high genetic connectivity in ood rogs sylvaticus s
TRANSCRIPT
Herpetological Conservation and Biology 10(1):64-89.Submitted: 26 August 2013; Accepted: 19 December 2014; Published: 14 June 2015.
High Genetic Connectivity inWood Frogs (Lithobatessylvaticus) and Spotted Salamanders (Ambystoma
maculatum) in a Commercial Forest
Stephanie S. Coster1,2, Kimberly J. Babbitt1 and Adrienne I. Kovach1
1114 James Hall, Department of Natural Resources and the Environment, University of New Hampshire,Durham, New Hampshire 03824, USA
2Corresponding author email: [email protected]
Abstract.—We characterized the genetic structure of two pond-breeding amphibian species in a com-mercial forest to evaluate population connectivity and investigate whether landscape features and tim-ber harvest influenced dispersal and gene flow. We sampled 20 Wood Frog (Lithobates sylvaticus) pop-ulations and 23 Spotted Salamander (Ambystoma maculatum) populations across an area of 40 × 52km. We estimated genetic diversity and differentiation, and used both a Bayesian clustering approachand a spatial autocorrelation analysis to evaluate genetic structure. We used a least-cost path analysisto examine dispersal and gene flow within each species. In both species, we found high genetic diversityand low differentiation across the study area, and the Bayesian clustering analysis identified a single ge-netic cluster for each species. The spatial autocorrelation analysis indicated there was greater spatialgenetic structure in Spotted Salamanders than Wood Frogs. None of the landscape features measuredwere significantly related to genetic distance in Wood Frogs, and lakes impeded dispersal in SpottedSalamanders. We attribute the findings of high genetic connectivity in both species to a combinationof abundant forest and wetlands with minimal anthropogenic disturbance. These findings suggest thatcurrent silviculture practices in the study area do not significantly impede dispersal and gene flow ofpond-breeding amphibians.
Key Words.—dispersal; forestry; gene flow; landscape genetics.
Introduction
Dispersal is one of the most important pro-cesses in population biology because it can im-pact individual fitness, population dynamics, pop-ulation genetics, and species distribution (Clobertet al. 2001). Anthropogenic influences such ashabitat alteration or fragmentation can limit dis-persal by increasing the demographic and geneticisolation of local populations, thereby increasingextinction risks (Keyghobadi 2007). In order toimplement effective conservation management,it is therefore important to understand how land-scape features affect the movement and dispersalpatterns of organisms.
Many pond-breeding amphibians depend onforested habitat for much of their habitat require-
ments and are sensitive to forest fragmentationand loss (deMaynadier and Hunter 1995; Gibbs1998; Cushman 2006). They may be especiallyvulnerable to habitat modification due to theirlimited mobility, high philopatry, patchy distribu-tions, and complex life cycles that include bothaquatic and terrestrial stages (Sinsch 1990; Al-ford and Richards 1999; Cushman 2006). In ad-dition, many amphibians exist as metapopula-tions and thus depend on periodic dispersal tomaintain gene flow and connectivity among pop-ulations (Marsh and Trenham 2001; Semlitsch2008). Therefore, understanding the factors thatimpact amphibian dispersal and gene flow are im-portant for maintaining population persistence.
Population genetic analyses can characterizedispersal by measuring the cumulative impact
Copyright c© 2015. Stephanie S. Coster.All Rights Reserved. 64
Herpetological Conservation and Biology
of disturbance on gene flow over generations.When combined with spatial information, theseanalyses can reveal how environmental factorsinfluence population connectivity. Recent studieshave found that despite high levels of gene flowin many amphibian species, geographic distancealone does not explain genetic structure (Crosbyet al. 2009; Purrenhage et al. 2009; Gabrielsenet al. 2013). Instead, both natural and anthro-pogenic factors influence amphibian connectiv-ity. There is evidence that lakes and rivers limitdispersal in some amphibians (Lee-Yaw et al.2009; Richardson 2012), while elevation and to-pography influence genetic structure in others(Funk et al. 2005; Giordano et al. 2007). In ad-dition, anthropogenic disturbance such as devel-opment, agriculture, or forest management cannegatively impact amphibian gene flow (Joly etal. 2003; Crosby et al. 2009; Spear and Storfer2008; Greenwald et al. 2009b; Gabrielsen et al.2013).
Land managed for timber production may havenegative impacts on amphibians dependent onforest habitat. Research shows that timber har-vesting, especially clearcutting, can negativelyimpact the survival, abundance, and dispersal oflocal amphibian populations (deMaynadier andHunter 1998; Patrick et al. 2006; Petranka et al.1994; Raymond and Hardy 1991). Clearcuts re-move canopy, reduce leaf litter and soil moisture,increase soil temperature, alter hydrology, andcreate a harsh microclimate unfavorable for am-phibians (e.g., deMaynadier and Hunter 1995;Semlitsch et al. 2009). This type of forest dis-turbance may limit amphibian dispersal as indi-viduals must move through less optimal habitat,which increases the risk of desiccation and mor-tality (Rothermel and Luhring 2005; Rittenhouseet al. 2008). Whether these impacts are manifestin reduced connectivity at the population levelmay depend on several local factors, includingthe nature of the forest management practices andthe abundance and distribution of the species andtheir breeding ponds.
In northern New England, there is a long his-
tory of forest management for timber harvest.Forest clearing peaked in the mid-1800s at theheight of agricultural production, and timber har-vest remains a staple of the regional economy(Foster et al. 1998; North East Foresters Asso-ciation 2013a). In Maine, the forest product in-dustry is an important livelihood for the state,with 500,000 acres and 7.86 million cords har-vested annually (Maine Forest Service, Depart-ment of Conservation 2010; North East ForestersAssociation 2013b). To promote sustainable har-vest, best management practices are encouraged(e.g., protect the integrity of water bodies, min-imize exposed soil, etc.; see Moesswilde 2004)and regulations limit the size and distribution ofclearcuts. Today, Maine is 89% forested and dom-inated by northern hardwood and spruce-fir foresttypes. Abundant vernal pools also characterizethe forest. In the context of the largely forestedNew England landscape, the impact of timberharvesting on vernal pool-breeding amphibiansis unknown. Given the history of forest manage-ment, it is important to understand how this typeof disturbance affects amphibian movement anddispersal.
In this study, our objectives were to character-ize the population genetic structure of two am-phibian species in a commercial forest managedfor timber harvest and identify landscape featuresthat impact dispersal and gene flow within eachspecies. The study area offered an excellent op-portunity to examine factors that influence am-phibian connectivity because it consisted of a mo-saic of natural and human-created landscape fea-tures with breeding ponds dispersed throughout.We studied the Wood Frog (Lithobates sylvati-cus) and the Spotted Salamander (Ambystomamaculatum) – two abundant, forest-dependentspecies. The two species have similar life cycles,but differ in demographic patterns, microhabi-tat selection, and dispersal capabilities (Redmerand Trauth 2005; Savage and Zamudio 2005),and they may respond differently to forest frag-mentation. The Wood Frog is more mobile, withthe maximum distance recorded from a breeding
65

Coster et al.—-Amphibian landscape genetics.
pond of 2.5 km, as compared to 467 m in Spot-ted Salamanders (Berven and Grudzien 1990;Montieth and Paton 2006). We predicted thatanthropogenic landscape features such as for-est management, roads, and agriculture impededispersal for both species. In addition, we pre-dicted that some natural landscape features suchas lakes would impede dispersal, while otherssuch as wetlands would facilitate dispersal viastepping-stones. Due to the greater mobility ofWood Frogs as compared to Spotted Salamanders,we expected to find less genetic differentiationand fewer landscape influences on gene flow inWood Frogs.
Materials andMethods
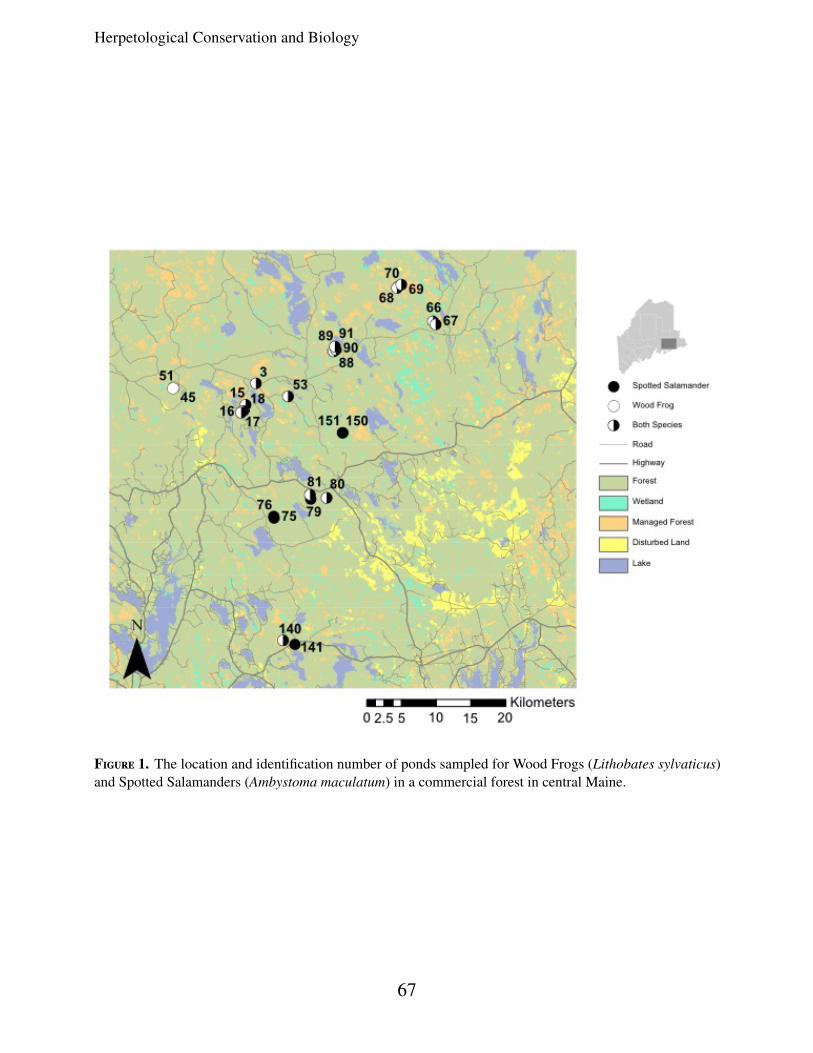
Study area and sampling.—We conducted thisresearch in central Maine within the countiesof Penobscot, Hancock, and Washington (Fig.1). The study area ( 40 × 50 km) was predomi-nately forested (72%) with numerous wetlandsand lakes (16%), and limited agriculture (4%)and development (0.7%). The forest was largelyprivately owned commercial timberland and con-sisted of actively logged second growth forest.The species composition included northern hard-woods such as Beech (Fagus grandifolia), YellowBirch (Betula alleghaniensis) and Sugar Maple(Acer saccharum) and softwoods including WhitePine (Pinus strobus), Red Spruce (Picea rubens),and Balsalm Fir (Abies balsamea; Hasbrouck andKnight 1994).
Seven percent of the study area was made up ofpatches that have experienced various forest man-agement treatments between 1995–2004, includ-ing partial, clearcut, and regenerating patches.Clearcuts made up < 1% of the study area andwere composed of forest patches with > 90%overstory removal; patch size ranged from 2–20 ha with a mean of 9 ha. Heavy partial cutsmade up 3% of the study area and were com-posed of forest where > 50% of the trees wereharvested; patch size ranged from 0–192 ha witha mean of 7 ha. Light partial cuts made up 2%
of the study area and were composed of for-est where < 50% of the overstory had been re-moved; patch size ranged from 0–88 ha with amean of 4 ha (derived from Maine Land CoverData Set, MeLCD. 2004; Maine Office of Ge-ographic Information Systems; available fromhttp://megis.maine.goc/catalog/).
To identify potential breeding ponds forsampling, we consulted US Fish and WildlifeService National Wetlands Inventory (NWI)maps. We selected breeding ponds distributedacross the study area, so as to include potentiallandscape barriers such as lakes and highways(Fig. 1). In the spring of 2004 and 2005, wesampled a total of 26 ponds and found SpottedSalamanders at 23 and Wood Frogs at 20 of theponds. The nearest neighbor distance betweensampled ponds ranged from 60 m to 4 km andthe maximum pairwise distance across all pondswas 54 km. At each pond we collected oneembryo from every egg mass with a target of 15individuals per pond, and stored them in vialswith 95% ethanol until DNA extraction. Forsix ponds, where larva had already hatched, weused dipnets to collect samples from differentareas of the pond to minimize possible collectionof related individuals (two collections of A.maculatum, four collections of L. sylvaticus).
DNA extraction and microsatelliteanalysis.—We extracted DNA from the embryosand larvae using QIAGEN QIAamp DNeasyBlood and Tissue R© kit (QIAGEN, Hilden,Germany). For both Spotted Salamanders andWood Frogs, we amplified DNA by polymerasechain reaction (PCR) at six polymorphic, species-specific, tetranucleotide microsatellite loci, usingthe published protocols of Julian and King(2003) and Julian et al. (2003). We used SpottedSalamander loci D287, D315, D184, D321, D99,C40 (Julian et al. 2003) and Wood Frog lociC41, D32, C52, D20, D77, C11 (Julian andKing 2003). We used fluorescent-dye-labeledprimers (HEX, FAM, NED) in two multiplexesfor each species. Amplified products were
66
Herpetological Conservation and Biology
Figure 1. The location and identification number of ponds sampled for Wood Frogs (Lithobates sylvaticus)and Spotted Salamanders (Ambystoma maculatum) in a commercial forest in central Maine.
67
Coster et al.—-Amphibian landscape genetics.
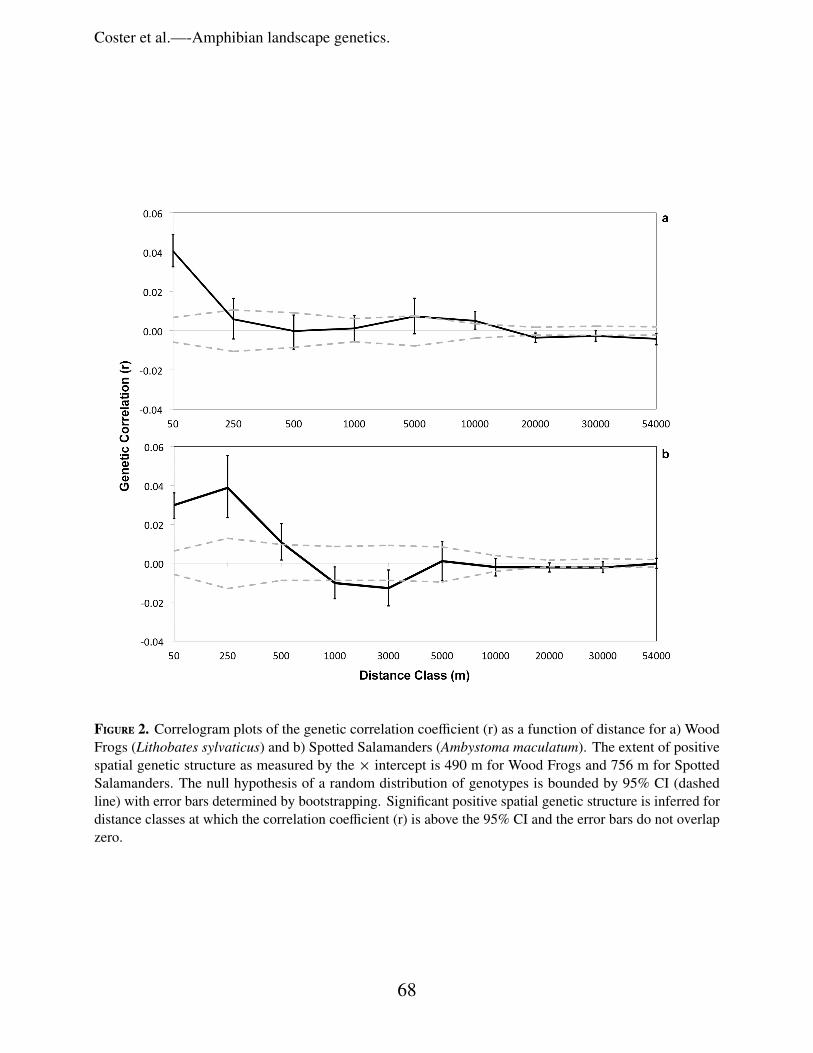
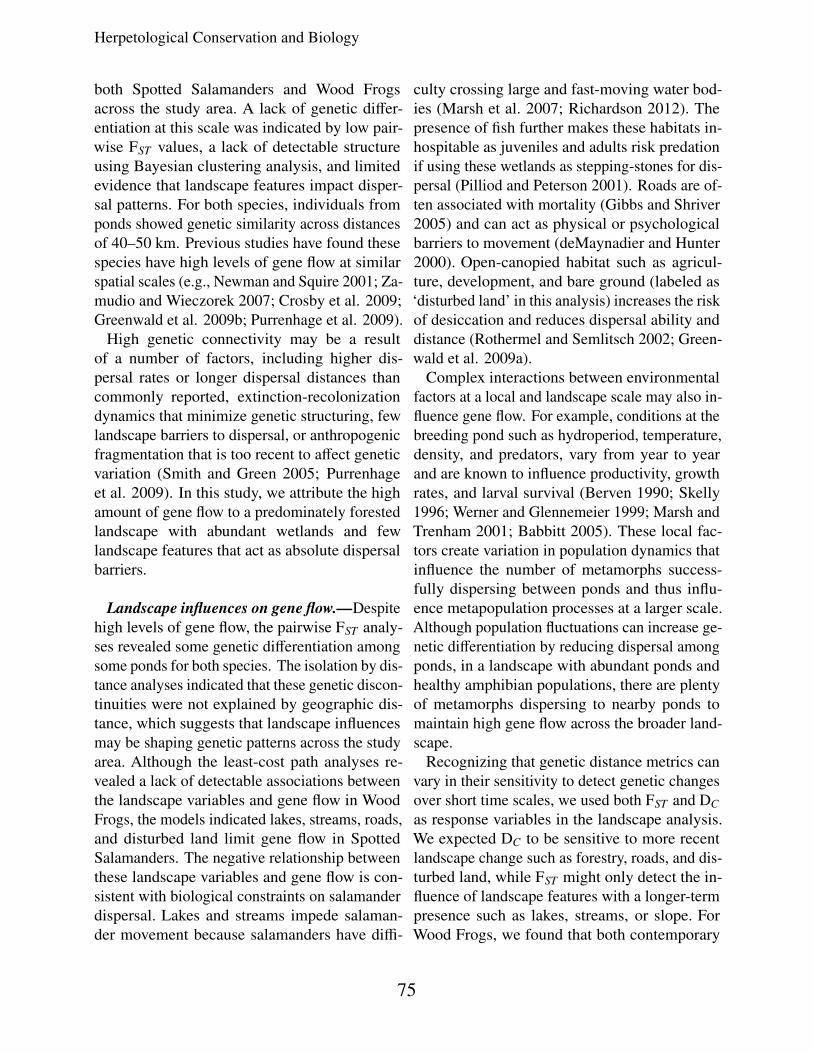
Figure 2. Correlogram plots of the genetic correlation coefficient (r) as a function of distance for a) WoodFrogs (Lithobates sylvaticus) and b) Spotted Salamanders (Ambystoma maculatum). The extent of positivespatial genetic structure as measured by the × intercept is 490 m for Wood Frogs and 756 m for SpottedSalamanders. The null hypothesis of a random distribution of genotypes is bounded by 95% CI (dashedline) with error bars determined by bootstrapping. Significant positive spatial genetic structure is inferred fordistance classes at which the correlation coefficient (r) is above the 95% CI and the error bars do not overlapzero.
68
Herpetological Conservation and Biology
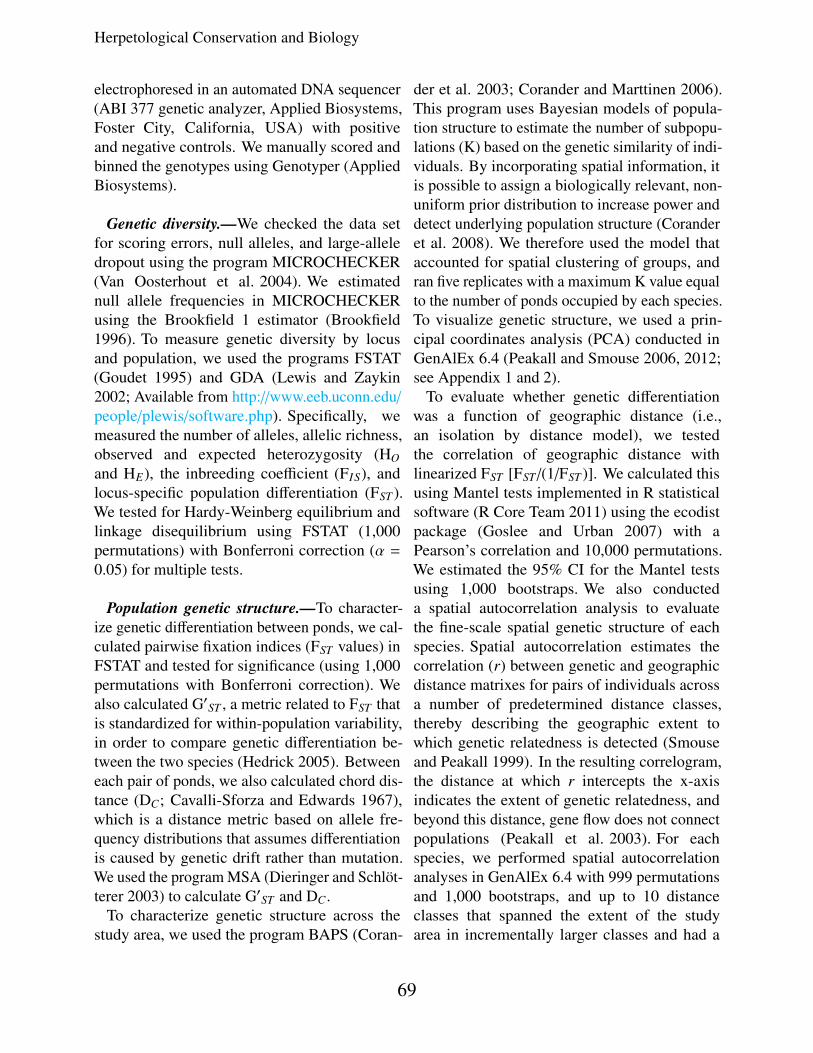
electrophoresed in an automated DNA sequencer(ABI 377 genetic analyzer, Applied Biosystems,Foster City, California, USA) with positiveand negative controls. We manually scored andbinned the genotypes using Genotyper (AppliedBiosystems).
Genetic diversity.—We checked the data setfor scoring errors, null alleles, and large-alleledropout using the program MICROCHECKER(Van Oosterhout et al. 2004). We estimatednull allele frequencies in MICROCHECKERusing the Brookfield 1 estimator (Brookfield1996). To measure genetic diversity by locusand population, we used the programs FSTAT(Goudet 1995) and GDA (Lewis and Zaykin2002; Available from http://www.eeb.uconn.edu/
people/plewis/software.php). Specifically, wemeasured the number of alleles, allelic richness,observed and expected heterozygosity (HOand HE), the inbreeding coefficient (FIS), andlocus-specific population differentiation (FST ).We tested for Hardy-Weinberg equilibrium andlinkage disequilibrium using FSTAT (1,000permutations) with Bonferroni correction (α =
0.05) for multiple tests.
Population genetic structure.—To character-ize genetic differentiation between ponds, we cal-culated pairwise fixation indices (FST values) inFSTAT and tested for significance (using 1,000permutations with Bonferroni correction). Wealso calculated G′ST , a metric related to FST thatis standardized for within-population variability,in order to compare genetic differentiation be-tween the two species (Hedrick 2005). Betweeneach pair of ponds, we also calculated chord dis-tance (DC; Cavalli-Sforza and Edwards 1967),which is a distance metric based on allele fre-quency distributions that assumes differentiationis caused by genetic drift rather than mutation.We used the program MSA (Dieringer and Schlöt-terer 2003) to calculate G′ST and DC .
To characterize genetic structure across thestudy area, we used the program BAPS (Coran-
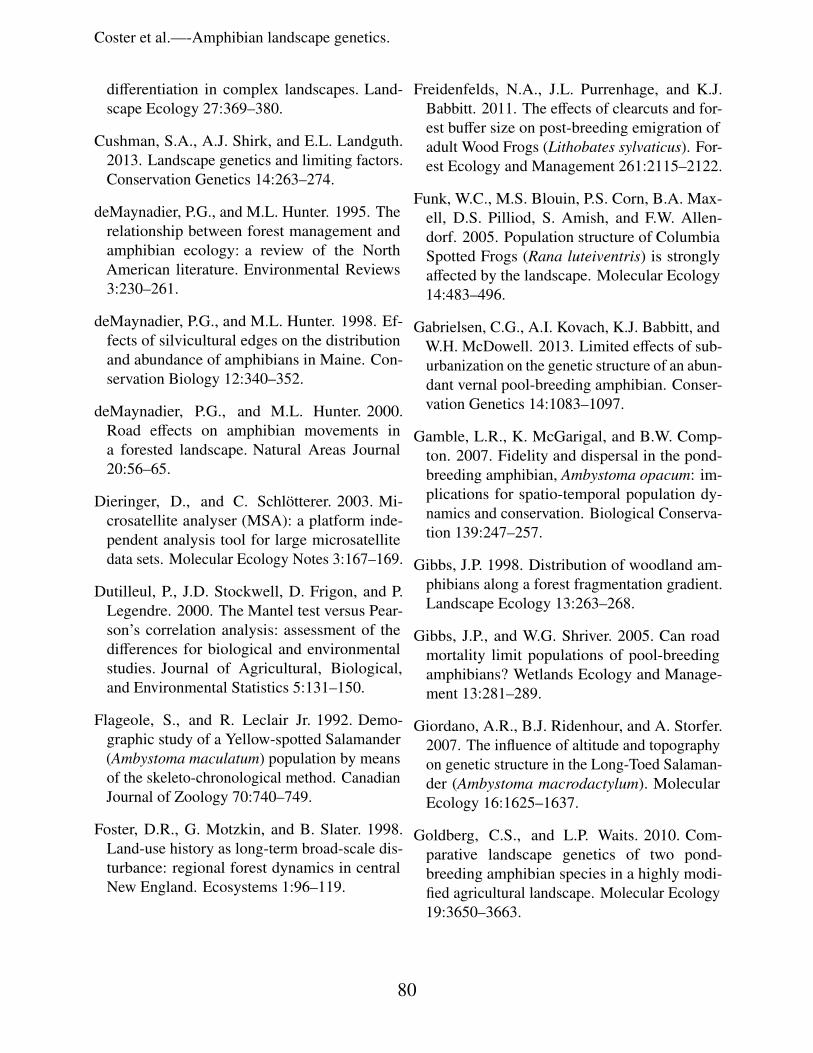
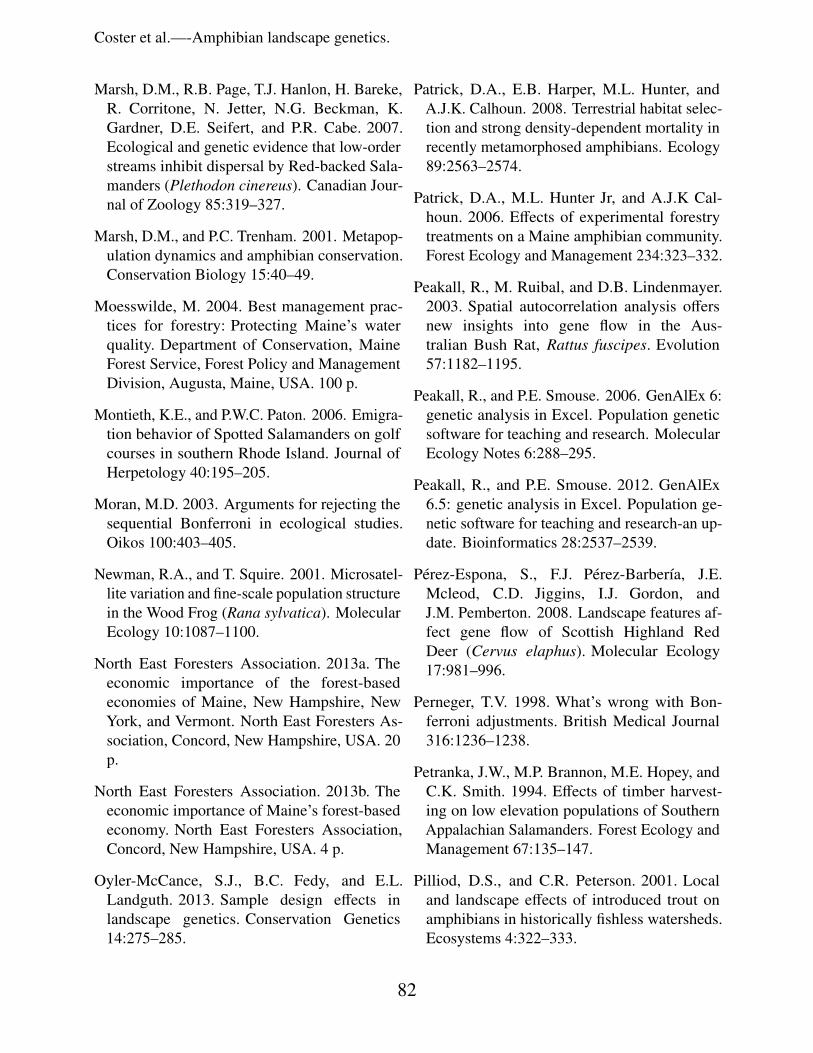
der et al. 2003; Corander and Marttinen 2006).This program uses Bayesian models of popula-tion structure to estimate the number of subpopu-lations (K) based on the genetic similarity of indi-viduals. By incorporating spatial information, itis possible to assign a biologically relevant, non-uniform prior distribution to increase power anddetect underlying population structure (Coranderet al. 2008). We therefore used the model thataccounted for spatial clustering of groups, andran five replicates with a maximum K value equalto the number of ponds occupied by each species.To visualize genetic structure, we used a prin-cipal coordinates analysis (PCA) conducted inGenAlEx 6.4 (Peakall and Smouse 2006, 2012;see Appendix 1 and 2).
To evaluate whether genetic differentiationwas a function of geographic distance (i.e.,an isolation by distance model), we testedthe correlation of geographic distance withlinearized FST [FST /(1/FST )]. We calculated thisusing Mantel tests implemented in R statisticalsoftware (R Core Team 2011) using the ecodistpackage (Goslee and Urban 2007) with aPearson’s correlation and 10,000 permutations.We estimated the 95% CI for the Mantel testsusing 1,000 bootstraps. We also conducteda spatial autocorrelation analysis to evaluatethe fine-scale spatial genetic structure of eachspecies. Spatial autocorrelation estimates thecorrelation (r) between genetic and geographicdistance matrixes for pairs of individuals acrossa number of predetermined distance classes,thereby describing the geographic extent towhich genetic relatedness is detected (Smouseand Peakall 1999). In the resulting correlogram,the distance at which r intercepts the x-axisindicates the extent of genetic relatedness, andbeyond this distance, gene flow does not connectpopulations (Peakall et al. 2003). For eachspecies, we performed spatial autocorrelationanalyses in GenAlEx 6.4 with 999 permutationsand 1,000 bootstraps, and up to 10 distanceclasses that spanned the extent of the studyarea in incrementally larger classes and had a
69

Coster et al.—-Amphibian landscape genetics.
minimum of 600 pair-wise comparisons in eachclass (50, 250, 500, 1,000, 3,000, 5,000, 10,000,20,000, 30,000, 54,000 m). For Wood Frogs, weomitted the 3,000 m distance class due to smallsample size within that distance class.
Landscape features as barriers or facilitatorsof dispersal.—We used a least-cost path analysis(Adriaensen et al. 2003) to assess the potentialof certain landscape features to act as barriers orfacilitators of dispersal for Spotted Salamandersand Wood Frogs. To do this, we evaluated twomethodologies for assigning resistance costs tolandscape features, including univariate and mul-tivariate models. The goal of the univariate ap-proach was to identify specific landscape featuresthat influenced genetic structure of amphibians,whereas the goal of the multivariate approachwas to test a model that simultaneously parame-terized the relative effects of different landscapevariables on dispersal based on amphibian ecol-ogy.
To create a land cover map for the analysis, weobtained land cover data from the 2004 MaineLandcover Dataset (MeLCD 2004 op. cit.; 5 mresolution). As this land cover had limited wet-land information, we used the Spatial Analystextension in ARCGIS 10 (Environmental Sci-ence Research Institute, Redlands, USA) andmerged the land cover with the NWI map anda map of stream orders derived from the NationalHydrography Data Set Plus (NHDPlus, US En-vironmental Protection Agency. 2006. Availablefrom http://www.epa.goc/waters 2006). To iso-late different road classes, we merged a road layerprovided by the landowner, which had more de-tail than the state databases.
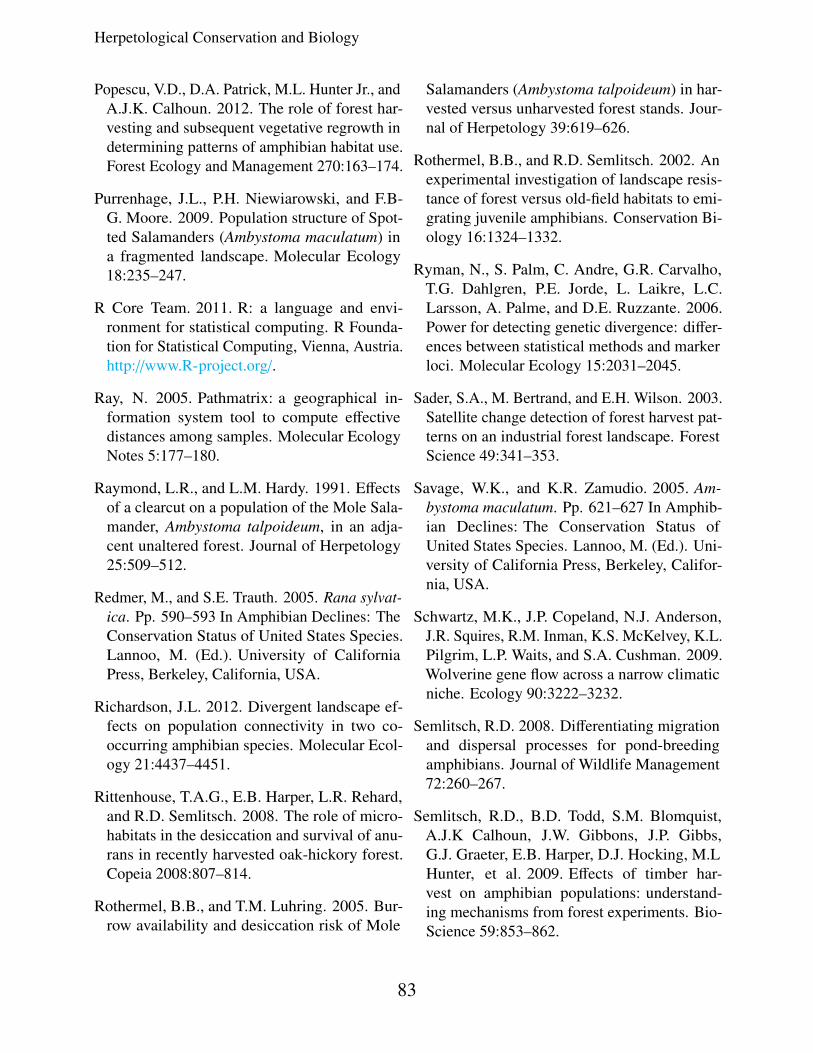
In the univariate approach, we mapped eachlandscape variable separately in a binary frictiongrid and assigned either high or low resistanceto movement to each variable (Pérez-Espona etal. 2008). We identified eight landscape classesof interest: geographic distance, lakes, wetlands,streams, forestry, roads, slope, and disturbed land(see Appendix Table A1 for details). To investi-
gate dispersal barriers we isolated each land coverclass and assigned high resistance (50) to thevariable of interest and low resistance (1) to thebackground. In contrast, we assumed wetlandsfacilitated gene flow and thus assigned them alow resistance (1) and assigned the background ahigh resistance (50). For the multivariate modelin the least-cost path analysis, we used the expertopinion model of Compton et al. (2007) with theaddition of classes describing forestry treatments,bare ground, and wetland type (e.g., vernal pool,scrub-shrub wetlands, etc.). We reclassified thedata into 19 categories and for all comparableclasses used the resistance values from Comptonet al. (2007) multiplied by a factor of 10 (Table1). For the few classes that were not representedin Compton et al. (2007), we estimated resistancevalues by evaluating relevant ecological knowl-edge about dispersal relative to the other classes.
We used program PATHMATRIX (Ray 2005)in ArcView 3.3 (Environmental Science ResearchInstitute, Redlands, California, USA) to identifythe least-cost paths, by minimizing the sum of re-sistances of all cells along the path between pairsof locations. Effective distances were measuredas lengths of the least-cost paths between each ofthe breeding ponds, as opposed to the total sum ofcosts along the path, because the least-cost lengthis more biologically interpretable (Ray 2005; Bro-quet et al. 2006). For each landscape variable,we tested for correlations between genetic dis-tance metrics (FST and Dc) and least-cost pathlength using a partial Mantel test controlling forgeographic distance. We performed these analy-ses in R using Pearson’s correlation with 10,000permutations in the ecodist package (α = 0.05)and 1,000 iterations for the bootstrapped 95%confidence limit. In addition to models based onthe landscape and topographic variables, we alsotested a geographic distance model, which is ex-pected to be the best fitting model if straight lineEuclidean distance alone explains the greatestvariation in genetic distance. We did not use aBonferroni correction procedure to account formultiple tests in the landscape genetics analysis
70

Herpetological Conservation and Biology
Table 1. Resistance values for landcover used in the multivariate model, with values comparable to Comptonet al. (2007) multiplied by a factor of 10.
Landcover type Resistance value
Vernal pool 10Forest 10Wetland: Freshwater forest/Scrub-shrub/riverine 10Wetland: Freshwater emergent 30Scrubland 31Bare Ground/Gravel pit 48Development: Low density residential 68Cropland/pasture/grassland 102Open water 220Estuarine 400Forestry: Regenerating/light partial cut 40Forestry: Clearcut/heavy partial cut 103Road: minor 72Road: major 164Road: highway 326Stream: 1st order 13Stream: 2nd order 28Stream: 3rd order 126Stream: 4th order 330
because this metric is too conservative and in-creases type II error (Perneger 1998; Cabin andMitchell 2000; Moran 2003), an important con-sideration given that Mantel tests often producesmall but significant correlations (Dutilleul et al.2000; Legendre and Fortin 2010).
Results
Genetic diversity and population geneticstructure.—We genotyped 9–16 Wood Frog sam-ples per pond for a total of 287 individuals, and8–27 Spotted Salamander samples per pond fora total of 411 individuals. The loci were highlypolymorphic, with a mean of 9.5 and 19.5 allelesin Spotted Salamanders and Wood Frogs, respec-tively (Appendix Table A2). MICROCHECKERdetected no loci with null alleles in Wood Frogs.Two loci were found to have null alleles in Spot-ted Salamanders (Ama D99 at 5% and Ama D321at 8%). As the overall percent of null alleles
was < 10%, and null alleles have been foundto have minor impacts on genetic distance esti-mates (Chapuis and Estoup 2007), we retainedthese loci in further analyses.
Observed heterozygosity was also high in bothspecies with a mean HO = 0.71 in Spotted Sala-manders and HO = 0.87 in Wood Frogs (Tables2 and 3). Pond specific observed heterozygosityranged from 0.65–0.80 in Spotted Salamanders(Table 2) and 0.76–0.94 in Wood Frogs (Table 3).Pond specific FIS values ranged from 0–0.12 inSpotted Salamanders and 0–0.11 in Wood Frogs(Tables 2 and 3) and were not significantly differ-ent from zero, indicating no sampling bias due towithin-pond relatedness. For Wood Frogs, therewere no deviations from Hardy-Weinberg equi-librium, and linkage disequilibrium was detectedin 1% of tests after Bonferroni correction. ForSpotted Salamanders, no pairs of loci were inlinkage disequilibrium; and D321 and D99 wereout of Hardy-Weinberg equilibrium, consistent
71

Coster et al.—-Amphibian landscape genetics.
Table 2. Metrics describing the genetic diversity of Spotted Salamanders (Ambystoma maculatum) from 23populations in central Maine. N is the number of individuals sampled per population. The number of alleles,allelic richness (AR), observed heterozygosity (HO), expected heterozygosity (HE ), and FI S are averagedacross 6 microsatellite loci per pond. Pond locations are shown in Fig. 1.
Pond N Alleles AR H0 HE FI S
69 19 6.7 4.6 0.73 0.73 -0.0170 16 5.7 4.3 0.75 0.71 -0.0568 19 6.5 4.6 0.69 0.70 0.0166 20 6.7 4.4 0.70 0.73 0.0367 15 6.0 4.5 0.78 0.73 -0.0690 26 6.8 4.5 0.67 0.73 0.0891 13 6.7 4.8 0.73 0.75 0.0489 11 5.3 4.2 0.65 0.72 0.1015 14 6.2 4.5 0.72 0.76 0.0617 12 4.8 4.0 0.69 0.66 -0.0416 13 7.0 4.9 0.70 0.75 0.0753 16 6.2 4.4 0.67 0.75 0.123 22 6.8 4.4 0.70 0.72 0.0318 27 7.2 4.5 0.69 0.72 0.04151 21 6.7 4.5 0.74 0.73 -0.01150 22 6.5 4.4 0.67 0.75 0.1176 10 5.5 4.6 0.78 0.76 -0.0375 8 4.7 4.1 0.78 0.73 -0.0779 22 6.2 4.4 0.80 0.73 -0.1081 20 5.5 4.1 0.66 0.68 0.0480 22 6.8 4.6 0.66 0.71 0.07140 23 7.2 4.6 0.66 0.73 0.10141 20 6.3 4.6 0.74 0.74 0.01
with the low frequency of null alleles detectedin these loci. The lack of significant non-zeropond-specific FIS values, however, further sup-ported our rationale for retaining these loci in theanalyses.
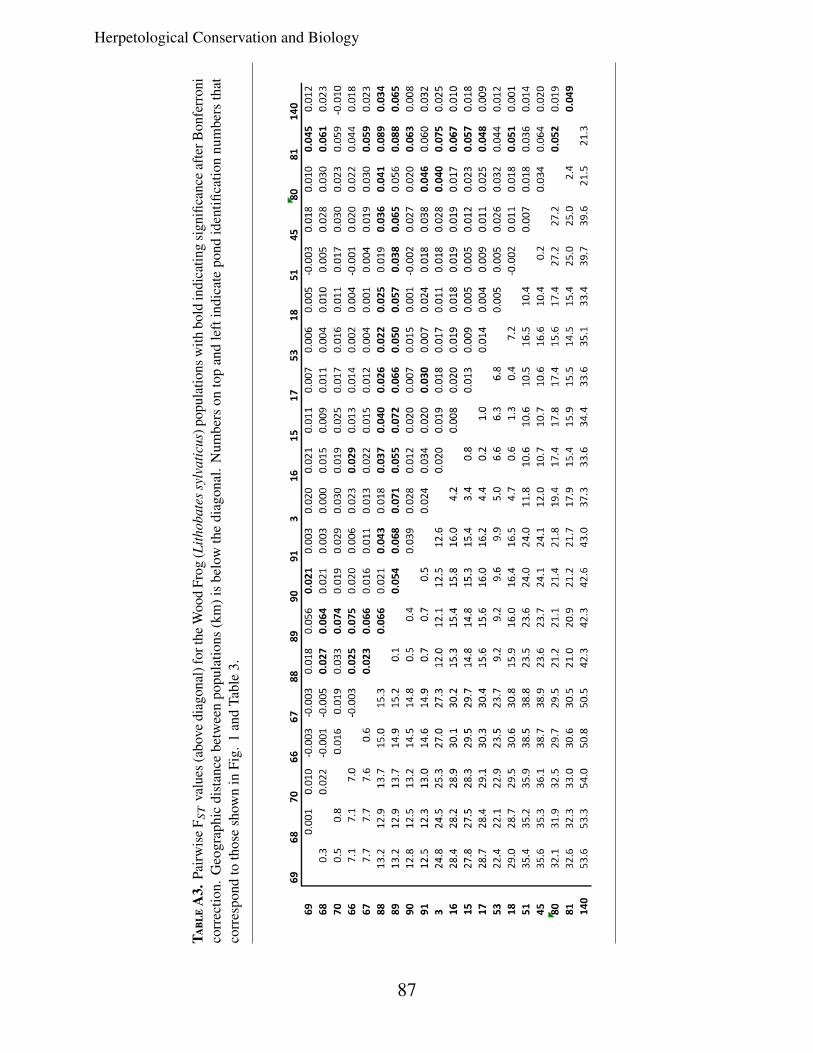
We found a general pattern of high genetic con-nectivity in both species with an overall FST valueof 0.016 (± 0.002) in Spotted Salamanders and0.023 (± 0.003) in Wood Frogs. In Spotted Sala-manders, pairwise FST ranged from 0–0.08 andDc ranged from 0.18–0.41, and in Wood Frogs,pairwise FST ranged from 0–0.09 and Dc rangedfrom 0.31–0.58 (Appendix Tables A3 and A4).Significance tests of pairwise FST values indi-cated only 5% of the pond pairs were significantlydifferentiated in Spotted Salamanders and 24%
were differentiated in Wood Frogs. StandardizedG′ST indicated Wood Frogs had slightly higheroverall genetic differentiation (0.32) than SpottedSalamanders (0.16). The analyses using BAPSassigned all breeding ponds to one populationcluster for both Spotted Salamanders (Pr = 1.0)and Wood Frogs (Pr = 0.71).
The tests of isolation by distance found nocorrelation between genetic and geographicdistance in Spotted Salamanders (r = -0.051,P = 0.60) or Wood Frogs (r = -0.20, P =
0.98). The spatial autocorrelation analysisrevealed that Spotted Salamanders had greaterfine-scale spatial genetic structure than did WoodFrogs (Fig. 2). For Spotted Salamanders, thepermutation and bootstrap methods in the spatial
72
Herpetological Conservation and Biology
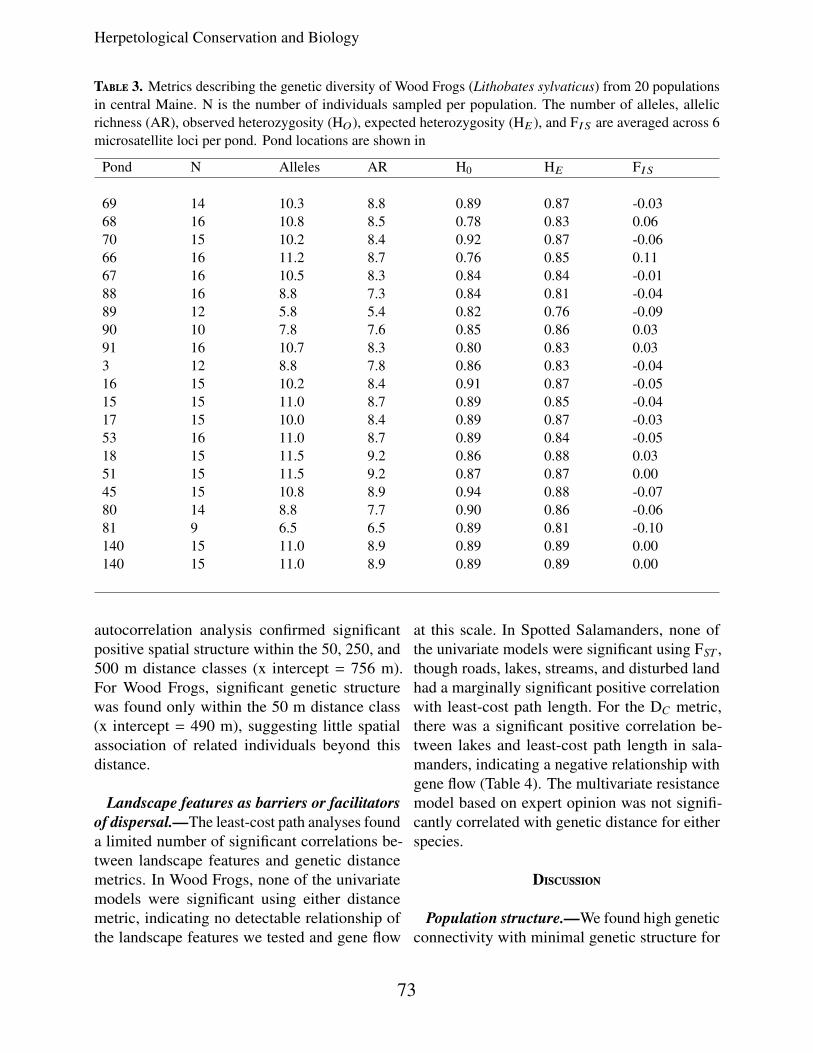
Table 3. Metrics describing the genetic diversity of Wood Frogs (Lithobates sylvaticus) from 20 populationsin central Maine. N is the number of individuals sampled per population. The number of alleles, allelicrichness (AR), observed heterozygosity (HO), expected heterozygosity (HE ), and FI S are averaged across 6microsatellite loci per pond. Pond locations are shown in
Pond N Alleles AR H0 HE FI S
69 14 10.3 8.8 0.89 0.87 -0.0368 16 10.8 8.5 0.78 0.83 0.0670 15 10.2 8.4 0.92 0.87 -0.0666 16 11.2 8.7 0.76 0.85 0.1167 16 10.5 8.3 0.84 0.84 -0.0188 16 8.8 7.3 0.84 0.81 -0.0489 12 5.8 5.4 0.82 0.76 -0.0990 10 7.8 7.6 0.85 0.86 0.0391 16 10.7 8.3 0.80 0.83 0.033 12 8.8 7.8 0.86 0.83 -0.0416 15 10.2 8.4 0.91 0.87 -0.0515 15 11.0 8.7 0.89 0.85 -0.0417 15 10.0 8.4 0.89 0.87 -0.0353 16 11.0 8.7 0.89 0.84 -0.0518 15 11.5 9.2 0.86 0.88 0.0351 15 11.5 9.2 0.87 0.87 0.0045 15 10.8 8.9 0.94 0.88 -0.0780 14 8.8 7.7 0.90 0.86 -0.0681 9 6.5 6.5 0.89 0.81 -0.10140 15 11.0 8.9 0.89 0.89 0.00140 15 11.0 8.9 0.89 0.89 0.00
autocorrelation analysis confirmed significantpositive spatial structure within the 50, 250, and500 m distance classes (x intercept = 756 m).For Wood Frogs, significant genetic structurewas found only within the 50 m distance class(x intercept = 490 m), suggesting little spatialassociation of related individuals beyond thisdistance.
Landscape features as barriers or facilitatorsof dispersal.—The least-cost path analyses founda limited number of significant correlations be-tween landscape features and genetic distancemetrics. In Wood Frogs, none of the univariatemodels were significant using either distancemetric, indicating no detectable relationship ofthe landscape features we tested and gene flow
at this scale. In Spotted Salamanders, none ofthe univariate models were significant using FST ,though roads, lakes, streams, and disturbed landhad a marginally significant positive correlationwith least-cost path length. For the DC metric,there was a significant positive correlation be-tween lakes and least-cost path length in sala-manders, indicating a negative relationship withgene flow (Table 4). The multivariate resistancemodel based on expert opinion was not signifi-cantly correlated with genetic distance for eitherspecies.
Discussion
Population structure.—We found high geneticconnectivity with minimal genetic structure for
73

Coster et al.—-Amphibian landscape genetics.
Table
4.R
esultsfrom
thepartialM
anteltestsofeffective
andgenetic
distance(F
ST
andDC
,respectively)forWood
Frogs(Lithobates
sylvaticus)andSpotted
Salamanders
(Am
bystoma
maculatum
).Includes
thepartialcorrelation
coefficient(R
),thep
value(P),and
the95%
confidenceintervalaround
thecorrelation
coefficient(L
L,low
erlimit;U
L,upperlim
it).
95%95%
95%95%
Model
Dc
RD
cP
CI-L
LC
I-UL
FST
RFST
PC
I-LL
CI-U
LW
oodFrog
IBD
-0.100.74
-0.180.03
-0.050.58
-0.120.06
Disturbed
-0.020.58
-0.100.05
-0.040.67
-0.120.02
Forestry-0.20
0.90-0.27
-0.14-0.17
0.85-0.21
-0.13R
oads-0.02
0.58-0.10
0.06-0.05
0.69-0.12
0.01L
akes-0.08
0.75-0.13
0.02-0.11
0.82-0.17
-0.03Slope
0.040.38
-0.060.11
-0.040.54
-0.110.05
Wetlands
-0.210.96
-0.32-0.07
-0.210.96
-0.32-0.06
Streams
-0.010.55
-0.090.07
-0.050.68
-0.130.02
Multivariate
-0.130.82
-0.190.00
-0.130.82
-0.220.01
SpottedSala-
mander
IBD
-0.130.86
-0.21-0.03
-0.200.98
-0.26-0.13
Disturbed
0.050.18
-0.010.10
0.080.08
+0.02
0.14Forestry
-0.100.66
-0.14-0.04
0.050.32
0.010.12
Roads
0.040.24
-0.010.10
0.080.10
+0.02
0.14L
akes0.16
0.03*0.06
0.260.12
0.06+
0.040.22
Slope-0.02
0.52-0.09
0.050.00
0.47-0.06
0.06W
etlands0.04
0.36-0.02
0.11-0.05
0.69-0.13
0.02Stream
s0.05
0.22-0.01
0.110.08
0.09+
0.020.14
Multivariate
0.070.27
-0.030.20
0.060.30
-0.030.19
*P≤
0.05+
P≤
0.10
74
Herpetological Conservation and Biology
both Spotted Salamanders and Wood Frogsacross the study area. A lack of genetic differ-entiation at this scale was indicated by low pair-wise FST values, a lack of detectable structureusing Bayesian clustering analysis, and limitedevidence that landscape features impact disper-sal patterns. For both species, individuals fromponds showed genetic similarity across distancesof 40–50 km. Previous studies have found thesespecies have high levels of gene flow at similarspatial scales (e.g., Newman and Squire 2001; Za-mudio and Wieczorek 2007; Crosby et al. 2009;Greenwald et al. 2009b; Purrenhage et al. 2009).
High genetic connectivity may be a resultof a number of factors, including higher dis-persal rates or longer dispersal distances thancommonly reported, extinction-recolonizationdynamics that minimize genetic structuring, fewlandscape barriers to dispersal, or anthropogenicfragmentation that is too recent to affect geneticvariation (Smith and Green 2005; Purrenhageet al. 2009). In this study, we attribute the highamount of gene flow to a predominately forestedlandscape with abundant wetlands and fewlandscape features that act as absolute dispersalbarriers.
Landscape influences on gene flow.—Despitehigh levels of gene flow, the pairwise FST analy-ses revealed some genetic differentiation amongsome ponds for both species. The isolation by dis-tance analyses indicated that these genetic discon-tinuities were not explained by geographic dis-tance, which suggests that landscape influencesmay be shaping genetic patterns across the studyarea. Although the least-cost path analyses re-vealed a lack of detectable associations betweenthe landscape variables and gene flow in WoodFrogs, the models indicated lakes, streams, roads,and disturbed land limit gene flow in SpottedSalamanders. The negative relationship betweenthese landscape variables and gene flow is con-sistent with biological constraints on salamanderdispersal. Lakes and streams impede salaman-der movement because salamanders have diffi-
culty crossing large and fast-moving water bod-ies (Marsh et al. 2007; Richardson 2012). Thepresence of fish further makes these habitats in-hospitable as juveniles and adults risk predationif using these wetlands as stepping-stones for dis-persal (Pilliod and Peterson 2001). Roads are of-ten associated with mortality (Gibbs and Shriver2005) and can act as physical or psychologicalbarriers to movement (deMaynadier and Hunter2000). Open-canopied habitat such as agricul-ture, development, and bare ground (labeled as‘disturbed land’ in this analysis) increases the riskof desiccation and reduces dispersal ability anddistance (Rothermel and Semlitsch 2002; Green-wald et al. 2009a).
Complex interactions between environmentalfactors at a local and landscape scale may also in-fluence gene flow. For example, conditions at thebreeding pond such as hydroperiod, temperature,density, and predators, vary from year to yearand are known to influence productivity, growthrates, and larval survival (Berven 1990; Skelly1996; Werner and Glennemeier 1999; Marsh andTrenham 2001; Babbitt 2005). These local fac-tors create variation in population dynamics thatinfluence the number of metamorphs success-fully dispersing between ponds and thus influ-ence metapopulation processes at a larger scale.Although population fluctuations can increase ge-netic differentiation by reducing dispersal amongponds, in a landscape with abundant ponds andhealthy amphibian populations, there are plentyof metamorphs dispersing to nearby ponds tomaintain high gene flow across the broader land-scape.
Recognizing that genetic distance metrics canvary in their sensitivity to detect genetic changesover short time scales, we used both FST and DCas response variables in the landscape analysis.We expected DC to be sensitive to more recentlandscape change such as forestry, roads, and dis-turbed land, while FST might only detect the in-fluence of landscape features with a longer-termpresence such as lakes, streams, or slope. ForWood Frogs, we found that both contemporary
75

Coster et al.—-Amphibian landscape genetics.
and historical distance metrics had little relation-ship to landscape pattern. For Spotted Salaman-ders, lakes were correlated with both DC andFST , and disturbed land, roads, and streams werecorrelated with FST but not DC . Therefore, ourfindings suggest that in this analysis, DC was notmore sensitive to recent landscape change thanFST .
Though this study took place in a commercialforest, we found no negative impacts of forestmanagement on gene flow at the scale we mea-sured. Similarly, Spear and Storfer (2008, 2010)found a relatively high amount of gene flow intwo species of tailed frog (Ascaphus) in managedforests in the northwestern US. Current regula-tions governing forest management practices inMaine may contribute to patterns of high geneflow. Public concern over timber liquidation inconjunction with salvage logging in the 1970s–1980s prompted the state to pass the Forest Prac-tices Act in 1989 (Sader et al. 2003). This acteffectively restricted clearcuts over 50 ha andrequired clearcuts to be separated by patchesof forest that cannot be cut for a decade, whilealso promoting partial and shelterwood harvesttechniques (Forest Practices Act, Maine ForestService. 1989. Title 12, Part 11, Chapter 805,Augusta, Maine, USA). These forest manage-ment practices may contribute to the connectivityof amphibians in this landscape because currentclearcut patches are noncontiguous, constrainedin size, distributed throughout the area, and makeup a small percentage of the landscape. Our find-ings suggest that the current level of forest dis-turbance in the study area is minimal enough tomaintain population level gene flow.
Alternatively, the lack of an effect of timberharvest on gene flow may result from a tempo-ral lag in the genetic response (Keyghobadi et al.2005; Holzhauer et al. 2006). Simulation studiessuggest that the time to detect the genetic effectsof landscape change depends on the dispersaldistance of the species and the generation time.In species with low dispersal ability (≥ 10 km),such as amphibians, it generally takes longer to
detect landscape change. In least-cost path anal-yses using Mantel tests, simulations showed itcan take up to six generations to detect a disper-sal barrier and > 500 generations to detect itsremoval (Landguth et al. 2010). These findingsindicate that for these less mobile species, ge-netic patterns may not reflect recent landscapechange, but instead may reflect past landscapeconditions. In their study of harvest impacts ongene flow in the Coastal Tailed Frog (Ascaphustruei), Spear and Storfer (2008) found that theeffects of forest management on amphibian geneflow took several generations (20+ years) to influ-ence genetic structure. The land cover map usedin our analysis depicted timber harvest cut up toa decade before genetic sampling, which is timefor one Spotted Salamander generation and twoto three Wood Frog generations to pass (SpottedSalamander longevity up to 20 years, mode 7years [Flageole and Leclair Jr. 1992]; Wood Froglongevity 3–5 years [Redmer and Trauth 2005]).Given this time frame, there may not have beenenough time to detect an effect of recent forestmanagement on gene flow.
Timber harvest may be a temporary distur-bance that operates on a time scale too shortto influence genetic patterns. In the studyarea, vegetation in clearcut patches regeneratesquickly, with saplings and shrubs growing upto 1 m tall within a year, providing shadedmicrohabitats that facilitate dispersal (Patrick etal. 2006; Popescu et al. 2012). Recent evidencesuggests that for juvenile Wood Frogs inMaine, abundance and survival within clearcutsincreases just a few years after harvest (Patrick etal. 2008; Popescu et al. 2012). In addition, bothspecies are capable of moving through clearcutsto reach forested patches (Veysey et al. 2009;Freidenfelds et al. 2011). Consequently, theimpacts of forest management on dispersal maybe minimal, with more permanent landscapefeatures more likely to influence genetic patternsfor these two species. Our findings confirm this,in that the only significant dispersal barrier weidentified was lakes. However, in developed
76

Herpetological Conservation and Biology
areas, where anthropogenic landscape featuresare long lasting, these factors may have astronger negative influence on gene flow (Crosbyet al. 2009; Gabrielsen et al. 2013).
Species comparison.—By comparing multiplespecies within the same landscape, it is possibleto identify species-specific responses and assessif patterns are consistent across species (Steele etal. 2009; Goldberg and Waits 2010; Richardson2012). In this study, we found similarly highlevels of gene flow in both focal species, butdifferent landscape influences. The variedpatterns may be related to the differences inmobility of the two species. Wood Frogs arecapable of traveling farther distances thanSpotted Salamanders (Berven and Grudzien1990; Montieth and Paton 2006). Therefore,Wood Frogs are more likely to move through anunfavorable patch or find ways around a potentialdispersal barrier and we would expect to findless genetic differentiation and fewer landscapeinfluences on gene flow. Richardson (2012)found evidence that supported this hypothesis,with greater mobility in Wood Frogs contributingto higher levels of gene flow as compared toSpotted Salamanders. Our results corroboratethis hypothesis as no landscape features weresignificantly correlated with genetic distancepatterns in Wood Frogs, while several landscapefeatures were correlated in Spotted Salamanders.In addition, greater Wood Frog mobility wassupported by the spatial autocorrelation analysis,in which Wood Frogs showed less fine-scale spa-tial genetic structure, indicating higher dispersalrates than Spotted Salamanders. Wood Frogs,however, exhibited higher overall G′ST , whichimplies higher average genetic differentiationbetween ponds.
Methodological considerations.—Aspects ofour experimental design may limit the strengthof the conclusions that can be drawn. First, inlandscape genetics the scale of analysis and sam-pling scheme are important considerations be-
cause both factors can impact the ability to de-tect a genetic signal of landscape change (Cush-man and Landguth 2010; Jaquiery et al. 2011;Oyler-McCance et al. 2013). Studies conductedat scales many times larger than the dispersaldistance of an animal may be detecting patternsthat emerge at a regional scale, rather than iden-tifying landscape features that impact individualmovement patterns. Assuming a maximum dis-persal distance of 2.5 km for Wood Frogs and 1km for salamanders (Berven and Grudzien 1990;Gamble et al. 2007), our study included pondswithin and up to 50 times the dispersal distancefor these species. Investigating the influences oflandscape features on gene flow at a smaller spa-tial scale may improve the power of the analy-sis (Cushman and Landguth 2010). Further, oursampling scheme incorporated several clusters ofponds with a range of intervening distances dis-tributed across the extent of the study area, ratherthan ponds sampled systematically and consis-tently throughout the landscape, as is consideredoptimal for fine-scale landscape genetics stud-ies (Storfer et al. 2007). A more systematic andintensive sampling scheme may be better at de-tecting patterns of isolation by distance and land-scape influences on gene flow (Oyler-McCanceet al. 2013).
The number of microsatellite loci (six perspecies) used in this study may also have limitedthe power of our analyses. While conducting thestudy with additional loci may have increased thesensitivity to detect patterns, it has been showntheoretically that the power to detect genetic dif-ferentiation is a function of not just the number ofloci used, but more specifically the total numberof alleles, as well as the sample sizes (Kalinowski2002; Ryman et al. 2006). The loci used in thisstudy were highly polymorphic, with high levelsof heterozygosity and a large number of allelesper locus (total of 117 and 57 alleles were foundfor the 6 loci in Wood Frogs and Spotted Sala-manders, respectively). The high polymorphismof the loci, combined with relatively large sam-ple sizes, despite relatively low FST s, suggest that
77
Coster et al.—-Amphibian landscape genetics.
the low levels of genetic differentiation we foundwere not due to power limitations, but rather werecharacteristic of this highly connected system.Other studies using more loci have also shownsimilar findings of high rates of gene flow andweak landscape influences in these species innortheastern North America (Crosby et al. 2009;Richardson 2012; Gabrielsen et al. 2013; Costeret al. 2015). Lastly, although null alleles weredetected in two loci in the Spotted Salamanderdataset, they were present at low frequencies (<10%), which are not expected to bias genetic dis-tance metrics (Chapuis and Estoup 2007), andtherefore should not have influenced our results.
The choice of resistance values may alsoaffect the ability to detect a relationship betweengene flow and landscape features (Jaquiery etal. 2011; Cushman et al. 2013). In this study,the multivariate expert opinion model performedpoorly. The lack of relationship between effec-tive and genetic distance in the multivariatemodel may indicate that the expert assignedresistances we used were not appropriate in thislandscape. These resistance values were initiallygenerated for ambystomatid salamanders insouthern New England, in a landscape withmore development and less forestry (Compton etal. 2007). Using univariate models can reducesome of the uncertainty associated with expertopinion models by eliminating the questionof relative effects and instead focusing onwhich landscape variables are most importantto dispersal (Broquet et al. 2006; Pérez-Esponaet al. 2008; Schwartz et al. 2009). However,the univariate models in this study similarlydetected weak relationships between gene flowand landscape pattern. Therefore, the lack ofpower may not be a methodological problem,but instead reflect the high connectivity due toabundant habitat. Simulation studies confirmthere is less power to detect landscape influenceson gene flow in homogenous landscapes wherehabitat is extensive (Cushman and Landguth2010; Cushman et al. 2012, 2013).
Conclusion.—We found high genetic connec-tivity and limited influences of landscape featureson the dispersal of Wood Frogs and Spotted Sala-manders in a commercial forest. Results fromour study suggest that the legislation in Mainerestricting the size of clearcuts and promoting par-tial harvest techniques may be compatible withamphibian dispersal and gene flow. These for-est management practices ultimately result in alargely forested landscape that favors success-ful dispersal for Spotted Salamanders and WoodFrogs. However, we caution against extrapolat-ing these findings to commercial forests in otherareas where moisture is limiting, wetlands areisolated, or management regimes are different.
Acknowledgements.—We thank InternationalPaper, GMO LLC, and Black Bear Forest, Inc.for permission to conduct research on their prop-erty and American Forestry Management, Inc.for their cooperation. We are grateful for thosethat helped in the field and lab, including: KerryArsenault, Matt Baber, Lisa Goldberg, LyndsaySchneiderman, and Andrew Simoncini. Thanksto David Berlinsky for use of laboratory facilities.The research was approved by the University ofNew Hampshire Institutional Animal Care & UseCommittee (permit No. 020601). This projectwas supported by the National Research Initiativeof the USDA Cooperative State Research, Edu-cation, and Extension Service: Grant Nos. 2003-35101-12922 and 2007-35101-18281, and by agrant from the Northeast States Research Coop-erative. Stephanie Coster was supported in partthrough a New Hampshire NASA Space Grantfellowship. Partial funding was also providedby the New Hampshire Agriculture ExperimentStation. This is scientific Contribution Number2528.
Literature Cited
Adriaensen, F., J.P. Chardon, G. De Blust,E. Swinnen, S. Villalba, H. Gulinck, andE. Matthysen. 2003. The application of“least-cost” modelling as a functional land-
78

Herpetological Conservation and Biology
scape model. Landscape and Urban Planning64:233–247.
Alford, R.A., and S.J. Richards. 1999. Globalamphibian declines: a problem in applied ecol-ogy. Annual Review of Ecology and Systemat-ics 30:133–165.
Babbitt, K.J. 2005. The relative importance ofwetland size and hydroperiod for amphibiansin southern New Hampshire, USA. WetlandsEcology and Management 13:269–279.
Berven, K.A. 1990. Factors affecting popula-tion fluctuations in larval and adult stagesof the Wood Frog (Rana sylvatica). Ecology71:1599–1608.
Berven, K.A., and T.A. Grudzien. 1990. Disper-sal in the Wood Frog (Rana sylvatica): impli-cations for genetic population structure. Evolu-tion 44:2047–2056.
Brookfield, J.F.Y. 1996. A simple new methodfor estimating null allele frequency fromheterozygote deficiency. Molecular Ecology5:453–455.
Broquet, T., N. Ray, E. Petit, J. Fryxell, andF. Burel. 2006. Genetic isolation by distanceand landscape connectivity in the AmericanMarten (Martes americana). Landscape Ecol-ogy 21:877–889.
Cabin, R.J., and R.J. Mitchell. 2000. To Bonfer-roni or not to Bonferroni: when and how arethe questions. Bulletin of the Ecological Soci-ety of America 81:246–248.
Cavalli-Sforza, L.L., and A.W.F. Edwards. 1967.Phylogenetic analysis. Models and estimationprocedures. American Journal of Human Ge-netics 19:233–257.
Chapuis, M.P., and A. Estoup. 2007. Microsatel-lite null alleles and estimation of populationdifferentiation. Molecular Biology and Evolu-tion 24:621–631.
Clobert, J., E. Danchin, A.A. Dhondt, and J.D.Nichols. (Eds.). 2001. Dispersal. Oxford Uni-versity Press, Oxford, England.
Compton, B.W., K. McGarigal, S.A. Cushman,and L.R. Gamble. 2007. A resistant-kernelmodel of connectivity for amphibians thatbreed in vernal pools. Conservation Biology21:788–799.
Corander, J., and P. Marttinen. 2006. Bayesianidentification of admixture events using multi-locus molecular markers. Molecular Ecology15:2833–2843.
Corander, J., J. Sirén, and E. Arjas. 2008.Bayesian spatial modeling of genetic pop-ulation structure. Computational Statistics23:111–129.
Corander, J., P. Waldmann, and M.J. Sil-lanpaa. 2003. Bayesian analysis of geneticdifferentiation between populations. Genetics163:367–374.
Coster, S.S., K.J. Babbitt, A. Cooper, and A.I.Kovac. 2015. Limited influence of local andlandscape factors on finescale gene flow in twopond-breeding amphibians. Molecular Ecology24:742-758.
Crosby, M., L. Licht, and J. Fu. 2009. The effectof habitat fragmentation on finescale popula-tion structure of Wood Frogs (Rana sylvatica).Conservation Genetics 10:1707–1718.
Cushman, S.A. 2006. Effects of habitat lossand fragmentation on amphibians: a re-view and prospectus. Biological Conservation128:231–240.
Cushman, S.A., and E.L. Landguth. 2010. Scaledependent inference in landscape genetics.Landscape Ecology 25:967–979.
Cushman, S.A., A. Shirk, and E.L. Landguth.2012. Separating the effects of habitat area,fragmentation and matrix resistance on genetic
79
Coster et al.—-Amphibian landscape genetics.
differentiation in complex landscapes. Land-scape Ecology 27:369–380.
Cushman, S.A., A.J. Shirk, and E.L. Landguth.2013. Landscape genetics and limiting factors.Conservation Genetics 14:263–274.
deMaynadier, P.G., and M.L. Hunter. 1995. Therelationship between forest management andamphibian ecology: a review of the NorthAmerican literature. Environmental Reviews3:230–261.
deMaynadier, P.G., and M.L. Hunter. 1998. Ef-fects of silvicultural edges on the distributionand abundance of amphibians in Maine. Con-servation Biology 12:340–352.
deMaynadier, P.G., and M.L. Hunter. 2000.Road effects on amphibian movements ina forested landscape. Natural Areas Journal20:56–65.
Dieringer, D., and C. Schlötterer. 2003. Mi-crosatellite analyser (MSA): a platform inde-pendent analysis tool for large microsatellitedata sets. Molecular Ecology Notes 3:167–169.
Dutilleul, P., J.D. Stockwell, D. Frigon, and P.Legendre. 2000. The Mantel test versus Pear-son’s correlation analysis: assessment of thedifferences for biological and environmentalstudies. Journal of Agricultural, Biological,and Environmental Statistics 5:131–150.
Flageole, S., and R. Leclair Jr. 1992. Demo-graphic study of a Yellow-spotted Salamander(Ambystoma maculatum) population by meansof the skeleto-chronological method. CanadianJournal of Zoology 70:740–749.
Foster, D.R., G. Motzkin, and B. Slater. 1998.Land-use history as long-term broad-scale dis-turbance: regional forest dynamics in centralNew England. Ecosystems 1:96–119.
Freidenfelds, N.A., J.L. Purrenhage, and K.J.Babbitt. 2011. The effects of clearcuts and for-est buffer size on post-breeding emigration ofadult Wood Frogs (Lithobates sylvaticus). For-est Ecology and Management 261:2115–2122.
Funk, W.C., M.S. Blouin, P.S. Corn, B.A. Max-ell, D.S. Pilliod, S. Amish, and F.W. Allen-dorf. 2005. Population structure of ColumbiaSpotted Frogs (Rana luteiventris) is stronglyaffected by the landscape. Molecular Ecology14:483–496.
Gabrielsen, C.G., A.I. Kovach, K.J. Babbitt, andW.H. McDowell. 2013. Limited effects of sub-urbanization on the genetic structure of an abun-dant vernal pool-breeding amphibian. Conser-vation Genetics 14:1083–1097.
Gamble, L.R., K. McGarigal, and B.W. Comp-ton. 2007. Fidelity and dispersal in the pond-breeding amphibian, Ambystoma opacum: im-plications for spatio-temporal population dy-namics and conservation. Biological Conserva-tion 139:247–257.
Gibbs, J.P. 1998. Distribution of woodland am-phibians along a forest fragmentation gradient.Landscape Ecology 13:263–268.
Gibbs, J.P., and W.G. Shriver. 2005. Can roadmortality limit populations of pool-breedingamphibians? Wetlands Ecology and Manage-ment 13:281–289.
Giordano, A.R., B.J. Ridenhour, and A. Storfer.2007. The influence of altitude and topographyon genetic structure in the Long-Toed Salaman-der (Ambystoma macrodactylum). MolecularEcology 16:1625–1637.
Goldberg, C.S., and L.P. Waits. 2010. Com-parative landscape genetics of two pond-breeding amphibian species in a highly modi-fied agricultural landscape. Molecular Ecology19:3650–3663.
80

Herpetological Conservation and Biology
Goslee, S.C., and D.L. Urban. 2007. The ecodistpackage for dissimilarity-based analysis of eco-logical data. Journal of Statistical Software22:1–19.
Goudet, J. 1995. FSTAT (Version 1.2): a com-puter program to calculate F-Statistics. Journalof Heredity 86:485 –486.
Greenwald, K.R., H.L. Gibbs, and T.A. Waite.2009a. Efficacy of land-cover models in pre-dicting isolation of Marbled Salamander pop-ulations in a fragmented landscape. Conserva-tion Biology 23:1232–1241.
Greenwald, K.R., J.L. Purrenhage, and W.K.Savage. 2009b. Landcover predicts iso-lation in Ambystoma salamanders acrossregion and species. Biological Conservation142:2493–2500.
Hasbrouck, S., and F. Knight. 1994. The Forestsof Maine. University of Maine, College ofNatural Resources, Forestry and Agriculture,Orono, Maine, USA.
Hedrick, P.W. 2005. A standardized ge-netic differentiation measure. Evolution59:1633–1638.
Holzhauer, S., K. Ekschmitt, A.-C. Sander, J.Dauber, and V. Wolter. 2006. Effect of historiclandscape change on the genetic structure of thebush-cricket Metrioptera roeseli. LandscapeEcology 21:891–899.
Jaquiery, J., T. Broquet, A.H. Hirzel, J. Years-ley, and N. Perrin. 2011. Inferring landscapeeffects on dispersal from genetic distances:how far can we go? Molecular Ecology20:692–705.
Joly, P., C. Morand, and A. Cohas. 2003. Habi-tat fragmentation and amphibian conservation:building a tool for assessing landscape ma-trix connectivity. Comptes Rendus Biologies326:132–139.
Julian, S.E., and T.L. King. 2003. Novel tetranu-cleotide microsatellite DNA markers for theWood Frog, Rana sylvatica. Molecular Ecol-ogy Notes 3:256–258.
Julian, S.E., T.L. King, and W.K. Savage. 2003.Isolation and characterization of novel tetranu-cleotide microsatellite DNA markers for theSpotted Salamander, Ambystoma maculatum.Molecular Ecology Notes 3:7–9.
Kalinowski, S.T. 2002. Evolutionary and statisti-cal properties of three genetic distances. Molec-ular Ecology 11:1263–1273.
Keyghobadi, N. 2007. The genetic implicationsof habitat fragmentation for animals. CanadianJournal of Zoology 85:1049–1064.
Keyghobadi, N., J. Roland, S.F. Matter, andC. Strobeck. 2005. Among- and within-patchcomponents of genetic diversity respond at dif-ferent rates to habitat fragmentation: an empir-ical demonstration. Proceedings of the RoyalSociety Biological Sciences 272:553–560.
Landguth, E.L., S.A. Cushman, M.K. Schwartz,K.S. McKelvey, M. Murphy, and G. Luikart.2010. Quantifying the lag time to detect barri-ers in landscape genetics. Molecular Ecology19:4179–4191.
Lee-Yaw, J.A., A. Davidson, B.H. McRae, andD.M. Green. 2009. Do landscape processespredict phylogeographic patterns in the WoodFrog? Molecular Ecology 18:1863–1874.
Legendre, P., and M. Fortin. 2010. Comparisonof the Mantel test and alternative approachesfor detecting complex multivariate relation-ships in the spatial analysis of genetic data.Molecular Ecology Resources 10:831–844.
Maine Forest Service, Department of Conserva-tion. 2010. Maine State Forest Assessment andStrategies. Maine Forest Service, Departmentof Conservation, Augusta, Maine, USA. 225 p.
81
Coster et al.—-Amphibian landscape genetics.
Marsh, D.M., R.B. Page, T.J. Hanlon, H. Bareke,R. Corritone, N. Jetter, N.G. Beckman, K.Gardner, D.E. Seifert, and P.R. Cabe. 2007.Ecological and genetic evidence that low-orderstreams inhibit dispersal by Red-backed Sala-manders (Plethodon cinereus). Canadian Jour-nal of Zoology 85:319–327.
Marsh, D.M., and P.C. Trenham. 2001. Metapop-ulation dynamics and amphibian conservation.Conservation Biology 15:40–49.
Moesswilde, M. 2004. Best management prac-tices for forestry: Protecting Maine’s waterquality. Department of Conservation, MaineForest Service, Forest Policy and ManagementDivision, Augusta, Maine, USA. 100 p.
Montieth, K.E., and P.W.C. Paton. 2006. Emigra-tion behavior of Spotted Salamanders on golfcourses in southern Rhode Island. Journal ofHerpetology 40:195–205.
Moran, M.D. 2003. Arguments for rejecting thesequential Bonferroni in ecological studies.Oikos 100:403–405.
Newman, R.A., and T. Squire. 2001. Microsatel-lite variation and fine-scale population structurein the Wood Frog (Rana sylvatica). MolecularEcology 10:1087–1100.
North East Foresters Association. 2013a. Theeconomic importance of the forest-basedeconomies of Maine, New Hampshire, NewYork, and Vermont. North East Foresters As-sociation, Concord, New Hampshire, USA. 20p.
North East Foresters Association. 2013b. Theeconomic importance of Maine’s forest-basedeconomy. North East Foresters Association,Concord, New Hampshire, USA. 4 p.
Oyler-McCance, S.J., B.C. Fedy, and E.L.Landguth. 2013. Sample design effects inlandscape genetics. Conservation Genetics14:275–285.
Patrick, D.A., E.B. Harper, M.L. Hunter, andA.J.K. Calhoun. 2008. Terrestrial habitat selec-tion and strong density-dependent mortality inrecently metamorphosed amphibians. Ecology89:2563–2574.
Patrick, D.A., M.L. Hunter Jr, and A.J.K Cal-houn. 2006. Effects of experimental forestrytreatments on a Maine amphibian community.Forest Ecology and Management 234:323–332.
Peakall, R., M. Ruibal, and D.B. Lindenmayer.2003. Spatial autocorrelation analysis offersnew insights into gene flow in the Aus-tralian Bush Rat, Rattus fuscipes. Evolution57:1182–1195.
Peakall, R., and P.E. Smouse. 2006. GenAlEx 6:genetic analysis in Excel. Population geneticsoftware for teaching and research. MolecularEcology Notes 6:288–295.
Peakall, R., and P.E. Smouse. 2012. GenAlEx6.5: genetic analysis in Excel. Population ge-netic software for teaching and research-an up-date. Bioinformatics 28:2537–2539.
Pérez-Espona, S., F.J. Pérez-Barbería, J.E.Mcleod, C.D. Jiggins, I.J. Gordon, andJ.M. Pemberton. 2008. Landscape features af-fect gene flow of Scottish Highland RedDeer (Cervus elaphus). Molecular Ecology17:981–996.
Perneger, T.V. 1998. What’s wrong with Bon-ferroni adjustments. British Medical Journal316:1236–1238.
Petranka, J.W., M.P. Brannon, M.E. Hopey, andC.K. Smith. 1994. Effects of timber harvest-ing on low elevation populations of SouthernAppalachian Salamanders. Forest Ecology andManagement 67:135–147.
Pilliod, D.S., and C.R. Peterson. 2001. Localand landscape effects of introduced trout onamphibians in historically fishless watersheds.Ecosystems 4:322–333.
82
Herpetological Conservation and Biology
Popescu, V.D., D.A. Patrick, M.L. Hunter Jr., andA.J.K. Calhoun. 2012. The role of forest har-vesting and subsequent vegetative regrowth indetermining patterns of amphibian habitat use.Forest Ecology and Management 270:163–174.
Purrenhage, J.L., P.H. Niewiarowski, and F.B-G. Moore. 2009. Population structure of Spot-ted Salamanders (Ambystoma maculatum) ina fragmented landscape. Molecular Ecology18:235–247.
R Core Team. 2011. R: a language and envi-ronment for statistical computing. R Founda-tion for Statistical Computing, Vienna, Austria.http://www.R-project.org/.
Ray, N. 2005. Pathmatrix: a geographical in-formation system tool to compute effectivedistances among samples. Molecular EcologyNotes 5:177–180.
Raymond, L.R., and L.M. Hardy. 1991. Effectsof a clearcut on a population of the Mole Sala-mander, Ambystoma talpoideum, in an adja-cent unaltered forest. Journal of Herpetology25:509–512.
Redmer, M., and S.E. Trauth. 2005. Rana sylvat-ica. Pp. 590–593 In Amphibian Declines: TheConservation Status of United States Species.Lannoo, M. (Ed.). University of CaliforniaPress, Berkeley, California, USA.
Richardson, J.L. 2012. Divergent landscape ef-fects on population connectivity in two co-occurring amphibian species. Molecular Ecol-ogy 21:4437–4451.
Rittenhouse, T.A.G., E.B. Harper, L.R. Rehard,and R.D. Semlitsch. 2008. The role of micro-habitats in the desiccation and survival of anu-rans in recently harvested oak-hickory forest.Copeia 2008:807–814.
Rothermel, B.B., and T.M. Luhring. 2005. Bur-row availability and desiccation risk of Mole
Salamanders (Ambystoma talpoideum) in har-vested versus unharvested forest stands. Jour-nal of Herpetology 39:619–626.
Rothermel, B.B., and R.D. Semlitsch. 2002. Anexperimental investigation of landscape resis-tance of forest versus old-field habitats to emi-grating juvenile amphibians. Conservation Bi-ology 16:1324–1332.
Ryman, N., S. Palm, C. Andre, G.R. Carvalho,T.G. Dahlgren, P.E. Jorde, L. Laikre, L.C.Larsson, A. Palme, and D.E. Ruzzante. 2006.Power for detecting genetic divergence: differ-ences between statistical methods and markerloci. Molecular Ecology 15:2031–2045.
Sader, S.A., M. Bertrand, and E.H. Wilson. 2003.Satellite change detection of forest harvest pat-terns on an industrial forest landscape. ForestScience 49:341–353.
Savage, W.K., and K.R. Zamudio. 2005. Am-bystoma maculatum. Pp. 621–627 In Amphib-ian Declines: The Conservation Status ofUnited States Species. Lannoo, M. (Ed.). Uni-versity of California Press, Berkeley, Califor-nia, USA.
Schwartz, M.K., J.P. Copeland, N.J. Anderson,J.R. Squires, R.M. Inman, K.S. McKelvey, K.L.Pilgrim, L.P. Waits, and S.A. Cushman. 2009.Wolverine gene flow across a narrow climaticniche. Ecology 90:3222–3232.
Semlitsch, R.D. 2008. Differentiating migrationand dispersal processes for pond-breedingamphibians. Journal of Wildlife Management72:260–267.
Semlitsch, R.D., B.D. Todd, S.M. Blomquist,A.J.K Calhoun, J.W. Gibbons, J.P. Gibbs,G.J. Graeter, E.B. Harper, D.J. Hocking, M.LHunter, et al. 2009. Effects of timber har-vest on amphibian populations: understand-ing mechanisms from forest experiments. Bio-Science 59:853–862.
83

Coster et al.—-Amphibian landscape genetics.
Sinsch, U. 1990. Migration and orientation inanuran amphibians. Ethology Ecology & Evo-lution 2:65–79.
Skelly, D.K. 1996. Pond drying, predators, andthe distribution of Pseudacris tadpoles. Copeia1996:599–605.
Smith, M.A., and D.M. Green. 2005. Dispersaland the metapopulation paradigm in amphib-ian ecology and conservation: are all amphib-ian populations metapopulations? Ecography28:110–128.
Smouse, P.E., and R. Peakall. 1999. Spatial au-tocorrelation analysis of individual multial-lele and multilocus genetic structure. Heredity82:561–573.
Spear, S.F., and A. Storfer. 2008. Landscape ge-netic structure of Coastal Tailed Frogs (Asca-phus truei) in protected vs. managed forests.Molecular Ecology 17:4642–4656.
Spear, S.F., and A. Storfer. 2010. Anthropogenicand natural disturbance lead to differing pat-terns of gene flow in the Rocky MountainTailed Frog, Ascaphus montanus. BiologicalConservation 143:778–786.
Steele, C.A., J. Baumsteiger, and A. Storfer.2009. Influence of life-history variation on thegenetic structure of two sympatric salamandertaxa. Molecular Ecology 18:1629–1639.
Storfer, A., M.A. Murphy, J.S. Evans, C.S. Gold-berg, S. Robinson, S.F. Spear, R. Dezzani, E.Delmelle, L. Vierling, and L.P. Waits. 2007.Putting the “landscape” in landscape genetics.Heredity 98:128–142.
Van Oosterhout, C., W.F. Hutchinson, D.P. Wills,and P. Shipley. 2004. Micro-checker: softwarefor identifying and correcting genotyping er-rors in microsatellite data. Molecular EcologyNotes 4:535–538.
Veysey, J.S., K.J. Babbitt, and A. Cooper. 2009.An experimental assessment of buffer width:implications for salamander migratory behav-ior. Biological Conservation 142:2227–2239.
Werner, E.E., and K.S. Glennemeier. 1999. In-fluence of forest canopy cover on the breedingpond distributions of several amphibian species.Copeia 1999:1–12.
Zamudio, K.R., and A.M. Wieczorek. 2007.Fine-scale spatial genetic structure and disper-sal among Spotted Salamander (Ambystomamaculatum) breeding populations. MolecularEcology 16:257–274.
84
Herpetological Conservation and Biology
Appendices
Appendix 1. Principal coordinates analysis (PCA)of Wood Frog (Lithobates sylvaticus) populationsbased on six microsatellite loci. Numbers indi-cate pond identification numbers.
Appendix 2. Principal coordinates analysis (PCA)of Spotted Salamander (Ambystoma macula-tum) populations based on six microsatellite loci.Numbers indicate pond identification numbers.
Table
A1.
Des
crip
tion
ofla
ndsc
ape
clas
ses
inve
stig
ated
inbi
nary
leas
t-co
stpa
than
alys
es.
Lay
erD
ata
Sour
ceD
escr
iptio
nG
eogr
aphi
cD
is-
tanc
e(I
BD
)G
PSco
ordi
nate
sD
ista
nce
deriv
edfr
omle
ast-
cost
path
sbe
twee
nG
PSco
ordi
nate
s.
Lak
esN
atio
nal
Wet
land
sIn
vent
ory
(NW
I)L
akes
wer
eis
loat
edfr
omN
WI
Wet
land
sN
WI
Wet
land
sw
ere
clas
sifie
das
allw
ater
bodi
esex
clud
ing
lake
sR
oads
Mai
neD
epar
tmen
tof
Tran
spor
tatio
nR
oads
incl
uded
high
way
san
din
dust
rial
acce
ssro
ads.
Slop
eU
SGS
Dig
ital
Ele
-va
tion
Mod
elPe
rcen
tslo
pew
asca
lcul
ated
usin
gSp
atia
lAna
lyst
inA
rcG
IS10
,and
natu
ralb
reak
sw
ithtw
ocl
assi
ficat
ions
wer
eus
edto
repr
esen
thig
h(2
0%)a
ndlo
w(8
0%)r
esis
tanc
eto
mov
emen
t.St
ream
sN
HD
Plus
Stre
ams
orde
rs3
and
4w
ere
incl
uded
.L
andc
over
MeL
CD
2004
See
belo
wfo
rdet
ails
.Fo
rest
Man
agem
ent
Fore
stry
incl
uded
clas
ses
that
wer
eid
entifi
edas
clea
r-cu
t,he
avy
part
ialc
ut,l
ight
part
ialc
ut,o
rfo
rest
rege
nera
tion.
Dis
turb
edla
ndD
istu
rbed
land
incl
uded
agri
cultu
re(c
ultiv
ated
land
,blu
eber
ryfie
ld,p
astu
re/h
ay),
deve
lopm
ent,
and
bare
grou
nd).
85

Coster et al.—-Amphibian landscape genetics.
Table A2. Metrics describing the genetic diversity of Wood Frog (Lithobates sylvaticus) and Spotted Sala-mander (Ambystoma maculatum) populations in central Maine. Each locus is presented and the number ofalleles, allelic richness (AR), observed heterozygosity (HO), expected heterozygosity (HE ), FI S , and pairwiseFST along with their standard error in parentheses are averaged across populations.
Locus Alleles AR HO HE FI S FST
Wood FrogC41 11 4.8 0.65 0.65 -0.019
(0041)0.014(0.008)
D32 18 8.9 0.87 0.90 0.013(0.028)
0.016(0.008)
C52 27 10.8 0.90 0.93 -0.005(0.019)
0.036(0.009)
D20 16 8.9 0.91 0.90 -0.039(0.023)
0.021(0.007)
D77 24 10.8 0.93 0.93 -0.017(0.021)
0.022(0.007)
C11 21 10.1 0.93 0.91 -0.038(0.020)
0.025(0.009)
Spotted SalamanderD287 11 5.2 0.87 0.83 -0.055
(0.020)0.013(0.006)
D315 9 4.2 0.77 0.74 -0.051(0.029)
0.015(0.008)
D184 12 5.9 0.85 0.87 0.003(0.018)
0.009(0.006)
D321 12 5.2 0.68 0.82 0.165(0.029)
0.015(0.007)
D99 10 4.9 0.72 0.81 0.102(0.027)
0.021(0.012)
C40 3 2.1 0.39 0.38 -0.047(0.035)
0.034(0.016)
86
Herpetological Conservation and Biology
Table
A3.
Pairw
ise
F ST
valu
es(a
bove
diag
onal
)for
the
Woo
dFr
og(L
ithob
ates
sylv
atic
us)p
opul
atio
nsw
ithbo
ldin
dica
ting
sign
ifica
nce
afte
rBon
ferr
oni
corr
ectio
n.G
eogr
aphi
cdi
stan
cebe
twee
npo
pula
tions
(km
)is
belo
wth
edi
agon
al.
Num
bers
onto
pan
dle
ftin
dica
tepo
ndid
entifi
catio
nnu
mbe
rsth
atco
rres
pond
toth
ose
show
nin
Fig.
1an
dTa
ble
3.
87

Coster et al.—-Amphibian landscape genetics.
Table
A4.
Pairwise
FST
values(above
diagonal)fortheSpotted
Salamander(A
mbystom
am
aculatum)populations
with
boldindicating
significanceafterB
onferronicorrection.G
eographicdistance
between
populations(km
)isbelow
thediagonal.
Num
berson
topand
leftindicatepond
identificationnum
bersthatcorrespond
tothose
shown
inFig.
1and
Table2.
88

Herpetological Conservation and Biology
Stephanie Coster completed her Ph.D. at the Universityof New Hampshire. Her dissertation research integratedpopulation genetics, landscape ecology, and GIS to ex-plore how amphibian population structure and gene flowis affected by natural and anthropogenic influences. Sheis broadly interested in using genetic techniques to helpmanage and conserve animal populations and has workedwith a number of taxa including frogs, salamanders, bears,elephant shrews (sengis), and bats. She received a M.S.from the University of New Hampshire and a B.S. fromTrinity University. (Photographed by Dennis Lees).
AdrienneKovach is Research Associate Professor of Nat-ural Resources at the University of New Hampshire. Herresearch interests are focused on the application of ge-netic approaches to the population ecology, evolution,and conservation of vertebrates. A current focus in herlab is on understanding landscape influences on animaldispersal patterns. Using landscape genetic approaches,she and her students are studying dispersal in vernal poolamphibians in fragmented, suburban landscapes as wellas managed forest landscapes. (Photographed by MattBaber).
Kimberly Babbitt is a Professor of Wildlife Ecology andAssociate Dean of Academic Affairs at the University ofNew Hampshire. She received her B.S. at the Universityof New Hampshire, her M.S. at Texas A&M University,and her Ph.D. at the University of Florida. Much of herresearch efforts focus on understanding effects of landuse change on wetland-dependent organisms in order toinform land use planning and conservation efforts. (Pho-tographed by L. George).
89