high school participation map project geography of sports spring 2011
Post on 21-Dec-2015
214 views
TRANSCRIPT

High School Participation Map Project
Geography of SportsSpring 2011
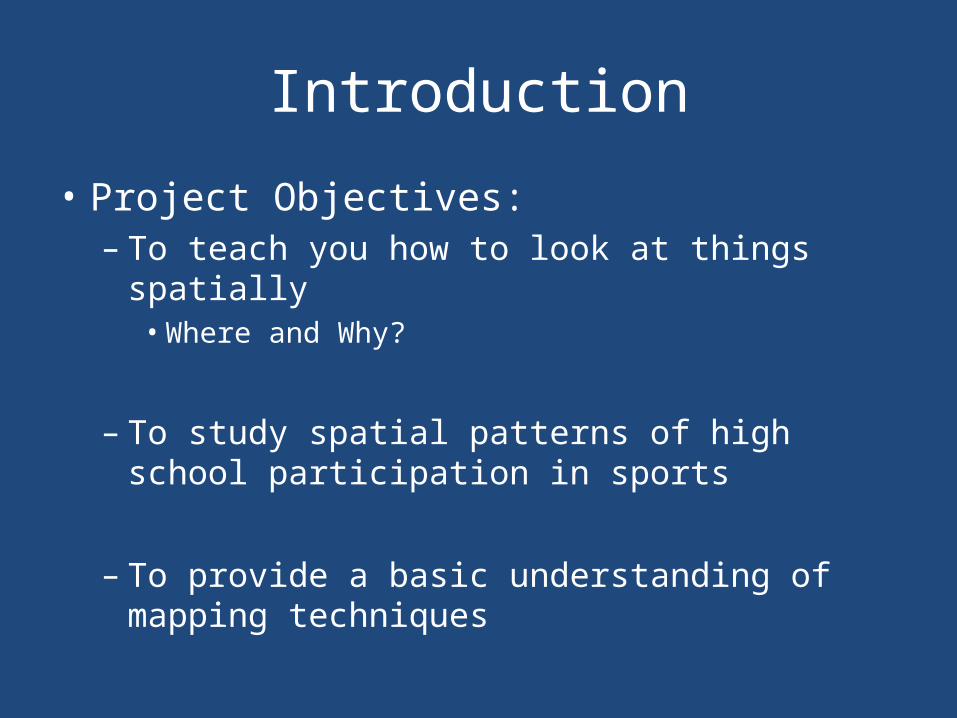
Introduction
• Project Objectives:– To teach you how to look at things spatially• Where and Why?
– To study spatial patterns of high school participation in sports
– To provide a basic understanding of mapping techniques
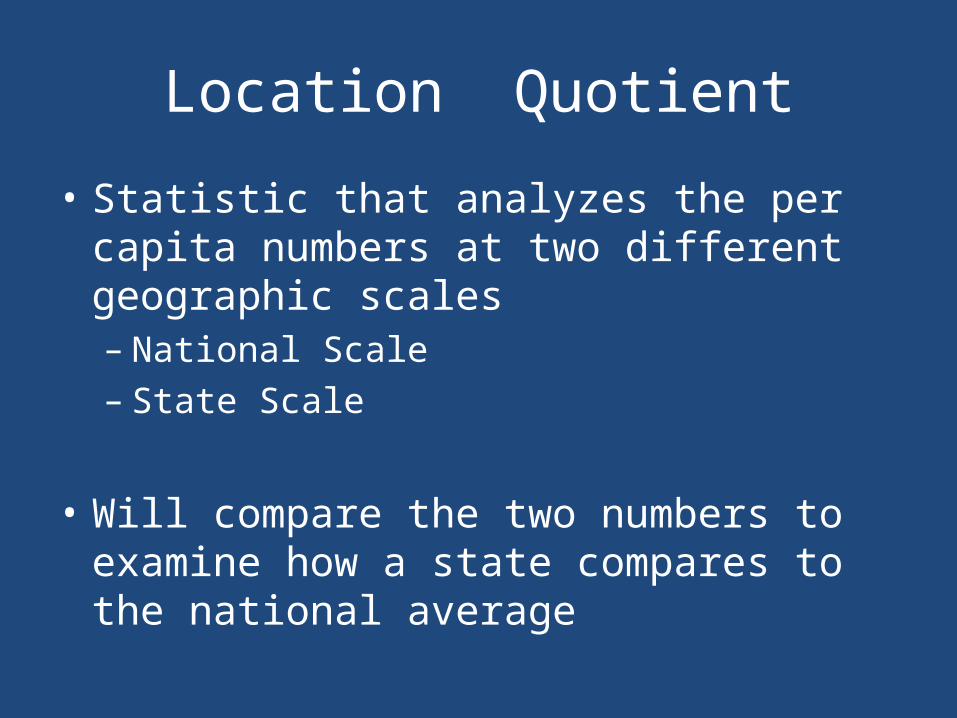
Location Quotient
• Statistic that analyzes the per capita numbers at two different geographic scales– National Scale– State Scale
• Will compare the two numbers to examine how a state compares to the national average
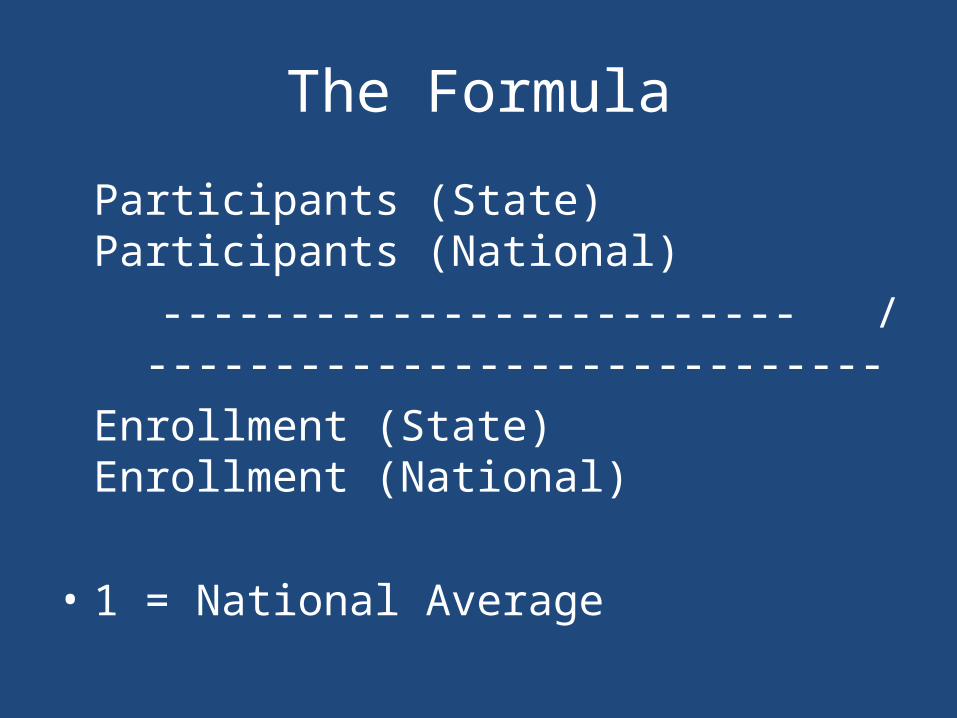
The Formula
Participants (State) Participants (National) ------------------------- / -----------------------------
Enrollment (State) Enrollment (National)
• 1 = National Average

The Project
• Data Used– NFHS Data for High School Participation • Link on the Website
– Data on Enrollment for grades 9-12
• Set up a spreadsheet for each sport to calculate the LQ.

The Project
• You will calculate the LQ for:– Boys Ice Hockey– Boys Lacrosse– A sport of your choice (from the approved list)– Total National Participation for both genders
combined
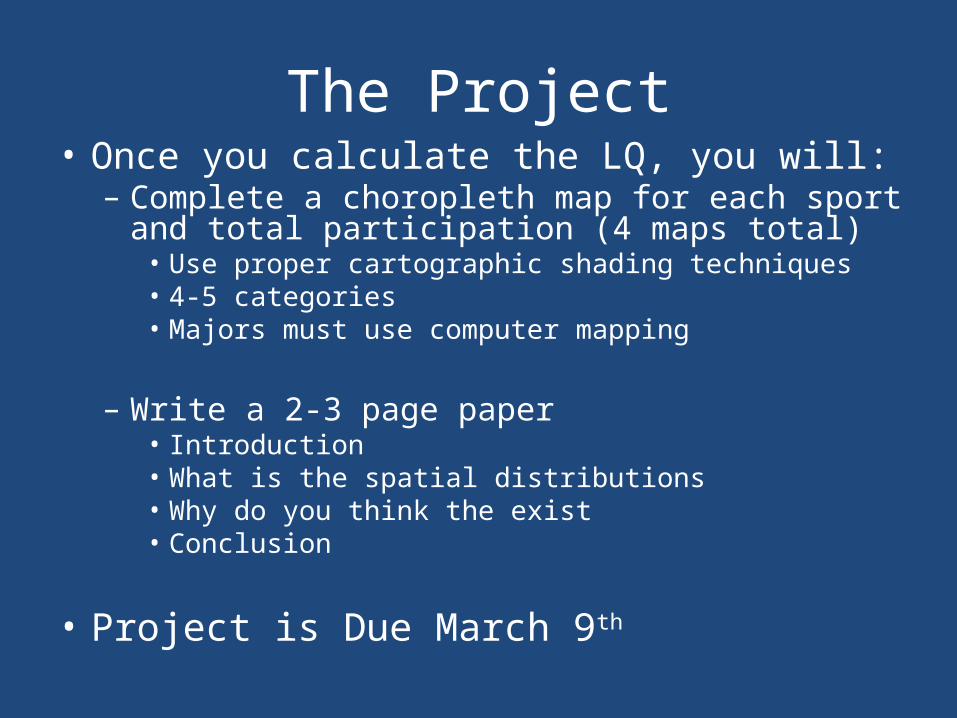
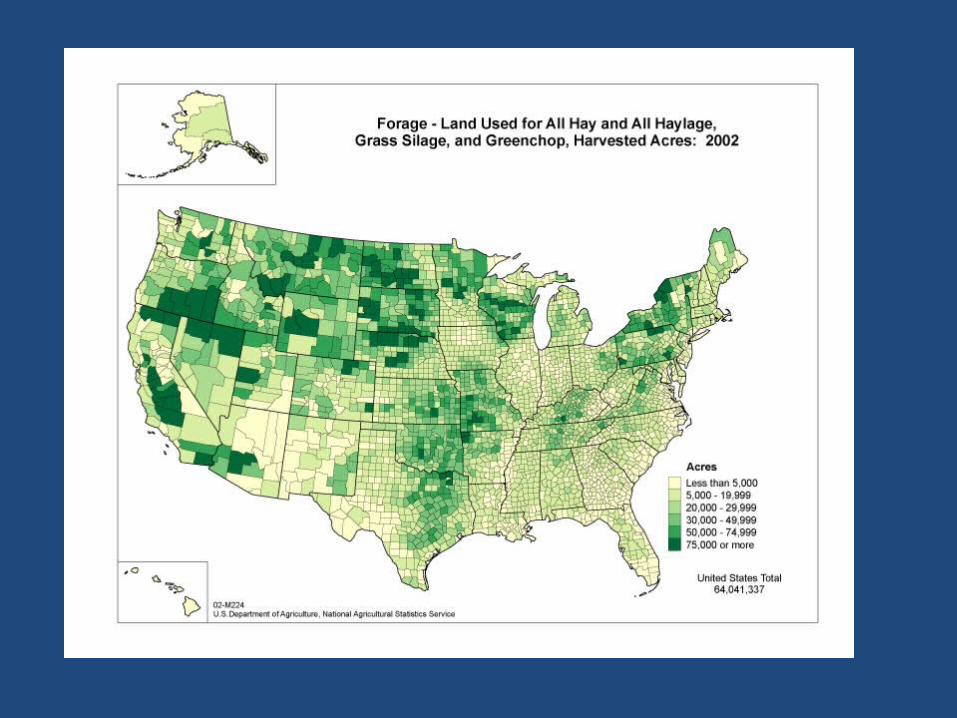
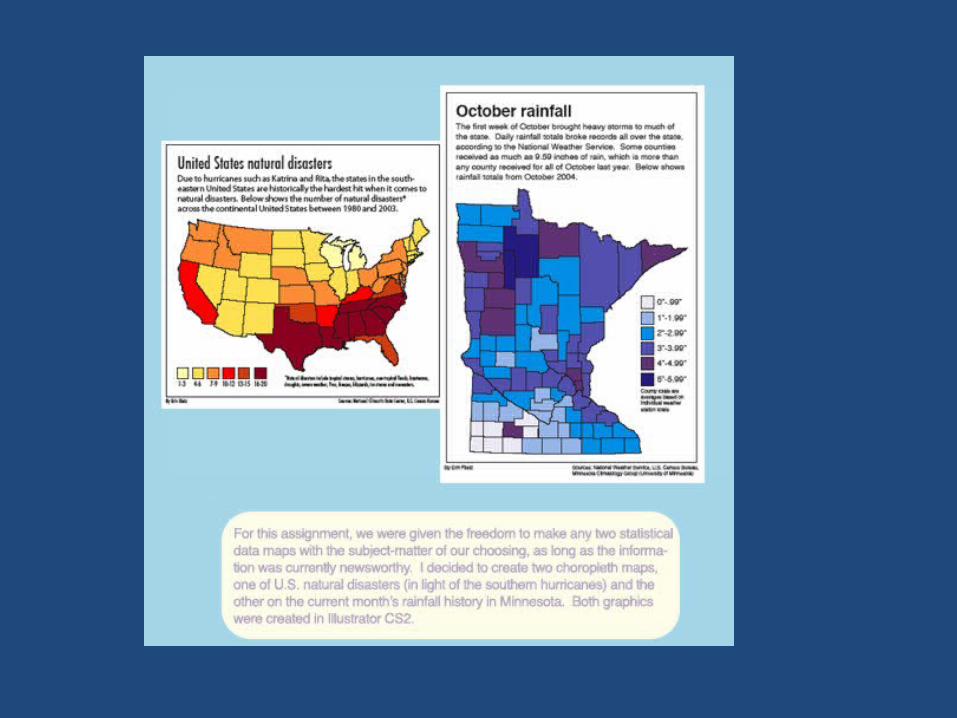
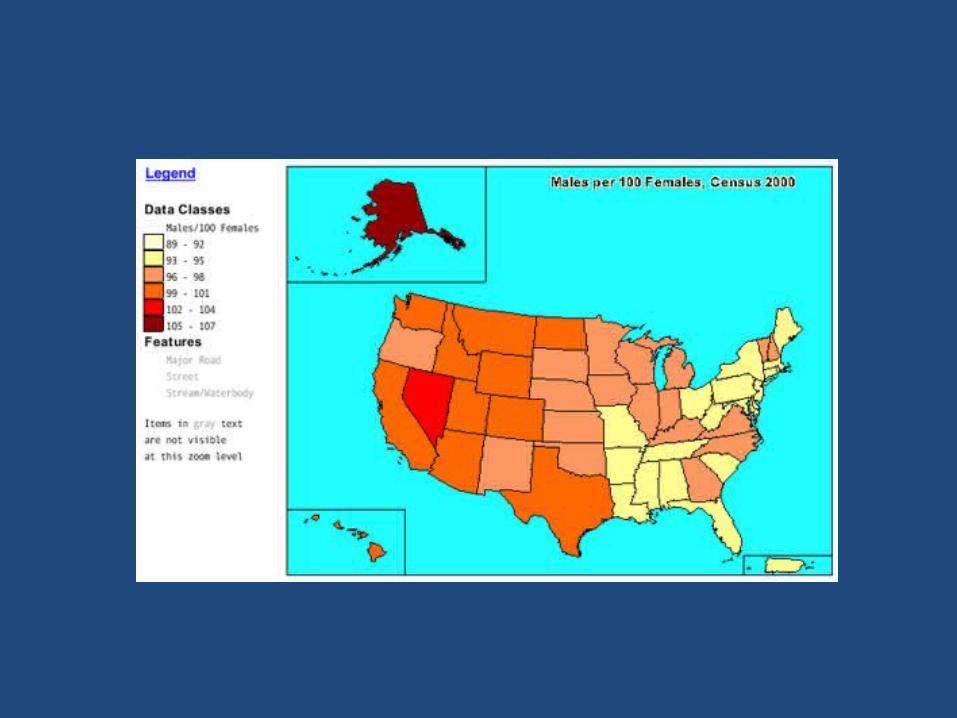
The Project• Once you calculate the LQ, you will:– Complete a choropleth map for each sport and total
participation (4 maps total)• Use proper cartographic shading techniques• 4-5 categories• Majors must use computer mapping
– Write a 2-3 page paper• Introduction• What is the spatial distributions • Why do you think the exist• Conclusion
• Project is Due March 9th