high school youth risk behavior & resiliency results yrbs booklet 2009 fi… · high school...
TRANSCRIPT

Prepared by Education, Training & Research Associates (www.etr.org)
High School Youth Risk Behavior & Resiliency Results Key Indicators from the 2009 Youth Risk Behavior & California Healthy Kids Surveys
This booklet provides an overview of the latest results on the health of students attending SanFrancisco's public high schools.
The booklet includes results from the 2009 High School Youth Risk Behavior Survey (YRBS) andCalifornia Healthy Kids Survey (CHKS) and examines trends in risk behavior over the past twelve years.The results in this report can be used to make inferences about the health risk behaviors and resiliencyof all students in grades nine through twelve attending public high schools in San Francisco.
The survey results are used by SFUSD's Student Support Services Department (SSSD) to monitor healthrisk behaviors of San Francisco’s youth, guide program planning, and evaluate school-based healthprograms. Results from these surveys support the District's Balanced Scorecard by assisting SSSD tounderstand our diverse student population. In addition, they identify areas of growth and areas thatneed improvement in addressing student health and wellness needs, which supports increased studentaccess to health-related educational programs and services. For more information, please visitwww.healthiersf.org.

2009 High School Youth Risk Behavior & Resiliency Results
2 For more information, please visit www.healthiersf.org.
Our special thanks go to all the SFUSD high school students who took the time to complete the surveys so that we might better understand how to reduce future health risks and support children achieving. Our sincere thanks also go to all the principals, teachers, and other school personnel who facilitated the administration of the surveys.
This project was funded by the Centers for Disease Control & Prevention (CDC), Cooperative Agreement 1U87DP001177-01, the California Department of Education (CDE), and the San Francisco Unified School District’s Student Support Services Department, Training & Research Associates (ETR) managed the administration of the surveys and produced this booklet.
The results presented in this report can be used to make inferences about the health-risk behaviors of all students in grades nine through twelve attending public high schools in San Francisco. In this booklet, information about risk behavior comes from the YRBS, while information about youth development assets and resiliency comes from the CHKS.
The CHKS was developed under contract from CDE by WestEd in collaboration with Duerr Evaluation Resources, assisted by an Advisory Committee of researchers, teachers, school prevention and health program practitioners, and public agency representatives. The Healthy Kids Survey is a youth self-report data collection system that provides essential and reliable health risk assessment and resilience information to schools, districts, and communities.
The 2009 High School CHKS was administered to 10,837 students in grades nine through twelve in 24 public high schools in San Francisco. More information about the CHKS can be found at www.wested.org/chks or www.healthiersf.org.
Appreciation
About this Report
About the California Healthy Kids Survey (CHKS)

2009 High School Youth Risk Behavior & Resiliency Results
3
Black, 9.0%
Chinese, 42.0%
Filipino, 6.4%
Hispanic / Latino, 18.5%
White, 7.7%
All other races, 7.5%
Multiple races, 8.0%
9TH, 26.7%
10TH, 25.5%
11TH, 24.1%
12TH, 23.4%
Other, 0.4%
In 1990, the Youth Risk Behavior Survey (YRBS) was developed by the Centers for Disease Control and Prevention (CDC) to monitor priority health risk behaviors that contribute to the leading causes of death, disability, and social problems among youth and adults in the United States. These behaviors, often established during childhood and early adolescence, include: (1) violence and unintentional injuries; (2) tobacco use; (3) alcohol and other drug use; (4) sexual behaviors; (5) weight management and dietary behaviors; and (6) physical activity.
The 2009 High School YRBS was administered to a random sample of 2,167 students in grades nine through twelve in 15 public high schools in San Francisco. The overall response rate was 84%. Based on guidelines from the CDC, response rates of 60% or greater are considered generalizable to the population from which the sample was drawn. More information about the YRBS can be found at www.cdc.gov/yrbs.
Figure 1: Race / Ethnicity of Surveyed Students Figure 2: Sex of Surveyed Students
Figure 4: Sexual Orientation of Surveyed Students
About the Youth Risk Behavior Survey (YRBS)
Demographic Profile of 2009 HS YRBS Sample (n=2,167)
Male, 51.1%
Female, 49.2%
Hetero-sexual,88.8%
Gay or Lesbian,
1.8%
Bisexual,3.7%
Not Sure,5.8%
Figure 3: Grade Level of Surveyed Students
2009 High School Youth Risk Behavior & Resiliency Results
4 For more information, please visit www.healthiersf.org.
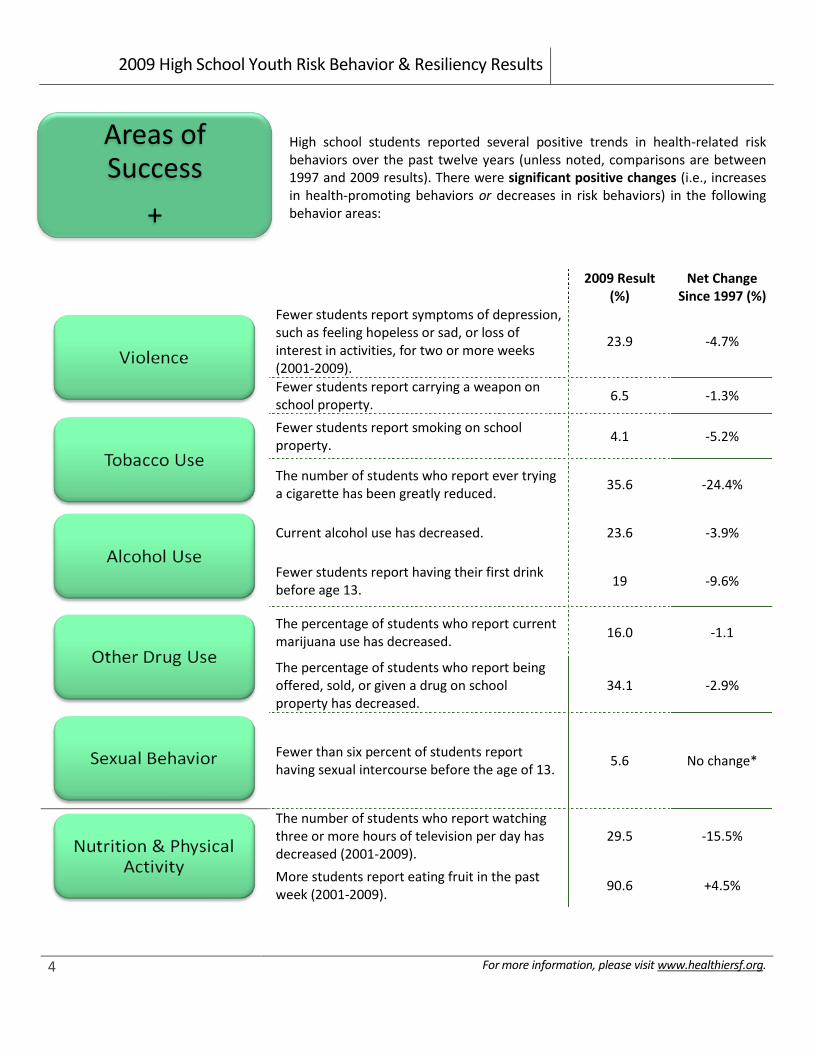
High school students reported several positive trends in health-related risk behaviors over the past twelve years (unless noted, comparisons are between 1997 and 2009 results). There were significant positive changes (i.e., increases in health-promoting behaviors or decreases in risk behaviors) in the following behavior areas:
2009 Result
(%) Net Change
Since 1997 (%)
Fewer students report symptoms of depression, such as feeling hopeless or sad, or loss of interest in activities, for two or more weeks (2001-2009).
23.9 -4.7%
Fewer students report carrying a weapon on school property.
6.5 -1.3%
Fewer students report smoking on school property.
4.1 -5.2%
The number of students who report ever trying a cigarette has been greatly reduced.
35.6 -24.4%
Current alcohol use has decreased. 23.6 -3.9%
Fewer students report having their first drink before age 13.
19 -9.6%
The percentage of students who report current marijuana use has decreased.
16.0 -1.1
The percentage of students who report being offered, sold, or given a drug on school property has decreased.
34.1 -2.9%
Fewer than six percent of students report having sexual intercourse before the age of 13.
5.6 No change*
The number of students who report watching three or more hours of television per day has decreased (2001-2009).
29.5 -15.5%
More students report eating fruit in the past week (2001-2009).
90.6 +4.5%
Areas of Success
+
2009 High School Youth Risk Behavior & Resiliency Results
5
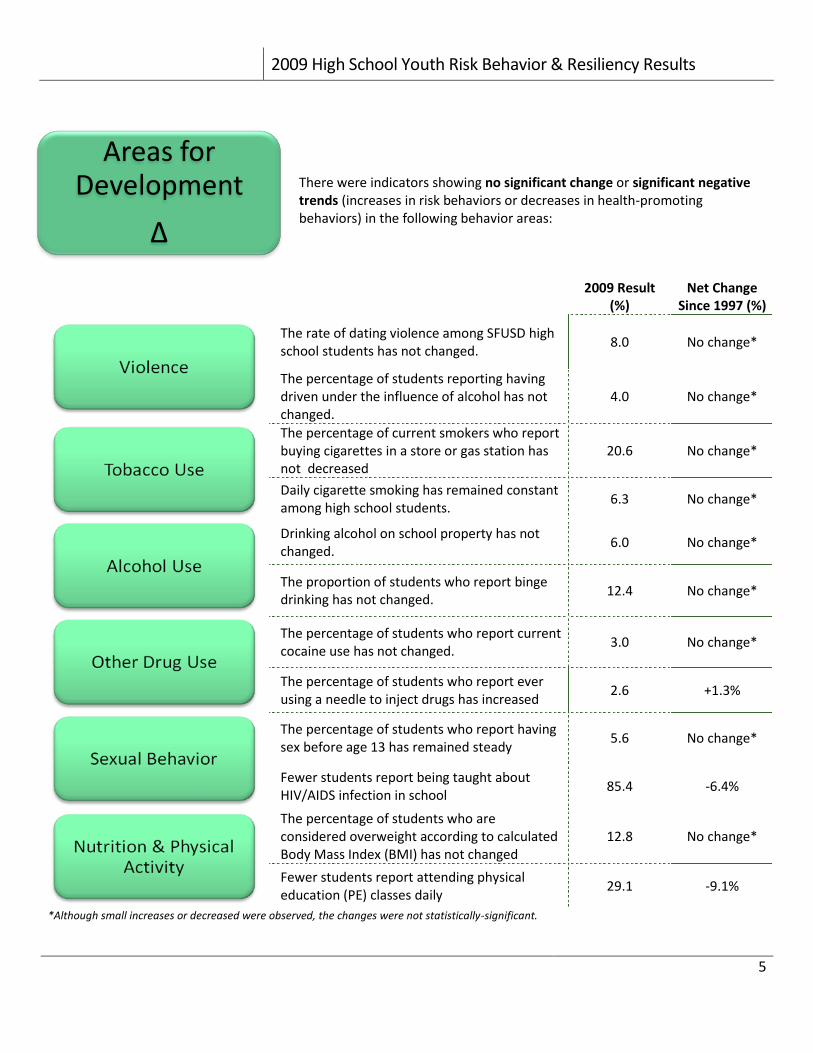
There were indicators showing no significant change or significant negative trends (increases in risk behaviors or decreases in health-promoting behaviors) in the following behavior areas:
2009 Result
(%) Net Change
Since 1997 (%)
The rate of dating violence among SFUSD high school students has not changed.
8.0 No change*
The percentage of students reporting having driven under the influence of alcohol has not changed.
4.0 No change*
The percentage of current smokers who report buying cigarettes in a store or gas station has not decreased
20.6 No change*
Daily cigarette smoking has remained constant among high school students.
6.3 No change*
Drinking alcohol on school property has not changed.
6.0 No change*
The proportion of students who report binge drinking has not changed.
12.4 No change*
The percentage of students who report current cocaine use has not changed.
3.0 No change*
The percentage of students who report ever using a needle to inject drugs has increased
2.6 +1.3%
The percentage of students who report having sex before age 13 has remained steady
5.6 No change*
Fewer students report being taught about HIV/AIDS infection in school
85.4 -6.4%
The percentage of students who are considered overweight according to calculated Body Mass Index (BMI) has not changed
12.8 No change*
Fewer students report attending physical education (PE) classes daily
29.1 -9.1%
*Although small increases or decreased were observed, the changes were not statistically-significant.
Areas for Development
∆

2009 High School Youth Risk Behavior & Resiliency Results
6 For more information, please visit www.healthiersf.org.
*Although small increases or decreased were observed, the changes were not statistically-significant.
Behaviors that Contribute to Injuries and Violence
•Twenty-two percent (22.4%) of students reported being the victim of a verbal slur because of their race or ethnic background in the past month.
•Nearly 22% of high school students reported being in a physical fight in the past year.
•Four out of five high school students (80.3%) report hearing harrassing remarks such as "fag," "dyke," or "that's so gay".
•In 2009, nearly 4% of students reported a suicide attempt that required treatment by a doctor or nurse.
Data from SFUSD...
•An estimated 30% of secondary school students in the United States were either a bully, a target of bullying, or both.1
•Approximately 72% of all deaths among US adolescents aged 10-24 years are attributed to injuries from only four causes: motor vehicle crashes (30%), all other unintentional injuries (15%), homicide (15%), and suicide (12%).(1)
Data from CDC...
Trends over the past twelve years…
1997 1999 2001 2003 2005 2007 2009 1997 Compared
to 2009 2007 Compared
to 2009
% Skipped school for fear of being unsafe at school or on the way to or from school
(One or more times in the 30 days preceding the survey)
SF HS 6.6 n/a 7.3 n/a 8.1 7.4 7.0 No change* No change*
National N/A – This question is not included in the national data set.
% Been in a physical fight
(One or more times during the 12 months preceding the survey)
SF HS 26.6 23.4 30.9 22.0 30.5 22.8 21.8 Decreased No change*
National 36.6 35.7 33.2 33.0 35.9 35.5 n/a n/a n/a
% Ever seriously thought about killing themselves
(One or more times during the 12 months preceding the survey)
SF HS 20.1 18.1 14.0 15.7 14.1 12.8 12.4 Decreased No Change*
National 20.5 19.3 19.0 16.9 16.9 14.5 n/a n/a n/a

2009 High School Youth Risk Behavior & Resiliency Results
7
`
Behaviors that Contribute to Injuries and Violence
9.1%
38.4%
12.4%
80.3%
22.4%
7.0%
24.7%
7.2%
17.5%
63.1%
0% 10% 20% 30% 40% 50% 60% 70% 80% 90% 100%
actually attempted suicide in the past year
seriously considered attempting suicide in the past year (among LGBQ students)
seriously considered attempting suicide in the past year (among all students)
heard other students making harassing remarks based on sexual orientation (e.g., "fag," "dyke," and "that's so gay"). …
were victimized by a racial / ethnic slur
did not go to school because they felt unsafe
had their property vandalized at school
were threatened or injured with a weapon at school
rode in a car with a driver who had been drinking
never or rarely wore a bicycle helmet while biking
Percentage of high school students who…
SFUSD Priority: Decrease
Harassment/Bullying
• Most high school students (80.3%) have heard other students make harrassing remarks based on sexual orientation.
SFUSD Priority: Increase
School Safety
• Over 1,100 students reported staying home from school at least one time in 2009 because they felt unsafe at school.
SFUSD Priority: Decrease
Suicidal Behavior
• In 2009, 9.1% of students reported attempting suicide. The number of LGBQstudents who reported seriously considering suicide(38.4%) increased significantly from 2007 (24.7%).
2009 High School Youth Risk Behavior & Resiliency Results
8 For more information, please visit www.healthiersf.org.
*Although small increases or decreased were observed, the changes were not statistically-significant.
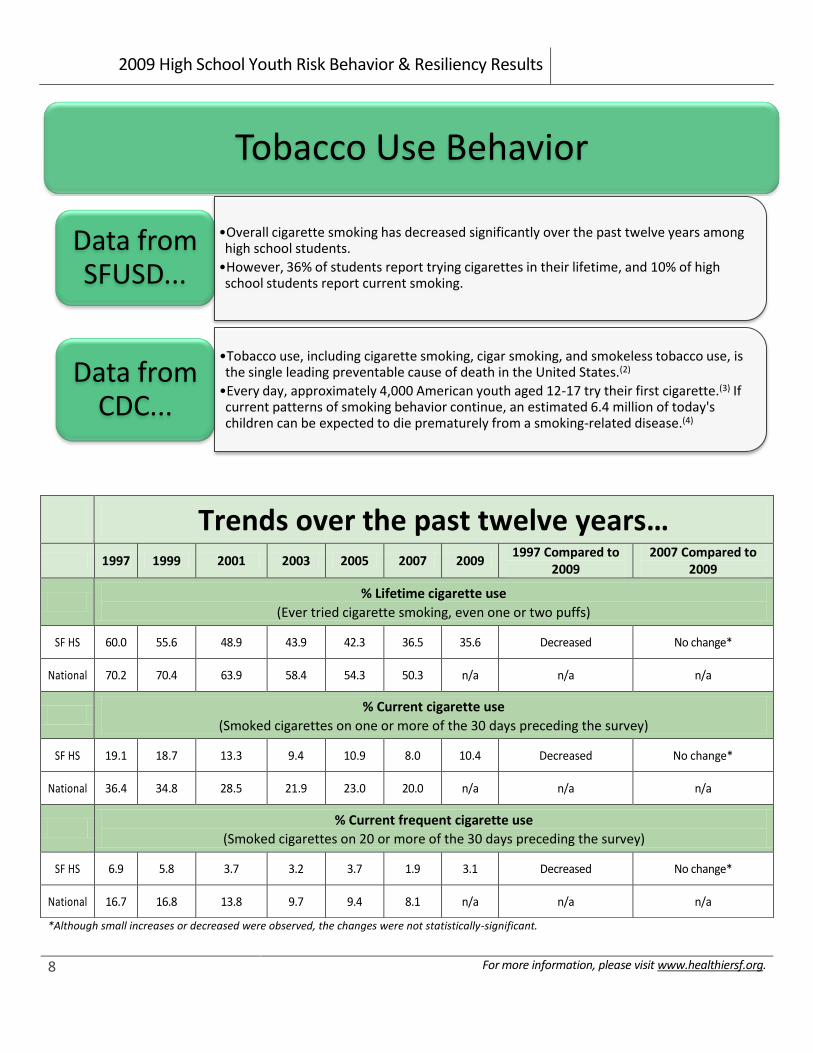
Tobacco Use Behavior
•Overall cigarette smoking has decreased significantly over the past twelve years among high school students.
•However, 36% of students report trying cigarettes in their lifetime, and 10% of high school students report current smoking.
Data from SFUSD...
•Tobacco use, including cigarette smoking, cigar smoking, and smokeless tobacco use, is the single leading preventable cause of death in the United States.(2)
•Every day, approximately 4,000 American youth aged 12-17 try their first cigarette.(3) If current patterns of smoking behavior continue, an estimated 6.4 million of today's children can be expected to die prematurely from a smoking-related disease.(4)
Data from CDC...
Trends over the past twelve years…
1997 1999 2001 2003 2005 2007 2009 1997 Compared to
2009 2007 Compared to
2009
% Lifetime cigarette use
(Ever tried cigarette smoking, even one or two puffs)
SF HS 60.0 55.6 48.9 43.9 42.3 36.5 35.6 Decreased No change*
National 70.2 70.4 63.9 58.4 54.3 50.3 n/a n/a n/a
% Current cigarette use
(Smoked cigarettes on one or more of the 30 days preceding the survey)
SF HS 19.1 18.7 13.3 9.4 10.9 8.0 10.4 Decreased No change*
National 36.4 34.8 28.5 21.9 23.0 20.0 n/a n/a n/a
% Current frequent cigarette use
(Smoked cigarettes on 20 or more of the 30 days preceding the survey)
SF HS 6.9 5.8 3.7 3.2 3.7 1.9 3.1 Decreased No change*
National 16.7 16.8 13.8 9.7 9.4 8.1 n/a n/a n/a

2009 High School Youth Risk Behavior & Resiliency Results
9
Tobacco Use Behavior
3.1%
4.1%
6.3%
10.4%
8.5%
35.6%
0% 10% 20% 30% 40% 50% 60% 70% 80% 90% 100%
smoked cigarettes on 20 or more of the past 30 days
smoked on school property in past 30 days
smoked daily in past 30 days
smoked cigarettes on one or more of the past 30 days
ever smoked a whole cigarette before age 13
ever tried cigarette smoking, even one or two puffs
Percentage of high school students who...
7.6% 20.6%53.9%
0%
50%
100%
Smo
ked
m
ore
th
an 1
0
ciga
rett
es
per
day
Usu
ally
go
t th
eir
ciga
rett
es
fro
m a
st
ore
or
gas
stat
ion
Trie
d t
o
qu
it
smo
kin
g in
pas
t 1
2
mo
nth
s
Among current smokers, the percentage of students who…
SFUSD Priority: Decrease
Current Smoking
• Over one in ten students (10.4%) reported current cigarette use in 2009.
SFUSD Priority: Decrease
Heavy Smoking
• In 2009, 10% of current smokers reported smoking ten or more cigarettes per day.
SFUSD Priority Decrease
Access to Cigarettes
• Twenty percent of student smokers reported they usually bought their cigarettes from a store or gas station.

2009 High School Youth Risk Behavior & Resiliency Results
10 For more information, please visit www.healthiersf.org.
Trends over the past twelve years…
1997 1999 2001 2003 2005 2007 2009 1997 Compared to
2009 2007 Compared to 2009
% Current alcohol use
(Had at least one drink of alcohol on one or more of the 30 days preceding the survey)
SFUSD HS 27.5 26.5 29.1 24.5 24.0 22.3 23.6 Decreased No change*
National 50.8 50.0 47.1 44.9 43.3 44.7 N/A n/a n/a
% Current binge drinking
(Had five or more drinks of alcohol in a row on one or more of the 30 days preceding the survey)
SFUSD HS 12.6 11.4 13.2 10.2 11.6 10.4 12.4 No change* No change*
National 33.4 31.5 29.9 28.3 25.5 26.0 N/A n/a n/a
% Current marijuana use
(Used marijuana one or more times during the 30 days preceding the survey)
SFUSD HS 17.1 15.2 18.3 12.5 15.6 11.4 16.0 No change* Increased
National 26.2 26.7 23.9 22.4 20.2 19.7 N/A n/a n/a
*Although small increases or decreased were observed, the changes were not statistically-significant.
Alcohol & Other Drug Use Behaviors
•Student reports of alcohol and other drug use have decreased significantly over the past twelve years.
• Nearly 24% percent of students report current alcohol use, and 12% report binge drinking in the previous month.
•Students continue to report current marijuana use (16%).
Data from SFUSD...
•Nationally, excessive alcohol consumption is associated with approximately 75,000 deaths per year.(5)
•Alcohol is a factor in approximately 41% of all deaths from motor vehicle crashes. (6)
•Among youth, the use of alcohol and other drugs has also been linked to unintentional injuries, physical fights, academic and occupational problems, and illegal behavior.(7)
Data from CDC...

2009 High School Youth Risk Behavior & Resiliency Results
11
Alcohol & Other Drug Use Behaviors
34.1%
3.1%
4.0%
5.3%
5.5%
16.0%
26.5%
6.0%
12.4%
23.6%
54.5%
0% 10% 20% 30% 40% 50% 60% 70% 80% 90% 100%
were offered, sold, or given an illegal drug at school
ever used heroin during their life
ever used methamphetamines during their life
ever used any form of cocaine during their life
used marijuana on school property in past 30 days
used marijuana one or more times in past 30 days
ever used marijuana
had a least one drink on school property in past 30 days
reported binge drinking in the past 30 days
had at least one drink of alcohol in the past 30 days
ever had at least one drink of alchohol
Percentage of high school students who...
SFUSD Priority: Decrease
Binge Drinking
• Twelve percent (12.4%) of students report recent binge drinking (i.e., drinking five or more drinks in a row on one or more of the past 30 days).
SFUSD Priority: Decrease
Current Alcohol Use
• In 2009, nearly one in four students (24%) reported using alcohol.
SFUSD Priority: Decrease
Drugs at School
• Thirty-four percent (34.1%) of students report being offered, sold, or given an illegal drug at school. This is significantly higher than 2007 (24.9%).

2009 High School Youth Risk Behavior & Resiliency Results
12 For more information, please visit www.healthiersf.org.
Trends over the past twelve years…
1997 1999 2001 2003 2005 2007 2009 1997 Compared to
2009 2007 Compared to 2009
% Ever had sexual intercourse
SFUSD HS n/a 26.7 29.8 24.6 31.3 26.4 28.7 No change* No change*
National 48.4 49.9 45.6 46.7 46.8 47.8 N/A n/a n/a
% Currently sexually active
(Had sexual intercourse with one or more person/s during the three months preceding the survey)
SFUSD HS 19.7 18.2 19.8 17.5 22.0 17.5 20.5 No change* No change*
National 34.8 36.3 33.4 34.3 33.9 35.0 N/A n/a n/a
*Although small increases or decreased were observed, the changes were not statistically-significant.
Sexual Behaviors
•Twenty-nine percent (29.0%) of students report ever having sexual intercourse in their lifetime.
•About 57% of sexually-active students report using a condom during their last sexual intercourse.
•Over the past twelve years, there's been a significant decrease in the percentage of students who report participating in HIV/AIDS education at school.
Data from SFUSD...
•Vaginal, anal, and oral intercourse place young people at risk for HIV infection and other sexually transmitted diseases (STDs). Vaginal intercourse carries the additional risk of pregnancy.(8)
•Adolescents are more likely to engage in high-risk behaviors, such as unprotected sex, when they are under the influence of drugs or alcohol.(9)
Data from CDC...

2009 High School Youth Risk Behavior & Resiliency Results
13
% Condom use during last sexual intercourse
(Of students who reported having sexual intercourse, used a condom during last intercourse)
SFUSD HS 57.1 56.8 62.9 65.4 66.3 70.8 56.5 No change Decreased
National 56.8 58.0 57.9 63.0 62.8 61.5 N/A n/a n/a
% Taught about HIV/AIDS in school
(Had been taught in school about AIDS or HIV infection)
SFUSD HS 91.8 90.2 90.0 92.5 83.9 85.5 85.4 Decreased No change*
National 91.5 90.6 90.0 92.5 83.9 85.5 85.4 n/a n/a
*Although small increases or decreased were observed, the changes were not statistically-significant.
Sexual Behaviors
22.0% 14.4%
56.5%
0%
50%
100%
drank alcohol or used drugs before last sexual intercourse
used birth control pills during last sexual intercourse
used a condom during last sexual intercourse
Among students who had sexual intercourse in the past 90 days, the percentage of students who…

2009 High School Youth Risk Behavior & Resiliency Results
14 For more information, please visit www.healthiersf.org.
Sexual Behaviors
5.6%
9.9%
28.7%
85.4%
0% 10% 20% 30% 40% 50% 60% 70% 80% 90% 100%
had sexual intercourse before age 13
have had sex with four or more people during their life
have ever had sexual intercourse
have ever been taught in school about AIDS or HIV infection
Percentage of high school students who...
SFUSD Priority: Increase
HIV/AIDS Prevention
• Over the past twelve years, the percentage of students who report participation in HIV/AIDS education has decreased significantly(91.8% to 85.4%).
SFUSD Priority: Increase
Condom Use
• The percentage of sexually-active students reporting condom use (56.5%) in 2009 has dropped significantlyfrom 2007 (70.8%). In contrast, the Condom Availiability Program has distributed thousands of condoms over the past several years, with nearly 5,000 students served in 2009.
SFUSD Priority: Decrease
Multiple Partners
• Nearly one in ten (9.9%) of students report having sexual intercourse with four or more people in their lifetime.

2009 High School Youth Risk Behavior & Resiliency Results
15
Trends over the past twelve years…
1997 1999 2001 2003 2005 2007 2009 1997 Compared to
2009 2007 Compared to 2009
% Overweight
(95th percentile or greater for body mass index, by age and sex, based on reference data)
SFUSD HS n/a n/a 10.6 6.3 10.5 8.5 12.8 No change* Increased
National n/a 10.7 10.5 12.1 13.1 13.0 N/A n/a n/a
% Described themselves as slightly or very overweight
SFUSD HS 30.3 34.9 32.1 34.7 30.9 31.2 30.8 No change* No change*
National n/a 30.0 29.2 29.6 31.5 29.3 N/A No change* No change*
% Were trying to lose weight
SFUSD HS 41.3 43.7 44.1 44.3 41.6 42.2 44.6 No change* No change*
National 39.7 42.7 46.0 43.8 45.6 45.2 N/A n/a n/a
*Although small increases or decreased were observed, the changes were not statistically-significant.
Weight Management & Dietary Behaviors
• Thirteen percent (13%) of students are overweight as measured by student self-reports of height and weight on the YRBS. In contrast, nearly one-third of students (31%) describe themselves as overweight.
• Forty-five percent (45%) of students report they are trying to lose weight.
Data from SFUSD...
• Healthy eating is associated with reduced risk for many diseases, including the three leading causes of death: heart disease, cancer, and stroke.(10)
• Healthy eating in childhood and adolescence is important for proper growth and development and can prevent health problems such as obesity, dental caries, and iron deficiency anemia.(10)
Data from CDC...

2009 High School Youth Risk Behavior & Resiliency Results
16 For more information, please visit www.healthiersf.org.
*that is, each day during the week preceding the survey.
Weight Management & Dietary Behaviors
90.6%
6.6%
15.5%
30.8%
44.6%
12.8%
8.4%
0% 10% 20% 30% 40% 50% 60% 70% 80% 90% 100%
ate fruit one or more times every day in the last week*
drank 3 or more glasses of milk every day in the last week*
drank a can, bottle, or glass of soda or pop one or more times every day in the last week*
described themselves as slightly or very overweight
were trying to lose weight
were overweight
were obese
Percentage of high school students who...
SFUSD Priority:Increase
Healthy Weight
• Nearly half (45%) of students report currently trying to lose weight.
SFUSD Priority:Improve
Healthy Habits
• Nearly 600 students (4%) reported vomiting to lose weight one or more times in the past 30 days.
SFUSD Priority:Increase
Healthy Eating
• Nearly one in six students (16%) reported drinking soda or pop daily.

2009 High School Youth Risk Behavior & Resiliency Results
17
Trends over the past twelve years…
1997 1999 2001 2003 2005 2007 2009 1997 Compared to
2009 2007 Compared to
2009
% Attended physical education classes
(On one or more days in an average week when they were in school)
SFUSD HS 51.9 50.1 56.0 51.8 54.6 54.2 55.6 No change* No change*
National 48.8 56.1 51.7 55.7 54.2 53.6 N/A n/a n/a
% Attended physical education classes daily
(Five days in an average week when they were in school)
SFUSD HS 38.2 36.0 34.3 37.0 36.4 36.0 29.1 Decreased No change*
National 27.4 29.1 32.2 28.4 33.0 30.3 N/A n/a n/a
% Watched television three or more hours per day
(On an average school day)
SFUSD HS n/a 45.1 45.0 40.9 41.5 33.2 29.5 Decreased No change*
National n/a 42.8 38.3 38.2 37.2 35.4 N/A n/a n/a
*Although small increases or decreased were observed, the changes were not statistically-significant.
Physical Activity Behaviors
•Eighty-eight percent (88.1%)of 9th and 10th grade students report attending the required physical education classes at least once per school week.
•Although the indicator has decreased significantly over the past twelve years, one-third of students (30%) report watching three or more hours of TV on an average school day.
•Over one-third of students (35.9%) report spending three or more hours per day using video games or computers for purposes other than school.
Data from SFUSD...
•Regular physical activity in childhood and adolescence improves strength and endurance, helps build healthy bones and muscles, helps control weight, reduces anxiety and stress, increases self-esteem, and may improve blood pressure and cholesterol levels.(11)
•Positive experiences with physical activity at a young age help lay the basis for being regularly active throughout life.(11)
Data from CDC...

2009 High School Youth Risk Behavior & Resiliency Results
18 For more information, please visit www.healthiersf.org.
29.5%
35.9%
34.4%
42.8%
29.1%
89.1%
0% 10% 20% 30% 40% 50% 60% 70% 80% 90% 100%
watched 3 or more hours of TV on an average school day
played video or computer games for 3 or more hours on an average school day
were physically active for an hour per day on five or more days in the past week
played on one or more sports teams during the past year
attended physical education (PE) classes daily in an average school week
attended physical education (PE) classes on one or more days in an average school week (9th and 10th grade
only)
Percentage of high school students who...
SFUSD Priority:Increase
Nonrequired Physical Education
• Fewer than twelve percent(11.8%) of 11th and 12th graders report attending PE classes on one or more days in an average school week.
SFUSD Priority:Increase
Participation in Sports
• Significantly more male than female students reported playing on one or more sports teams during the previous year (48% vs. 37%).
SFUSD Priority:Increase
Physical Activity
• One in three students (36%) report playing video games or using a computer for something other than school work for three or more hours on an average school day.

2009 High School Youth Risk Behavior & Resiliency Results
19
This section provides results from the CHKS on youth development assets in the school environment. SFUSD administers the youth development module of the CHKS every two years to students in the 9th and 11th grades. Youth development researchers emphasize the importance of providing support and opportunities (external assets) in the form of caring relationships, high expectations, and opportunities for meaningful participation within the school environment. The development of assets within the school community improves health outcomes and academic performance. The following charts show the percentage of SFUSD 9th and 11th students who scored “high” on school environment factors. For comparison purposes, statewide results are also included.
School Environment Assets Results
23%33%
10%20%
28%
43%
11%
26%28%
39%
14%
27%
0%10%20%30%40%50%60%70%80%90%
100%
Caring Relationships: Adults at School
High Expectations: Adults at School
Opportunities for Meaningful Participation
Total School Environment Assets
SFUSD Grade 9 (2007) SFUSD Grade 9 (2009) California Grade 9 (2009)
28%34%
13%
24%32%
40%
15%
30%31%39%
15%
29%
0%10%20%30%40%50%60%70%80%90%
100%
Caring Relationships: Adults at School
High Expectations: Adults at School
Opportunities for Meaningful Participation
Total School Environment Assets
SFUSD Grade 11 (2007) SFUSD Grade 11 (2009) California Grade 11 (2009)

2009 High School Youth Risk Behavior & Resiliency Results
20 For more information, please visit www.healthiersf.org.
References
(1) CDC, NCHS. Public use data file and documentation: multiple cause of death for ICD-10 2005 data [CD-ROM]. 2008.
(2) Fellows JL, Trosclair A, Adams EK, Rivera CC. Annual smoking attributable mortality, years of potential life lost and economic costs: United States 1995-1999. Morbidity and Mortality Weekly Report 2002; 51: 300-303.
(3) Substance Abuse and Mental Health Services Administration. Summary of findings from the 2001 National Household Survey on Drug Abuse: Volume II. Technical appendices and selected data tables. Rockville, MD: U.S. Department of Health and Human Services, 2002; NHSDA Series H-18; DHHS publication no. (SMA) 02-3759.
(4) CDC. Office on Smoking and Health, 2002 calculations based upon: Smoking attributable mortality and years of potential life loss—United States, 1984. Morbidity and Mortality Weekly Report 1997; 46: 444-451.
(5) U.S. Department of Health and Human Services. The Surgeon General's Call to Action to Prevent and Reduce Underage Drinking. U.S. Department of Health and Human Services, Office of the Surgeon General, 2007.
(6) CDC. Alcohol-attributable deaths and years of potential life lost—United States, 2001. Morbidity & Mortality Weekly Report 2004; 53(37):866–870.
(7) U.S. Department of Transportation. Fatality Analysis Reporting System (FARS) Web-based Encyclopedia. (8) CDC. Accessed at http://www.cdc.gov/healthyyouth/sexualbehaviors/index.htm. (9) Leigh B, Stall R. Substance use and risky sexual behavior for exposure to HIV: issues in methodology,
interpretation, and prevention. American Psychologist 1993; 48: 1035–1043. (10) U.S. Department of Health and Human Services. The Surgeon General's call to action to prevent and
decrease overweight and obesity. Rockville, MD.: U.S. Department of Health and Human Services, Public Health Service, Office of the Surgeon General, 2001.
(11) CDC. Physical Activity and Health: A Report of the Surgeon General. Atlanta, GA: U.S. Department of Health and Human Services, 1996.

2009 High School Youth Risk Behavior & Resiliency Results
21
For more information, please visit www.healthiersf.org