high sensitivity electron diffractionanalysis astudy of ... · suggestthat...
TRANSCRIPT
High sensitivity electron diffraction analysisA study of divalent cation binding to purple membrane
Alok K. Mitra and Robert M. StroudDepariment of Biochemistry and Biophysics, University of California San Francisco, San Francisco, California 94143-0448
ABSTRACT A sensitive high-resolutionelectron diffraction assay for change instructure is described and harnessedto analyze the binding of divalent ca-
tions to the purple membrane (PM) ofHalobacterium halobium. Low-doseelectron diffraction patterns are subjectto a matched filter algorithm (Spencer,S. A., and A. A. Kossiakoff. 1980. J.Appl. Crystallogr. 13:563-571). to ex-
tract accurate values of reflectionintensities. This, coupled with a schemeto account for twinning and specimentilt in the microscope, yields results thatare sensitive enough to rapidly quanti-tate any structure change in PMbrought about by site-directed muta-genesis to the level of less than twocarbon atoms.
Removal of tightly bound divalentcations (mainly Ca2' and Mg2+) fromPM causes a color change to blue andis accompanied by a severely alteredphotocycle of the protein bacteriorho-dopsin (bR), a light-driven protonpump. We characterize the structuralchanges that occur upon associationof 3:1 divalent cation to PM, versus
membranes rendered purple by addi-tion of excess Na+. High resolution, lowdose electron diffraction data obtainedfrom glucose-embedded samples ofPb2+ and Na+ reconstituted PM prepa-rations at room temperature identifyseveral sites with total occupancy of2.01 ± 0.05 Pb2+ equivalents. Thecolor transition as a function of ion con-
centration for Ca2+ or Mg2+ and Pb2+
are strictly comparable. A (Pb2+-Na+) PM Fourier difference map inprojection was synthesized at 5 A usingthe averaged data from several nomi-nally untilted patches corrected fortwinning and specimen tilt. We find sixmajor sites located on helices 7, 5, 4, 3,2 (nomenclature of Engelman et al.1980. Proc. Natl. Acad. Sci. USA.77:2023-2027) in close associationwith bR. These partially occupied sites(0.55-0.24 Pb2+ equivalents) repre-sent preferential sites of binding fordivalent cations and complements our
earlier result by x-ray diffraction (Katreet al. 1986. Biophys. J. 50:277-284).
INTRODUCTION
Bacteriorhodopsin (bR), a transmembrane protein, isfound in a highly ordered, two-dimensional hexagonal P3lattice as purple patches (the so-called purple membrane[PM]) in the cytoplasmic membrane of halophilic bacte-rium Halobacterium halobium (Stoeckenius and Bogo-molni, 1982). bR contains a single retinylidene chromo-phore bound via a protonated Schiff base to the E-NH2group of Lys216 (Bayley et al., 1981; Katre et al., 1981)and absorbs maximally at 568 nm in the light-adaptedform of native bR. Upon the absorption of a photon, bRundergoes a photocycle during which all-trans to 13-cisisomerization of the chromophore plus deprotonation ofthe Schiff base takes place and protons are pumpedvectorially to the extracellular region, establishing an
electrochemical gradient which drives some metabolicprocesses, e.g., ATP synthesis (Bogomolni et al., 1976).
Well-washed PM binds primarily divalent cations,namely, -3-4 mol of Mg2' and -1 mol of Ca2, per mol ofbR and small amounts of manganese, copper, and zinc(Chang et al., 1985). Deionization of PM turns themembrane blue with Xmax shifting to 605 nm (Kimura etal., 1984), and this color transition is associated with a
severely altered photocycle (Kobayashi et al., 1983). Theblue membrane photocycle lacks a deprotonated blue-shifted photo-intermediate analogous to M412, and it hasbeen suggested (Mowery et al., 1979) that it does notpump protons. PM can be regenerated by the addition ofstoichiometric amounts of divalent cations (2-3 times) or
monovalent cations (200 times) to the deionized PM(Kimura et al., 1984; Chang et al., 1985, 1986). Recentstudies have shown, for instance, through absorptionspectroscopy (Kimura et al., 1984; Chang et al., 1985;Ariki and Lanyi, 1986) and electron spin resonance
spectroscopy (Dufiach et al., 1987) that there are multipletight binding sites for divalent cations on the PM. Theinvolvement of metal ions in the deprotonation of theSchiff base and a-tyrosine residue during the formation ofM412 have been described (Corcoran et al., 1987; Dupuiset al., 1985). These observations have suggested a possiblerole for the divalent cations in the functioning of bR(Dupuis et al., 1985; Chronister and El-Sayed, 1987),either by direct involvement in the proton-pumping mech-anism or in maintaining structural integrity. However,recent studies (Szundi and Stoeckenius, 1987, 1988)
Biophys. J. Biophysical SocietyVolume 57 February 1990 301-311
0006-3495/90/02/30 1 / 11 $2.000006-3495/90/02/301/11 $2.00 301

suggest that the blue to purple transition is mediated onlyby protonation changes at the membrane surface andapparently argue against any direct role for the divalentcations with regard to the stabilization of bR and/orproton pumping.
In this study by electron diffraction on glucose embed-ded single PM sheets, we investigated whether or notthere are discrete divalent-cation binding sites on PM,and if so define their location in projection. High-resolution electron-diffraction data from purple mem-
brane sheets reconstituted with Pb2+ or with Na+,whereby possible effects on the protein conformationthrough deionization were minimized, were compared bythe calculation of a difference density map between theformer and the latter to locate divalent-cation bindingsites. The color transition as a function of the ion concen-tration for Ca2" or Mg2" and Pb2+ are strictly compara-ble. Also Pb2+ and Na+ were chosen so as to maximize thecontribution of the difference in electron scattering poten-tial in the two cases and hence the signal in the differencemap. By establishing the validity of a Pb2+ - Na+ peak(Katre et al., 1984) in the difference Fourier map, we
describe the sites of divalent cation binding on PM. Thesix major sites, all located on the protein, are partiallyoccupied (0.55-0.24 Pb2+ equivalents) and establish pre-
ferential binding sites for divalent cation. This conclusioncomplements results from our earlier investigation basedon x-ray diffraction analyses (Katre et al., 1986).
MATERIALS AND METHODS
MaterialsPurple membranes isolated from strain ET1001 of H. halobium (Oes-terhelt and Stoeckenius, 1974) were provided by Prof. W. Stoeckenius(Cardiovascular Research Institute, University of California, San Fran-cisco, CA). The concentration of bR in PM was assayed by absorbanceat 568 nm using a value of 63,000 cm-'M-1 for the extinction coefficientof light-adapted form of bR. The concentration of bR in blue membrane(BM: deionized PM) was measured using E60- 60,000 cm-'M-'(Kimura et al., 1984). Optical densities were measured on a spectropho-tometer (Beckman Instruments, Inc., Fullerton, CA) equipped with adigital detection system (Gilford Instruments Laboratories, Inc., Ober-lin, OH). All centrifugations were carried out in a Sorvall SS-34 rotor(DuPont Co., Wilmington, DE) at 40C. Cation-exchange resin inhydrogen form was cellex-P (Bio-Rad Laboratories, Richmond, CA).All blue membrane preparations were kept in clean plastic tubes(Applied Scientific, San Francisco, CA) as suspension in nano-purewater (18 MQl/cm restivity, pH 5.9) (Sybron/Barnstead, Boston, MA)at 40C and handled with plastic pipettes (Bio-Rad Laboratories). Anycontact with glass was scrupulously avoided. Triton X-100 (Rohm andHaas Co., Philadelphia, PA), D-glucose, and the salts NaCl, PbCI2,NaH2PO4, Na2HPO4, NaCH3COO, and NaN3 were reagent grade.
Specimen preparationTo improve signal-to-noise ratio in electron diffraction patterns, we usedlarge reconstituted PM sheets (5 ,um average diameter, _106 molecules
of bR per diffraction pattern) prepared by Triton X-100 solubilizationfollowed by detergent removal (Cherry et al., 1978). Blue membranesgenerated from such PM sheets by the passage through a cationexchange resin (Kimura et al., 1984; Katre et al., 1986) were convertedto purple membrane by adding either Pb2+ or Na+.
Glucose embedded Pb2+ or Na+ reconstituted PM samples wereprepared for electron diffraction as follows. For preparing Pb2+ labeledPM samples, an aliquot of BM (60-80 MM protein concentration) wasincubated overnight with 3:1 molar ratio of PbCl2 to protein. ThisPb2`-labeled membrane was later resuspended at the same proteinconcentration in 1 mM Na phosphate buffer, pH 7.0, containing 0.7%glucose and 0.05% sodium azide. Na+-reconstituted PM samples wereprepared by resuspending BM (60-80 MM protein concentration) in 10mM sodium (Na+/bR > 150:1) phosphate buffer pH 7.0 containing0.7% glucose and 0.05% sodium azide. Hereafter, Na+- and Pb2+-reconstituted samples are referred to as Na+ PM and Pb2+ PM,respectively.
Electron microscopyTypically 6 gl of glucose-embedded reconstituted PM sample was
applied to a 300-mesh copper grid that was covered by a thinhydrophobic carbon film floated off a freshly-cleaved mica sheet. Thecarbon-coated grid was washed several times with nanopure waterbefore sample application. The sample was allowed to stand for -5 minand then excess liquid was removed by touching the edge of the grid withthe tip of a filter paper, and the grid air dried. Electron diffraction was
carried out at 100 kV in an EM400 electron microscope (PhillipsElectronic Instruments, Eindhoven, Netherlands). Electron dose (e/A2/min) on the specimen was determined by measured current regis-tered on an electrometer (model 61OB; Keithley Instruments, Inc.,Cleveland, OH) connected to the focusing screen. A current versus dosecalibration determined from the knowledge of the speed of the recordingfilm was used for this purpose.
A nominal dose rate of 2.0-2.5 e/A2/min was set up by using a spotsize of 0.5 ,um (highly excited first condenser lens), 12-Mum-diamcondenser aperture, and an illuminated area of -8 zm on the specimenby overfocusing the second condenser lens. With the emission currentturned down to the lowest setting, the grid was scanned in an out-of-focus diffraction mode which resulted in a high contrast image. Whena suitable membrane sheet was found, the diffraction beam was rapidlyfocused, the beam shuttered, and the emission current restored tonormal. This resulted in no more than -0.03 e/A2 of total dose on thecrystal before taking the exposure. Next the shutter was opened and an
exposure taken typically for 10 s which resulted in a total dose of-0.3-0.4 e/A2. At the end of each session of recording diffractionpatterns, calibration films with known electron exposures were obtained.Diffraction patterns and calibration films were recorded on Kodak 4489film (Eastman Kodak Co., Rochester, NY), which was developed for 4min according to manufacturer's specification in fresh Kodak D19developer diluted 1:2 with deionized water at 200C.
Data acquisitionElectron diffraction patterns that showed reflections to high resolution,typically to -3.5 A, were digitized on a PDS O01OM flatbed microdensi-tometer (Perkin-Elmer Corp., Norwalk, CT) using an aperture and stepsize of 10 Mm. To reduce the area of scanning and yet have enough datapoints for reliable estimation of background, strips 49 pixels wide andcentered on lattice rows parallel to one of the unit cell axes were scannedfor reflection intensities from infinity to 3.5 A resolution and digitized.From scanning the calibration films it was found that for the "slow"Kodak 4489 films used in this study up to an optical density (OD) of 2.8
302 Biophysical Journal Volume 57 February 1990302 Biophysical Journal Volume 57 February 1990

corresponding to that for the strongest reflections, the OD values were
linearly related to electron exposure with a correlation coefficient>0.99. Hence no conversion factor for determining electron exposurewas used and this was absorbed in the final scaling of the diffractionpatterns. Smoothing of the data, accurate location of the diffraction spotcenters, and calculation of the background and the background-corrected intensities were carried out using a "matched filter" algorithm(Spencer and Kossiakoff, 1980) as described in Katre et al. (1984).
Correction for twinning, tilt, andscalingThe large reconstituted PM sheets used for data collection are in generaltwinned, being composed of domains of bR molecules in oppositeorientations and organized according to the space group P3. A schemefor the analysis of the twins, detwinning, and removal of the effects ofthe specimen tilt in terms of departure from exact normal to the electronbeam (even a small amount of which introduces systematic errors inintensities, especially at high resolution) was developed as described inthe Appendix. Nominally untilted patterns were selected visually bycomparing the intensities of the symmetry mates of tilt sensitivereflections 5,0 and 7,0 whose intensities are twin independent, and 1,4and 4,2. Systematic errors arising from specimen tilt were corrected forthe 26-7 A data by using the variation of structure factor against z*, thedistance along the reciprocal lattice line. For reflections from 7 to 5 Aresolution a linear fit of the intensities of symmetry-related reflections toz* was applied to determine the tilt contribution. The symmetry,Friedel, and triplet residuals RS, RF, and RT, respectively, for a
diffraction pattern were calculated as,
RS = E E IFil- (IFil) .IFil (1)hki-I jhki-I
RF E FiF - IF7I (IFil + IF,I) (2)hk i-I ~ hk i-I
RT IFjI- (IFj51) 2.| IF1l, (3)h i-I hk i- I
where F 's are the extracted detwinned-detilted amplitudes, (IF;|) is thesixfold symmetry-averaged value, (IFil) is the triplet averaged value, iis the Friedel mate of reflection i and IF11l - (IFil + IF,1)/2.0.The extracted diffraction amplitudes after correcting for twinning
and tilt were sixfold symmetry averaged and then weighted according totheir variance between patterns. The Na+ PM patterns were scaled andaveraged together to yield a set of consensus Na+ PM amplitudesFN(hk). The extracted symmetry averaged amplitudes from each Pb2+PM pattern were individually scaled to FN(hk) set and subsequentlyaveraged between patterns after weighting according to the variance, toyield a set of consensus Pb2+ PM amplitudes FD(hk). The scalingbetween two sets of amplitudes F, and F2 was performed by least-squares minimizing
Q = (F,), -K exp (-Bs2) (F2)S, (4)hk
where s is the reciprocal lattice vector and sum is over all overlappingreflections. The scaling residual after minimization was given by
R = Ql L: ( F, )S. (5)hk
Fourier analysis and errorestimation in the mapsDifference Fourier maps were generated from the Fourier synthesis ofthe terms AF, where
AF = (IF,(hk)l - IF2(hk)l) * Mhk * exp (ikhk)- (6)
Here F, corresponds to FD(hk) or a subset of Pb2+ PM patterns and F2corresponds to FN(hk) or a subset of Na+ PM patterns, mhk is the figureof merit, and khk the projection phase as determined by Hayward andStroud (1981).The interpretation of a peak or a set of peaks in the difference Fourier
map as potential candidates for Pb2+ sites was tested by refining thepositions and occupancies of the selected sites by the least squaresminimization of
E = E (IFDI - IFN +fpbl)'.hk
(7)
where fpb is the calculated structure factor contribution from Pb2+ andthe sum is over all independent reflections (Dickerson et al., 1968).Double difference Fourier maps synthesized with terms AAFpb, where
AzXFPb = (IFDI - IFN + fpbl) * Mhk * exp (iWhk), (8)
then show possible errors and/or extra features (with a better signal-to-noise ratio than difference maps) still unaccounted for in the modelfor the cation sites.The mean squared error (AAp2) in the difference map was calculated
according to the expression (Blundell and Johnson, 1976)
(AAp2) = (1/V2) E 0.5 . [AF(hk)]2hk
+ aN(hk) + OrD(hk)2, (9)
where UN and aD are the standard deviations in FN and FD (Table 2), AFis the difference amplitude, and the sum is over all reflections used in thesynthesis of the map. The standard deviation in the expected noise levelis Q = ((AAp2))'/2
All data between 26 and 5 A were used in scaling, averaging, Fouriersynthesis, and in refinement of sites.An absolute scale factor for the native amplitudes was calculated by
assuming that the protein occupies 68% of the unit cell and that theaverage scattering density in the lipid region is 77% of that of the protein(Engelman et al., 1980). Electron scattering factors were from Interna-tional Tables for Crystallography, vol. 4.
RESULTS
Statistics of extracted amplitudesThe expected average change in the electron structurefactors for the addition of 2 Pb2+ is 10% and is 12% for 3Pb2+ on the assumption that the protein is a randomarrangement of ordered atoms as are the lipid molecules.Neither of these two assumptions is strictly correctbecause of coherently or repetitively disposed atomicpositions in helices and because results from structuralanalysis of bR (Hayward and Stroud, 1981; Baldwin etal., 1988) and from partially delipidated bR (Glaeser etal., 1985; Tsygannik and Baldwin, 1987) indicate that at
Mitra and Stroud Divalent Cation Binding Sites on Bacteriorhodopsin 303Mitra and Stroud Divalent Cation Binding Sites on Bacteriorhodopsin 303

least some of the lipid molecules are ordered. This meansthat the average change in F's are expected to be evenlower than the values indicated above, and so it wascritically important to minimize all sources of error.
Since Friedel-related reflections are unaffected bytwinning and specimen tilt, only those nominally untilteddiffraction patterns that had the least noise as assayed bythe low values of the residual RF were considered foraveraging. 4 Na+ PM patterns and 6 Pb2+ PM patternswere chosen. The statistics for these patterns after de-twinning and detilting are given in Table 1. All except twoof the diffraction patterns were essentially untwinned: theamount of twinning in these two were 28.07 (±0.40)%and 1.07(±0.40)%. The Friedel residuals (5% on anaverage) here are about one half of that observed earlierfor native or mercurilated phenyl-glyoxal labeled PM(Katre et al., 1984) and the reduction in noise is essen-tially due to better signal-to-noise ratio in the diffractionpatterns from -25 times larger reconstituted sheets usedin this work. The systematic errors in each patternresulting from errors in evaluating the twinning and tiltparameters and from their contribution to the calculationof corrected amplitudes are represented in the "triplet"residuals RT (Table 1) calculated for threefold symmetricreflections where each reflection is averaged with itsFriedel mate. Table 2 lists the averaged extracted ampli-tudes FN and FD and their standard deviations (Beving-ton, 1969) calculated from a total of 24 (4 Na+ PM
TABLE 1 Statistics* for diffraction patterns fromreconstituted PM used for calculating Fourierdifference maps
Na+ PM Pb2* PM
No. of patterns 4 6averaged
RFt (26-5 A) 4.0-5.5 (4.6)1 4.1-6.3 (5.0)(26-7 A) 2.6-3.4 (3.0) 2.7-5.0 (3.5)(7-5 A) 6.3-9.9 (7.6) 6.6-9.5 (6.7)
RTt (26-5 A) 2.9-3.9 (3.4) 3.5-6.5 (4.7)(26--7 A) 1.9-2.5 (2.3) 2.6-5.6 (3.5)(7-5 A) 4.5-6.5 (5.2) 5.2-7.6 (6.4)
Tilt1 0.3-0.9 0.1-0.5
R 1 4.6-6.2 (5.3) 4.0-7.4 (5.4)
*Based on extracted detwinned-detilted amplitudes.tAgreement index (see Materials and Methods for definition) inpercentage for a diffraction pattern.1Entries in parentheses are averaged values.1Estimated specimen tilt in degree with average values of 0.6 ± 0.1degree for Na+ PM patterns and 0.4 ± 0.2 degree for the Pb2+ PMpatterns.'Calculated scaling residual between patterns after sixfold averaging ofthe symmetry-related relfections (see Materials and Methods for defini-tion).
TABLE 2 Averaged structure factors F * and theirexperimentally determined deviations a$ for Na+reconstituted (FN) and Pb2+ reconstituted (FD) purplemembrane to 5 A resolution
H K FN aN FD aD
22222222233333333344444444
4
5
44
5SSS
56666666
7777778
2345678910
1234S67890l23456780
23456780l2345670
234560
23450
9.364.3713.5016.383.53
13.244.614.493.815.29
13.098.19
22.596.478.289.048.778.284.7115.3012.172.7716.9716.282.676.965.54
12.4315.728.01
27.435.916.013.174.523.96
19.094.1518.155.863.263.902.645.52
11.3613.715.812.075.693.262.059.779.352.694.992.022.472.99
0.090.160.160.100.080.120.170.150.120.220.090.080.160.170.040.170.250.370.130.150.050.180.060.130.130.120.140.090.120.190.210.120.100.230.060.210.060.190.220.070.080.140.130.060.030.110.070.010.070.170.050.060.040.210.070.150.030.25
9.764.8513.7216.123.3813.094.333.384.315.61
13.278.88
22.556.788.109.269.238.504.7615.2213.133.42
16.4916.162.986.835.0312.9615.498.02
26.546.345.693.314.434.3418.604.0717.956.663.013.923.155.5111.3014.135.712.355.782.421.809.789.192.704.962.532.473.35
304 Biophysical Journal Volume 57 February 1990
0.090.090.070.080.060.080.100.190.080.240.150.130.150.080.070.040.060.060.110.110.160.100.060.080.090.060.190.120.050.110.290.160.120.050.070.100.040.070.070.120.110.030.140.740.070.120.110.070.050.340.230.030.100.120.090.241.140.10
Biophysical Journal Volume 57 February 1990304

TABLE 2 (continued)
88889991010
2340120l
2.125.965.543.143.548.294.962.953.44
0.050.090.140.140.090.100.180.110.10
2.206.346.093.274.128.615.003.332.92
0.080.070.070.030.180.050.080.150.16
*Each FN and FD are averages of 24 and 36 separate observations,respectively, for the same reflection.
_ M
F= L (F1/a?)/ L O lof2),iI i I
where aj is the standard deviation in the extracted sixfold averagedstructure factor Fj for the jth pattern and M is the number of patternsaveraged.
M M 1/2tff= E (1/l)(Fj- F)2/M E(17/a2)
jw ijFD
where F is FN Or FD.
patterns) and 36 (6 Pb2+ PM patterns) observations forthe 67 independent reflections (26-5 A).
Fourier difference maps anderror analysesThe consensus difference map calculated using the sets ofamplitudes FN and FD is shown in Fig. 1 a where the sixmajor refinable sites for cation binding are marked. Fig.1 b shows that all these six sites are within the proteinboundary.To assess the effects of random errors in the amplitudes
in our (Pb2+ - Na+) consensus difference map, we
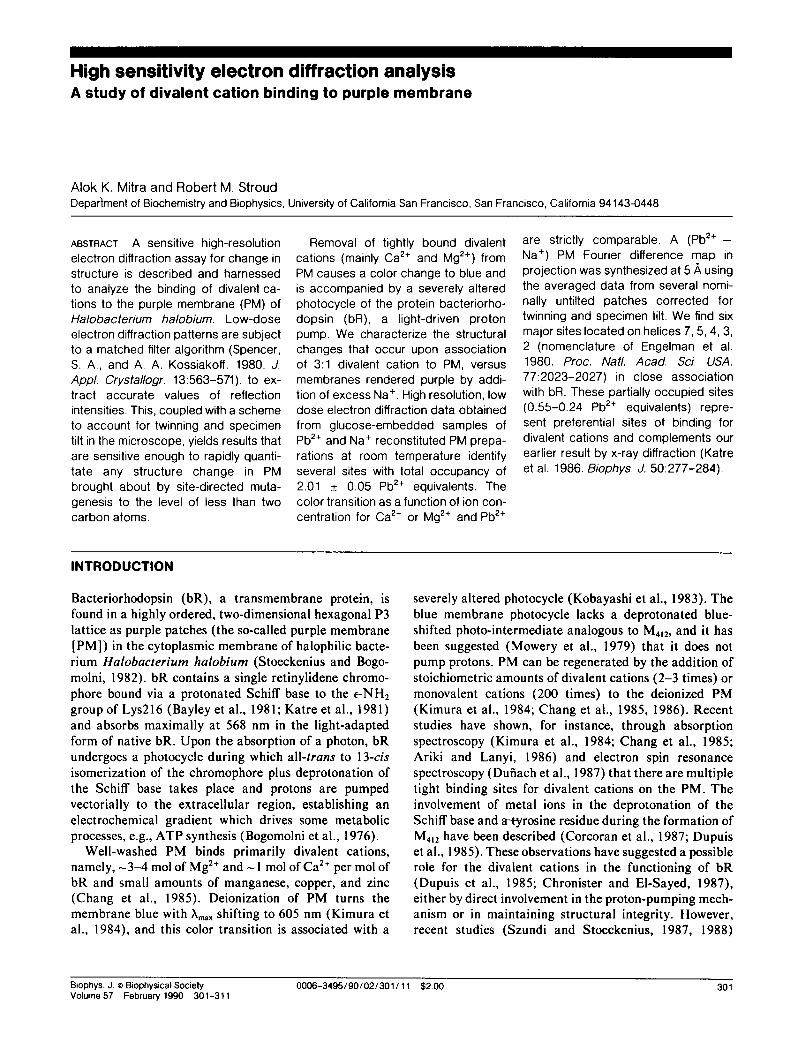
carried out difference Fourier analyses on independentsubsets of data. We first looked at the contribution ofnoise in the Na+ PM and Pb2+ PM data sets. For thispurpose we synthesized difference maps between indepen-dent subsets of two merged Na+ PM and also betweenindependent subsets of two merged Pb2+ PM data. Atypical set of such "noise" maps are shown in Fig. 2. The".noise" map synthesized from the Pb2+ PM data shows no
distinct features while the "noise" map synthesized fromNa+ PM data also is essentially featureless except for twopeaks that are closest to, but distinct from, the peak athelix 7 in the consensus difference map in Fig. 1 a. Nextwe studied Pb2 - Na+ subset difference maps. These are
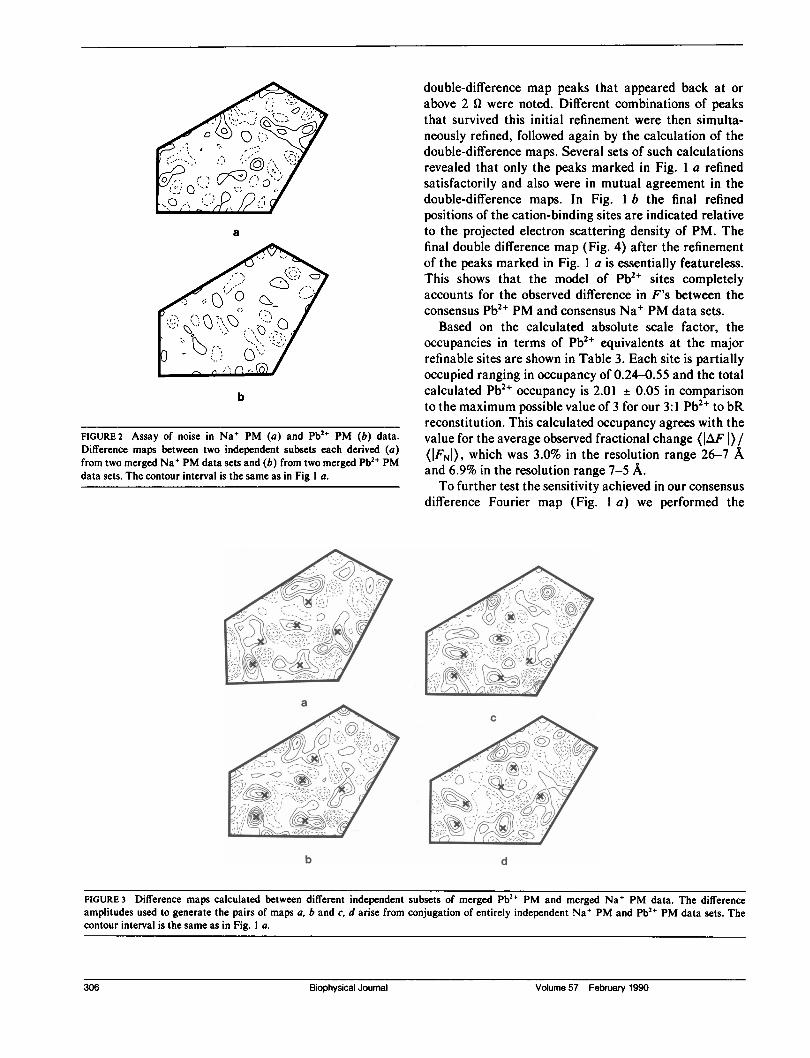
difference maps synthesized from independent subsets ofdata from two merged Pb2+ PM and two merged Na+ PMdata. These independent sets of difference amplitudesshowed a high degree of similarity with an averagesample correlation coefficient (Hoel, 1984) of 0.64. In
FIGURE I (a) Consensus projected Fourier difference map calculatedat 5 A resolution with the six major refinable divalent cation sitesmarked. The contour interval is one standard deviation of the expectednoise level (Q1, see Materials and Methods). Solid lines represent positiveand dashed lines represent negative contour levels (b). The refinedcation-site locations indicated as crosses relative to the projected elec-tron scattering density of PM at 5 A resolution.
Fig. 3 a collection of such subset difference maps con-
toured at the same density interval as the previous mapsare shown. These maps show in general a mutual similar-ity in the pattern of all significant peaks in strength andtheir positions, comparable to those seen in Fig. 1 a, even
though because of the averaging of fewer data sets thesemaps are, as expected, noisier than the consensus differ-ence map. Taken together, the maps in Figs. 2 and 3establish clearly that the peaks in the consensus map (Fig.I a) are not due to random errors in the amplitudes.
Refinement of the peaksIn order to assess whether a statistically significant peakin Fig. 1 a is a positive peak due to Pb2+ and not due tosome structural change in the protein, least-squaresrefinement of the positions and occupancies of the siteswas followed by the calculation of double-differenceFourier maps (Katre et al., 1984, 1986). Ideally, any netnegative peaks remaining would then indicate conforma-tional change. All statistically significant peaks (peakheight 2 2 Q) were analyzed. First, individual peaks were
separately refined and, in each case, in the accompanying
Mitra and Stroud Divalent Cation Binding Sites on Bacteriorhodopsin
a
b
Mitra and Stroud Divalent Cation Binding Sites on Bacteriorhodopsin 305
a
b
FIGURE 2 Assay of noise in Na+ PM (a) and Pb2+ PM (b) data.Difference maps between two independent subsets each derived (a)from two merged Na+ PM data sets and (b) from two merged Pb2+ PMdata sets. The contour interval is the same as in Fig I a.
double-difference map peaks that appeared back at or
above 2 Q were noted. Different combinations of peaksthat survived this initial refinement were then simulta-neously refined, followed again by the calculation of thedouble-difference maps. Several sets of such calculationsrevealed that only the peaks marked in Fig. 1 a refinedsatisfactorily and also were in mutual agreement in thedouble-difference maps. In Fig. 1 b the final refinedpositions of the cation-binding sites are indicated relativeto the projected electron scattering density of PM. Thefinal double difference map (Fig. 4) after the refinementof the peaks marked in Fig. 1 a is essentially featureless.This shows that the model of Pb2+ sites completelyaccounts for the observed difference in F's between theconsensus Pb2+ PM and consensus Na+ PM data sets.
Based on the calculated absolute scale factor, theoccupancies in terms of Pb2+ equivalents at the major
refinable sites are shown in Table 3. Each site is partiallyoccupied ranging in occupancy of 0.24-0.55 and the totalcalculated Pb2+ occupancy is 2.01 ± 0.05 in comparisonto the maximum possible value of 3 for our 3:1 Pb2, to bRreconstitution. This calculated occupancy agrees with thevalue for the average observed fractional change (IAF I) /(IFNI), which was 3.0% in the resolution range 26-7 Aand 6.9% in the resolution range 7-5 A.To further test the sensitivity achieved in our consensus
difference Fourier map (Fig. 1 a) we performed the
b d
Biophysical Journal Volume 57 February 1990
FIGURE 3 Difference maps calculated between different independent subsets of merged Pb2+ PM and merged Na+ PM data. The differenceamplitudes used to generate the pairs of maps a, b and c, d arise from conjugation of entirely independent Na+ PM and Pb2+ PM data sets. Thecontour interval is the same as in Fig. I a.
306 Biophysical Journal Volume 57 February 1990

FIGURE 4 Final double difference map after the refinement of the sixlocated divalent cation sites. The contour interval is the same as in Fig.I a.
following analysis on peak 4 which yields the lowestrefined occupancy of 0.24 Pb2+. In Fig. 5 a the idealizedsignal due to 0.24 Pb2+ located at the refined site isshown. Assuming that the random noise in the differenceamplitudes follow a normal distribution, we calculated anoise-corrupted set AFF', by adding (or subtracting)randomly to the idealized set AFpb the experimentallyobserved noise in IAF1 weighted by a Gaussian based onspline-fitted values of averaged observed noise versusresolution (Fig. 6) and their standard deviations. In Fig.5 b the map synthesized based on these calculated "noisy"difference amplitudes is shown in which the most intensepeak is still seen at the same location but the peak heightis reduced by about 22% compared with that for theidealized signal in Fig. 5 a. Thus the signal due to 0.24Pb2+ can be clearly distinguished from random noise inour consensus difference map. To address the same issuethe maps in Fig. 2, a and b, which describe noise in theNa+ and Pb2+ PM data sets, were further analyzed. Ateach of the Pb2+ sites cited in Fig. 1 a, the singly-refinedoccupancies at the corresponding locations in both thenoise maps were calculated. The largest values for theseoccupancies were 0.10 and 0.12 Pb2+ equivalents for the
TABLE 3 Occupancy of the divalent cation bindingsites in purple membrane
Occupancy in Pb2+Site Location* equivalentst
(i) Helix 7 0.27(ii) Helix 5 0.41
(iii) Helix 4 0.55(iv) Helix 3 0.24(v) Helix 2 and 3 0.27(vi) Helix 2 0.27
Total 2.01
*Closest helix location in the projected structure.tThe estimated average error in occupancy at a given site is 0.01 Pb2+equivalent calculated from the least-squares refinement analysis.
b
FIGURE 5 (a) An ideal difference map, synthesized by adding contri-butions for 0.24 Pb2+, the lowest refined occupancy deduced from theconsensus difference map (Fig. I a) to the observed structure factors forNa+ PM and then generating difference terms AF and (b) correspond-ing expected noise-corrupted map based on the experimentally deter-mined errors in the amplitudes of both Na+ PM and Pb2+ PM. The idealpeak in a and the noise-corrupted peak in b are shaded. The contourinterval is 0.88 ft.
maps in Fig. 2, a and b, respectively. By either estimateeven the largest noise peak in the "noise" maps translateto less than half the lowest observed occupancy level of
0.24 Pb2+ equivalents in the consensus difference map(Fig. I a).
Scattering and errors in theconsensus data setsIn Fig. 6, the level of estimated errors in IAFL extractedafter detwinning and correcting for tilt, sixfold observa-tions of each reflection from 4 Na+ PM and 6 Pb2+ PMpatterns, observed and calculated values of All afterrefinement of positions and occupancies of the cationsites, and the lack of closure errors are illustrated. Rela-tive to (IFNI) the average estimated error in IAF1 is 2.4%and the lack of closure error IAAF1 is 2.8% and thus are
comparable throughout the resolution range. Theobserved average fractional change (|IAF) / (IFN|I) rangedfrom 3.0% at low resolution (26-7 A) to 6.9% at higherresolution (7-5 A).
Mitra and Stroud Divalent Cation Binding Sites on Bactenorhodopsin 307307Mitra and Stroud Divalent Cation Binding Sites on Bacteriorhodopsin

12. and Kossiakoff, 1980) to evaluate accurate reflection
intensities, especially for the weakest reflections, and10 multiple averaging of diffraction patterns enabled us to
A achieve very low random error levels. The final averagezLZ 8 - estimated errors in FN were 1.5% at low resolution (26-7v
A) and 3.3% at higher resolution (7-5 A) and those in FD
O 6 I were 1.2 and 4.8%, respectively. Relative to average FNthe expected signal for the total of 2.01 Pb2+ cited is 2.5%
> at low resolution and 5.9% at higher resolution. Since the
extracted amplitudes for each reflection was evaluated
from multiple observations (usually 24 for Na+PM and2-
36 for Pb2+ PM patterns) the random errors tend tocancel while the signal is reinforced. Based on the esti-
0.06 0.08 0.10 0.12 0.14 0.16 0.18 0.20l mated error levels in F's we find, as shown in Figs. 5, a
and b, that a signal from 0.24 Pb2+ (-3 electrons) can be
Resolution in Angstrom 1 distinguished from random noise. We had collected datato -4 A for some of the patterns, and a difference mapsynthesized at 4.5 A (map not shown) showed essentially
FIGURE 6 Scattering and errors for the Pb2+ reconstituted PM versus the same set of peaks as theSmap (Fig. 1 a). However
resolution. x, mean observed difference (IAFI) between Pb2+ PM and thisahi her ro ma since noi evel
Na+ PM structure factors; O, calculated value of (IAFI) computed this higher resolution map was noisier since the noise levelfrom IIFN + fPbI - IFNII after refinement; A, lack of closure errors in the difference map increases at least as 4(X[AF]2),(IAAFI) computed from IIFDI - IFN + fpbII after refinement; and *, coupled with the fact that the systematic errors in themean error in |AFI calculated from 24 and 36 observations of each extracted F's due to possible residual errors in the calcu-reflection from the sets of 4 Na+ PM and 6 Pb" PM data sets, lated tilt parameters increases with resolution and the
respectively, given as square root (aN + c4), where a's are listed in Table
2. Each point on the graph is for a bin of 12 reflections centered at that average noise levelsin the extracted amplitudes were also
resolution. found to increase with resolution.
Previously Katre et al. (1986) from this laboratorysynthesized Pb2+ PM - Ca2" PM difference maps from
x-ray powder diffraction data and located partially occu-
DISCUSSION pied Pb2+ sites on bR, which were found to be on helices 2,3, 6, and 7. Our sites (i), (iv), and (v) on helices 7, 3, and
We have located Pb2+ binding sites on PM by low-dose between helices 2 and 3, respectively, are close to three of
electron diffraction on glucose-sustained single purple the four sites found by Katre et al. (1986). We find one
membrane sheets. There are six major sites located on additional site (vi) on helix 2, and two new sites on helix 4
helices 7, 5, 4, 3, and 2 (nomenclature of Engelman et al., and helix 5.
1980) all of which are partially occupied ranging in Since a ratio of 3 Pb2" to bR was used both in this studyoccupancy from 0.55 to 0.24 of Pb2+ equivalents with the and in our earlier x-ray work, we discuss below possibletotal occupancy of 2.01 ± 0.05 compared with the total sources for the differences in the number and locations of
titrated amount of 3 Pb2`/bR in the samples used for some of the divalent cation sites in the two investigations.electron diffraction. There are also peaks in the lipid (a) In comparison there were far fewer independentregion that do not mutually refine satisfactorily with the observations in the x-ray powder pattern (7 A against 5 A
peaks at the major sites. These peaks at the lipid region resolution data used here) which was further reduced bycould arise due to phase errors inherent in the difference rotational overlap of F(hk) on F(kh) in the x-ray work
Fourier synthesis; however, it cannot be ruled out that that could result in errors in the refinement due to
these may also represent additional binding sites. From insufficient data/parameter ratio. (b) Reconstituted PM
the present work the three-dimensional location of the generated by titrating blue membrane with 150-fold
sites cannot be deduced; however, recent results from amounts of Na+, as in this study, is essentially identical to
anomalous small angle x-ray scattering (Wakatsuki, S., native PM in its absorption and photocycle propertiesS. Doniach, and K.O. Hodgson, manuscript in prepara- (Kimura et al., 1984; Chang et al., 1986), indicating a
tion) on Tb3+-titrated bR clearly show that cations bind native-like protein conformation. Even though spectro-exclusively on the membrane surface. scopically, Ca2+ reconstituted (used in x-ray work) and
The use of large reconstituted sheets (-5 ,um diam) Na+ reconstituted PM (in this study) appear very similar,which improved the signal-to-noise ratio in our diffraction possible small localized conformational differences at the
patterns, the use of a matched-filter algorithm (Spencer cation binding pockets and/or different site-specific bind-
308 Biophysical Journal Volume 57 February 1990Volume 57 February 1990Biophysical Journal308

ing affinities for Na+ could elicit slightly different "na-tive" structures. This would effect the difference maps
and the occupancies at the Pb2+ sites in the two maps. (c)Different sample preparation techniques resulting in pos-
sible differences in protein conformation in the hydratedmembrane stack used in x-ray work and glucose-embed-ded sheets used in this study.The binding characteristics of cations, particularly
divalent cations, in the process of blue to purple transitionhave been recently investigated by optical absorption(Kimura et al., 1984; Zubov et al., 1986; Chang et al.,1986; Ariki and Lanyi, 1986) or by ESR (Du-nach et al.,1986, 1987; Corcoran et al., 1987). Duniach et al. (1987),find five medium and high affinity sites (with Kd = 0.6-26.0 ,M at pH 5.0 and 20-50 ,uM at pH 7.0) and fivelow-affinity sites (50 mM) for Mn2" on bR. On the otherhand, monovalent cations such as Na+ or K+ bind PMonly weakly with affinity constants in the millimolarrange and effect the blue to purple transition in millimo-lar concentrations as compared with micromolar concen-
tration in the case of divalent cations. Trivalent cationssuch as La3", at pH 7.0, and at micromolar concentra-tions induce the blue to purple transition but affect theproton uptake by significantly reducing the decay of theM-intermediate and also reduce the amplitude of the0-intermediate (Chang et al., 1986). It is not yet clearwhether the blue to purple transition effected by cations isdue to a neutralization of the negative surface potential,(e.g., on the cytoplasmic surface, where apart from theexcess negatively charged residues phospholipids are alsoassumed to be asymmetrically disposed [Henderson et al.,1978]), or in addition conformational effects induced bycation binding are also involved. Szundi and Stoeckenius(1987, 1988) argue from studies on lipid-depleted andlipid-substituted (acidic native lipids by neutral or zwit-terionic lipids) membranes that the maintenance of pur-
ple color does not require cations. This was based on theirobservation that upon deionization the lipid-exchanged or
lipid-depleted membranes did not change to blue. How-ever, by pH reduction to - 1.0 they could generate blue-like membranes (Amax= 585 nm compared with 605 nm
for native blue membranes). In so far as the lipid-depletedor lipid-substituted membranes could be thought of as
adequate models for the native PM, the results of Szundiand Stoeckenius do not preclude the existence of specificprotein binding sites for divalent cations or, as stated bythese authors, the extent to which cations affect thesurface charge may also effect the purple to blue transi-tion. On the other hand, Chang et al. (1986) from atomicabsorption spectroscopy and Duniach et al. (1986) fromESR observe that bleached deionized membranes bindfewer divalent cations and more weakly than do deionizedmembranes. Because PM does not change its surfacepotential upon bleaching (Ehrenberg and Meiri, 1983;
Packer et al., 1984), these observations probably indicatethat specific conformational interactions between surfaceresidues and divalent cations are also present. Indeed,circular dichroism (Kimura et al., 1984) and thermaldenaturation (Chang et al., 1986) data suggest thatchelation by divalent cation induces protein conforma-tional changes. Also, Du-nach et al. (1988) have observedthat addition of Mn2" to a deionized purple membrane atpH 6.5 induces a UV-difference spectrum, indicating thata conformational change is occurring. However, theseauthors also find similar difference upon pH increase ofthe blue membrane suspensions and have raised thequestion about the possible functional role of the cation-induced conformational change.
In this work we have carefully examined whether thereare discrete binding sites for divalent cation on single PMsheets under the nominal functionally active 3:1 Pb2+ tobR reconstitution. After careful consideration of allsources of error, our finding that none of the sites locatedin projection are fully occupied could lead to two alternatesuggestions. These are either that these sites representbinding pockets that are indeed preferential rather thanspecific or that the drying from solution on the electronmicroscopy grid in a glucose environment statisticallydisorders the probably flexible bR surface residues (Jaffeand Glaeser, 1987), where the cations are most expectedto bind, to reduce the effective occupancies. If the latter isthe case then the relatively higher occupancy sites athelices 4 and 5 could represent discrete sites wherebinding of divalent cation could exert electrostatic and/orallosteric effects, for instance, in stabilizing the M412intermediate in the native purple membrane. In thiscontext, of particular interest are the putative linkingregions between the helices on the cytoplasmic surfacethat contain 4 Asp (36, 38, 102, 104) and 2 Glu(161, 166) residues (see Katre and Stroud, 1981). Selec-tive alterations in side-chain length and charge of thesecarboxylic acid residues by site-specific mutation will testtheir involvement in cation binding as well as theirpossible influence on the blue to purple transition.An important feature of this present study is that we
have demonstrated that we can distinguish in our differ-ence map a signal from about one quarter of Pb2+ ionfrom random noise. This translates to a change of -1.5carbon atoms corresponding, for example, to an isomor-phous replacement of an Ala to Thr. Thus, the methodsdescribed here provide a powerful high resolution assay
for structure change that is sensitive at the level of lessthan two carbon atoms difference. The scheme we
describe to extract accurate values of intensities fromlow-dose electron diffraction patterns by using a
matched-filter algorithm, and for correcting theseextracted intensities for twinning and specimen tilt, iscapable of assessing whether the structural consequences
Mitra~~~ an StodDvln ainBnigStso atrohdpi 0309Mitra and Stroud Divalent Cation Binding Sites on Bacteriorhodopsin
of any given site-directed mutagenic change are localizedjust to the residue that is the site of substitution or involvelarge scale movements. In conjunction with spectroscopicstudies, a high resolution assay for structural changemakes it possible to determine whether an effect on bRfunction is direct or is a consequence of alteration relayedto the rest of the protein.
APPENDIX
For a P3 lattice in general, three types of twinning operations arepossible that combine the structure factor F(hkl) with those for threeother twin-related reflections. The three possible twin components are(a) reflections of the type (h + k, k, l) due to patches related bytwofolds parallel to (100), (010), or (110); (b) reflections of the type(khl) due to patches related by twofolds parallel to (110), (120), or(210), and (c) reflections of the type (hkl), due to patches related bytwofold axis perpendicular to the membrane: these are Friedel related to(hkl) only for untilted two-dimensional crystalline patch(F(hkl) = F(hkl) for I - 0). Denoting by Xi, X2, X3, and X4, thefractional volumes of the four twin-related patches and by G thetwinned-tilted intensity of the hkz4k reflection we have
G = XII(hkz*k) + X2I(h + k, k, z*)+ X31(khz*k) + X4I(hkzk), (1)
where
XA + X2 + X3 + X4= 1.0 withX > .O. (2)In Eq. 1, I is the untwinned intensity and z* is the reciprocal latticecoordinate normal to the two-dimensional lattice given as
Zh* = a* tan O[h sin #+ k sin (1 + 600)]. (3)
In Eq. 3, 0 is the tilt angle and 4' is the angle between the tilt axis and thea* axis. For small amounts of tilt we can express
I(hkz* ) = IO(hk) + ql(hk)zh*k + . . . higher order terms, (4)
where 10(hk) is the untilted-untwinned intensity and q*(hk) are thevarious orders of derivatives of the intensity profile at zh = 0.0. UsingEq. 4 for the various terms in Eq. 1 we get
G = (Xi + X4)I°(hk) + (X3 + X2)IO(kh) + T(hk), (5)
where the tilt containing term T(hk) is given by
T(hk) = z4*(ql(hk)(Xi- X4) + ql(kh)(X3 - X2)+ higher-order terms. (6)
The three independent twin parameters, the two tilt parameters (0 andO), and K and B, the scale and temperature factors, are obtained byleast-squares minimizing the sum H calculated over all reflections to7 A where H is given by,
H =Z(1/chk)2G- [( XI + X4)IO(hk)hk
+ (X3 + X2)I(kh) + T(hk)] - Kexp (-Bs2)12. (7)
In Eq. 7 ahk is the observed standard deviation for the sixfold symmetrymates of the twinned-tilted reflection hk, s is the reciprocal latticevector, and we approximate the intensities at zero tilt 1° by the values
obtained by Hayward and Stroud (1981) from native unreconstituted(untwinned) nominally untilted patches. Also in Eq. 7 the values usedfor the derivatives qj(hk) were calculated from the three-dimensionaltilt data for the set of up to 7-A resolution reflections as used in Katre etal., 1986. From Eq. 4 we can form the simultaneous equations:
(Xi + X4)IO(hk) + (X3 + X2)IO(kh)+ T(hk) = G'(h, k, z*) (8a)
(Xi + X4)IO(kh) + (X3 + X2)IO (hk) + T(kh)= G'(k, h, Zkh). (8b)
where G' = G/K exp (-Bs2).These yield detwinned-detilted intensities J(hk) and also I(kh). For
reflections of resolution greater than 7 A (5-7 A), using the knowledgeof the already determined tilt parameters to evaluate z* for thesereflections and using a linear approximation for the tilt term in Eq. 5,the detwinned-detilted intensity values were extracted after a linear fitto the intensities of the sixfold symmetry related mates.
We thank Nandini Katre and Janet Finer-Moore for useful discussions.A. K. Mitra thanks Thomas Earnest for useful comments. We aregrateful to Professor Walther Stoeckenius for generously providingpurple membranes.
Research was supported by the National Institutes of Health grantGM32079 to Robert M. Stroud.
Received for publication 24 June 1988 and in final form 17October 1989Note added in proof: Stoeckenius, W., and I. Szundi in a recentpublication (1989. Biophys. J. 56:369-383) provide theoretical justifi-cation to their earlier work (referred to in text) on the purple to bluetransition in PM with surface charge modified by lipid depletion or lipidsubstitution. However, as before, their results cannot dispute specific orpreferential binding of divalent cation to native PM nor to the possiblerole of such binding.
REFERENCES
Ariki, M., and J. K. Lanyi. 1986. Characterization of metal ion-bindingsites in bacteriorhodopsin. J. Biol. Chem.261:8167-8174.
Baldwin, J. M., R. Henderson, E. Beckman, and F. Zemlin. 1988.Images of purple membrane at 2.8 A resolution obtained by cryo-electron microscopy. J. Mol. Biol. 202:585-591.
Bayley, H., K.-S. Huang, R. Ramakrishnan, A. H. Ross, Y. Tagagaki,and H. G. Khorana. 1981. Site of attachment of retinal in bacterio-rhodopsin. Proc. Natl. Acad. Sci. USA. 78:2225-2229.
Bevington, P. R. 1969. Data Reduction and Error Analysis for thePhysical Sciences. McGraw-Hill Book Company, New York. 73 pp.
Bogomolni, R. A., R. A. Baker, R. H. Lozier, and W. Stoeckenius. 1976.Light-driven proton translocations in halobacterium halobium. Bio-chim. Biophys. Acta. 440:68-88.
Blundell, T. L., and L. N. Johnson. 1976. Protein Crystallography.Academic Press Inc., London. 409-411.
Chang, C.-H., J.-G. Chen, R. Govindjee, and T. Ebrey. 1985. Cationbinding by bacteriorhodopsin. Proc. Natl. Acad. Sci. USA. 82:396-400.
Chang, C.-H., R. Jonas, S. Melchiore, R. Govindjee, and T. G. Ebrey.1986. Mechanism and role of divalent cation binding of bacteriorho-dopsin. Biophys. J. 49:731-739.
310 Biophysical Journal Volume 57 February 1990
Cherry, R. J., U. Muller, R. Henderson, and M. P. Heyn. 1978.Temperature-dependent aggregation of bacteriorhodopsin in dipalmi-toyl- and dimyristoylphosphatidylcholine vesicles. J. Mol. Biol.121:283-298.
Chronister, E. L., and M. A. El-Sayed. 1987. Time-resolved resonanceRaman spectra of the photocycle intermediates of acid and deionizedbacteriorhodopsin. Photochem. Photobiol. 45:507-513.
Corcoran, T. C., K. Z. Ismail, and M. A. El-Sayed. 1987. Evidence forthe involvement of more than one metal cation in the Schiff basedeprotonation process during the photocycle of bacteriorhodopsin.Proc. Natl. Acad. Sci. USA. 84:4094-4098.
Dickerson, R. E., J. E. Weinzierl, and R. A. Palmer. 1968. A leastsquares refinement method for isomorphous replacement. Acta Crys-tallogr. Sect. B. Struct. Crystallogr. Cryst. Chem. B24:997-1003.
Dunach, M., M. Seigneuret, J.-L. Rigaud, and E. Padros. 1986. Therelationship between chromophore moiety and the cation binding sitesin bacteriorhodopsin. Biosci. Rep. 6:961-966.
Dufiach, M., M. Seigneuret, J.-L. Rigaud, and E. Padros. 1987.Characterization of the cation binding sites of the purple membrane.Electron spin resonance and flash photolysis studies. Biochemistry.26:1179-1186.
Duilach, M., E. Padros, M. Seigneuret, and J.-L. Rigaud. 1988. On themolecular mechanism of the blue to purple transition of bacteriorho-dopsin. UV-difference spectroscopy and electron spin resonance stud-ies. J. Biol. Chem. 263:7555-7559.
Dupuis, P., T. C. Corcoran, and M. A. El-Sayed. 1985. Importance ofbound divalent cations to the tyrosine deprotonation during thephotocycle of bacteriorhodopsin. Proc. Nat!. Acad. Sci. USA.82:3662-3664.
Ehrenberg, E., and Z. Meiri. 1983. The bleaching of purple membranesdoes not change their surface potential. FEBS (Fed. Eur. Biochem.Soc.) Lett. 164:63-66.
Engelman, D. M., R. Henderson, A. D. McLachlan, and B. A. Wallace.1980. Path of polypeptide in bacteriorhodopsin. Proc. Natl. Acad.Sci. USA. 77:2023-2027.
Glaeser, R. M., J. S. Jubb, and R. Henderson. 1985. Structuralcomparison of native and deoxycholate-treated purple membrane.Biophys. J. 48:775-780.
Hayward, S. B., and R. M. Stroud. 1981. Projected structure of purplemembrane determined to 3.7 A resolution by low temperature elec-tron microscopy. J. Mol. Biol. 151:491-517.
Henderson, R., J. S. Jubb, and S. Whytock. 1978. Specific labelling ofthe protein and lipid on the extracellular surface of the purplemembrane. J. Mol. Biol. 123:259-274.
Hoel, P. G. 1984. Introduction to Mathematical statistics. Fifth ed. JohnWiley and Sons, New York. 193 pp.
Jaffe, J. S., and R. M. Glaeser. 1987. Difference Fourier analysis of
"surface features" of bacteriorhodopsin using glucose-embedded andfrozen-hydrated purple membrane. Ultramicroscopy. 23:17-28.
Katre, N. V., and R. M. Stroud. 1981. A probable linking sequencebetween two transmembrane components of bacteriorhodopsin.FEBS (Fed. Eur. Biochem. Soc.) Lett. 136:170-174.
Katre, N. V., P. K. Wolber, W. Stoeckenius, and R. M. Stroud. 1981.Attachment site of retinal in bacteriorhodopsin. Proc. Natl. Acad.Sci. USA. 78:4068-4072.
Katre, N. V., S. Hayward, and R. M. Stroud. 1984. Location of anextrinsic label in the primary and tertiary structure of bacteriorho-dopsin. Biophys. J. 46:195-203.
Katre, N. V., Y. Kimura, and R. M. Stroud. 1986. Cation binding siteson the projected structure of bacteriorhodopsin. Biophys. J. 50:277-284.
Kimura, Y., A. Ikegami, and W. Stoeckenius. 1984. Salt and pH-dependent changes of the purple membrane absorption spectrum.Photochem. Photobiol. 40:641-646.
Kobayashi, T., H. Ohtani, J.-I. Iwai, A. Ikegani, and H. Uchiki. 1983.Effect of pH on the photoreaction cycle of bacteriorhodopsin. FEBS(Fed. Eur. Biochem. Soc.) Lett. 162:197-200.
Mowery, P. C., R. H. Lozier, Q. Chae, Y.-W. Tseng, M. Taylor, and W.Stoeckenius. 1979. Effect of acid pH on the absorption spectra andphotoreactions of bacteriorhodopsin. Biochemistry. 18:4100-4107.
Oesterhelt, D., and W. Stoeckenius. 1974. Isolation of the cell mem-brane of Halobacterium and its fractionation into red and purplemembrane. Methods Enzymol. 31:667-678.
Packer, L., B. Arrio, G. Johannin, and P. Volfin. 1984. Surface chargeof purple membrane measured by laser Doppler velocimetry. Bio-chem. Biophys. Res. Commun. 122:252-258.
Spencer, S. A., and A. A. Kossiakoff. 1980. An automated peak fittingprocedure for processing protein diffraction data from a linearposition-sensitive detector. J. Appl. Crystallogr. 13:563-571.
Szundi, I., and W. Stoeckenius. 1987. Effect of lipid surface charges onthe purple-to-blue transition of bacteriorhodopsin. Proc. Natl. Acad.Sci. USA. 84:3681-3684.
Szundi, I., and W. Stoeckenius. 1988. Purple-to-blue transition ofbacteriorhodopsin in a neutral lipid environment. Biophys. J. 54:227-232.
Stoeckenius, W., R. H. Lozier, and R. A. Bogomolni. 1979. Bacteriorho-dopsin and the purple membrane of halobacteria. Biochim. Biophys.Acta. 505:215-278.
Tsygannik, l. N., and J. M. Baldwin. 1987. Three-dimensional structureof deoxycholate-treated purple membrane at 6 A resolution andmolecular averaging of three crystal forms of bacteriorhodopsin. Eur.Biophys. J. 14:263-272.
Zubov, B., K. Tsuji, and B. Hess. 1986. Transition kinetics of theconversion of blue to purple bacteriorhodopsin upon magnesiumbinding. FEBS (Fed. Eur. Biochem. Soc.) Lett. 200:226-230.
Mitra and Stroud Divalent Cation Binding Sites on Bacteriorhodopsin 311