high-speed visualisation of combustion in modern gasoline engines
TRANSCRIPT

Journal of Physics Conference Series
OPEN ACCESS
High-Speed Visualisation of Combustion inModern Gasoline EnginesTo cite this article W Sauter et al 2006 J Phys Conf Ser 45 016
View the article online for updates and enhancements
You may also likeA comprehensive study of combustionproducts generated from pulverized peatcombustion in the furnace of BKZ-210-140F steam boilerV A Kuzmin and I A Zagrai
-
Advances in measurements andsimulation of gas-particle flows and coalcombustion in burnerscombustorsL X Zhou
-
The role of non-equilibrium plasma kineticeffect on GCH4GOX rocket enginecombustion performanceQingya Chen Jiaying Ge Tikai Zheng etal
-
Recent citationsReduzierung der Motoremissionen durchkontrollierte Selbstzuumlndung im OttomotorWerner Sauter et al
-
This content was downloaded from IP address 2137624450 on 21112021 at 2357
High-Speed Visualisation of Combustion in Modern Gasoline Engines
W Sauter A Nauwerck K-M Han J Pfeil A Velji and U Spicher
Universitaumlt Karlsruhe (TH) Institut fuumlr Kolbenmaschinen Postfach 69 80 D-76128 Karlsruhe Germany
E-mail wernersauterifkmuni-karlsruhede
Abstract Today research and development in the field of gasoline engines have to face a double challenge on the one hand fuel consumption has to be reduced while on the other hand ever more stringent emission standards have to be fulfilled The development of engines with its complexity of in-cylinder processes requires modern development tools to exploit the full potential in order to reduce fuel consumption Especially optical non-intrusive measurement techniques will help to get a better understanding of the processes With the presented high-speed visualisation system the electromagnetic radiation from combustion in the UV range is collected by an endoscope and transmitted to a visualisation system by 10000 optical fibres The signal is projected to 1920 photomultipliers which convert the optical into electric signals with a maximum temporal resolution of 200 kHz This paper shows the systematic application of flame diagnostics in modern combustion systems For this purpose a single-cylinder SI engine has been modified for a spray guided combustion strategy as well as for HCCI The characteristics of flame propagation in both combustion modes were recorded and correlated with thermodynamic analyses In case of the spray guided GDI engine high pressure fuel injection was applied and evaluated
1 Introduction In consideration of very stringent emission standards and the simultaneous demand for reduced fuel consumption there is a rising interest for alternative engine operating modes with extremely low raw emissions and further increased efficiency
Combustion of gasoline by homogeneous compression ignition (HCCI) is widely accepted as a technology with a high potential for ultra-low emissions and high fuel economy HCCI combustion is achieved by compressing a lean homogeneous mixture of fuel air and (very often) considerable amounts of residual gas until it auto-ignites Due to the homogeneity of the charge ignition occurs almost simultaneously throughout the combustion chamber leading to rapid low-temperature combustion of the charge As a result almost no NOX is formed during combustion which facilitates exhaust aftertreatment considerably At the same time the thermodynamic cycle approaches ideal constant-volume combustion providing a significant potential for improvement of thermal efficiency especially at part load
For a large amount of questions dealing with the optimisation of new gasoline engine combustion strategies an analysis and evaluation of the process flow is no longer possible by investigating the composition of emissions and a conventional pressure indication Rather a direct visualisation of the process flow with a high temporal and spatial resolution is necessary
Institute of Physics Publishing Journal of Physics Conference Series 45 (2006) 120ndash132doi1010881742-6596451016 Second International Conference on Optical and Laser Diagnostics (ICOLAD 2005)
120copy 2006 IOP Publishing Ltd
In this paper a visualisation system is presented that is in use and further development at the Institute for Reciprocating Engines of the University Karlsruhe (TH) This high speed visualisation system is based on fibre optics and features a fast and simple application at production engines The main components are a UV-endoscope and a photomultiplier-array camera The application of the fibre endoscope needs only one small bore with access to the combustion chamber to enable the visualisation of flame propagation
After a detailed system description of the high-speed photomultiplier camera possible applications in the field of homogeneous compression ignition (HCCI) and gasoline direct injection with spray guided combustion strategy are discussed
2 PhotoMultiplierTube-Camera (PMT-Camera) The optical measurements presented in this paper were carried out with a multi-fibre visualisation technique from Smetec GmbH (Figure 1) called PhotoMultiplierTube-Camera (PMT-Camera) For this purpose an endoscope is used to transmit ultraviolet radiation as well as visible light from the combustion process in the cylinder to a photomultiplier-tube-camera The endoscope includes about 10000 optical fibres in an inner capillary tube while an outer capillary is adapted concentrically to provide additional mechanical protection The clearance between both capillaries is streamed by compressed air for cooling purposes during measurements in hot engines Due to the compactness of the endoscope (4 mm in outer diameter) the system can be easily adapted to series engines without any major modifications in engine design The application of the endoscope needs only a small optical access to the combustion chamber similar to the ones used for pressure transducers The endoscope is mounted into a probe which is protected by a fused silica window The endoscope allows to capture signals within an observation cone of approximately 80 degrees
Figure 1 Experimental setup for combustion visualisation in engines (Smetec Imagine System) The endoscopic image which results from all fibre signals is then projected onto a photosensitive
array composed of 30 multianode photomultiplier modules (Hamamatsu R7400U-03 series) Each
121
module has 8 x 8 independent anodes which as secondary emission multipliers provide the amplification of the incident light signals by photoelectric effect and electron acceleration There exist a variety of dynode types and each type exhibits different gain time response uniformity and secondary-electron collection efficiency depending upon the structure and the number of stages The system in the present case uses metal channel dynodes which ensure good time characteristics and stable gain Another feature offered by these kind of dynodes is very low crosstalk between multiple anodes ie the light signal incident on a certain position of the photocathode is detected very accurately due to a minimum spatial spread of the electron flow between different dynode stages Therefore position data is precisely maintained through the cascade multiplication process [1]
In spite of the low level of crosstalk a calibration of all photomultiplier anodes is indispensable due to a non-uniformity originating from gain variations in the secondary electron multipliers Figure 2 shows typical uniformity data obtained from each anode when uniform light is illuminated over the entire photocathode
The calibration takes place as a white balance for a number of different supply voltages which depend on the anticipated supply voltage value needed for measuring a certain intensity of light emission from the combustion process For this purpose an adjustable uniform light source is placed in front of the photomultiplier-array After determining the anode with the maximum output signal the values of all remaining anodes get corrected by an appropriate factor to set them to the same level In case that any anode signal is beyond the saturation threshold the intensity of the uniform light source is being reduced immediately until a safety margin to the saturation limit is reached This proceeding has been automated by the control software
Once the calibration process has been finished successfully the measurement can be started Each of the 30 photomultiplier modules consists of 8 x 8 independent anodes so that consequently the light emission from combustion process is detected in 1920 subvolumes After evaluating the output signals from the photomultiplier array a two-dimensional image of the line integral intensity distribution can be reconstructed for each time-step
The R7400U-03 photomultiplier tubes used in the present work are able to determine ultra-violet radiation with an acceptable sensitivity down to a wavelength of about 250 nm Thus it is possible to detect and separate spectral signals in the wavelength range of OH species eg by using an appropriate filter Sufficient photocathode sensitivity can be found in the range from 300 nm to 500 nm as shown in Figure 3
Figure 2 Typical anode output uniformity [1] Figure 3 Spectral sensitivity of different photomultiplier tubes [1]
122
The used photomultiplier tubes have excellent time characteristics Suitable quantities for time response measurement are rise time fall time and electron transit time As indicated in Figure 4 the transit time is the time interval between the arrival of a light pulse at the photocathode and the appearance of the output pulse The rise time is defined as the time for the output pulse to increase from 10 to 90 percent of the peak pulse height Conversely the fall time is defined as the time needed to decrease from 90 to 10 percent Metal channel dynodes typically have time responses in the range of 8 to 15 nanoseconds considering the total of risefall time and electron transit time
Regarding the whole measurement system it can be observed that even if the photomultiplier and amplifier have fast response the total response is limited to a cut-off frequency determined by the subsequent output circuits such as the current-to-voltage conversion and signal processing circuit In the present case the maximum temporal resolution is reached at 200 kHz which allows for example a resolution of 01deg crank angle at an engine speed of 3000 rpm Using a ring buffer it is possible to record process and display up to one-hundred subsequent engine cycles depending on the chosen temporal resolution of the measurement
Figure 4 Definitions of risefall time and electron transit time [1]
3 Cycle-Resolved Combustion Visualization in an HCCI-DI engine Homogeneous compression ignition was realised for the first time in two-stroke engines The temperature necessary for setting off auto-ignition was achieved either by increasing the compression ratio [2] or by increasing the amount of hot residual gases in the cylinder [3 4]
The combustion principle of homogeneous compression ignition was applied to four-stroke engines for the first time in the 1980s [5 6] For these investigations fuel research engines with variable compression ratio have been used In many cases intake charge heating served to provide the high temperature level before compression start which is necessary for reaching auto-ignition with moderate compression ratios
As a consequence of the limited operating range of HCCI a hybrid strategy with HCCI in part load points and conventional spark-ignited gasoline combustion strategies for higher loads was suggested Other approaches aim at achieving and controlling HCCI combustion by mixing two fuels with different auto-ignition properties [7] In recent years several concepts have been developed for precise control of gasoline HCCI combustion using variable residual gas content (either from external or internal EGR) and early or multi-stage direct injection [eg 8 9] Moreover fully variable valve trains are proposed for control of HCCI combustion in gasoline engines even with port fuel injection [10 11] Today these two approaches are considered as the most promising solutions for fast control of homogeneous compression ignition in future engines for automobiles
31 Experimental Setup
The single-cylinder engine used for this study (see Table 1) is derived from a BMWRotax F650 four-stroke motorcycle engine featuring a modern four-valve layout
123
Table 1 Engine Data
Engine Type Single-cylinder water-cooled
Displacement [cm3] 652
Bore x Stroke [mm x mm] 100 x 83
Compression ratio [-] 971 1151
Mixture Formation MPI GDI The modifications made to the basic engine relate primarily to the valve train The optimised valve
lift profiles for HCCI combustion are displayed in Figure 5 together with the profiles used for conventional SI combustion on the basic engine The range of exhaust camshaft timings is represented by the two boundary curves for the outlet valve lift in Figure 5 Continuously variable valve timing at the outlet is realised by a vane type camphaser taken from a series engine and adapted to the single-cylinder engine for the experiments
Val
ve li
ft [m
m]
0
1
2
3
4
5
6
7
8
9
[degCA]0 60 120 BDC 240 300 TDC 420 480 BDC 600 660 TDC
IVSI EVSI IVHCCI EVHCCIearly EVHCCIlate
Figure 5 Valve lift curves of the camshafts used for the
experiments (IV = intake valve EV = exhaust valve)
The test bench is fully equipped with measurement devices for all basic operation parameters
During the investigation the engine was operated with standard RON95 gasoline using port injection as well as direct injection Port injection (MPI) was used during the first series of HCCI experiments with the aim of providing a homogeneous mixture For the subsequent investigations a direct injection system (GDI) was adapted to the engine which made it possible to vary the homogeneity of the charge and the time available for pre-ignition reactions of the fuel by changing the injection timing A detailed description of the test bench is given in [12]
32 Comparison of SI Combustion and HCCI combustion
The UV-endoscope was mounted in the central spark plug position (Figure 6) The engine was started with the side spark plug and stable HCCI combustion was ensured before ignition was switched off for the measurement The orientation of the recorded images with respect to the intake and exhaust port and the side spark plug can be understood from the schematic representation in Figure 6
124
Intake
Exhaust
Bottom View
Front View
Spark plug (Sp)Observation area
Combustion ChamberPiston TDC
Endoscope
Right View
Right
BottonFro
nt
Top View
Sp
Figure 6 Measuring arrangement and observation volume of the optical investigations The direct comparison of the combustion process in SI and HCCI mode elucidates the
characteristic differences of the two operation modes (Figure 7) While during SI combustion a well defined flame front develops from the spark plug located at the left side of the image (outside of the observation volume) and gradually expands into the combustion chamber HCCI combustion is characterised by homogeneously distributed ignition centers throughout the observation volume leading to rapid combustion within a few degrees crank angle
SOC +1deg +2deg +3deg +4deg +5deg +6deg +7deg +8deg +9deg +10deg +11deg +12deg +13deg +14degCA
Figure 7 Comparison of SI combustion (upper row) and HCCI combustion (lower row) at 1500 rpm IMEP = 25 bar top view
33 Homogenisation at Combustion
In view of controlling the homogeneous charge compression ignition in a wide operation range the analysis of unstable operation points is of great importance Thus clues for a stabilisation of the combustion process can be achieved With the information of the pressure indication as well of the combustion visualisation the operation behaviour with heavy fluctuating ignition timings can be investigated through single-cycle analysis over several cycles During the analysis of such a comparatively unstable operation point it became obvious that single-cycles can be classified into two categories (Figure 8) For cycles 3 5 and 7 combustion onset was located at about 182 degCA while for cycles 2 4 6 and 8 ignition occurred about 5 degCA later Retarded ignition results in even more retarded combustion which shows a fluctuation of mass fraction point of up to 8 degCA in consecutive cycles The combustion fluctuations of the examined operation point are just about so far constricted that no risk of flame-extinction exists
The analysis shown above can be made entirely based on the pressure indication curves however pressure data do not deliver any information on the spatial character of combustion which can only be
125
obtained by optical analysis This analysis also shows a systematic difference between the early and late burning cycles
55
0 M
FB [
degCA
AT
DC
]
2
4
6
8
10
12
14
16
18
Cycle No
0 2 4 6 8 10 12 14 16 18B
urn
Dur
atio
n [deg
CA
]
5
10
15
20
25
30
35
40
455 MFB50 MFB10-90 BD
Figure 8 Location of 5 and 50 MFB and burn duration of subsequent cycles during
instable operation
The difference becomes obvious from a comparison of the two subsequent cycles 5 and 6 which in each case show typical characteristics of early and late combustion in the optically recorded combustion process (Figure 9) Due to the early onset of combustion the cylinder charge of cycle 5 still exhibits some inhomogeneities leading to ignition occurring in a clearly confined zone at the upper right corner of the observation volume (thus on the intake side opposite of the ndash inactive ndash spark plug) while ignition in the rest of the charge occurs about 2 degCA later Cycle 6 on the other hand exhibits typical homogeneous combustion characteristics Ignition starts at the centre of the combustion chamber ndash the region with the highest charge temperature due to reduced heat loss compared to the near-wall region ndash and then quickly spreads to the entire combustion chamber within only 1 degCA Light emission is much weaker and correlates well with the reduced peak pressure
Similar variations in the degree of ignition homogeneity can be found for other cycles with similar combustion phasing The HCCI ignition process is thus influenced not only by residual gas content and temperature fuel mass and the time available for pre-ignition reactions but also by the spatial distribution of residual gas and fuel This leads to the conclusion that it should be possible to control combustion phasing and limit the pressure gradients resulting from too rapid combustion through charge homogenisation eg by using direct injection with multiple injection events
Cyc
le 5
Cyc
le 6
4deg 5deg 6deg 7deg 8deg CA ATDC
8deg 9deg 10deg 11deg 12deg CA ATDC
Figure 9 Visualisation of the ignition process for
cycles with early (Cycle 5) and late combustion phasing
(Cycle 6)
126
Comparing the combustion images of consecutive cycles the different events of ignition become obvious Figure 10 shows randomly selected consecutive 10 cycles with temporal resolution of 05 degCA between 3 degCA ATDC and 10 degCA ATDC in vertical arrangement It is obvious that cycles with early ignition show a more inhomogeneous combustion behaviour than cycles with late ignition
3deg
4deg
5deg
6deg
7deg
8deg
9deg
3deg
No 01 02 03 04 05 06 07 08 09 10
6
9
12
15
18
1 3 5 7 9Cycle No
50
MF
B[deg
CA
AT
DC
]
260
265
270
275
280
IME
P[b
ar]
50 MFB [degCA ATDC] IMEP [bar]
Figure 10 Visualisation of combustion of 10 subsequent cycles in gasoline self ignition mode
127
4 Visualisation of Combustion in DISI-engine The high speed flame visualisation system is a powerful tool when developing new combustion strategies This measurement system helps to describe and to understand combustion processes interaction of flame with charge motion and influence of injection pressure In particular in DISI-engines with spray guided system a sensitive adjustment of various factors like arrangement of injector and spark plug fuel-mixture preparation or combustion chamber geometry is necessary The high speed imaging system provides suitable data to visualise cycle-resolved inflammation combustion and the burnout in IC engines The application of the measurement system on a spray guided combustion system is described in the following
The examined engine was described above in chapter 3 Some modifications have been done to run the engine in stratified mode One exhaust valve was removed in order to locate the spark plug close to the injector The injector was positioned in the centre of the combustion chamber The optical probe is directed to the spark plug and covers a wide range of the chamber The schematic in figure 11 illustrates the observation angle and gives an impression of the field of view into the chamber The exhaust valve (EV) is located behind the spark plug opposite of one intake valve (IV)
Figure 11 Endoscopic field of view
Cycle-resolved measurements with a temporal resolution of 01degCA means a huge amount of
recorded data One development target was to convert images into quantitative information Therefore several routines compute (a) the integral light intensity of each image (b) a two-dimensional flame area and (c) the coordinates of the flame centre The flame area was defined as the projection of the 3-dimensional flame onto the photo-multipliers
Influence of charge motion on flame centre movement is shown in figure 12 The clockwise swirl moves the flame kernel from the spark plug to the left so that the flame crosses the whole field of view In contrast to this a counter clockwise swirl leads to a displacement of the flame to the opposite direction away from the endoscopic probe The flame seems to remain in one position because the flame passes off from this point of observation
A tumble motion decays faster than a swirl due to the change of tumble shape in late compression stroke The tumblersquos diameter is continuously reduced while the swirlrsquos shape stays nearly undisturbed (except during compression) This means a swirl can retain much longer its kinetic energy than a tumble [13] Consequently the charge motion of a tumble induces less influence on flame movement than a swirl
A considerable flame fluctuation is observed although no charge motion is generated Basically all kinds of charge motion show a drift upwards to the pent roof
The flame movement was nearly independent of the ignition timing for each applied charge motion (not shown in figure 12) All measurement results confirmed that flow conditions remain almost constant while inflammation and combustion take place
128
Figure 12 Movement of flame centre (pinj = 300 bar tign = 22 degCA BTDC)
The flame area vs the crank angle is shown in figure 13 (left) for 200 bar injection pressure with a
clockwise swirl The ignition timing was varied As expected the beginning of flame detection starts with chronological synchronism to the ignition A later ignition leads to a decrease in flame area Thermodynamic investigations show a delayed combustion and a long burning duration at late ignition timing so that no constant-volume cycle can be obtained In this case in-cylinder pressure and temperature are decreased as well as flame intensity It can be assumed that flame area will decline in the same way
Figure 13 Flame area vs crank angle and vs 50 MFB In order to validate this result a correlation between 50 MFB and maximum flame area was
carried out The maximum flame area over 50 MFB is mapped in figure 13 (right hand side) for all kinds of charge motion and all applied injection pressures The correlation delivers a more diversified point of view Basically maximal flame area decreases with late 50 MFB in spite of the high
129
fluctuations due to stratified combustion strategy But on the other hand small flame areas can be detected at early timings and every charge motion presents a maximal flame area depending on 50 MFB The conclusion is that the maximal detected flame area is associated with a characteristic 50 MFB timing depending on charge motion
Further insides can be gained by comparing thermodynamic data with flame intensity The first time when the flame is detected was correlated with 5 MFB the peak of flame detection was correlated with 50 MFB and the flame burnout with 95 MFB respectively Results are shown in figure 14
Figure 14 Correlation between thermodynamics (MFB) and flame
detection
A distinct correlation between begin of flame detection and 5 MFB can be found The regression
coefficient Rsup2 shows a high value In accordance to Reissing [14] the visible inflammation occurs earlier than the first noticeable burned mass fraction The temporal difference in degree crank angle is about 14deg CA Similarly 50 MFB correlates with the timing of maximal flame area (peak of detection) The variance increases slightly compared to 5 MFB The delay time is only about 8deg CA
The end of combustion association shows higher fluctuations According to Reckers et al [15] the development and process of the combustion cycle is initialised in early inflammation stage Small irregularities at the beginning of combustion can provoke significant consequences at the end of burning so that the 95 MFB does not correlate any more with end of flame detection This becomes more important for stratified combustion strategies when the burning duration is considerably longer than for homogeneous combustion
5 Conclusions and Outlook The visualisation of the self ignition process in HCCI engines requires both high repetition rates (gt 100 kHz) and a high memory depth of the camera system to be able to record a sufficient number of consecutive cycles with suitable resolution in a broad acquisition window
130
The presented investigations show that only a visualisation of the combustion with a resolution of 01degCA in an acquisition window of at least 10 degCA is able to represent the dynamics of the ignition process sufficiently Only then it is possible to evaluate the homogeneity of combustion Therefore the introduced visualisation system is especially suitable for research and development in the field of homogeneous compression ignited engines
The investigations in the DISI engine revealed that mixture formation and inflammation are very complex processes that interact and are influenced by ambient conditions like temperature injection pressure or flow conditions Visualisations of these processes can be the first step to understand interaction and correlation As shown high speed visualisation is necessary due to the fast burning process and the cyclic variations which can definitely not be understood by investigating non-consecutive cycles
The analysis of the recorded images identified different flame movement schemes for various intake generated charge motions The defined flame area showed unequal maximum values for different ignition timings The reason for this became clear after having correlated optical data with thermodynamically data
The aim must be to integrate this measurement technique into a cluster of results and finally to correlate it with further measurements eg optics thermodynamics exhaust emission and fuel consumption
Limitation of the system is shown in figure 15 This figure gives an idea about the interaction between various charge motion with the flame A global observation of the flame delivers a light intensity without the information of its distance to the endoscope Therefore detection of high intensities suggest flames with vehement fuel conversion The difficulty when analysing the results is to differentiate them from flames that pass near the optical probe and pretend strongly burning flames As a matter of fact the flame area of a certain charge motion can not be compared to other flow conditions It is impossible to give a basic statement about the absolute value of maximal flame area for different charge motion Therefore the results have to be carefully post-processed and evaluated
Figure 15 Flame area depending on charge motion
For future investigations an advanced measurement system is currently developed being based on
the existing photomultiplier-camera The purpose is to apply up to three single camera systems simultaneously to measure the combustion radiation from different perspectives Afterwards a three-dimensional image reconstruction algorithm shall allow to evaluate the spatial absolute position and movement of the flame by approximation of its visual hull
131
Acknowledgements The authors wish to express their thanks to DFG (Deutsche Forschungsgemeinschaft) for funding the research activities in the framework of SFB 606 (Sonderforschungsbereich 606) presented in this paper
References [1] Hamamatsu Photonics KK Photomultiplier tubes handbook [2] Schroumlder W ldquoLohmann-Fahrrad-Motorrdquo Automobiltechnische Zeitschrift (ATZ) Vol 53 pp
78-83 1951 [3] Onishi S Jo SH Shoda K Jo PD Kato S ldquoActive Thermo-Atmosphere Combustion
(ATAC) ndash A New Combustion Process for Internal Combustion Enginesrdquo SAE Technical Paper 790501 1979
[4] Noguchi M Tanaka Y Tanaka T Takeuchi Y ldquoA Study on Gasoline Engine Combustion by Observation of Intermediate Reactive Products during Combustionrdquo SAE Technical Paper 790840 1979
[5] Najt PM Foster DE ldquoCompression-Ignited Homogeneous Charge Combustionldquo SAE Technical Paper 830264 1983
[6] Thring RH ldquoHomogeneous Charge Compression Ignition (HCCI) Enginesldquo SAE Technical Paper 892068 1989
[7] Christensen M Hultqvist A Johansson B ldquoDemonstrating the Multi Fuel Capability of a Homogeneous Charge Compression Ignition Engine with Variable Compression Ratioldquo SAE Technical Paper 1999-01-3679 1999
[8] Lavy J Willand J Lendresse Y Schulz C Zhao H et al ldquoInnovative Ultra-low Nox Controlled Auto-Ignition Combustion Process for Gasoline Engines the 4-SPACE Projectldquo SAE 2000-01-1837
[9] Kaneko M Morikawa K Itoh J Saishu Y ldquoStudy on Homogeneous Charge Compression Ignition Gasoline Engineldquo 5th International Symposium on Diagnostics and Modeling of Combustion in Internal Combustion Engines (COMODIA) Nagoya 2001
[10] Wolters P Salber W Duesmann M ldquoProzessoptimierung der kontrollierten Selbstzuumlndung mittels elektromechanischem Ventiltriebldquo 6 Tagung ldquoMotorische Verbrennungldquo Muumlnchen 2003
[11] Allen J Law D ldquoVariable Valve Actuated Controlled Auto-Ignition Speed Load Maps and Strategic Regimes of Operationldquo SAE Technical Paper 2002-01-0422 2002
[12] Guumlnthner M ldquoUntersuchung der Eigenschaften und Kontrollmoumlglichkeiten der homogen kompressionsgezuumlndeten Verbrennungrdquo Logos Verlag Berlin 2004
[13] Barthelmauml L Einfluss der Luftbewegung im Brennraum auf die Abgasemission eines direkt einspritzenden Dieselmotors Dissertation TU Muumlnchen 1982
[14] Reissing J Spektroskopische Untersuchungen an einem Ottomotor mit Benzin-Direkteinspritzung Logos Verlag Berlin 1999
[15] Reckers W Schwab H Weiten C Befrui B Kneer R Investigation of Flame Propagation and Cyclic Combustion Variations in a DISI Engine Using Synchronous High-Speed Visualization and Cylinder Pressure Analysis 5th International Symposium on Internal Combustion Diagnostics Baden-Baden 2002
132
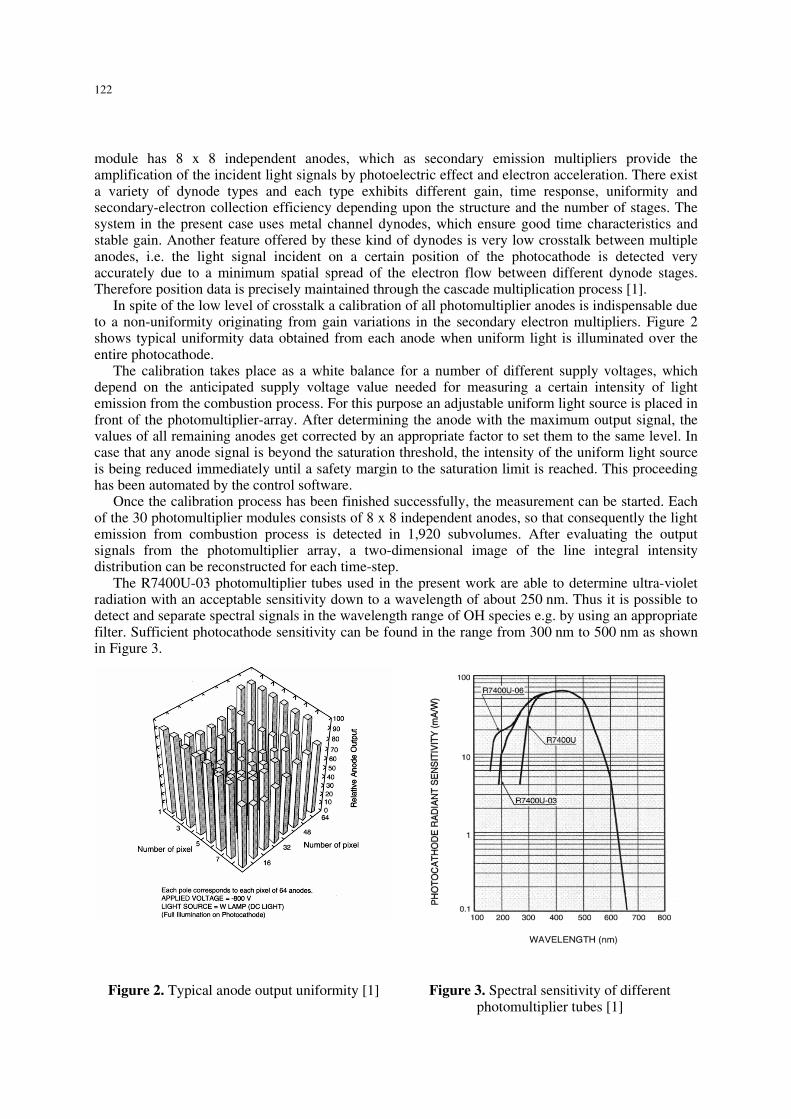
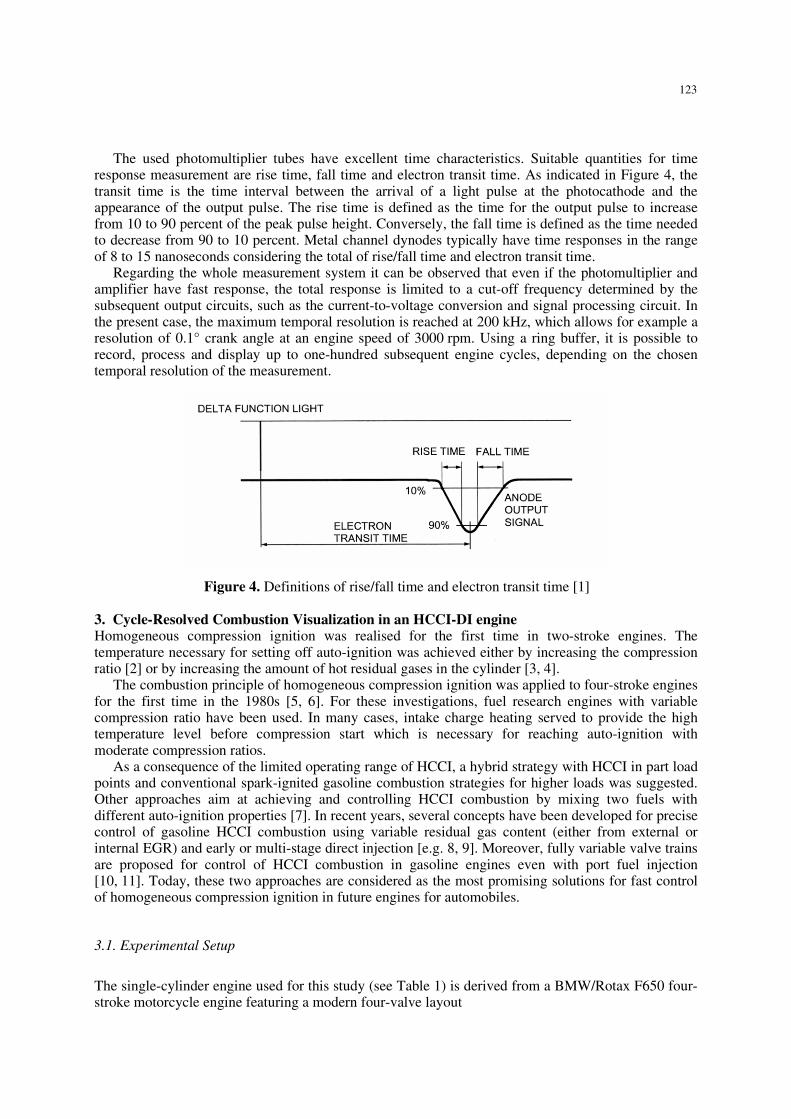
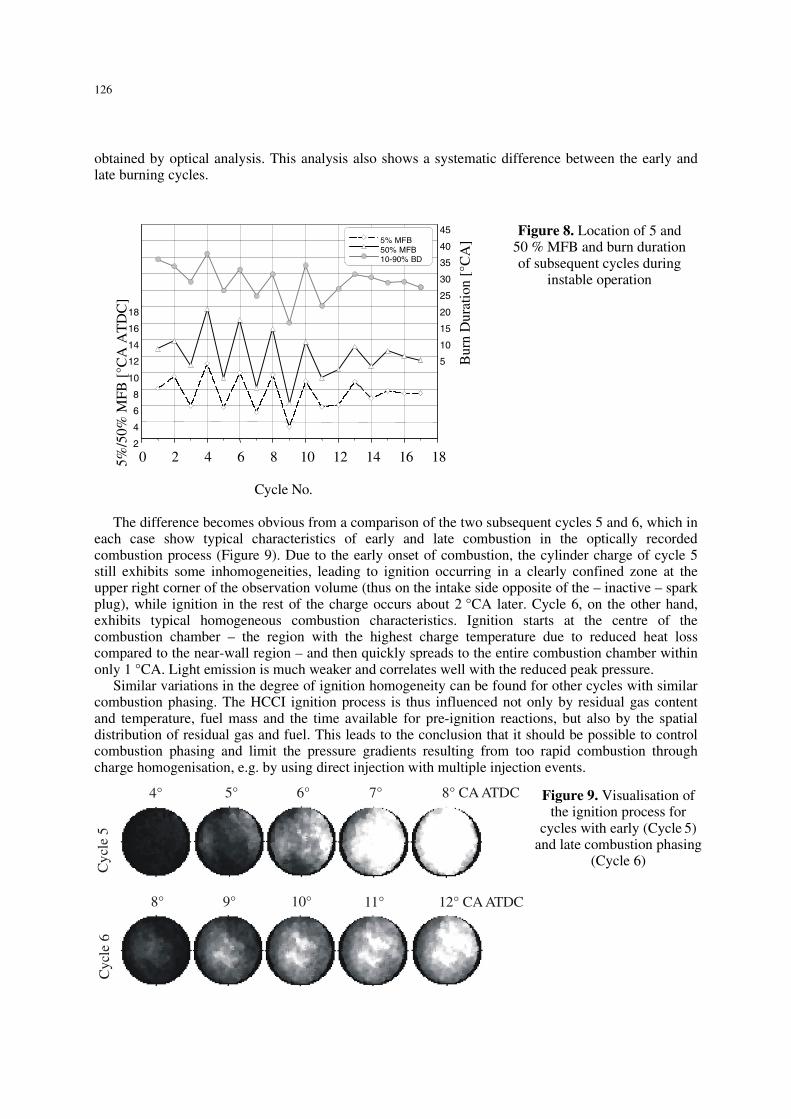
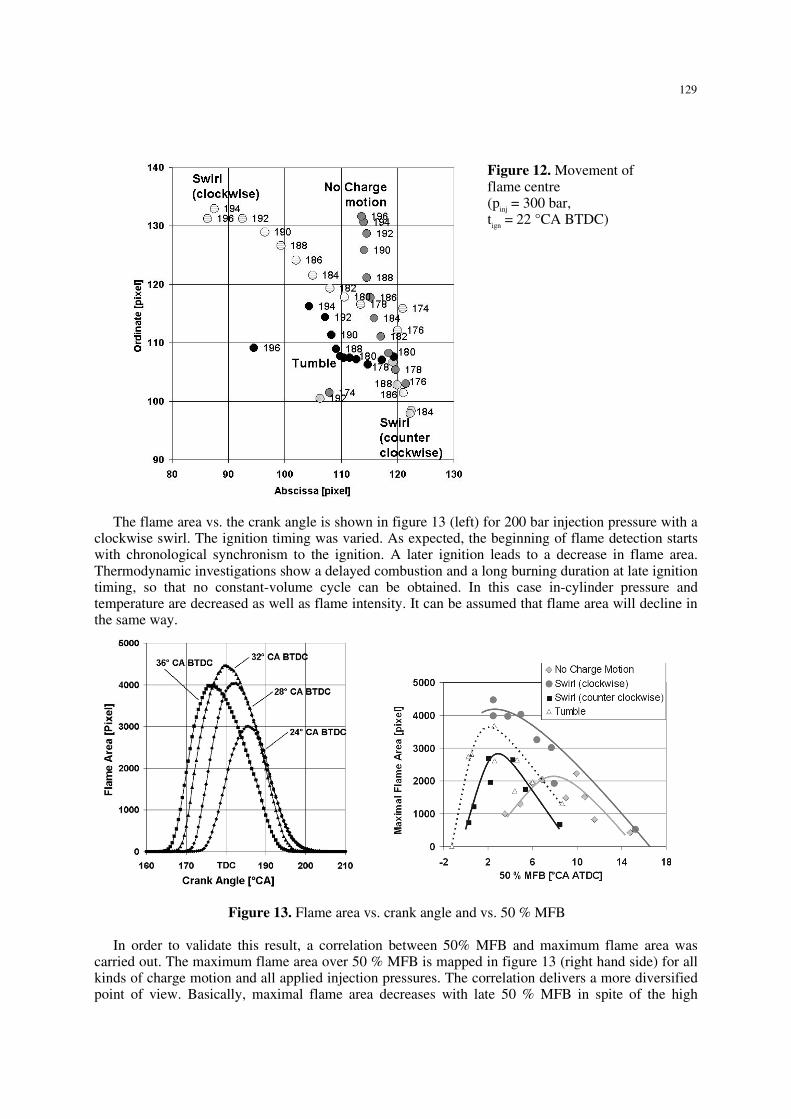
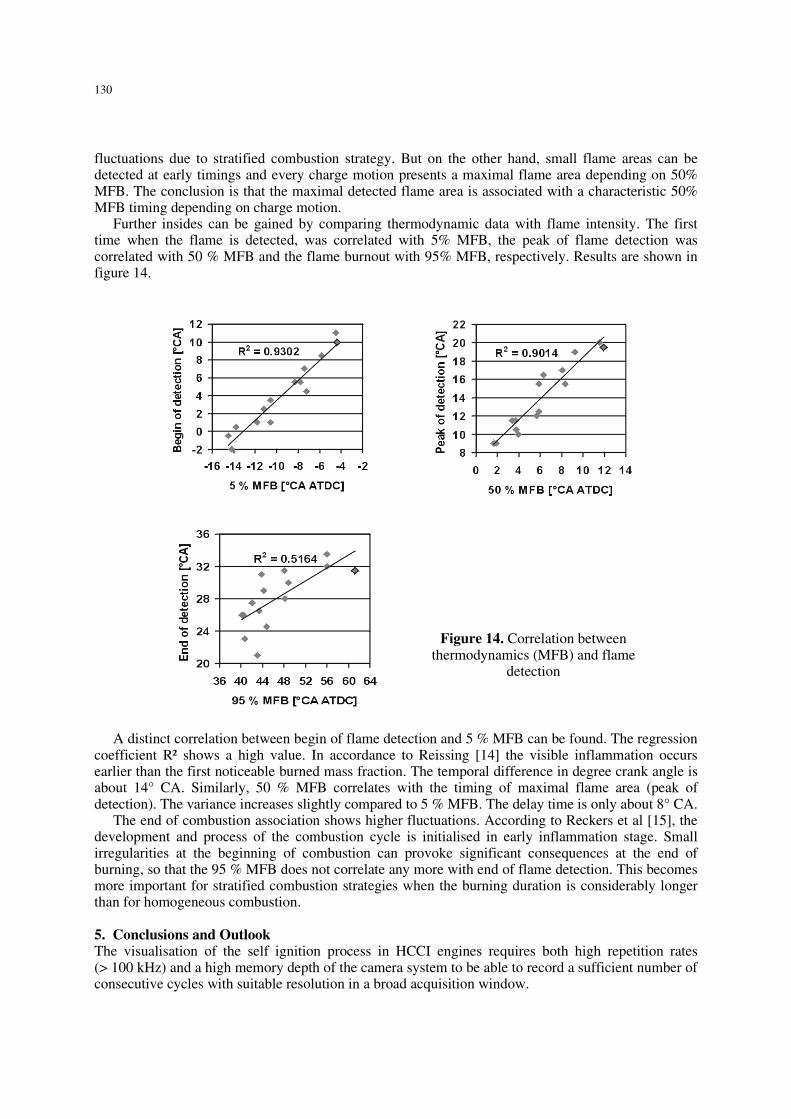