high strength glass testing and model validation for static and … · 2016-05-25 · high strength...
TRANSCRIPT

1 Distribution A: Approved for public release; distribution unlimited.
88ABW-2013-0024; 3 January 2013.
High Strength Glass Testing and Model Validation for Static and Dynamic Loading
Ryan M. Alberson1, Carrie E. Davis2, and Kirk A. Marchand3
1Associate Engineer, Protection Engineering Consultants, Austin, TX, USA, [email protected] 2Senior Associate Engineer, Protection Engineering Consultants, Austin, TX, USA, [email protected] 3Managing Principal, Protection Engineering Consultants, San Antonio, TX, USA, [email protected]
ABSTRACT The Glass Failure Prediction Model (GFPM) is the basis for ASTM E1300 which is used across the nation for window glass design. ASTM E1300 states that the model is valid only for annealed (AN) glass but, ASTM E1300 does incorporate heat strengthened (HS) or fully tempered (FT) glass through the use of multiplication factors. Rather than multiplication factors, this paper will address modifying the GFPM to incorporate these types of higher strength glass. Designers can then incorporate the model into common design methods such as single degree of freedom (SDOF) and finite element analysis (FEA) to analyze dynamic performance of glazing layups. To validate the modified GFPM, both static and dynamic testing of high strength glass was completed and comparisons to analysis predictions will be provided in the paper. The paper also illustrates how to use the modified GFPM in window design for both static and dynamic applications through the use of Single-degree-of-freedom Blast Effects Design Spreadsheet for Windows (SBEDS-W), a SDOF design tool to be released by the U.S. Army Corps of Engineers Protective Design Center (USACE PDC). Dynamic window analysis tools like SBEDS-W will be utilized more frequently due to the new threat-based requirements for windows and doors in the Unified Facilities Criteria (UFC) 4-010-01 DoD Minimum Antiterrorism Standards for Building (9 February 2012). Also, an understanding of the failure prediction capabilities of SBEDS-W is important for engineers performing the dynamic glazing analyses.
INTRODUCTION Protection Engineering Consultants (PEC) was engaged by the Air Force Research Laboratory (AFRL) to provide evaluation of the performance of window systems incorporating Herculite® XP glass and develop a fast running model to be used as a design tool enabling engineers to specify Herculite® XP glass for the Defense Acquisition Challenge (DAC). Herculite® XP glass is a high strength glass technology developed by PPG Industries with a residual stress about twice that of commercially produced FT glass. The research program included quasi-static tests of Herculite® XP glass at PEC, shock tube tests of punched windows (insulating glass units (IGUs) with commercial window frames containing Herculite® XP glass) at ABS Consulting, and two full-scale blast tests at AFRL on IGUs containing

2 Distribution A: Approved for public release; distribution unlimited.
88ABW-2013-0024; 3 January 2013.
Herculite® XP glass in punched window and storefront configurations using commercially available window frames.
The DAC test program was used to validate a model capable of predicting glass failure for both static and dynamic loads. The GFPM developed by Beason and Morgan (1984) was chosen for its incorporation of load rate, empirical probability distribution (validated), and because it is the basis for the industry standard ASTM E1300 design methodology. However, the GFPM was only developed to accommodate AN glass and needed modifications to handle the increased strength of Herculite® XP glass. The modifications to the GFPM and validation thereof are presented below.
GFPM MODIFICATIONS Original GFPM. The original GFPM, developed by Beason and Morgan (1984), was developed through the analysis and testing of AN glass. To summarize the basic premise, the GFPM utilizes a finite difference model (Vallabahn and Wang, 1981) to correlate the lateral pressure on a given piece of glass to its stress distribution. The stress is then modified to account for load duration and biaxiality, which is referenced as the equivalent stress. The equivalent stress is applied to a Weibull distribution where empirical flaw parameters (m, k) define the shape of the Weibull distribution and correlate equivalent stress to the probability of failure. For more information on the GFPM see Beason and Morgan (1984).
SBEDS-W GFPM Methodology. SBEDS-W uses the GFPM to predict glass failure for SDOF analysis. Specifically, SBEDS-W utilizes the methodology presented in ASTM E1300 Appendix X3. Use of the stress distribution factor, J, eliminates the need to explicitly map the relationship between lateral load and stress in the glass. However, the stress distribution factor is based on testing of AN glass. To accommodate the increased strength of Herculite® XP glass, a strength multiplier was added to the model which has a similar effect as altering the k parameter of the Weibull distribution found in the GFPM. Due to this modification, the k parameter is fixed at a value of 2.86x10-53 in SBEDS-W. Therefore, the m parameter is the only variable used to calibrate differing strengths of glass (in addition to the embedded strength factor). This parameter was established through both static and dynamic testing.
Proposed ASTM E1300 Appendix Methodology. The ASTM E1300 committee also began discussion of an appendix to the current ASTM E1300 that accommodates higher strength glass. The new approach extends the original ASTM approach by incorporating the residual compressive surface stress (RCSS) found in higher strength glass into the material model found in the GFPM.
Morse and Norville (2012) took the existing GFPM and modified it to account for the RCSS that is present in HS and FT glass. This is executed by subtracting the RCSS from the stress observed from the finite difference model prior to calculating the equivalent stress in the original GFPM.

3 Distribution A: Approved for public release; distribution unlimited.
88ABW-2013-0024; 3 January 2013.
This approach allows for the same flaw parameters (m=7, k=2.86e-53 N-7m12 or k=1.365e-29 lb-7in12) identified in the original GFPM development to be used with HS and FT glass under the assumption that the number and distribution of the flaws are identical to AN glass. However, test data showed modification to the flaw parameters were necessary to accurately model Herculite® XP glass.
PEC used an implicit FEA analysis by LS-DYNA to map stress to lateral load on the glass. This supplants the original finite difference model found in the GFPM, but is accomplishing the same task. Results were validated for AN glass to verify model accuracy. Additionally, the deflection data from this model verified the polynomial method for calculating deflection of the midpoint presented in ASTM E1300 Appendix X2.
This approach on modifying the GFPM differs from the approach using the GFPM implementation in SBEDS-W, but both yield conservative results when calibrated to blast test data.
Model Comparison. Figure 1 and Figure 2 show the cumulative Weibull distribution (failure probability) using both the original and adjusted set of flaw parameters plotted against the lateral pressure on the glass. Both models of the RCSS GFPM are shown for comparison.
The SBEDS-W model represents the model modified by PEC during the course of this project and uses an m value of 6.55 and k is treated as a constant (k=2.86e-53 N-
7m12). The RCSS version was run with both original flaw parameters (m=7, k=1.365e-
29 lb-7in12) and adjusted values (m=3, k=3.3e-15 lb-3in4). To adjust the Weibull distribution parameters, several pairs of flaw parameters were plotted against test data until the cumulative distribution encompassed most test values (minimizing the number of test values in the tails of the distribution curve). This adjustment proved to be robust across multiple sizes, thicknesses, and load durations. Also, notice that that SBEDS-W model is consistently conservative and tuned for better correlation on dynamic test results (compared to the quasi-static tests).
The resistance of the glass was not directly measured in dynamic testing (shock tube and blast testing) as material resistances are extremely difficult to measure directly when combined with inertial resistances. Resistance was thus inferred from measured deflection and known mass. The deflection was measured over time through the use of a laser gauge and the time of failure was determined from high speed video. The resistance curve relates the deflection to the lateral pressure and the time of failure was used to identify the maximum deflection and subsequent pressure (resistance) on the glass.

4 Distribution A: Approved for public release; distribution unlimited.
88ABW-2013-0024; 3 January 2013.
Figure 1. Dynamic Test Validation (60-in x 34-in x 0.220-in Herculite® XP glass)
Figure 2. Static Test Validation (60-in x 34-in x 0.220-in Herculite® XP glass)
The plots show good results from both models based on conservative predictions from the probability distribution. The RCSS GFPM has better handling of load duration than the SBEDS-W GFPM as evidenced by a better probability envelope for both static and dynamic testing. However, SBEDS-W is only used for dynamic events
Pressure (psi)
Prob
abili
ty o
f Fai
lure
0 2 4 6 8 10 12 14 16 18 20 220
0.1
0.2
0.3
0.4
0.5
0.6
0.7
0.8
0.9
1
RCSS (m=7, k=1.365e-29)RCSS (m=3 k=3.3e-15)SBEDS-W (m=6.55)New Tests
Pressure (psi)
Prob
abili
ty o
f Fai
lure
0 1 2 3 4 5 6 7 8 9 10 11 12 13 14 15 16 17 18 19 200
0.1
0.2
0.3
0.4
0.5
0.6
0.7
0.8
0.9
1
RCSS (m=7, k=1.365e-29)RCSS (m=3, k= 3.3e-15)SBEDS-W (m=6.55)New TestsOld Tests

5 Distribution A: Approved for public release; distribution unlimited.
88ABW-2013-0024; 3 January 2013.
and thus the embedded GFPM method is specifically calibrated for such events and performs well based on test results plotted against the probability distribution. For longer duration loads, the SBEDS-W methodology will be very conservative.
TEST RESULTS AND MODEL VALIDATION Three test programs were completed to investigate and validate the SBEDS-W GFPM model – static, shock tube, and blast testing. Brief discussion of the setups are shown for each test along with the corresponding results and model comparison.
Static Testing. Tests on monolithic Herculite® XP glass were performed with the PEC static test tank. Each framed glass lite was attached to the test tank with a steel mask corresponding to the nominal glass size. The tank utilized water to apply a uniform pressure to the glass. The side of the glass facing the inside of the test tank is denoted as the “blast” face and represents the exterior face of a window in a building. For all static testing, PEC used an ultraviolet lamp to determine the tinned (or weak) side of the glass. The tinned side was used as the blast face for all static tests, such that the strong side of the glass was facing up and tested in flexure. The test tank has a 4-ft by 6-ft opening and is 9-in deep. The mask was bolted to the test tank to decrease the opening to the nominal glass size. The non-responding window frame was bolted to the steel mask as shown in Figure 3. A rubber gasket was placed between the tank/mask and mask/frame interfaces to create a watertight seal. After shimming the frame at each bolt, the bolts were tightened around the frame and tank perimeter to minimize leaks.
Figure 3. Quasi-Static Test Set-up
potentiometers
glazing
window frame
steel mask
test tank
instrumentation frame

6 Distribution A: Approved for public release; distribution unlimited.
88ABW-2013-0024; 3 January 2013.
Results from quasi-static tests on Herculite® XP glass tests are summarized in Table 1. The residual stress “trapped” in the glass after tempering effectively reduces the effect of surface flaws. This enabled the Herculite® XP glass to reach high glass failure pressures relative to AN and FT glass. In addition, all of the specimens exhibited a forceful glass failure due to the residual stored energy from tempering and the applied strain energy accumulated during the quasi-static testing. Unlike the failure of AN glass, the monolithic Herculite® XP glass exhibited micro cracking. In general, the fracture planes of the glass fragments were dull and relatively smooth. The primary mode of failure was brittle fracture precipitated by stress concentration at the critical surface flaw site. Upon failure, specimens of monolithic Herculite® XP glass tended to fracture all the way up to the glazing tape bite at the aluminum frame edges.
Table 1. Quasi-Static Test Results Summary
The pressure and displacement histories from each test were used to develop static resistance functions for each test specimen. The measured gauge pressure inside the tank was taken to be equivalent to the resistance of the window assembly. Prior to each test, the pressure gauge was corrected for the additional pressure afforded by the static head of the water inside the tank.
1 1 2 x 3 M 0.186 17.4 2.21 0.94 1.272 2 2 x 3 M 0.190 15.0 1.96 0.84 1.123 3 2 x 3 M 0.164 11.2 1.78 0.59 1.194 4 2 x 3 M 0.165 8.9 1.51 0.48 1.035 1 3 x 5 M 0.159 4.9 2.10 0.15 1.956 2 3 x 5 M 0.149 5.3 2.24 0.25 1.997 3 3 x 5 M 0.225 9.6 2.52 0.28 2.248 4 3 x 5 M 0.220 9.7 2.45 0.53 1.929 5 3 x 5 L 0.372 10.0 2.12 0.25 1.8710 8 3 x 5 L 0.376 10.3 2.13 0.17 1.9611 9 3 x 5 L 0.374 10.1 2.16 0.20 1.9712 10 3 x 5 L 0.376 10.0 2.01 0.19 1.8213 1 3 x 5 M 0.154 5.9 2.05 0.11 1.9414 2 3 x 5 M 0.156 6.9 2.20 0.14 2.0615 3 3 x 5 M 0.124 4.0 2.01 0.09 1.9316 4 3 x 5 M 0.181 7.0 2.01 0.13 1.8717 5 3 x 5 M 0.187 8.3 2.16 0.16 2.0018 6 3 x 5 M 0.116 5.1 2.20 0.11 2.0919 7 3 x 5 M 0.221 12.9 2.20 0.20 2.0020 8 3 x 5 M 0.220 10.7 2.14 0.18 1.95
* M = Monolithic; L = Laminated (PVB thickness = 0.060 in.)
Net Defl. (in)
Identification Nominal Window Size* (ft)
Glass BreakTest No.
Window No.
Thickness (in)
SMA
LL
GLA
ZIN
G
Pressure (in)
Mid Point Defl. (in)
Frame Defl. (in)
LAR
GE
GLA
ZIN
G

7 Distribution A: Approved for public release; distribution unlimited.
88ABW-2013-0024; 3 January 2013.
The results of the quasi-static tests were used to confirm the GFPM parameters (m = 6.40 and k = 2.86×10-53 N-7m12) for use in shock tube test predictions for Herculite® XP glass. Shock Tube Testing. The shock tube testing provided an abundance of data with regard to deformed shape, crack propagation, glass deflection at failure, and poly-vinyl butyral (PVB) bite considerations. Initial predictions by SBEDS-W did a reasonable job of predicting glass response by correctly predicting 59% of all breaks across both monolith and IGU tests. The data obtained from the high speed cameras was used to capture crack propagation, which was used to assess glass break timing and correlated displacement at time of failure. This was used to improve the predictive capabilities of the GFPM found in SBEDS-W. The initial monolithic glass tests were performed to investigate rate effects included in the GFPM model. Layups tested are summarized in Table 2. Figure 4 shows a typical setup for shock tube testing. Shock tube test results and predictions using an m of 6.4 in SBEDS-W are summarized in Table 3. SBEDS-W predicted slightly higher deflections and resistances to first crack than observed in the tests. Additionally, the break point of glass was predicted correctly 57% of the time based on flaw parameters determined from static testing. Using the dynamic test data, m was adjusted to 6.55 to account for these differences which were most likely due to rate effects and assumed deformed shape. Figure 5 illustrates the effect of inertia on the observed test data versus the idealized window response calculated by SDOF in SBEDS-W.
Table 2. Shock Tube Tests Glass Layup Types
Outer Lite Air Gap Inner Lite*1 4 3/16 1/2 1/4 laminate (0.060 PVB) aluminum2 3 1/4 1/2 5/16 laminate (0.060 PVB) aluminum3 3 1/4 1/2 3/8 laminate (0.060 PVB) aluminum4 4 3/16 1/2 1/4 aluminum5 1 1/8 - - steel
1 5/32 - - steel1 3/16 - - steel1 1/4 - - steel
* laminates composed of 2 lites of glass
Nominal Thickness (in)No. of Samples
Glass Layup Type
Frame Type

8 Distribution A: Approved for public release; distribution unlimited.
88ABW-2013-0024; 3 January 2013.
Figure 4. Shock Tube Setup
Table 3. Shock Tube Test Comparison of Monolithic Glass
Figure 5. Shock Tube Test 1 Results: Deflection Comparison
support frame
window
pressure gauge
laser deflection gauge
shock tube
Glass Break Time (ms)
Max. Defl. (in)
Glass Break Time (ms)
Max. Defl. (in)
1 1/4 7.7¹² ± 1 2.14 - 2.45ᵃ no break 2.332 3/16 no break 1.42ᵃ no break 1.543 3/16 break 1.92ᵃ no break 2.678 1/4 5.3¹² ± 1 2.71 - 6.10ᵃ 4.15 2.9816 1/8 5.5¹ ± 0.5 1.67 - 3.08ᵃ 5.17 2.8217 5/32 6¹ ± 0.5 2.23 - 4.40ᵃ no break 2.8118 1/4 5¹ ± 0.5 1.03 - 3.58ᵃ 4.94 2.99
Notes: ¹ABS Estimation; ²high-Speed Video EstimationᵃLaser Deflection
Glass Thickness
(in)
Test No.
SBEDS-W PredictionsTesting
Time (ms)
Def
lect
ion
(in)
0 2.5 5 7.5 100
1.5
3Laser data adjusted by -0.75ms
SBEDS-WLaserGlass Break

9 Distribution A: Approved for public release; distribution unlimited.
88ABW-2013-0024; 3 January 2013.
In addition to the monolithic glass tests, several laminated IGU layups were tested. The shock tube pressure capacity was the limiting factor on the thicker glass layups (Type 2 and 3 as shown in Table 2) as higher pressures were needed to break the glass without subsequent over loading of the PVB. Higher impulses with lower pressures could be achieved to break the glass, but this resulted in a lack of control in the testing and caused PVB failure and catastrophic failure of the system, immediately after glass break occurred. Several successful and controlled tests were conducted, however. Table 4 shows the inner lite test results and the corresponding SBEDS-W predictions using an m of 6.4. On average, SBEDS-W was 3% lower than the measured deflections of the inner lite when the glass did not break. Thus, deformed shape has a limited effect on the maximum deflection of the window at midspan, which occurs after the shape has returned to the typical parabolic shape. However, the GFPM predicted no failure for each of the tests where the glass failed, which could be improved. Again the test data showed a value of m adjusted to 6.55 would account for these differences and provide better predictions for the blast tests.
Table 4. Shock Tube Results: Laminated IGU Comparison
Blast Testing. Two full-scale blast tests were performed on twelve window assemblies (six per test) at the AFRL test facilities located on Tyndall Air Force Base in Panama City, Florida. Test 1 was performed on August 22, 2012 and Test 2 was performed on October 3, 2012 (Figure 6). Both tests were performed to validate the performance of IGUs incorporating Herculite® XP glass in punched window and storefront configurations using commercially available window frames. PEC analyzed the performance of the Herculite® XP glass subjected to the actual blast loads. SDOF analyses were performed using SBEDS-W. The SBEDS-W glass module was calibrated to match results from static tests completed in January 2012 and shock tube tests in April 2012 (m = 6.55, k = 2.86×10-53 N-7m12, POF = 500, LF =
Glass Break Time (ms)
Max. Defl. (in)
Glass Break Time (ms)
Max. Defl. (in)
9 1 6.1² ± 0.15 2.67ᵇ no break 2.77 3.7%10 1 7.2² ± 0.15 2.40ᵇ no break 2.5 4.2%11 1 no break 2.37ᵃ no break 2.23 -5.9%12 1 no break 2.55ᵇ no break 2.42 -5.1%13 1 6.2² ± 0.15 2.44ᵇ no break 2.76 13.1%14 3 no break 2.51ᵇ no break 2.45 -2.4%15 3 <6.7² ± 0.5 N/M no break 2.9 N/M19 2 no break 2.58ᵃ no break 2.58 0.0%20 2 no break 2.60ᵃ no break 2.58 -0.8%21 2 no break 2.77ᵃ no break 2.66 -4.0%
Notes:ᵃLaser Deflection; ᵇDIC Deflection; N/M - not measured
Test No.
Window Type
Testing SBEDS-W PredictionsSBEDS-W Error (%)
2High-Speed Video Estimation
10 Distribution A: Approved for public release; distribution unlimited.
88ABW-2013-0024; 3 January 2013.
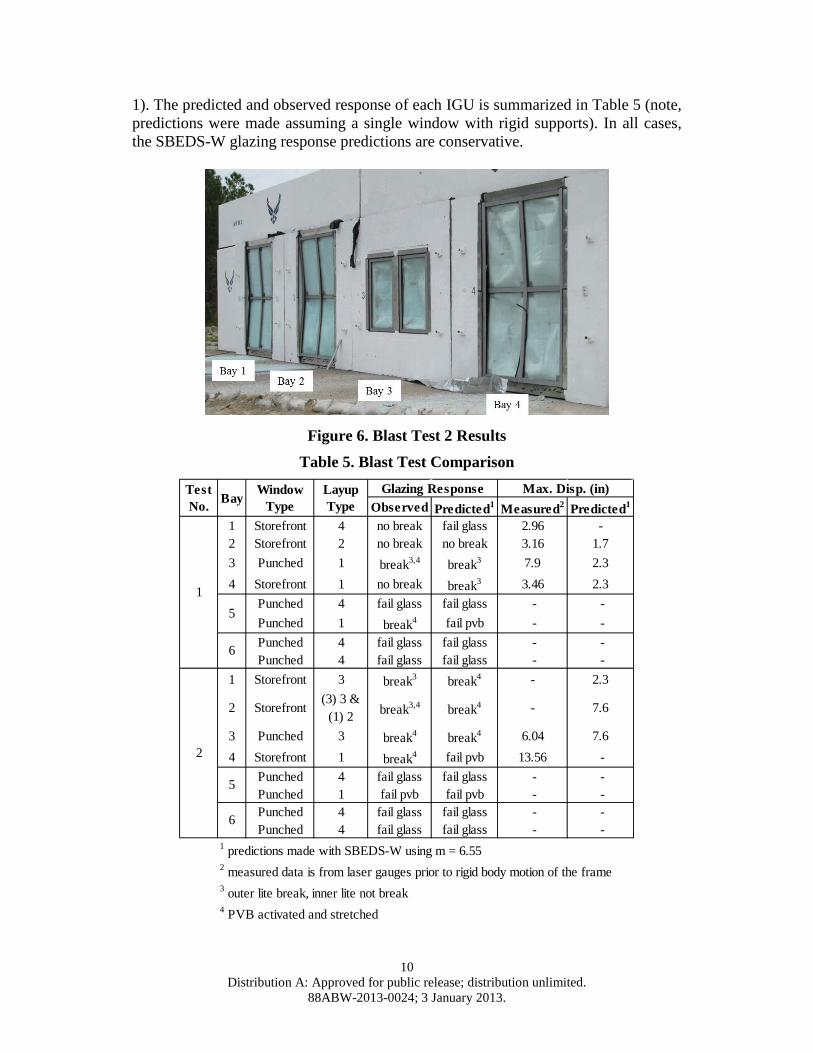
1). The predicted and observed response of each IGU is summarized in Table 5 (note, predictions were made assuming a single window with rigid supports). In all cases, the SBEDS-W glazing response predictions are conservative.
Figure 6. Blast Test 2 Results
Table 5. Blast Test Comparison
Observed Predicted1 Measured2 Predicted1
1 Storefront 4 no break fail glass 2.96 - 2 Storefront 2 no break no break 3.16 1.73 Punched 1 break3,4 break3 7.9 2.34 Storefront 1 no break break3 3.46 2.3
Punched 4 fail glass fail glass - -Punched 1 break4 fail pvb - -Punched 4 fail glass fail glass - -Punched 4 fail glass fail glass - -
1 Storefront 3 break3 break4 - 2.3
2 Storefront(3) 3 &
(1) 2 break3,4 break4 - 7.6
3 Punched 3 break4 break4 6.04 7.64 Storefront 1 break4 fail pvb 13.56 -
Punched 4 fail glass fail glass - -Punched 1 fail pvb fail pvb - -Punched 4 fail glass fail glass - -Punched 4 fail glass fail glass - -
1 predictions made with SBEDS-W using m = 6.552 measured data is from laser gauges prior to rigid body motion of the frame3 outer lite break, inner lite not break4 PVB activated and stretched
2
6
5
Max. Disp. (in)Glazing ResponseTest No. Bay
Window Type
Layup Type
15
6

11 Distribution A: Approved for public release; distribution unlimited.
88ABW-2013-0024; 3 January 2013.
CONCLUSIONS AND RECOMMENDATIONS In addition to evaluation of Herculite® XP glass through testing for blast and the evaluation of existing techniques for prediction of that response, a goal of the project was to determine a design method to enable engineers to specify Herculite® XP glass for windows using consensus based standards such as ASTM E1300. Herculite® XP glass can be incorporated into existing industry standards, such as ASTM E1300, using an approach outlined by the ASTM task group with minor modifications to the m and k parameters. Data collected during the test program was used to adjust the approach specifically for applications with Herculite® XP glass.
Testing during this program provided sufficient data to evaluate a resistance function for IGUs containing Herculite® XP glass for use in a dynamic SDOF analysis program. Comparisons of test data illustrate that the model can conservatively predict the performance of IGUs containing Herculite® XP glass subjected to blast loads. In general, Herculite® XP glass can provide the same level of protection as AN or HS glazing using a thinner and lighter section.
Accuracy of SDOF Analysis Predictions. Shock tube and blast testing showed good correlation with SDOF predictions made with SBEDS-W based on consistent and conservative glazing failure predictions. As discussed previously, the deformed shape of the glass is consistent with large deformation plate theory and exhibits a parabolic shape soon after load is applied. Additionally, the resistance curve generation based on the polynomial method found in Appendix X2 in ASTM E1300 was verified with the static test results.
Lastly, based on a comparison of predictions and observations of glazing failure in the blast tests found in Table 5, the modifications to the GFPM used in SBEDS-W provide good predictions for glass failure. The flaw parameters were calibrated to static and shock tube test data and Table 5 again shows they did a good job of predicting glass failure in the final blast tests.
Final Design Parameters and Assumptions. The flaw parameters for the SBEDS-W GFPM model were continually refined throughout the course of this project. The modified GFPM treats the flaw parameter, k, as a constant (k = 2.86e-53 N-7m12) and must be run using international system (SI) units. For the remaining flaw parameter, m, a value of 6.34 was selected to match quasi-static test results. However, for short duration loads such as shock tube and blast tests, an m of 6.55 was selected to match test results. Since an m value of 6.55 is conservative for all load durations and calibrated to blast loads, it is the final design value selected for Herculite® XP glass for use in the SBEDS-W modified GFPM, as shown in Table 6. The SBEDS-W model assumes that a probability of 0.5 will be used for design purposes. Additionally, while only a single glazing geometry was tested and evaluated in the shock tube and blast tests, size variation was evaluated as a part of the original static test series and not found to change the design parameters significantly. Window sizes significantly larger than 60-in by 34-in tested could require additional investigation, but should be adequately predicted for aggregate response using the parameters recommended.
12 Distribution A: Approved for public release; distribution unlimited.
88ABW-2013-0024; 3 January 2013.
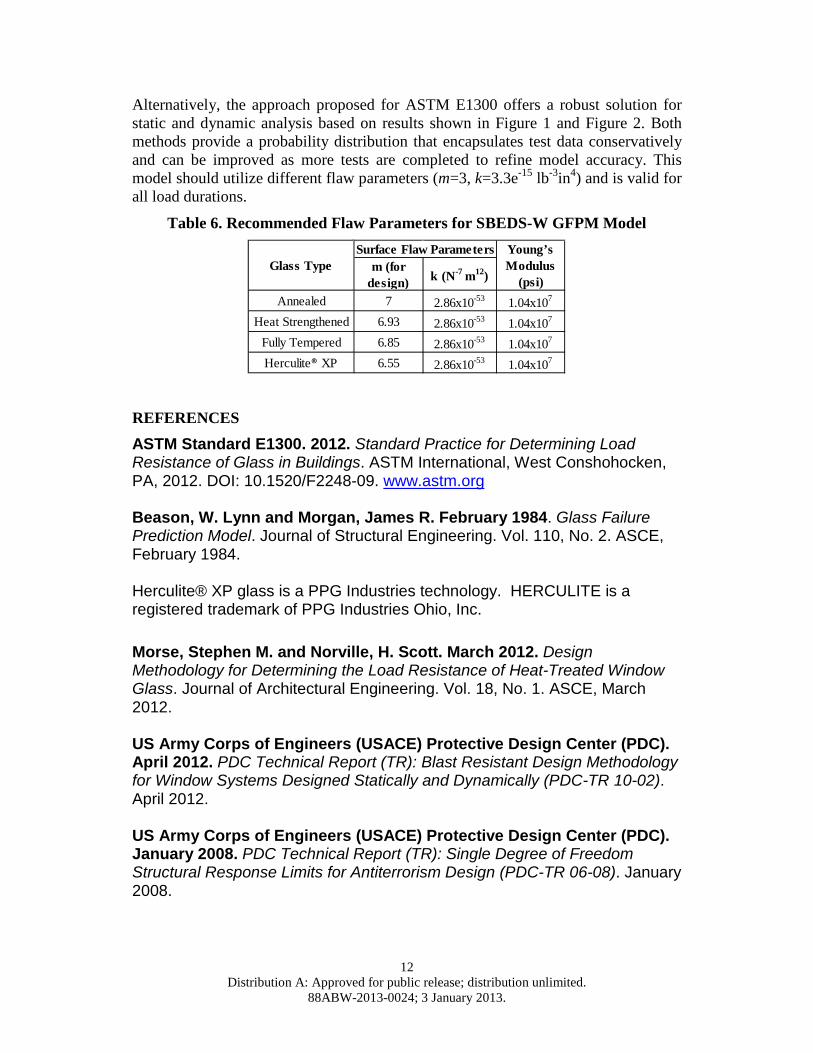
Alternatively, the approach proposed for ASTM E1300 offers a robust solution for static and dynamic analysis based on results shown in Figure 1 and Figure 2. Both methods provide a probability distribution that encapsulates test data conservatively and can be improved as more tests are completed to refine model accuracy. This model should utilize different flaw parameters (m=3, k=3.3e-15 lb-3in4) and is valid for all load durations.
Table 6. Recommended Flaw Parameters for SBEDS-W GFPM Model
REFERENCES ASTM Standard E1300. 2012. Standard Practice for Determining Load Resistance of Glass in Buildings. ASTM International, West Conshohocken, PA, 2012. DOI: 10.1520/F2248-09. www.astm.org Beason, W. Lynn and Morgan, James R. February 1984. Glass Failure Prediction Model. Journal of Structural Engineering. Vol. 110, No. 2. ASCE, February 1984. Herculite® XP glass is a PPG Industries technology. HERCULITE is a registered trademark of PPG Industries Ohio, Inc. Morse, Stephen M. and Norville, H. Scott. March 2012. Design Methodology for Determining the Load Resistance of Heat-Treated Window Glass. Journal of Architectural Engineering. Vol. 18, No. 1. ASCE, March 2012. US Army Corps of Engineers (USACE) Protective Design Center (PDC). April 2012. PDC Technical Report (TR): Blast Resistant Design Methodology for Window Systems Designed Statically and Dynamically (PDC-TR 10-02). April 2012. US Army Corps of Engineers (USACE) Protective Design Center (PDC). January 2008. PDC Technical Report (TR): Single Degree of Freedom Structural Response Limits for Antiterrorism Design (PDC-TR 06-08). January 2008.
AnnealedHeat Strengthened
Fully TemperedHerculite® XP
Glass Type
m (for
design) k (N-7 m12)
7 2.86x10-53 1.04x10⁷
6.93 2.86x10-53 1.04x10⁷
6.85 2.86x10-53 1.04x10⁷
6.55 2.86x10-53 1.04x10⁷
Surface Flaw Parameters
Young’s Modulus
(psi)

13 Distribution A: Approved for public release; distribution unlimited.
88ABW-2013-0024; 3 January 2013.
US Army Corps of Engineers (USACE) Protective Design Center (PDC). In Publication. Single Degree of Freedom Blast Effects Design Spreadsheet for Windows Version 1.0 (SBEDS-W). In Publication. Vallabahn, C. V. G. and Wang, B. Y-T. June 1981. Nonlinear Analysis of Rectangular Glass Plates by Finite Difference Method. Institute for Disaster Research, Texas Tech University. Lubbock, Texas: June 1981.

High Strength Glass Testing and Model Validation for Static
and Dynamic Loading Ryan Alberson, P.E. Carrie Davis, P.E.
Kirk Marchand, P.E.
ASCE Structures Congress May 3, 2013

Project Goals
Annealed
Heat Strengthened
Fully Tempered
Herculite® XP
2 of 13
Does Herculite® XP glass offer performance improvements over traditional glass and how can we put it in engineer’s hands?

0
2
4
6
8
10
12
14
0.0 0.5 1.0 1.5 2.0 2.5
Res
istan
ce (p
si)
Net Midspan Deflection (in.)
Test 1
Test 2
Test 3
Test 4
Test 5
Test 6
Test 7
Test 8
1/4-in
1/8-in
5/32-in
3/16-in
Quasi-Static Test Results
Herculite® XP
Annealed
4 of 13
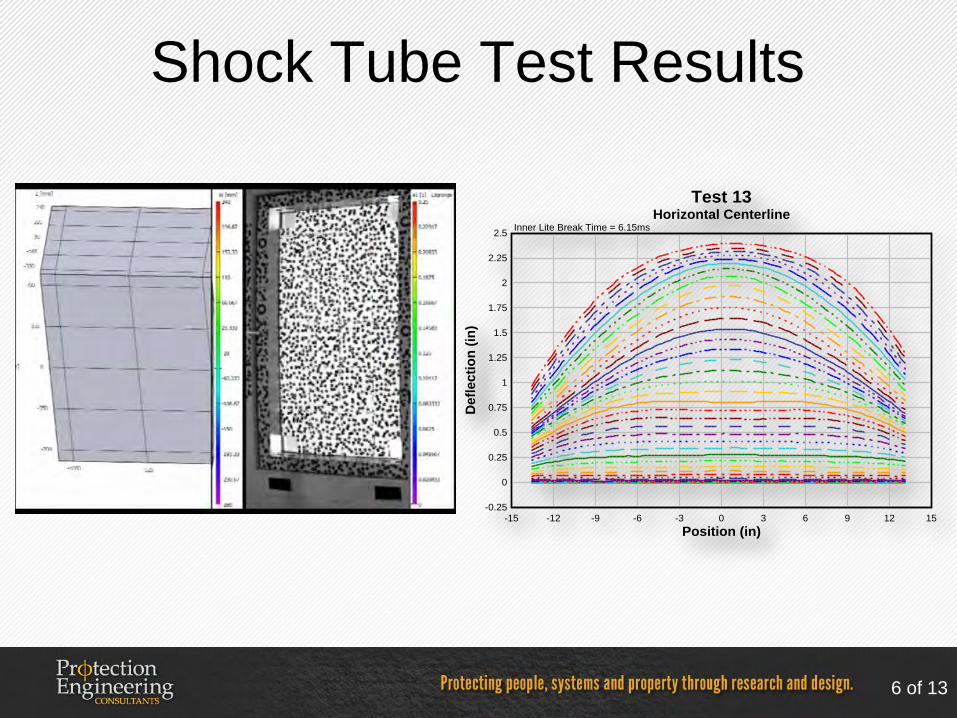
Shock Tube Test Results
Position (in)
Def
lect
ion
(in)
Test 13Horizontal Centerline
-15 -12 -9 -6 -3 0 3 6 9 12 15-0.25
0
0.25
0.5
0.75
1
1.25
1.5
1.75
2
2.25
2.5 Inner Lite Break Time = 6.15ms
6 of 13

Model Validation
• Glass Dimensions – Width = 34 in. – Height = 60 in. – Thickness = 0.220 in.
• Two GFPM implementations with modifications to handle high strength glass
– SBEDS-W • Applies a strength factor increase
internally
– RCSS
Pressure (psi)
Prob
abili
ty o
f Fai
lure
0 1 2 3 4 5 6 7 8 9 10 11 12 13 14 15 16 17 18 19 200
0.1
0.2
0.3
0.4
0.5
0.6
0.7
0.8
0.9
1
RCSS (m=7, k=1.365e-29)RCSS (m=3, k= 3.3e-15)SBEDS-W (m=6.55)New TestsOld Tests
Static Test
8 of 13
Pressure (psi)
Prob
abili
ty o
f Fai
lure
0 2 4 6 8 10 12 14 16 18 20 220
0.1
0.2
0.3
0.4
0.5
0.6
0.7
0.8
0.9
1
RCSS (m=7, k=1.365e-29)RCSS (m=3 k=3.3e-15)SBEDS-W (m=6.55)New Tests
Dynam
ic Test

Overall Glass Performance
• Performs well when subjected to blast loads
• High strength before fracture
• Fails into small fragments
Test 1 - Bay 1 Test 1 - Bay 3
12 of 13

Conclusions
13 of 13
Herculite® XP is 10x stronger than AN glass

14