high-temporal-resolution capabilities of the national ... · high-temporal-resolution capabilities...
TRANSCRIPT

High-Temporal-Resolution Capabilities of the National Weather RadarTestbed Phased-Array Radar
PAMELA L. HEINSELMAN
NOAA/OAR/National Severe Storms Laboratory, Norman, Oklahoma
SEBASTIAN M. TORRES
Cooperative Institute for Mesoscale Meteorological Studies, University of Oklahoma, and NOAA/OAR/National
Severe Storms Laboratory, Norman, Oklahoma
(Manuscript received 24 June 2010, in final form 27 August 2010)
ABSTRACT
Since 2007 the advancement of the National Weather Radar Testbed Phased-Array Radar (NWRT PAR)
hardware and software capabilities has been supporting the implementation of high-temporal-resolution
(;1 min) sampling. To achieve the increase in computational power and data archiving needs required for
high-temporal-resolution sampling, the signal processor was upgraded to a scalable, Linux-based cluster with
a distributed computing architecture. The development of electronic adaptive scanning, which can reduce
update times by focusing data collection on significant weather, became possible through functionality added
to the radar control interface and real-time controller. Signal processing techniques were implemented to
address data quality issues, such as artifact removal and range-and-velocity ambiguity mitigation, absent from
the NWRT PAR at its installation. The hardware and software advancements described above have made
possible the development of conventional and electronic scanning capabilities that achieve high-temporal-
resolution sampling. Those scanning capabilities are sector- and elevation-prioritized scanning, beam mul-
tiplexing, and electronic adaptive scanning. Each of these capabilities and related sampling trade-offs are
explained and demonstrated through short case studies.
1. Introduction
The need for high-temporal-resolution data (;1 min) to
improve the depiction, understanding, and warning of
hazardous weather phenomena has been understood for
some time (e.g., Miller and Kropfli 1980; Carbone et al.
1985) and continues to drive radar research and demon-
stration initiatives (e.g., Wilson et al. 1984; Lin et al. 1986;
Qiu and Xu 1996; Wurman 2002; Bluestein and Wakimoto
2003; Zrnic et al. 2007; Heinselman et al. 2008; Bluestein
et al. 2010; Kumjian et al. 2010; Yussouf and Stensrud
2010). For example, in 2010 the second Verification of the
Origin of Rotation in Tornadoes Experiment (VORTEX2)
used short-wavelength (3 and 5 cm) mobile radars to col-
lect rapid-scan data to improve our understanding of tor-
nadogenesis (information online at http://www.vortex2.
org). In another research initiative, the Center for
Collaborative Adapting Sensing of the Atmosphere
(CASA) has been investigating the use of distributed
collaborative adaptive sensing to produce rapid-scan, low-
altitude sampling of storms with a network of four low-
power, short-wavelength (3 cm), mechanically scanning
radars (Junyent et al. 2010; McLaughlin et al. 2009).
Since May 2004, scientists at the National Severe
Storms Laboratory (NSSL) have been exploring the high-
temporal-resolution weather scanning capabilities of an
S-band (9.38 cm), agile-beam, phased-array radar system.
Located in Norman, Oklahoma, this system is referred
to as the National Weather Radar Testbed Phased-Array
Radar (NWRT PAR). The system is part of the broader
multifunction phased-array radar (MPAR) initiative that
is investigating the use of a single radar system to perform
both weather and aircraft surveillance functions (Weber
et al. 2007; National Academies 2008). Interested readers
may refer to Zrnic et al. (2007) for a detailed, technical
description of the NWRT PAR.
Corresponding author address: Dr. Pamela L. Heinselman, 120
David L. Boren Blvd., Norman, OK 73072.
E-mail: [email protected]
MARCH 2011 H E I N S E L M A N A N D T O R R E S 579
DOI: 10.1175/2010JAMC2588.1
� 2011 American Meteorological Society

Briefly, the NWRT PAR exploits a passive, 4352-
element phased-array antenna to provide stationary, two-
dimensional electronic scanning of weather echoes within
a given 908 azimuthal sector. The antenna is mounted on
a turntable to allow focused data collection in the di-
rection of greatest meteorological interest. The two-way,
6-dB antenna beamwidth is 1.68 at boresight (i.e., per-
pendicular to the array plane) and gradually increases
to 2.38 at 6458 from boresight. The peak transmitted
power is 750 kW and the range resolution provided by
this system is 240 m. In some aspects, such as beamwidth
and sensitivity, the NWRT PAR is inferior compared
to operational radars such as the Weather Surveillance
Radar-1988 Doppler (WSR-88D). However, the pur-
pose of this system is not to achieve operational-like
performance or to serve as a prototype for the MPAR,
but to demonstrate the operational utility of some of
the unique capabilities offered by PAR technology that
may eventually drive the design of future operational
weather radars.
A key capability of PAR technology is high-temporal
resolution sampling that can be achieved through many
methods. As illustrated in Heinselman et al. (2008), data
collection with the NWRT PAR over a 908 sector, rather
than over a typical 3608 sector, produces faster updates
than would otherwise be possible. Because a future op-
erational system would likely have a multipanel design
that samples a full 3608 sector, the NWRT PAR dem-
onstrates this design-driven rapid-scan capability. More-
over, the NWRT PAR’s electronic beam steering allows
the development of unique sampling techniques like
beam multiplexing (Yu et al. 2007) and weather-focused
electronic adaptive scanning that can further reduce sam-
pling time.
The purpose of this paper is fourfold: 1) to document
the advancement of NWRT PAR hardware and soft-
ware capabilities that support high-temporal-resolution
sampling of weather, 2) to provide an analysis of the
trade-offs involved in the design of rapid-scanning strat-
egies, 3) to describe the weather-focused adaptive scan-
ning technique currently implemented on the NWRT
PAR, and 4) to illustrate examples of high-temporal
sampling employed by this unique radar system. Al-
though most of the trade-off analysis can be extended
to other radar systems, the focus of this work is on the
NWRT PAR.
2. NWRT PAR upgrades
Significant hardware and software upgrades have been
and are needed to support the NWRT mission as a dem-
onstrator system for the MPAR concept. Since 2007,
scientists and engineers at NSSL have been improving
the functionality and capabilities of the NWRT PAR.
These upgrades are summarized next.
a. Hardware upgrades
Soon after deployment of the NWRT PAR, it became
apparent that proposed increasing needs for computa-
tional power and archiving of time series and meteoro-
logical data were unsustainable with the original signal
processing hardware. Accordingly, the radar signal pro-
cessor was upgraded from a discontinued, proprietary
cluster of multiprocessor boards manufactured by SKY
Computers, Inc., to a Linux-based cluster of multiple
dual-processor, dual-core nodes that communicate via a
high-speed interconnect (Forsyth et al. 2007). The ar-
chitecture of the new signal processor is based on dis-
tributed computing. That is, all nodes in the cluster work
toward the common goal of real-time radar signal pro-
cessing. The system is designed to optimally utilize the
nodes (i.e., computational resources). Specifically, a load-
balancing mechanism, in which nodes compete to read
and process sets of radar data, tailors the data distri-
bution to each node at a rate according to their capa-
bilities. In this way, the system’s scalability is facilitated
by allowing a hybrid mixture of nodes in the cluster. The
signal processor cluster is complemented by a 12-TB re-
dundant storage system [Redundant Array of Independent
Disks (RAID)] that supports simultaneous, continuous
recording of time series and meteorological quantities
(i.e., reflectivity, Doppler velocity, and spectrum width)
for about 175 h.
b. Software upgrades
The deployment of the new signal processing hard-
ware marked the beginning of a series of software up-
grades. Using a path of continuous upgrades with an
average of two releases every year, we have been grad-
ually incorporating new and improved functionality to
the NWRT PAR. The need for software and signal pro-
cessing improvements is twofold. On one hand, it is de-
sirable that the NWRT PAR produces operational-like
data with quality comparable to that of the WSR-88D.
High data quality leads to better data interpretation and
is conducive to the development of automatic algorithms.
On the other hand, improvements are needed to dem-
onstrate new capabilities, some of which are applicable to
conventional and phased-array radars, and some that are
unique or better suited to PAR technology. For example,
the use of adaptive scanning strategies to perform focused
observations of the atmosphere is not unique to PAR
(e.g., Chrisman 2009), but update times can be greatly
reduced by using PAR’s electronic beam-steering capa-
bilities to scan individual storms of interest as opposed to
580 J O U R N A L O F A P P L I E D M E T E O R O L O G Y A N D C L I M A T O L O G Y VOLUME 50
having to overcome the mechanical inertia inherent to
reflector antennas.
1) INFRASTRUCTURE UPGRADES
The software infrastructure was drastically revamped
to support the implementation of new functionality in
three major areas: the distributed computing environ-
ment, the user interface, and the real-time controller. The
message-based, signal processing-cluster infrastructure
was modeled after the Next Generation Weather Radar
(NEXRAD) Open Radar Product Generation design
(Jain et al. 1997). This type of design allows for the
seamless integration of nodes in the cluster, and provides
the required computational power to implement tradi-
tional as well as advanced signal processing techniques.
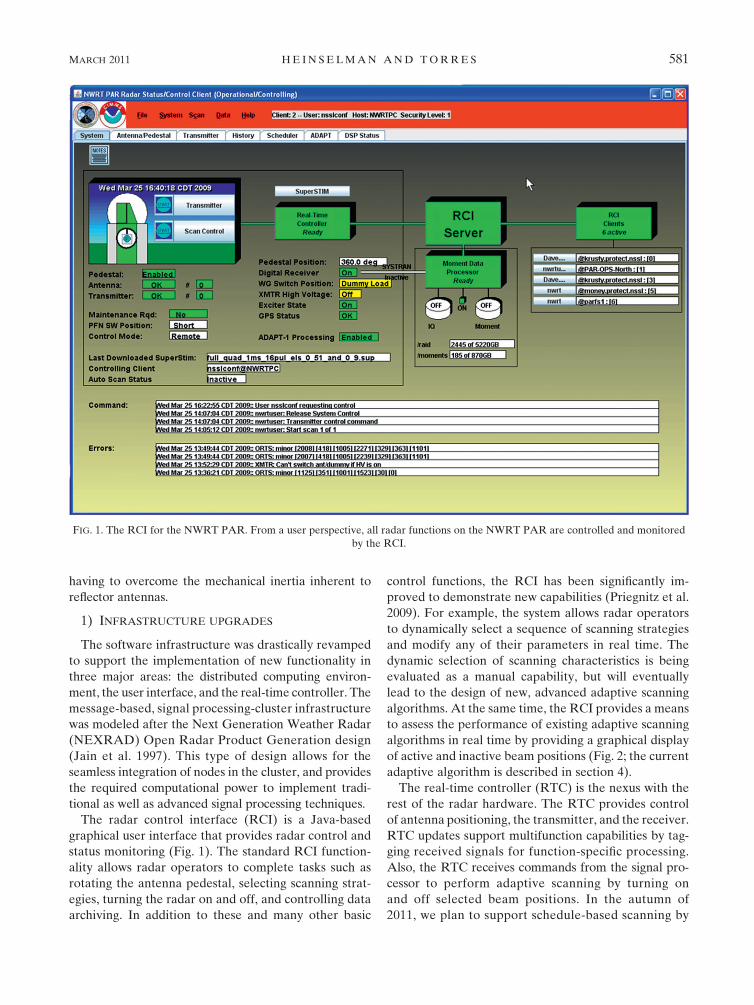
The radar control interface (RCI) is a Java-based
graphical user interface that provides radar control and
status monitoring (Fig. 1). The standard RCI function-
ality allows radar operators to complete tasks such as
rotating the antenna pedestal, selecting scanning strat-
egies, turning the radar on and off, and controlling data
archiving. In addition to these and many other basic
control functions, the RCI has been significantly im-
proved to demonstrate new capabilities (Priegnitz et al.
2009). For example, the system allows radar operators
to dynamically select a sequence of scanning strategies
and modify any of their parameters in real time. The
dynamic selection of scanning characteristics is being
evaluated as a manual capability, but will eventually
lead to the design of new, advanced adaptive scanning
algorithms. At the same time, the RCI provides a means
to assess the performance of existing adaptive scanning
algorithms in real time by providing a graphical display
of active and inactive beam positions (Fig. 2; the current
adaptive algorithm is described in section 4).
The real-time controller (RTC) is the nexus with the
rest of the radar hardware. The RTC provides control
of antenna positioning, the transmitter, and the receiver.
RTC updates support multifunction capabilities by tag-
ging received signals for function-specific processing.
Also, the RTC receives commands from the signal pro-
cessor to perform adaptive scanning by turning on
and off selected beam positions. In the autumn of
2011, we plan to support schedule-based scanning by
FIG. 1. The RCI for the NWRT PAR. From a user perspective, all radar functions on the NWRT PAR are controlled and monitored
by the RCI.
MARCH 2011 H E I N S E L M A N A N D T O R R E S 581

removing the scan-processing functionality from the
RTC and providing scan information directly from the
signal processor. This will allow better real-time control of
scanning strategies driven by an automatic scheduling
algorithm and will therefore enable more advanced
adaptive scanning schemes.
Improvements to the archiving function were also
needed to support the recording and playback capabil-
ities necessary in a research and development environ-
ment. The playback function is routinely used to evaluate
the performance of signal processing techniques and fine-
tune algorithm parameters. Also, because the system is
in constant evolution, playback is often used to reprocess
time series data with the latest capabilities and obtain the
best possible quality of the meteorological data. Moreover,
the recording and playback functions are key components
of the yearly spring experiments conducted at the NWRT
(Heinselman et al. 2009) as they allow participants to
work ‘‘on demand’’ with a diverse set of weather situ-
ations from our archive.
2) SIGNAL PROCESSING UPGRADES
Signal processing enhancements are a fundamental
part of the NWRT PAR upgrades with both traditional
and advanced signal processing techniques being imple-
mented and tested in a pseudo-operational environment.
Traditional signal processing techniques are exploited to
achieve performance similar to that of WSR-88Ds. This
facilitates data analyses and comparisons with existing
operational data. Additionally, we are able to transition
our latest research into the NWRT PAR in the form of
advanced signal processing techniques.
To support the evolutionary nature of the signal pro-
cessing capabilities on the NWRT PAR, we designed
a flexible and expandable architecture based on ‘‘pro-
cessing modes.’’ Each processing mode ingests time series
data (i.e., in-phase and quadrature samples) and produces
spectral moment data (i.e., reflectivity, Doppler veloc-
ity, and spectrum width) in fundamentally different ways.
To date, the system supports five processing modes: three
modes operate in the time domain and two in the fre-
quency domain. Processing modes are data-driven sig-
nal processing pipelines (i.e., sequences of processing
blocks) that can be controlled with a set of ‘‘processing
options.’’ These are user-defined, editable control flags
and parameters for the processing blocks that compose
a processing mode.
Signal processing techniques address needs in four
major areas: calibration, artifact removal, range-and-
velocity ambiguity mitigation, and data accuracy. As of
December 2009, the system runs a few automatic cali-
bration routines such as noise power and direct-current
(DC) bias measurements. Reflectivity calibration is per-
formed offline at boresight and adjusted in real time for
off-boresight beam positions (Zhang et al. 2008). Time
series data are filtered to mitigate contamination from
FIG. 2. Depiction of ADAPTS’s real-time performance at the NWRT PAR user interface. Beam positions on an azimuth-by-elevation
plane are color coded as follows: white beam positions are inactive, green beam positions are active based on elevation and coverage
criteria, and orange beam positions are active based on the neighborhood criterion.
582 J O U R N A L O F A P P L I E D M E T E O R O L O G Y A N D C L I M A T O L O G Y VOLUME 50

radio-frequency interference, strong point targets such
as airplanes, and stationary returns from the ground
such as buildings and trees. Ground clutter detection
and filtering is done automatically in real time and the
filter’s suppression is adjusted based on the strength of
the contamination (Warde and Torres 2009). To miti-
gate range and velocity ambiguities (Doviak and Zrnic
2006), the signal processor can ingest multiple-pulse-
repetition-time (PRT) data such as ‘‘batch’’ or staggered
PRT (Torres et al. 2004). In addition, the accuracy of
meteorological data can be improved by using range
oversampling techniques (Torres and Zrnic 2003) or
beam multiplexing (Yu et al. 2007).
3. Design of scanning strategies for theNWRT PAR
Pulsed weather radars continuously sample the atmo-
sphere in three dimensions, and scanning strategies are
used to control how this sampling occurs. The effective
design of scanning strategies involves tailoring spatial
sampling and data acquisition parameters for a specific
need or particular meteorological situation. Herein, we
discuss the considerations and trade-offs involved in
the design of scanning strategies. Although most of this
analysis can be extended to other radar systems, the fo-
cus is on the NWRT PAR.
Spatial sampling occurs on a volumetric grid defined
on spherical coordinates: range, azimuth, and elevation.
The grid spacing in range is controlled by the sampling
period of echoes at the radar receiver, and grid spacing
is usually chosen to match the depth of the radar’s res-
olution volume to produce independent estimates of
meteorological variables along the beam (Doviak and
Zrnic 2006). However, oversampling in range can be
used to reduce the uncertainty of weather data without
increasing update times (Torres and Zrnic 2003). In the
NWRT PAR, typical range spacing is 240 m, though the
system can oversample by factors of 4, 8, or 16. The main
trade-off associated with range oversampling is related
to the data throughput and computational complexity
that are required with finer sampling. On the other hand,
sampling in azimuth and elevation determines the num-
ber of beam positions in the scanning strategy and leads
to more fundamental trade-offs discussed next.
The scan update time (UT) is defined as the time to
complete the execution of a scanning strategy and can be
computed as
UT 5�BP
i51DT
i, (1)
where BP is the number of beam positions in the scan-
ning strategy and DTi is the dwell time corresponding
to the ith beam position. This equation shows that the
scan update time is directly proportional to the number
of antenna beam positions in the scanning strategy,
which, in turn, is dictated by the sampling in azimuth and
elevation.
The azimuthal sampling is usually set to match the
antenna beamwidth so that complete coverage can be
obtained with the minimum number of beam positions.
Nevertheless, oversampling (i.e., overlapped beams) can
be used advantageously once again, in this case, to im-
prove observations of small-scale features at long ranges
such as with super-resolution on the NEXRAD network
(Brown et al. 2002; Torres and Curtis 2007). Because the
NWRT PAR’s antenna is stationary during data collec-
tion, the beam-smearing effect from continuously rotat-
ing antennas is absent. The azimuthal beam resolution
with electronic beam steering is solely determined by
the antenna beam pattern. The combination of finer az-
imuthal sampling and the absence of beam smearing can
provide improved observations of reflectivity and veloc-
ity magnitude, and as a result enhanced depictions of
storm structure. The number of beam positions in the
azimuth is determined by the extent of coverage and
the desired sampling resolution. In the NWRT PAR, the
size of the azimuthal sector is limited by electronic beam
steering to 6458 relative to the boresight.
The required vertical resolution and extent of cover-
age determines the sampling in elevation. Usually finer
vertical resolution is desired closer to the ground, but
due to the inherent coordinate system or the radar sam-
pling grid, vertical resolution varies as a function of
range. Storm tops and their range may be used to de-
termine the highest elevation angle of beam positions
needed to sample an entire storm. As such, nearby
storms would require larger elevation spans and vice
versa. In the NWRT PAR, elevation angles can range
from 0.58 to 608.
In addition to being dependent on the number of beam
positions, the scan update time is directly proportional
to the dwell times defined by the scanning strategy. The
dwell time is the time spent at a given beam position;
it depends on the waveform, PRT(s), and desired num-
ber of samples (pulses). In the NWRT PAR, available
waveforms are uniform PRT, batch PRT, staggered
PRT, and beam multiplexing (BMX). The PRT controls
the maximum unambiguous range and velocity, but dif-
ferent waveforms, such as staggered PRT, can be used
to mitigate ambiguities (e.g., Torres et al. 2004). In the
NWRT PAR, the PRT can range from 0.8 to 3.2 ms.
Dwell times can be reduced by reducing the PRT(s) or
the number of samples. Reducing the PRT may increase
the likelihood of overlaid echoes, and reducing the num-
ber of samples can affect the performance of some signal
MARCH 2011 H E I N S E L M A N A N D T O R R E S 583
processing techniques, such as ground clutter filtering,
which require a minimum number of samples for ade-
quate suppression. In general, short dwell times result in
reduced data quality. Nevertheless, there are techniques
that can be used to reduce dwell times without sacrific-
ing data quality. For example, range oversampling tech-
niques (Torres and Zrnic 2003) use faster sampling rates
at the radar receiver so that more samples are acquired
in range without increasing the dwell times; range sam-
ples collected in this way can be decorrelated and used
to reduce the variance of estimates via averaging. Con-
versely, dwell times can be increased without increasing
the update time. Beam multiplexing (Yu et al. 2007)
exploits beam agility to ‘‘multitask’’ by interlacing the
sampling of multiple beam positions, which leads to lon-
ger dwell times without increasing the overall scan update
time.
In summary, the scan update time can be reduced by
reducing either the number of beam positions or dwell
times. That is, achieving faster data updates leads to a
trade-off between spatial resolution and data quality.
Examples of trade-offs
The concept of designing custom scanning strategies
is not unique to PAR-based systems. For instance, the
NEXRAD network uses precipitation and clear-air scan-
ning strategies with different trade-offs (NOAA 2006, 5-
1–5-8); three examples follow. Precipitation volume
coverage pattern (VCP) 21 comprises nine elevation tilts
(0.58–19.58) and employs long dwell times resulting in
a 6-min scan update. This scanning strategy trades im-
proved data quality for longer update times and coarser
vertical sampling. Precipitation VCP 12 comprises 14
tilts (0.58–19.58) and employs short dwell times result-
ing in a ;4-min scan update. This strategy trades faster
updates and denser vertical sampling at the lower tilts
for reduced data quality (higher variance of esti-
mates). Clear-air VCP 31 comprises five tilts (0.58–
4.58) and employs long dwell times with a 10-min scan
update. This strategy trades improved detection and
better data quality for longer update times and limited
vertical sampling.
Similarly, for NWRT PAR we have adopted
phenomenon-specific scanning strategies. These achieve
the best trade-offs for a particular situation. Improved
spatial resolution is achieved with scanning strategies
employing higher-resolution vertical and/or azimuthal
sampling. Unique to the PAR is that the inherent beam
broadening that occurs as the beam is electronically steered
away from boresight can be exploited to reduce the num-
ber of beam positions and obtain faster updates (e.g., to
completely cover a 908 sector, only 55 nonoverlapping
radials are needed).
For improved temporal resolution there are different
options. BMX can be exploited to produce data with
lower variance and faster updates. Yu et al. (2007) re-
port it is possible to reduce the scan time by a factor of
2–4 without an increase in the variance of estimates at
high signal-to-noise ratios. The trade-off is one of data
quality since effective ground clutter filters that are com-
patible with the nonuniform signal sampling of BMX
do not exist. This trade-off may be acceptable when
weather is located outside of the area contaminated by
ground clutter. As another option for improved tem-
poral resolution, more frequent updates for the lowest
tilt are achievable by adding a low-elevation scan half-
way through the scanning strategy. This results in good
data quality, but faster updates are only realized at
the lowest tilt and this leads to slightly slower updates
elsewhere. Through elevation-prioritized scanning, dif-
ferent updates at different levels can be achieved. In
general, the fastest updates occur at the lowest tilts for
the best temporal resolution closer to the ground. In-
termediate tilts are updated less frequently, enough to
detect new storm developments with short latency. Fi-
nally, the upper tilts get the slowest updates. Another
way to improve the temporal resolution of the NWRT
PAR without loss in data quality is to scan less than
the full 908. However, new developments outside the
reduced sector are likely to be missed. An optimum
compromise to produce good quality data with faster
updates is to employ adaptive scanning techniques that
automatically focus data collection on smaller areas of
interest at the same time that periodic surveillance is
performed to capture new storm developments. This
automatic algorithm is described in the next section.
Though many of these methods for reducing update time
either have been (e.g., Vasiloff et al. 1987; Biggerstaff
et al. 2005; Chrisman 2009; McLaughlin et al. 2009) or can
be implemented on radars with mechanically scanning
antennas, the resulting pedestal inertia and increased
wear and tear associated with faster rotation rates make
them better suited to stationary, electronically steered
antennas.
4. ADAPTS: Adaptive Digital Signal ProcessingAlgorithm for PAR Timely Scans
ADAPTS is a proof-of-concept implementation of
spatially targeted adaptive scanning for the electroni-
cally steered NWRT PAR. Preliminary evaluations of
ADAPTS have shown that the performance improve-
ment with weather-focused adaptive scanning can be
significant compared to conventional scanning strategies,
especially when observing isolated storms as illustrated
in section 5. ADAPTS works by turning ‘‘on’’ or ‘‘off’’
584 J O U R N A L O F A P P L I E D M E T E O R O L O G Y A N D C L I M A T O L O G Y VOLUME 50

individual beam positions within a scanning strategy
based on three criteria. If one or more criteria are met,
the beam position is declared active. Otherwise, the beam
position is declared inactive. Active beam position set-
tings are applied and become valid on the next execution
of a given scanning strategy. Additionally, ADAPTS
periodically completes a complete volumetric surveil-
lance scan, which is used to redetermine where weather
echoes are located. A user-defined parameter controls
the time between full surveillance scans (by default this
is set at 5 min). Following a surveillance scan, data col-
lection continues only on the active beam positions.
A beam position becomes active if one or more of the
following criteria are met: 1) reflectivities along the
beam meet continuity, coverage, and significance condi-
tions; 2) the elevation angle is below a predefined level;
or 3) a ‘‘neighboring’’ beam position is active based on
the first or second criteria. The first criterion uses con-
tinuity, coverage, and significance conditions to make
a quantitative determination of the amount of significant
weather returns at each beam position. Within this con-
text, a beam position is active if it contains (a) a certain
number of consecutive range gates (by default four) with
reflectivities exceeding a threshold (by default 10 dBZ)
and (b) a total areal coverage (by default 1 km2) with
reflectivities exceeding the same threshold (that areal
coverage is computed as the product of the range spac-
ing and the gate width, which depends on the distance
from the radar and the two-way, 6-dB antenna beam-
width). The second criterion provides data collection at
all beam positions for the lowest elevation angles to
monitor low-altitude developments. A user-defined ele-
vation threshold (2.58 by default) controls the lowest
elevation angle where ADAPTS may begin to deactivate
beam positions. The third criterion uses neighboring
beam positions to expand the data collection footprint
to allow for continuous adaptation in response to storm
advection and growth. Nevertheless, new developments
at midlevels may not be immediately sensed, and there-
fore additions to the list of active beam positions may
be delayed until the next full surveillance volume scan.
Neighboring beam positions are defined as those imme-
diately above and below in elevation and two on either
side in azimuth of an active beam position (i.e., there
are a total of six neighbors for each beam position,
unless the scanning domain boundaries are approached).
If no beam positions are defined active above the user-
defined elevation threshold (criterion 2), ADAPTS will
activate all beam positions at the tilt directly above the
elevation threshold.
In its early implementation, ADAPTS only worked
with scanning strategies that had a specific structure.
ADAPTS assumed that there was only one plan position
indicator (PPI) scanning strategy that repeated contin-
uously. The algorithm also expected that all tilts were in
ascending elevation order, and all used the same beam
position azimuths with a minimum azimuthal spacing of
0.58 (i.e., the maximum number of beam positions for all
elevations is 180). These limitations were removed with
the next upgrade cycle during spring of 2010.
Users at the RCI can monitor the performance of the
ADAPTS algorithm by looking at a graphical display of
active beam positions (Fig. 2). Beam positions are color
coded as follows: white beam positions are inactive, and
green and yellow beam positions are active. Green beam
positions meet the first and second detection criteria,
whereas yellow beam positions correspond to the neigh-
bor footprint extension (third criterion). The display up-
dates every second and highlights in red the ‘‘current’’
beam position.
5. High-temporal sampling with the NWRT PAR
One of the key advantages of the NWRT PAR is the
capability to produce the higher-temporal-resolution
data desired by National Weather Service (NWS) fore-
casters (e.g., Steadham 2008), broadcast meteorologists
in the southern plains (LaDue et al. 2010), and several
government agencies (OFCM 2006, 9–21). Multipanel
designs typical of PAR systems reduce the sampling
time by having each panel scan only part of a 3608
sector (Brookner 1988). This type of design is dem-
onstrated by the 908 sector scanned by the NWRT PAR.
As discussed in section 3, though, depending on the sit-
uation, update time can be traded for spatial resolution
and/or data quality. This section uses case examples to
illustrate some of the sampling techniques employed by
the NWRT PAR for high temporal sampling of storms.
a. Achieving denser spatial sampling
When NEXRAD VCPs are employed by the NWRT
PAR, temporal resolution is improved by a factor of 4
due to the smaller sector size: 908 versus 3608. Sampling
storms with VCPs 11 and 12, for example, results in up-
dates of 1.25 and 1.0 min, respectively. Given this sig-
nificant improvement in temporal sampling, a relevant
research question is: in what situations might it be
worthwhile to slightly reduce the temporal sampling
rate to improve the observations of storm structures?
1) DENSER VERTICAL SAMPLING
To study the advantages of dense vertical sampling, a
scanning strategy with 25 tilts, spaced to provide a verti-
cal overlap of up to one-half beamwidth, was developed
and implemented in spring 2009. Rather than designing
a ‘‘one size fits all’’ scanning strategy, two versions were
MARCH 2011 H E I N S E L M A N A N D T O R R E S 585

developed to better sample the vertical structure of storms
located near and far from the radar (Fig. 3). The near
version extended to 28.58 to provide sampling through
higher heights close to the radar than typical scanning
strategies. In contrast, the far version (radar range $
80 km) extended to only 16.18 to avoid scanning above
storm top height (assumed # 18 km AGL), while pro-
viding even denser vertical sampling than the near scan
(Fig. 3). In both versions the number of samples either
matched or exceeded those of VCP 12 (NOAA 2006),
and the PRTs were chosen to match the maximum ex-
pected range of storms. Slight adjustments to the PRTs
and numbers of samples achieved the same update
time for both versions. Data were collected using a batch
PRT waveform and 18 azimuthal oversampling. This com-
bination of scanning strategy characteristics produced an
update time of ;2 min.
One radar-derived application that could benefit from
dense vertical sampling is storm-top height estimates.
Similar to the echo tops product from the WSR-88D,
in this study storm-top height is defined as the highest
height at which an 18-dBZ or higher reflectivity factor is
sampled. Because uncertainty in storm-top height esti-
mates is related primarily to the spacing between con-
secutive tilts, closer spacing reduces uncertainty. The
impacts of dense vertical sampling on storm top esti-
mates are illustrated in Fig. 4. In this case, a group
of longitudinally oriented storms, located about 100 km
from the NWRT PAR, were sampled at ;0352 UTC
13 May 2009 using the far version of the dense vertical
scanning strategy (Fig. 3). Typically, the upper levels
of storms (in this case 11–15 km MSL) located 100 km
from the radar would be sampled by two elevation an-
gles (28 increment) rather than by four (Fig. 4). If these
two elevation angles were 6.488 and 8.468, storm-top
height estimates would be 14.9 km MSL for storm A and
11.8 km MSL for storms B–E. The dense vertical sampl-
ing better captures variations in storm-top height among
storms A–E (Fig. 4) and reduces the uncertainty of the
estimates. The storm-top heights resulting from denser
vertical sampling are A, 14.9 km; B, 13 km; C, 14 km;
D, 12.6 km; and E, 11.8 km MSL. As mentioned earlier,
the trade-off for dense vertical sampling is longer sam-
pling time (2 versus 1 min).
Though the accuracy of several other radar-derived
quantities may benefit from dense vertical sampling (e.g.,
vertical extent of circulations and high reflectivity cores
or vertically integrated quantities), a more complete ex-
amination of them is beyond the scope of this paper.
2) DENSER AZIMUTHAL SAMPLING
The depiction of velocity signatures with significant
gradients in the azimuthal direction depends strongly
on azimuthal sampling. Similar to super-resolution sam-
pling (Brown et al. 2002), 50% overlapped azimuthal
sampling (0.758–1.058) was employed to improve the
apparent resolution of azimuthal signatures sampled by
the NWRT PAR. Because the beamwidth varies across
the sector, the oversampling is adjusted accordingly. In
this case, the increased number of azimuthal beam po-
sitions (55 without oversampling; 109 with 50% over-
sampling) at all elevations (14) increases the sampling
time of the VCP. These sampling characteristics in-
creased the volumetric sampling time from about 1 min
to approximately 1.4 min.
A key velocity signature that can benefit from high-
resolution azimuthal sampling is the mesocyclone sig-
nature. At 0131:24 UTC 1 May 2009, the NWRT PAR
sampled the center of a mesocyclone signature located
;170 km west-northwest of the NWRT PAR (Fig. 5).
At this location the azimuthal sampling spacing without
oversampling was ;4.63 km, whereas with 50% over-
sampling the azimuthal sampling spacing was ;2.31 km.
To simulate velocity and reflectivity fields without azi-
muthal oversampling, every other radial was removed
from the oversampled data and then plotted for com-
parison. The comparison of the structure of the meso-
cyclone signature in the velocity field, and the structure
of the inflow notch and hook echo in the reflectivity field,
shows that these structures are more poorly resolved
when azimuthal oversampling is not employed (Fig. 5).
b. Achieving further improvements to the temporalsampling via electronic scanning
The improved vertical and azimuthal spatial resolutions
illustrated in Figs. 4 and 5 came at the expense of slightly
slower update times. The remaining subsections describe
three scanning methods that are either only feasible on, or
are best suited for, electronically steered antennas. These
methods can achieve the high-temporal-resolution sam-
pling needed to observe rapid evolution in severe storms.
FIG. 3. The 25 elevation angles that define the near (open circles)
and far versions (filled circles) of the dense vertical scanning strategy.
586 J O U R N A L O F A P P L I E D M E T E O R O L O G Y A N D C L I M A T O L O G Y VOLUME 50

1) BMX AND SECTOR SCANNING
On 19 August 2007, low-top supercells developed in a
tropical environment rarely experienced in Oklahoma,
a few hours prior to the reintensification of Tropical
Cyclone Erin (Arndt et al. 2009). Due to the potential
for tornado development, both high-temporal-resolution
sampling (,1 min) and accurate estimates of radial ve-
locity were desired. This goal was accomplished by im-
plementing a BMX scanning strategy with the same
14 tilts as the NEXRAD VCP 12 (NOAA 2006). Ac-
curate velocity and reflectivity estimates were obtained
by sampling the storm with 64 pulses at all elevations.
Velocity aliasing and update time were minimized by
employing a uniform and lowest available PRT (0.8 ms).
In this case, the uniform PRT was appropriate due to
the lack of storm development beyond 120 km. The
azimuthal sampling spacing of velocity estimates was im-
proved by fixed 0.58 oversampling. Without BMX, these
scanning strategy characteristics would typically produce
132-s volumetric updates over a 908 sector. The imple-
mentation of BMX increased the temporal resolution by
approximately a factor of 2, resulting in 63-s updates.
In the example shown, the update time was reduced
further, from 63 to 43 s, by manually decreasing the
sector size to 608 (Fig. 6). The smaller sector size fo-
cused data collection on a low-top supercell located
;60 km from the NWRT PAR (Fig. 6a). At this radar
range, the height of the 0.58 tilt was 0.8 km MSL and
the spatial distance between azimuthal observations
was 0.52 km.
The 43-s volumetric sampling captured the develop-
ment of a cyclonic velocity couplet at the 0.58 elevation
during 0141:27–0143:36 UTC 19 August 2007 (Fig. 6b).
FIG. 4. Storm-top heights (18-dBZ echo) depicted by dense vertical sampling at ;0352 UTC
13 May 2009. Elevation angles are (a) 8.468, (b) 7.768, (c) 7.108, and (d) 6.488. Letters denote the
tilt at which storm-top height was computed for each storm. Range rings are shown in 50-km
increments.
MARCH 2011 H E I N S E L M A N A N D T O R R E S 587

A damage survey later revealed that about 2 min after
the velocity couplet first appeared on the NWRT PAR
(Fig. 6c), a short-lived (;2 min) tornado occurred that
produced category-1 damage on the enhanced Fujita
(EF) scale along a swath 2.0 km long and 0.036 km wide
(information online at http://ewp.nssl.noaa.gov/projects/
shave/tornsurveys.php#map). During the tornado’s short
lifetime, the maximum measured gate-to-gate azimuthal
velocity difference was 48 m s21. The rapid development
and short-lived nature of this tornado illustrates the need
for high-temporal-resolution data to sample this type of
event. As mentioned previously, a drawback of this scan-
ning strategy is that ground clutter filtering is currently
unavailable for BMX. However, this was not an issue in
this particular case because the storm of interest was lo-
cated beyond the typical clutter field for the NWRT PAR.
2) ELEVATION-PRIORITIZED SCANNING
Elevation-prioritized scanning is designed to provide
the fastest update rate at low-elevation angles and the
slowest update rate at high-elevation angles. In this case,
14 tilts are elevation prioritized to accomplish the fol-
lowing within about 4 min (Fig. 7):
d six updates at the lowest two elevations,d three updates at the next five elevations, andd two updates at the highest six elevations.
Because of the interlaced nature of this scanning
strategy, the temporal sampling rate at a fixed elevation
angle varies. The time intervals between 0.58-elevation
scans, for example, range from 41 to 51 s, with a median
time interval of 43.5 s. The median update times for the
elevation-prioritized scanning strategy are as follows:
the lowest two elevation angles, 43.5 s (0.73 min); the
middle elevation angles, 87 s (1.45 min); and the upper-
elevation angles, 132.5 s (2.2 min).
Like the dense vertical scanning strategy, the elevation-
prioritized scanning strategy has two versions: near and
far. Only the near version is described in detail (Fig. 7)
because the storm in the case example was located within
50 km of the NWRT PAR. Both versions, however, op-
erate similarly with the main difference being the specific
elevation angles and PRTs employed.
The update times result from the number and temporal
ordering of the elevation angles, the PRTs, azimuthal
sampling, and number of pulses. To improve azimuthal
sampling, the elevation-prioritized scanning strategy
implements 50% overlapped azimuthal sampling at all
elevation angles. To further improve detection of tor-
nadic vortex signatures and other hazardous weather
signatures, variance of velocity estimates at the lowest
two tilts is minimized by collecting a relatively large
number of pulses (64). The accuracy of the reflectivity
data is also enhanced by collecting more than the tradi-
tional number of pulses (16) for all surveillance scans. The
higher number of pulses provides less noisy depictions
of hook echoes, bounded weak echo regions, and other
reflectivity signatures associated with potentially severe
convective storms.
On the evening of 13 May 2009 (CDT), a cyclic supercell
moved across Oklahoma City, Oklahoma. Because tor-
nado occurrence was a concern, high-temporal-resolution
FIG. 5. Comparison of (top) reflectivity (dBZ) and (bottom) velocity (m s21) fields at 0.58 elevation with (left) 0%
and (right) 50% azimuthal oversampling. The white circle denotes the mesocyclone circulation.
588 J O U R N A L O F A P P L I E D M E T E O R O L O G Y A N D C L I M A T O L O G Y VOLUME 50

FIG. 6. (a) A 608 sector scan of 0.58-elevation (left) reflectivity (dBZ) and (right) velocity (m s21) fields at
0140:44 UTC 19 Aug 2007. Range rings are in 20-km increments. The white box denotes the location and
scale of the storm whose evolution at the 0.58 tilt is shown (b) prior to and (c) during an EF1-rated tornado.
The white circles enclose the tornadic vortex signature.
MARCH 2011 H E I N S E L M A N A N D T O R R E S 589

sampling, especially at the lower elevations, was desired.
As noted earlier, due to the storm’s proximity to the
NWRT PAR, the supercell was sampled with the near
version of the elevation-prioritized scanning strategy
(Fig. 7), which provided 43.5-s median updates at the
two lowest elevations: 0.58 and 1.58. These data were
collected while the supercell’s hook echo and several
mesocyclone circulations were located within 10–20 km
of the NWRT PAR during 0318:11–0348:26 UTC 14 May
2009.
At 0339:25 UTC, a prominent cyclonic circulation
at 0.58 elevation was sampled with a 0.22-km azimuthal
spacing at a height of 0.5 km MSL (Fig. 8). To track the
intensity of the initial and subsequent circulations, the
FIG. 7. Temporal order of elevation angles in the near version of the elevation-prioritized
scanning strategy. The median temporal resolution is indicated by the colored dots: orange, 43.5 s
(0.73 min); green, 87 s (1.45 min); and blue, 132.5 s (2.2 min).
FIG. 8. A time series of NWRT PAR 0.58-elevation radial velocity data prior to and during the EF0 tornado over Lake Stanley Draper.
The white circles highlight the two significant cyclonic circulations discussed in the text.
590 J O U R N A L O F A P P L I E D M E T E O R O L O G Y A N D C L I M A T O L O G Y VOLUME 50

maximum azimuthal velocity difference within 1 km of
the circulations’ center was computed. Though the ve-
locity difference associated with this first circulation
was 23.5 m s21 at 0339:25 UTC, it rapidly dissipated
within the following 2 min. Within this same time in-
terval, a new circulation developed ;1 km to the north
of the former one (0341:00 UTC; Fig. 8). The initial
velocity difference of this second cyclonic circulation
was 26 m s21 (0341:00 UTC); this intensity was main-
tained or exceeded during the next 5 min.
A comparison of the locations of this velocity sig-
nature with a damage survey (completed by the first
author and L. Lemon, who is affiliated with the Na-
tional Weather Service’s Warning Decision Training
Branch) concluded that a short-lived tornado pro-
ducing EF0 damage occurred during the 0342:24 and
0343:50 UTC volume scans (Fig. 8). During its short
duration, the maximum measured velocity difference
was 31.5 m s21 (0.5 km MSL) at 0343:50 UTC. Within
the tornado’s lifetime, it crossed the marina on the
western shore of Lake Stanley Draper and proceeded
southward across a picnic area, parking lot, and walk-
ing path just east of a small pond, producing an ap-
proximate 0.80-km-long damage path. Once again, the
rapid development and short-lived nature of this tornadic
event illustrates the need for high-temporal-resolution
radar data to detect the occurrence of similar types of
events.
3) ADAPTIVE SCANNING
During 0040:59–0044:03 UTC 1 May 2009, data were
collected on an isolated storm located in Custer County,
Oklahoma (Fig. 9a). The storm developed into a non-
tornadic supercell that, according to a preliminary Storm
Data report, produced up to baseball-sized hailstones
FIG. 9. (a) Three 0.58-elevation reflectivity images illustrating the evolution of areal storm coverage on 1 May 2009.
The green box outlines Custer County in west-central Oklahoma. (b) Time series showing temporal resolution of 102
volume scans collected within 0040:59–0244:03 UTC 1 May 2009. Blank areas within the time series indicate a break
in data collection.
MARCH 2011 H E I N S E L M A N A N D T O R R E S 591
(2.75 in) at approximately 0200 UTC near Stafford,
Oklahoma, in south-central Custer County (information
online at http://www.spc.noaa.gov).
Because the storm was isolated, it was a good candi-
date for demonstrating and evaluating the potential util-
ity of ADAPTS. As described in section 4, a primary goal
of ADAPTS is to reduce scan time by sampling only re-
gions containing weather features of interest, while cap-
turing the growth, decay, and horizontal advection of
existing storms. When ADAPTS is running, full volume
scans are collected at ;5-min intervals, with adaptive
scanning occurring between them.
Because of the storm’s distance from the PAR (150–
200 km) and a desire for rapid updates at all tilts, the
storm was sampled with a far version of a conventional
14-tilt scanning strategy that extended to 15.58. Like sev-
eral of the other scanning strategies, this one employed
50% overlapped azimuthal sampling at all elevations;
the PRTs ranged from 0.8 to 3.104 ms. These sampling
characteristics resulted in approximately 1.4-min updates.
Figure 9b shows the improvement in temporal reso-
lution attained from ADAPTS. The occasional gaps in
the time series indicate loss of data collection owing to
forced reboots of the RCI. The highest improvement
in temporal resolution (0.9 min) occurs early in the
storm’s lifetime: 0040:59–0052:44 UTC. Over the next
hour, volume updates of 1 min or less are maintained
between volume scans (Fig. 9b). Thereafter, Fig. 9b shows
a nearly linear increase in sampling time between 5-min
intervals, which directly corresponds to an increase in
the number of active beam positions. The contributing
factors to the increase in active beam positions were an
increase in the number of storms sampled and the hori-
zontal (Fig. 9a) and vertical (not shown) storm growth as
the storms advanced toward the NWRT PAR.
6. Conclusions
Under the umbrella of the multifunction phased-array
radar (MPAR) initiative, scientists at the National Se-
vere Storms Laboratory have been demonstrating unique
PAR capabilities for weather observations in a multi-
function environment. The focus of this work was the
capability to observe weather phenomena with high tem-
poral resolution. In addition to describing the engineer-
ing and software upgrades required to develop advanced
scanning strategies for weather observations, we dis-
cussed the trade-offs that exist when designing scanning
strategies that attempt to balance the need for faster
updates with requirements for coverage and data qual-
ity. We presented examples of scanning strategies that
trade update time for coverage and/or data quality and
illustrated each of these with case data. The examples
show that having phenomenon-based, adaptive scanning
strategies is essential to fully capitalize on the benefits of
PAR technology.
Although a comprehensive study of the improve-
ments resulting from high temporal sampling of weather
phenomena was beyond the scope of this study, it was
demonstrated that PAR technology can be exploited to
achieve results that are unfeasible with current opera-
tional technology. Nonetheless, more research is needed
to translate these improvements into concrete, measur-
able, and meaningful service improvements for the Na-
tional Weather Service. As such, researchers working
with the NWRT PAR will continue to explore and
demonstrate new capabilities to address twenty-first-
century weather forecasting and warning needs.
Acknowledgments. The authors are grateful for the
data collection efforts of NSSL staff and graduate stu-
dents at the University of Oklahoma’s School of Mete-
orology. They also thank NSSL radar and software
engineers Ric Adams, Chris Curtis, Eddie Forren, Igor
Ivic, David Priegnitz, John Thompson, and David Warde
for advances in data quality and radar functionality that
made this research possible. We also appreciate the tech-
nical expertise of Kurt Hondl and Valliappa Lakshmanan
in the display of phased-array radar data. This manuscript
benefited from reviews by Rodger Brown, Dick Doviak,
and Dusan Zrnic, and was prepared with funding pro-
vided by NOAA/Office of Oceanic and Atmospheric
Research under NOAA–University of Oklahoma Co-
operative Agreement NA17RJ1227, U.S. Department of
Commerce. The statements, findings, conclusions, and
recommendations are those of the author(s) and do not
necessarily reflect the views of NOAA or the Department
of Commerce.
REFERENCES
Arndt, D. S., J. B. Basara, R. A. McPherson, B. G. Illston,
G. D. McManus, and D. B. Demko, 2009: Observations of the
overland reintensification of Tropical Storm Erin (2007). Bull.
Amer. Meteor. Soc., 90, 1079–1093.
Biggerstaff, M. I., and Coauthors, 2005: The Shared Mobile At-
mospheric Research and Teaching Radar: A collaboration to
enhance research and teaching. Bull. Amer. Meteor. Soc., 86,
1263–1274.
Bluestein, H. B., and R. M. Wakimoto, 2003: Mobile radar obser-
vations of severe convective storms. Radar and Atmospheric
Science: A Collection of Essays in Honor of David Atlas,
Meteor. Monogr., No. 52, Amer. Meteor. Soc., 105–138.
——, M. M. French, I. PopStefanija, R. T. Bluth, and J. B. Knorr,
2010: A mobile, phased-array Doppler radar for the study
of severe convective storms. Bull. Amer. Meteor. Soc., 91,579–600.
Brookner, E., 1988: Aspects of Modern Radar. Artech House,
574 pp.
592 J O U R N A L O F A P P L I E D M E T E O R O L O G Y A N D C L I M A T O L O G Y VOLUME 50

Brown, R. A., V. T. Wood, and D. Sirmans, 2002: Improved tor-
nado detection using simulated and actual WSR-88D data with
enhanced resolution. J. Atmos. Oceanic Technol., 19, 1759–1771.
Carbone, R. E., M. J. Carpenter, and C. D. Burghart, 1985: Doppler
radar sampling limitations in convective storms. J. Atmos.
Oceanic Technol., 2, 357–361.
Chrisman, J. N., 2009: Automated Volume Scan Evaluation and
Termination (AVSET): A simple technique to achieve faster
volume scan updates for the WSR-88D. Preprints, 34th Conf.
on Radar Meteorology, Williamsburg, VA, Amer. Meteor. Soc.,
P4.4. [Available online at http://ams.confex.com/ams/pdfpapers/
155324.pdf.]
Doviak, R., and D. Zrnic, 2006: Doppler Radar and Weather Ob-
servations. 2nd ed. Academic Press, 562 pp.
Forsyth, D., and Coauthors, 2007: Update on the National Weather
Radar Testbed (phased array). Preprints, 33rd Conf. on Radar
Meteorology, Cairns, QLD, Australia, Amer. Meteor. Soc., 7.4.
[Available online at http://ams.confex.com/ams/pdfpapers/
119631.pdf.]
Heinselman, P. L., D. L. Priegnitz, K. L. Manross, T. M. Smith, and
R. W. Adams, 2008: Rapid sampling of severe storms by the
National Weather Radar Testbed Phased Array Radar. Wea.
Forecasting, 23, 808–824.
——, and Coauthors, 2009: Phased array radar innovative sensing
experiment. Preprints, 34th Conf. on Radar Meteorology,
Williamsburg, VA, Amer. Meteor. Soc., P6.5A. [Available
online at http://ams.confex.com/ams/pdfpapers/155589.pdf.]
Jain, M., Z. Jing, A. Zahrai, A. Dodson, H. Burcham, D. Priegnitz,
and S. Smith, 1997: Software architecture of the Nexrad open
systems Radar Product Generator (RPG). Preprints, 13th Int.
Conf. on Interactive Information and Processing Systems for
Meteorology, Oceanography, and Hydrology, Long Beach,
CA, Amer. Meteor. Soc., 238–241.
Junyent, F., V. Chandrasekar, D. McLaughlin, E. Insanic, and
N. Bharadwaj, 2010: The CASA Integrated Project 1 net-
worked radar system. J. Atmos. Oceanic Technol., 27, 61–78.
Kumjian, M. R., A. V. Ryzhkov, V. M. Melnikov, and T. J. Schuur,
2010: Rapid-scan super-resolution observations of a cyclic
supercell with a dual-polarization WSR-88D. Mon. Wea. Rev.,
138, 3762–3786.
LaDue, D., P. Heinselman, and J. Newman, 2010: Strengths and
limitations of current radar systems for two stakeholder groups
in the southern plains. Bull. Amer. Meteor. Soc., 91, 899–910.
Lin, Y. J., T. C. Wang, and J. H. Lin, 1986: Pressure and temper-
ature perturbations within a squall-line thunderstorm derived
from SESAME dual-Doppler data. J. Atmos. Sci., 43, 2302–
2327.
McLaughlin, D., and Coauthors, 2009: Short-wavelength technol-
ogy and the potential for distributed networks of small radar
systems. Bull. Amer. Meteor. Soc., 90, 1797–1817.
Miller, L. J., and R. A. Kropfli, 1980: The Multiple Radar Work-
shop, November 1979, Part II: Experimental design and pro-
cesses. Bull. Amer. Meteor. Soc., 61, 1173–1177.
National Academies, 2008: Evaluation of the Multifunction Phased
Array Radar Planning Process. National Academy Press, 79 pp.
NOAA, 2006: Doppler radar meteorological observations. Part C:
WSR-88D Products and Algorithms, Federal Meteorological
Handbook, FCH-H11C-2006, Office of the Federal Coordi-
nator for Meteorological Services and Supporting Research,
Rockville, MD. [Available online at http://www.ofcm.gov/
fmh11/fmh11C.htm.]
OFCM, 2006: Federal research and development needs and prior-
ities for phased array radar. FMC-R25-2006, Interdepartmental
Committee for Meteorological Services and Supporting Re-
search, Committee for Cooperative Research Joint Action
Group for Phased Array Radar Project. [Available online at
http://www.ofcm.gov/r25-mpar/pdf/00-opening.pdf.]
Priegnitz, D., P. Heinselman, S. Torres, and R. Adams, 2009: Im-
provements to the National Weather Radar Testbed radar
control interface. Preprints, 34th Conf. on Radar Meteorology,
Williamsburg, VA, Amer. Meteor. Soc., P10.10. [Available
online at http://ams.confex.com/ams/pdfpapers/155633.pdf.]
Qiu, C.-J., and Q. Xu, 1996: Least squares retrieval of microburst
winds from single-Doppler radar data. Mon. Wea. Rev., 124,
1132–1144.
Steadham, R., 2008: Volume Coverage Pattern Usage. Part 1, 2008
National Weather Service Field Study, Radar Operations Cen-
ter, Norman, OK, 28 pp. [Available from WSR-88D Radar
Operations Center, 1200 Westheimer Dr., Norman, OK 73069.]
Torres, S., and D. Zrnic, 2003: Whitening in range to improve
weather radar spectral moment estimates. Part I: Formula-
tion and simulation. J. Atmos. Oceanic Technol., 20, 1433–
1448.
——, and C. Curtis, 2007: Initial implementation of super-resolution
data on the NEXRAD network. Preprints, 23rd Int. Conf. on
Interactive Information and Processing Systems (IIPS) for
Meteorology, Oceanography, and Hydrology, San Antonio,
TX, Amer. Meteor. Soc., 5B.10. [Available online at http://
ams.confex.com/ams/pdfpapers/116240.pdf.]
——, Y. Dubel, and D. Zrnic, 2004: Design, implementation, and
demonstration of a staggered PRT algorithm for the WSR-
88D. J. Atmos. Oceanic Technol., 21, 1389–1399.
Vasiloff, S. V., R. J. Doviak, and M. T. Istok, 1987: Weather radar
interlaced scanning strategy. J. Atmos. Oceanic Technol., 4,
245–249.
Warde, D., and S. Torres, 2009: Automatic detection and removal
of ground clutter contamination on weather radars. Preprints,
34th Conf. on Radar Meteorology, Williamsburg, VA, Amer.
Meteor. Soc., P10.11. [Available online at http://ams.confex.com/
ams/pdfpapers/155681.pdf.]
Weber, M. E., J. Y. N. Cho, J. S. Herd, J. M. Flavin, W. E. Benner,
and G. S. Torok, 2007: The next-generation multimission U.S.
surveillance radar network. Bull. Amer. Meteor. Soc., 88, 1739–
1751.
Wilson, J. W., R. D. Roberts, C. Kessinger, and J. McCarthy, 1984:
Microburst wind structure and evaluation of Doppler radar
for airport wind shear detection. J. Climate Appl. Meteor., 23,
898–915.
Wurman, J., 2002: The multiple-vortex structure of a tornado. Wea.
Forecasting, 17, 473–505.
Yu, T.-Y., M. B. Orescanin, C. D. Curtis, D. S. Zrnic, and D. E. Forsyth,
2007: Beam multiplexing using the phased-array weather radar.
J. Atmos. Oceanic Technol., 24, 616–626.
Yussouf, N., and D. J. Stensrud, 2010: Impact of phased-array radar
observations over a short assimilation period: Observing sys-
tem simulation experiments using an ensemble Kalman filter.
Mon. Wea. Rev., 138, 517–538.
Zhang, G., R. Doviak, C. Curtis, and Q. Cao, 2008: Multi-patterns
to reduce sidelobe effects on the National Weather Radar
Testbed. Preprints, Symp. on Recent Development in Atmo-
spheric Application of Radar and Lidar, New Orleans, LA, Amer.
Meteor. Soc., P1.12. [Available online at http://ams.confex.
com/ams/pdfpapers/130792.pdf.]
Zrnic, D. S., and Coauthors, 2007: Agile beam phased array radar
for weather observations. Bull. Amer. Meteor. Soc., 88, 1753–
1766.
MARCH 2011 H E I N S E L M A N A N D T O R R E S 593