high-throughput high-resolution class i hla genotyping in
TRANSCRIPT
High-Throughput High-Resolution Class I HLAGenotyping in East AfricaRebecca N. Koehler1, Anne M. Walsh1, Eric E. Sanders-Buell1, Leigh Anne Eller2, Michael Eller2, Jeffrey R.
Currier1, Christian T. Bautista1, Fred Wabwire-Mangen3, Michael Hoelscher4,5, Leonard Maboko5, Jerome
Kim6, Nelson L. Michael6, Merlin L. Robb1, Francine E. McCutchan1¤, Gustavo H. Kijak1*
1 United States Military HIV Research Program/Henry M. Jackson Foundation, Rockville, Maryland, United States of America, 2 Makerere University Walter Reed Research
Project, Henry M. Jackson Foundation, Kampala, Uganda, 3 Makerere University, Kampala, Uganda, 4 Department of Infectious Diseases and Tropical Medicine, University
of Munich, Munich, Germany, 5 Mbeya Medical Research Program, Mbeya, Tanzania, 6 United States Military HIV Research Program/Walter Reed Army Institute of
Research, Silver Spring, Maryland, United States of America
Abstract
HLA, the most genetically diverse loci in the human genome, play a crucial role in host-pathogen interaction by mediatinginnate and adaptive cellular immune responses. A vast number of infectious diseases affect East Africa, including HIV/AIDS,malaria, and tuberculosis, but the HLA genetic diversity in this region remains incompletely described. This is a majorobstacle for the design and evaluation of preventive vaccines. Available HLA typing techniques, that provide the 4-digitlevel resolution needed to interpret immune responses, lack sufficient throughput for large immunoepidemiologicalstudies. Here we present a novel HLA typing assay bridging the gap between high resolution and high throughput. Theassay is based on real-time PCR using sequence-specific primers (SSP) and can genotype carriers of the 49 most commonEast African class I HLA-A, -B, and -C alleles, at the 4-digit level. Using a validation panel of 175 samples from Kampala,Uganda, previously defined by sequence-based typing, the new assay performed with 100% sensitivity and specificity. Theassay was also implemented to define the HLA genetic complexity of a previously uncharacterized Tanzanian population,demonstrating its inclusion in the major East African genetic cluster. The availability of genotyping tools with this capacitywill be extremely useful in the identification of correlates of immune protection and the evaluation of candidate vaccineefficacy.
Citation: Koehler RN, Walsh AM, Sanders-Buell EE, Eller LA, Eller M, et al. (2010) High-Throughput High-Resolution Class I HLA Genotyping in East Africa. PLoSONE 5(5): e10751. doi:10.1371/journal.pone.0010751
Editor: Esper Georges Kallas, University of Sao Paulo, Brazil
Received December 22, 2009; Accepted April 14, 2010; Published May 20, 2010
This is an open-access article distributed under the terms of the Creative Commons Public Domain declaration which stipulates that, once placed in the publicdomain, this work may be freely reproduced, distributed, transmitted, modified, built upon, or otherwise used by anyone for any lawful purpose.
Funding: This work was supported through a cooperative agreement between the Henry M. Jackson Foundation for the Advancement of Military Medicine andthe United States Department of Defense, by the National Institute for Allergy and Infectious Diseases, National Institutes of Health (‘‘HIV Vaccine Research andDevelopment - Project 2’’ Y1-AI-2642-11). The funders had no role in study design, data collection and analysis, decision to publish, or preparation of themanuscript.
Competing Interests: The authors have declared that no competing interests exist.
* E-mail: [email protected]
¤ Current address: Bill & Melinda Gates Foundation, Seattle, Washington, United States of America
Introduction
The human leukocyte antigen (HLA) loci, located in the major
histocompatibility complex (MHC), encode cell-surface molecules
that present peptides sampled from the proteome, mediating key
immunological events: defining self-antigen tolerance and cellular
immune responses to tumors and pathogens. Class I HLA-A, -B,
and -C loci are essential for both innate and adaptive cellular
immune responses. Their crucial interaction with T-cell receptors
on cytotoxic T-lymphocytes (CTLs) mediates adaptive immune
responses against viruses and intracellular parasites [1,2]. HLA are
also ligands of killer immunoglobulin-like receptors (KIR) on the
surface of natural killer cells, forming a bridge between innate and
adaptive immunity [3].
The HLA are the most genetically diverse loci in the human
genome [4]. When solely enumerated by variants that differ at the
amino acid level (i.e., ‘‘4-digit’’ resolution level) the number of
currently published class I HLA alleles amounts to 700 in the
HLA-A locus, 1084 in the HLA-B locus, and 371 in the HLA-C
locus [5]. While these counts reflect worldwide surveys, only a
subset of these alleles is usually found in any given global
indigenous population [6]. At the global scale, the complex genetic
makeup of the HLA bears the marks of the history of each
population [7], including several waves of migration [8], different
levels of admixture with other populations [9], and changes in
their effective population size [10]. In addition, one of the
strongest forces molding HLA complexity has been the selective
pressure exerted by numerous pathogens [8,11] which is most
evident in populations that have maintained larger effective
population sizes for longer periods of time [12], as is the case for
East African populations [13].
East African populations are heavily affected by infectious
diseases [14], including malaria [15], tuberculosis [16], HIV/
AIDS [17], leishmaniasis [18], schistosomiasis [19], and viral
hemorrhagic fever [20,21,22]. For each of these diseases, HLA
diversity plays a crucial role in the host-pathogen interaction,
affecting the rates of disease acquisition and outcome
[23,24,25,26,27,28,29,30,31]. Nevertheless, and with few excep-
PLoS ONE | www.plosone.org 1 May 2010 | Volume 5 | Issue 5 | e10751
tions [32,33,34,35,36,37,38,39,40], class I HLA genetic diversity
of East African populations remains incompletely described, one of
the main impediments for the design and evaluation of preventive
vaccines for this region [41].
Immunoepidemiological studies aimed at supporting vaccine
development require the assessment of large cohorts [42].
However, the level of diversification within HLA allele families
in East African populations [32,33] and its consequences on
antigen presentation and disease course [31] call for high-
resolution HLA genotyping. Currently available techniques, such
as sequence-based typing (SBT), PCR using sequence-specific
primers (SSP), and PCR using sequence-specific oligonucleotide
probes (SSOP), meet only some of these requirements. SBT
provides high-resolution typing, but at high cost and low
throughput, and is not able to discern cis/trans linkage of sequence
motifs, which can result in ambiguities in allele calls [43]. PCR-
SSP is able to indentify linkage among polymorphisms [44], but
PCR-SSP and PCR-SSOP have a lower level of resolution than
SBT and require time-consuming post-PCR processing, signifi-
cantly reducing their throughput.
Here we present the development, validation, and implemen-
tation of an assay to support molecular epidemiology studies
capable of discriminating carriers of the most frequent class I
HLA-A, -B, and -C alleles in East Africa from non-carriers, and
that bridges the gap between high-throughput/low-cost and high-
resolution HLA typing. The novel platform is based on real-time
PCR-SSP, and performs with high sensitivity and specificity in
identifying carriers of the 49 most common class I HLA-A, -B, and
-C alleles in East Africa, providing 80–90% population coverage.
Thus, it is an ideal tool for immunoepidemiological studies.
Results
Assay scope and principleTo date, 36, 55, and 24 HLA-A, -B and -C alleles have been
reported in East African populations [32,33], respectively. There is
a coincidence in the alleles constituting the major variants in
Kenyan Luo, Kenyan Nandi, and Ugandans, despite some
differences in the frequencies at which each allele variant is
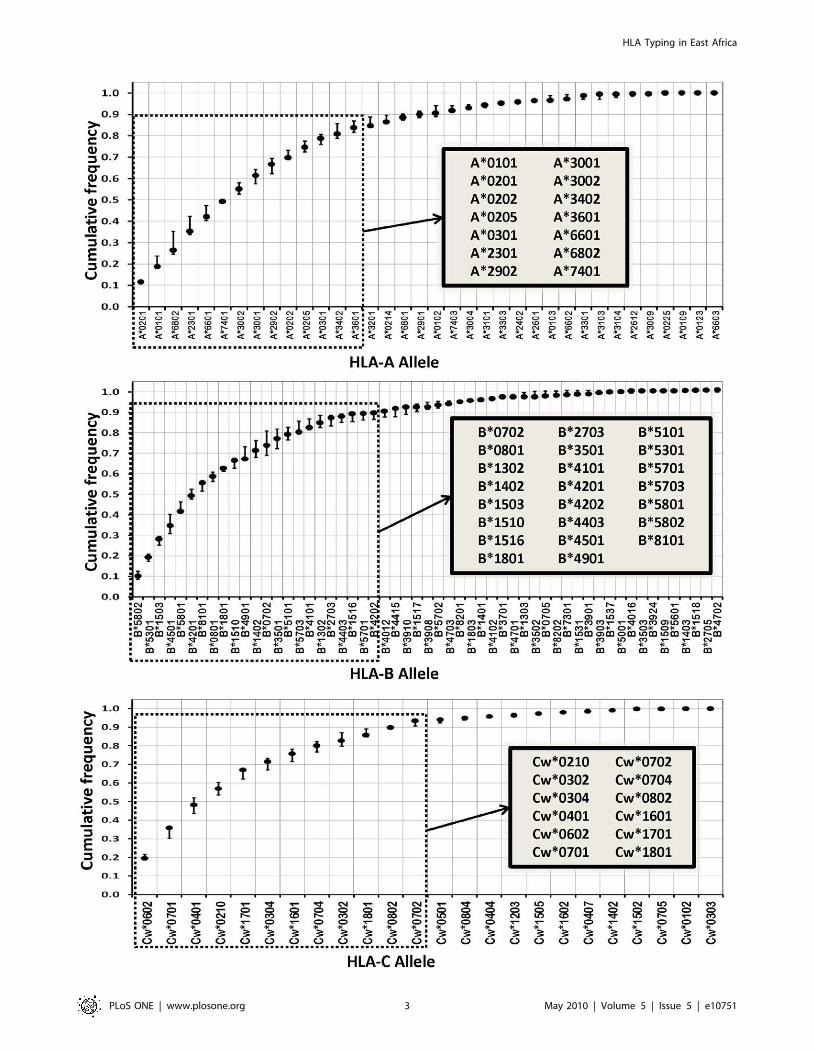
represented [32,33]. When these alleles were sorted in descending
order of abundance and the cumulative allele frequencies were
calculated for each locus, their layout resembled a logarithmic
distribution, with less than half of the allelic variants providing
large population coverage and the remainder found at very low
frequencies (Figure 1). Based on this distribution of genetic
variation, we focused on discrimination of the 14 most frequent
HLA-A, 23 HLA-B, and 12 HLA-C alleles that provide
population coverage ranging from 80 to 90% in East African
populations (see insets in Figure 1). None of the minor alleles was
represented at allelic frequencies larger than 0.03, and even
though they might have an impact at the individual level they are
unlikely to have a significant influence at the population level [45];
due to statistical power constraints these minor alleles are of only
marginal interest in molecular epidemiological studies. Further-
more, by limiting the scope of the assay to the major alleles in these
populations, we could attempt to achieve a genotyping platform
with a higher throughput, higher specificity, and higher sensitivity.
Assay layoutThe layout of the assay is summarized in Figure 2. Genomic
areas spanning exon 2 through exon 3 of the class I HLA-A, -B,
and -C were respectively amplified in three separate first round
PCRs, one per locus, using locus-specific primers [46,47]. This
initial amplification step prevented the subsequent interference
from paralogous loci (Figure S1). These amplicons were diluted
and used as templates in subsequent real-time PCR-SSPs. Each
real time PCR-SSP consisted of a pair of forward and reverse
sequence-specific primers, whose amplification was monitored by
a fluorescent TaqMan probe targeting a conserved region
encompassed by the primers. For internal standardization, a
parallel real-time PCR targeted an invariant region in the
converse exon within the same first-round amplicon template.
The difference in amplification efficiency between the sequence-
specific and the internal standardization reactions, measured as
the respective Ct values, was used to assign a positive or negative
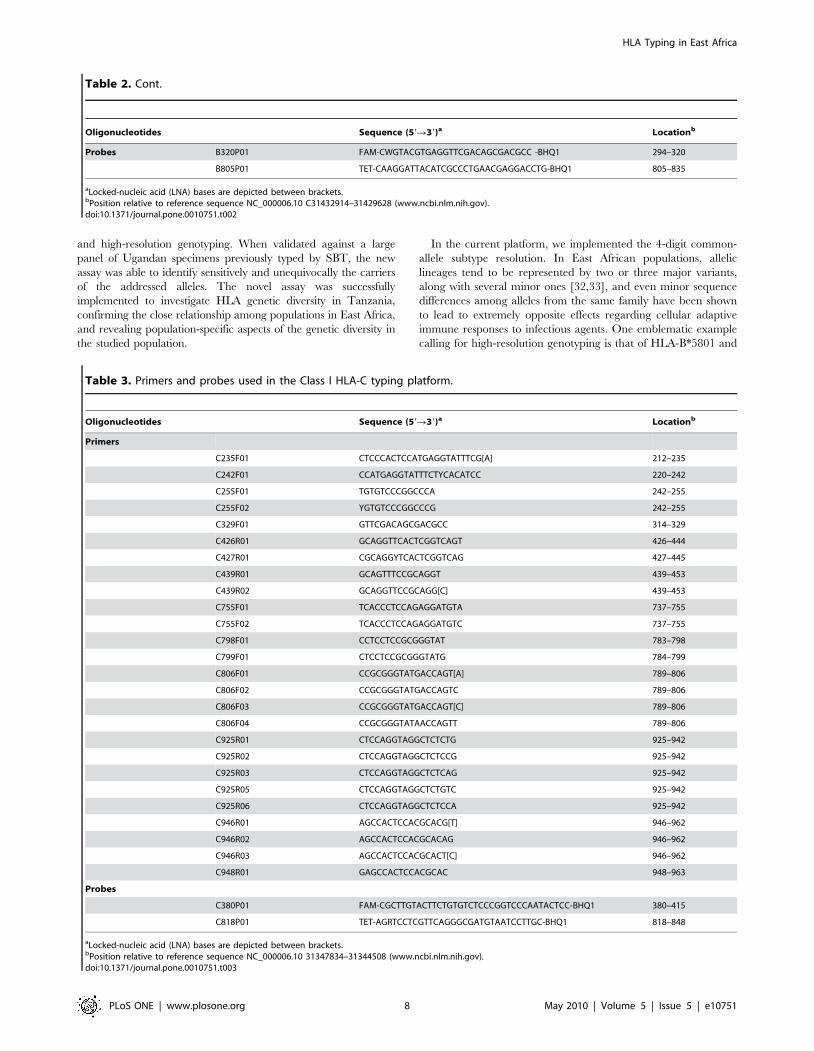
reactivity to each reaction. In total, 31, 50, and 26 different
primers and 7 probes (Table 1, Table 2 and Table 3) were utilized
in 20 HLA-A, 46 HLA-B, and 15 HLA-C typing reactions,
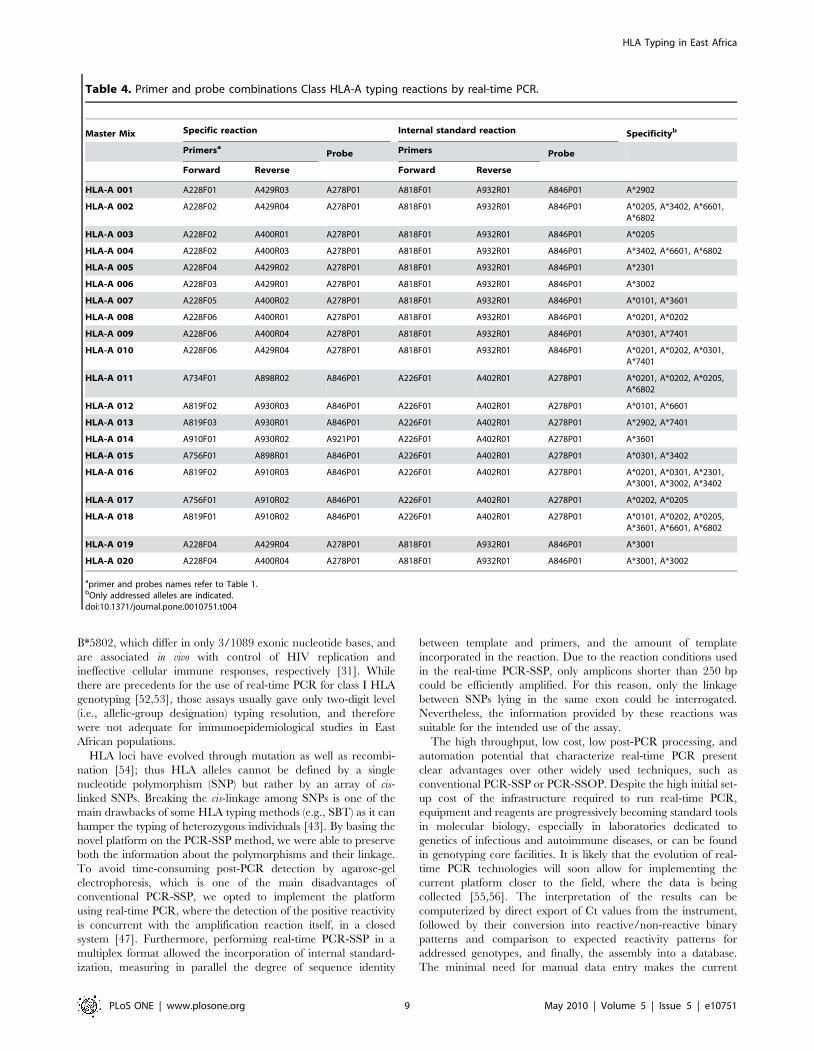
respectively (Table 4, Table 5 and Table 6). While some of the
reactions were specific for several alleles (e.g., reactions 016 and
018 in the HLA-A locus), other reactions exhibited reactivity with
only few (e.g., reactions 008 and 009 in the HLA-A locus) or a
single allele (e.g., reactions 001 and 003 in the HLA-A locus)
(Table 7, Table 8 and Table S1).
The arrays of reactions were designed so that each of the 105
HLA-A and 78 HLA-C individual genotypes comprising the
addressed alleles had a unique aggregate reactivity pattern (Table
S2, Table S3, and Table S4). In the case of HLA-B, due to the
allele complexity of the locus, 273/276 distinct patterns were
attained, as the following pairs of addressed genotypes shared
common reactivity patterns: B*4201/B*4202 and B*4201/
B*4201; B*0702/B*4202 and B*0702/B*4201; and B*4201/
B*8101 and B*4202/B*8101. Note that, while alleles B*4201
and B*4202 exhibit an extremely high degree of sequence identity,
(i.e., differing only by a single non-synonymous change at
nucleotide position 225: TAC and CAC, respectively) [48], it
was possible to discriminate between carriers and non-carriers of
either of these two alleles in the setting of all 39 other genotypes
that involved addressed alleles.
Assay ValidationThe assay is intended for use in discriminating carriers of the
most common HLA alleles in East Africa from non-carriers. A
panel of 175 specimens sampled in Kampala, Uganda, previously
characterized by SBT [33], was used to assess the performance of
the platform (see Table S5 for a complete list of the genotypes).
Performance of the HLA-A typing system was tested on 125
samples representing 63 different genotypes, composed exclusively
of addressed alleles (Table 9). Carriers and non-carriers of all 14
addressed alleles could be unequivocally discriminated, rendering
genotypes that were fully concordant with those obtained by SBT.
Similarly, the 141 samples whose genotypes were composed
exclusively of addressed HLA-B alleles were typed with 100%
sensitivity and specificity. Note that in this case the validation
panel represented 83 different genotypes, combining 21/23
addressed alleles. HLA-B*2703 and B*5701 were not represented
in the current panel, but the assay was able to correctly detect
them in specimens from Tanzania and Kenya that had been
identified as carriers of these alleles by SBT (data not shown).
Finally, 151 specimens that were exclusively carriers of the 12
addressed HLA-C alleles and that represented 59 different
genotypes, were typed with this novel platform. Obtained results
were fully concordant with those of SBT.
Within the validation panel, some of the specimens contained at
least one allele not addressed in the current platform (Table S5).
These genotypes were represented by 50, 34, and 24 samples for
the HLA-A, -B, and -C loci, respectively. We proceeded to assess
how the assay would perform on these samples. The obtained
HLA Typing in East Africa
PLoS ONE | www.plosone.org 2 May 2010 | Volume 5 | Issue 5 | e10751
HLA Typing in East Africa
PLoS ONE | www.plosone.org 3 May 2010 | Volume 5 | Issue 5 | e10751

results varied depending on the nature of the non-addressed
alleles, and can be grouped into four main categories (Table S6).
First, there were the non- addressed alleles that fully shared a
reactivity pattern with addressed alleles. In this category we could
mention HLA-A*0103, HLA-A*2901, HLA-A*3009, HLA-
A*7403, HLA-B*1803, HLA-B*1537, HLA-Cw*0407 and HLA-
Cw*0622, which, respectively, reacted exactly like the addressed
alleles HLA-A*0101, HLA-A*2902, HLA-A*3002, HLA-A*7401,
HLA-B*1801, HLA-B*1510, HLA-Cw*0401 and HLA-Cw*0602.
These non- addressed alleles will always be typed by the platform
as their cognate addressed alleles. In a second category, we
included those non-addressed alleles that had a reactivity pattern
closely resembling that of one of the addressed alleles, with the
addition or absence of one or two reactions. For instance, non-
addressed allele HLA-A*6801 shared the reactivity with A*6802 in
reactions HLA-A 002, 004, and 018 but differed from the latter in
having additional reactivity at reaction 017 and the absence of
reactivity at 011. In the setting of most heterozygote genotypes,
these minor differences in reactivity would be eclipsed by the
superimposing reactivity pattern of the accompanying allele. For
the most part, these non-addressed alleles could not be
distinguished from the cognate addressed alleles. Other cognate
pairs of addressed and non-addressed alleles falling within this
category included HLA-A*2301/HLA-A*2402, HLA-A*7401/
HLA-A*3201, HLA-A*3002/HLA-A*3004, HLA-B*5703/HLA-
B*5702, and HLA-Cw*0602/HLA- Cw*1203. A third category
included those non-addressed alleles that reacted in only one or
few reactions, rendering reactivity patterns that were eclipsed by
most addressed alleles. In most of these cases, samples would be
genotyped as homozygous for the identified addressed allele.
Examples of this category included HLA-A*3104, HLA-B*4415,
HLA-Cw*0804, and HLA-Cw*1505. Finally, some non-addressed
alleles had a very distinctive reactivity pattern that allowed their
detection in most settings. However, these variants were not
included in the original design of the platform and therefore, there
might be some relevant genotypic settings in which they might not
be unequivocally genotyped. The main representative of this last
category was HLA-A*0214.
Three main points are noteworthy about the aforementioned
non-addressed alleles. They tend to be found at extremely low
frequencies in reports from East African populations [32,33], and
thus their exclusion from the original assay design. Secondly, the
observed reactivity patterns were reproducible and consistent with
those expected based on their sequence. Thirdly, in most instances
the presence of a non-addressed allele was not an obstacle for the
adequate genotyping of the accompanying addressed alleles.
Overall, the novel genotyping platform exhibited a 100%
sensitivity, specificity, positive predictive value (PPV) and negative
predictive value (NPV) on specimens that were exclusively carriers
of the 14, 23, and 12 addressed HLA-A, -B, and -C alleles,
respectively. Additionally, the assay was able to correctly
discriminate carriers from non-carriers of these variants even
when they were part of genotypes that contained non-addressed
alleles. The performance of the assay on the complete validation
panel, including carriers of at least one non-addressed allele, is
shown in Table S7. The sensitivity and NPV remained at 100%
for all the addressed alleles. The specificity and PPV was 100% for
all but 14 alleles. For the remainder, the sensitivity was 99.3–
99.9% (9 alleles), 97.6–98.6% (4 alleles) and 87.1% for HLA-
Cw*0701. The PPV of these alleles was 91.4–97.0% (8 alleles),
85.7–88.0% (3 alleles), and 60.0–78.3% (3 alleles). The most
common interfering factor in the latter was the presence of non-
addressed alleles which differed from the cognate addressed alleles
by only one nucleotide base (see notes at the foot of Table S7 for
details).
Class I HLA genetic diversity in Mbeya, TanzaniaFollowing the development and validation of the real-time
PCR-SSP platform, we performed a field test of this assay using a
set of specimens (n = 174) from Tanzania, an East African country
that to date has not been subject to systematic class I HLA genetic
characterization. Samples proceeded from a cohort development
study that was conducted in preparation of HIV vaccine trials in
the southwestern region of Mbeya. In the HLA-A,-B, and -C loci,
174/174 (100%) and 173/174 (99.4%) and 173/174 (99.4%)
samples yielded interpretable reactivity patterns, respectively. The
number of samples that were carriers of at least one addressed
allele were 171/174 (98.3%) in the HLA-A locus, 171/174
(98.3%) in the HLA-B locus, and 173/174 (99.4%) in the HLA-C
locus. Observed HLA-A, -B, and -C allele frequencies are shown
in Table S8. Overall, the alleles addressed by the novel platform
provided a population coverage of 91.7%, 81.0%, and 94.0% in
the HLA-A,-B, and -C loci, respectively. Observed genotypes did
not deviate significantly from those expected under Hardy-
Weinberg equilibrium (Table S9). All the major allelic lineages
previously reported in East Africa were represented in the studied
Tanzanian sample set (Figure S2). Carrier frequencies of the
majority of the addressed HLA alleles tracked very closely among
Tanzanians and the other East African populations [32,33] (e.g.,
A*0201, A*0301, A*3001, B*1503, B*4202, B*5701, Cw*0210).
Interestingly, when compared with the other East African
populations, Tanzanians exhibited the highest carriage frequency
for alleles A*3002, A*3601, A*6802, B*0702, B*1510, B*5301,
Cw*0401, Cw*1601, and Cw*1801. On the other hand, alleles
A*0101, A*0301, A*6601, B*2703, B*5701, B*5801, Cw*0302,
Cw*0602, Cw*0701 and Cw*0704 tended to be under-represent-
ed in the studied Tanzanian cohort. Finally, the location of the
current Tanzanian population in the context of global class I HLA
genetic diversity was explored through the calculation of pair-wise
inter-population genetic distances [49,50]. The principal compo-
nent analysis (PCA) based on HLA-A, -B, and -C loci grouped the
current Tanzanian population together with other reported sub-
Saharan populations (Figure S3). Moreover, the dendrogram
analysis evidenced the Tanzanian population as an integral part of
the previously reported major East African cluster, along with the
Kenyan Luo, Kenyan Nandi, and Ugandan populations [33]
(Figure S4).
Discussion
The association between genetic variation in class I HLA and the
susceptibility, presentation, and outcome of infectious diseases in
East Africa, and the development of preventive vaccines, are topics
of high public health relevance. However, the lack of adequate tools
Figure 1. Distribution of Class I HLA-A, -B, and -C allele frequencies in East Africa. For each locus, cumulative frequencies of reportedalleles in Kenyan Luo [32], Kenyan Nandi [32], and Ugandan populations [33] are depicted in decreasing frequency order. Solid dots represent themedian of the cumulative frequencies among the three populations, and the error bars represent their range. HLA alleles that provide a populationcoverage of 80–90% and were selected as the target of the current assay (see text for details) are boxed by a dotted line and listed in the insets. Onlyalleles that have been reported in at least one of the three East African populations were included in the analysis.doi:10.1371/journal.pone.0010751.g001
HLA Typing in East Africa
PLoS ONE | www.plosone.org 4 May 2010 | Volume 5 | Issue 5 | e10751

HLA Typing in East Africa
PLoS ONE | www.plosone.org 5 May 2010 | Volume 5 | Issue 5 | e10751

that can provide HLA typing information with the needed level of
molecular detail, in a timely and cost-effective fashion, is one of the
main obstacles to conducting large epidemiological studies. This
deficiency is reflected in the very low representation of East African
populations in global HLA databases [51]. Here, we presented a
novel platform aimed at bridging the gap between high-throughput
Figure 2. Novel sequence-specific primer (SSP) real-time PCR-based genotyping assay for HLA-A, -B, and -C in East African populations.The layout of the assay is here exemplified for the HLA-A locus, but proceeds similarly for the HLA-B and -C loci. a) After PCR amplification of a genomicregion encompassing exons 2 through 3 of HLA-A using locus-specific primers, the amplicon was distributed in 20 separate multiplex SSP real-time PCRscontaining sequence-specific primers (colored arrows), variation-insensitive primers (black arrows), and universal fluorescent TaqMan probes (colored stars).Sequence-specific and variation-insensitive primers targeted areas of converse exons. Sequence-specific primers were designed to more efficiently amplifydefined targeted alleles (noted next to each reaction). Variation-insensitive primers were used to allow for internal standardization. b) The cross threshold(Ct) values obtained by monitoring amplification with the sequence-specific and internal standardization reagents were then used to assign samplespositive or negative reactivities in each reaction (exemplified in the inset by results from reaction HLA-A018). The aggregate reactivity patterns rendered bythe array of reactions were used to define the presence or absence of the addressed alleles. See text for details.doi:10.1371/journal.pone.0010751.g002
Table 1. Primers and probes used in the Class I HLA-A typing platform.
Oligonucleotides Sequence (59R39)a Locationb
Primers
A226F01 GGCTCYCACTCCATGAGGTATTTC 203–226
A228F01 GGCTCYCACTCCATGAGGTATTTCAC 203–228
A228F02 GGCTCYCACTCCATGAGGTATTTCTA 203–228
A228F03 GGCTCYCACTCCATGAGGTATTTCTC 203–228
A228F04 GGCTCYCACTCCATGAGGTATTTCT[C] 203–228
A228F05 GGCTCYCACTCCATGAGGTATTTCTT 203–228
A228F06 GGCTCYCACTCCATGAGGTATTTCT[T] 203–228
A400R01 TCTGTGASTGGGCCTTCACT 400–419
A400R02 TCTGTGASTGGGCCTTCAT[A] 400–419
A400R03 TCTGTGASTGGGCCTTCACA 400–419
A400R04 TCTGTGASTGGGCCTTCAC[A] 400–419
A402R01 TCTGTGASTGGGCCTTCA 402–419
A429R01 GCAGGGTCCCCAGGTTCT 429–446
A429R02 CGCGATCCGCAGGTTCT 429–444
A429R03 CAGGGTCCCCAGGTTCG 429–445
A429R04 CAGGGTCCCCAGGTCCA 429–445
A734F01 NGTTCTCACACCVTCCAGAGG 714–734
A756F01 GCTGCGACGTGGGGT 742–756
A818F01 GGCAAGGATTACATCGCC 801–818
A819F01 GGCAAGGATTACATCGCCC 801–819
A819F02 GGCAAGGATTACATCGCC[C] 801–819
A819F03 GGCAAGGATTACATCGCC[T] 801–819
A898R01 RCTCTCMRCTGCTCCGCC[T] 898–916
A898R02 RCTCTCMRCTGCTCCGCCA 898–916
A910F01 TCCATTCGGCGGAGCAACG 892–910
A910R02 GCCCTCCAGGTAGRCTCTC[C] 910–929
A910R03 GCCCTCCAGGTAGGCTCTC[A] 910–929
A930R01 GAGCCMSTCCACGCACGT 930–947
A930R02 GAGCCMSTCCACGCACG[T] 930–947
A930R03 AGCCMSTCCACGCACC[G] 930–946
A932R01 GAGCCMSTCCACGCAC 932–947
Probes
A278P01 FAM-CGCACAAACTGCATGTCGTCCACGTAGCC-BHQ1 278–306
A846P01 TET-TCTGAGCCGCCATGTCCGCCGC-BHQ1 846–867
A921P01 TET-CTGGAGGGCTGCTGCGTGGAGTGG-BHQ1 921–944
aLocked-nucleic acid (LNA) bases are depicted between brackets.bPosition relative to reference sequence NC_000006.10 30018310–30021633 (www.ncbi.nlm.nih.gov).doi:10.1371/journal.pone.0010751.t001
HLA Typing in East Africa
PLoS ONE | www.plosone.org 6 May 2010 | Volume 5 | Issue 5 | e10751

Table 2. Primers and probes used in the Class I HLA-B typing platform.
Oligonucleotides Sequence (59R39)a Locationb
Primers B224F01 GCTCCCACTCCATGAGGTATTTC 202–224
B225F01 GCTCCCACTCCATGAGGTATTTC[C] 202–225
B225F02 GCTCCCACTCCATGAGGTATTTC[G] 202–225
B225F03 GCTCCCACTCCATGAGGTATTTC[T] 202–225
B231F01 CCCCACTCCATGAAGTATTTCNACACC[G] 204–231
B234F01 CCACTCCATGAAGTATTTCNACACCNCC[A] 206–234
B270F01 GGAGCCCCGCTTCATC[A] 254–270
B270F02 GGAGCCCCGCTTCATC[G] 254–270
B270F03 GGAGCCCCGCTTCATCT 254–270
B270F04 GGAGCCCCGCTTCATC[T] 254–270
B350R01 GCCCCTCCTGCTCTATCCAT 350–369
B350R02 GCCCCTCCTGCTCTATCCA[C] 350–369
B408R01 GGCTCTCTCGGTMAGTCTGTGTGT[T] 408–432
B429F01 TCTCTCGGTMAGTCTGTGCCT[G] 408–429
B429F02 TCTCTCGGTMAGTCTGTGCGGA 408–429
B445R01 CGCTCTGGTTGTAGTAGCCGC 445–465
B445R02 CGCTCTGGTTGTAGTAGCCG[C] 445–465
B445R03 CCTCYCTCTGGTTGTAGTAGCCSGM 445–445
B445R04 CCTCTCTCTGGTTGTAGTAGCGGA 445–468
B734F01 CAGGGTCTCACATCATCCAG[A] 714–734
B734F02 GGGTCTCACATCATCCAG[T] 716–734
B734F03 CAGGGTCTCACATCATCCAG[T] 714–734
B751F01 CAGANSATGTAYGGCTGCGAC 731–751
B752F01 CAGANSATGTAYGGCTGCGACC 731–752
B752F02 CAGANSATGTAYGGCTGCGAC[C] 731–752
B752F03 CAGANSATGTAYGGCTGCGAC[G] 731–752
B785F01 CCTCCTCCACGGGCAT[A] 769–785
B785F02 CCTCCTCCACGGGCAT[G] 769–785
B792F01 CGCGGGCATAACCAGT[A] 776–792
B792F02 CGGGCATGACCAGT[C] 778–792
B792F03 GCGGGCATGACCAGT[C] 777–792
B793F01 CGGGCATGACCAGGA[C] 778–793
B793F02 CGCGGGCATGACCAGTA[C] 776–793
B793F03 GCGGGCATGACCAGTTA 777–793
B793F04 GCGGGCATGACCAGTT[A] 777–793
B793F05 CGCGGGTATAACCAGTT[C] 776–793
B859R01 GGTGATCTGAGCCGCG 859–874
B859R02 GGTGATCTGAGCCGCC 859–874
B859R03 GGTGATCTGAGCCGC[C] 859–874
B860R01 CTGGGTGATCTGAGCCGC 860–877
B879R01 GCCGCCTCCMACTTGC 879–894
B879R02 GCCGCCTCCMACTTG[C] 879–894
B879R03 GGCCGCCTCCMACTTGA 879–895
B911R01 CCTCCAGGTAGGTAGGCTCTCCG 911–933
B911R02 CCTCCAGGTAGGTAGGCTCTCAG 911–933
B911R03 CCTCCAGGTAGGTAGGCTCTCA[G] 911–933
B911R04 CCTCCAGGTAGGTAGGCTCTGTC 911–933
B932R01 GAGCAACTCCACGCACGT 932–949
B932R02 GAGCAACTCCACGCACAG 932–949
B932R03 GAGCAACTCCACGCACA[G] 932–949
HLA Typing in East Africa
PLoS ONE | www.plosone.org 7 May 2010 | Volume 5 | Issue 5 | e10751
and high-resolution genotyping. When validated against a large
panel of Ugandan specimens previously typed by SBT, the new
assay was able to identify sensitively and unequivocally the carriers
of the addressed alleles. The novel assay was successfully
implemented to investigate HLA genetic diversity in Tanzania,
confirming the close relationship among populations in East Africa,
and revealing population-specific aspects of the genetic diversity in
the studied population.
In the current platform, we implemented the 4-digit common-
allele subtype resolution. In East African populations, allelic
lineages tend to be represented by two or three major variants,
along with several minor ones [32,33], and even minor sequence
differences among alleles from the same family have been shown
to lead to extremely opposite effects regarding cellular adaptive
immune responses to infectious agents. One emblematic example
calling for high-resolution genotyping is that of HLA-B*5801 and
Oligonucleotides Sequence (59R39)a Locationb
Probes B320P01 FAM-CWGTACGTGAGGTTCGACAGCGACGCC -BHQ1 294–320
B805P01 TET-CAAGGATTACATCGCCCTGAACGAGGACCTG-BHQ1 805–835
aLocked-nucleic acid (LNA) bases are depicted between brackets.bPosition relative to reference sequence NC_000006.10 C31432914–31429628 (www.ncbi.nlm.nih.gov).doi:10.1371/journal.pone.0010751.t002
Table 2. Cont.
Table 3. Primers and probes used in the Class I HLA-C typing platform.
Oligonucleotides Sequence (59R39)a Locationb
Primers
C235F01 CTCCCACTCCATGAGGTATTTCG[A] 212–235
C242F01 CCATGAGGTATTTCTYCACATCC 220–242
C255F01 TGTGTCCCGGCCCA 242–255
C255F02 YGTGTCCCGGCCCG 242–255
C329F01 GTTCGACAGCGACGCC 314–329
C426R01 GCAGGTTCACTCGGTCAGT 426–444
C427R01 CGCAGGYTCACTCGGTCAG 427–445
C439R01 GCAGTTTCCGCAGGT 439–453
C439R02 GCAGGTTCCGCAGG[C] 439–453
C755F01 TCACCCTCCAGAGGATGTA 737–755
C755F02 TCACCCTCCAGAGGATGTC 737–755
C798F01 CCTCCTCCGCGGGTAT 783–798
C799F01 CTCCTCCGCGGGTATG 784–799
C806F01 CCGCGGGTATGACCAGT[A] 789–806
C806F02 CCGCGGGTATGACCAGTC 789–806
C806F03 CCGCGGGTATGACCAGT[C] 789–806
C806F04 CCGCGGGTATAACCAGTT 789–806
C925R01 CTCCAGGTAGGCTCTCTG 925–942
C925R02 CTCCAGGTAGGCTCTCCG 925–942
C925R03 CTCCAGGTAGGCTCTCAG 925–942
C925R05 CTCCAGGTAGGCTCTGTC 925–942
C925R06 CTCCAGGTAGGCTCTCCA 925–942
C946R01 AGCCACTCCACGCACG[T] 946–962
C946R02 AGCCACTCCACGCACAG 946–962
C946R03 AGCCACTCCACGCACT[C] 946–962
C948R01 GAGCCACTCCACGCAC 948–963
Probes
C380P01 FAM-CGCTTGTACTTCTGTGTCTCCCGGTCCCAATACTCC-BHQ1 380–415
C818P01 TET-AGRTCCTCGTTCAGGGCGATGTAATCCTTGC-BHQ1 818–848
aLocked-nucleic acid (LNA) bases are depicted between brackets.bPosition relative to reference sequence NC_000006.10 31347834–31344508 (www.ncbi.nlm.nih.gov).doi:10.1371/journal.pone.0010751.t003
HLA Typing in East Africa
PLoS ONE | www.plosone.org 8 May 2010 | Volume 5 | Issue 5 | e10751
B*5802, which differ in only 3/1089 exonic nucleotide bases, and
are associated in vivo with control of HIV replication and
ineffective cellular immune responses, respectively [31]. While
there are precedents for the use of real-time PCR for class I HLA
genotyping [52,53], those assays usually gave only two-digit level
(i.e., allelic-group designation) typing resolution, and therefore
were not adequate for immunoepidemiological studies in East
African populations.
HLA loci have evolved through mutation as well as recombi-
nation [54]; thus HLA alleles cannot be defined by a single
nucleotide polymorphism (SNP) but rather by an array of cis-
linked SNPs. Breaking the cis-linkage among SNPs is one of the
main drawbacks of some HLA typing methods (e.g., SBT) as it can
hamper the typing of heterozygous individuals [43]. By basing the
novel platform on the PCR-SSP method, we were able to preserve
both the information about the polymorphisms and their linkage.
To avoid time-consuming post-PCR detection by agarose-gel
electrophoresis, which is one of the main disadvantages of
conventional PCR-SSP, we opted to implement the platform
using real-time PCR, where the detection of the positive reactivity
is concurrent with the amplification reaction itself, in a closed
system [47]. Furthermore, performing real-time PCR-SSP in a
multiplex format allowed the incorporation of internal standard-
ization, measuring in parallel the degree of sequence identity
between template and primers, and the amount of template
incorporated in the reaction. Due to the reaction conditions used
in the real-time PCR-SSP, only amplicons shorter than 250 bp
could be efficiently amplified. For this reason, only the linkage
between SNPs lying in the same exon could be interrogated.
Nevertheless, the information provided by these reactions was
suitable for the intended use of the assay.
The high throughput, low cost, low post-PCR processing, and
automation potential that characterize real-time PCR present
clear advantages over other widely used techniques, such as
conventional PCR-SSP or PCR-SSOP. Despite the high initial set-
up cost of the infrastructure required to run real-time PCR,
equipment and reagents are progressively becoming standard tools
in molecular biology, especially in laboratories dedicated to
genetics of infectious and autoimmune diseases, or can be found
in genotyping core facilities. It is likely that the evolution of real-
time PCR technologies will soon allow for implementing the
current platform closer to the field, where the data is being
collected [55,56]. The interpretation of the results can be
computerized by direct export of Ct values from the instrument,
followed by their conversion into reactive/non-reactive binary
patterns and comparison to expected reactivity patterns for
addressed genotypes, and finally, the assembly into a database.
The minimal need for manual data entry makes the current
Table 4. Primer and probe combinations Class HLA-A typing reactions by real-time PCR.
Master Mix Specific reaction Internal standard reaction Specificityb
PrimersaProbe Primers Probe
Forward Reverse Forward Reverse
HLA-A 001 A228F01 A429R03 A278P01 A818F01 A932R01 A846P01 A*2902
HLA-A 002 A228F02 A429R04 A278P01 A818F01 A932R01 A846P01 A*0205, A*3402, A*6601,A*6802
HLA-A 003 A228F02 A400R01 A278P01 A818F01 A932R01 A846P01 A*0205
HLA-A 004 A228F02 A400R03 A278P01 A818F01 A932R01 A846P01 A*3402, A*6601, A*6802
HLA-A 005 A228F04 A429R02 A278P01 A818F01 A932R01 A846P01 A*2301
HLA-A 006 A228F03 A429R01 A278P01 A818F01 A932R01 A846P01 A*3002
HLA-A 007 A228F05 A400R02 A278P01 A818F01 A932R01 A846P01 A*0101, A*3601
HLA-A 008 A228F06 A400R01 A278P01 A818F01 A932R01 A846P01 A*0201, A*0202
HLA-A 009 A228F06 A400R04 A278P01 A818F01 A932R01 A846P01 A*0301, A*7401
HLA-A 010 A228F06 A429R04 A278P01 A818F01 A932R01 A846P01 A*0201, A*0202, A*0301,A*7401
HLA-A 011 A734F01 A898R02 A846P01 A226F01 A402R01 A278P01 A*0201, A*0202, A*0205,A*6802
HLA-A 012 A819F02 A930R03 A846P01 A226F01 A402R01 A278P01 A*0101, A*6601
HLA-A 013 A819F03 A930R01 A846P01 A226F01 A402R01 A278P01 A*2902, A*7401
HLA-A 014 A910F01 A930R02 A921P01 A226F01 A402R01 A278P01 A*3601
HLA-A 015 A756F01 A898R01 A846P01 A226F01 A402R01 A278P01 A*0301, A*3402
HLA-A 016 A819F02 A910R03 A846P01 A226F01 A402R01 A278P01 A*0201, A*0301, A*2301,A*3001, A*3002, A*3402
HLA-A 017 A756F01 A910R02 A846P01 A226F01 A402R01 A278P01 A*0202, A*0205
HLA-A 018 A819F01 A910R02 A846P01 A226F01 A402R01 A278P01 A*0101, A*0202, A*0205,A*3601, A*6601, A*6802
HLA-A 019 A228F04 A429R04 A278P01 A818F01 A932R01 A846P01 A*3001
HLA-A 020 A228F04 A400R04 A278P01 A818F01 A932R01 A846P01 A*3001, A*3002
aprimer and probes names refer to Table 1.bOnly addressed alleles are indicated.doi:10.1371/journal.pone.0010751.t004
HLA Typing in East Africa
PLoS ONE | www.plosone.org 9 May 2010 | Volume 5 | Issue 5 | e10751

Table 5. Primer and probe combinations Class HLA-B typing reactions by real-time PCR.
Master Mix Specific reaction Internal standard reaction Specificityb
PrimersaProbe Primers Probe
Forward Reverse Forward Reverse
HLA-B 001 B225F01 B350R01 B320P01 B751F01 B860R01 B805P01 B*4101, B*4501, B*4901
HLA-B 002 B225F01 B408R01 B320P01 B751F01 B860R01 B805P01 B*1801, B*4101, B*4501,B*4901
HLA-B 003 B225F02 B350R02 B320P01 B751F01 B860R01 B805P01 B*0801
HLA-B 004 B225F03 B429F01 B320P01 B751F01 B860R01 B805P01 B*0702, B*4201, B*8101
HLA-B 005 B231F01 B429F02 B320P01 B751F01 B860R01 B805P01 B*1516, B*5701, B*5703,B*5801, B*5802
HLA-B 006 B231F01 B445R02 B320P01 B751F01 B860R01 B805P01 B*0801, B*1402, B*1503,B*1510, B*3501, B*4101,B*4501
HLA-B 007 B231F01 B445R04 B320P01 B751F01 B860R01 B805P01 B*1302, B*1516, B*4403,B*4901, B*5101 B*5301,B*5701, B*5703, B*5801,B*5802
HLA-B 008 B234F01 B445R02 B320P01 B751F01 B860R01 B805P01 B*0801, B*1503, B*1510,B*3501, B*4101, B*4501
HLA-B 009 B270F01 B408R01 B320P01 B751F01 B860R01 B805P01 B*1302, B*4101, B*4403,B*4501, B*4901
HLA-B 010 B270F01 B445R01 B320P01 B751F01 B860R01 B805P01 B*4101, B*4501
HLA-B 011 B270F01 B445R04 B320P01 B751F01 B860R01 B805P01 B*1302, B*2703, B*4403,B*4901
HLA-B 012 B270F02 B350R01 B320P01 B751F01 B860R01 B805P01 B*1516, B*3501, B*5301,B*5701, B*5703, B*5801,B*5802
HLA-B 013 B270F02 B408R01 B320P01 B751F01 B860R01 B805P01 B*3501, B*5301
HLA-B 014 B270F02 B445R02 B320P01 B751F01 B860R01 B805P01 B*3501
HLA-B 015 B270F03 B429F01 B320P01 B751F01 B860R01 B805P01 B*0702, B*4201, B*4202,B*8101
HLA-B 016 B270F03 B445R02 B320P01 B751F01 B860R01 B805P01 B*0702, B*0801, B*1402,B*1503, B*1510, B*1801,B*4201, B*4202, B*8101
HLA-B 017 B270F04 B445R04 B320P01 B751F01 B860R01 B805P01 B*5101
HLA-B 018 B734F01 B859R01 B805P01 B224F01 B445R03 B320P01 B*0801, B*1801, B*3501,B*4201, B*4202, B*4403,B*5301, B*5801
HLA-B 019 B734F02 B932R02 B805P01 B224F01 B445R03 B320P01 B*5802
HLA-B 020 B734F03 B911R02 B805P01 B224F01 B445R03 B320P01 B*1402, B*5802
HLA-B 021 B752F01 B879R02 B805P01 B224F01 B445R03 B320P01 B*1516, B*3501, B*4501,B*4901, B*5301, B*5801,B*5802
HLA-B 022 B752F02 B859R01 B805P01 B224F01 B445R03 B320P01 B*1302, B*3501, B*4501,B*4901, B*5301, B*5801,B*5802
HLA-B 023 B752F02 B911R04 B805P01 B224F01 B445R03 B320P01 B*4501
HLA-B 024 B752F03 B859R02 B805P01 B224F01 B445R03 B320P01 B*0702, B*1503, B*1510,B*2703, B*5701, B*5703,B*8101
HLA-B 025 B752F03 B879R01 B805P01 B224F01 B445R03 B320P01 B*0702, B*0801, B*1402,B*1503, B*1510, B*1801,B*2703, B*4101, B*4201,B*4202, B*4403, B*5101,B*5701, B*5703, B*8101
HLA-B 026 B752F03 B932R03 B805P01 B224F01 B445R03 B320P01 B*1503, B*1510, B*4403,B*5101, B*5701, B*5703
HLA-B 027 B785F01 B879R01 B805P01 B224F01 B445R03 B320P01 B*0801, B*4101, B*4201,B*4202, B*5101, B*5703,B*8101
HLA Typing in East Africa
PLoS ONE | www.plosone.org 10 May 2010 | Volume 5 | Issue 5 | e10751

molecular platform ideal for epidemiologic studies. In our hands, a
single operator with a fully dedicated instrument can genotype
class I HLA-A, -B, and -C for ca. 50 specimens per week.
Achieving a comparable throughput by conventional PCR-based
techniques would require a much larger work force, dedicated to
labor-intensive gel electrophoresis, interpretation, and manual
data entry.
The current platform has several limitations inherent to its
design, so it is not meant to replace gold-standard SBT, and it
should be used only for research and not for diagnostics or
therapeutics purposes. With the current assay, only addressed
alleles can be detected with high sensitivity and specificity. Rare,
non-addressed alleles sometimes cannot be detected, leading to
overcalling of homozygotes. Assessing major deviations from
Hardy-Weinberg equilibrium can help identify this problem.
Alternatively, non-addressed variants may be assigned to highly
related addressed alleles, and SBT may be used for further
genotype confirmation.
The extreme level of genetic diversity characteristic of the HLA
loci prevents the achievement of high-sensitivity and high-
specificity typing of the over 2,000 class I HLA-A, -B, and -C
alleles reported worldwide. However, our focusing on the 49 most
common variants reported in East Africa, which provide 80–90%
population coverage, offered an adequate balance between the
quantity and the quality of the data that can be gathered. While
many alleles found in East Africa were not addressed in the
current assay, their very low representation in these populations
results in their relatively low public health impact. The modular
and ‘‘open source’’ nature of the current assay permits
incorporation, by any member of the field, of further reactions
that can allow for the discrimination of carriers of any given non-
addressed variant deemed to be of interest. The current molecular
platform was tailor-made for East Africa, and thus has an
application limited only to this geographic area, which is home to
more than 100 million individuals and presents high prevalence of
infectious diseases including HIV/AIDS, malaria, and tuberculosis
Master Mix Specific reaction Internal standard reaction Specificityb
PrimersaProbe Primers Probe
Forward Reverse Forward Reverse
HLA-B 028 B785F01 B911R02 B805P01 B224F01 B445R03 B320P01 B*1302, B*5101, B*5703,B*8101
HLA-B 029 B785F01 B932R03 B805P01 B224F01 B445R03 B320P01 B*5101, B*5703
HLA-B 030 B785F02 B879R01 B805P01 B224F01 B445R03 B320P01 B*0702, B*1503, B*1510,B*1516, B*1801, B*3501,B*5301, B*5701, B*5801,B*5802
HLA-B 031 B785F02 B911R02 B805P01 B224F01 B445R03 B320P01 B*1503, B*1510, B*1516,B*1801, B*3501, B*5301,B*5701, B*5801, B*5802
HLA-B 032 B785F02 B932R03 B805P01 B224F01 B445R03 B320P01 B*1503, B*1510, B*1516,B*3501, B*5301, B*5701,B*5801, B*5802
HLA-B 033 B793F01 B859R01 B805P01 B224F01 B445R03 B320P01 B*4403
HLA-B 034 B793F01 B879R02 B805P01 B224F01 B445R03 B320P01 B*2703, B*4403
HLA-B 035 B793F01 B911R03 B805P01 B224F01 B445R03 B320P01 B*2703, B*4403
HLA-B 036 B792F01 B911R02 B805P01 B224F01 B445R03 B320P01 B*1510, B*5101, B*5703,B*8101
HLA-B 037 B792F01 B911R04 B805P01 B224F01 B445R03 B320P01 B*0801, B*4101, B*4201,B*4202
HLA-B 038 B792F01 B932R02 B805P01 B224F01 B445R03 B320P01 B*1510, B*5101, B*5703
HLA-B 039 B793F02 B911R01 B805P01 B224F01 B445R03 B320P01 B*0702
HLA-B 040 B792F02 B911R02 B805P01 B224F01 B445R03 B320P01 B*1503, B*1516, B*1801,B*3501, B*5301, B*5701,B*5801, B*5802
HLA-B 041 B792F02 B932R02 B805P01 B224F01 B445R03 B320P01 B*1503, B*1516, B*3501,B*5301, B*5701, B*5801,B*5802
HLA-B 042 B792F03 B859R02 B805P01 B224F01 B445R03 B320P01 B*1503, B*1516, B*5701
HLA-B 043 B793F03 B879R03 B805P01 B224F01 B445R03 B320P01 B*1302
HLA-B 044 B793F04 B911R02 B805P01 B224F01 B445R03 B320P01 B*1302, B*4901
HLA-B 045 B793F05 B932R01 B805P01 B224F01 B445R03 B320P01 B*1402
HLA-B 046 B752F02 B859R03 B805P01 B224F01 B445R03 B320P01 B*1516
aprimer and probes names refer to Table 2.bOnly addressed alleles are indicated.doi:10.1371/journal.pone.0010751.t005
Table 5. Cont.
HLA Typing in East Africa
PLoS ONE | www.plosone.org 11 May 2010 | Volume 5 | Issue 5 | e10751
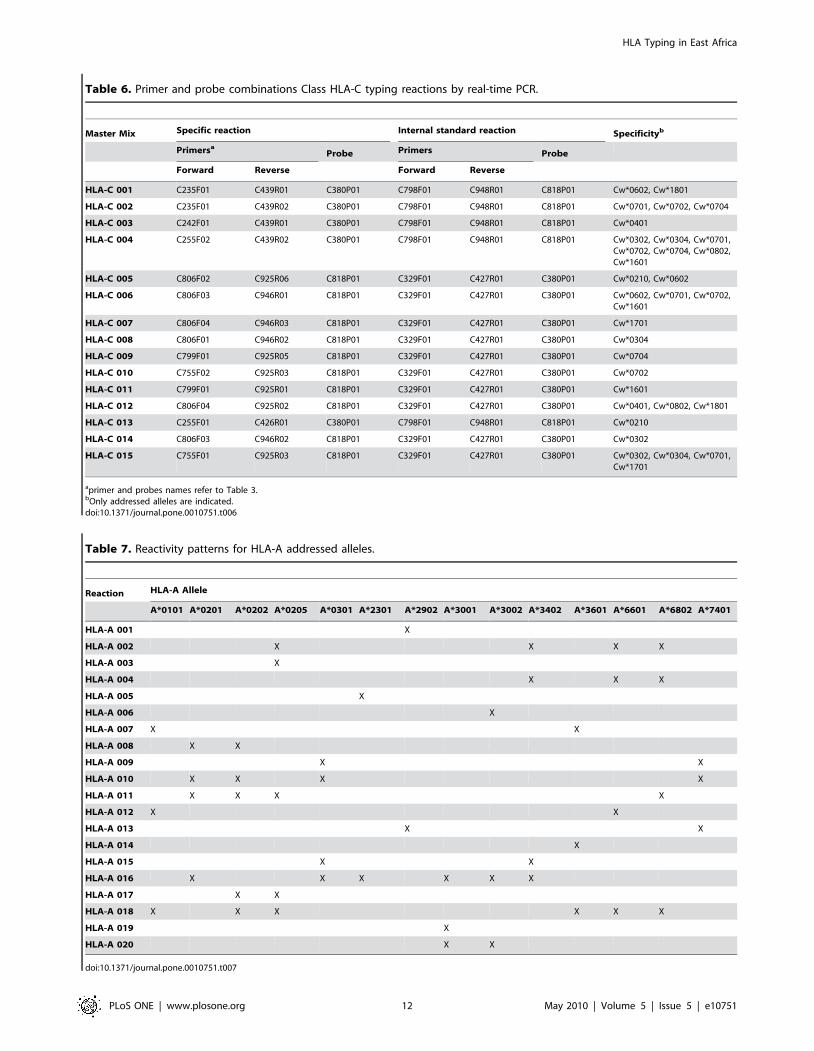
Table 6. Primer and probe combinations Class HLA-C typing reactions by real-time PCR.
Master Mix Specific reaction Internal standard reaction Specificityb
PrimersaProbe Primers Probe
Forward Reverse Forward Reverse
HLA-C 001 C235F01 C439R01 C380P01 C798F01 C948R01 C818P01 Cw*0602, Cw*1801
HLA-C 002 C235F01 C439R02 C380P01 C798F01 C948R01 C818P01 Cw*0701, Cw*0702, Cw*0704
HLA-C 003 C242F01 C439R01 C380P01 C798F01 C948R01 C818P01 Cw*0401
HLA-C 004 C255F02 C439R02 C380P01 C798F01 C948R01 C818P01 Cw*0302, Cw*0304, Cw*0701,Cw*0702, Cw*0704, Cw*0802,Cw*1601
HLA-C 005 C806F02 C925R06 C818P01 C329F01 C427R01 C380P01 Cw*0210, Cw*0602
HLA-C 006 C806F03 C946R01 C818P01 C329F01 C427R01 C380P01 Cw*0602, Cw*0701, Cw*0702,Cw*1601
HLA-C 007 C806F04 C946R03 C818P01 C329F01 C427R01 C380P01 Cw*1701
HLA-C 008 C806F01 C946R02 C818P01 C329F01 C427R01 C380P01 Cw*0304
HLA-C 009 C799F01 C925R05 C818P01 C329F01 C427R01 C380P01 Cw*0704
HLA-C 010 C755F02 C925R03 C818P01 C329F01 C427R01 C380P01 Cw*0702
HLA-C 011 C799F01 C925R01 C818P01 C329F01 C427R01 C380P01 Cw*1601
HLA-C 012 C806F04 C925R02 C818P01 C329F01 C427R01 C380P01 Cw*0401, Cw*0802, Cw*1801
HLA-C 013 C255F01 C426R01 C380P01 C798F01 C948R01 C818P01 Cw*0210
HLA-C 014 C806F03 C946R02 C818P01 C329F01 C427R01 C380P01 Cw*0302
HLA-C 015 C755F01 C925R03 C818P01 C329F01 C427R01 C380P01 Cw*0302, Cw*0304, Cw*0701,Cw*1701
aprimer and probes names refer to Table 3.bOnly addressed alleles are indicated.doi:10.1371/journal.pone.0010751.t006
Table 7. Reactivity patterns for HLA-A addressed alleles.
Reaction HLA-A Allele
A*0101 A*0201 A*0202 A*0205 A*0301 A*2301 A*2902 A*3001 A*3002 A*3402 A*3601 A*6601 A*6802 A*7401
HLA-A 001 X
HLA-A 002 X X X X
HLA-A 003 X
HLA-A 004 X X X
HLA-A 005 X
HLA-A 006 X
HLA-A 007 X X
HLA-A 008 X X
HLA-A 009 X X
HLA-A 010 X X X X
HLA-A 011 X X X X
HLA-A 012 X X
HLA-A 013 X X
HLA-A 014 X
HLA-A 015 X X
HLA-A 016 X X X X X X
HLA-A 017 X X
HLA-A 018 X X X X X X
HLA-A 019 X
HLA-A 020 X X
doi:10.1371/journal.pone.0010751.t007
HLA Typing in East Africa
PLoS ONE | www.plosone.org 12 May 2010 | Volume 5 | Issue 5 | e10751

[14]. Similar platforms based on the same principles, targeting the
HLA genetic diversity in other global populations (e.g., Southeast
Asia), are currently being designed to support large cohort-based
studies.
Using the novel typing platform, we were able to provide for the
first time a detailed description of a Tanzanian population. Genetic
distance analyses demonstrate that this population was highly
related to other sub-Saharan groups, and more specifically, it was
embedded within the previously defined major East African cluster
[32,33]. These results are concordant with recently published
findings, based on the analysis of non-immunogenetic loci
[57].The commonalities found between the Tanzanian, Ugandan
and Kenyan populations were reflected in the presence of the same
allelic lineages, defining the immunogenetic background of East
African populations. On the other hand, subtle genetic differences
among these groups were also evident, indicating the uniqueness of
each individual population within the major cluster. Interestingly,
each of these populations is home to unique genetic forms of
common widely spread pathogens. For instance, HIV type-1
strains circulating in East Africa represent mostly group-M
subtypes A, C, D, and a constellation of recombinant forms
among them, but the genetic subtypes are differently balanced in
each country [58,59,60,61,62]. Coupled with existing high-
throughput viral subtyping assays [62], the current platform will
be able to provide high-resolution HLA information with the
needed throughput, to elucidate the underlying immunogenetic
basis of this unique subtype distribution.
Among the most relevant immunoepidemiological applications
for the novel genotyping platform are association studies between
host genotype and disease susceptibility and outcome [31], and the
analysis of host-pathogen genetic co-variation [63,64]. Further-
more, this assay allows for the identification of large numbers of
individuals who are carriers of HLA alleles of interest to support
functional characterization of immune responses to pathogens [65]
or vaccines [66]. High-resolution HLA typing has provided deep
insight into the underlying molecular mechanisms of host-
pathogen interaction [67]. East Africa is one of the world regions
with the highest pathogen burdens [14], which can be mitigated by
preventive vaccines. The availability of high- throughput high-
resolution HLA typing platforms, such as the one presented here,
will be extremely useful in the identification of correlates of
immune protection and the evaluation of the effectiveness of
candidate vaccines.
Materials and Methods
Ethics StatementAll volunteers completed informed consent, and the study was
reviewed and approved by the human subject ethics and safety
committees, in compliance with all relevant federal guidelines and
institutional policies.
Sequence alignment for assay developmentPublished class I HLA-A, -B, and -C nucleotide sequences of
alleles reported in East Africa [32,33] were retrieved from the
IMGT/HLA Database (http://www.ebi.ac.uk/imgt/hla/) [68].
For each locus, alignments of nucleotide sequences representing
the targeted alleles were constructed using ClustalX [69] and were
manually edited using Genetic Data Environment [70]. Polymor-
phic sites that helped to discriminate among these alleles were
identified by visual inspection. The sequence analysis was
restricted to exons 2 and 3 of the HLA loci, which define the
peptide-binding a1 and a2 domains, the only region for which
sequences were available for all of the targeted alleles defined at
the 4-digit level.
Primer/Probe DesignOligonucleotide primers and probes were designed using Primer
Express software version 2.0 (Applied Biosystems, Foster City, CA)
and PrimerSelect version 7.1.0 as implemented in the Lasergene
package (DNASTAR, Madison, WI). The primers were designed
so that their 39extremes would determine their sequence
specificity, their melting temperature (Tm) would be approxi-
mately 65uC to ensure uniform amplification conditions, and with
Table 8. Reactivity patterns for HLA-C addressed alleles.
Reaction HLA-C Allele
Cw*0210 Cw*0302 Cw*0304 Cw*0401 Cw*0602 Cw*0701 Cw*0702 Cw*0704 Cw*0802 Cw*1601 Cw*1701 Cw*1801
HLA-C 001 X X
HLA-C 002 X X X
HLA-C 003 X
HLA-C 004 X X X X X X X
HLA-C 005 X X
HLA-C 006 X X X X
HLA-C 007 X
HLA-C 008 X
HLA-C 009 X
HLA-C 010 X
HLA-C 011 X
HLA-C 012 X X X
HLA-C 013 X
HLA-C 014 X
HLA-C 015 X X X X
doi:10.1371/journal.pone.0010751.t008
HLA Typing in East Africa
PLoS ONE | www.plosone.org 13 May 2010 | Volume 5 | Issue 5 | e10751

Table 9. Performance of typing platform on validation panel.
Class I HLA Allele Individuals bearing the allele(n)a Performance
Sensitivity Specificity Positive predictive value Negative predictive value
A*0101 19 100.0% 100.0% 100.0% 100.0%
A*0201 35 100.0% 100.0% 100.0% 100.0%
A*0202 13 100.0% 100.0% 100.0% 100.0%
A*0205 4 100.0% 100.0% 100.0% 100.0%
A*0301 13 100.0% 100.0% 100.0% 100.0%
A*2301 23 100.0% 100.0% 100.0% 100.0%
A*2902 13 100.0% 100.0% 100.0% 100.0%
A*3001 17 100.0% 100.0% 100.0% 100.0%
A*3002 27 100.0% 100.0% 100.0% 100.0%
A*3402 4 100.0% 100.0% 100.0% 100.0%
A*3601 9 100.0% 100.0% 100.0% 100.0%
A*6601 18 100.0% 100.0% 100.0% 100.0%
A*6802 17 100.0% 100.0% 100.0% 100.0%
A*7401 31 100.0% 100.0% 100.0% 100.0%
B*0702 13 100.0% 100.0% 100.0% 100.0%
B*0801 12 100.0% 100.0% 100.0% 100.0%
B*1302 4 100.0% 100.0% 100.0% 100.0%
B*1402 10 100.0% 100.0% 100.0% 100.0%
B*1503 25 100.0% 100.0% 100.0% 100.0%
B*1510 15 100.0% 100.0% 100.0% 100.0%
B*1516 1 100.0% 100.0% 100.0% 100.0%
B*1801 5 100.0% 100.0% 100.0% 100.0%
B*3501 4 100.0% 100.0% 100.0% 100.0%
B*4101 3 100.0% 100.0% 100.0% 100.0%
B*4201 21 100.0% 100.0% 100.0% 100.0%
B*4202 1 100.0% 100.0% 100.0% 100.0%
B*4403 1 100.0% 100.0% 100.0% 100.0%
B*4501 32 100.0% 100.0% 100.0% 100.0%
B*4901 14 100.0% 100.0% 100.0% 100.0%
B*5101 3 100.0% 100.0% 100.0% 100.0%
B*5301 34 100.0% 100.0% 100.0% 100.0%
B*5703 9 100.0% 100.0% 100.0% 100.0%
B*5801 19 100.0% 100.0% 100.0% 100.0%
B*5802 29 100.0% 100.0% 100.0% 100.0%
B*8101 14 100.0% 100.0% 100.0% 100.0%
Cw*0210 26 100.0% 100.0% 100.0% 100.0%
Cw*0302 9 100.0% 100.0% 100.0% 100.0%
Cw*0304 21 100.0% 100.0% 100.0% 100.0%
Cw*0401 47 100.0% 100.0% 100.0% 100.0%
Cw*0602 55 100.0% 100.0% 100.0% 100.0%
Cw*0701 46 100.0% 100.0% 100.0% 100.0%
Cw*0702 11 100.0% 100.0% 100.0% 100.0%
Cw*0704 6 100.0% 100.0% 100.0% 100.0%
Cw*0802 13 100.0% 100.0% 100.0% 100.0%
Cw*1601 15 100.0% 100.0% 100.0% 100.0%
Cw*1701 23 100.0% 100.0% 100.0% 100.0%
Cw*1801 10 100.0% 100.0% 100.0% 100.0%
aOnly samples from individuals bearing fully-addressed genotypes at the corresponding locus are reported (HLA-A: n = 125; HLA-B: n = 141; HLA-C: n = 151).doi:10.1371/journal.pone.0010751.t009
HLA Typing in East Africa
PLoS ONE | www.plosone.org 14 May 2010 | Volume 5 | Issue 5 | e10751

minimal potential for constrained secondary structure or primer-
dimer formation. TaqMan fluorescent probes, targeting highly
conserved regions, were designed to serve as universal reagents
that allow for kinetic read-out by real-time PCR.
Real-time PCR-SSPFor HLA typing, 900–980 bp fragments encompassing exons 2
through 3 of HLA-A, -B, or -C were PCR amplified in three
separate reactions using locus-specific primers targeting conserved
regions of each respective HLA gene, as previously described
[46,47]. Briefly, the first-round PCR contained 106 PCR Gold
Buffer (Applied Biosystems, Foster City, CA), 200 nM of each
dNTP, 1.5 mM MgCl2, 400 nM of each primer (Sigma Aldrich,
St. Louis, MO) [46], 1.25 U of AmpliTaq Gold DNA Polymerase
(Applied Biosystems, Foster City, CA) and genomic DNA (20–
100 ng) in a final volume of 50 uL. Thermocycling conditions
were: 10 min at 95uC, followed by 30 cycles of 30 seconds at
95uC, 1 minute at 65uC, and 2 min at 72uC. First-round PCR
products were each diluted 1000-fold in molecular-grade water for
use in subsequent real-time PCR-based genotyping reactions.
Corresponding first-round PCR dilutions were distributed into 20,
46 and 15 separate real-time-PCR-SSPs for the targeted variants
in HLA-A, -B, and -C, respectively. Each reaction used a
multiplex format designed to target both a sequence-specific
region and a non-polymorphic region of the amplicon itself, for
internal standardization. Amplification was monitored in real-time
using TaqMan fluorescent probes. When variation was assessed in
the exon 2 using polymorphism-specific primers and FAM-labeled
probes, the internal standardization reaction was designed to
amplify a segment of exon 3 with detection by TET-labeled
probes, and vice versa for exon 3. Tables 1, Table 2, Table 3,
Table 4, Table 5 and Table 6 indicate the sequences and
combinations of primers and probes used for each of the typing
reactions. Several primers contain locked nucleic acid (LNA)
modifications at the 39 extreme [71,72]. Because LNAs are a class
of nucleic acid analogues that have a more rigid configuration
than standard oligonucleotide primers, they perform with higher
specificity than standard primers, although sometimes at the
expense of amplification efficiency [47]. The applicability of LNAs
for each reaction was determined empirically (data not shown).
Each of the genotyping real-time PCR mixtures consisted of
TaqMan 26 Universal PCR Master Mix No AmpErase UNG
(Applied Biosystems, Foster City, CA), 400 nM of each forward
and reverse sequence-specific primers (Sigma Aldrich, St. Louis,
MO and Exiqon, Vedbaek, Denmark), 400 nM of each forward
and reverse universal primers (Sigma Aldrich, St. Louis, MO),
250 nM of a locus-specific probe (Sigma Aldrich, St. Louis, MO),
250 nM of an internal-standardization probe (Sigma Aldrich, St.
Louis, MO), and diluted first-round PCR product, in a final
volume of 6.25 uL. Samples were run in a 384-well plate format
with the following thermocycling program: 10 min at 95uCfollowed by 60 cycles of 15 seconds at 95uC and 1 minute at
60uC. The intensity of each fluorescent probe was read
automatically by the 7900HT Fast Real-time PCR System
(Applied Biosystems, Foster City, CA) then analyzed and
interpreted with Sequence Detection Software version 2.2.2
(Applied Biosystems, Foster City, CA) as the cycle threshold (Ct),
i.e., the number of cycles required to bring the fluorescent signal
generated in the reaction above a set threshold. Samples that did
not cross the threshold were manually assigned a Ct of the
maximum 60. In all cases, non-template controls were included
where water substituted for genomic DNA. Positive reactivity for
each reaction was determined by computation of the difference in
Ct values between the sequence-specific and the internal-
standardization reactions and comparison to empirically deter-
mined cut-offs. The calling of HLA genotypes was performed by
comparing the observed aggregate reactivity patterns of real-time
PCR-SSP with those deduced from the sequences of addressed
alleles (Table 7, Table 8, Table S1, Table S2, Table S3, and
Table S4).
Assay validationAssay validation was based on a panel of 175 specimens from
Kampala, Uganda, previously characterized by class I HLA-A, -B,
and -C SBT at the 4-digit level [33]. Genomic DNA was extracted
from Epstein-Barr virus (EBV) transformed B-cell lines prepared
from peripheral blood mononuclear cells (PBMCs) separated from
whole blood (MagNA pure total nucleic acid extraction, Roche
Diagnostics Corp., Indianapolis, IN). Detailed previous analysis
had demonstrated that these specimens provided a representative
sample of the HLA genetic diversity found in East Africa [33]. The
samples represented 108, 114, and 80 different HLA-A, -B, and -C
genotypes, respectively, and included alleles A*0101, A*0102,
A*0103, A*0109, A*0123, A*0201, A*0202, A*0205, A*0214,
A*0301, A*2301, A*2402, A*2601, A*2612, A*2901, A*2902,
A*3001, A*3002, A*3004, A*3009, A*3101, A*3104, A*3201,
A*3303, A*3402, A*3601, A*6601, A*6602, A*6603, A*6801,
A*6802, A*7401, A*7403, , B*0702, B*0705, B*0801, B*1302,
B*1303, B*1401, B*1402, B*1503, B*1510, B*1516, B*1531,
B*1537, B*1801, B*1803, B*3501, B*3502, B*3503, B*3701,
B*3910, B*3924, B*4012, B*4101, B*4102, B*4201, B*4202,
B*4403, B*4415, B*4501, B*4703, B*4901, B*5001, B*5101,
B*5301, B*5702, B*5703, B*5801, B*5802, B*7301, B*8101,
B*8202, , Cw*0210, Cw*0302, Cw*0304, Cw*0401, Cw*0404,
Cw*0407, Cw*0501, Cw*0602, Cw*0622, Cw*0701, Cw*0702,
Cw*0704, Cw*0706, Cw*0718, Cw*0802, Cw*0804, Cw*1203,
Cw*1402, Cw*1505, Cw*1601, Cw*1602, Cw*1701, Cw*1801.
Sensitivity, specificity, PPV, and NPV of the real-time PCR-SSP
platform were calculated as previously described by Altman and
Bland [73,74] using SBT as the reference method.
Field test of the assayA sample set from Tanzania was used to field test the real-time
PCR-SSP platform. Between September 2002 to April 2003, 3096
volunteers from Mbeya (southwestern Tanzania, latitude
8u549530S and longitude 33u279430E) were enrolled in a
prospective community cohort study, with the objective of
assessing the suitability of different population groups for HIV
vaccine cohort development. The composition of this cohort was
described in detail elsewhere [58]. The study was conducted
jointly by the Mbeya Regional AIDS Control Programme
(Tanzanian Ministry of Health), the Department of Infectious
Diseases & Tropical Medicine, Ludwigs-Maximillians University
(Munich, Germany), the Walter Reed Army Institute of Research
(Rockville, MD, USA), and the Henry M. Jackson Foundation for
the Advancement of Military Medicine (Rockville, MD, USA).
Blood samples collected from 174 randomly selected individuals,
out of the 2479 participants who remained HIV sero-negative for
the 42-month duration of the study, were available for HLA
typing. This sample set included 110 female (63.2%), and the
median age was 26 years (inter-quartile interval: 21–35 years). All
of the tested participants were Black Africans residing in the
Mbeya Region, and were recruited from the urban Ghana ward in
Mbeya Town, and from the small rural village of Itende. Genomic
DNA was extracted from peripheral blood mononuclear cells
(PBMCs) separated from whole blood (MagNA pure total nucleic
acid extraction, Roche Diagnostics Corp., Indianapolis, IN).
HLA Typing in East Africa
PLoS ONE | www.plosone.org 15 May 2010 | Volume 5 | Issue 5 | e10751

Comparison of genetic composition among worldpopulations
Class I HLA-A, -B, and -C allele frequencies from world
populations were retrieved from the dbMHC database [75]. To
facilitate the comparison between the current SBT HLA data with
historical datasets, which were often described using other
techniques or with other levels of molecular resolution, allele
Cw*0210 was considered synonymous with Cw*0202 [76].
Similarly, for HLA-C alleles that are often not distinguishable,
the previously defined allele grouping systems were applied, which
include Cw*0401G, Cw*0501G, Cw*0701G, Cw*0704G,
Cw*1701G, and Cw*1801G [32]. Inter-population genetic
distances were estimated using the definition proposed by
Cavalli-Sforza and Bodmer [49,50], which is a measure of the
level of overlap of genetic variants between pairs of populations, as
implemented by the GENDIST module of PHYLIP (Phylogeny
Inference Package) version 3.6 [77]. The estimated genetic
distance matrixes so obtained were used to construct unrooted
dendrograms through the neighbor-joining algorithm [78] as
implemented in MEGA version 4 [79]. Contingency tables were
tested using the Fisher’s exact test and the Fisher-Freeman-Halton
test using StatXact Version 6 (Cytel Software Corporation, MA).
Principal component analysis (PCA) was performed using JMPH,
Version 7.0.2 (SAS Institute Inc., Cary, NC) based on the
calculated genetic distances.
Supporting Information
Table S1 Reactivity patterns for HLA-B addressed alleles.
Found at: doi:10.1371/journal.pone.0010751.s001 (0.03 MB
XLS)
Table S2 Expected reactivity patterns for 105 HLA-A genotypes
among addressed alleles.
Found at: doi:10.1371/journal.pone.0010751.s002 (0.05 MB
XLS)
Table S3 Expected reactivity patterns for 276 HLA-B genotypes
among addressed alleles.
Found at: doi:10.1371/journal.pone.0010751.s003 (0.21 MB
XLS)
Table S4 Expected reactivity patterns for 78 HLA-C genotypes
among addressed alleles.
Found at: doi:10.1371/journal.pone.0010751.s004 (0.04 MB
XLS)
Table S5 Class I HLA-A, -B, and -C genotypes of 175 samples
from Kampala, Uganda, used for assay validation.
Found at: doi:10.1371/journal.pone.0010751.s005 (0.04 MB
XLS)
Table S6 Examples of expected and observed reactivity patterns
for non-addressed genotypes. See text for details.
Found at: doi:10.1371/journal.pone.0010751.s006 (0.03 MB
XLS)
Table S7 Performance of typing platform on the complete
sample set from Kampala, Uganda (n = 175).
Found at: doi:10.1371/journal.pone.0010751.s007 (0.06 MB
DOC)
Table S8 Allele frequencies for class I HLA-A,-B, and -C in
Mbeya, Tanzania (2n = 348). Only alleles addressed by the current
SSP-real-time PCR assay are listed. See text for details.
Found at: doi:10.1371/journal.pone.0010751.s008 (0.06 MB
DOC)
Table S9 Observed genotypes in Tanzania (n = 174) did not
significantly differ from those expected under Hardy-Weinberg
equilibrium.
Found at: doi:10.1371/journal.pone.0010751.s009 (0.09 MB
DOC)
Figure S1 Locus-specific pre-amplification is necessary for
optimal performance of SSP-real time PCR-based HLA typing.
Performance of reaction HLA-B016 (which is specific for HLA-
B*0702, HLA-B*0801, HLA-B*1402, HLA-B*1503, HLA-
B*1510, HLA-B*1801, HLA-B*4201, HLA-B*4202, and HLA-
B*8101) on Ugandan samples a) before, and b) after subjecting to
HLA-B-specific PCR pre-amplification. Red circles and black
crosses depict carriers and non-carriers of the addressed
polymorphisms, respectively. Non-template controls are depicted
by triangles. See text for details.
Found at: doi:10.1371/journal.pone.0010751.s010 (1.55 MB TIF)
Figure S2 Carrier frequencies of major class I HLA alleles in
East African populations. Carrier frequencies of alleles addressed
by the current platform are shown for the Kenyan Highlander
[Nandi] [32] (yellow), Kenyan Lowlander [Luo] (orange) [32],
Uganda [33] (green) and the current Tanzanian population (red).
Found at: doi:10.1371/journal.pone.0010751.s011 (0.73 MB TIF)
Figure S3 Principal component analysis showing the location of
the Mbeya, Tanzania population in the context of global class I
HLA genetic diversity. Principal component analysis (PCA) based
on genetic distances in HLA-A,-B, and -C loci. Reference world
populations were retrieved from the dbMHC [75]. In interest of
clarity, only the first and second principal components are shown,
which account for 79.4% of the variance. The composition of the
outlined sub-Saharan cluster is shown in detail in the inset. The
expanded box shows a close up the sub-Saharan populations.
Populations are labeled as follows: 1: AmericanSamoa (American
Samoa, United States), 2: Amerindian (United States), 3: Ami97
(Taiwan), 4: ArabDruze (Israel), 5: Atayal (Taiwan), 6: Bari
(Venezuela), 7: Brazilian Admixed (Brazil), 8: Bulgarian (Bulgaria),
9: Bunun (Taiwan), 10: Canoncito (New Mexico, United States),
11: CapeYork (Australia), 12: Chinese (China), 14: Mbeya
(Tanzania), 16: Czech (Czech Republic), 17: Doggon (Mali), 18:
Filipino (Phillipines), 19: Finn90 (Finland), 20: Georgian (Georgia),
21: GrooteEylandt (Australia), 22: Guarani-Kaiowa (Brazil), 23:
Guarani-Nandewa (Brazil), 24: Hakka (Taiwan), 25: Irish
(Ireland), 26: IsraeliJews (Irish), 27: Ivatan (Philippines), 28:
JavaneseIndonesian (Singapore), 29: Kenyan142 (Kenya), 30:
KenyanHighlander (Kenya), 31: KenyanLowlander (Kenya), 32:
Kimberley (Australia), 33: Korean200 (South Korea), 34: Kurdish
(Georgia), 35: Malay (Singapore), 36: Minnan (Taiwan), 37:
NewDelhi (India), 38: African American (United States), 39: Asian
American (United States), 40: Caucasian (United States), 41:
Hispanic (United States), 42: Okinawan (United States), 43:
Paiwan51 (Taiwan), 44: Pazeh (Taiwan), 45: Puyuma49 (Taiwan),
46: Rukai (Taiwan), 47: Kampala, Uganda (Uganda), 48: Saisiat
(Taiwan), 49: Shona (Zimbabwe), 50: Siraya (Taiwan), 51: Tamil
(South Africa), 52: Thai (Singapore), 53: Thao (Taiwan), 54:
Toroko (Taiwan), 55: Tsou (Taiwan), 56: Tuva (Taiwan), 58:
Yami (Taiwan), 59: Yuendumu (Australia), 60: Yupik (Alaska,
United States), 61: Zambian (Zambia), 62: Zulu (South Africa).
See text for details.
Found at: doi:10.1371/journal.pone.0010751.s012 (1.26 MB TIF)
Figure S4 Dendrogram showing the location of the Mbeya,
Tanzania population in the context of global class I HLA genetic
diversity. The unrooted dendrogram was built using combined
HLA-A,-B, -C allele frequency derived genetic distances. The
HLA Typing in East Africa
PLoS ONE | www.plosone.org 16 May 2010 | Volume 5 | Issue 5 | e10751
expanded box shows a close up the sub-Saharan populations.
Populations are labeled as follows: 1: AmericanSamoa (American
Samoa, United States), 2: Amerindian (United States), 3: Ami97
(Taiwan), 4: ArabDruze (Israel), 5: Atayal (Taiwan), 6: Bari
(Venezuela), 7: Brazilian Admixed (Brazil), 8: Bulgarian (Bulgaria),
9: Bunun (Taiwan), 10: Canoncito (New Mexico, United States),
11: CapeYork (Australia), 12: Chinese (China), 14: Mbeya
(Tanzania), 16: Czech (Czech Republic), 17: Doggon (Mali), 18:
Filipino (Phillipines), 19: Finn90 (Finland), 20: Georgian (Georgia),
21: GrooteEylandt (Australia), 22: Guarani-Kaiowa (Brazil), 23:
Guarani-Nandewa (Brazil), 24: Hakka (Taiwan), 25: Irish
(Ireland), 26: IsraeliJews (Irish), 27: Ivatan (Philippines), 28:
JavaneseIndonesian (Singapore), 29: Kenyan142 (Kenya), 30:
KenyanHighlander (Kenya), 31: KenyanLowlander (Kenya), 32:
Kimberley (Australia), 33: Korean200 (South Korea), 34: Kurdish
(Georgia), 35: Malay (Singapore), 36: Minnan (Taiwan), 37:
NewDelhi (India), 38: African American (United States), 39: Asian
American (United States), 40: Caucasian (United States), 41:
Hispanic (United States), 42: Okinawan (United States), 43:
Paiwan51 (Taiwan), 44: Pazeh (Taiwan), 45: Puyuma49 (Taiwan),
46: Rukai (Taiwan), 47: Kampala, Uganda (Uganda), 48: Saisiat
(Taiwan), 49: Shona (Zimbabwe), 50: Siraya (Taiwan), 51: Tamil
(South Africa), 52: Thai (Singapore), 53: Thao (Taiwan), 54:
Toroko (Taiwan), 55: Tsou (Taiwan), 56: Tuva (Taiwan), 58:
Yami (Taiwan), 59: Yuendumu (Australia), 60: Yupik (Alaska,
United States), 61: Zambian (Zambia), 62: Zulu (South Africa).
The Tanzanian population is depicted as a filled triangle. See text
for details.
Found at: doi:10.1371/journal.pone.0010751.s013 (0.86 MB TIF)
Acknowledgments
The authors would like to thank Mr. Olalesi Osunsade and Mrs. Nasheed
Moqueet at the U.S. Military HIV Research Program, Rockville, MD for
their technical assistance. The views and opinions expressed herein do not
necessarily reflect those of the U.S. Army, the Department of Defense or
the National Institutes of Health.
Author Contributions
Conceived and designed the experiments: RNK AMW EESB FM GHK.
Performed the experiments: RNK AMW. Analyzed the data: RNK AMW
CB GHK. Contributed reagents/materials/analysis tools: LAE MAE JRC
FWM MH LM JK NM MLR. Wrote the paper: RNK GHK. Critical
review of manuscript: AMW EESB LAE MAE JRC CB FWM MH LM JK
NM MLR FM.
References
1. Rimmelzwaan GF, Fouchier RA, Osterhaus AD (2007) Influenza virus-specific
cytotoxic T lymphocytes: a correlate of protection and a basis for vaccine
development. Curr Opin Biotechnol 18: 529–536.
2. Stenger S (2001) Cytolytic T cells in the immune response to mycobacterium
tuberculosis. Scand J Infect Dis 33: 483–487.
3. Parham P (2005) MHC class I molecules and KIRs in human history, health and
survival. Nat Rev Immunol 5: 201–214.
4. International HapMap Consortium (2005) A haplotype map of the human
genome. Nature 437: 1299–1320.
5. Anthony Nolan Research Institute (2009) Full List of HLA Class I Alleles
Assigned July 2009.
6. Solberg OD, Mack SJ, Lancaster AK, Single RM, Tsai Y, et al. (2008) Balancing
selection and heterogeneity across the classical human leukocyte antigen loci: a
meta-analytic review of 497 population studies. Hum Immunol 69: 443–464.
7. Parham P, Ohta T (1996) Population biology of antigen presentation by MHC
class I molecules. Science 272: 67–74.
8. Prugnolle F, Manica A, Charpentier M, Guegan JF, Guernier V, et al. (2005)
Pathogen-driven selection and worldwide HLA class I diversity. Curr Biol 15:
1022–1027.
9. Probst CM, Bompeixe EP, Pereira NF, de ODMM, Visentainer JE, et al. (2000)
HLA polymorphism and evaluation of European, African, and Amerindian
contribution to the white and mulatto populations from Parana, Brazil. Hum
Biol 72: 597–617.
10. Olsson KS, Ritter B, Hansson N, Chowdhury RR (2008) HLA haplotype map of
river valley populations with hemochromatosis traced through five centuries in
Central Sweden. Eur J Haematol 81: 36–46.
11. Hughes AL, Yeager M (1998) Natural selection at major histocompatibility
complex loci of vertebrates. Annu Rev Genet 32: 415–435.
12. Takahata N, Nei M (1990) Allelic genealogy under overdominant and
frequency-dependent selection and polymorphism of major histocompatibility
complex loci. Genetics 124: 967–978.
13. Stoneking M, Fontius JJ, Clifford SL, Soodyall H, Arcot SS, et al. (1997) Alu
insertion polymorphisms and human evolution: evidence for a larger population
size in Africa. Genome Res 7: 1061–1071.
14. Global Infectious Diseases and Epidemiology Network GIDEON database, Tel
Aviv Medical Centre, Israel. Available: http://www.gideononline.com.
15. World Health Organization (2008) World malaria report 2008. Geneva,
Switzerland.
16. World Health Organization (2009) WHO REPORT 2009 Global Tuberculosis
Control - EPIDEMIOLOGY, STRATEGY, FINANCING.
17. Joint United Nations Programme on HIV/AIDS (UNAIDS) (2008) Report on
the global AIDS epidemic - 2008. Geneva, Switzerland.
18. Desjeux P (2001) The increase in risk factors for leishmaniasis worldwide.
Trans R Soc Trop Med Hyg 95: 239–243.
19. World Health Organization (2006) Schistosomiasis and soil-transmitted
helminth infections – preliminary estimates of the number of children treated
with albendazole or mebendazole. WEEKLY EPIDEMIOLOGICAL RE-
CORD 81: 145–164.
20. World Health Organization (2006) Outbreak of Marburg haemorrhagic fever:
Uganda, June–August 2007. WEEKLY EPIDEMIOLOGICAL RECORD 82:
381–384.
21. World Health Organization (2007) Rift Valley Fever in Kenya, Somalia and the
United Republic of Tanzania.
22. World Health Organization (2007) Ebola haemorrhagic fever in Uganda.
23. Hill AV, Allsopp CE, Kwiatkowski D, Anstey NM, Twumasi P, et al. (1991)Common west African HLA antigens are associated with protection from severe
malaria. Nature 352: 595–600.
24. Hill AV, Yates SN, Allsopp CE, Gupta S, Gilbert SC, et al. (1994) Human
leukocyte antigens and natural selection by malaria. Philos Trans R SocLond B Biol Sci 346: 379–385.
25. Kettaneh A, Seng L, Tiev KP, Toledano C, Fabre B, et al. (2006) Human
leukocyte antigens and susceptibility to tuberculosis: a meta-analysis of case-
control studies. Int J Tuberc Lung Dis 10: 717–725.
26. Raja A (2004) Immunology of tuberculosis. Indian J Med Res 120: 213–232.
27. Basu R, Roy S, Walden P (2007) HLA class I-restricted T cell epitopes of thekinetoplastid membrane protein-11 presented by Leishmania donovani-infected
human macrophages. J Infect Dis 195: 1373–1380.
28. Sanchez A, Wagoner KE, Rollin PE (2007) Sequence-based human leukocyte
antigen-B typing of patients infected with Ebola virus in Uganda in 2000:identification of alleles associated with fatal and nonfatal disease outcomes.
J Infect Dis 196 Suppl 2: S329–336.
29. Abdel-Salam E, Abdel Khalik A, Abdel-Meguid A, Barakat W, Mahmoud AA(1986) Association of HLA class I antigens (A1, B5, B8 and CW2) with disease
manifestations and infection in human schistosomiasis mansoni in Egypt. Tissue
Antigens 27: 142–146.
30. Leslie A, Price DA, Mkhize P, Bishop K, Rathod A, et al. (2006) Differentialselection pressure exerted on HIV by CTL targeting identical epitopes but
restricted by distinct HLA alleles from the same HLA supertype. J Immunol 177:4699–4708.
31. Kiepiela P, Leslie AJ, Honeyborne I, Ramduth D, Thobakgale C, et al. (2004)Dominant influence of HLA-B in mediating the potential co-evolution of HIV
and HLA. Nature 432: 769–775.
32. Cao K, Moormann AM, Lyke KE, Masaberg C, Sumba OP, et al. (2004)Differentiation between African populations is evidenced by the diversity of
alleles and haplotypes of HLA class I loci. Tissue Antigens 63: 293–325.
33. Kijak GH, Walsh AM, Koehler RN, Moqueet N, Eller LA, et al. (2009) HLA
class I allele and haplotype diversity in Ugandans supports the presence of amajor east African genetic cluster. Tissue Antigens 73: 262–269.
34. Ellis JM, Mack SJ, Leke RF, Quakyi I, Johnson AH, et al. (2000) Diversity is
demonstrated in class I HLA-A and HLA-B alleles in Cameroon, Africa:description of HLA-A*03012, *2612, *3006 and HLA-B*1403, *4016, *4703.
Tissue Antigens 56: 291–302.
35. Louie LG, Hartogensis WE, Jackman RP, Schultz KA, Zijenah LS, et al. (2004)
Mycobacterium tuberculosis/HIV-1 coinfection and disease: role of humanleukocyte antigen variation. J Infect Dis 189: 1084–1090.
36. Luo M, Embree J, Ramdahin S, Ndinya-Achola J, Njenga S, et al. (2002) HLA-
A and HLA-B in Kenya, Africa: allele frequencies and identification of HLA-
B*1567 and HLA-B*4426. Tissue Antigens 59: 370–380.
37. Middleton D, Williams F, Meenagh A, Daar AS, Gorodezky C, et al. (2000)Analysis of the distribution of HLA-A alleles in populations from five continents.
Hum Immunol 61: 1048–1052.
38. Sanchez-Mazas A, Steiner QG, Grundschober C, Tiercy JM (2000) Themolecular determination of HLA-Cw alleles in the Mandenka (West Africa)
HLA Typing in East Africa
PLoS ONE | www.plosone.org 17 May 2010 | Volume 5 | Issue 5 | e10751
reveals a close genetic relationship between Africans and Europeans. Tissue
Antigens 56: 303–312.39. Tang J, Naik E, Costello C, Karita E, Rivers C, et al. (2000) Characteristics of
HLA class I and class II polymorphisms in Rwandan women. Exp Clin
Immunogenet 17: 185–198.40. Williams F, Meenagh A, Darke C, Acosta A, Daar AS, et al. (2001) Analysis of
the distribution of HLA-B alleles in populations from five continents. HumImmunol 62: 645–650.
41. Brander C, Frahm N, Walker BD (2006) The challenges of host and viral
diversity in HIV vaccine design. Curr Opin Immunol 18: 430–437.42. Burton PR, Hansell AL, Fortier I, Manolio TA, Khoury MJ, et al. (2009) Size
matters: just how big is BIG?: Quantifying realistic sample size requirements forhuman genome epidemiology. Int J Epidemiol 38: 263–273.
43. Adams SD, Barracchini KC, Chen D, Robbins F, Wang L, et al. (2004)Ambiguous allele combinations in HLA Class I and Class II sequence-based
typing: when precise nucleotide sequencing leads to imprecise allele identifica-
tion. J Transl Med 2: 30.44. Browning MJ, Krausa P, Rowan A, Bicknell DC, Bodmer JG, et al. (1993)
Tissue typing the HLA-A locus from genomic DNA by sequence-specific PCR:comparison of HLA genotype and surface expression on colorectal tumor cell
lines. Proc Natl Acad Sci U S A 90: 2842–2845.
45. Trachtenberg E, Korber B, Sollars C, Kepler TB, Hraber PT, et al. (2003)Advantage of rare HLA supertype in HIV disease progression. Nat Med 9:
928–935.46. Cereb N, Maye P, Lee S, Kong Y, Yang SY (1995) Locus-specific amplification
of HLA class I genes from genomic DNA: locus-specific sequences in the firstand third introns of HLA-A, -B, and -C alleles. Tissue Antigens 45: 1–11.
47. Koehler RN, Walsh AM, Moqueet N, Currier JR, Eller MA, et al. (2009) High-
throughput genotyping of KIR2DL2/L3, KIR3DL1/S1, and their HLA class Iligands using real-time PCR. Tissue Antigens 74: 73–80.
48. Robinson J, Marsh SG (2007) IPD: the Immuno Polymorphism Database.Methods Mol Biol 409: 61–74.
49. Cavalli-Sforza LL, Edwards AW (1967) Phylogenetic analysis. Models and
estimation procedures. Am J Hum Genet 19: 233–257.50. Cavalli-Sforza L, Bodmer WF (1971) The Genetics of Human Populations. San
Francisco, CA: W.H. Freeman.51. Middleton D, Menchaca L, Rood H, Komerofsky R (2003) New allele frequency
database: http://www.allelefrequencies.net. Tissue Antigens 61: 403–407.52. Luedeck H, Blasczyk R (1997) Fluorotyping of HLA-C: differential detection of
amplicons by sequence-specific priming and fluorogenic probing. Tissue
Antigens 50: 627–638.53. Slateva K, Camps MA, Blasczyk R (1998) Fluorotyping of HLA-A by sequence-
specific priming and fluorogenic probing. Tissue Antigens 52: 462–472.54. Lienert K, Parham P (1996) Evolution of MHC class I genes in higher primates.
Immunol Cell Biol 74: 349–356.
55. Xiang Q, Xu B, Fu R, Li D (2005) Real time PCR on disposable PDMS chipwith a miniaturized thermal cycler. Biomed Microdevices 7: 273–279.
56. Walczak R, Dziuban JA, Koszur J, Bang DD, Ruano-Lopez J (2008)Miniaturized Real-Time PCR System: Toward Smart Diagnostic Device for
Point-of-Care Food Pathogens DNA Analyze. 19–21 June 2008. Poznan,Poland. pp 633–636.
57. Tishkoff SA, Reed FA, Friedlaender FR, Ehret C, Ranciaro A, et al. (2009) The
genetic structure and history of Africans and African Americans. Science 324:1035–1044.
58. Arroyo MA, Hoelscher M, Sateren W, Samky E, Maboko L, et al. (2005) HIV-1diversity and prevalence differ between urban and rural areas in the Mbeya
region of Tanzania. Aids 19: 1517–1524.
59. Arroyo MA, Sateren WB, Serwadda D, Gray RH, Wawer MJ, et al. (2006)Higher HIV-1 incidence and genetic complexity along main roads in Rakai
District, Uganda. J Acquir Immune Defic Syndr 43: 440–445.
60. Dowling WE, Kim B, Mason CJ, Wasunna KM, Alam U, et al. (2002) Forty-one
near full-length HIV-1 sequences from Kenya reveal an epidemic of subtype Aand A-containing recombinants. Aids 16: 1809–1820.
61. Harris ME, Serwadda D, Sewankambo N, Kim B, Kigozi G, et al. (2002)Among 46 near full length HIV type 1 genome sequences from Rakai District,
Uganda, subtype D and AD recombinants predominate. AIDS Res Hum
Retroviruses 18: 1281–1290.
62. Hoelscher M, Kim B, Maboko L, Mhalu F, von Sonnenburg F, et al. (2001)
High proportion of unrelated HIV-1 intersubtype recombinants in the Mbeyaregion of southwest Tanzania. Aids 15: 1461–1470.
63. Leslie A, Kavanagh D, Honeyborne I, Pfafferott K, Edwards C, et al. (2005)Transmission and accumulation of CTL escape variants drive negative
associations between HIV polymorphisms and HLA. J Exp Med 201: 891–902.
64. Moore CB, John M, James IR, Christiansen FT, Witt CS, et al. (2002) Evidence
of HIV-1 adaptation to HLA-restricted immune responses at a population level.Science 296: 1439–1443.
65. Frahm N, Yusim K, Suscovich TJ, Adams S, Sidney J, et al. (2007) ExtensiveHLA class I allele promiscuity among viral CTL epitopes. Eur J Immunol 37:
2419–2433.
66. Harari A, Bart PA, Stohr W, Tapia G, Garcia M, et al. (2008) An HIV-1 clade C
DNA prime, NYVAC boost vaccine regimen induces reliable, polyfunctional,
and long-lasting T cell responses. J Exp Med 205: 63–77.
67. Kawashima Y, Pfafferott K, Frater J, Matthews P, Payne R, et al. (2009)
Adaptation of HIV-1 to human leukocyte antigen class I. Nature 458: 641–645.
68. Robinson J, Waller MJ, Fail SC, McWilliam H, Lopez R, et al. (2009) The
IMGT/HLA database. Nucleic Acids Res 37: D1013–1017.
69. Thompson JD, Gibson TJ, Plewniak F, Jeanmougin F, Higgins DG (1997) The
CLUSTAL X windows interface: flexible strategies for multiple sequencealignment aided by quality analysis tools. Nucleic Acids Res 25: 4876–4882.
70. Smith SW, Overbeek R, Woese CR, Gilbert W, Gillevet PM (1994) The geneticdata environment an expandable GUI for multiple sequence analysis. Comput
Appl Biosci 10: 671–675.
71. Mouritzen P, Nielsen AT, Pfundheller HM, Choleva Y, Kongsbak L, et al.
(2003) Single nucleotide polymorphism genotyping using locked nucleic acid
(LNA). Expert Rev Mol Diagn 3: 27–38.
72. Latorra D, Campbell K, Wolter A, Hurley JM (2003) Enhanced allele-specific
PCR discrimination in SNP genotyping using 39 locked nucleic acid (LNA)primers. Hum Mutat 22: 79–85.
73. Altman DG, Bland JM (1994) Diagnostic tests. 1: Sensitivity and specificity. BMJ308: 1552.
74. Altman DG, Bland JM (1994) Diagnostic tests 2: Predictive values. BMJ 309:102.
75. Kitts A, Feolo M, Helmberg W (2003) The Major Histocompatibility ComplexDatabase, dbMHC. In: National Center for Biotechnology Information NIH,
editor. The NCBI Handbook. Bethesda, MD.
76. Redon R, Ishikawa S, Fitch KR, Feuk L, Perry GH, et al. (2006) Global
variation in copy number in the human genome. Nature 444: 444–454.
77. Felsenstein J (1989) PHYLIP - Phylogeny Inference Package (Version 3.2).
Cladistics 5: 164–166.
78. Saitou N, Nei M (1987) The neighbor-joining method: a new method for
reconstructing phylogenetic trees. Mol Biol Evol 4: 406–425.
79. Tamura K, Dudley J, Nei M, Kumar S (2007) MEGA4: Molecular Evolutionary
Genetics Analysis (MEGA) software version 4.0. Mol Biol Evol 24: 1596–1599.
HLA Typing in East Africa
PLoS ONE | www.plosone.org 18 May 2010 | Volume 5 | Issue 5 | e10751