highlights by region, country and product -...
TRANSCRIPT

Highlights by Region, Country and Product
Innovative BI Conference 2012, Budapest
Alexander Gebath
Director, BARC Austria

Agenda
BARC / CXP Group
About the BI Survey: Methodology, Sample, Products
Excerpt of results
Reasons to buy
Mobile BI
Self service BI / Visual Analysis / Data Discovery
Cloud BI / BiaaS
Big data
Access to the results?
2
The BARC / CXP group

The new le CXP / BARC Group
•La référence dans le monde du progiciel applicatif sur une zone francophone
11 domaines couverts, 7000 produits référencés…
BI & DW ECM CRM
ERP
ITSM
Expertise
11
Do
mai
ns
80+ employees (Paris, Würzburg, London, Vienna, Barcelona, Zurich)
40 analysts (15 analysts in BI and DW)
2000 customers all over Europe
4
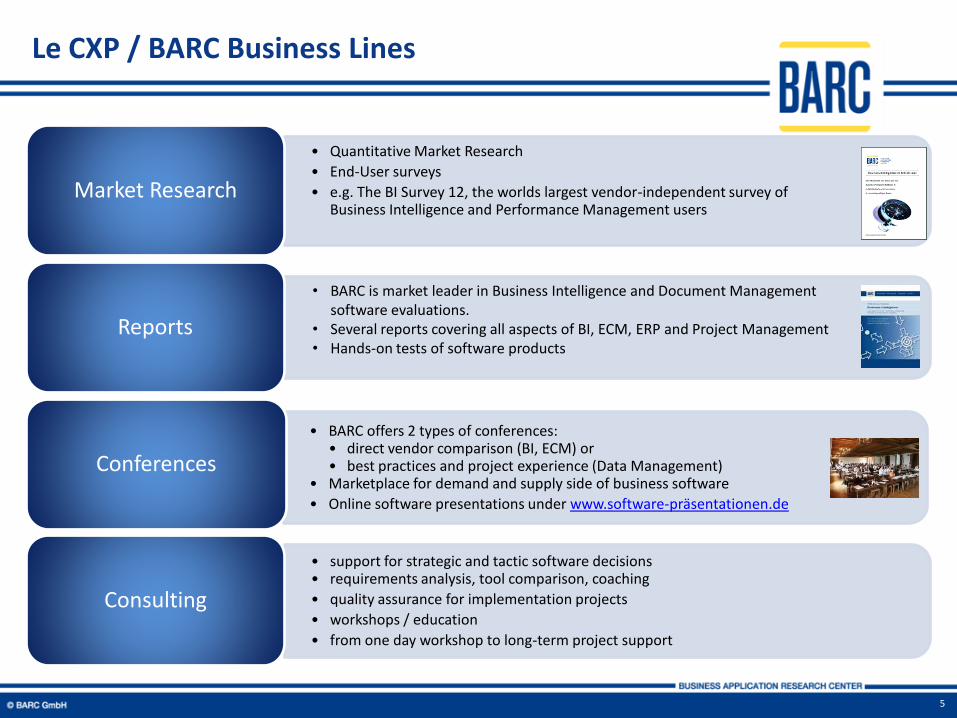
Le CXP / BARC Business Lines
• Quantitative Market Research
• End-User surveys
• e.g. The BI Survey 12, the worlds largest vendor-independent survey of Business Intelligence and Performance Management users
Market Research
Reports
• BARC offers 2 types of conferences: • direct vendor comparison (BI, ECM) or • best practices and project experience (Data Management)
• Marketplace for demand and supply side of business software
• Online software presentations under www.software-präsentationen.de
Conferences
• support for strategic and tactic software decisions • requirements analysis, tool comparison, coaching
• quality assurance for implementation projects
• workshops / education
• from one day workshop to long-term project support
Consulting
• BARC is market leader in Business Intelligence and Document Management software evaluations.
• Several reports covering all aspects of BI, ECM, ERP and Project Management • Hands-on tests of software products
5
BI Survey 2012
Methodology, Sample, Products, …
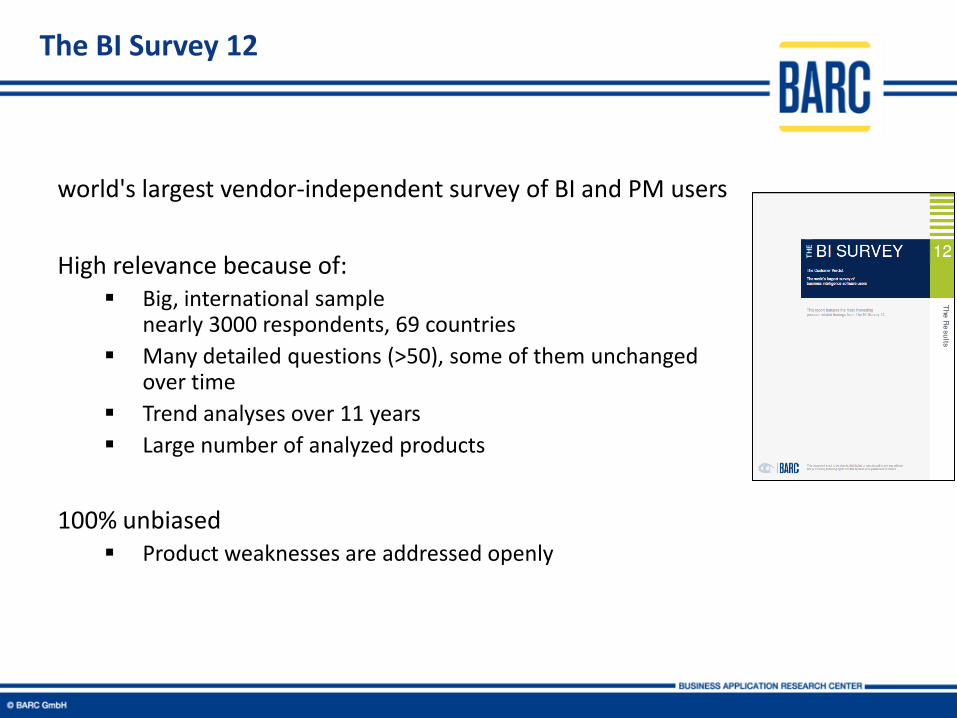
The BI Survey 12
world's largest vendor-independent survey of BI and PM users
High relevance because of: Big, international sample
nearly 3000 respondents, 69 countries
Many detailed questions (>50), some of them unchanged over time
Trend analyses over 11 years
Large number of analyzed products
100% unbiased Product weaknesses are addressed openly

Sample
by employee count (n=1906)
by industry (n=2775) by region (n=2775)

BI Survey 2012
Results

Reasons to buy
40%
34%
28%
21%
18%
16%
14%
14%
12%
11%
11%
10%
9%
8%
5%
5%
1%
0% 20% 40% 60%
Ease of use for report recipients (851)
Ease of use for report designers (723)
Fast query performance (593)
Low price (441)
Proof of concept faster (374)
Large data handling capacity (347)
Predefined data connection (300)
Vendor/product reputation (295)
Vendor relationship (248)
Large numbers of users (240)
Availability of local support (240)
Bundled with another product (202)
Corporate standard (186)
Other (165)
Support for mobile devices (115)
Collaboration features (108)
External hosting or cloud offering (17)
n = 2118

3,21
3,65
4,32
4,35
4,45
4,53
4,60
4,90
4,91
4,98
4,98
5,10
5,12
5,26
5,51
5,65
6,50
0 2 4 6 8
Other (163)
Corporate standard (185)
Predefined data connection (300)
Bundled with another product (201)
Low price (440)
Vendor/product reputation (295)
Vendor relationship (248)
Ease of use for report recipients (846)
Availability of local support (240)
Ease of use for report designers (717)
Proof of concept faster (372)
Large data handling capacity (345)
Large number of users (240)
Fast query performance (588)
Support for mobile devices (115)
Collaboration features (108)
External hosting (17)
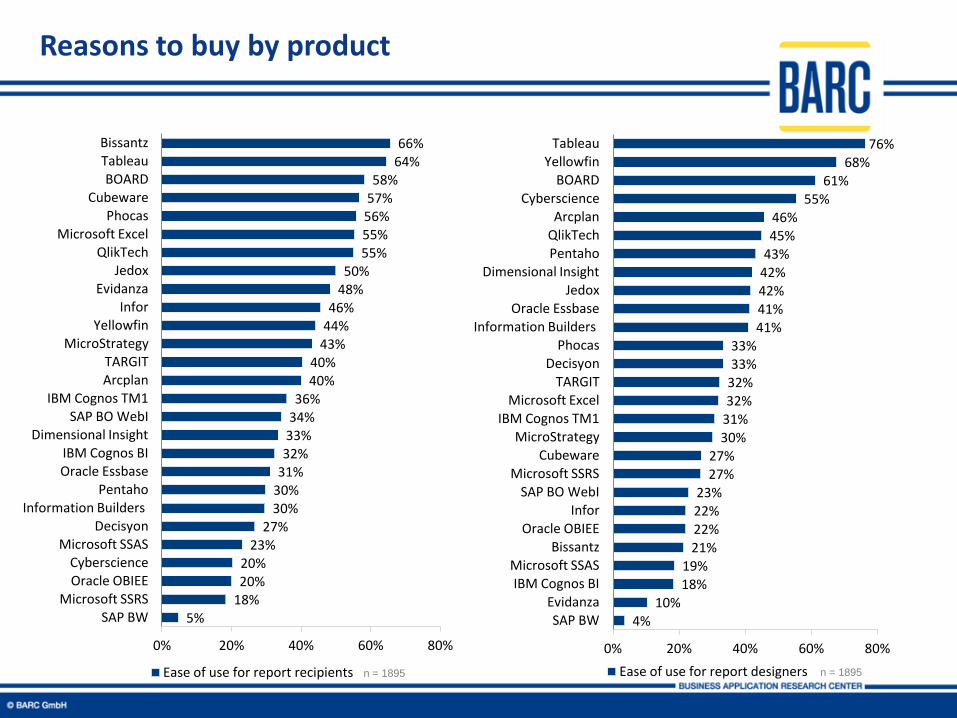
Reasons to buy by BBI
n = 2118
4% 10%
18% 19%
21% 22% 22% 23%
27% 27%
30% 31% 32%
32% 33% 33%
41% 41% 42%
42% 43%
45% 46%
55%
61% 68%
76%
0% 20% 40% 60% 80%
SAP BW
Evidanza IBM Cognos BI
Microsoft SSAS
Bissantz Oracle OBIEE
Infor SAP BO WebI
Microsoft SSRS
Cubeware MicroStrategy
IBM Cognos TM1
Microsoft Excel TARGIT
Decisyon Phocas
Information Builders Oracle Essbase
Jedox Dimensional Insight
Pentaho QlikTech
Arcplan Cyberscience
BOARD
Yellowfin Tableau
Ease of use for report designers
Reasons to buy by product
5% 18% 20% 20%
23% 27%
30% 30% 31% 32% 33% 34% 36%
40% 40%
43% 44% 46%
48% 50%
55% 55% 56% 57% 58%
64% 66%
0% 20% 40% 60% 80%
SAP BW Microsoft SSRS
Oracle OBIEE Cyberscience
Microsoft SSAS Decisyon
Information Builders Pentaho
Oracle Essbase IBM Cognos BI
Dimensional Insight SAP BO WebI
IBM Cognos TM1 Arcplan TARGIT
MicroStrategy Yellowfin
Infor Evidanza
Jedox QlikTech
Microsoft Excel Phocas
Cubeware BOARD
Tableau Bissantz
Ease of use for report recipients n = 1895 n = 1895

Selection Type by Country
n = 893
54%
54%
55%
56%
58%
67%
30%
18%
15%
20%
24%
15%
16%
28%
30%
24%
18%
18%
0% 10% 20% 30% 40% 50% 60% 70% 80% 90% 100%
Switzerland
Benelux
United Kingdom
Austria
France
Germany
Competitive evaluation
Single product evaluation
No formal evaluation

BI trending topics
European BI markets
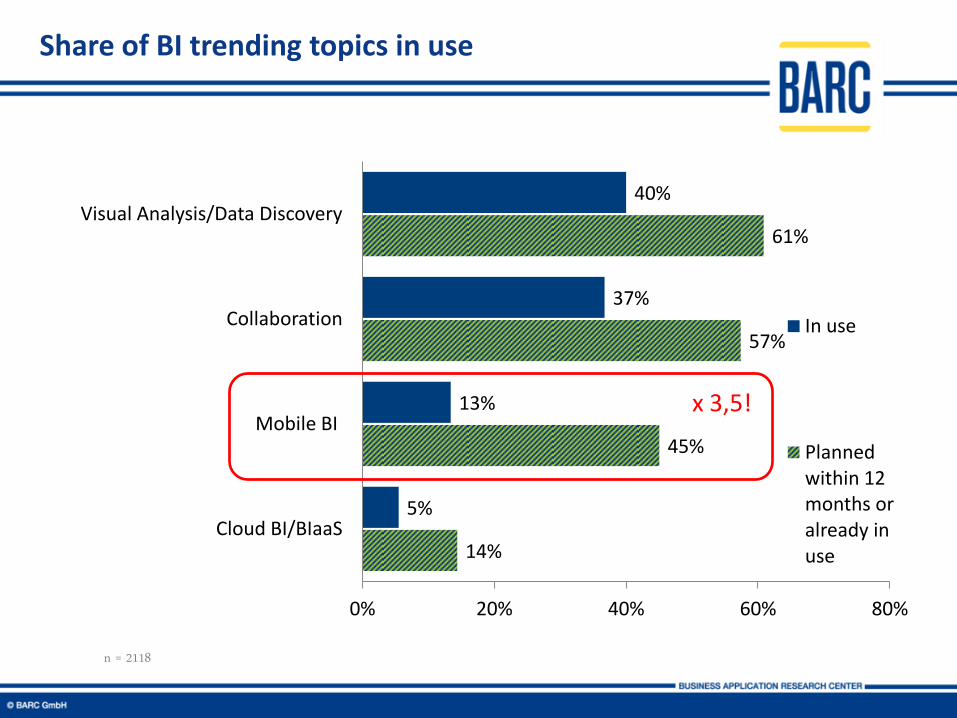
Share of BI trending topics in use
n = 2118
40%
37%
13%
5%
61%
57%
45%
14%
0% 20% 40% 60% 80%
Visual Analysis/Data Discovery
Collaboration
Mobile BI
Cloud BI/BIaaS
In use
Planned within 12 months or already in use
x 3,5!
Mobile BI

Mobile BI adoption in selected countries / regions
17
About 30-40 % of companies will use Mobile BI after the next 12 months.
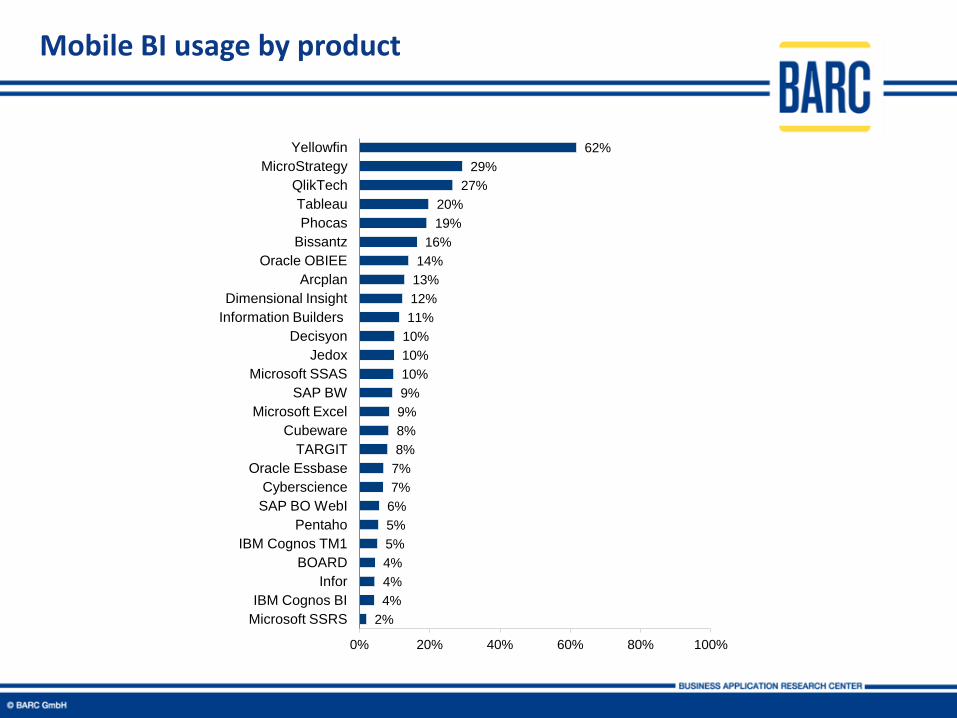
Mobile BI usage by product
2%
4%
4%
4%
5%
5%
6%
7%
7%
8%
8%
9%
9%
10%
10%
10%
11%
12%
13%
14%
16%
19%
20%
27%
29%
62%
0% 20% 40% 60% 80% 100%
Microsoft SSRS
IBM Cognos BI
Infor
BOARD
IBM Cognos TM1
Pentaho
SAP BO WebI
Cyberscience
Oracle Essbase
TARGIT
Cubeware
Microsoft Excel
SAP BW
Microsoft SSAS
Jedox
Decisyon
Information Builders
Dimensional Insight
Arcplan
Oracle OBIEE
Bissantz
Phocas
Tableau
QlikTech
MicroStrategy
Yellowfin

Expected benefits by use of mobile BI
22%
32%
38%
39%
60%
81%
0% 20% 40% 60% 80% 100%
Make workflows shorter
Easier to use
Better communication
Make daily work easier
Access information faster
Access information from anywhere
n = 2016

Self Service and Visual Analysis
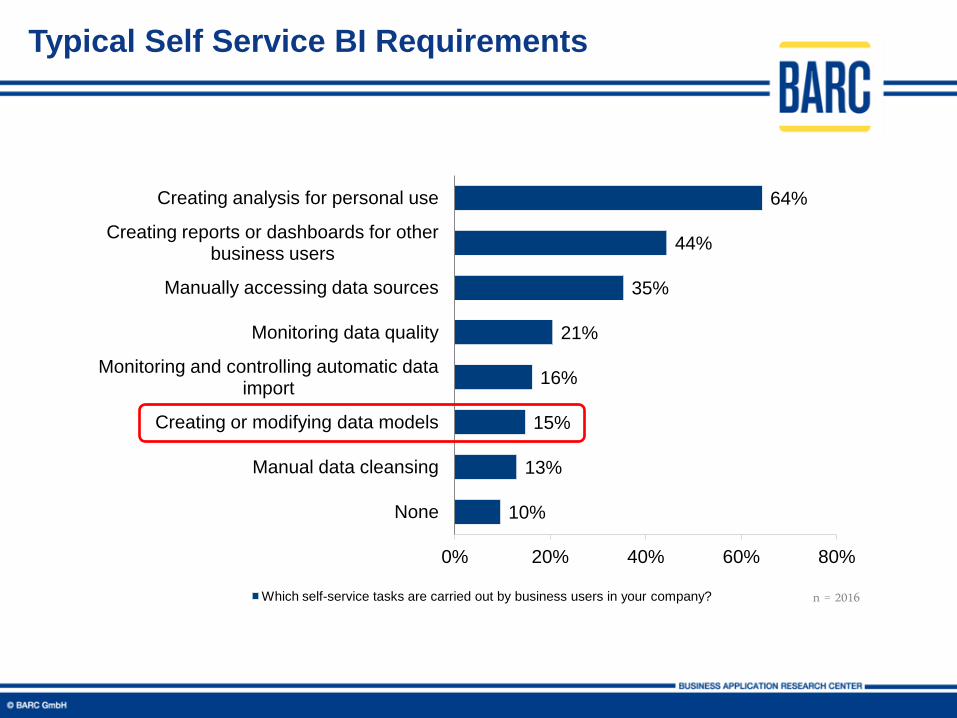
Typical Self Service BI Requirements
10%
13%
15%
16%
21%
35%
44%
64%
0% 20% 40% 60% 80%
None
Manual data cleansing
Creating or modifying data models
Monitoring and controlling automatic data import
Monitoring data quality
Manually accessing data sources
Creating reports or dashboards for other business users
Creating analysis for personal use
Which self-service tasks are carried out by business users in your company? n = 2016

Visual Analytics adoption in selected countries / regions
22
About 50-60 % of companies will use Visual Analytics / Data Discovery after the next 12 months.
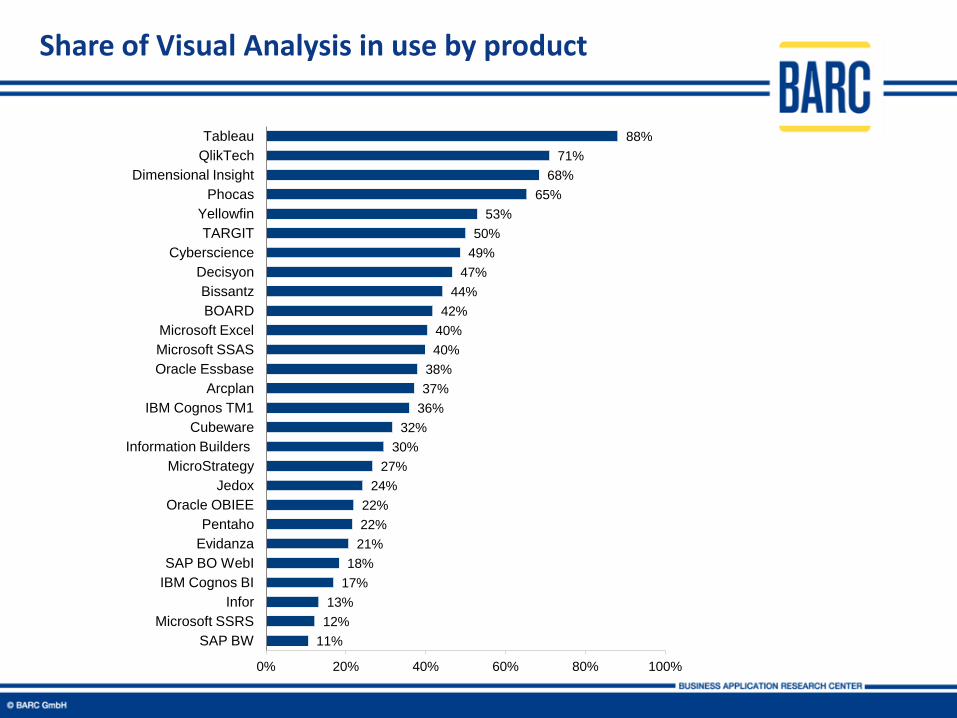
Share of Visual Analysis in use by product
11%
12%
13%
17%
18%
21%
22%
22%
24%
27%
30%
32%
36%
37%
38%
40%
40%
42%
44%
47%
49%
50%
53%
65%
68%
71%
88%
0% 20% 40% 60% 80% 100%
SAP BW
Microsoft SSRS
Infor
IBM Cognos BI
SAP BO WebI
Evidanza
Pentaho
Oracle OBIEE
Jedox
MicroStrategy
Information Builders
Cubeware
IBM Cognos TM1
Arcplan
Oracle Essbase
Microsoft SSAS
Microsoft Excel
BOARD
Bissantz
Decisyon
Cyberscience
TARGIT
Yellowfin
Phocas
Dimensional Insight
QlikTech
Tableau
Cloud BI / BIaaS
European BI markets
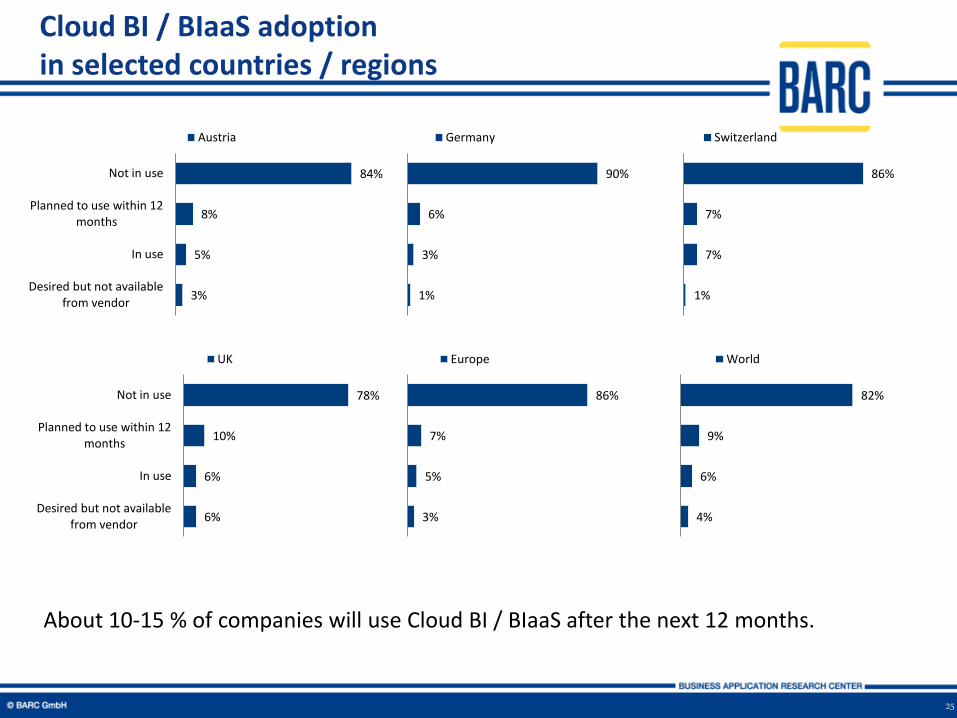
Cloud BI / BIaaS adoption in selected countries / regions
25
84%
8%
5%
3%
Not in use
Planned to use within 12 months
In use
Desired but not available from vendor
Austria
90%
6%
3%
1%
Germany
86%
7%
7%
1%
Switzerland
78%
10%
6%
6%
Not in use
Planned to use within 12 months
In use
Desired but not available from vendor
UK
86%
7%
5%
3%
Europe
82%
9%
6%
4%
World
About 10-15 % of companies will use Cloud BI / BIaaS after the next 12 months.

Expected benefits of Cloud BI / BIaaS
n = 589

Cloud BI / BIaaS potential problems
27
n = 600

Relevance of SaaS by BI architecture components
28
48%
17%
18%
17%
In use
Planned to use within 12 months
Planned in the longterm
Not relevant
Reporting, Analysis, Planning
29%
22%
25%
24%
Performance Management
42%
17%
22%
20%
Analytical Applications
30%
15%
24%
31%
In use
Planned to use within 12 months
Planned in the longterm
Not relevant
Data Integration
27%
15%
24%
34%
Data Warehouse
23%
16%
23%
37%
Data Marts
Basis: Companies yet using Cloud BI / BIaaS or or planned to use it or want to use but vendor does not provide the service.
SaaS is seen more relevant for BI- than data management applications.

Big Data
European BI markets

Big data expected benefits
30
n = 1066

Big Data challenges
31
n = 1151
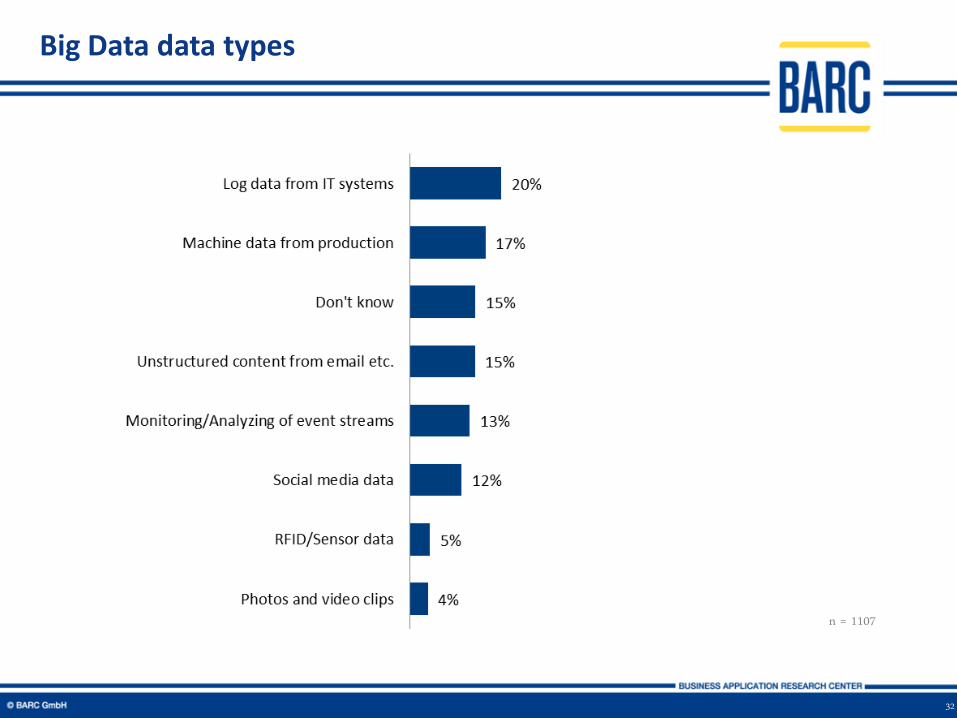
Big Data data types
32
n = 1151 n = 1107

BI Survey 2012
How to gain full access to the results?

BI Survey Analyzer:
34
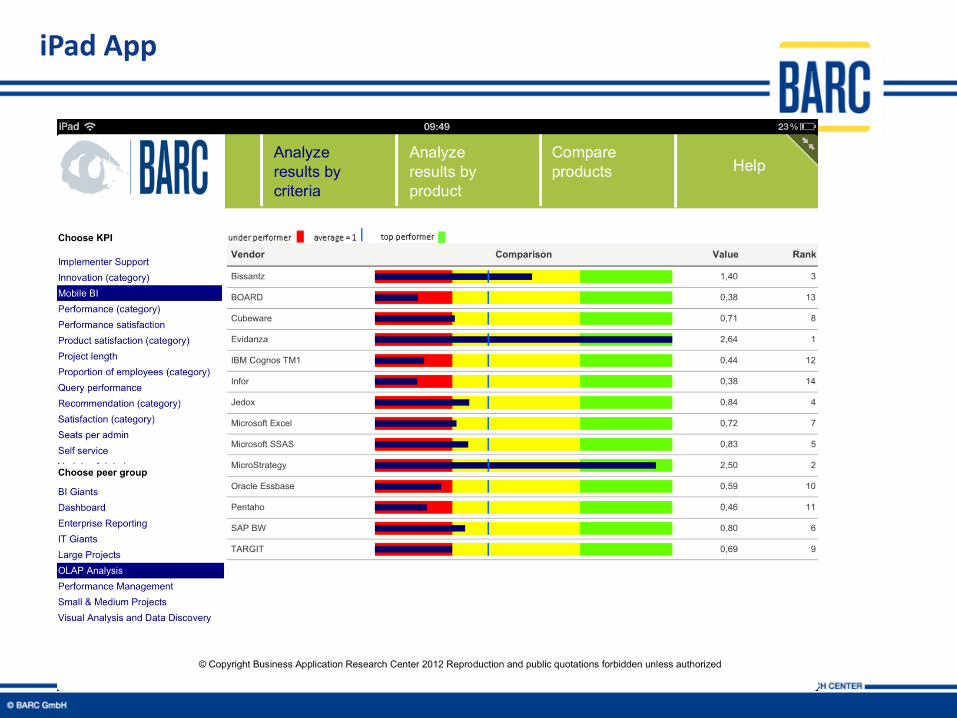
iPad App

Packages and pricing
36
The BI Survey 12 Full Package BI Survey Analyzer, The iPad App, The BI Survey Results report, The BI Survey Best Practices
report, plus all the Vendor Performance Summaries and 'Trending Topics' series over the course of the coming months.
BI Survey Analyzer Access to our powerful interactive online tool which enables you to perform your own custom
analysis of the full survey data set.
The BI Survey 12 iPad App including 16GB iPad Access to our new interactive online tool which enables you to perform your own custom analysis
of the survey data.
The BI Survey 12 iPad App without an iPad Access to our new interactive online tool which enables you to perform your own custom analysis
of the survey data.
The BI Survey 12: The Results A PDF report detailing the key findings from The BI Survey 12, supplemented by in-depth expert
commentary.
For more offerings and details see: www.bi-survey.com Special pricing is valid until Nov 30, 2012 and only for attendees of The Innovative BI Conference 2012 in Budapest The special pricing is not valid for consultants or vendors. The BI Survey 12 Full Packages includes a license up to 3 users. All other offerings are single user licenses. For multi-user-licenses or offerings for consultants or vendors please send an email to [email protected]
5.000 EUR 3.750 EUR (-25%)
1.950 EUR 1.560 EUR (-20%)
1.395 EUR 1.216 EUR (-12%)
895 EUR 716 EUR (-20%)
1.550 EUR 1.240 EUR (-20%)
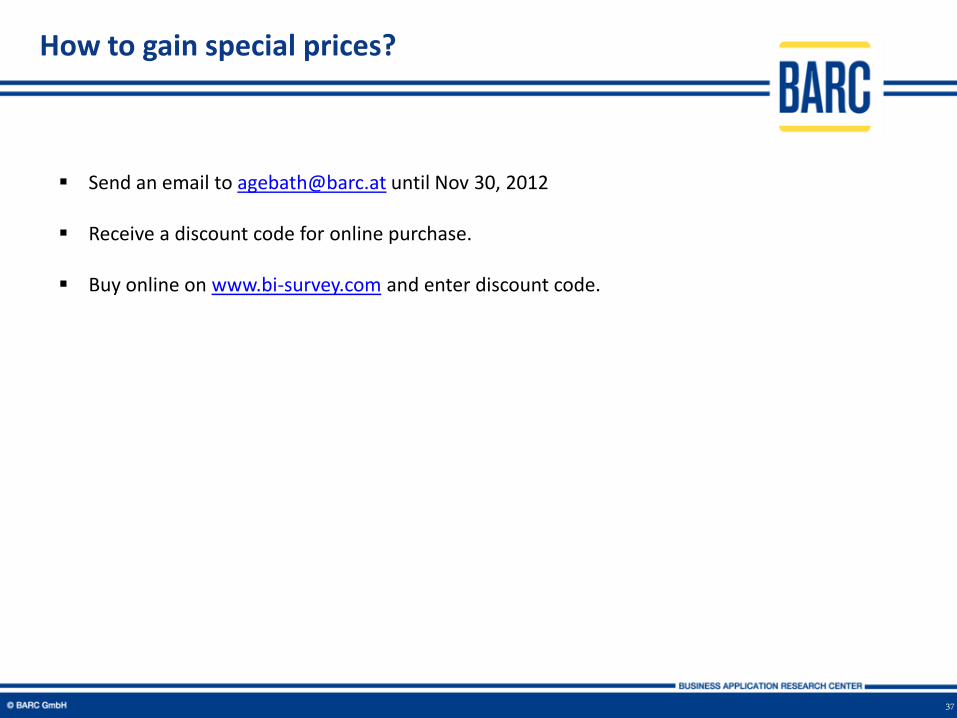
How to gain special prices?
37
Send an email to [email protected] until Nov 30, 2012
Receive a discount code for online purchase.
Buy online on www.bi-survey.com and enter discount code.

Contact