highwall stability due to ground vibrations from blasting dr. kyle a. perry dr. kot f. unrug kevin...
TRANSCRIPT

HIGHWALL STABILITY DUE TO GROUND VIBRATIONS
FROM BLASTING
Dr. Kyle A. Perry
Dr. Kot F. Unrug
Kevin Harris
Michael Raffaldi
PURPOSEObjective: Study the effect of blast vibrations
on the stability of highwalls and web and barrier pillars
Methods• Numerical Modeling• Field Testing• Laser Scanning• Vibrations Monitoring

PROGRESS
SASW Testing
Numerical Modeling
• FLAC3D – Web and Barrier Pillars– Stress Distribution– Pillar Stability
• 3DEC – Highwall Modeling– Laser Scanning– Displacement/Velocity
Field Data Collection

SASW Testing
Dynamic Material Properties
• Shear Modulus
• Damping Ratio
Modulus/Damping Reduction Curves
• Dynamic Model Calibration
• Iterative Numerical Process

SASW Testing4000
3000
2000
1000
0
Su
rfa
ce W
ave
Ve
loci
ty (
ft/s
)
3 4 5 6 7 8 910
2 3 4 5 6 7 8 9100
2 3
Wavelength (ft)
Experimental Theoretical

Numerical ModelingSub-Objective 1: Evaluate the influence of
highwall mining progression on web/barrier pillar stability using FLAC3D
Methodology• Simplification – 2D Section• Validation – Mark-Bieniawski• 5 Case Studies

Material PropertiesCoal Material Model • Strain Softening Mohr-Coulomb
Roof/Floor Interface• Bi-linear Mohr-Coulomb
Property Value
Elastic Modulus (GPa) 3
Poisson Ratio 0.25
Cohesion (MPa)
Initial 1.81
Final 0.41
Friction Angle (deg) 28
Plastic Strain Range 0.015 0 1.15 2.3 3.45 4.6 5.75 6.90
0.5
1
1.5
2
2.5
Normal Stress (MPa)
Sh
ear
Str
ess
(MP
a)

Material PropertiesRock Material Model• Ubiquitous Joint Model with Softening
Rock Matrix Properties Bedding Plane Properties UCS Elastic
ModulusPoisson Ratio
Friction Angle Cohesion Tensile
Strength Dilation Friction Angle Cohesion Tensile
Strength MPa GPa --- Deg MPa MPa Deg deg MPa MPaSS 100 40 0.25 40 13.52 5.8 12 30 6.76 4.64SH 30 10 0.25 20 7.3 1.74 19 7 0.5 0.17
Matrix SofteningCohesion Tensile Strength Dilation
Maximum Residual Range* Maximum Residual Range Maximum Residual Range*MPa MPa --- MPa MPa --- Deg Deg ---
SS 13.52 0 0.005 5.8 0 0.001 12 0 0.005SH 7.3 0 0.005 1.74 0 0.001 19 0 0.005
Bedding Plane SofteningCohesion Tensile Strength Dilation
Maximum Residual Range* Maximum Residual Range Maximum Residual Range*MPa MPa --- MPa MPa --- Deg Deg ---
SS 6.76 0.68 0.005 4.64 0 0.001 12 0 0.005SH 0.5 0.05 1.005 0.17 0 0.001 19 0 0.005
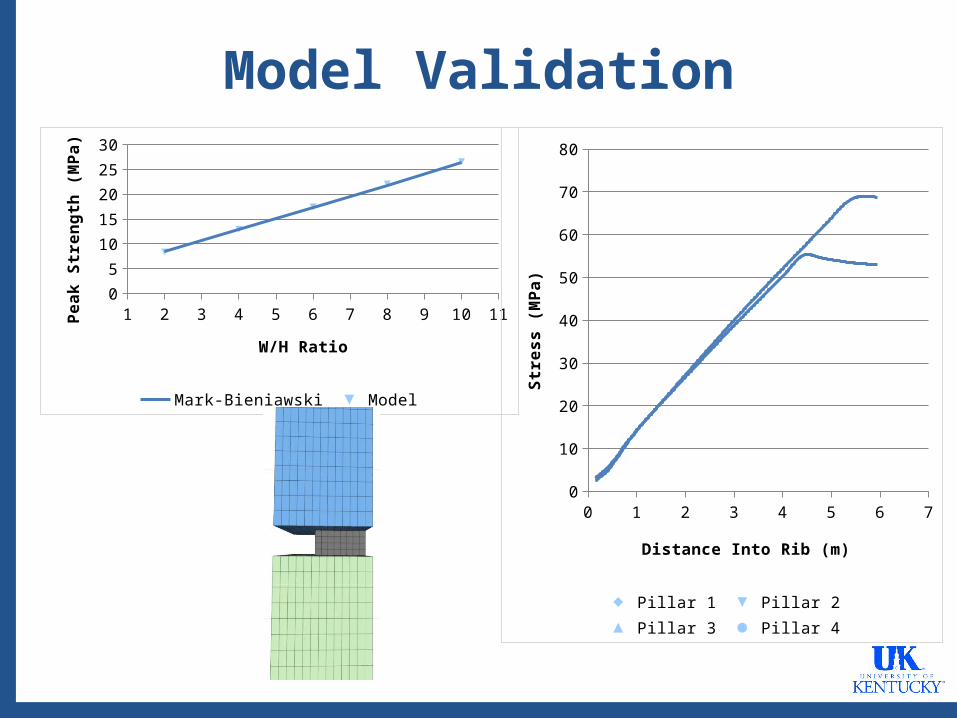
Model Validation
1 2 3 4 5 6 7 8 9 10 110
5
10
15
20
25
30
Mark-Bieniawski Model
W/H Ratio
Pea
k S
tren
gth
(M
Pa)
0 1 2 3 4 5 6 70
10
20
30
40
50
60
70
80
Pillar 1 Pillar 2 Pillar 3 Pillar 4
Distance Into Rib (m)
Str
ess
(MP
a)
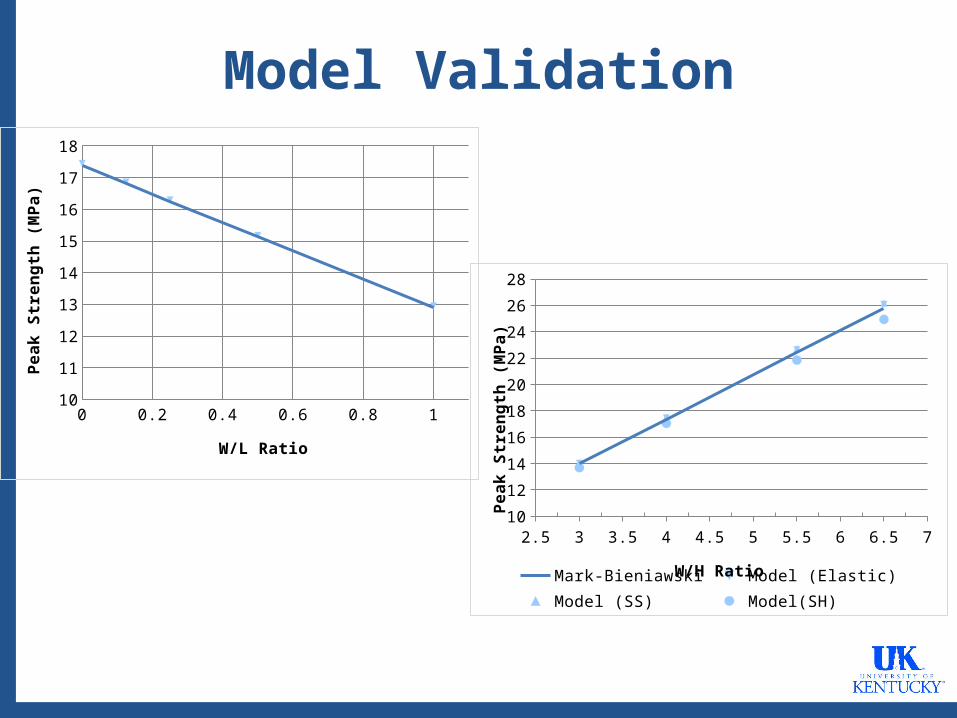
Model Validation
0 0.2 0.4 0.6 0.8 110
11
12
13
14
15
16
17
18
W/L Ratio
Pea
k S
tren
gth
(M
Pa)
2.5 3 3.5 4 4.5 5 5.5 6 6.5 710
12
14
16
18
20
22
24
26
28
Mark-Bieniawski Model (Elastic)Model (SS) Model(SH)
W/H Ratio
Pea
k S
tren
gth
(M
Pa)

Model Validation
Material Properties
• Peak Strength
• Calibration Reasonable
Web/Barrier Pillars
• “Infinite Length” Assumption
2D Cross Section
• Plane Strain Validation
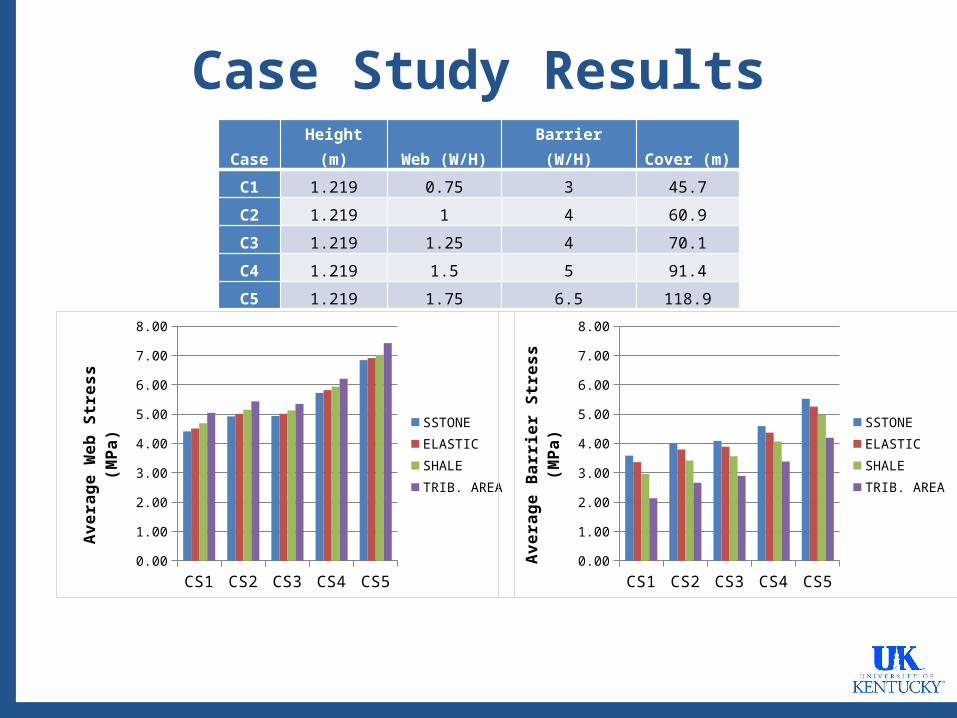
Case Study ResultsCase Height (m) Web (W/H) Barrier (W/H) Cover (m)
C1 1.219 0.75 3 45.7
C2 1.219 1 4 60.9
C3 1.219 1.25 4 70.1
C4 1.219 1.5 5 91.4
C5 1.219 1.75 6.5 118.9
CS1 CS2 CS3 CS4 CS50.00
1.00
2.00
3.00
4.00
5.00
6.00
7.00
8.00
SSTONE
ELASTIC
SHALE
TRIB. AREA
Ave
rage
Web
Str
ess
(MP
a)
CS1 CS2 CS3 CS4 CS50.00
1.00
2.00
3.00
4.00
5.00
6.00
7.00
8.00
SSTONE
ELASTIC
SHALE
TRIB. AREA
Ave
rage
Bar
rier
Str
ess
(MP
a)

Mining Progression Results
Web 1
Web 2
Web 3
Web 4
Web 5
Web 6
Web 7
Web 8
Web 9
Web 10
80%
82%
84%
86%
88%
90%
92%
94%
96%
98%
100%
CS1
CS2
CS3
CS4
CS5

Important Findings
Tributary Area Loading
• Common Assumption
• Arching Effect – Geology Dependent
• Importance of Barrier Pillar Design
Mining Progression
• De-stressing near Barriers
• Asymmetric Loading
Probability of Pillar Failure/Highwall Collapse
Dynamic Impact on Web/Barrier Pillars

Numerical ModelingSub-Objective 2: Correlate active highwall
sites with 3DEC for validation and additional testing
Methodology• Routine trips collect scan data• Digitize geometry for mesh generation
within 3DEC

Primary Mine SitePine Branch Mine• Perry County, KY• Mountaintop/Contour• Hazard 7 – Hazard 10 seams• 200’ – 300’ Highwall• Massive Sandstone
Important Mine Data• Corehole Data• Mapping

Primary Mine Site

VIBRATION AND SCAN DATA
Laser Scanning• Pre/Post Blast Capture• Mesh Generation for 3DEC• Geologic Data
– 2 Primary Joint Sets– 85 Degree Dip– 110, 185 Direction
Seismograph Deployment• Highwall Peak and Bottom• Single Event Vibration Data


SUMMARYHIGHWALL
STABILITY STUDY
MODELING FIELD DATA
LIDARVIBRATION RECORDS
DESIGN CALIBRATION
FIELD TESTING
LITERATURE/ EMPIRICAL
COMPLETED MODEL
BLAST AND DAMAGE CORRELATION
NUMERICAL STUDY
DRAW CONCLUSIONS

Project DirectionFLAC3D Modeling• Probability of Pillar Failure/Highwall Collapse
• Dynamic Impact on Web/Barrier Pillars
3DEC Modeling
• Solidify Static Model
• Quantify/Correlate Damage and Vibrations
• Sensitivity Studies
– Ratio of PPV
– Geology
– Highwall Geometry

QUESTIONS?