delayed blasting tests to improve highwall stability-a ... · pdf filedelayed blasting tests...
TRANSCRIPT

Report of Investigations 9008
Delayed Blasting Tests To Improve Highwall Stability-A Final Report
By Virgil J. Stachura, larry R. Fletcher, and Michael A. Peltier
UNITED STATES DEPARTMENT OF THE INTERIOR Donald Paul Hodel. Secretary
BUREAU OF MINES Robert C. Horton, Director

Library of Congress Cataloging in Publication Data:
Stachura, Virgil J Delayed blasting tests to improve highwall stability.
(Bureau of Mines report of investigations ; 9008)
Bibliography: p. 12.
Supt. of Docs, no.: I 28,23: 9008,
1. Blasting. 2. Coal mines and mining-Safety measures. 3. Coal mines and mining-West Virginia-Barbour County, I. Fletcher, Larty R. II. Peltier, Michael A. III, Title, IV, Series: Report of investigations (United States, Bureau of Mines) ; 9008.
TN23,U43 [TN2791 622s (622'.334] 85-600256

CONTENTS
Abstract. • • • • • . • • • • • • • • • • • . . • • • • • • • . • . . • • • • • • • • • • • • • • • • • • • • • • • • • • • . • • . • • • • • • • • • 1 Introduc-t~ion................................................................... 2 Acknowledgments. • • • • • . • • • • • • • . • • • • • • • • • • • • • • . . • • • • • • • • • • • • • . • • • • • • • • . . • . • • • • • • • 3 Experimental procedure••••••••••••••••••••••••••••••••••••••••••••••••••••••••• 4
Blast'designs•••••••••••••••••••••••••••••••••••••••••••••••••••••••••••••••• 4 Highwall evaluation•••••••••••••••••••••••••••••••••••••••••••••••••••••••••• 4
Test site...................................................................... 7 Results ••••••••..•.•••••••••.••••••••••.•.••••.•••.•. ••••••.••••••... , • • • • • • • . • 7 Conclusions and recommendations•••••••••••••••••••••••••••••••••••••••••••••••• 12 References • ••.•••••.•.••••••••••••• , • • • • • • • • . • • . • • • • • • • • • • • • . . . • • • • • • • • • • . . • • . . 12
1. 2.
3.
4.
5. 6. 7. 8. 9.
10. 11. 12. 13.
14.
1. 2. 3.
ILLUSTRATIONS
Break line prior to 285 ms with 200-ms in-the-hole delays throughout •••••• Break line prior to 335 ms with 250-ms in-the-hole delays in highwall holes and 200-ms in-the-hole delays in remaining holes •••••••••••••••••••
Break line prior to 385 ms with 300-ms in-the-hole delays in highwall holes and 200-ms in-the-hole delays in remaining holes •••••••••••••••••••
Break line prior to 385 ms with 250- and 300-ms in-the-hole delays in two rows of holes nearest to the highwall and 200-ms in-the-hole delays in remaining holes ••••••••••••••••••••••••••••••••••••••••••••••••••••••••••
Illustration of stereo photography technique with control targets ••••••••• Test site location (site 2), Barbour County, wv ••••••••••••••••••••••••••• Test highwall, no increase in delay time•••••••••••••••••••••••••••••••••• Test highwall profiles, no increase in delay time••••••••••••••••••••••••• Test highwall, 50-ms-longer delays in highwall holes •••••••••••••••••••••• Test highwall profiles, 50-ms-longer delays in highwall holes ••••••••••••• Test highwall, lOO-ms-longer delays in highwall holes ••••••••••••••••••••• Test highwall profiles, lOO-ms-longer delays in highwall holes •••••••••••• Test highwall, 50- and lOO-ms-longer delays in two rows of holes nearest
5
5
5
5 6 6 8 8 9 9
10 10
to the highwall • .•••.•.. , • , • . . • . . • • • . . . . . • . . • • • • • • • . • . • . . • • . . . . . . . . . • • • • • . 11 Test highwall profiles, 50- and lOO-ms-longer delays in the two rows of holes nearest to the highwall••••••••••••••••••••••••••••••••••••••••••••
TABLES
Reported injuries, surface coal mining•••••••••••••••••••••••••••••••••••• Average injury severity, surface coal mining•••••••••••••••••••••••••••••• Fatality probability per reported incident, surface coal mining •••••••••••
11
3 3 3

UNIT OF MEASURE ABBREVIATIONS USED IN THIS REPORT
ft foot ms millisecond

DELAYED BLASTING TESTS TO IMPROVE HIGHWALL STABILITY-A FINAL REPORT
By Virgil J. Stachura, 1 Lorry R. Fletcher, 2 and Michael A. Peltier 3
ABSTRACT
The Bureau of Mines conducted a series of delayed blasting experiments at a Barbour County, WV, contour coal mine that resulted in smoother highwalls. The highwalls were smoother due to reduced overbreak (excessive rock breakage beyond the excavation limit) and were inherently safer due to reduced likelihood of rockfall. The experiments were directed at reducing overbreak without special drilling or significant additional cost. Reduced overbreak was accomplished by increasing the highwall hole delays, which changed the effective delay pattern geometry and the direction of burden movement.
Three test combinations of blast delays were used in the highwall holes: (1) 50 ms longer than the nominal design, (2) 100 ms longer than nominal, and (3) 50 and 100 ms longer in the two rows of holes nearest to the highwall. The mine's nominal blast design was a flat V pattern with 17-ms surface delays between holes, 42-ms surface delays between rows, and 200-ms in-the-hole delays. All three test designs produced highwall improvements, compared with results using the nominal design, with occasional exceptions because of geologic variations. Observations and terrestrial photogrammetry showed that the delay changes produced generally smoother vertical profiles with less loose material.
1 Geophysicist. 2Mining engineering technician. 3Mining engineer. Twin Cities Research Center, Bureau of Mines, Minneapolis, MN.

2
INTRODUCTION
One of the major hazards found in surface mining is rockfall from highwalls. This hazard occurs in all forms of excavation in rock, especially where explosives have been used. The explosive energy not only fractures the rock to be excavated, but also damages the rock that borders the excavation. This reduces the stability of the highwall and increases the rockfall potential. The rockfall hazard is normally attributed to blasting practices, geologic conditions, and adverse weather in 65% of the accidents in surface coal mines (1).4 Of these three factors, only blasting is controllable, and therefore, blasting was the subject of this investigation.
The probability of fatal or nonfatal, injuries associated with mine workers' exposure to the highwall increases with the height of the highwall and the extent of its overbreak. In general, rockfalls are most prevalent after rainstorms, since the flowing water may wash out fracture fillings or hydrostatic forces may change the stress situation. Most rockfalls occur in the first 15 days of exposure (1). This is significant because most work below a highwall, such as stripping of overburden and coal removal, is done during this time. The area of greatest hazard is within 25 ft of the toe for vertically falling rocks, and 90 ft from the toe for rocks deflected by the highwall during their descent (1). Three employee classifications are most frequently involved in highwall incidents: dozer operators, 45%; ground laborers, 25%; and shovel operators or oilers, 10% (l).
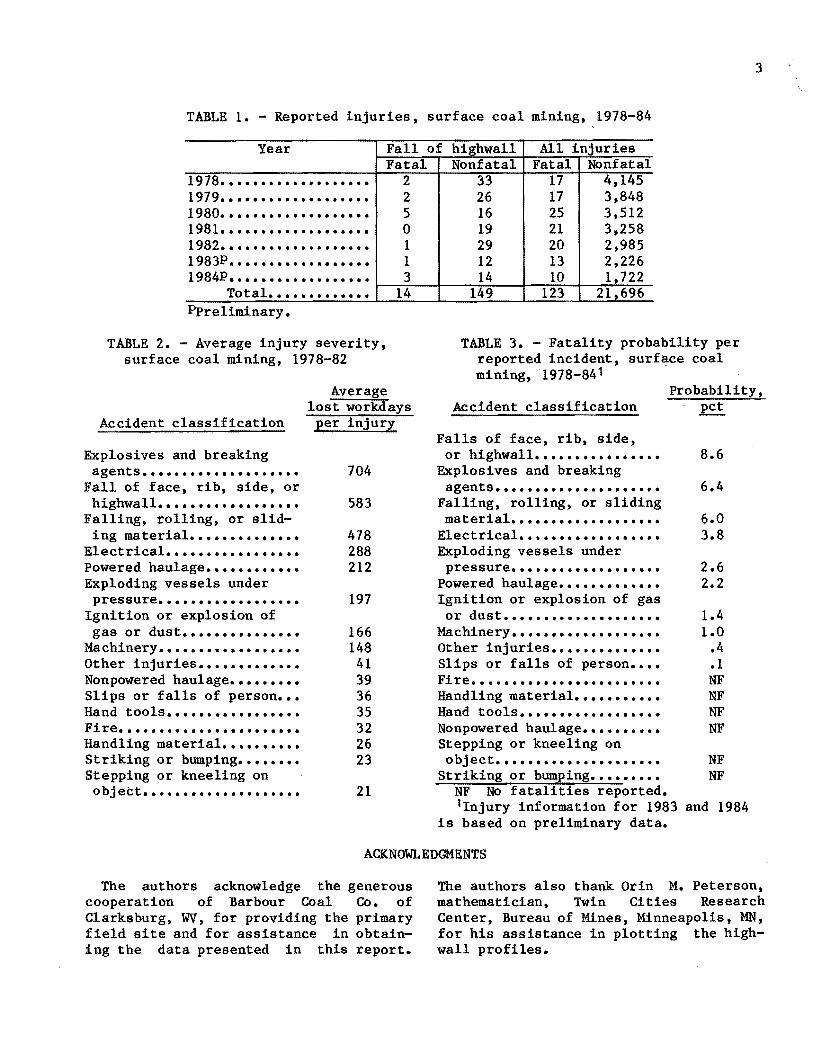
According to information obtained from the Health and Safety Analysis Center of the Mine Safety and Health Administration (MSHA), there were 123 fatalities and 21,696 nonfatal injuries in the surface coal mining industry from 1978 through 1984 (£-3). The reported injuries in surface coal mines are shown in table 1. Highwall incidents accounted for 11.4% of
4underlined numbers in fer to items in the list the end of this report.
parentheses reof references at
the fatal and 0.7% of the nonfatal injuries and ranked secondS in average severity (table 2), with 583 lost workdays per injury. Although the total numbers of fatal (14) and nonfatal (149) highwall injuries do not appear to be of great significance when compared with the overall totals for all mining-related injuries, the high average severity of highwall injuries indicates that they .are a serious problem. Another way of gauging the seriousness of highwall injuries is to calculate the probability of a fatality, as shown in table 3. The probability of a fatality in falls of highwall ranks first6 at 8.6%.
In previous research sponsored by the Bureau of Mines, Engineers International Inc. evaluated blasting practices at nine contour mines and conducted eight test blasts at one mine site (4). The test blasts resulted in improved-highwall stability, but after the contractor left, the mine personnel reverted to their old blasting practices. There appeared to be too great a procedural impact for immediate acceptance of the improved blasting practices. To maximize acceptance, the authors of this report emphasize simple, easily understood changes in blast design that minimize economic and procedural impact. A progress report, RI 8916 (5), was published on earlier tests conducted by the Bureau. This final report summarizes the field experiments conducted by the Bureau at the Barbour County, WV, test site.
The experiments described in this report are directed at reducing overbreak without special drilling or significant additional cost. They use simple changes in timing, which improve relief by changing the direction and time of burden movement. In this report, overbreak is defined as excessive breakage of rock beyond the desired excavation limit (~).
5The disparities in rank between tables 2 and 3 apparently resulted because table 2 does not include data for 1983 and 1984.
6see footnote s.
3
TABLE 1. - Reported injuries, surface coal mining, 1978-84
Year Fall of highwall All injuries
1978 ••••••••••••••••••• 1979 ••••••••••••••••••• 1980 ••••••••••••••••••• 1981 ••••••••••••••••••• 1982 ••••••••••••••••••• 1983P•••••••••••••••••• 1984P••••••••••••••••••
Total ••••••••••••• Ppreliminary.
TABLE 2. - Average injury severity, surface coal mining, 1978-82
Fatal 2 2 5 0 1 1 3
14
Accident classification
Average lost workdays
per injury
Explosives and breaking agents ••••••••••••••••••••
Fall of face, rib, side, or highwall ••••••••••••••••••
Falling, rolling, or slid-ing material ••••••••••••••
Electrical ••••••••••••••••• Powered haulage •••••••••••• Exploding vessels under
pressure •••••••••••••••••• Ignition or explosion of gas or dust •••••••••••••••
Machinery •••••••••••••••••• Other injuries ••••••••••••• Nonpowered haulage ••••••••• Slips or falls of person ••• Hand tools ••••••••••••••••• Fire••••••••••••••••••••••• Handling material •••••••••• Striking or bumping •••••••• Stepping or kneeling on
objeCt ••••••••••••••••••••
704
583
478 288 212
197
166 148
41 39 36 35 32 26 23
21
Nonfatal Fatal Nonfatal 33 17 4,145 26 17 3,848 16 25 3,512 19 21 3,258 29 20 2,985 12 13 2,226 14 10 1, 722
149 123 21,696
TABLE 3. - Fatality probability per reported incident, surface coal mining, 1978-841
Accident classification
Falls of face, rib, side, or highwall ••••••••••••••••
Explosives and breaking agents •••••••••••••••••••••
Falling, rolling, or sliding material •••••••••••••••••••
Electrical •••••••••••••••••• Exploding vessels under
pressure ••••••••••••••••••• Powered haulage ••••••••••••• Ignition or explosion of gas or dust ••••••••••••••••••••
Probability, pet
8.6
6.4
6.0 3.8
2.6 2.2
1.4 Machinery••••••••••••••••••• 1.0 Other injuries.............. .4 Slips or falls of person.... .1 Fire........................ NF Handling material........... NF Hand tools.................. NF Nonpowered haulage.......... NF Stepping or kneeling on object..................... NF
Striking or bumping......... NF NF No fatalities reported. 1Injury information for 1983 and 1984
is based on preliminary data.
ACKNOWLEDGMENTS
The authors acknowledge the generous cooperation of Barbour Coal Co. of Clarksburg, WV, for providing the primary field site and for assistance in obtaining the data presented in this report.
The authors also thank Orin M. Peterson, mathematician, Twin Cities Research Center, Bureau of Mines, Minneapolis, MN, for his assistance in plotting the highwall profiles.

4
EXPERIMENTAL PROCEDURE
BLAST DESIGNS
The approach selected for devising the experimental blast designs was to take the design in use at the mine site and make minor delay-period changes. No other parameters were changed intentionally, but the accuracy of spacings and burdens varied, more than one hole diameter was occasionally used, and powder column heights also varied. The mine where the tests were conducted used a NONEL7 (also called shock tube) initiating system, so the original delay times reflected those available using that system.
The blast design used by the mine and the Bureau's first two alternative designs were previously described in detail in RI 8916. Briefly, design 1 (the pattern used by the mine) was a flat V with surface delays of 17 ms between holes, 42 ms between rows, and 200-ms in-th~-hole delays. Designs 2 and 3 were the same as design 1 except that in-the-hole delays of 250 and 300 ms, respectively, were used in the highwall holes. Design 4 was the same as design 1 except that 300-ms in-the-hole delays were used in the highwall holes and 250-ms in-the-hole delays were used in the second row of holes from the highwall. The four designs and the cumulative delay times for each blast hole are shown in figures 1 through 4. Each plan view (figs. 1-4) includes an arrow that indicates the observed direction of burden movement. In figures 2 through 4, this direction is perpendicular to the plane of the highwall, a sign of im~roved relief over that illustrated in figure 1. Design 4 was tried because of reports of overbreak extending far beyond a distance equal to one burden (7-8). It was anticipated that the additional delay in the second row of holes from the highwall would provide additional relief, reducing the damage to the highwall.
7Reference to specific not imply endorsement by Mines.
products does the Bureau of
HIGHWALL EVALUATION
To determine a criterion for evaluating the test blasts, discussions were held with MSHA inspectors, mine superintendents, safety officers, and blasters. The general theme found in these discussions was that a smooth highwall of competent appearance is a safer one. A competent appearance is achieved by reducing overbreak. In addition to visual inspection criteria, stereo photography techniques were used to analyze the blasting effects in this study. The use of highwall profiles generated from stereo photographs provided for more analytical and consistent comparison of highwalls than visual inspection. Early stereo procedures are described in RI 8916, while later techniques are described below. Since an aerial mapping firm generated the many profiles that were needed, the earlier procedures were modified to provide necessary controls or dimensional references. The procedure was to--
1. Take two photographs (left and right stereo pair) with parallel camera axes, with separation one-fourth to onefifth of the distance to the highwall.
2. Survey the location of the two camera stations and at least four targets on the highwall as controls such that their x, y, and z coordinates may be calculated. The four targets should be common to both the left and right pictures (fig. 5).
The photographs and coordinates were given to a photogrammetry firm so it could set up the pictures in a manner which duplicated the highwall geometry through a stereoscope. A photogrammetric operator then scanned a cursor over the surface seen in the stereoscope in vertical sections at regular intervals to read the x, y, and z coordinates of points on the highwall surface and feed them into a computer. The vertical sections were at 1-1/2- to 3-ft horizontal intervals, and the vertical increments between reading points were 1/3 ft or less. The vertical profiles of the highwalls were plotted from the coordinates by a Bureau computer

to determine the effectiveness of each blast design. (Examples of the plotted profiles are included in the "Results" section on page 7.) The amount of overhanging material forming ledges and the
\
0 0 0 0 0 0 0 0 I I
0 0 0 0 0 0 0 0 I ~:m~e;~f"
0 0 0 0 0 0 4~1 I 326 343 360 377 394
I 0 0 0 0 0 0 o I
301 84 301 318 335 352 3691
0 0 0 I
259 242 310 I Note: Numbers by holes are j cumulative delay times,
0 I Arrow lnctlcstes burden
0 0 2 ~5 movement.
200 234 251 268
I I I
foce
FIGURE 1. ~ Break line prior to 285 ms with 200-ms in-the-hole delays throughout.
0 0 0 0 0 0 0 o I I
o I 0
3~ 0 0 0 0 Next section
385 402 419 436 553 r or hlghwaJI
~II 0 0 343 326 343 360 377 394
I 0 0 0 0 4~91 301 284 318
I 0 0 0 0
0 I 242 259 293 427 Note. Numbers by holes are
1 ctJmU1alive delay umes. Maw !ndteates burden
0 0 0 0 0 0 I movement. 217 200 217 2~4 251
I Foce I
FIGURE 3. ~ Break line prior to 385 ms with 300-ms in-the-hole de lays in high wall holes and 200-ms in-thehole delays in remaining holes.
5
if
shape of the highwall could be easily observed from the profiles. An irregularly shaped highwall was considered to be the result of a poor blast design.
0 0 0 0 0 0 0 01
I 0 0 0 0 0 0 0
01 Next section r of tJighwnll
0 0 0 0
4~rl 3/326 343 377
I 0 0 0
4?91 301 335 352
I 0 0 0 0
3j7l 259 242 276 293 310
I No1e: Numbers by holes are cumulative delay times
~~51 Arrow lndicales burden
0 0 0 0 movement. 200 217 251 268
I I
FIGURE 2.- Break line prior to 335 ms with 250-ms in-the-hole delays in highwall holes and 200-ms in-the-hole delays in remaining holes.
0 0 0 0 0 0 5~51 427 410 427 444 461
I 0 0 0 0 0 5~31, ~~;~:n 305 368 385 419 486
I 0 0 0 5~1 I 343 326 343 360 377 444
I 0 0 0 0 0 4~91 284 301 318 335 402
I 0 0 0 0 0 0 4~71 259 242 259 276 293 360
Note: Numbers by holes ate j cumulative delay times.
0 0 Arrow Indicates burden
0 0 0 0 movement. 217 200 217 234 251 3!8
face
FIGURE 4. • Break line prior to 385 ms with 250-and 300-ms in·the~hole delays in two rows of holes nearest to the highwall and 200·ms in-the-hole de· lays in remaining holes.

6
Station I Station 2
KEY 0T1 Target
Camera and ~--- survey stations
FIGURE 5.- Illustration of stereo photography technique with control targets.
FIGURE 6. • Test site location (site 2), Barbour County, WV.

7
TEST SITE
The highwall profiles presented in this report are from test site 2, a contour coal mine located in Barbour County, WV, as shown in figure 6. However, overall evaluation of the blast designs is based on results from all three test sites (fig. 6). The overburden is in the
Monongahela Series, which is composed of green and gray fine-grained sandstones, alternating with red and/or sandy shales and a few thin limestones. The most important coal seams are the Redstone and Pittsburgh Seams.
RESULTS
The highwalls of 59 test blasts were evaluated from stereo photographs, onsite observation, photographs taken by the blaster, and notes made by the blaster. Profiles and photographs of four typical highwalls are shown as figures 7-14. Figures 7 and 8 show a highwall formed by a shot that used 200-ms in-the-hole delays throughout. This highwall was dangerous because of the large (5-ft) overhang left of center. Overbreak had caused the lower material to fall away, leaving the overhanging portion as a hazard.
The second highwall example (figs. 9-10) resulted from a shot that used 250-ms delays in the highwall holes and 200-ms delays in the rest of the shot. This highwall was smoother and showed wellinterlocked material. There were some small ledges of about 1 ft, but they appeared to be locked in tightly.
The third example (figs. 11-12) was formed by a shot that used 300-ms delays in the highwall holes and 200-ms delays in the rest of the shot. This highwall was sawtooth-shaped, although it did appear to be fairly solid. The shearing between holes was not as good as when 250-ms delays were used in the highwall holes (example 2). This was found to be true in many cases when 300-ms delays
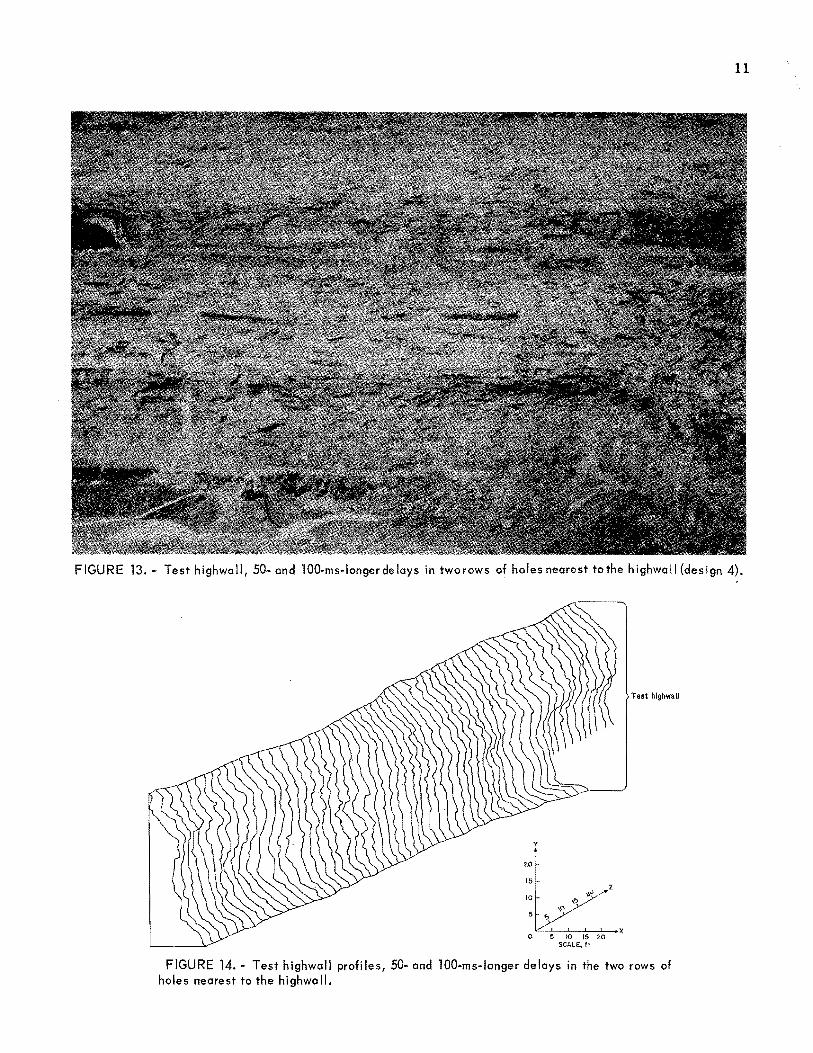
·were used. The fourth example (figs. 13-14) was
formed by a shot that had 300-ms delays in the highwall holes, 250-ms delays in the second row of holes from the highwall, and 200-ms delays in the remainder
of the pattern. The highwall was smooth and showed well-interlocked material. This fourth shot design gave results comparable to those obtained using 250-ms delays in the highwall holes (example 2). The fourth shot design was tried because of reports of overbreak extending far beyond a distance of one burden (7-8). The additional row of longer delays-(250 ms) provides a more uniform burden for the highwall holes (300-ms delays) because of the improved shearing action of the 250-ms delays. In addition to the uniform burden, less overbreak should occur up to a distance of two burdens because more time is allowed for burden movement. The evaluation system of stereo-generated profiles and photographic observation could not detect a reduction in fractures, although this probably occurred as a result of the additional row of delays.
In spite of the variables found in the field, blast designs 2 and 4 produced the best results. Design 4 should be used in difficult geologies where designs 2 and 3 produce poor results, since it introduces a second row of relief. Design 3, used in the third example (figs. 11-12) tended to produce a sawtooth appearance; however, this appearance corresponded to the joints present and so would not necessarily occur at another site. The authors believe design 3 resulted in less overbreak than design 1 did (first example, figs. 7-8), but that the shearing action between holes was not as good-hence the sawtooth appearance.

8
FIGURE 7.- Test highwall, no increase in delay time (blast design 1).
Test hlghwall
y
20
15
10~"'. 'l,.Q z ,o 5 ..,
)( 0 5 10 15 20
SCALE, ft
FIGURE 8.- Test highwal! profiles, no increase in delay time.

9
FIGURE 9.- Test highwall, 50-ms-longer delays in highwall holes (design 2).
Test highwall
FIGURE 10. • Test highwall profiles, 50-ms-longer delays in highwall holes.

10
FIGURE 11. Test highwall, lOO-ms-longer delays in highwall holes (design 3}.
20 yl 15
·:~, 0 5 10 15 20
SCALE, fl
FIGURE 12.- Test highwall profiles, lOO-ms-longer delays in highwall holes.
Test highwall
11
FIGURE 13.- Test highwall, 50- and 100-ms-longerdelays in two rows of holes nearest to the highwall (design 4).
Test highwall
y
20 -
15
10
'"' 5 10 15 20
SCALE, f1
FIGURE 14. • Test highwall profiles, 50· and lOO·ms-longer delays in the two rows of holes nearest to the highwall.

12
CONCLUSIONS AND RECOMMENDATIONS
The results demonstrated that greater highwall stability can be achieved by changing the burden movement to a direction closer to perpendicular to the plane of the highwall. The changes in blast design described in this report can be implemented without increasing costs or technical complication.
Redirecting the burden movement was accomplished by using delays in all highwall holes that were either 50 or 100 ms longer than those previously used in the delay pattern. Another variation was to increase the delay time by 50 ms in the second row of holes from the highwall and by 100 ms in the highwall row of holes. The lengthened delays allowed more time for the burden to move, thereby reducing overbreak, which causes irregular and unstable highwalls. At the test sites used, the 50-ms-longer delays or combination of 50- and 1004ms-longer delays or combination of longer delays worked better, than when the delay time was increased by 100 ms only. This was because of the better shearing action obtained with the 50-ms incremental increase. Since the test mine had a particular
geology and used the NONEL initiating system for blasting, other mine sites and initiating systems (such as electric) may require adjustment of the delay time to obtain optimum results.
The test results showed a general improvement in the highwalls even though drill-hole alignment wandered, powder column heights varied, the geology changed continually (because the test site was a contour mine), and scaling practices varied. During the course of study, the safety officer and the mine operator both observed that the highwalls had noticeably improved and required less cleanup time by the dozers used to scale the highwalls at the test site. Precise evaluation of the blast effects on highwalls proved to be difficult because of the many variables mentioned above. However, after observing the results of 59 test blasts, the authors recommend an increased delay of 50 to 100 ms in the highwall holes as described in the "Experimental Procedure" section. These delay increases may need to be adjusted slightly for specific sites or adapted for other initiation systems.
REFERENCES
1. Theodore Barry and Associates. Industrial Engineering Study of Hazards Associated With Surface Coal Mines (contract H0230004). BuMines OFR 48-74, 1974, 265 pp.; NTIS PB 235 927.
2. Mine Safety and Health Administration (Dep. Labor). Mine Injuries and Worktime Quarterly. Closeout editions, 1978-82.
3. Quarterly. 84.
Mine Injuries and Worktime Preliminary editions, 1983-
4. Kendorski, F. S., and M. F. Dunn. Safety and Cost Benefits From Improved Highwall Blasting Practice (contract H0282011). BuMines OFR 54-82, 1981, 169 pp.; NTIS PB 82-205691.
5. Stachura, v. J., and L. R. Fletcher. Delayed Blasting Test To Improve
Highwall Stability--A Progress Report. BuMines RI 8916, 1984, 24 pp.
6. Dick, R. A., L. R. Fletcher, and D. V. D'Andrea. Explosives and Blasting Procedures Manual. BuMines IC 8925, 1983, 105 pp •
7. Hoek, E. Impact of Blasting Damage on the Stability of Rock Structures. Pres. at 2d Annu. Workshop, Generic Miner. Technol. Center, Mine Systems Design and Ground Control, Reno, NV, Nov. 12-13, 1984, 10 pp.; available upon request from v. J. Stachura, BuMines, Minneapolis, MN.
8. Holmberg, R., and K. Maki. Case Examples of Blasting Damage and Its Influence on Slope Stability. SveDeFo, Rep. DS 1981:9, Stockholm, Sweden, 1981, 20 pp.
INT.-BU.OF MINES,PGH.,PA. 28191