hiscox ltd preliminary results · – cyber – us flood – product recall • increased syndicate...
TRANSCRIPT

Hiscox LtdPreliminary resultsFor the year ended 31 December 2017

Weathering the stormsAn historic year for natural catastrophes
1

Strategy of balance builds resilience
• GWP up by 6% to £2.5bn
• Hiscox Retail GWP up 21%
• COR excluding FX 98.8%
• PBT excluding FX £94m
• Full-year dividend 29.0p
2
Financial performance

2017£m
2016£m
Change%
GrowthGross premiums written 2,549.3 2,402.6 6Net premiums written 1,864.2 1,787.9 4Net premiums earned 1,874.5 1,675.0 12EarningsUnderwriting profit 34.7 162.8 (79)Investment return 81.3 70.6* 15Monetary FX items (62.8) 152.4 (141)Other** (22.4) (31.3) (28)Profit before tax 30.8 354.5 (91)Profit before tax excl. monetary FX 93.6 202.1 (54)Combined ratio 99.9% 84.2% (15.7)Combined ratio excl. monetary FX 98.8% 90.6% (8.2)Balance sheetOrdinary dividend (p) 29.0 27.5 5.5Net asset value
£mp per share
1,754.4618.6
1,818.4649.9
(4)(5)
Return on equity 1.5% 23.0% (21.5)
Group performanceA good result in a challenging year
4
• GWP growth in constant currency of 2%
• Hiscox Retail key driver of top line, up 21%
• Solid investment return of 2.0%†
• FX headwind of (£63m)
• Business mix delivers underwriting profit in heavy catastrophe year
• Net $225 million reserved for catastrophe claims
• Dividend up 5.5%, returning to progressive after re-base in 2016
• Change to USD reporting effective 1 January 2018
*Re-classification of investment fees.**Includes finance costs, impairments and accelerated amortisation.†Gross of derivatives and fees.

Hiscox RetailGood growth and profits
5*Includes impairments and accelerated amortisation.
• Strong GWP growth in constant currency of 16%– Hiscox UK & Ireland:
11%– Hiscox Europe: 12%– Hiscox USA: 29%
• Growth driven by small commercial, up 23%
• More normal loss experience and modest hurricane exposure for Hiscox USA
• Hiscox Special Risks stable in a competitive environment
• DirectAsia making headway with investment in marketing and distribution
• Evolving leadership structure to build on growth momentum
2017£m
2016£m
Gross premiums written 1,423.9 1,181.4
Net premiums written 1,298.9 1,092.0
Net premiums earned 1,229.9 1,020.5
Underwriting profit 89.0 100.4
Investment result 22.8 30.4
Foreign exchange and other* (1.9) 27.2
Profit before tax 109.9 158.0
Profit before tax excl. monetary FX 110.3 120.7
Combined ratio 94.6% 88.0%
Combined ratio excl. monetary FX 94.5% 91.8%

379
452
584
696
840
0
200
400
600
800
1,000
1,200
1,400
1,600
2013 2014 2015 2016 2017
Hiscox RetailConsistent growth and profitability
6
Retail GWP (£m) Retail policies in force (‘000) Retail NEP (£m) Retail COR (ex-FX)
50%
55%
60%
65%
70%
75%
80%
85%
90%
95%
100%
0
200
400
600
800
1,000
1,200
1,400
1,600
2013 2014 2015 2016 2017

Hiscox London MarketA testing year with a brighter outlook
7*Includes accelerated amortisation.
• Top line reduced by 23% in constant currency as planned
• Impacted by hurricanes Harvey and Irma
• Capitalising on rate improvements
• Continued investment where we see opportunity:– Cyber– US flood– Product recall
• Increased Syndicate 33 capacity by £450m to £1.6bn for 2018
• Leadership evolution with appointment of CEO
2017£m
2016£m
Gross premiums written 581.7 726.0
Net premiums written 376.2 469.1
Net premiums earned 435.7 443.1
Underwriting loss (35.7) (2.3)
Investment result 11.3 12.3
Foreign exchange and other* (11.8) 34.0
Profit/(loss) before tax (36.2) 44.0
Profit/(loss) before tax excl. monetary FX (24.5) 9.0
Combined ratio 111.6% 90.7%
Combined ratio excl. monetary FX 108.7% 99.4%

Hiscox Re & ILSProfitable in a costly year for reinsurers
8*Includes finance costs.
• Growth of 5% in constant currency, driven by ILS
• Capitalising on rate improvements
• Growing contribution from fees and profit commissions
• ILS AUM now $1.5bn
2017£m
2016£m
Gross premiums written 543.7 495.2
Net premiums written 189.2 226.8
Net premiums earned 209.0 211.4
Underwriting profit 3.5 84.1
Investment result 21.7 10.1
Foreign exchange and other* (5.4) 21.3
Profit before tax 19.8 115.5
Profit before tax excl. monetary FX 23.9 92.5
Combined ratio 101.3% 53.0%
Combined ratio excl. monetary FX 98.9% 64.9%

31 December 2017 31 December 2016
Asset allocation
%
Annualised return
%Return
£000
Asset allocation
%
Annualised return
%Return
£000
Bonds £ 13.4 1.2 14.1 2.7
US$ 54.2 1.5 54.6 1.7
Other 10.2 (0.1) 8.7 1.1
Bonds total 77.8 1.2 42,079 77.4 1.9 55,709
Equities 7.6 12.9 41,453 6.9 6.2 17,246
Deposits/cash/bonds <three months 14.6 0.5 3,755 15.7 0.3 1,881
Investment result – financial assets 2.0 87,287 1.9 74,836
Derivative returns (1,315) 155
Investment fees (4,709) (4,361)
Investment result 81,263 70,630
Group invested assets £4,413m £4,410m
Solid investment performanceInvestment return of £81.3m
9Now categorised including investment fees.
69.7
18.7
9.7
1.9
USDGBPEURCAD and other
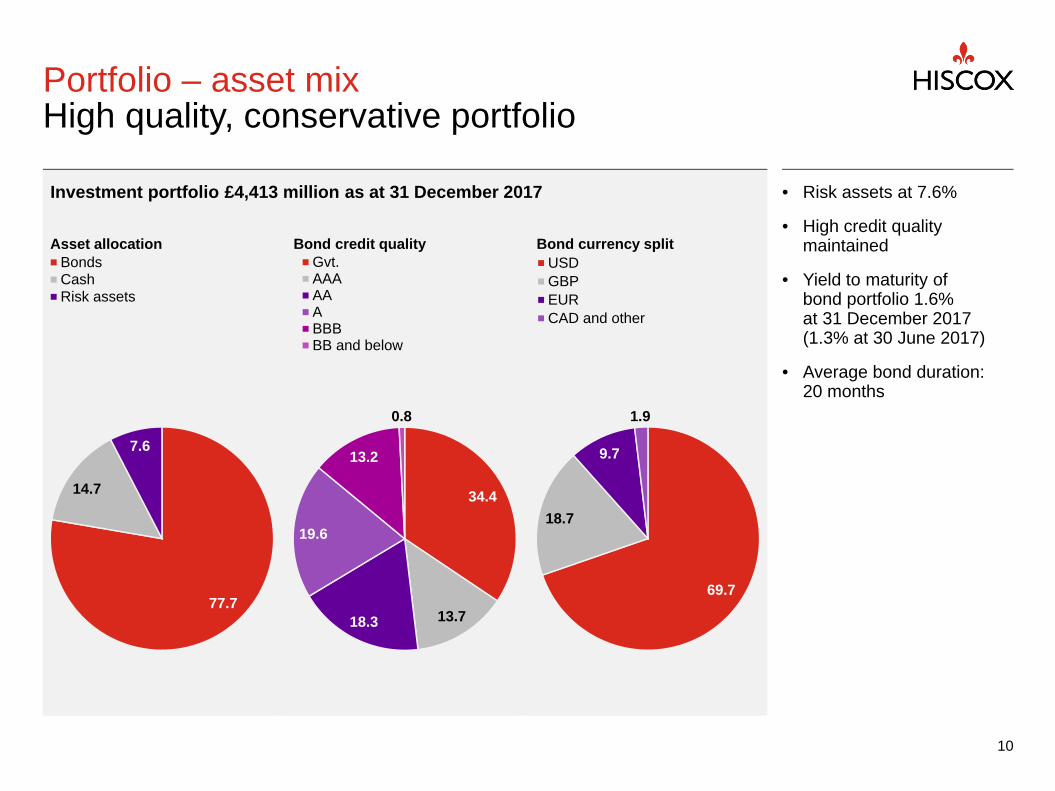
Portfolio – asset mixHigh quality, conservative portfolio
10
Investment portfolio £4,413 million as at 31 December 2017 • Risk assets at 7.6%
• High credit quality maintained
• Yield to maturity of bond portfolio 1.6% at 31 December 2017 (1.3% at 30 June 2017)
• Average bond duration: 20 months
34.4
13.718.3
19.6
13.2
0.8
Gvt.AAAAAABBBBB and below
77.7
14.7
7.6
BondsCashRisk assets
Asset allocation Bond credit quality Bond currency split

0.70
0.75
0.80
0.85
0.90
0.95
1.00
1.05
Year 1 Year 2 Year 3 Year 4 Year 5
Prudent approach to reserving continuesReserve releases £252m
11
Loss development by accident year
2013 2014 2015 2016
Reserve release as % of opening net reserves
15.0%
10.2% 9.5%11.5% 13.2% 12.7% 12.4%
2011 2012 2013 2014 2015 2016 2017

Capital requirement
12
£1.89bn available capital
£1.83bn available capital (post-final dividend)
• All capital bases satisfactorily capitalised
• Bermuda solvency ratio above 225%
• Key constraint remains rating agency capital
• S&P capital requirement reduced due to risk re-classification from high to moderate, reflecting business model diversification
• US capital requirement increased by $75m due to BEAT
Rating agency assessments shown are internal Hiscox assessments of the agency capital requirements on the basis of projected year-end 2017 results. Hiscox uses the internally developed Group capital model to assess its own capital needs on both a trading (economic) and purely regulatory basis. All capital requirements have been normalised with respect to variations in the allowable capital in each assessment for comparison to a consistent available capital figure. The available capital figure comprises net tangible assets and subordinated debt.
Economic Regulatory
31 December 2017
Post-risk re-classification
Pre-S&P risk re-classification
A.M. Best S&P Fitch Hiscoxintegrated
capital model(economic)
Hiscoxintegrated
capital model(regulatory)
Bermudaenhancedsolvencycapital
requirement

Financial flexibilityCapital strength and business mix diversification
13
• Net $225m of catastrophe losses
• £54m invested in marketing
• Lloyd’s stamp increased by £450m to £1.6bn
• UK and US IT system replacement
• Group-wide finance transformation project –coming off end-of-life technologies
• New internal capital model
• Moving systems to the cloud
• US tax reform –modest P&L impact, estimated $75m capital injection required
• Brexit – Luxembourg carrier receives regulatory approval
• S&P capital requirement lowered, BSCR potentially to increase
Absorbing losses Investing for growth Building operational resilience
Managing regulatory change

Underwriting
2017 catastrophes$140bn* of insured catastrophe losses
• Net reserves $225 million for all catastrophes
• No adverse deterioration of reserves expected
• Losses within modeled range
• Alternative capital partners re-committed following losses
• Comfortably capitalised for events of this size
15*Source: JLT Re.
0
20
40
60
80
100
120
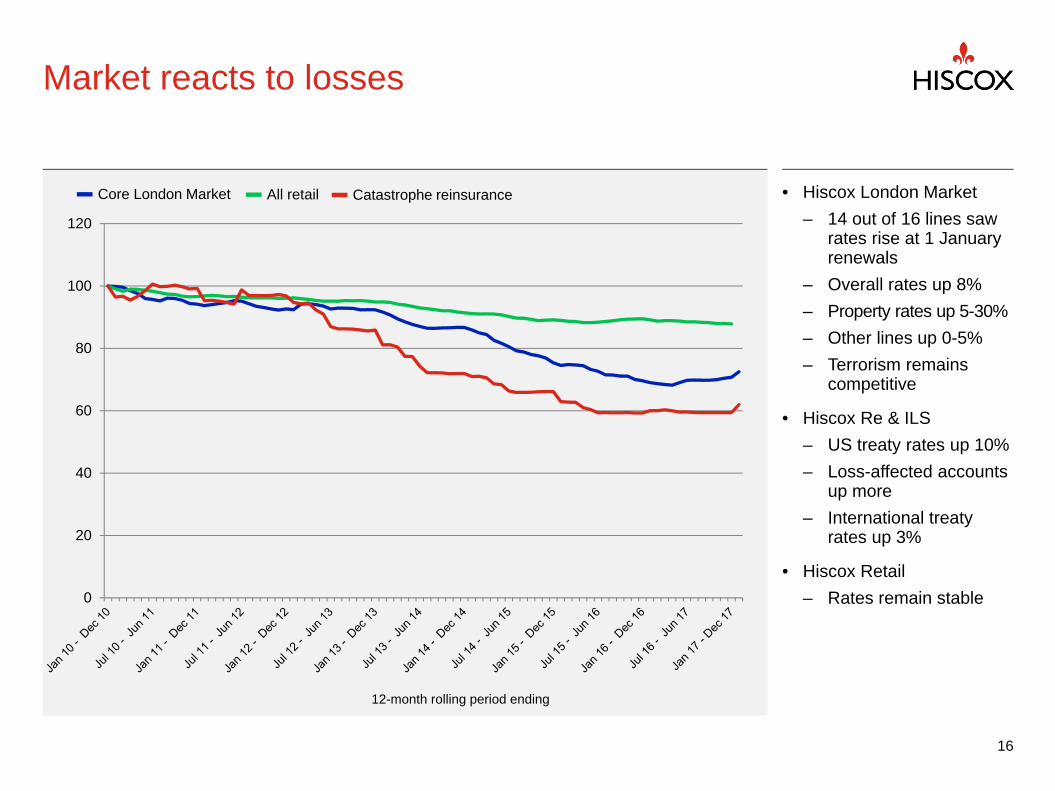
Market reacts to losses
16
• Hiscox London Market– 14 out of 16 lines saw
rates rise at 1 January renewals
– Overall rates up 8%– Property rates up 5-30%– Other lines up 0-5%– Terrorism remains
competitive
• Hiscox Re & ILS– US treaty rates up 10%– Loss-affected accounts
up more– International treaty
rates up 3%
• Hiscox Retail – Rates remain stable
Core London Market All retail Catastrophe reinsurance
12-month rolling period ending

Small commercial Reinsurance Specialty Art and private client Property Marine and energy Global casualty
An actively managed business
17
Period-on-period in constant currency2017 GWP
Non-marine
Marine
Aviation
Casualty
Specialty
Professional liabilities
Errors and omissions
Private directors and
officers’ liability
Cyber
Commercial small package
Small technology and media
Healthcare related
Media and entertainment
Kidnap and ransom
Contingency
Terrorism
Product recall
Personal accident
Home and contents
Fine art
Classic car
Luxury motor
Asian motor
Commercial property
Onshore energyUSA homeowners Managing general
agentsInternational
property
CargoMarine hull
Energy liabilityOffshore energyMarine liability
Public D&O, Errors and omissions
Large cyberGeneral liability
+23%£972m
+9%£609m
-33%£367m +4%
£331m-9%
£273m
+5%£141m
+7%£140m
Total Group controlled premium 31 December 2017: £2,833 million
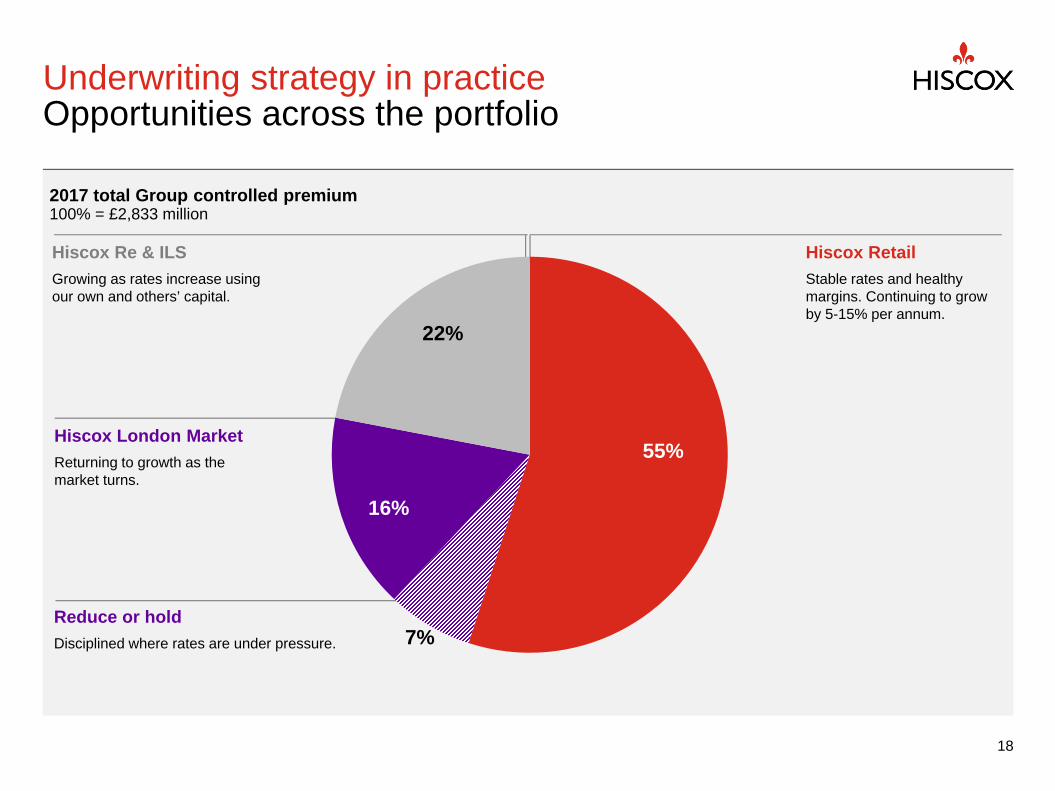
Underwriting strategy in practiceOpportunities across the portfolio
Hiscox Retail Stable rates and healthy margins. Continuing to grow by 5-15% per annum.
Hiscox Re & ILSGrowing as rates increase using our own and others’ capital.
Hiscox London MarketReturning to growth as the market turns.
18
2017 total Group controlled premium100% = £2,833 million
55%
22%
16%
7%Reduce or holdDisciplined where rates are under pressure.

0%
20%
40%
60%
80%
100%
2015 2016 2017 2020ambition
Segmented underwriting model
• Efficient underwriting of less complex risks using our own and third-party data and advanced analytics
• Targeted data labs to deliver insight and drive profitable growth
• Enabling underwriters to focus on business development and product innovation
• Human where it counts
Hiscox RetailContinued investment in technology, data and people
19
Hiscox UK & IrelandNon-automatedAutomated

0%
10%
20%
30%
40%
50%
60%
70%
80%
90%
100%
2015 2016 2017 2018 outlook
NW
P (%
)
Hiscox London MarketDisciplined growth in 2018
20
• Opportunities to grow– Core catastrophe
lines: household, commercial lines, major property
– New teams:cyber, general liability, product recall
– New products e.g. FloodPlus
– Third-party capital strategy: quota share, consortia, ILS
• Hold where margins are slim– Marine cargo, marine
hull, personal accident and energy
• Reduce or exit lines Disciplined where margins have eroded– Extended warranty,
political risks, healthcare, PI,aviation hull, liability
ReduceHoldGrow
*
*Applies 2018 segmentation (grow, hold, reduce) to 2017 business mix.

Hiscox Re & ILSGrowth of the hybrid reinsurer
21

Business performance and outlook

Year to 31 December 2017 Constant currency
GWP£m
GWP change%
GWP change%
Hiscox Retail 1,423.9 21 16
Hiscox UK & Ireland 556.3 12 11
Hiscox USA 544.2 36 29
Hiscox Europe 213.3 22 12
Hiscox Special Risks 98.7 4 (1)
DirectAsia 11.4 (5)* (10)*
Hiscox London Market 581.7 (20) (23)
Hiscox Re & ILS 543.7 10 5
Total 2,549.3 6 2
Managing the business
23*Excludes disposal of Hong Kong subsidiary.
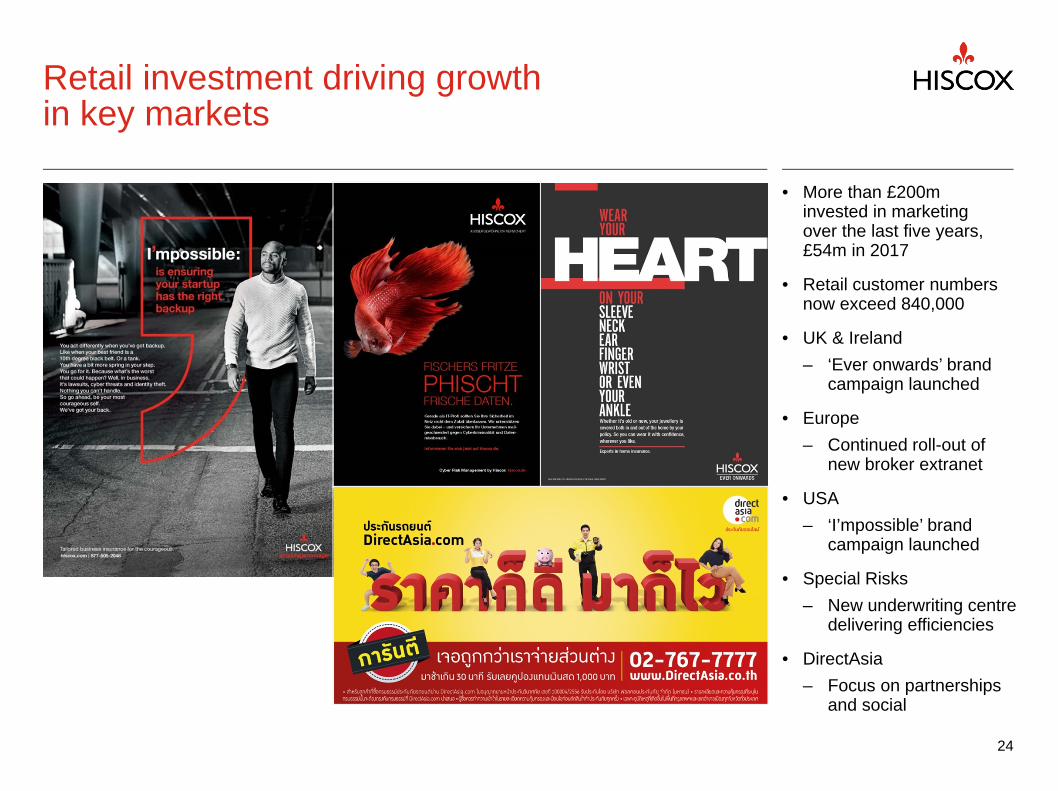
Retail investment driving growth in key markets
25
• More than £200m invested in marketing over the last five years, £54m in 2017
• Retail customer numbers now exceed 840,000
• UK & Ireland– ‘Ever onwards’ brand
campaign launched
• Europe– Continued roll-out of
new broker extranet
• USA – ‘I’mpossible’ brand
campaign launched
• Special Risks– New underwriting centre
delivering efficiencies
• DirectAsia– Focus on partnerships
and social
24

0
100
200
300
400
500
600
700
800
900
1000
1994 1995 1996 1997 1998 1999 2000 2001 2002 2003 2004 2005 2006 2007 2008 2009 2010 2011 2012 2013 2014 2015 2016 2017
Building our small business cathedralLong-term investment and patience
Launched products targeting specific professions – tech, media, consultants
Launched specialty commercial in Europe
Increased investment in UK brand
Launched US direct
Launched specialty commercial in US
Launched Europe direct
Wrote E&Oinsurance through non-Lloyd’s brokers
Launched UK direct commercial
Innovations in cyber
25
Expanded UK product suite: office, PA, EL, EPLI
Added new professions in US
Launched US partnerships
Launched UKpartnerships
Expanded appetite for newprofessions in UK
Small commercial – GWP (£m)

Broadening distribution and access to capital
26
Broadening distribution
• Hiscox Re & ILS FloodXtra product supporting US primary carriers
• Hiscox USA writing property binders on behalf of London Market property consortium
• Hiscox MGA accessing Middle East, South America and European business
• Partnerships in UK, Europe and US drive our small commercial and private client business
Flexible deployment of own and others’ capital
• Hiscox-led London Market flood consortium deploying significant capacity
• Material cyber quota share supports large lines and manages risk exposure
• Hiscox Re & ILS supported by 16 quota share partners
• ILS funds re-load after events, AUM now $1.5 billion

Evolution of structure and leadershipPutting the right people behind the right opportunities
27
Building on momentum in Hiscox Retail
Evolving to meet challenges in Hiscox London Market
Succession in Hiscox Re & ILS
Ben Walter, CEO Hiscox Global Retail – new roleSteve Langan, CEO Hiscox USAJoanne Musselle, CUO Hiscox Global Retail – new role
Kate Markham, CEO Hiscox London Market – new rolePaul Lawrence, CUO Hiscox London Market
Mike Krefta, CEO Hiscox Re & ILSJeremy Pinchin returns to London as Group Claims DirectorAdam Szakmary and Megan McConnell join as Directors of Underwriting in Bermuda and London

Summary and outlookStrategy of balance to continue
• 2017 was a challenging year
– Profitable in an historic year for catastrophes
– Responding to ongoing regulatory and political expectations
– Considerable investment to support growth
• 2018 has a positive outlook
– Evolving our leadership around opportunities
– Improving pricing environment
– Continued infrastructure investment
• Growth ambitions for every business unit
28

Appendices
• Big-ticket and retail business• Geographical reach • Strategic focus• A symbiotic relationship• Long-term growth• An actively managed business• Segmental analysis• Hiscox Ltd results• Boxplot and whisker diagram of Hiscox Ltd• Realistic disaster scenarios• Casualty extreme loss scenarios • GWP geographical and currency split• Group reinsurance security• Reinsurance• Portfolios – USD bond portfolios• Portfolios – GBP, EUR and CAD bond portfolios• Business segments
29

What do we mean by big-ticket and retail business?
• We characterise big-ticket as larger premium, catastrophe exposed business written mainly through Hiscox Re & ILS and Hiscox London Market. We expand and shrink these lines according to market conditions.
• Retail is smaller premium, less volatile business written mainly through Hiscox Retail. Investment in our brand and specialist knowledge differentiates us here. We aim to grow this business between 5-15% per annum.
30

Geographical reach32 offices in 14 countries
31
USAAtlantaChicagoDallasLos AngelesNew York CitySan FranciscoWhite Plains
GuernseySt Peter Port
Latin American gatewayMiami
BermudaHamilton
EuropeAmsterdamBordeauxBrusselsCologneDublinFrankfurtHamburgLisbonLuxembourg LyonMadridMunichParis
UKBirminghamColchesterGlasgowLondonMaidenheadManchesterYork
AsiaBangkok Singapore

Strategic focus
32

A symbiotic relationship
33

Long-term growth
34
Hiscox Re & ILS Hiscox UK
Gro
ss w
ritte
n pr
emiu
ms
(£m
)
Hiscox London Market Hiscox EuropeHiscox Special RisksHiscox USA
DirectAsia
His
cox
Ret
ail
His
cox
Lond
on M
arke
tH
isco
x R
e &
ILS
0 ‐
500
1,000
1,500
2,000
2,500
3,000

Small commercial Reinsurance Specialty Art and private client Property Marine and energy Global casualty
An actively managed business
35
Period-on-period in constant currency2017 GWP
Non-marine
Marine
Aviation
Casualty
Specialty
Professional liabilities
Errors and omissions
Private directors and
officers’ liability
Cyber
Commercial small package
Small technology and media
Healthcare related
Media and entertainment
Kidnap and ransom
Contingency
Terrorism
Product recall
Personal accident
Home and contents
Fine art
Classic car
Luxury motor
Asian motor
Commercial property
Onshore energyUSA homeowners Managing general
agentsInternational
property
CargoMarine hull
Energy liabilityOffshore energyMarine liability
Public D&O, Errors and omissions
Large cyberGeneral liability
+23%£972m
+9%£609m
-33%£367m +4%
£331m-9%
£273m
+5%£141m
+7%£140m
Total Group controlled premium 31 December 2017: £2,833 million

31 December 2017 31 December 2016
HiscoxRetail
£m
HiscoxLondon Market
£m
Hiscox Re & ILS
£m
CorporateCentre
£mTotal
£m
HiscoxRetail
£m
HiscoxLondon Market
£m
Hiscox Re & ILS
£m
CorporateCentre
£mTotal
£m
Gross premiums written 1,423.9 581.7 543.7 – 2,549.3 1,181.4 726.0 495.2 – 2,402.6
Net premiums written 1,298.9 376.2 189.1 – 1,864.2 1,092.0 469.1 226.8 – 1,787.9
Net premiums earned 1,229.9 435.7 208.9 – 1,874.5 1,020.5 443.1 211.4 – 1,675.0
Investment result 22.8 11.3 21.7 25.5 81.3 30.4 12.3 10.0 17.9 70.6
Foreign exchange gains/(losses) (0.4) (11.8) (4.1) (46.5) (62.8) 37.2 35.0 23.0 57.2 152.4
Profit/(loss) before tax 109.8 (36.2) 19.8 (62.6) 30.8 158.0 44.0 115.5 37.0 354.5
Combined ratio 94.6% 111.6% 101.3% – 99.9% 88.0% 90.7% 53.0% – 84.2%
Combined ratioexcluding monetary FX 94.5% 108.7% 98.9% – 98.8% 91.8% 99.4% 64.9% – 90.6%
Segmental analysis
36Business segments described in appendices.

£m 2017 2016 2015 2014 2013 2012
Gross premiums written 2,549.3 2,402.6 1,944.2 1,756.3 1,699.5 1,565.8
Net premiums written 1,864.2 1,787.9 1,571.8 1,343.4 1,371.1 1,268.1
Net premiums earned 1,874.5 1,675.0 1,435.0 1,316.3 1,283.3 1,198.6
Investment return† 81.3 70.6 33.7 56.4 58.9 92.7
Profit before tax 30.8 354.5 216.1 231.1 244.5 217.5
Profit after tax 26.3 337.0 209.9 216.2 237.8 208.0
Basic earnings per share 9.3p 119.8p 72.8p 67.4p 66.3p 53.1p
Dividend 29.0p 27.5p 24.0p 22.5p 21.0p 18.0p
Invested assets (incl. cash)† 4,412.7 4,409.6 3,609.4 3,244.9 3,129.5 3,055.8
Net asset value
£m 1,754.4 1,818.4 1,528.8 1,454.2 1,409.5 1,365.4
p per share 618.6 649.9 545.0 462.5 402.2 346.4
Combined ratio 99.9 84.2% 85.0% 83.9% 83.0% 85.5%
Return on equity after tax* 1.5 23.0% 16.0% 17.1% 19.3% 17.1%
Hiscox Ltd results
37†Excluding derivatives, insurance linked funds and third-party assets managed by Kiskadee Investment Managers.*Annualised post tax, based on adjusted opening shareholders’ funds.

-
100
200
300
400
500
600
700
800
JPEQ
USEQ
EUWS
USWS
JPEQ
USEQ
EUWS
USWS
JPEQ
USEQ
EUWS
USWS
JPEQ
USEQ
EUWS
USWS
JPEQ
USEQ
EUWS
USWS
5-10yr 10-25yr 25-50yr 50-100yr 100-250yr
Boxplot and whisker diagram of modeledHiscox Ltd net loss (US$m) January 2018
38
02 02 06 19 06 07 10 43 17 19 15 67 26 39 20 100 36 67 27 145Mean industry loss $bn
Industry loss returnperiod and peril
JP EQ – Japanese earthquakeUS EQ – United States earthquakeEU WS – European windstormUS WS – United States windstorm
His
cox
Ltd
loss
($m
)Lower 5%- upper 95% rangeModeled mean loss
5-10 year 10-25 year 25-50 year 50-100 year 100-250 year
0
Hur
rican
e K
atrin
a \U
S$5
0bn
mar
ket
loss
21
year
retu
rn p
erio
d
Hur
rican
e A
ndre
w U
S $
56bn
mar
ket
loss
25
year
retu
rn p
erio
d
Nor
thrid
ge Q
uake
US
$24b
n m
arke
t lo
ss 4
0 ye
ar re
turn
per
iod
Sup
erst
orm
San
dy -
US$
20bn
mar
ket
loss
, 7 y
ear r
etur
n pe
riod
1987
J U
S$1
0bn
mar
ket l
oss
15 y
ear r
etur
n pe
riod
Lom
a P
rieta
Qua
ke U
S$6
bn m
arke
t lo
ss 1
5 ye
ar re
turn
per
iod
2011
Toh
oku
Qua
ke U
S $
25bn
m
arke
t los
s, 4
5 ye
ar re
turn
per
iod

37%
17%
39%
50%
26%
7%
3%
7%
8%
4%
San Fransisco earthquake
European windstorm
Florida windstorm
Gulf of Mexico windstorm
Japanese earthquake
Realistic disaster scenarios
39
Hiscox Group – losses shown as percentage of 2017 gross and net written premium
Estimates calculated in accordance with Lloyd’s guidelines using models provided by Risk Management Solutions, Inc. and AIR Worldwide Corporation. Industry return periods estimated using Lloyd’s guideline industry loss figures.
Industry loss return period
$50bn 1 in 240 year
$107bn 1 in 80 year
$125bn 1 in 100 year
$30bn 1 in 200 year
$50bn 1 in 110 year
Gross lossNet loss

Casualty extreme loss scenariosChanging portfolios, changing risk
• As our casualty businesses continue to grow, we develop extreme loss scenarios to better understand and manage the associated risks
• Losses in the region of £105m-£405m could be suffered in the following extreme scenarios:
40
Event Est. loss
Pandemic Global Spanish flu type event (high infection, low mortality)45% infection rate, 20% medical treatment, 0.3% case fatality rate £145m
Cyber Key region of a premier cloud service provider goes offline for five days £105m
Multi-year loss ratio deterioration 5% deterioration on three years’ casualty premiums of c.£2.8bn £155m
Economic collapse US GDP drop of 10% to 15%, approximately three times the 2007-08 financial crisis £400m
Casualty reserve deterioration
35% deterioration on existing casualty reserves of c.£1.1bnEst. 1 in 200 year event £405m
Property catastrophe 1 in 200 year catastrophe event from £160bn US windstorm £265m

GWP geographical and currency split
41
2017 geographical split – controlled income 2017 currency split – controlled income
49.1%
6.7%
11.4%
14.2%
18.6%
North AmericaOtherWesterm Europe (excl. UK)WorldwideUK
23.1%
60.3%
3.8%
12.8%
GBPUSDCAD and otherEUR

Group reinsurance security
42
Receivables at 31 December 2017 of £1,358 million
57.1%
15.8%
26.9%
0.2%
AAAAAA and collateralisedOther
57%
38%
5%
AAAAAA
*Reinsurance placements in force at 14 February 2018.
2017 reinsurance protections*First loss exposure by rating

20.9
13.4
18.7
21.7
19.4 21
.0
19.0
19.0
19.3
23.5
19.2
25.6 26
.9
0
5
10
15
20
25
30
Reinsurance
43
Ceded as a percentage of GWP Reinsurance receivables as a percentage of total assets
17.0
10.0
7.7
13.4
11.0 11
.6
11.7 12
.3
10.3
10.6
10.2
12.1
18.8
0
5
10
15
20
25

Portfolios: $3.2 billionAAA
%AA%
A %
BBB%
BB and below
%Total
%Durationmonths
Government issued 38.0 0.3 38.3 22
Government supported* 1.0 4.5 1.2 0.1 6.8 18
Asset backed 3.4 3.4 9
Mortgage backed agency 6.0 6.0 17
Non agency 0.1 0.1 0.9 1.1 18
Commercial MBS 0.8 0.8 20
Corporates 0.9 7.5 21.0 12.9 0.2 42.5 16
Lloyd’s deposits 1.1 1.1 12
Total 6.2 57.1 22.5 13.1 1.1 100.0 18
Portfolio – USD bond portfoliosas at 31 December 2017
44*Includes agency debt, Canadian provincial debt and government guaranteed bonds.
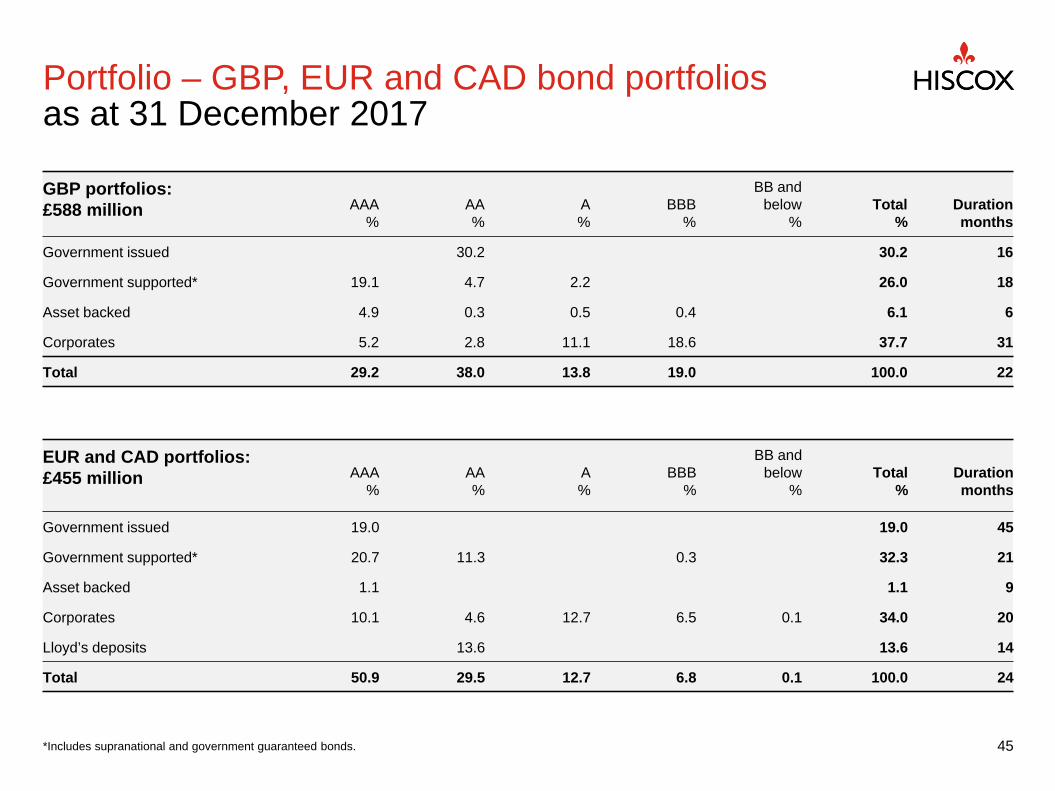
GBP portfolios: £588 million AAA
%AA%
A%
BBB%
BB and below
%Total
%Durationmonths
Government issued 30.2 30.2 16
Government supported* 19.1 4.7 2.2 26.0 18
Asset backed 4.9 0.3 0.5 0.4 6.1 6
Corporates 5.2 2.8 11.1 18.6 37.7 31
Total 29.2 38.0 13.8 19.0 100.0 22
EUR and CAD portfolios: £455 million AAA
%AA%
A%
BBB%
BB andbelow
%Total
%Durationmonths
Government issued 19.0 19.0 45
Government supported* 20.7 11.3 0.3 32.3 21
Asset backed 1.1 1.1 9
Corporates 10.1 4.6 12.7 6.5 0.1 34.0 20
Lloyd’s deposits 13.6 13.6 14
Total 50.9 29.5 12.7 6.8 0.1 100.0 24
Portfolio – GBP, EUR and CAD bond portfoliosas at 31 December 2017
45*Includes supranational and government guaranteed bonds.

Business segments
Hiscox RetailHiscox Retail brings together the results of the UK and Europe, and Hiscox International being the US, Special Risks and Asia retail business divisions. Hiscox UK and Europe underwrite European personal and commercial linesbusiness through Hiscox Insurance Company Limited, together with the fine art and non-US household insurance business written through Syndicate 33. In addition, Hiscox UK includes elements of specialty and international employees and officers’ insurance written by Syndicate 3624, and Hiscox Europe excludes the kidnap and ransom business written by Hiscox Insurance Company Limited. Hiscox International comprises the specialty and fine art lines written through Hiscox Insurance Company (Guernsey) Limited, and the motor business written via DirectAsia, together with US commercial, property and specialty business written by Syndicate 3624 and Hiscox Insurance Company Inc. via the Hiscox USA business division. It also includes the European kidnap and ransom business written by Hiscox Insurance Company Limited and Syndicate 33.
Hiscox London Market Hiscox London Market comprises the internationally-traded insurance business written by the Group’s London based underwriters via Syndicate 33, including lines in property, marine and energy, casualty and other specialty insurance lines, excluding the kidnap and ransom business.
Hiscox Re & ILSHiscox Re & ILS is the reinsurance division of the Group, combining the underwriting platforms in Bermuda, London and Paris. The segment comprises the performance of Hiscox Insurance Company (Bermuda) Limited, excluding the internal quota share arrangements, with the reinsurance contracts written by Syndicate 33. In addition, the casualty reinsurance contracts written in Bermuda on Syndicate capacity are also included. The segment also captures the performance and fee income of the ILS funds, further details of which can be found in note 2.3 of the Group’s Report and Accounts for the year ended 31 December 2017.
Corporate CentreCorporate Centre comprises the investment return, finance costs and administrative costs associated with Group management activities. Corporate Centre also includes the majority of foreign currency items on economic hedges and intragroup borrowings, further details of which can be found at note 12 of the Group’s Report and Accounts for the year ended 31 December 2017. Corporate Centre forms a reportable segment due to its investment activities which earn significant external returns.
46