historic characterization of wria 9 shoreline … characterization of wria 9 shoreline landforms 1...
TRANSCRIPT
Technical Report 2005-01
Historic Characterization of WRIA 9 Shoreline Landforms Prepared in support of the Puget Sound Nearshore Partnership
November 2005 Jessemine Fung and Chris Davis CommEn Space

Technical subject matter of this document was produced by the Puget Sound Nearshore Partnership which is entirely responsible for its contents. This document may be freely copied and distributed without charge.
Acknowledgements The authors would thank the members of the Nearshore Science Team for their help and input. We especially thank Hugh Shipman for his assistance in developing the methodology and in ‘working out the kinks’. The resulting dataset was developed out of the GIS coverage of historic conditions developed by the Puget Sound River History Project. We’d like to acknowledge their excellent work in doing so. The Washington Department of Natural Resources (DNR) provided these data to the Puget Sound Nearshore Partnership. Phil Bloch managed the historic shoreline data development contract for DNR and was instrumental in facilitating data transfer. Funding for this study was provided by a grant from the King Conservation District through the WRIA 9 Watershed Forum. The Nearshore Partnership appreciates the ongoing support from WRIA 9. Washington Department of Fish and Wildlife staff provided design and publication services for this document. Citation: Fung, J. and C. Davis, 2005. Historic Characterization of WRIA 9 Shoreline Landforms. Puget Sound Nearshore Partnership Report No. 2005-01. Published by Washington Department of Fish and Wildlife, Olympia, Washington. Available at http://pugetsoundnearshore.org. Cover: The south beach of West Point in Discovery Park (Seattle, Washington). West Point is a barrier beach that enclosed a tidal lagoon and salt marsh prior to its filling in the 1940s. Riprap and an intertidal sewage lagoon were removed from this beach in 1980 and a natural shoreline restored using beach nourishment and dune revegetation. (Photo: Hugh Shipman, Washington Department of Ecology, May 2004).

II PUGET SOUND NEARSHORE PARTNERSHIP Technical Report 2005-01
Contents
Overview....................................................................................... 1
Objectives ..................................................................................... 1
Background ................................................................................... 1
Data Sources ................................................................................. 2
Methodology.................................................................................. 2 Bluff-backed Beaches ..................................................................................5 Barrier Beaches ..........................................................................................6 Open Coastal Inlets.....................................................................................6 Barrier Estuaries .........................................................................................7 Barrier Lagoons ..........................................................................................8 Closed Lagoon & Marsh...............................................................................8 River-dominated Estuarine Delta ..................................................................9 Wave-dominated Delta ..............................................................................10 Fan-type Delta..........................................................................................10 Tidally-dominated delta .............................................................................10 Plunging Rocky Shores ..............................................................................10 Rocky Ramp/Platform................................................................................11 Pocket Beaches ........................................................................................11
Results and Discussion ..................................................................12
Recommendations.........................................................................16
References ...................................................................................17
Appendix A ...................................................................................18
Appendix B ...................................................................................19

II PUGET SOUND NEARSHORE PARTNERSHIP Technical Report 2005-01

Historic Characterization of WRIA 9 Shoreline Landforms 1
Overview This report is the first in a series of “Conditions Analysis” papers designed to define the problems in ecosystem processes within Puget Sound’s nearshore area, and ultimately, to assist in formulating a Puget Sound-wide restoration plan. This report describes a methodology used to characterize the landforms of the WIRA 9 shoreline, prior to European settlement of the region, and will be involved in a comparison of historic and current nearshore conditions in order to understand changes in the physical conditions of nearshore ecosystem processes. Using the nearshore typology developed by the Puget Sound Nearshore Ecosystem Project Science Team (Shipman et al. 2005) and the historic physical conditions of the nearshore developed and digitized by the River History Group (methodology detailed in Collins et al. 2003), we describe and relate historic shoreforms to underlying geomorphic processes.
Objectives 1. Apply a nearshore typology developed by
the Puget Sound Nearshore Ecosystem Restoration Project (PSNERP) to the historic shoreline data for the Water Resource Inventory Area 9 (WRIA 9) to characterize historic geomorphology and develop a coarse level historic conditions map for WRIA 9.
2. Develop and describe a methodology for attributing historic shoreline data to the geomorphic classes identified in the nearshore typology (Shipman et al. 2005) to complete a coarse level assessment of historic nearshore conditions in WRIA 9 (including Vashon and Maury Islands).
3. Describe and report the historic nearshore landforms within the WRIA 9 project area.
4. Recommend steps towards “scaling up” a Puget Sound-wide historic condition assessment analysis.
Background The nearshore typology developed in Shipman et al. (2005) is a description of various nearshore physical shoreforms or features that result from geomorphic processes that shape and maintain the modern shoreline. The physical processes that act on Puget Sound’s shoreline to create various erosional, transport, and depositional features, interact with ongoing biological processes at a variety of scales resulting in diverse habitat types in the nearshore area. This typology follows a logical framework that describes the majority of shoreline types found in Puget Sound in a hierarchical and scaleable format that allows nesting of smaller features, as well as groupings of similar shoreforms into larger management units (Shipman et al. 2005). For this effort, we used the ‘shore types’ described in the nearshore typology (see Appendix A) to apply to the historic shoreline data. The University of Washington River History Group (RHG) has developed and digitized the historic features of Puget Sound’s major river deltas and the conditions of the nearshore shoreline. Using historic T-sheets and H-sheets, cartographic symbology, and attributes from field notes, the RHG digitized and made available the provisional historic datasets for use by PSNERP. The datasets include georectified scanned images of the original T-sheets for all saltwater shorelines in WRIA 9, and the digitized shoreline data off the T-sheets in three shapefile formats: polygons, lines, and points. This data is intended to be a faithful representation of the historic mapped conditions. Typically for each cross section of the historic shoreline there are at least two types polygons: one indicating intertidal, intertidal substrate or occasionally intertidal vegetation; the second polygon denotes upland conditions immediately adjacent to the intertidal. This second polygon may indicate land use (e.g., forest type, marsh, orchard, or urban), and/or the presence of a bluff. Examples of typical ‘lines’ digitized off the T-sheets for each cross section of shoreline include Mean Lower Low Water elevation, shoreline/coastline, base of bluff, top of bluff, and fence lines. Other line features seem to be much more sporadic. Point features were uncommon along individual stretches of WRIA 9 shoreline and indicated occasional observations such as rock, pilings, or buoys.

2 PUGET SOUND NEARSHORE PARTNERSHIP Technical Report 2005-01
Data Sources In addition to the RHG historic shoreline datasets, we identified and compiled key auxiliary GIS datasets that characterize nearshore habitats of WRIA 9 to assist in the geomorphic typing of historic shoreline conditions. These include: • WDNR’s ShoreZone Inventory: this
inventory characterizes the geomorphic and biological resources of the intertidal and nearshore habitats of the entire Puget Sound coast. Aerial imagery was taken at low tide providing a “snap-shot” in time of habitat conditions. This dataset was used to map substrate, subtidal and intertidal vegetation, shoreline modifications, and provide some proxies for wave energy, and basic sources of sediment and direction of transport. The basic mapping units are Shore Zone segments of homogeneous shoreline, with descriptions of cross–shore units included. Data is available through WDNR (http://www2.wadnr.gov/nearshore/research/).
• Net Shore-Drift: this dataset depicts the net longshore drift of sediment between two points representing a closed or nearly closed system in areas throughout Puget Sound. The Washington Department of Ecology and Western Washington University cooperated in a series of net shore-drift studies of the Washington marine shoreline, including Schwartz’s report for the Pacific Ocean and Strait of Juan de Fuca Region; the Northern Bays and Straits Region; Jim Johannessen’s report for San Juan, parts of Jefferson, Island, and Snohomish Counties. Data is available through WDOE (http://www.ecy.wa.gov/programs/sea/sma/data/maps_table.htm).
• Slope Stability: these digital maps were originally published as hard copy maps in the Coastal Zone Atlas of Washington between 1978 and 1980. These maps indicate the relative stability of coastal slopes as interpreted by geologists based on aerial photographs, geological mapping, topography, and field observations. This mapping represents conditions observed in the early and mid-1970s. Data is available through WDOE
(http://www.ecy.wa.gov/programs/sea/sma/data/maps_table.htm).
• LIDAR: is a relatively new technology that employs an airborne scanning laser rangefinder to produce accurate topographic surveys in great detail. The data can be used to determine the height and density of the overlying vegetation, and to characterize the location, shape, and height of buildings and other manmade structures. We used the bare-earth digital elevation model for the best estimate of topography at these settings: Azimuth: 315˚ Altitude: 45˚ Z-factor: 1 ft. Cell Size: 3 ft. Data is available through the Puget Sound Lidar Consortium (http://rocky2.ess.washington.edu/data/raster/lidar/index.htm) and King County GIS Center (http://www.metrokc.gov/gis/sdc/raster/elevation/).
Methodology The shoreline linework from the RHG line dataset was selected as the basic data structure used for this assessment. The RHG dataset was determined to be reliable at the 1:6000 scale to apply the ‘shore type’ class described in the Shipman nearshore typology. The final GIS dataset is the historic shoreline segmented according to the nearshore ‘shore types’. The principal challenge underlying the first two objectives involved developing a cross–walk strategy to translate the structural classification used by the RHG into the more Process-based typology proposed by Shipman et at. (2005). After a series of discussions with the Nearshore Science Team, we decided on a rules-based, increasing levels of evidence approach. The datasets mentioned above were divided into two categories:

This approach not only standardizes the assessment methodology, it also allows us to assign a confidence level attribute within the final GIS dataset. The confidence levels capture any uncertainties or discrepancies encountered when attributing historic shoreline data to the ‘shore type’ class, as well as a validation of our rule sets (see below). Confidence levels are defined as:
Primary datasets: 1. The RHG line and polygon datasets
representing historic US Coast & Geodetic Survey topographic sheets (1850 – 1890)
2. Net Shore-Drift cell dataset
Secondary datasets: 1. Lidar data 2. ShoreZone cross-shore attributes (used
primarily for presence of bedrock)
High – all primary dataset’s rules are met and most secondary datasets concur with rules. 3. Slope Stability (used as a general indication
of slope/bluff)
Medium – most primary dataset’s rules are met and some secondary datasets concur with rules. However, a presence of a feature such as stream mouth or intermittent stream, indicated by the primary datasets may indicate that there may be finer geomorphic or biological processes acting on that shoreline segment that is not captured by the existing data and may be revisited by the members of the Nearshore Science Team to reassess at a later date (see Figure 1). The presence of stream mouths are captured and attributed to the shoreline segment it associates with.
4. WA DOE Oblique Shoreline Photos
The primary datasets represent the best level of evidence to characterize the historic shoreline with the nearshore typology: the RHG data were derived from actual historic information and the Net Shore-Drift cell data characterize the concept of longshore drift. Where drift is mapped, whether it is unidirectional, divergent, or convergent, it implies the presence of either a bluff-backed beach or a barrier beach. There is an underlying assumption that the default shoreline is assumed to be a bluff-backed beach unless there are features or evidence that say otherwise. Together, the two primary datasets embody the best representation of historic and durable features that allow us to deduce processes; thus, we placed more confidence when using these datasets to characterize the historic shoreline with the nearshore typology. The secondary datasets characterize the modern shoreline. They convey a lesser degree of support in attributing the historic data to the nearshore typology and the rules associated with these datasets should only be used in support of the primary datasets.
Low – we tried to minimize the number of low confident ratings and these segments occur when there is contradictory evidence. In some cases there is insufficient evidence from the RHG dataset to tell us more definitively (see Figure 2). Red flags can include ShoreZone’s cross shore attribute that describe finer scale features such as the presence of a delta or lagoon, but the RHG data did not capture it, or in some cases, contradict ShoreZone (Figure 3).
No Appreciable
Drift
No Appreciable
Drift
b
RHG Bluff Polygon
a
RHG Bluff Polygon
Figure 1. In characterizing the bluff-backed beach segment within the circle above, the RHG data indicates a bluff polygon from the t-sheet; however, the there is no drift according to the drift dataset.
Historic Characterization of WRIA 9 Shoreline Landforms 3
ba
4 PUGET SOUND NEARSHORE PARTNERSHIP Technical Report 2005-01
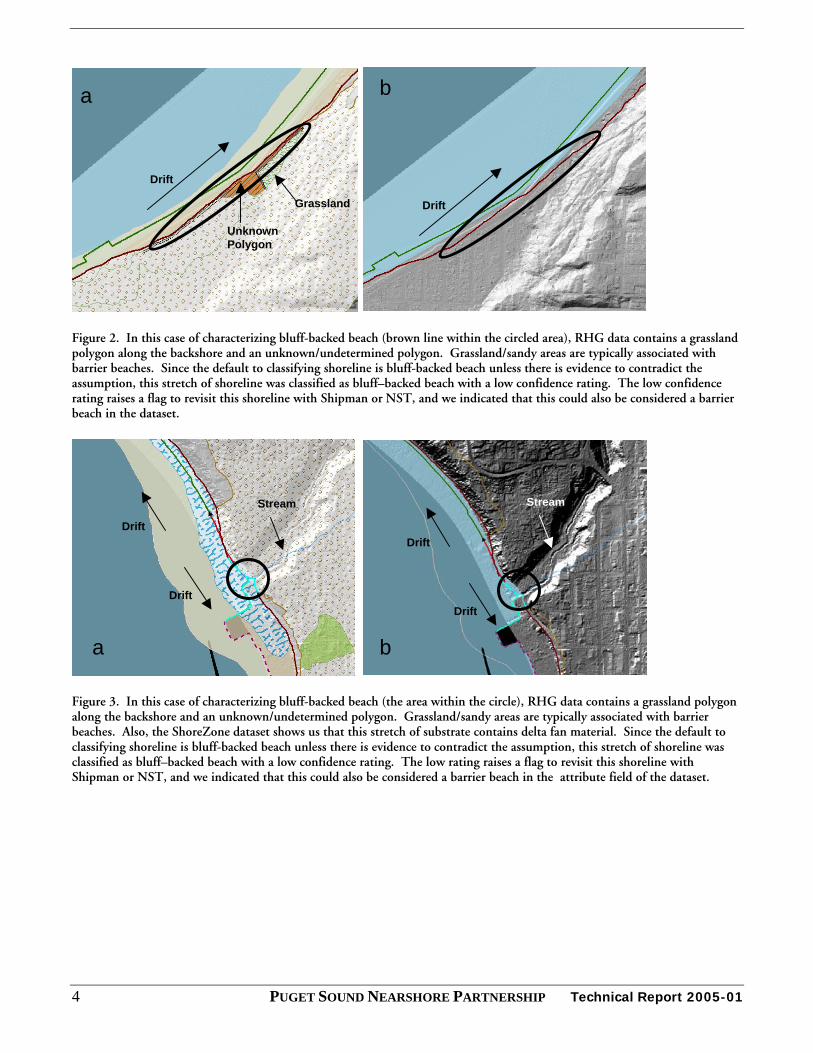
Figure 2. In this case of characterizing bluff-backed beach (brown line within the circled area), RHG data contains a grassland polygon along the backshore and an unknown/undetermined polygon. Grassland/sandy areas are typically associated with barrier beaches. Since the default to classifying shoreline is bluff-backed beach unless there is evidence to contradict the assumption, this stretch of shoreline was classified as bluff–backed beach with a low confidence rating. The low confidence rating raises a flag to revisit this shoreline with Shipman or NST, and we indicated that this could also be considered a barrier beach in the dataset.
Figure 3. In this case of characterizing bluff-backed beach (the area within the circle), RHG data contains a grassland polygon along the backshore and an unknown/undetermined polygon. Grassland/sandy areas are typically associated with barrier beaches. Also, the ShoreZone dataset shows us that this stretch of substrate contains delta fan material. Since the default to classifying shoreline is bluff-backed beach unless there is evidence to contradict the assumption, this stretch of shoreline was classified as bluff–backed beach with a low confidence rating. The low rating raises a flag to revisit this shoreline with Shipman or NST, and we indicated that this could also be considered a barrier beach in the attribute field of the dataset.
Grassland
UnknownPolygon
Drift
Drift
Drift
StreamStream
Drift
DriftDrift
a b

In addition to the confidence level attribute, some features like stream, stream mouth, salt and wooded marshes, channel, kelp bed, water body from the RHG datasets were captured in attribute fields of the resulting dataset. Along with the confidence levels, these notes add important clues that will aid in validating or reclassifying the ‘shore type’ assigned to the historic shoreline segments, as well as describe features for the change analysis. The following are the rules used in assigning the ‘shore type’ classes to the shoreline segments, using the datasets and the shore type descriptions from Shipman et al. 2005. I. Bluff-backed Beaches (see Figure 4 for an example) Bluff-backed beaches occur where wave action has resulted in erosion of an elevated upland area. Erosion of the bluff, resulting in mass-wasting of the slope, and the deposition of the eroded
material is typical. The removal of the material by wave action results in bluff-backed beaches. Primary: a) Drift cell data: presence of any drift
(unidirectional or divergent). If mapped convergent, the confidence might drop, depending on presence of other features like marshes, lagoons, or stream mouths.
b) RHG line and polygon data: presence of bluff or bank
c) This is the default shore type if drift is mapped, unless other features/dataset indicates otherwise.
Secondary: c) Lidar data: appearance of elevation at
nearshore and/or indication of hillslope mass-wasting and erosion into upland surface
d) Slope Stability data: presence of ‘unstable slopes’, ‘unstable old slide’ or ‘unstable recent slide areas’.
Historic Characterization of WRIA 9 Shoreline Landforms 5
Figure 4. The brown line assigned along the shoreline indicates bluff-backed beach. Drift is mapped along the shoreline (both divergent and unidirectional). The grey polygon in panel (a) is data indicating bluff (RHG dataset). In panel (b), Lidar indicates hillslope mass-wasting, and the slope stability data indicates unstable slope (yellow, pink, and brown polygons).
a b

II. Barrier Beaches (see Figure 5 for an example) These shoreforms result from accumulation of sediment along the shore as a consequence longshore wave action. A barrier beach is essentially a ridge of sediment extending a small distance above high tide. The prevalent characteristic of this feature is the presence of drift, and an accumulation of sand or gravel at the intertidal. Primary: a) Drift cell data: presence of any drift
(unidirectional or divergent, and particularly convergent zones)
b) RHG line data: at points and changes of shoreline orientation; cuspate foreland geometry
c) RHG polygon data: accumulation of sand or gravel at the intertidal
d) RHG polygon data: presence of any lagoon, pond, tidal embayment, or other low-lying wetland/aquatic feature in backshore area usually indicates a barrier beach along the shoreline with either an open or closed marsh/estuary/lagoon in the backshore
Secondary: e) Lidar data: presence of low lying ‘platform’(~1m
above shoreline)
Figure 5. The yellow line assigned along the shoreline indicates barrier beach. Drift is mapped along the shoreline (unidirectional). RHG data shows presence of a wooded marsh with a stream in panel (a), and Lidar indicates a low-lying platform. This stretch of shoreline is a barrier beach with a barrier estuary in the backshore. III. Open Coastal Inlets (see Figure 6 for an example) These shoreforms are characterized with limited wave action and are usually associated with valleys in the terrestrial landscape, and can be associated with a coastal stream or river mouth. Open coastal inlets are distinguished by the lack of a barrier and no drift in the inlet. Primary:
6 PUGET SOUND NEARSHORE PARTNERSHIP Technical Report 2005-01
a) Drift cell data: presence of No Appreciable Drift (NAD), or lack of drift
b) RHG line data: the shoreline depicts basin-like geometry, i.e., indention landward (no beaches and few waves)
c) These are distinguished from other embayments (e.g., barrier estuary, open lagoon) is the lack of enclosure by a barrier
d) RHG line and polygon data: may be associated with stream mouth(s).
Secondary: d) Lidar data: basin-like depression, associated
with stream or river beds
Bluff
Wooded Marsh
Stream
Drift
a b

Figure 6. The light purple line assigned along the shoreline indicates an open coastal inlet. Drift is mapped only into a portion of the inlet, where it turn into no drift (dashed purple line). There is no barrier enclosing the inlet. This is Judd Creek, and the only instance of an open coastal inlet in WRIA 9. IV. Barrier Estuaries (see Figure 7 for an example)
These features consist of marshes and lagoons behind a barrier and with significant freshwater input. These may include wetlands formed on cuspate forelands (a triangular, accretionary shoreform), wetlands within an embayment, or wetlands along an unembayed coastline.
Primary:
Historic Characterization of WRIA 9 Shoreline Landforms 7
a) Drift cell data: presence drift is associated with the barrier beach on the seaward side of the estuary, but no drift within the barrier estuary
b) RHG line data: the shoreline indicates spit or barrier features across the seaward side of the
feature, that may or may not be open to tidal exchange
c) RHG line and polygon data: presence of any lagoon, pond, tidal embayment, or other low-lying wetland/aquatic feature with a barrier beach along the seaward side.
d) RHG line data: presence of stream(s) flowing into wetland feature; freshwater input into the wetland
e) RHG line data: the shoreline depicts basin-like geometry, i.e., indention landward
Secondary: f) Lidar data: basin-like depression, associated
with stream or river beds
Figure 7. The green line around the wooded marsh is the barrier estuary. Drift is mapped along the shore of the barrier beach (yellow line). A stream flows into the marsh. The combination of the barrier beach and a marsh with a stream indicate presence of barrier estuary.
a b
a b
Drift Drift
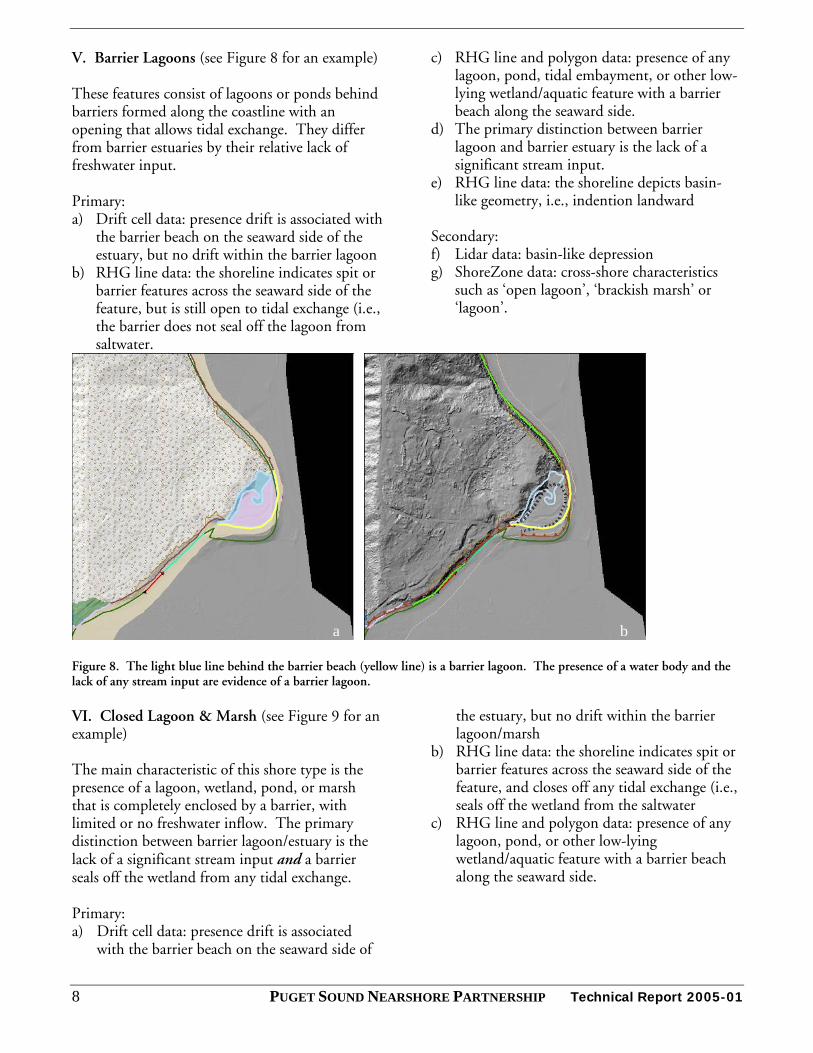
V. Barrier Lagoons (see Figure 8 for an example) These features consist of lagoons or ponds behind barriers formed along the coastline with an opening that allows tidal exchange. They differ from barrier estuaries by their relative lack of freshwater input. Primary: a) Drift cell data: presence drift is associated with
the barrier beach on the seaward side of the estuary, but no drift within the barrier lagoon
b) RHG line data: the shoreline indicates spit or barrier features across the seaward side of the feature, but is still open to tidal exchange (i.e., the barrier does not seal off the lagoon from saltwater.
c) RHG line and polygon data: presence of any lagoon, pond, tidal embayment, or other low-lying wetland/aquatic feature with a barrier beach along the seaward side.
d) The primary distinction between barrier lagoon and barrier estuary is the lack of a significant stream input.
e) RHG line data: the shoreline depicts basin-like geometry, i.e., indention landward
Secondary: f) Lidar data: basin-like depression g) ShoreZone data: cross-shore characteristics
such as ‘open lagoon’, ‘brackish marsh’ or ‘lagoon’.
Figure 8. The light blue line behind the barrier beach (yellow line) is a barrier lagoon. The presence of a water body and the lack of any stream input are evidence of a barrier lagoon. VI. Closed Lagoon & Marsh (see Figure 9 for an example) The main characteristic of this shore type is the presence of a lagoon, wetland, pond, or marsh that is completely enclosed by a barrier, with limited or no freshwater inflow. The primary distinction between barrier lagoon/estuary is the lack of a significant stream input and a barrier seals off the wetland from any tidal exchange. Primary:
8 PUGET SOUND NEARSHORE PARTNERSHIP Technical Report 2005-01
a) Drift cell data: presence drift is associated with the barrier beach on the seaward side of
the estuary, but no drift within the barrier lagoon/marsh
b) RHG line data: the shoreline indicates spit or barrier features across the seaward side of the feature, and closes off any tidal exchange (i.e., seals off the wetland from the saltwater
c) RHG line and polygon data: presence of any lagoon, pond, or other low-lying wetland/aquatic feature with a barrier beach along the seaward side.
a b

Secondary: d) Lidar data: basin-like depression
e) ShoreZone data: cross-shore characteristics such as ‘open lagoon’, ‘brackish marsh’ or ‘lagoon’.
Figure 9. The green and black line behind the barrier beach (yellow line) is a closed barrier lagoon/marsh. The presence of salt marsh (green polygon) and wooded marsh (brown polygon) as well as the lack of any stream input are evidence of a barrier lagoon/marsh. VII. River-dominated Estuarine Delta (see Figure 10 for an example)
These systems are typically found in the Puget Lowlands, which include the estuaries of Lumni, Nooksack, Snohomish, Samish, Skagit, Stilliguamish, Duwamish, Puyallup, Nisqually, and Skokomish rivers. These rivers typically have extensive estuarine wetlands with well-developed tidal and distibutary channels. Extensive freshwater marshes and freshwater tidal channels are often associated wit these delta systems.
Primary: a) Drift cell data: presence of No Appreciable
Drift (NAD) b) RHG polygon and line data: indicate large
river channel features c) RHG polygon data: associated with pro-delta
flat, channel, marsh features d) RHG line data: shoreline indicates
embayment geometry Secondary: e) Lidar data: basin-like depression, associated
with stream or river beds
Figure 10. The blue lines indicate a river-dominated estuarine delta, fed by the Duwamish River.
9 Historic Characterization of WRIA 9 Shoreline Landforms

VIII. Wave-dominated Delta This shore type was not observed along the project’s shoreline. The Elwha and Dungeness rivers are examples of wave-dominated deltas. The high-wave energy environment of these rivers
of significant saltmarsh.
he he
s have relatively eep fan-deltas, with steep valley walls, and are
les of these deltas can be und in South Puget Sound bays, where finger
inlets are common.
ward of the shoreline, and the oblique photo on the right confirms exposed bedrock with no subtidal/intertidal latform.
inhibits development IX. Fan-type Delta This shore type was not observed along tproject’s shoreline. The rivers that drain into tHood Canal, like the Hamma Hamma, Duckabush, and Doosewallipstexamples of fan-type deltas. X. Tidally-dominated delta This shore type was not observed along the project’s shoreline. Tide-dominated deltas generally show wide lobes of land perpendicular to the coast. Exampfo
XI. Plunging Rocky Shores (see Figure 11 for an example) This shore type was not observed along WRIA 9 shoreline. However, we found instances of this shore type near Deception Pass in WRIA 5, where resistant bedrock is exposed along the shoreline. Plunging rocky shorelines are those with no significant intertidal or subtidal platform. Primary: a) Drift cell data: presence of No Appreciable
Drift (NAD), no drift b) RHG polygon data: no intertidal polygon
Secondary: c) ShoreZone data: cross-shore characteristics
such as ‘bedrock’ at the A, B, or C profiles d) WA DOE Oblique Photo: for confirmation
of exposed bedrock and no intertidal/subtidal platform
Figure 11. The area within the circle is a Plunging Rocky Shore. Note the lack of drift (dashed purple line), no intertidal polygon seap
10 PUGET SOUND NEARSHORE PARTNERSHIP Technical Report 2005-01

XII. Rocky Ramp/Platform (see Figure 12 for an example) There are 2 instances of rocky ramp and platform shore type in WRIA 9, and many more around Deception Pass in WRIA 5. Rocky ramp/platform is composed of exposed bedrock, but with low gradient intertidal/subtidal surfaces formed by erosion. Drift is not usually present. Primary: a) Drift cell data: presence of No Appreciable
Drift (NAD), no drift
b) RHG polygon data: presence of an intertidal polygon
Secondary: c) ShoreZone data: cross-shore characteristics
such as ‘bedrock’ at the A, B, or C profiles d) WA DOE Oblique Photo: for confirmation
of exposed bedrock and with intertidal/subtidal platform or surface (beach)
Figure 12. The area within the circle is an example Rocky Ramp/Platform. Note the presence of an intertidal polygon (beige zone along the shoreline) and the oblique photo on the right confirms exposed bedrock with a subtidal/intertidal platform. XIII. Pocket Beaches (see Figure 13 for an example) This shore type was not observed along the WRIA 9 shoreline. However, we found an instance of this shore type in WRIA 6, around Deception Pass. Pocket beaches are isolated from longer reaches of shoreline by rocky headlands or promontories that restrict longshore sediment transport. Primary: a) Drift cell data: presence of No Appreciable
Drift (NAD), no drift b) RHG polygon data: presence of an intertidal
polygon c) ShoreZone data: presence of bedrock on both
side of a beach
Secondary
d) WA DOE Oblique Photo: for confirmation of exposed bedrock on both sides of an isolated sandy beach
e) Shipman confirmation: flag these areas for Shipman to confirm if unsure
Historic Characterization of WRIA 9 Shoreline Landforms 11
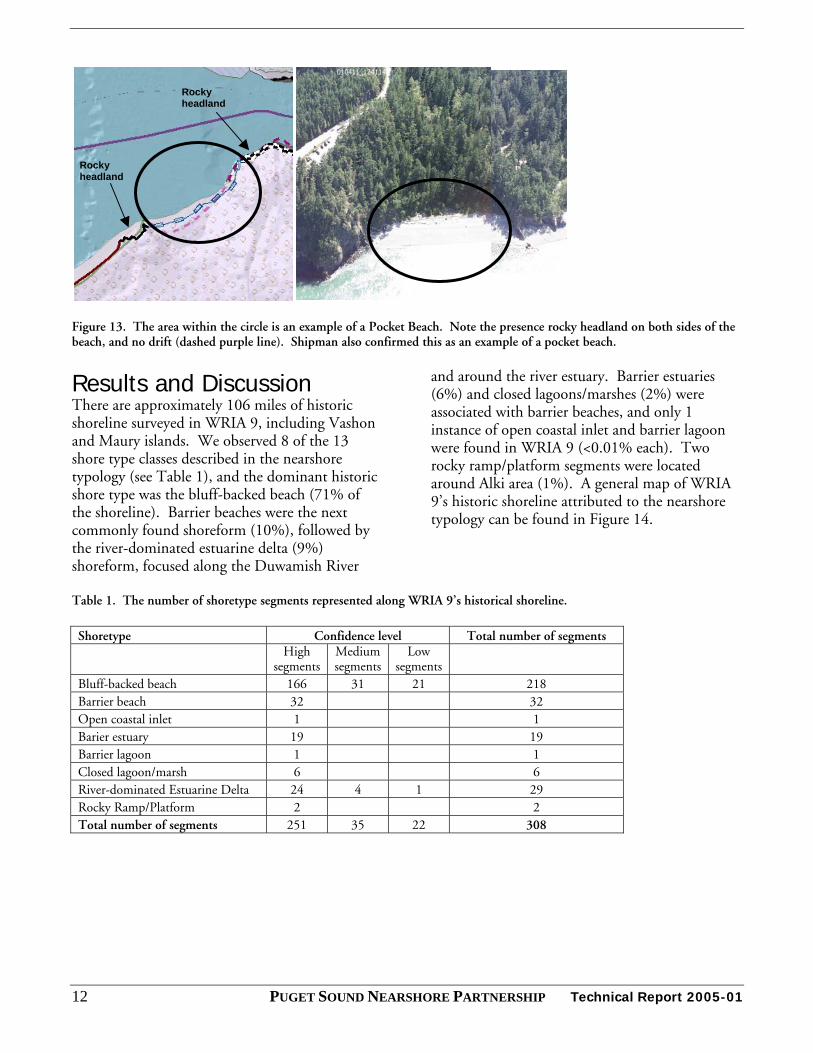
Figure 13. The area within the circle is an example of a Pocket Beach. Note the presence rocky headland on both sides of the beach, and no drift (dashed purple line). Shipman also confirmed this as an example of a pocket beach.
Results and Discussion There are approximately 106 miles of historic shoreline surveyed in WRIA 9, including Vashon and Maury islands. We observed 8 of the 13 shore type classes described in the nearshore typology (see Table 1), and the dominant historic shore type was the bluff-backed beach (71% of the shoreline). Barrier beaches were the next commonly found shoreform (10%), followed by the river-dominated estuarine delta (9%) shoreform, focused along the Duwamish River
and around the river estuary. Barrier estuaries (6%) and closed lagoons/marshes (2%) were associated with barrier beaches, and only 1 instance of open coastal inlet and barrier lagoon were found in WRIA 9 (<0.01% each). Two rocky ramp/platform segments were located around Alki area (1%). A general map of WRIA 9’s historic shoreline attributed to the nearshore typology can be found in Figure 14.
Table 1. The number of shoretype segments represented along WRIA 9’s historical shoreline.
12 PUGET SOUND NEARSHORE PARTNERSHIP Technical Report 2005-01
Shoretype Confidence level Total number of segments
High
segments Medium segments
Low segments
Bluff-backed beach 166 31 21 218 Barrier beach 32 32 Open coastal inlet 1 1 Barier estuary 19 19 Barrier lagoon 1 1 Closed lagoon/marsh 6 6 River-dominated Estuarine Delta 24 4 1 29 Rocky Ramp/Platform 2 2 Total number of segments 251 35 22 308
Rocky headland
Rocky headland

Historic Characterization of WRIA 9 Shoreline Landforms 13
Two additional shore types were found in WRIA 6. We extended our work to WRIA 6 and 5 to define rules for plunging rocky shore and pocket beach shore forms. Working in WRIA 5 and 6 also provided additional samples for the 8 shore forms that have been validated in WRIA 9 to increase the confidence in analyzing those types. The remaining undefined shoretypes (wave-dominated deltas, fan-type deltas, and tide-dominated deltas) will be defined as we move to other parts of Puget Sound where specific and unique geology, river behavior, and wave action processes occur as described in the methods section. We were highly confident that the rules and datasets accurately typed the historic shoreline to the nearshore typology 81% of the time, while we were less certain 11 % of the time (medium confidence), and 7 % uncertain (low confidence). Table 1 displays the number of high, medium and low confidence segments within each shoretype. Bluff-backed Beaches The prevalence of coastal bluffs on Puget Sound, especially on WRIA 9 shoreline, is generally acknowledged (Shipman pers. comm.), and we were encouraged to find bluff-backed beaches as the dominant shore type (218 out of 308 segments). Of the 218 segments, 166 segments were typed at a high level of confidence. It is important to note that a majority of Puget Sound’s coastline is also composed of many small watersheds, each with a stream that emerges on the shoreline, and WRIA 9 is no exception. For many of these bluff-backed beaches, stream mouths were noted. The mouth of these streams may take many forms, depending on the discharge, sediment yield, topography, and geomorphology where they reach the intertidal (Shipman et al. 2005). Because streams can occur at any coastal shore type, they may or may not influence the overall characteristic of the shoreline. The spatial resolution of the T-sheets is limited, which reduces the ability to identify smaller coastal features like small deltas, stream mouth estuaries, and barriers. Therefore, lower levels of confidence were usually assigned to shoreline
segments where Lidar data exhibited presence of riverine basins or low-lying depressions, and/or RHG data indicated presence of one or more stream mouth despite the presence of a bluff or bank, also denoted by the RHG data and Lidar data (14% of the segments were assigned medium confidence and 10% of the segments were assigned low confidence). We found that the decision to assign the medium versus low confidence level relied on whether Lidar data indicated elevated topography and if the Slope Stability data indicated unstable slopes. Stable slopes and low-lying topography shoreline segments were assigned the low confidence levels at these shoreline segments. We found the cross-shore attribute from ShoreZone data did not consistently correlate with the presence of bluff or bank from the RHG data, and was not a reliable source to characterize the shoreline with this shore type. There are only 52 segments assigned with a medium or low confidence rating and we recommend that members of the Nearshore Science Team (NST) check these segments.

Figure 14. Map of WRIA 9 historic shoreline attributed to the nearshore typology.
14 PUGET SOUND NEARSHORE PARTNERSHIP Technical Report 2005-01

Historic Characterization of WRIA 9 Shoreline Landforms 15
Barrier Beaches Only 32 segments out of 308 found in WRIA 9 were typed as barrier beaches, and we were confident that the rules and datasets correctly classified the shoreline to this shore type (100% high confidence). Some of these beaches were found on cuspate forelands (11 segments), landforms that result from sediment accumulating along the shore from longshore sediment transport. In other cases, a combination of features such as the presence of stream mouths and channel and marshes and the Lidar data indicating a depression in elevation (indicators of delta or embayment shore types) was also found along with the presence of longshore drift. This scenario led to assemblages of a barrier beach seaward of barrier estuaries, barrier lagoons, and closed lagoons/marshes, and constituted the majority of this shoreform (21 segments). Open Coastal Inlets Only one segment was typed as an open coastal inlet. This was found at Judd Creek, near Quartermaster Harbor. This segment complied with the rules that were developed and confirmed by members of the NST. Barrier Estuaries Nineteen segments of the shoreline were assigned as barrier estuary and all were rated at a high confidence level. This shoreform were correlated with barrier beaches, and a few of them were also found on cuspate forelands. Barrier Lagoons Only one segment was typed as barrier lagoon, at Heyer Point, near Ellisport on Vashon Island. Closed Lagoon/Marsh Six closed lagoons/marshes were found in WRIA 9, and they were all associated with barrier beaches. A few of this shoreform were also found on cuspate forelands.
River-dominated Estuarine Deltas This shore type was assigned to the shoreline segments at the Duwamish Estuary, and to the river up to the confluence of the White River, the original extent of tidal influence (29 segments). Segments assigned with the medium confidence levels were found along the stretch of shoreline between Pier 55 and Pier 57 in Elliot Bay. This area was found to be already modified by the RHG data, as an urban area, and the Drift dataset indicated no appreciable drift. We were fairly certain that this stretch was probably part of the river-dominated estuarine delta shore type, but wanted to note it for the NST members. The segments with the low confidence levels were found at the northwestern portion of the Duwamish Estuary, between the Duwamish Head and bluffs along the shoreline past Seacrest Marina. Although the shoreline indicated embayment geometry, with no appreciable drift, and is a part of the Duwamish delta system, the steep and unstable bluffs along that stretch of shoreline led us to assign the low confidence level to be inspected by members of the NST. Rocky Ramp/Platform Two segments were found to be rocky ramp/platform shore types. These are located at and near Alki Point. This assignment confirms the anecdotal knowledge held by most geologists and was checked by the NST sub-committee previously. Plunging Rocky Shore This shoreform was not found in WRIA 9; however, several instances were located in WRIA 6, around Deception Pass. Rules were developed for this shoretype and should be tested in the San Juan area. Pocket Beach This shoreform was not found in WRIA 9, but one example was found in WRIA 6, near the Deception Pass Bridge. Although rules were defined, we recommend testing these rules in other WRIAs.

16 PUGET SOUND NEARSHORE PARTNERSHIP Technical Report 2005-01
Recommendations This project proved to be a collaborative process, and is a work in progress. Although there was a hope that an efficient and automated method could be applied, the translation of structural features used by the RHG into the more process-based nearshore typology relied on the experiences and pattern recognition of expert users. Although we developed and applied the increasing levels of evidence/rules-based methodology systematically, there was still a degree of subjectivity found in the process, especially when deciding between assigning a medium or low confidence level. We suspect that with subsequent assessments in new WRIAs by trained expert users, the efficiency and quality of the translation of the historic shoreline to the nearshore typology will increase. We found 8% of WRIA 9 historic shoreline was assigned to a ‘shore type’ at a low confidence level and 12% at a medium confidence. We recommend that the NST find a way to check and examine these shoreline segments to validate or change the attribution with the aid of historical field notes, photos, or literature. A goal of the PSNERP General Investigation study is a comparison of historic and current conditions to understand changes in geomorphology and other indicators of nearshore ecosystem processes. This historic conditions assessment is the first step in a pilot study to understanding how anthropogenic factors have
changed nearshore processes. This process will eventually lead to better informed decisions about Sound–wide restoration needs. Because we found only 8 of the 13 shore types on WRIA 9, we applied this methodology to WRIA 6 and 5 and defined 2 additional shore types. The remaining 3 shoreforms are large deltas that are found in specific locations around Puget Sound. The following points are general observations to keep in mind as we scale up this methodology to the rest of Puget Sound: 1. The scale of the T-sheets limits resolution of
many small, but ecologically and geomorphologically interesting features. These may include stream mouths and associated estuaries and back-barrier wetland complexes.
2. This methodology seeks to map geomorphology, but does so using limited geomorhological tools (GIS data, knowledge, and interpretive techniques).
3. Defining rules for shore types not represented in WRIA 9, 6, and 5 may prove challenging and can only be resolved once we approach those areas.
In conclusion, we can apply this methodology throughout the rest of Puget Sound, and recommend setting a NST quality assurance and control protocol in place as the next step towards assessing all of Puget Sound’s historic shoreline.

Historic Characterization of WRIA 9 Shoreline Landforms 17
References Collins, B.D., D.R. Montgomery, & A.J. Sheikh. 2003. Reconstructing the historical riverine landscape of
the Puget Lowland. In: D.R. Montgomery, S.M. Bolton, D.B. Booth, & L.Wall, eds. Restoration of Puget Sound Rivers, University of Washington Press, Seattle, WA. pp. 79-128.
Brian D. Colllins and Amir J. Sheikh, Puget Sound River History Project, Department of Earth and Space
Sciences, University of Washington, Box 351310, Seattle, WA 98195. Project completion report to: Washington Department of Natural Resources, Aquatic Resources Division, Olympia, WA Olympia, WA 98504-7027. June 30, 2005
Shipman, H., M. Dethier, C. Simenstad, T. Mumford, & F. Goetz. 2005. Developing a geomorphic
typology for the Puget Sound shoreline: discussion paper (Draft, in prep., PSNERP Nearshore Science Team Workgroup, 2005.

18 PUGET SOUND NEARSHORE PARTNERSHIP Technical Report 2005-01
Appendix A The nearshore typology units used to populate the shore type attribute field of the WRIA 9 historic conditions dataset.
Beaches Shore type • Bluff-backed beaches (A) • Barrier beaches (B)
Embayments
• Open coastal inlets (C) • Barrier estuaries (D) • Barrier lagoons (E) • Closed lagoons & marshes (F)
Deltas
• River-dominated estuarine deltas (G) • Wave-dominated deltas (H) • Fan-type deltas (I) • Tidally-dominated deltas (J)
Rocky Shores
• Plunging (K) • Ramps/platforms (L) • Pocket beaches (M)

Historic Characterization of WRIA 9 Shoreline Landforms 19
Appendix B
Data Dictionary Entity_and_Attribute_Information:
Detailed_Description: Entity_Type: Entity_Type_Label: WRIA9_Historic_Shoretype Attribute: Attribute_Label: LULC Attribute_Definition: Land use/land cover Attribute_Definition_Source: Polygons that contain a mixture of more then one land use/land cover are attributed with each of the categories separated by a '/' (e.g. GRA/FOR). Attribute_Domain_Values: Enumerated_Domain: Enumerated_Domain_Value: CH/EEM Enumerated_Domain_Value_Definition: Estuarine emergent wetland channel Enumerated_Domain: Enumerated_Domain_Value: CH/ESS Enumerated_Domain_Value_Definition: Estuarine scrub-shrub wetland Enumerated_Domain: Enumerated_Domain_Value: CH/FR Enumerated_Domain_Value_Definition: Fresh water channel Enumerated_Domain: Enumerated_Domain_Value: CH/TF Enumerated_Domain_Value_Definition: Tidal-fresh channel Enumerated_Domain: Enumerated_Domain_Value: EEM_LOW_OUTER_EDGE Enumerated_Domain_Value_Definition: Outer edge of submerged estuarine emergent wetland Enumerated_Domain: Enumerated_Domain_Value: LOW_WATER Enumerated_Domain_Value_Definition: The t-sheet topographer's estimate of the approximate line of mean low water (p. 185, Shalowitz, 1962). Low water was defined differently on T-sheets made in different time intervals. Individual T-sheets typically do not indicate their plane of reference; in general in the Puget Sound area it was defined, sequentially, as mean low water (1849-1853), mean lower low water (1854-late 1870s), mean of selected low waters (late 1870s-1897); harmonic or Indian tide plane (1897-1902); 2 feet below the plane of mean lower low water (1902-1921); and mean lower low water (1921-present; see p. 256, Shalowitz, 1962) . Enumerated_Domain: Enumerated_Domain_Value: LOW_WATER_IMPLIED Enumerated_Domain_Value_Definition: We used "Low water, implied" for the outer edge of "reefs," "rocky ledges," and the outer margin of intertidal substrate symbology having a sharp boundary as defined by the legend as "shores and low water lines" Enumerated_Domain: Enumerated_Domain_Value: SHORELINE Enumerated_Domain_Value_Definition: The surveyed line of mean high water on T-sheets. The locational accuracy "...on the early surveys is within a maximum error of 10 meters and may possibly be much more accurate than this" (p. 175,
20 PUGET SOUND NEARSHORE PARTNERSHIP Technical Report 2005-01
Shalowitz, 1962). The actual high-water line was not surveyed in tidal marshes, where the shoreline was taken instead as the outer or seaward edge of the marsh (p. 177, Shalowitz, 1962). Enumerated_Domain: Enumerated_Domain_Value: SHORELINE_APPROX Enumerated_Domain_Value_Definition: Locations where T-sheet was poorly legible, making it impossible to precisely locate the shoreline. Enumerated_Domain: Enumerated_Domain_Value: SHORELINE_DOCK Enumerated_Domain_Value_Definition: Areas where the shoreline and a dock coincide on t-sheets and the actual shoreline is not distinguishable. Enumerated_Domain: Enumerated_Domain_Value: SHORELINE_LEVEE Enumerated_Domain_Value_Definition: Areas where the shoreline on t-sheets and a levee coincide. Attribute: Attribute_Label: FID Attribute_Definition: Internal feature number. Attribute_Definition_Source: ESRI Attribute_Domain_Values: Unrepresentable_Domain: Sequential unique whole numbers that are automatically generated. Attribute: Attribute_Label: Shape Attribute_Definition: Feature geometry. Attribute_Definition_Source: ESRI Attribute_Domain_Values: Unrepresentable_Domain: Coordinates defining the features. Attribute: Attribute_Label: LANDFORM Attribute_Definition: Geomorphic surface Attribute_Domain_Values: Enumerated_Domain: Enumerated_Domain_Value: AT Enumerated_Domain_Value_Definition: Alluvial Terrace Enumerated_Domain: Enumerated_Domain_Value: FP Enumerated_Domain_Value_Definition: Floodplain Enumerated_Domain: Enumerated_Domain_Value: GT Enumerated_Domain_Value_Definition: Glacial (Pleistocene) terrace Enumerated_Domain: Enumerated_Domain_Value: BASE_OF_BANK Enumerated_Domain_Value_Definition: The lower boundary of a "bank" polygon. Enumerated_Domain: Enumerated_Domain_Value: BASE_OF_BLUFF Enumerated_Domain_Value_Definition: The lower boundary of a "bluff" polygon. Enumerated_Domain: Enumerated_Domain_Value: BASE_OF_EMBANKMENT Enumerated_Domain_Value_Definition: The lower boundary of an "embankment" polygon. Enumerated_Domain: Enumerated_Domain_Value: TOP_OF_BANK Enumerated_Domain_Value_Definition: The upper boundary of a "bank" polygon.

Historic Characterization of WRIA 9 Shoreline Landforms 21
Enumerated_Domain: Enumerated_Domain_Value: TOP_OF_BLUFF Enumerated_Domain_Value_Definition: The upper boundary of a "bluff" polygon. Enumerated_Domain: Enumerated_Domain_Value: TOP_OF_EMBANKMENT Enumerated_Domain_Value_Definition: The upper boundary of an "embankment" polygon. Attribute: Attribute_Label: OBJECTID Attribute_Definition: Internal feature number. Attribute_Definition_Source: ESRI Attribute_Domain_Values: Unrepresentable_Domain: Sequential unique whole numbers that are automatically generated. Attribute: Attribute_Label: SHAPE Attribute_Definition: Feature geometry. Attribute_Definition_Source: ESRI Attribute_Domain_Values: Unrepresentable_Domain: Coordinates defining the features. Attribute: Attribute_Label: COUNTY Attribute_Definition: Counties Attribute_Domain_Values: Enumerated_Domain: Enumerated_Domain_Value: King Attribute: Attribute_Label: SHAPE_LENG Attribute: Attribute_Label: SHORE_TYPE Attribute_Definition: Geomorphological typology Attribute_Domain_Values: Enumerated_Domain: Enumerated_Domain_Value: A Enumerated_Domain_Value_Definition: Bluff-Backed Beach Enumerated_Domain: Enumerated_Domain_Value: B Enumerated_Domain_Value_Definition: Barrier Beach Enumerated_Domain: Enumerated_Domain_Value: C Enumerated_Domain_Value_Definition: Open Coastal Inlet Enumerated_Domain: Enumerated_Domain_Value: D Enumerated_Domain_Value_Definition: Barrier Estuary Enumerated_Domain: Enumerated_Domain_Value: E Enumerated_Domain_Value_Definition: Barrier Lagoon Enumerated_Domain: Enumerated_Domain_Value: F Enumerated_Domain_Value_Definition: Closed Barrier Lagoon/Marsh Enumerated_Domain: Enumerated_Domain_Value: G
22 PUGET SOUND NEARSHORE PARTNERSHIP Technical Report 2005-01
Enumerated_Domain_Value_Definition: River-Dominated Estuarine Delta Enumerated_Domain: Enumerated_Domain_Value: H Enumerated_Domain_Value_Definition: Wave-Dominated Delta Enumerated_Domain: Enumerated_Domain_Value: I Enumerated_Domain_Value_Definition: Fan-Type Delta Enumerated_Domain: Enumerated_Domain_Value: J Enumerated_Domain_Value_Definition: Tide-Dominated Delta Enumerated_Domain: Enumerated_Domain_Value: K Enumerated_Domain_Value_Definition: Plunging Rocky Shores Enumerated_Domain: Enumerated_Domain_Value: L Enumerated_Domain_Value_Definition: Rocky Ramp/Platform Enumerated_Domain: Enumerated_Domain_Value: M Enumerated_Domain_Value_Definition: Pocket Beach Attribute: Attribute_Label: CONFIDENCE Attribute_Definition: Confidence rating for shoretype Attribute_Domain_Values: Enumerated_Domain: Enumerated_Domain_Value: H Enumerated_Domain_Value_Definition: High Enumerated_Domain: Enumerated_Domain_Value: M Enumerated_Domain_Value_Definition: Medium Enumerated_Domain: Enumerated_Domain_Value: L Enumerated_Domain_Value_Definition: Low Attribute: Attribute_Label: NOTE Attribute_Definition: Flags for inspection Attribute: Attribute_Label: UPLAND Attribute_Definition: Adjacent landcover to shoretype Attribute: Attribute_Label: WETLANDS Attribute_Definition: Adjacent wetland to shoretype Attribute: Attribute_Label: STREAMS Attribute_Definition: Presence of stream/channel that flows to the shoretype Attribute: Attribute_Label: MILES Attribute_Definition: Length of shoretype in miles Attribute: Attribute_Label: SHOREID Attribute: Attribute_Label: Comple_Con


PSNERP and the Nearshore Partnership The Puget Sound Nearshore Ecosystem Restoration Project (PSNERP) was formally initiated as a General Investigation (GI) Feasibility Study in September 2001 through a cost-share agreement between the U.S. Army Corps of Engineers and the State of Washington, represented by the Washington Department of Fish and Wildlife. This agreement describes our joint interests and responsibilities to complete a feasibility study to
“…evaluate significant ecosystem degradation in the Puget Sound Basin; to formulate, evaluate, and screen potential solutions to these problems; and to recommend a series of actions and projects that have a federal interest and are supported by a local entity willing to provide the necessary items of local cooperation.”
The current Work Plan describing our approach to completing this study can be found at: http://www.pugetsoundnearshore.org/documents/StrategicWorkPlanfinal.pdf
Since that time, PSNERP has attracted considerable attention and support from a diverse group of individuals and organizations interested and involved in improving the health of Puget Sound nearshore ecosystems and the biological, cultural, and economic resources they support. The Puget Sound Nearshore Partnership is the name we have chosen to describe this growing and diverse group, and the work we will collectively undertake that ultimately supports the goals of PSNERP, but is beyond the scope of the GI Study. Collaborating with the Puget Sound Action Team, the Nearshore Partnership seeks to implement portions of their Work Plan pertaining to nearshore habitat restoration issues. We understand that the mission of PSNERP remains at the core of our partnership. However restoration projects, information transfer, scientific studies and other activities can and should occur to advance our understanding, and ultimately, the health of the Puget Sound nearshore beyond the original focus and scope of the on-going GI Study. As of the date of publication for this Technical Report, our partnership includes participation by the following entities: Interagency Committee for Outdoor
Recreation King Conservation District King County National Wildlife Federation NOAA Fisheries Northwest Indian Fisheries Commission People for Puget Sound Pierce County Puget Sound Action Team Salmon Recovery Funding Board Taylor Shellfish Company The Nature Conservancy
U.S. Army Corps of Engineers U.S. Environmental Protection Agency U.S. Geological Survey U.S. Fish and Wildlife Service University of Washington Washington Department of Ecology Washington Department of Fish and
Wildlife Washington Department of Natural
Resources Washington Public Ports Association Washington Sea Grant WRIA 9