historic waters 5 1 2013 - dept. of landscape...
TRANSCRIPT


Abstract
The purpose of this design project is to investigate
and address the stormwater and open space
problems in Hoboken, New Jersey. Researching the
historical landscape change of Hoboken has shown
the change from tidal marsh to a developed city and
reasons why the city continues to fl ood. Continued
development without new park expansion has led
to an increase in population resulting in a lack
appropriate open space requirements for residents.
The design explores different stormwater interventions
within an open space network that incorporates
stormwater infrastructure and the landscape. The
focus of the design is creating a rain terrain where
stormwater is absorbed and engaged by pedestrians,
not forced into conduits to fl ow into the Hudson River.
Spaces will be created through ideas established
in Infrastructural Landscapes. These new multi-
functional landscapes will improve the pedestrian
experience in Hoboken, providing a better urban
infrastructure for movement and management.

Historic Waters: Re-imaging Hoboken’s Engineered Landscape
By James John Bykowski
Submitted in partial fulfi llment of the requirementsfor the degree of Master of Landscape Architecture in the Department of Landscape Architecture at Rutgers University.
May 6, 2013
New Brunswick, New Jersey
Committee:
Professor Wolfram Hoefer, Committee Chair
Professor Kate John-Alder
Professor Tobiah Horton

For my mom, Linda Bykowski, who helped me through
the past three years of my education. Thank you for
being there and encouraging me to work hard.

Contents:
Abstract 2
Introduction Purpose of Research 8
Methods Regional Background: Hudson County, New Jersey 13Early Development of the City of Hoboken 17Historical Landscape Change 19Existing Conditions of the City of Hoboken 26 Existing Land Use Flooding 30 Combined Sewer System 34 Sub-Local Watershed 38
Design Theories and Literature ReviewInfrastructural Landscape 42
Urban Stormwater and FloodingUrban Condition 46Best Management Practices 48
Design ExplorationsSite Description 52Design Proposal 54Conceptual Plan 56Proposed Interventions 60
Conclusion 68
Addendum: Rebuilding after Sandy: A Call to “Design with Nature” 67
References 70

8
Introduction
Purpose of Research
Traditional stormwater management,
increased impervious surfaces from development
and climate change is causing more fl ooding in our
urban landscapes. Stormwater issues in Hudson
County, New Jersey, have resulted in major fl ooding
fears and damages. This design project will look
at signifi cantly improving the quality of stormwater
infrastructure while adding public spaces and creating
multi-functional landscapes in Hudson County through
ideas based in Infrastructural Landscapes.
My research and personal experience with the
landscape has directed me towards Hoboken, New
Jersey’s landscape and stormwater issues for this
graduate design project. In September 2011, during
the third semester of my landscape architecture
education, The Department of Landscape Architecture
at Rutgers University had its annual fall fi eld trip. This
year, the department decided to venture out into the
landscape of Manhattan, so I decided to stay at a
friend’s apartment in Hoboken the evening before
to get an early start to New York the next day. That
day Manhattan, New York and New Jersey received
a pretty generous rain event, causing fl ooding in
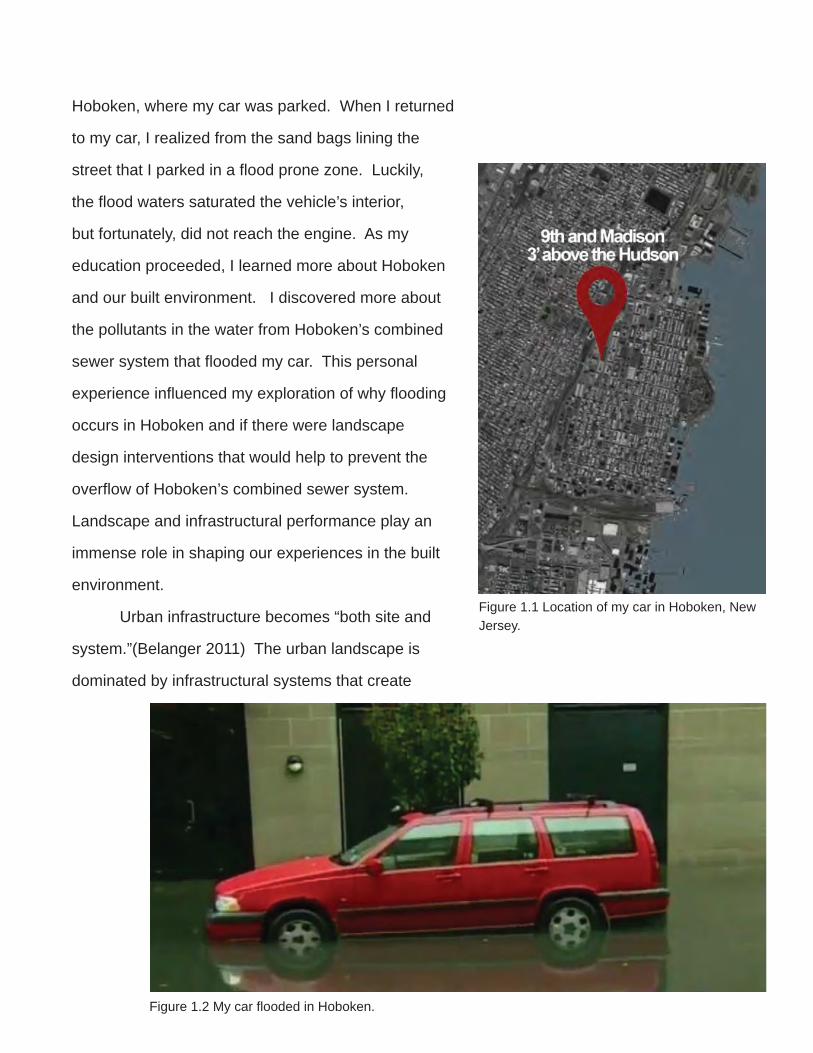
Hoboken, where my car was parked. When I returned
to my car, I realized from the sand bags lining the
street that I parked in a fl ood prone zone. Luckily,
the fl ood waters saturated the vehicle’s interior,
but fortunately, did not reach the engine. As my
education proceeded, I learned more about Hoboken
and our built environment. I discovered more about
the pollutants in the water from Hoboken’s combined
sewer system that fl ooded my car. This personal
experience infl uenced my exploration of why fl ooding
occurs in Hoboken and if there were landscape
design interventions that would help to prevent the
overfl ow of Hoboken’s combined sewer system.
Landscape and infrastructural performance play an
immense role in shaping our experiences in the built
environment.
Urban infrastructure becomes “both site and
system.”(Belanger 2011) The urban landscape is
dominated by infrastructural systems that create
Figure 1.1 Location of my car in Hoboken, New Jersey.
Figure 1.2 My car fl ooded in Hoboken.

10
movement of energy and materials that our cities
need to function. These systems that make our
cities function also create barriers for the people
who inhabit cities. “In order to function, fi t, and be
acceptable infrastructure needs to enhance the quality
of the landscape. Hence, conceiving infrastructure
blends with generating architecture, building
landscapes and producing urban settings and living
environments. ” (Shannon 64) The barriers between
infrastructure and landscape should be dissolved to
create spaces that function socially and enhance the
engineered functions of the city.
Imagining these innovative landscapes raises
questions on how they will function in many different
ways. Will these new multi-functional landscapes
improve stormwater practices and the pedestrian
experience in the county, providing a better urban
infrastructure for movement and management? Can
infrastructural landscapes bring the dynamic functions
of the urban environment into the public space to
bridge the gap between infrastructure and landscape?
Can landscape architects change the public’s thinking
and help them to see the importance of these
biodynamic systems? How will these potential public
spaces help in connecting the residents of different
communities with the waterfront and themselves?
This design project will show the function and

11
possible benefi t of an infrastructural system bound
to urban ecology. Creating connectivity within these
systematic landscapes for pedestrians, infrastructure,
public transportation and vehicular movement is a
potential way of designing the future of our urban
fabric.

12
Figure 2.1 Cities and towns in Hudson County, NJ

13
Methods
Regional Background: Hudson County, New Jersey.
This design project is located in Hudson
County, New Jersey. The county is comprised of
twelve cities and municipalities: Bayonne, Jersey
City, Hoboken, Weehawken, Union City, West New
York, Guttenberg, Secaucus, Kearny, Harrison,
East Newark, and North Bergen. The majority of
the county is surrounded by different water bodies;
to the west are the Hackensack and Passaic rivers
and Newark Bay; to the east is the Hudson River
and the Upper New York Bay, and to the south is
the Kill Van Kull. The proximity of the county to
these water bodies provides great opportunity for
residents to experience their landscape in different
ways. One can go from a dense urban environment
to a tidal marsh to a developed river walk with views
of Manhattan. These different spatial experiences
provide for an exciting and attractive place to live.
Hudson County’s close proximity to New York
City, across the Hudson River, offers its residents
easy accessibility to a remarkable transportation
network for movement through the region. Within the
county, residents have the opportunity to travel on a
Figure 2.2 Water bodies surrounding Hudson County

number of different transportation systems. These
public transportation systems include New Jersey
Transit rail, light rail and bus, Path trains, and New
York Waterway ferry.
With all these great advantages to living in
Figure 2.3 Public Transportation connecting with New York City

15
Hudson County, there are many important diffi culties.
One of the problems in the county is the continuous
fl ooding from medium to heavy rain events. Urban
stormwater runoff from the high amount of impervious
surfaces is the main cause of the fl ooding in this
densely populated area. The urban stormwater of the
county is currently designed to fl ow into combined
sewer systems that make up the entire county. This
outdated infrastructure is causing environmental and
human health risks. “The Hudson County Combined
Sewer treats both the city’s wastewater and its
rain runoff equally well, and in the same combined
facilities. But when high rates of storm runoff overload
the system and exceed its treatment capacity,
untreated water pours into the Hudson Bay or onto
county and city streets.” (Hudson County 2010)
Figure 2.4 Diagram of combined sewer system. Source EPA

16
One of the infl uences on the fl ooding problems
is the development that has been occurred in
Hudson County from the time of the fi rst settlers from
Europe. The development included a great deal of
fi lling of wetlands to “reclaim land.” “Another factor
threatening to increase the incidence of fl ooding
events in Hudson County is the continued loss of
wetlands. According to the Land Use/Cover data
from the New Jersey Department of Environmental
Protection Agency, Hudson County had 3,897 acres of
wetlands in 1986. This number decreased to a mere
1,540 acres by 2002, a decrease of over fi fty percent.”
(Hudson County 2010) These actions have continually
caused problems in our built environments and
preeminent engineered solutions are not resolving the
fl ooding issues.
Flooding issues are also infl uenced by the lack
of open space and public space in the county. The
2010 population of Hudson County, the smallest in
land size in the state, was 634,266 (Hudson County
2010). It is the most densely populated county in New
Jersey (Hudson County 2010).The high population
density of the region compared to the relatively low
open space percentage provides great potential to
improve current conditions of the county through
brownfi eld and infrastructure revitalization. These
improvements would not only attract new residents,
Figure 2.5 Existing Wetlands in Hudson County and surrounding area.
17
but also new business and help the county prepare
for the 21st century.
Early Development of the City of Hoboken
Hoboken, New Jersey is located on the
western shore of the Hudson River in Hudson County.
Originally, Hoboken was part of the Township of North
Bergen, until April 16, 1849 when the Township of
Hoboken was established. As the city’s population
grew the township was renamed the City of Hoboken
on March 28, 1855 with a population of around six
thousand.
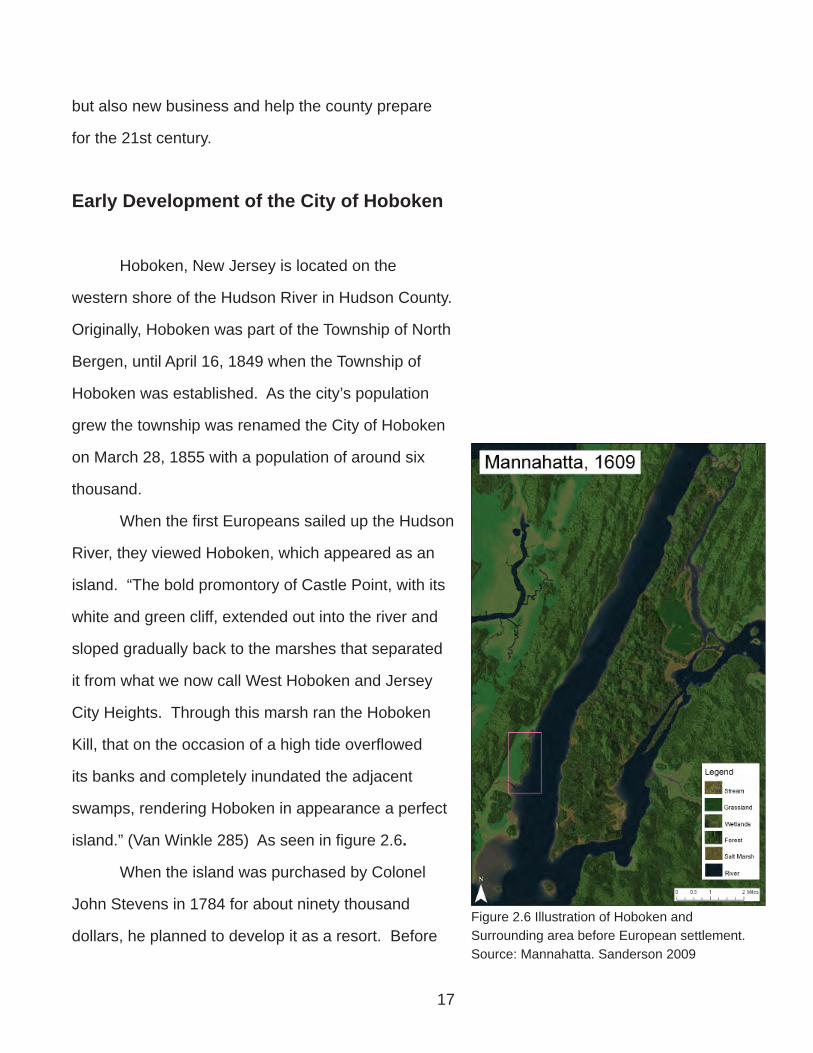
When the fi rst Europeans sailed up the Hudson
River, they viewed Hoboken, which appeared as an
island. “The bold promontory of Castle Point, with its
white and green cliff, extended out into the river and
sloped gradually back to the marshes that separated
it from what we now call West Hoboken and Jersey
City Heights. Through this marsh ran the Hoboken
Kill, that on the occasion of a high tide overfl owed
its banks and completely inundated the adjacent
swamps, rendering Hoboken in appearance a perfect
island.” (Van Winkle 285) As seen in fi gure 2.6.
When the island was purchased by Colonel
John Stevens in 1784 for about ninety thousand
dollars, he planned to develop it as a resort. Before Figure 2.6 Illustration of Hoboken and Surrounding area before European settlement. Source: Mannahatta. Sanderson 2009
18
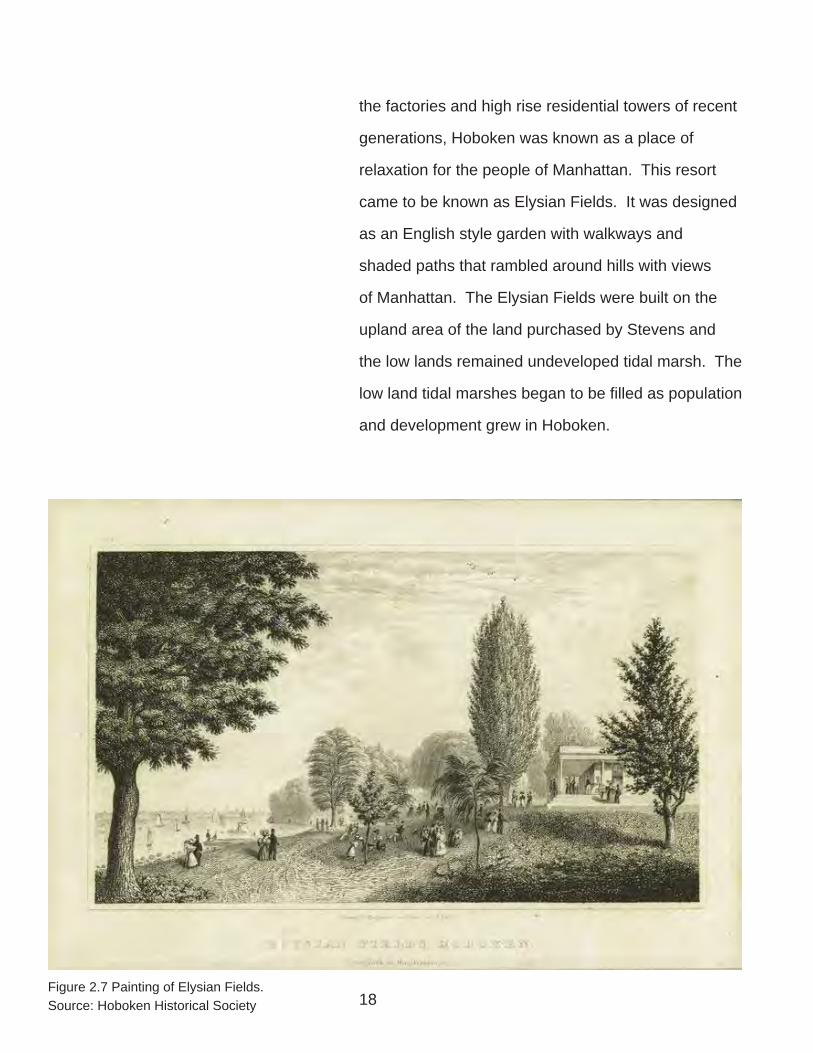
the factories and high rise residential towers of recent
generations, Hoboken was known as a place of
relaxation for the people of Manhattan. This resort
came to be known as Elysian Fields. It was designed
as an English style garden with walkways and
shaded paths that rambled around hills with views
of Manhattan. The Elysian Fields were built on the
upland area of the land purchased by Stevens and
the low lands remained undeveloped tidal marsh. The
low land tidal marshes began to be fi lled as population
and development grew in Hoboken.
Figure 2.7 Painting of Elysian Fields. Source: Hoboken Historical Society

19
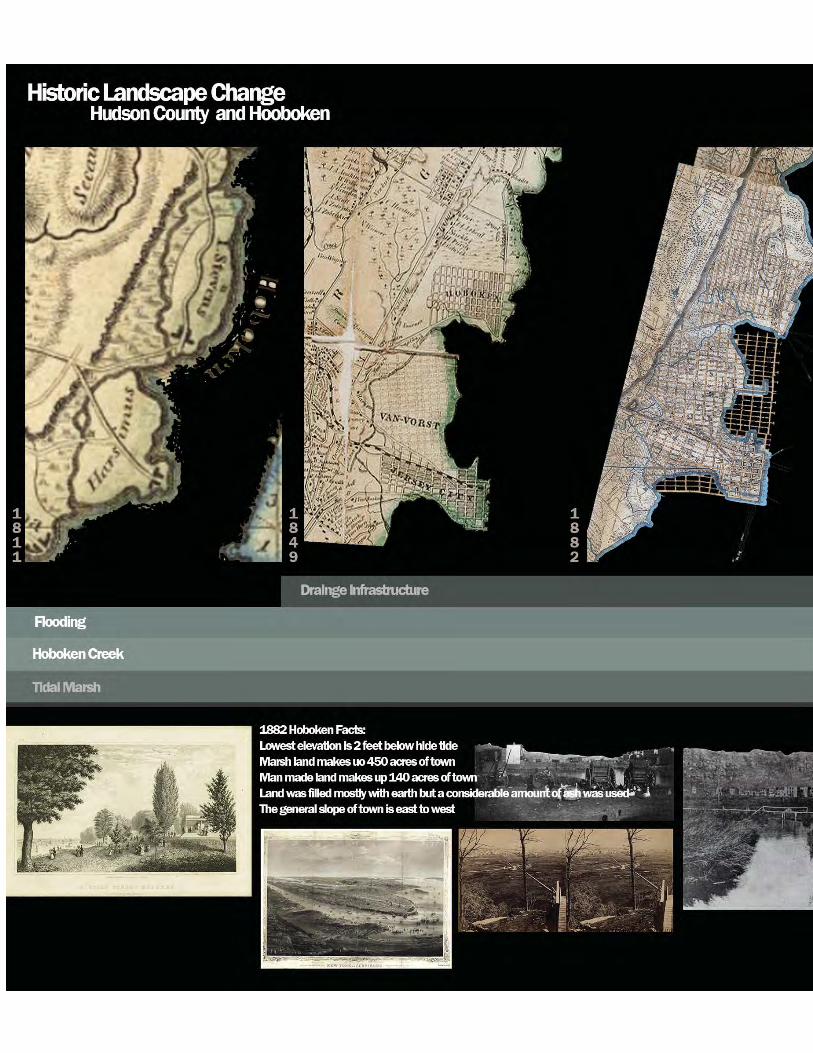
Historical Landscape Change
Through archival research, a number of historic
maps and texts were accessed to study the history of
Hudson County and Hoboken. These maps and texts
have been invaluable in mapping the changes in the
landscapes over time. They reveal the changes in the
region from tidal marshes to developed urban land.
Colonel Stevens created the original grid for Hoboken
when the area was mostly tidal marsh. The tidal
marsh lands were gradually fi lled in as development
of the land progressed for buildings and infrastructure.
The Hoboken Land and Improvement Company was
responsible for the development of these lands. In
1838, the Hoboken Land and Improvement Company
was incorporated by an act of legislature of the
State of New Jersey. The company was responsible
to “purchase, improve, mortgage and dispose of
lands and other estates in and about Hoboken, for
the purpose of grading and laying out the streets
and squares, erecting wharves, and similar work.”
(Wallace 288) As the city grew the western wetland
edge slowly disappeared. This natural low land
helped control fl ooding in the area, cutting it off
from the Hudson River gave stormwater fl ow off the
highlands nowhere to go.
Figure 2.8 Map of Hoboken Creek. Source: Hoboken Historical Society
Figure 2.9 Map of Hoboken 1882.


22
Mapping Historic Wetlands of Hoboken
Historical mapping and existing land use show
how Hoboken’s landscape has changed through time.
When fi rst discovered, Hoboken was mostly tidal
wetlands of the Hudson River. These wetlands have
been totally fi lled in for development, with no wetlands
remaining. Also known as the Hoboken Meadows.
(Figures 2.10 - 2.12) Residents of the meadows
had to build plank roads to traverse the fl ood prone
landscape. Filling of wetlands is the case for most
of the New Jersey and New York region. “Tidal
wetlands and shallow water flats that historically lined
the coastlines of the New York/New Jersey (NY/NJ)
Estuary have been impacted heavily since the arrival
of European colonists.” (Montalto 414) The now lost
wetlands once provided a valuable ecological function
for our environment. Stormwater, that was once
stored, fi ltered, and infi ltrated in the fi lled wetlands
now runoff our built environments surfaces directly
into adjacent water bodies.
The historical mapping study used maps
between 1811 and 1910 to understand how the
wetlands in Hoboken were fi lled in. “Beginning
in the 17th century, huge portions of shoreline
were modified, channels dredged, and wetlands
disrupted or filled to accommodate increases in Figure 2.12 Photo of Hoboken Plank Roads. 1890 Source: Rutgers University Community Repository
Figure 2.10 Photo of Hoboken Meadows. 1860Source: Rutgers University Community Repository
Figure 2.11 Photo of Hoboken Meadows. 1903Source: Rutgers University Community Repository
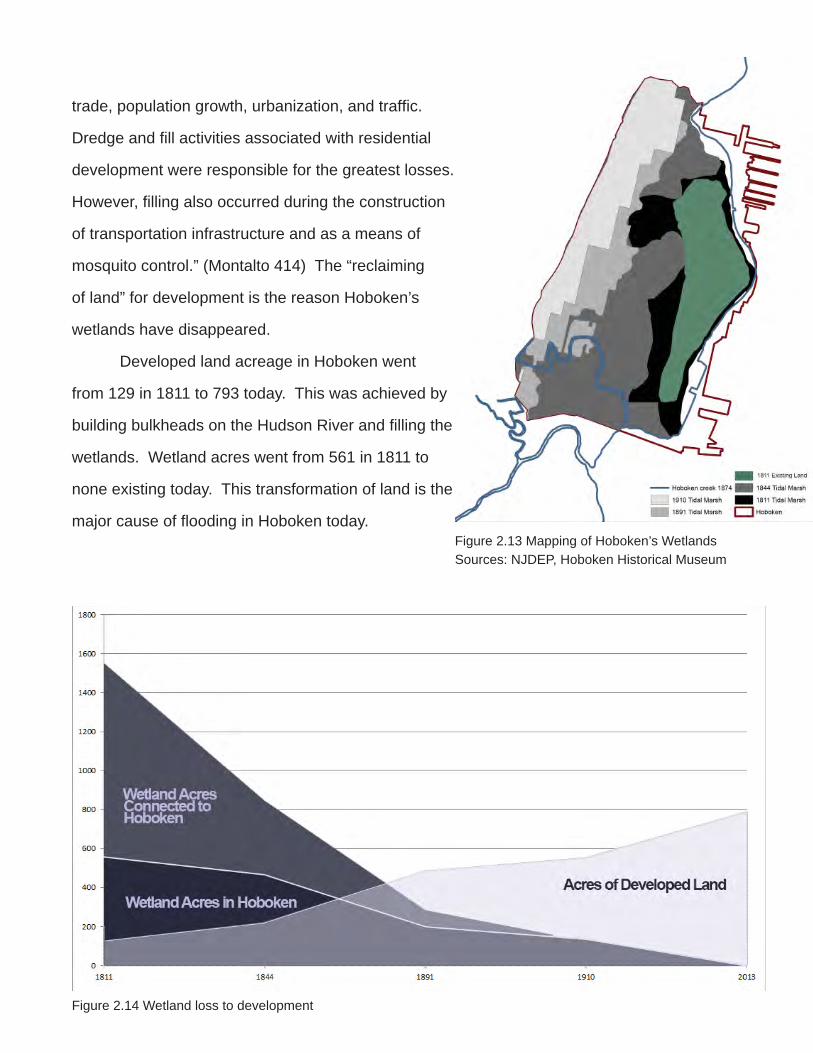
trade, population growth, urbanization, and traffic.
Dredge and fill activities associated with residential
development were responsible for the greatest losses.
However, filling also occurred during the construction
of transportation infrastructure and as a means of
mosquito control.” (Montalto 414) The “reclaiming
of land” for development is the reason Hoboken’s
wetlands have disappeared.
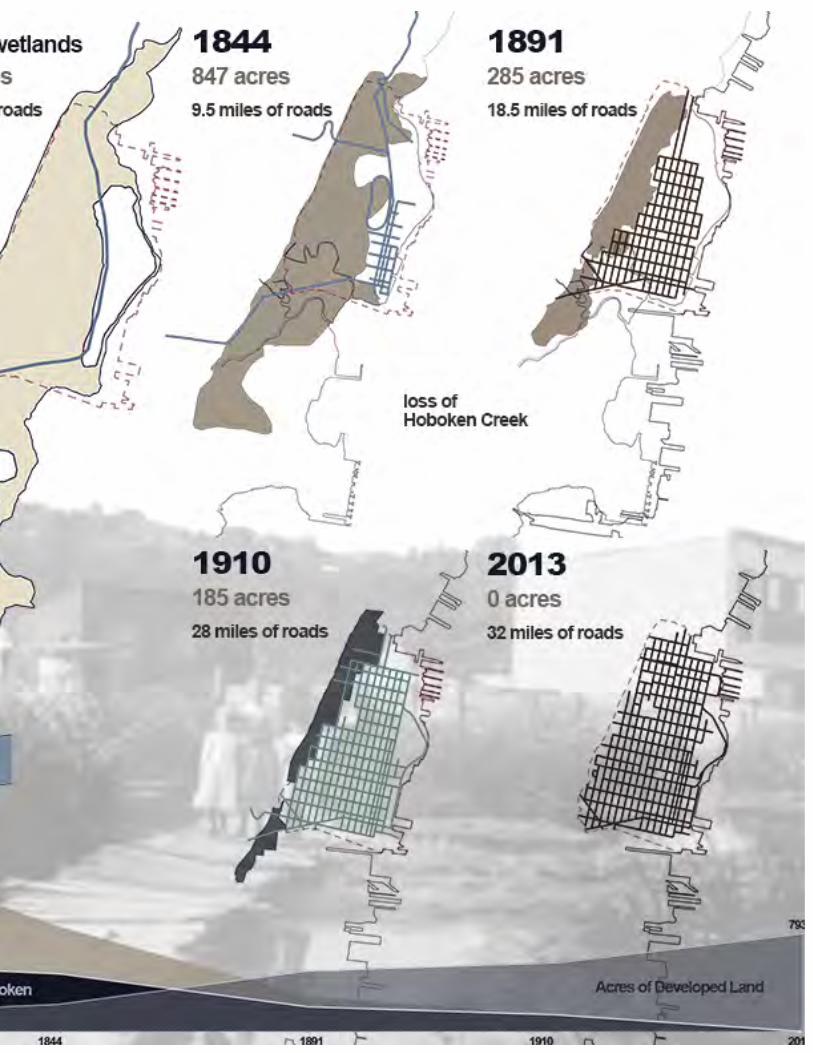
Developed land acreage in Hoboken went
from 129 in 1811 to 793 today. This was achieved by
building bulkheads on the Hudson River and fi lling the
wetlands. Wetland acres went from 561 in 1811 to
none existing today. This transformation of land is the
major cause of fl ooding in Hoboken today.Figure 2.13 Mapping of Hoboken’s Wetlands Sources: NJDEP, Hoboken Historical Museum
Figure 2.14 Wetland loss to development

24
Figure 2.15 Wetland loss to development

26
Existing Conditions of the City of Hoboken
Existing Land Use
Hoboken is currently a highly developed urban
landscape. To better understand this landscape a
mapping of its current land use was very important.
Using Arc GIS, a mapping study of existing residential
and industrial buildings, vacant land, off street
parking, open space, roads and utility areas was
conducted. Private backyards and driveways where
not included in the study. Some areas were included
because of the close proximity to the Hoboken City
boundary. The results of the mapping are presented
in fi gures 2.16 and 2.17.
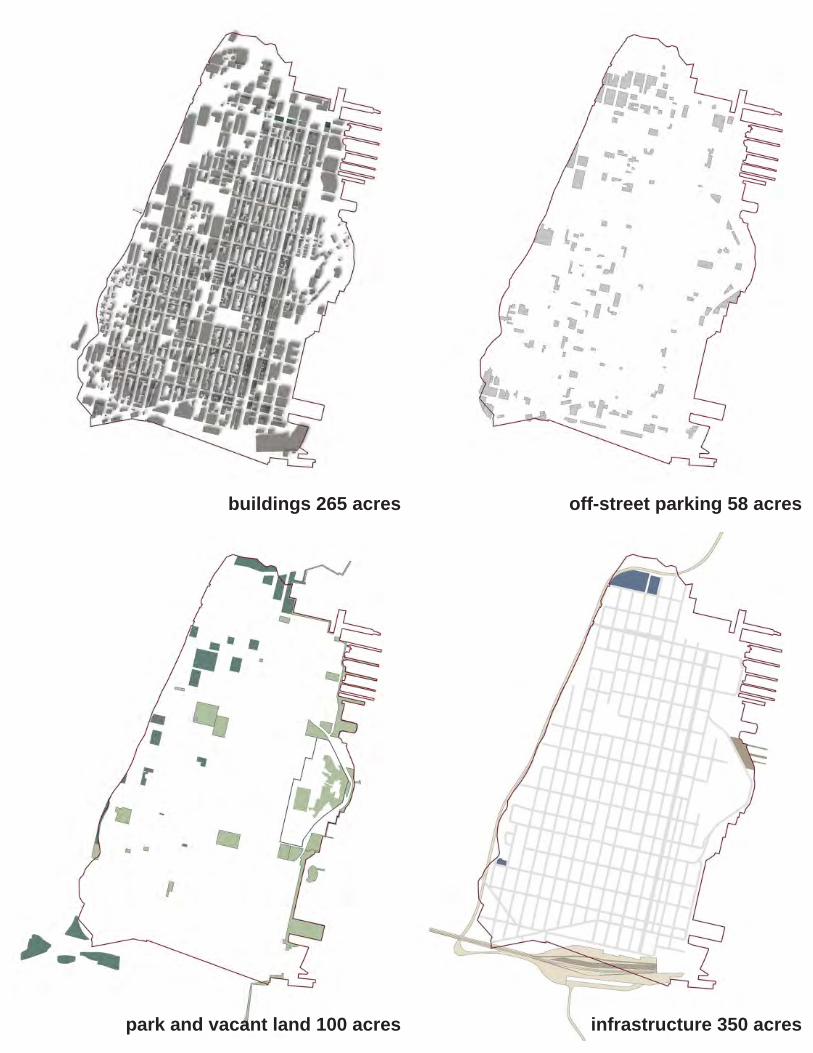
“The city of Hoboken is 90% impervious,
meaning that 90% of rainwater enters the collection
system almost immediately.” (EmNet 11) The
mapping goals were to better understand the amount
of impervious surface broken into different categories.
This data will help guide design interventions dealing
with urban fl ooding.

Figure 2.16 Existing land use

28
Figure 2.16 Existing land use
29
buildings 265 acres
park and vacant land 100 acres infrastructure 350 acres
off-street parking 58 acres

30
Flooding in Hoboken
Since September 2011 when my car was
fl ooded in Hoboken, I have been interested in
exploring the reasons why the City of Hoboken has
such major fl ooding issues. The development and
use of impervious surfaces has clearly contributed
to the fl ooding issues in this urban environment.
However, the location of Hoboken has contributed
signifi cantly to its fl ooding. One of the major issues is
that most of Hoboken was developed in a fl ood plain.
The city of Hoboken is roughly 793 acres, located
directly adjacent to a major body of water, the Hudson
River. Much of Hoboken is in fl ood zones defi ned
by the Federal Emergency Management Agency
(FEMA).
The term “100-year fl ood plain line” is a
commonly misunderstood concept. A “100-year fl ood
can happen two years in a row.” (USGS) “The term
“100-year fl ood” is used in an attempt to simplify the
defi nition of a fl ood that statistically has a one percent
chance of occurring in any given year. Likewise, the
term “100-year storm” is used to defi ne a rainfall event
that statistically has this same one percent chance of
occurring.” (USGS) The fi rst zone in Hoboken labeled
by FEMA is called, “Zone AE”. Zone AE is a parcel
of land that has a one percent chance of fl ooding
Figures 2.17 - 20 Flooding in Hoboken. Figure 2.21 FEMA fl ood map.

31

32
annually, also known as the 100 year fl ood plain.
This zone has the potential to fl ood during many
different rain events. The second area of the fl ood
plain in Hoboken that rarely fl oods is known as the
“0.2 percent chance of fl ooding” zone. As the name
states, it has a 0.2 percent chance of fl ooding each
year, this area is in the 100 to 500 year fl ood zone.
The third zone in Hoboken is called “Zone X” and this
area has an elevation above the 500 year fl ood plain
resulting in a nominal chance of fl ooding. (FEMA)
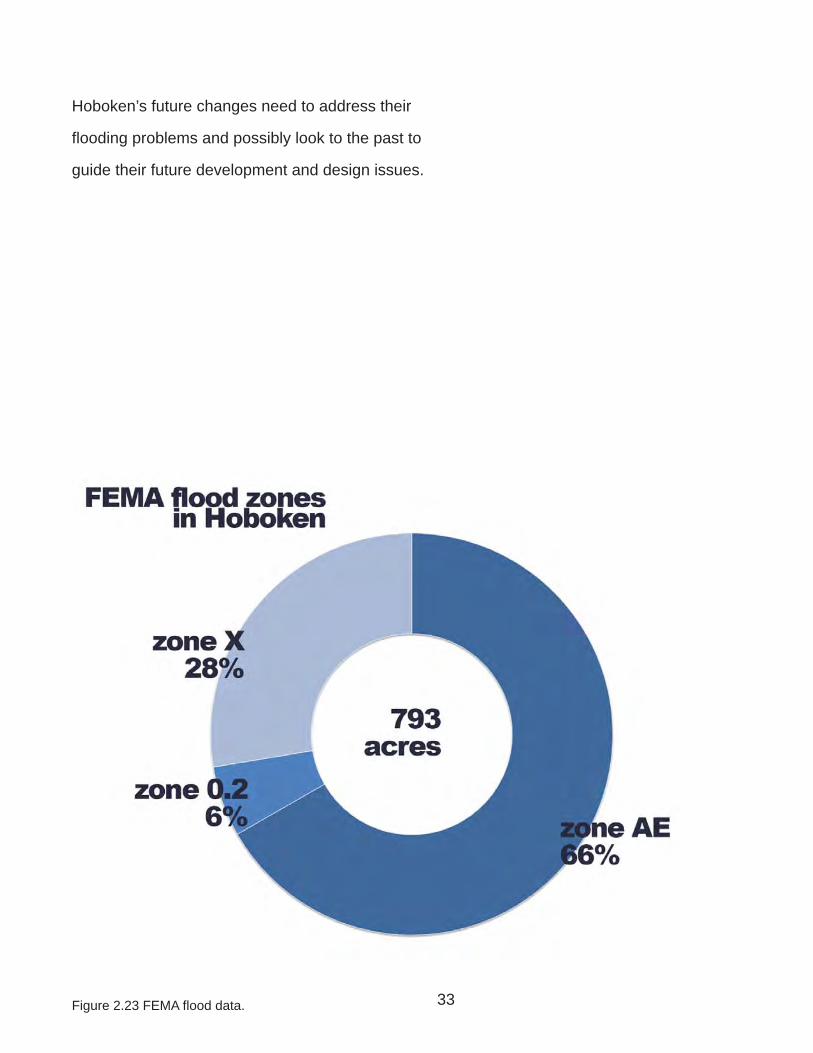
Of Hoboken’s 793 acres, 66% of the total land area
or 529 acres fall in zone AE, an area that is under
constant threat of fl ood. Six percent falls in “zone 0.2”
which comprises 45 acres. The total land area of both
zone AE and Zone 0.2 combined is 574 acres, 72
percent of the City of Hoboken.
This is a landscape that has gone through
constant change, from tidal wetlands to a major city. Figure 2.22 FEMA fl ood map.
33
Hoboken’s future changes need to address their
fl ooding problems and possibly look to the past to
guide their future development and design issues.
Figure 2.23 FEMA fl ood data.

34
Combined Sewer System
Flooding in Hoboken becomes a major public
health concern because of the combined sewer
system that exists there. “Combined Sewer Overfl ow
(CSOs) discharge toxic materials and bacterial and
viral pathogens at potentially harmful levels on the
receiving water bodies. CSO’s are a major pollution
concern for approximately 772 cities in the U.S.
that have combined sewer systems.” (Delleur 568)
Combined sewer systems developed in European and
American cities in the early 1800s.
These systems were designed to collect and
combine stormwater, raw sewage and industrial
wastewater into the same pipe. The collected
wastewater is then directed to a water treatment
plant, where it is cleaned and discharged into a Figure 2.24 Diagram of combined sewer system. Source EPA

35
nearby body of water. In Hoboken, this water body
is the Hudson River. Problems arise during episodes
of heavy rainfall and the combined sewer system
is overwhelmed with wastewater. This wastewater
will then be discharged directly into the water body
without being treated, causing pollution. (Delleur 568)
Another problem with the combined sewer system in
Hoboken is when the Hudson River is at high tide,
six of the seven combined sewer outfall points are
submerged by the river. When the outfall points are
submerged the wastewater cannot discharge and the
wastewater backs up into the streets causing fl ooding.
Keeping stormwater from entering the combined
sewer system will help reduce the fl ooding in
Hoboken. This can be done through different
sustainable methods and will be discussed in Best
Management Practices, page 48.

Hoboken
14VO
18PS
H
H1
H2
H3
H4
H5
H6
H7
HSI
HWF
Figure 2.25 Sewer shed map.Source: North Hudson Sewer Authority, NJDEP

37
Trunk Lines
Sewer SystemTYPE
Force Main
Gravity
Interceptor
Inverted Siphon
Outfall
SS
SSFM
ST
UNK
Hoboken
Road Edge
Figure 2.26 Sewer line map.Source: North Hudson Sewer Authority, NJDEP

38
Hoboken Sub Watershed
A watershed analysis study was performed
using a digital elevation model of the city and Arc
GIS. This analysis shows how the topography of
Hoboken infl uences the stormwater fl ow. The majority
of Hoboken slopes east to west. At the western edge
the landform rises back up to Bergen Hill. The low
point of Hoboken is in the southwest section. The
most frequent fl ooding occurs in this section because
of the natural water fl ow into it seen in the watershed
map.
Figure 2.27 Topography.
Figure 2.29 View of Hoboken from New York City.

39
Figure 2.28 Stormwater fl ow.

40
Design Theories and Literature ReviewInfrastructural Landscapes: Methodology to Design
“Infrastructure: the basic physical and organizational
structures and facilities (e.g. buildings, roads, and
power supplies) needed for the operation of a society
or enterprise.” (Oxford Dictionary)
Infrastructural landscape, “proposes an
expanded operating system for contemporary cities
where the full complexity of biodynamic processes
and resources are visualized and deployed across
the full footprint of urbanism and the life cycles of
infrastructure.” (Belanger 2011) These working
landscapes have relatively few boundaries and
Figure 3.1 View of Light rail, Vacant and Residential

41
contain systems which work together to provide
functions for the urban environment and public space
to experience the urban landscape. Thinking about
defi nition of infrastructure one sees how ecological
functions and open space can also fall into the
category of infrastructure because of society’s need
for these to function correctly within our cities for
healthy living.
Figure 3.2 OverpassFigure 3.3 Infrastructures

42
Our cities are planned by design professionals
to function in a clear and orderly way. Downtown
sections contain stores and businesses for
commerce; parks and open space are used for
recreation; roads and train corridors are used for
transportation. “Building the city that is intended to
be effi cient with clearly designated and segregated
usually results in many leftover spaces without
planned uses, including areas near or under
highways, bridges and overpasses. Also, as
industries move out of cities, land becomes vacant.”
(Hauck 117) Reclaimed spaces on the fringe of
existing infrastructure or the spaces in-between are
areas with potential of becoming more than prosaic
landscapes and becoming landscape with value to
the community they serve. “These reclaimed spaces,
however, are more than just stop gap measures
resulting from a lack of better places. Users have
discovered aesthetic and functional potential in these
condemned spaces, which they continue to activate
for their own purposes. Such spaces are attractive
for their users because the user defi nes what these
spaces are good for.” (Hauck 15) The spaces created
by infrastructure offer a different urban experience
then the traditional urban park. These space need the
correct program assigned to them to succeed in the
city or neighborhood they exist in.
Figure 3.4 Washington Street, Hoboken.
Figure 3.5 Pier A Park, Hoboken.
Figure 3.6 Light Rail Station, Hoboken.

44
Urban Stormwater and Flooding Urban Condition
The urban environment and development
of impervious landscapes create challenges for
stormwater management. The natural water cycle
has been devastated by development and hard
engineered solutions such as Hoboken’s combined
sewer systems. Stormwater no longer fl ows through
natural surfaces, absorbed and slowed by plants
and soils. Instead it is designed to fl ow as fast as
possible off a surface, into a drain, then a pipe and
outfall downstream into a river or ocean to become
somebody else’s problem. “The displacement of open
land by impervious surface of streets, driveways and
buildings will intensify rainfall runoff. This will not only
increase the risk of fl ooding but will also threaten
water resources through pollutants transported from
impervious surfaces.” (Hermy 224)
Flexible or softer stormwater systems offer
an ecological based framework that reproduces the
natural process of the area before urbanization. A
softer system of plants and soil slows and treats
stormwater before entering the sewer system and
pipe and rapidly discharged into an end of pipe
solution, usually a river.
The overall surface condition of Hoboken’s
Figure 4.1 1950 Flooding Hoboken.Source: Hoboken Historical Museum.

45
urban landscape places pressure on the combined
sewer system by the connectivity of impervious
surface to it. During any rain event, 90-95% of the
stormwater reaching Hoboken will be directed into the
sewer system then into the Hudson River. (EmNet
Report 2011) There is not enough green or pervious
space to absorb the stormwater. “The effect of
disconnecting impervious areas from a combined
sewer in favour of a new open rainfall management
(including open channels, ponds and green
roofs) found that it not only improved stormwater
management in the area, but also the performance
of the combined sewer system that serves the
surrounding area.” (Hermy 224)
46
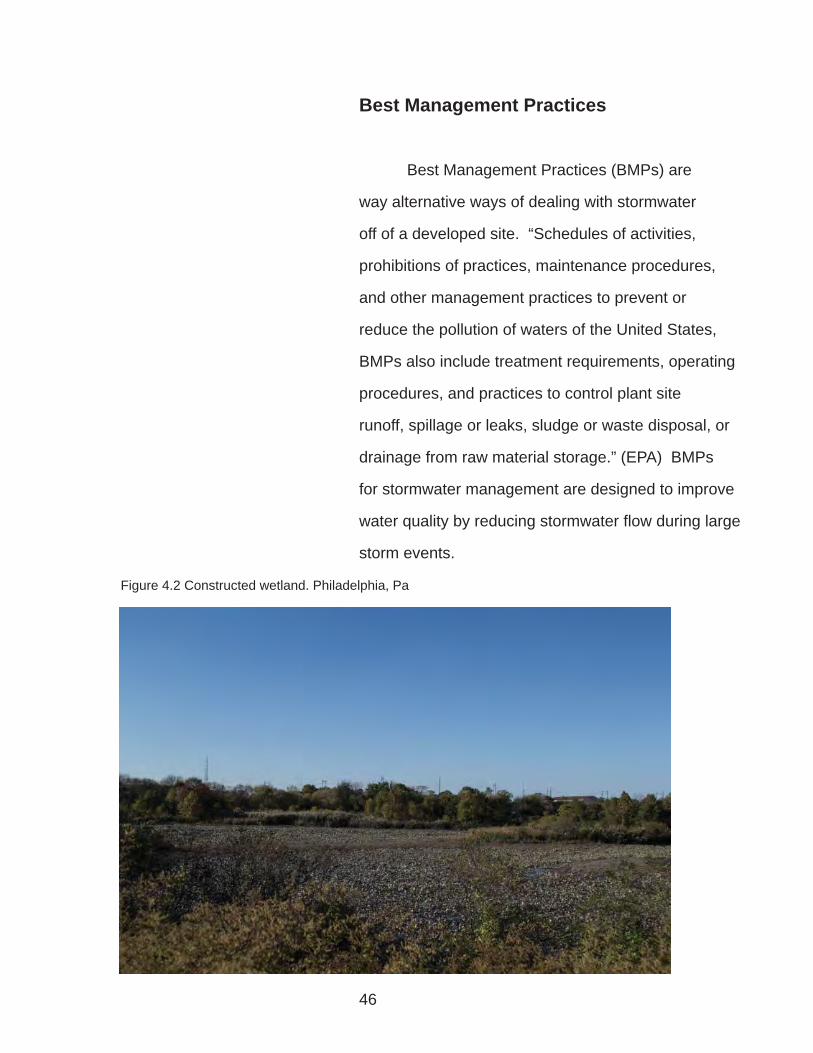
Best Management Practices
Best Management Practices (BMPs) are
way alternative ways of dealing with stormwater
off of a developed site. “Schedules of activities,
prohibitions of practices, maintenance procedures,
and other management practices to prevent or
reduce the pollution of waters of the United States,
BMPs also include treatment requirements, operating
procedures, and practices to control plant site
runoff, spillage or leaks, sludge or waste disposal, or
drainage from raw material storage.” (EPA) BMPs
for stormwater management are designed to improve
water quality by reducing stormwater fl ow during large
storm events.
Figure 4.2 Constructed wetland. Philadelphia, Pa

47
Stormwater System Interventions : Green Infrastructure
Collection – stormwater can be collected in tanks
from a roof or another impervious surface and stored
for later use.
Bio-swale – is designed to slow, absorb and infi ltrate
stormwater from minor fl oods through the use of
different plants and soils. Can be used along streets
and parking lots to prevent stormwater from entering
the sewer system.
Constructed Wetlands – are large shallow areas
where stormwater collects and is temporarily stored.
These systems are heavily planted with wetland
species and allow sediment and pollutants to settle at
the bottom, fi ltering the water. These areas offer high
aesthetic values to the surrounding community.
Green Roofs – are installed on the top of a building
and consist of different layers. A green or planted
layer and a drainage layer. Water is absorbed by
designed soils and plants; the excess will fl ow off.
Street trees with soil volume channel – help slow and
store stormwater from the adjacent street. Keeps
stormwater from entering the sewer and reduses
Figure 4.3 Stormwater collection
Figure 4.4 Bio-swale
Figure 4.5 ASLA Green Roof

48
pressure on a sewer system.
Vertical green walls or planters – Slows stormwater
that is coming off a roof on its way down to street
level.
Permeable Paving - Allows stormwater to infi ltrate
through a paved surface and help recharge ground
water
Polder – a low lying parcel of land that is surrounded
by dykes or walls for temporary stormwater storage.
After the rain event has stopped, stormwater can
slowly be released back into the environment
.
Soft shore line – Used instead of a bulkhead or wall
to slow storm surge from entering a city.
Oysters – These creatures naturally create reefs that
help protect land from oncoming storm surge.
Waterfront Parks – Usually provide ample impervious
surface and plants to help slow, absorb and infi ltrate
stormwater.
Surge walls - are designed to keep ocean or river
water from a large
Figure 4.6 Street trees with permeable paving

49
Pumps – Use electricity to pump excess surface
stormwater to an adjacent water body or storage
facility.
Sewer – Traditional stormwater management where
water runs off a surface into a pipe. The stormwater
is then delivered to the nearest water body (river,
stream, lake or ocean) as fast as possible to avoid
back up from other locations.
Figure 4.3 Sewer Outfall.
Figure 4.3 Stormwater Interventions

50
Design ResearchSite Description
The design proposal will focus on the areas
located on the western edge of Hoboken. Stormwater
fl ooding occurs most frequently in this area of the city.
Development is on the rise in this part of town and
no valuable open space has been created to offset
the development. Existing conditions show a very
urban landscape; mostly off-street parking, vacant
land and industrialized. Stormwater interventions and
open space will reduce the fl ooding frequency and
take pressure off the aging sewer infrastructure. This
design proposal investigates ways to protect Hoboken
from fl ooding from medium to large rain events, not
from storm surge due to large hurricanes.
Figure 5.1 Western edge, Hoboken.

51
Figure 5.2 Western edge, Hoboken. Source: Google Maps

52
Design Proposal
The design interventions use the spaces in-between
or left over spaces created by past urban planning
and changing land use to create a framework for
stormwater infrastructure and a pedestrian circulation
system that incorporates historical wetland traces
of the city. The historical research and existing
conditions has shown why Hoboken has a signifi cant
fl ooding problem. This research can be applied
to help frame the future design interventions in
an attempt to relieve the fl ooding problems of the
western edge. The stormwater interventions will be
based on the research from urban stormwater BMPs.
West Hoboken Design Goals:
• Reclaim space for ecological stormwater
management
• Disconnect impervious surface
• Increase the time it takes for stormwater to enter
the existing combined sewer system
• Create an open space network/linear park system
for future development of Hoboken’s landscape
• Use plant species for their phytoremediation
abilities
• Increase public engagement with the landscape
and natural processes, mainly fl ooding

53
• Create a richer experience for commuters in west-
ern Hoboken
The reclamation of land on the western edge
of Hoboken is an important design facilitation to make
space for stormwater interventions. The existing
land use analysis has shown that this part of the city
offers the largest available parcels of land. These
large parcels are important in reducing the amount
of impervious surface that dominates the urban
landscape of Hoboken. “The creation of more green
areas is also an answer to the recent calls for a more
ecological and greener urbanization.” (Hermy 218)
Redevelopment of the spaces in-between for future
stormwater interventions that allow public access will
be important in mitigating the fl ooding issues in the
western section of Hoboken.
The disconnection of impervious surfaces by
adding spaces which allow for stormwater infi ltration
or collection will have a signifi cant impact on slowing
stormwater from entering Hoboken’s combined sewer
system. This can be done through small or large
scale stormwater interventions.
Reducing the amount of stormwater entering
a sewer system will reduce the frequency of fl ooding.
Using different ecological stormwater interventions
will slow and absorb stormwater, reducing the time

54
of concentration which in turn reduces runoff. This
design approach will be important for shaping the
overall concept for the western edge of Hoboken.
An open space network with different areas of
stormwater intervention will create a linear network
that will slow and absorb stormwater comparable to
a massive planted sponge. This linear network of
drainage solutions will be analogous of the historic
Hoboken creek that once fl owed over the western
edge of Hoboken.
Increasing public engagement with the urban
landscape will create value and a sense of place. The
stormwater interventions proposed serve to reconnect
the people with the water which once fl owed through
this landscape and is now buried beneath the city.
Enhancing the public’s understanding of stormwater
management can help to promote civic motivation to
develop stormwater improvement strategies.
Conceptual PlanThe conceptual plan evaluates the existing land use
and begins to reclaim spaces for the stormwater
interventions most appropriate to the City of Hoboken.
The conceptual form and linear spatial planning are
infl uenced by the historical analysis and assessment
of the land “reclaimed” from wetlands before the
1900’s. The concept and the space on the western
1910 wetlands185 acresroads28 miles
Figure 5.3 Western Edge, Hoboken. 1909Source: Rutgers University Community Repository
Figure 5.4 Western Edge, Hoboken. 1908Source: Rutgers University Community Repository
Figure 5.5 1910 Wetlands

55
edge will once again reclaim landscape but this time it
is for creating a rain terrain not land to develop. The
plan for the space on the western edge of Hoboken
will reclaim landscape that was wetlands around 1910
and reform the land to be used for water management
to prevent fl ooding and promote pedestrian access.
The proposed green space runs the length of the
western edge of Hoboken and is connected to the
existing waterfront park system at both the north and
south edges of Hoboken. The largest spaces will be
used for stormwater fl ood plains. These spaces are
designed to fl ood and will have the greatest impact on
preventing the fl ow of stormwater into the combined
sewer system, reducing pressure and allowing
stormwater from highly developed areas to enter the
sewer system.
Figure 5.6 Reclaimed land
Figure 5.7 land use acres

56
Park Typologies: Creating a Rain Terrain
The different park typologies are based on
creating different ecologies within the space but
connected to the overall network. Topography and
the urban fabric of Hoboken infl uence where the
different typologies are proposed within the reclaimed
land.
Urban Forest: Trees play an important role in
improving water quality. Their leaves slow rain water
from reaching the ground and their roots absorb
stormwater. The proposed urban forests will be
developed on the western edge and connect to the
existing forest on Bergen Hill.
Urban Park: Primary these parks will be used as
social spaces for the residents of Hoboken. Design
with BMPs they help in reducing overall stormwater
volumes.
Wetland Park: These spaces will inhabit the lowest
areas of Hoboken where fl ooding issues are the
worst. They will primarily be planted with different
species of grasses for maximum water uptake and
habitat creation. Wetland parks will offer the residents
of Hoboken a places to stroll and interact with an
urban ecology.Figure 5.8 Park typologies

57
Figure 5.9 Conceptual Plan

58
Figure 5.10 Reclaimed street.

59
Proposed InterventionsMadison between 12th and 14th
Reclaiming Madison Street between 12th and 14th
allows a deteriorating street to continue the open
space network in the western portion of Hoboken
without purchasing private property. Designed soils
are added to the edges of streets and planted to soak
up stormwater from adjacent buildings. The existing
buildings act as retaining walls for the added soil.

Figure 5.11 Reclaimed vacant and industrial land.

Monroe and 9th Using vacant land on the western edge,
the intervention allows reclaimed land to become
a surface to absorb and slow stormwater. The
boardwalk running through the space connects to
the 9th street Light Rail Station. The board walk is
infl uenced by the plank roads that ran through this
section of Hoboken before the tidal marshes were
fi lled in.

62
Harrison and 6th This area offers a vacant space next to
residential housing for stormwater concentration. To
help with reducing impervious surface runoff, Harrison
street has been reclaimed allowing the area to have a
more signifi cant role in stormwater absorption.
Figure 5.12 Reclaimed vacant land.

63

Figure 5.13 Reclaimed vacant land.


66
Conclusion
As the environment changes and rain events
come more frequently, urban fl ooding will continue to
increase. Design has given us a palette of different
stormwater interventions to work with that show
potential for decreasing volume of stormwater fl ows.
Now is the time to release these interventions on the
full scale of the urban environment. Designing these
different interventions within the landscape that allows
the human experience to be heightened and engage
the water, not pipe the water under our feet and out of
sight.
These different design interventions offer
a wide range of different user experience while
moving through the urban landscape. From large
urban forests where stormwater is absorbed by
many different plants to small urban parks that
focus on collection and reuse of water. Stormwater
management and public space working together have
a lot to offer Hoboken’s built environment.

67
Addendum Rebuilding after Sandy: A Call to “Design with Nature”
Hurricane Sandy ravaged New Jersey and New York on October 29, 2012. The vast devastation
will be extremely hard for people to forget. Even so, we are very resilient; we will rebuild and
move on with our lives. I am one of the millions affected by Sandy, luckily there was no damage
to my home but I was without power for more than ten days and forced to relocate. Some of my
closest friends weren’t as lucky and I want them to really think about how and where they rebuild.
Year after year the storms on the east coast get larger and cause more damage with longer
periods of restoration required. People lose power, water, heat, and property but, we rebuild.
Towns and cities lose infrastructure, but we rebuild and move on with our lives just to face another
devastating storm. Is this the proper course of action? I am suggesting we step back and really
thinking before we rebuild the same way. After “Super-Storm Sandy” we have to re-imagine
the way we engineer our infrastructure and use our land. Traditional methods (end of pipe
engineering) are not standing up to sea level rise and larger storm systems.
Landscape architects have been thinking about this for years. My hope is that Sandy will be
the event that changes the way we actually develop and re-develop our land. The New Jersey
coastline was almost completely destroyed by Sandy. Landscape architects, architects, engineers
and planners should be looking back to resources that may have forgotten and draw infl uence
from them when considering re-development of our built environments following this extremely
destructive storm.
In Ian McHarg’s “Design with Nature,” one appreciates a way to design with nature and use
natural processes as part of our infrastructures, not over engineer a simple process. “Emphasis

68
is not on either design or nature by itself, but upon the preposition with, which implies human
cooperation and biological partnership.” (McHarg viii) Green infrastructure in today’s built
environment is attempting to use this partnership. Instead of draining storm water from our paved
surfaces directly into a pipes and sending it down stream to become someone else’s problem, let’s
use infi ltration and get that water back into our ground water supply.
One of the chapters in, “Design with Nature,” deals with a study about the New Jersey Shore,
completed by graduate students in landscape architecture at the University of Pennsylvania.
This study uncovered the importance of the barrier islands that run along the coast and protect
the New Jersey bays from the Atlantic Ocean. These islands were designed by nature to control
storm surges with a series of dunes. This series of dunes, primary (front), secondary (middle) and
back dunes offer a remarkable defense system to our larger east coast storms. Unfortunately, it
was a storm similar to Sandy that hit our coast a little over fi fty years ago, “The Storm of 1962,”
that lead to the study being conducted. The winter storm took a comparable path and caused
similar damage as Sandy. During the storm of 62, houses built high on primary dunes had the
sand washed out from beneath them. The same happened during Sandy, to residents of Long
Beach Island, creating an uncomfortable view of a residential area next to the ocean. The barrier
islands were breached by the ocean during the storm of 62, this also happened during Sandy
in Mantoloking, New Jersey causing immense fl ooding problems and major damage to homes
and infrastructure. Flooding from storm surge also occurred further up the New Jersey coast
in Hoboken. The majority of the city was covered with six feet of water that fl owed in from the
Hudson River.
As New Jersey prepares to rebuild, we should consider stepping back and looking at alternatives
to the status quo of development along the shore. The native landscape before development
started would be the appropriate starting point for infl uence into new design ideas. Landscape
architects, architects, engineers, planners and public offi cials should step forward and put proper

69
plans into action. It is possible to re-develop the New Jersey coast and save the important tourism
business while new regulations are put into place allowing housing and natural processes to
coexist protecting our investments.
Ian McHarg said, “let us accept the proposition that nature is process, that it is interacting, that
it responds to laws, representing values and opportunities for human use with certain limitations
and even prohibitions to certain of these.” (McHarg 7) So, in this time of sorrow and despair, we
fi nd the strength to help our neighbors and friends; let’s also fi nd the strength to re-thinking the
places we develop and how we develop, so we have less of a chance of seeing the devastation of
Hurricane Sandy happen again. Rebuilding smarter and more resourceful should be the goal of
all New Jersey residents.

70
ReferencesBelanger, Pierre. “Landscape as Infrastructure.” Landscape Journal 28.1 (2009): 79-95. Print.
Belanger, Pierre. “Landscape Infrastructure: Urbanism Beyond Engineering.” Infrastructure Sustainability & Design edited by Spiro N. Pollalis, Daniel Schodek, Adreas Georgoulias and Stephen J. Ramos (London: Routledge, 2011)
Delleur, Jacques W. “The Evolution of Urban Hydrology: Past, Present, and Future.” Journal of Hydraulic Engineering. v129 (2003): 563-573.
Franck, Karen A. Loose space: possibility and diversity in urban life. New York: Routledge. 2007
Hauck, Thomas, Regine Keller, and Volker Kleinekort. Infrastructural Urbanism Addressing the In-Between. Berlin: Dom publishers, 2011. Print.
Hermy Martin, Mentens Jeroen, Raes Dirk. “Green roofs as a tool for solving the rainwater runoff problem in the urbanized 21st century?” Landscape and Urban Planning 77 (2006) 217–226.
Herrington, Susan. “The Nature of Ian McHarg’s Science.” Landscape Journal 29.1 (2010): 1-20. Print.
Hung, Ying-Yu. Landscape Infrastructure: Case Studies by SWA. Basel: Birkhäuser, 2011. Print.
Hudson County Division of Planning. Hudson County Regional Comprehensive Economic Development Strategy or CEDS. Hudson County, New Jersey. 2010
McHarg, Ian L. Design with Nature. Garden City, NY: Published for the American Museum of Natural History, 1969. Print.
Montalto, Franco A. and Steenhuis, Tammo S. “The Link Between Hydrology and Restoration of Tidal Marshes In the New York/New Jersey Estuary.” Wetlands Vol. 24, No. 2, June 2004, pp. 414–425.

71
Shannon, Kelly. “Towards Integrating Infrastructure and Landscape.” Topos 74.1 (2011): 64-71. Print.
Stanley, Allen.“Infrastructural Urbanism.” Scroop: Cambridge Architectural Journal. n.9 (1997- 1998): 71-79
Thompson, Ian H. “Ten Tenets and Six Questions for Landscape Urbanism.” Landscape Research 37.1 (2012): 7-26. Print
United States Geological Survey (USGS). Floods: Recurrence intervals and 100-year fl oods. http://ga.water.usgs.gov/edu/100yearfl ood.html. Acessed 3/20/2013.
Van Winkle, Daniel . History of the Municipalities of Hudson County New Jersey 1603-1923. New York: Lewis Historical Publishing copany, Inc. 1924. Print.
Waldheim, Charles. The Landscape Urbanism Reader. New York: Princeton Architectural, 2006. Print.