historical estimates of the market risk premium - attachment...historical estimates of the market...
TRANSCRIPT
Historical Estimates of the Market Risk Premium
A report for Jemena Gas Networks, Jemena
Electricity Networks, ActewAGL, Ausgrid, AusNet
Services, Australian Gas Networks, CitiPower,
Endeavour Energy, Energex, Ergon, Essential
Energy, Powercor, SA Power Networks and United
Energy
February 2015

Project Team
Simon Wheatley
NERA Economic Consulting
Darling Park Tower 3
201 Sussex Street
Sydney NSW 2000
Australia
Tel: 61 2 8864 6500 Fax: 61 2 8864 6549
www.nera.com

NERA Economic Consulting
CONFIDENTIALITY
We understand that the maintenance of confidentiality with respect to our clients’ plans and data is critical to their interests. NERA Economic Consulting rigorously applies internal confidentiality practices to protect the confidentiality of all client information.
Similarly, our approaches and insights are proprietary and so we look to our clients to protect our interests in our proposals, presentations, methodologies and analytical techniques. Under no circumstances should this material be shared with any third party without the prior written consent of NERA Economic Consulting.
© NERA Economic Consulting
Historical Estimates of the Market Risk Premium Contents
NERA Economic Consulting
Contents
Executive Summary i
1. Introduction 8
2. Arithmetic versus Geometric Averaging 12
2.1. The Views of the ACT, AER and McKenzie and Partington 13
2.2. The Bias Produced by Compounding 17
2.3. The AER Never Compounds 20
3. Historical Estimates of the Market Risk Premium 25
3.1. Lally 27
3.2. Handley 29
3.3. AER 39
3.4. Update of the Data 40
Appendix A. Compounding 44
Appendix B. Annual Data 47
Appendix C. Terms of Reference 52
Appendix D. Federal Court Guidelines 57
Appendix E. Curriculum Vitae 60

Historical Estimates of the Market Risk Premium List of Tables
NERA Economic Consulting
List of Tables
Table 3.1 Differences between yields used by Brailsford, Handley and Maheswaran and yields computed by Lamberton and NERA 32
Table 3.2 Data sources 38 Table 3.3 Estimates of the MRP for overlapping subsamples: theta = 0.35 42 Table 3.4 Estimates of the MRP for non-overlapping subsamples: theta = 0.35 42 Table 3.5 Estimates of the MRP for non-overlapping subsamples: theta = 0.60 43 Table 3.6 Estimates of the mean real return to the market: theta = 0.35 43

Historical Estimates of the Market Risk Premium List of Figures
NERA Economic Consulting
List of Figures
Figure 3.1 Adjustment factors 33 Figure 3.2 Lamberton and adjusted dividend yields 34 Figure 3.3 Difference between ASX and Lamberton without-dividend returns 36
Historical Estimates of the Market Risk Premium Executive Summary
NERA Economic Consulting i
Executive Summary
This report has been prepared for Jemena Gas Networks (JGN) by NERA Economic Consulting (NERA). JGN on behalf of itself and Jemena Electricity Networks, ActewAGL, Ausgrid, AusNet Services, Australian Gas Networks, CitiPower, Endeavour Energy, Energex, Ergon, Essential Energy, Powercor, SA Power Networks and United Energy (the network firms) has asked NERA to update the historical estimates of the mean real return to the market and the market risk premium that it provided to the Energy Networks Association (ENA) in 2013 and to respond to matters raised by the Australian Energy Regulator (AER) in its recently published Draft decision Jemena Gas Networks (NSW) Ltd Access arrangement
2015-20, in other recent AER decisions and by the AER’s advisors. 1
Arithmetic Versus Geometric Averaging
In a March 2012 report we emphasise that an estimate of the long-run weighted average cost of capital (WACC) that is based on the arithmetic mean of a sample of annual excess returns to the market portfolio will – so long as the other components of the WACC have been correctly computed and ignoring minor adjustments to the regulated asset base (RAB) and to the evolution of prices – produce an unbiased estimate of the revenue that the market will require in any one year, in the long run, on the RAB. 2 We also emphasise in the report that, in contrast, an estimate of the WACC that is in part based on an estimate of the MRP that places a positive weight on the geometric mean of a sample of annual excess returns to the market portfolio will produce a downwardly biased estimate of the revenue that the market requires in any one year.
While an estimate of the WACC compounded over more than one year, based on the arithmetic mean of a sample of annual excess returns to the market portfolio, will be biased, the AER, aside from some minor adjustments to the RAB and to the evolution of prices over
1 AER, APT Petroleum Pipeline Pty Ltd Access arrangement draft decision Roma to Brisbane Pipeline 2012–13 to
2016–17, April 2012.
AER, Draft decision | Multinet 2013–17 | Draft decision appendices, September 2012.
AER, Better Regulation Explanatory Statement Rate of Return Guideline (Appendices), December 2013.
Handley, J.C., Report prepared for the Australian Energy Regulator: Advice on the return on equity, University of Melbourne, 16 October 2014.
Lally, M., The cost of equity and the market risk premium, Victoria University of Wellington, 25 July 2012.
Lally, M., Review of submissions to the QCA on the MRP, risk-free rate and gamma, 12 March 2014.
McKenzie, M. and G. Partington, Report to Corrs Chambers Westgarth: Equity market risk premium, 21 December 2011.
McKenzie, M. and G. Partington, Report to the AER: Supplementary report on the equity market risk premium, SIRCA Limited, 22 February 2012.
NERA, The market, size and value premiums: A report for the Energy Networks Association, June 2013.
NERA, The market risk premium, analysis in response to the AER’s draft rate of return guideline: A report for the
Energy Networks Association, 11 October 2013.
2 NERA, Prevailing conditions and the market risk premium: A report for APA Group, Envestra, Multinet & SP AusNet, March 2012, pages 3-16 and pages 57-59.
Historical Estimates of the Market Risk Premium Executive Summary
NERA Economic Consulting ii
the regulatory period, never compounds the WACC over more than one year. 3 Thus we recommend that for long-run estimates of the MRP the AER should rely solely on estimates that use arithmetic means and that the AER should place no weight on estimates that use geometric means. An estimate of the MRP that relies solely on estimates that use arithmetic means will provide a materially better estimate than an estimate that relies either fully or in part on geometric means.
We note that in independent advice provided at the AER’s request in July 2012, Associate Professor Lally reaches the same conclusion as we do. 4 Lally states that: 5
‘The AER’s belief that geometric averages are useful apparently arises from a belief that there is a compounding effect in their regulatory process (AER, 2012, Appendix A.2.1), and therefore the analysis of Blume (1974) and Jacquier et al (2003) applies. However, I do not think that there is any such compounding effect in regulatory situations and the absence of a compounding effect leads to a preference for the arithmetic mean over the geometric mean.’
‘If historical average returns are used, they should be arithmetic rather than geometric averages.’
The AER, however, has disregarded the advice that Lally provides in July 2012, and advice we provide in March 2012 and June 2013, and instead continues to rely on advice provided by McKenzie and Partington in December 2011 and February 2012. 6 McKenzie and Partington note that an estimate of the WACC, compounded over more than one year, that is based on the arithmetic mean of a sample of annual excess returns to the market portfolio will be biased. McKenzie and Partington, however, do not point to where in the regulatory process they believe the AER compounds an estimate of the WACC. Again, apart from minor adjustments to the RAB and to the evolution of prices, the AER never compounds an estimate of the WACC.
Market Risk Premium
The AER, in its Draft decision Jemena Gas Networks (NSW) Ltd Access arrangement 2015-
20 (and the other recent draft decisions), provides estimates of the MRP computed using data
3 Our March 2012 report details the minor adjustments that the AER makes that involve compounding. These have to do with the timing of capital expenditure, difference between actual and forecast capital expenditure and the smoothing of prices.
NERA, Prevailing conditions and the market risk premium: A report for APA Group, Envestra, Multinet & SP AusNet, March 2012, pages 7-9.
4 Lally, M., The cost of equity and the market risk premium, Victoria University of Wellington, 25 July 2012.
5 Lally, M., The cost of equity and the market risk premium, Victoria University of Wellington, 25 July 2012, pages 31-32.
6 McKenzie, M. and G. Partington, Report to Corrs Chambers Westgarth: Equity market risk premium, 21 December 2011.
McKenzie, M. and G. Partington, Report to the AER: Supplementary report on the equity market risk premium, SIRCA Limited, 22 February 2012.
Historical Estimates of the Market Risk Premium Executive Summary
NERA Economic Consulting iii
that Brailsford, Handley and Maheswaran (2012) supply and that the AER updates. 7 The AER reports that an estimate of the MRP from 1883 to 2013 based on an arithmetic mean and the data is 6.3 per cent per annum under the assumption that a one dollar imputation credit distributed is worth 60 cents. In contrast, Dimson, Marsh and Staunton (2014) report that an estimate of the MRP from 1900 to 2013 based on an arithmetic mean and an alternative set of data is 7.0 per cent per annum under the assumption that the market places no value on imputation credits distributed. 8
The difference between the two estimates is largely explained by differences in the way in which the dividends distributed by a value-weighted portfolio of Australian stocks were determined by those who provided the data to the two sets of authors. 9 Dimson, Marsh and Staunton (2014) use a series of dividend yields provided to them by Professor Robert Officer of the University of Melbourne that is largely based on a series produced by Lamberton (1961). 10 Brailsford, Handley and Maheswaran (2012) use a series of yields reportedly provided to them by an employee of the Australian Stock Exchange (ASX) with the yield series also largely based on Lamberton’s data. 11 Donald Lamberton (later a Professor of Economics at the University of Queensland) worked in the Research and Statistical Bureau of the Sydney Stock Exchange (SSE) from 1949 to 1953. 12 The yields that Brailsford, Handley and Maheswaran use, however, have been adjusted downwards to take account of perceived deficiencies in the series that Lamberton provides. In contrast, the yields that Dimson, Marsh and Staunton use have not been adjusted. Brailsford, Handley and Maheswaran explain that the adjustment that they employ was made by an employee or employees of the ASX.
In June 2013 and October 2013 reports for the ENA, NERA assesses whether the adjustment to Lamberton’s (1961) yield series over the period 1883 to 1957 in the data that Brailsford, Handley and Maheswaran (2012) employ is appropriate and provide evidence that it is not. 13
7 AER, Draft decision Jemena Gas Networks (NSW) Ltd Access arrangement 2015–20 Attachment 3: Rate of return, November 2014, page 193. The same points are contained in the AER’s other recent draft decisions.
Brailsford, T., J. Handley and K. Maheswaran, The historical equity risk premium in Australia: Post-GFC and 128
years of data, Accounting and Finance, 2012, pages 237-247.
8 Dimson, E., P. Marsh and M. Staunton, Credit Suisse Global investment returns sourcebook 2014, Credit Suisse, February 2014.
9 Other factors affecting the difference are the different time periods that the AER and Dimson, Marsh and Staunton use, differences in the way that Brailsford, Handley and Maheswaran and Dimson, Marsh and Staunton compute bond returns and a difference in the assumption made about the value placed by the market on imputation credits distributed.
10 Dimson, E., P. Marsh and M. Staunton, Credit Suisse Global investment returns sourcebook 2014, Credit Suisse, February 2014.
Lamberton, D., Ordinary share yields: A new statistical series, Sydney Stock Exchange Official Gazette, 14 July 1961.
11 Brailsford, T., J. Handley and K. Maheswaran, The historical equity risk premium in Australia: Post-GFC and 128
years of data, Accounting and Finance, 2012, pages 237-247.
12 Lodewijks, J., Professor of foresight: An Interview with Donald Lamberton, Journal of Economic and Social Policy, 2007.
13 Brailsford, T., J. Handley and K. Maheswaran, The historical equity risk premium in Australia: Post-GFC and 128
years of data, Accounting and Finance, 2012, pages 237-247.
Lamberton, D., Ordinary share yields: A new statistical series, Sydney Stock Exchange Official Gazette, 14 July 1961.
NERA, Market, size and value premiums: A report for the ENA, June 2013.
Historical Estimates of the Market Risk Premium Executive Summary
NERA Economic Consulting iv
Our evidence suggests that some adjustment should be made to Lamberton’s data but that the adjustment should be smaller than the adjustment made to the data with which Brailsford, Handley and Maheswaran were provided. An estimate of the downward bias generated by the inappropriate adjustment of Lamberton’s yield series in Brailsford, Handley and Maheswaran’s data is only 18 basis points for the period that Dimson, Marsh and Staunton examine – 1900 to 2012 – but is 36 basis points for the longer period – 1883 to 2012.
The estimates of the downward bias in our 2013 reports rely on Lamberton’s series, Brailsford, Handley and Maheswaran’s (2008) analysis of yield data for February 1966, our analysis of yield data for December 1891, December 1901, December 1911, December 1921, December 1931, December 1941, December 1951 and interpolation. 14
In the current report we find that an estimate of the MRP based on an arithmetic mean using data from 1883 to 2013 appropriately adjusted is 6.56 per annum under the assumption that a one dollar imputation credit distributed is worth 35 cents. 15 An estimate of the mean real return to the market computed using the same data is 8.92 per cent per annum while an estimate of the mean nominal return to the market is 12.17 per cent per annum.
Goetzmann and Ibbotson (2007) emphasise that: 16
‘One of the major issues with statistical estimation of the realized equity risk premium is that a very long time series of stationary returns is required to achieve a high degree of confidence in the estimate. The longer the data series, the more accurate the equity risk premium calculation, as long as the fundamental expectations have remained the same.’
We report estimates of the MRP above that use the longest time series available to us and recommend that the AER – to the extent that it uses historical estimates of the MRP, mean real return on the market or mean nominal return on the market – rely on estimates that use the longest time series available.
The AER’s advisor, Associate Professor Lally, in advice provided in May 2014 to the Queensland Competition Authority, states that: 17
‘Clearly, NERA’s process is superior to that of Brailsford et al (2008) because NERA examine results for seven years rather than only one month and these years are all within the relevant period (1883-1957).’
NERA, The market risk premium: Analysis in response to the AER’s Draft Rate of Return Guidelines, October 2013.
14 Brailsford, T., J. Handley and K. Maheswaran, Re-examination of the historical equity risk premium in Australia, Accounting and Finance 48, 2008, pages 73-97.
15 An estimate of the MRP based on an arithmetic mean using data appropriately adjusted is 6.65 per annum under the assumption that a one dollar imputation credit distributed is worth 60 cents. An estimate of the MRP based on an arithmetic mean using data appropriately adjusted is 6.44 per annum under the assumption that the market places no value on imputation credits distributed.
16 Goetzmann, W.N. and R.G. Ibbotson, The equity premium over the very long run, in Handbook of the equity premium, ed. R. Mehra, Elsevier Science, 2007, Chapter 12.
17 Lally, M., Review of submissions to the QCA on the MRP, risk-free rate and gamma, 12 March 2014, page 6.
Historical Estimates of the Market Risk Premium Executive Summary
NERA Economic Consulting v
Handley, however, raise some concerns about our 2013 empirical work. First, Handley (2014) states about the adjustment that Brailsford, Handley and Maheswaran use that: 18
‘Contrary to the claim by SFG – and it is not clear whether this view is also shared by NERA – the adjustment was not something which BHM took upon themselves to apply to the Lamberton data. Rather, the data that the ASX provided to BHM had already had been adjusted by the ASX. In other words, the ASX had many years earlier decided in their knowledge and wisdom that some adjustment was necessary and it was the ASX who determined the amount and adjusted the data accordingly.’
We note that the knowledge and wisdom to which Handley refers is summarised by the following message from an employee of the ASX to Brailsford, Handley and Maheswaran: 19
‘the SSE determined that the reported Lamberton/SSE yield series was prima facie not appropriate for the purposes of constructing an accumulation index and ‘it was concluded that the real weighted dividend yield was probably overstated about a third on average and therefore the [Lamberton/SSE yield] was reduced by 25% in the early years of the accumulation index where we didn’t have any other dividend
yields to guide us.’’
[Emphasis added]
This correspondence clearly indicates that in the early years – a period that the SSE does not define in this correspondence – the 75 per cent adjustment factor was not based on any knowledge of the characteristics of the data because the SSE did not have any other dividend yields to guide it. It follows that an examination of earlier data extracted from original sources will almost surely lead to an adjustment that is more accurate than the one contained in the data that Brailsford, Handley and Maheswaran employ. NERA has undertaken such an examination.
Second, Handley (2014) states that: 20
‘NERA have based their conclusion on a comparison of only seven data points – December 1891, December 1901, December 1911, December 1921, December 1931, December 1941 and December 1951 – out of the 300 possible quarters over the period 1883 to 1957. Further, in only four of their data points (December 1891, December 1901, December 1911, December 1921) is their estimated adjustment smaller than the adjustment applied by the ASX.’
18 Handley, J.C., Report prepared for the Australian Energy Regulator: Advice on the return on equity, University of Melbourne, 16 October 2014, page 19.
19 Brailsford, T., J. Handley and K. Maheswaran, Re-examination of the historical equity risk premium in Australia, Accounting and Finance 48, 2008, page 80.
Handley, J.C., Report prepared for the Australian Energy Regulator: Advice on the return on equity, University of Melbourne, 16 October 2014, page 19.
20 Handley, J.C., Report prepared for the Australian Energy Regulator: Advice on the return on equity, University of Melbourne, 16 October 2014, page 19.

Historical Estimates of the Market Risk Premium Executive Summary
NERA Economic Consulting vi
We not only use our analysis of yield data at seven points in time each separated by 10 years but also Brailsford, Handley and Maheswaran’s (2008) analysis of yield data for February 1966. 21 Thus one would expect our estimates of what adjustments should be made to Lamberton’s yields to be more accurate than the adjustment that Brailsford, Handley and Maheswaran employ because we use more data before making our adjustment. Brailsford, Handley and Maheswaran examine what adjustment is required at one point in time – at the very end of the period from 1883 to 1966 – while we examine, in addition, what adjustment is required at seven other points in time scattered approximately evenly over this 75-year period. In five, not four, of these additional points in time our adjustment is smaller than the adjustment that Brailsford, Handley and Maheswaran employ.
Third, Handley (2014) states that: 22
‘NERA have neither used the same sources that Lamberton employed nor have they reconciled their seven dividend yields with the corresponding yields of Lamberton.’
Our October 2013 analysis of the data that Brailsford, Handley and Maheswaran (2012) supply indicates that they did not use Lamberton’s price series. 23 We use the price series that Brailsford, Handley and Maheswaran supply and so we also do not use Lamberton’s price series. Instead we and Brailsford, Handley and Maheswaran use a series – that we label the ASX series – that differs in a significant way at a number of points in time from Lamberton’s series. We do not know whether the differences between the two series represent an elimination of errors in Lamberton’s series or the introduction of errors. Nevertheless, we follow Brailsford, Handley and Maheswaran and use this ASX series. The correlation between the ASX and Lamberton monthly without-dividend returns is 0.95, while the means of the two series are very similar – they are 0.370 and 0.368 per cent per month. We note in our October 2013 report that the relation between the equally weighted average yields that we compute and Lamberton’s series of yields is similarly close. In particular, we note that:
‘The correlation between our estimate of the equally weighted average yield to dividend paying issues (firms) and (Lamberton’s) estimate is 0.93 (0.94) across the seven years we examine. Also, the means of our series come close to matching the mean of his estimates. The mean of our seven estimates of the equally weighted average yield to dividend paying issues (firms) is 7.19 (7.16) while the mean of his seven estimates is 7.09.’
We also note that of the 2,360 observations that we enter, 99.41 per cent are drawn from sources that Lamberton uses.
21 Brailsford, T., J. Handley and K. Maheswaran, Re-examination of the historical equity risk premium in Australia, Accounting and Finance 48, 2008, pages 73-97.
22 Handley, J.C., Report prepared for the Australian Energy Regulator: Advice on the return on equity, University of Melbourne, 16 October 2014, page 19.
23 Brailsford, T., J. Handley and K. Maheswaran, The historical equity risk premium in Australia: Post-GFC and 128
years of data, Accounting and Finance, 2012, pages 237-247.
NERA, The market risk premium: Analysis in response to the AER’s Draft Rate of Return Guidelines, October 2013.
Historical Estimates of the Market Risk Premium Executive Summary
NERA Economic Consulting vii
Finally, Handley (2014) states that: 24
‘More generally, NERA have considered the dividend yield issue in isolation of the other limitations with the historic (sic) data prior to 1958. To claim there is a downward bias in the BHM historic (sic) returns data set would require not only reconstructing the entire historic (sic) dividend yield series but to be sure, would probably require one to reconstruct the entire stock return series along similar lines to what Dimson, Marsh and Staunton have done in relation to U.K. stock return data.’
The almost sole contribution of Brailsford, Handley and Maheswaran (2012) relative to the work of Dimson, Marsh and Staunton (2011) is to provide a series of returns that have been adjusted in the way that Brailsford, Handley and Maheswaran (2008) describe. It is, therefore, quite reasonable that one ask whether the adjustment that Brailsford, Handley and Maheswaran employ is warranted. It is, on the other hand, quite unreasonable to conclude that if one finds that the adjustment that Brailsford, Handley and Maheswaran employ is not fully warranted, then the pre-1958 data should be jettisoned. Unless one can show that there is a systematic bias associated with the older data, then the older data, appropriately adjusted, should be used to sharpen estimates of the MRP.
24 Handley, J.C., Report prepared for the Australian Energy Regulator: Advice on the return on equity, University of Melbourne, 16 October 2014, page 20.
Historical Estimates of the Market Risk Premium Introduction
NERA Economic Consulting 8
1. Introduction
This report has been prepared for Jemena Gas Networks (JGN) by NERA Economic Consulting (NERA). JGN on behalf of itself and Jemena Electricity Networks, ActewAGL, Ausgrid, AusNet Services, Australian Gas Networks, CitiPower, Endeavour Energy, Energex, Ergon, Essential Energy, Powercor, SA Power Networks and United Energy (the network firms) has asked NERA to update the historical estimates of the mean real return to the market and the market risk premium that it provided to the Energy Networks Association (ENA) in 2013 and to respond to matters raised by the Australian Energy Regulator (AER) in its recently published Draft decision Jemena Gas Networks (NSW) Ltd Access arrangement
2015-20, in other recent AER decisions and by the AER’s advisors. 27
JGN submitted its revised Access Arrangement proposal with supporting information for the consideration of the AER on 30 June 2014. The revised access arrangement will cover the period 1 July 2015 to 30 June 2020. The AER published its draft decision on this proposal on 27 November 2014. JGN must submit any additions or other amendments to its proposal by 27 February 2015. The AER also published its other recent draft decisions around the same date.
Two of the key rules relevant to an access arrangement and its assessment are Rules 74 and 87 of the National Gas Rules. Rule 74 of the National Gas Rules, relating generally to forecasts and estimates, states:
(1) Information in the nature of a forecast or estimate must be supported by a statement of the basis of the forecast or estimate.
(2) A forecast or estimate:
(a) must be arrived at on a reasonable basis; and
(b) must represent the best forecast or estimate possible in the circumstances.
27 AER, APT Petroleum Pipeline Pty Ltd Access arrangement draft decision Roma to Brisbane Pipeline 2012–13 to
2016–17, April 2012.
AER, Draft decision | Multinet 2013–17 | Draft decision appendices, September 2012.
AER, Better Regulation Explanatory Statement Rate of Return Guideline (Appendices), December 2013.
Handley, J.C., Report prepared for the Australian Energy Regulator: Advice on the return on equity, University of Melbourne, 16 October 2014.
Lally, M., The cost of equity and the market risk premium, Victoria University of Wellington, 25 July 2012.
Lally, M., Review of submissions to the QCA on the MRP, risk-free rate and gamma, 12 March 2014.
McKenzie, M. and G. Partington, Report to Corrs Chambers Westgarth: Equity market risk premium, 21 December 2011.
McKenzie, M. and G. Partington, Report to the AER: Supplementary report on the equity market risk premium, SIRCA Limited, 22 February 2012.
NERA, The market, size and value premiums: A report for the Energy Networks Association, June 2013.
NERA, The market risk premium, analysis in response to the AER’s draft rate of return guideline: A report for the
Energy Networks Association, 11 October 2013.
Historical Estimates of the Market Risk Premium Introduction
NERA Economic Consulting 9
Rule 87 of the National Gas Rules, relating to the allowed rate of return, states:
(1) Subject to rule 82(3), the return on the projected capital base for each regulatory year of the access arrangement period is to be calculated by applying a rate of return that is determined in accordance with this rule 87 (the allowed rate of return).
(2) The allowed rate of return is to be determined such that it achieves the allowed rate of return objective.
(3) The allowed rate of return objective is that the rate of return for a service provider is to be commensurate with the efficient financing costs of a benchmark efficient entity with a similar degree of risk as that which applies to the service provider in respect of the provision of reference services (the allowed rate of return objective).
(4) Subject to subrule (2), the allowed rate of return for a regulatory year is to be:
(a) a weighted average of the return on equity for the access arrangement period in which that regulatory year occurs (as estimated under subrule (6)) and the return on debt for that regulatory year (as estimated under subrule (8)); and
(b) determined on a nominal vanilla basis that is consistent with the estimate of the value of imputation credits referred to in rule 87A.
(5) In determining the allowed rate of return, regard must be had to:
(a) relevant estimation methods, financial models, market data and other evidence;
(b) the desirability of using an approach that leads to the consistent application of any estimates of financial parameters that are relevant to the estimates of, and that are common to, the return on equity and the return on debt; and
(c) any interrelationships between estimates of financial parameters that are relevant to the estimates of the return on equity and the return on debt.
Return on equity
(6) The return on equity for an access arrangement period is to be estimated such that it contributes to the achievement of the allowed rate of return objective.
(7) In estimating the return on equity under subrule (6), regard must be had to the prevailing conditions in the market for equity funds.
[Subrules (8) – (19) omitted].
The equivalent National Electricity Rules are in clauses 6A.6.2 (for electricity transmission) and 6.5.2 (for electricity distribution).
In its proposal (and that of other regulated energy networks), JGN submitted expert reports that NERA provided to the ENA in 2013 which supplied historical estimates of the mean real
Historical Estimates of the Market Risk Premium Introduction
NERA Economic Consulting 10
return to the market and the market risk premium.29 The estimates included in the reports were used as inputs in determining the return on equity component of the rate of return, in a way that complies with the requirements of the National Gas Law and Rules and National Electricity Law and Rules, including those requirements highlighted above. The AER draft decision considered these earlier NERA reports.
JGN on behalf of itself and Jemena Electricity Networks, ActewAGL, Ausgrid, AusNet Services, Australian Gas Networks, CitiPower, Endeavour Energy, Energex, Ergon, Essential Energy, Powercor, SA Power Networks and United Energy (the network firms) has asked NERA to update the historical estimates of the mean real return to the market and the market risk premium that NERA provided in its earlier reports and to review and respond to matters raised in the draft decision about using these estimates to determine the return on equity. JGN has also asked NERA to respond to issues raised in reports provided by the AER’s advisors.
The remainder of this report is structured as follows:
� section 2 examines arguments for and against using arithmetic means and geometric means in computing historical estimates; and
� section 3 provides updated estimates of the mean real return to the market and the market risk premium that use historical data and responds to issues raised by the AER and its advisors about similar estimates that we have previously provided.
In addition:
� Appendix A provides an analysis of the minor adjustments that the AER makes that involve compounding;
� Appendix B provides the annual data that we construct from 1883 to 2013;
� Appendix C provides the terms of reference for this report;
� Appendix D provides a copy of the Federal Court of Australia’s Guidelines for Expert
Witnesses in Proceeding in the Federal Court of Australia; and
� Appendix E provides the curriculum vitae of the author of the report.
29 NERA, The market, size and value premiums: A report for the Energy Networks Association, June 2013.
NERA, The market risk premium, analysis in response to the AER’s draft rate of return guideline: A report for the
Energy Networks Association, 11 October 2013.
Historical Estimates of the Market Risk Premium Introduction
NERA Economic Consulting 11
Statement of Credentials
This report has been prepared by Simon Wheatley.
Simon Wheatley is an Affiliated Industry Expert with NERA, and was until 2008 a Professor of Finance at the University of Melbourne. Since 2008, Simon has applied his finance expertise in investment management and consulting outside the university sector. Simon’s interests and expertise are in individual portfolio choice theory, testing asset-pricing models and determining the extent to which returns are predictable. Prior to joining the University of Melbourne, Simon taught finance at the Universities of British Columbia, Chicago, New South Wales, Rochester and Washington.
In preparing this report, the author (herein after referred to as ‘I’ or ‘my’ or ‘me’) confirms that I have made all the inquiries that I believe are desirable and appropriate and that no matters of significance that I regard as relevant have, to my knowledge, been withheld from this report. I acknowledge that I have read, understood and complied with the Federal Court of Australia’s Practice Note CM 7, Expert Witnesses in Proceedings in the Federal Court of
Australia. I have been provided with a copy of the Federal Court of Australia’s Practice Note
CM 7, Expert Witnesses in Proceedings in the Federal Court of Australia, dated 4 June 2013, and my report has been prepared in accordance with those guidelines.
I have undertaken consultancy assignments for Jemena in the past. However, I remain at arm’s length, and as an independent consultant.
Historical Estimates of the Market Risk Premium Arithmetic Versus Geometric Averaging
NERA Economic Consulting 12
2. Arithmetic versus Geometric Averaging
The AER, in its Draft decision Jemena Gas Networks (NSW) Ltd Access arrangement 2015-
20, provides estimates of the market risk premium (MRP) computed using both arithmetic means and geometric means. 30
In a March 2012 report we emphasise that an estimate of the long-run weighted average cost of capital (WACC) that is based on the arithmetic mean of a sample of annual excess returns to the market portfolio will – so long as the other components of the WACC have been correctly computed and ignoring minor adjustments to the regulated asset base (RAB) and to the evolution of prices – produce an unbiased estimate of the revenue that the market will require in any one year, in the long run, on the RAB. 31, 32 We also emphasise in the report that, in contrast, an estimate of the WACC that is in part based on an estimate of the MRP that places a positive weight on the geometric mean of a sample of annual excess returns to the market portfolio will produce a downwardly biased estimate of the revenue that the market requires in any one year.
While an estimate of the WACC compounded over more than one year, based on the arithmetic mean of a sample of annual excess returns to the market portfolio, will be biased, the AER, aside from some minor adjustments to the RAB and to the evolution of prices over the regulatory period, never compounds the WACC over more than one year. 33 Thus we recommend that for long-run estimates of the MRP the AER should rely solely on estimates that use arithmetic means and that the AER should place no weight on estimates that use geometric means. An estimate of the MRP that relies solely on estimates that use arithmetic means will provide a materially better estimate than an estimate that relies either fully or in part on geometric means.
In independent advice provided at the AER’s request in July 2012, Associate Professor Lally reaches the same conclusion. He states that: 35
‘The AER’s belief that geometric averages are useful apparently arises from a belief that there is a compounding effect in their regulatory process (AER, 2012, Appendix
30 AER, Draft decision Jemena Gas Networks (NSW) Ltd Access arrangement 2015–20 Attachment 3: Rate of return, November 2014, page 193. The same points are contained in the AER’s other recent draft decisions.
31 NERA, Prevailing conditions and the market risk premium: A report for APA Group, Envestra, Multinet & SP AusNet, March 2012, pages 3-16 and pages 57-59.
32 Appendix A reproduces the analysis from our March 2012 report of the minor adjustments to the RAB and to the evolution of prices that the AER makes.
33 As we note in an August 2011 report, if the excess return to the market portfolio is serially uncorrelated, then an unbiased estimator of a WACC compounded over more than one year will require one use an estimate of the MRP that lies below the arithmetic mean of a sample of annual excess returns to the market portfolio and places a positive weight on the geometric mean. In contrast, if the excess return to the market portfolio is serially uncorrelated, then an unbiased estimator of a discount factor will require one use an estimate of the MRP that exceeds the arithmetic mean of a sample of annual excess returns to the market portfolio and places a negative weight on the geometric mean.
NERA, The market risk premium: A report for CitiPower, Jemena Electricity Networks, Powercor, SP AusNet and
United Energy Distribution, August 2011.
35 Lally, M., The cost of equity and the market risk premium, Victoria University of Wellington, 25 July 2012, pages 31-32.
Historical Estimates of the Market Risk Premium Arithmetic Versus Geometric Averaging
NERA Economic Consulting 13
A.2.1), and therefore the analysis of Blume (1974) and Jacquier et al (2003) applies. However, I do not think that there is any such compounding effect in regulatory situations and the absence of a compounding effect leads to a preference for the arithmetic mean over the geometric mean.’
‘If historical average returns are used, they should be arithmetic rather than geometric averages.’
The AER’s advisors Handley and McKenzie and Partington have not responded to:
• the analysis that we provide in our March 2012 report;
• the analysis that Lally provides in his July 2012 report; or
• additional analysis that we provide in a later June 2013 report
and, as we reveal below, the AER continues to rely on:
• advice that McKenzie and Partington provide in December 2011 and February 2012 reports – that is, reports written before our March 2012 report, Lally’s July 2012 report and our June 2012 report; and
• a decision made by the Australian Competition Tribunal (ACT) in January 2012 – that is, made before our March 2012 report, Lally’s July 2012 report and our June 2012 report.
In what follows we review the advice provided by McKenzie and Partington, the ACT’s decision and the arguments that the AER makes.
2.1. The Views of the ACT, AER and McKenzie and Partington
In their December 2011 report, McKenzie and Partington recognise that an estimate of the WACC compounded over more than one year, based on the arithmetic mean of a sample of annual excess returns to the market portfolio, will be biased. 36 They state, for example that:37
‘The problem with the use of annual arithmetic averages is that compounding an arithmetic average will lead to a bias.’
There is no sign in their December 2011 report, however, that McKenzie and Partington know whether or not the AER ever compounds an arithmetic average. In other words, while McKenzie and Partington recognise in their report that, in principle, compounding an arithmetic average can generate bias, they do not appear to know whether, in practice, the
36 McKenzie, M. and G. Partington, Report to Corrs Chambers Westgarth: Equity market risk premium, 21 December 2011.
37 McKenzie, M. and G. Partington, Report to Corrs Chambers Westgarth: Equity market risk premium, 21 December 2011, page 11.

Historical Estimates of the Market Risk Premium Arithmetic Versus Geometric Averaging
NERA Economic Consulting 14
AER ever compounds an arithmetic average. They conclude their December 2011 analysis with the statement: 38
‘we recommend using the arithmetic average. This recommendation, however, is subject to the caveat that due recognition be given to the likely overestimation bias inherent in the use of the arithmetic average.’
Two months later in their February 2012 report, on the other hand, McKenzie and Partington state that:39
‘We make it clear that the unbiased estimator of the MRP lies between the arithmetic average and the geometric average.’
‘The evidence solidly supports the AER’s position that over the ten year regulatory period the unbiased MRP lies somewhere between the arithmetic average and the geometric average of annual returns.’
The typical regulatory period is, of course, five years and not 10 years. More importantly, McKenzie and Partington do not indicate where in the regulatory process they believe the AER compounds an estimate of the WACC.
Again, as we in our March 2012 report and Lally in his July 2012 report make clear, the AER never – ignoring minor adjustments to the RAB and to the evolution of prices – compounds an estimate of the WACC.
The AER, though, argues in its September 2012 Multinet draft decision that it does compound arithmetic averages. It states that: 40
‘the building block model is a tool to achieve an outcome whereby the present value of expected revenue equals the present value of expected expenditure over the life of the regulated assets. From this perspective, the AER considers an appropriate discount rate requires the evaluation of an expected multi-period cost of equity.’
For this reason, the AER dismisses the concerns that we raise in our March 2012 report. For example, the AER states in its April 2012 Roma to Brisbane draft decision that: 41
‘while the issues are technical and complex, the AER considers NERA's concerns are no longer valid. To determine a profile of revenues in which the NPV=0 outcome holds, an appropriate discount rate must be used, which requires the evaluation of an expected multi-period cost of equity.’
38 McKenzie, M. and G. Partington, Report to Corrs Chambers Westgarth: Equity market risk premium, 21 December 2011, page 12.
39 McKenzie, M. and G. Partington, Report to the AER: Supplementary report on the equity market risk premium, SIRCA Limited, 22 February 2012, pages 5-7.
40 AER, Draft decision | Multinet 2013–17 | Draft decision appendices, September 2012, page 30.
41 AER, APT Petroleum Pipeline Pty Ltd Access arrangement draft decision Roma to Brisbane Pipeline 2012–13 to
2016–17, April 2012, page 294.
Historical Estimates of the Market Risk Premium Arithmetic Versus Geometric Averaging
NERA Economic Consulting 15
Given its own views and the conflicting advice provided by McKenzie and Partington in their December 2011 and February 2012 reports and Lally in his July 2012 report, the AER concludes in its September 2012 Multinet draft decision that: 42
‘the consultants have different views, which need assessing to determine a reasonable approach. In view of the conflicting evidence, the AER considers it should review both arithmetic and geometric averages when considering the historical estimates of the MRP. It is aware of potential deficiencies with both averages, so does not exclusively rely on one or the other.’
In a June 2013 report submitted to the AER we show that use of the revenue equation, the asset-base roll-forward equation and an estimate of the MRP based on the arithmetic mean of a time series of excess returns to the market portfolio imply that, on average, the present value principle will be satisfied. 43 We also show in the report that use of the revenue equation, the asset-base roll-forward equation and an estimate of the MRP that places a positive weight on the geometric mean of a time series of excess returns to the market portfolio imply that, on average, the present value principle will be violated.
The AER has not responded to the analysis in our June 2013 report. Instead the AER states in its JGN draft decision that: 44
‘while SFG only had regard to arithmetic averages; we also have regard to geometric averages. This is consistent with McKenzie and Partington's advice, 'the unbiased estimator of the MRP lies between the arithmetic average and the geometric average'. The Australian Competition Tribunal has found no error with this approach.’
Again, while an estimate of the WACC compounded over more than one year, based on the arithmetic mean of a sample of annual excess returns to the market portfolio, will be biased, the AER, aside from some minor adjustments to the RAB and to the evolution of prices over the regulatory period, never compounds the WACC over more than one year. In addition, the AER has not demonstrated that it compounds the WACC over more than one year and McKenzie and Partington have not demonstrated that the regulator compounds the WACC. In other words, the AER and these two advisors have not pointed to a document or workbook that the regulator has issued that demonstrates that, setting aside minor adjustments to the RAB and to the evolution of prices over the regulatory period, it compounds the WACC.
42 AER, Draft decision | Multinet 2013–17 | Draft decision appendices, September 2012, page 30.
Lally, M., The cost of equity and the market risk premium, Victoria University of Wellington, 25 July 2012.
McKenzie, M. and G. Partington, Report to Corrs Chambers Westgarth: Equity market risk premium, 21 December 2011.
McKenzie, M. and G. Partington, Report to the AER: Supplementary report on the equity market risk premium, SIRCA Limited, 22 February 2012.
43 NERA, The market, size and value premiums: A report for the Energy Networks Association, June 2013, pages 25-30.
44 AER, Draft decision Jemena Gas Networks (NSW) Ltd Access arrangement 2015–20 Attachment 3: Rate of return, November 2014, pages 80-81.
Historical Estimates of the Market Risk Premium Arithmetic Versus Geometric Averaging
NERA Economic Consulting 16
As the AER notes, the Australian Competition Tribunal in January 2012 referred to the issue of whether an estimate of the MRP should use the arithmetic mean of a sample of annual excess returns to the market or a geometric mean. 45 The Tribunal commented that: 46
‘It may be accepted that an arithmetic mean of historic (sic) annual returns is an unbiased estimate of expected future one-year returns. It is not, however, an unbiased estimate of expected future returns over longer time horizons. A geometric mean of historical annual returns does not provide an unbiased estimate of expected returns over longer time horizons, either. Envestra’s submission that, because the CAPM model (sic) uses expected returns, only the arithmetic mean may be used cannot be accepted once it is understood that the arithmetic mean of annual historic (sic) returns is not an unbiased estimate of expected ten year returns.
Once it is accepted that the relevant benchmark is ten year excess returns, considerable thought and effort should be given to deriving the best estimate of expected ten year returns. The material before the Tribunal in this matter does not allow it to decide the issue. Rather, it is a matter that the AER should consider in consultation with service providers and other interested parties.’
The Tribunal, though, without the benefit of the analysis contained in our March 2012 report, Lally’s July 2012 report and our June 2013 report, did not consider in its reasoning the fact that the AER, aside from minor adjustments to the RAB and to the evolution of prices over the regulatory period, never compounds the WACC over more than one year. 47 In other words, in January 2012, the Tribunal did not consider in its reasoning that an arithmetic mean of a series of annual returns being a biased estimator of a 10-year mean return is a red herring.
Even though the AER does not compound the WACC over 10 years, it states in its recent JGN draft decision that: 48
‘We have previously considered arithmetic and geometric averages relevant when estimating a 10 year forward looking MRP using historical annual excess returns. The Australian Competition Tribunal found no error with this approach.’
Since the AER has not responded to the analysis in our June 2013 report, we repeat the analysis here. We do so, however, in such a way as to relate the analysis to the AER’s
45 Australian Competition Tribunal, Application by Envestra Ltd (No 2) [2012] ACompT4, 11 January 2012, paragraphs 151-158.
46 Australian Competition Tribunal, Application by Envestra Ltd (No 2) [2012] ACompT4, 11 January 2012, paragraphs 157-158.
47 NERA, Prevailing conditions and the market risk premium: A report for APA Group, Envestra, Multinet & SP AusNet, March 2012, pages 3-16 and pages 57-59.
Lally, M., The cost of equity and the market risk premium, Victoria University of Wellington, 25 July 2012.
NERA, The market, size and value premiums: A report for the Energy Networks Association, June 2013, pages 25-30.
48 AER, Draft decision Jemena Gas Networks (NSW) Ltd Access arrangement 2015–20 Attachment 3: Rate of return, November 2014, page 196. The same points are contained in the AER’s other recent draft decisions.
Historical Estimates of the Market Risk Premium Arithmetic Versus Geometric Averaging
NERA Economic Consulting 17
recently published amendment to the electricity transmission and distribution post-tax revenue models. 49
2.2. The Bias Produced by Compounding
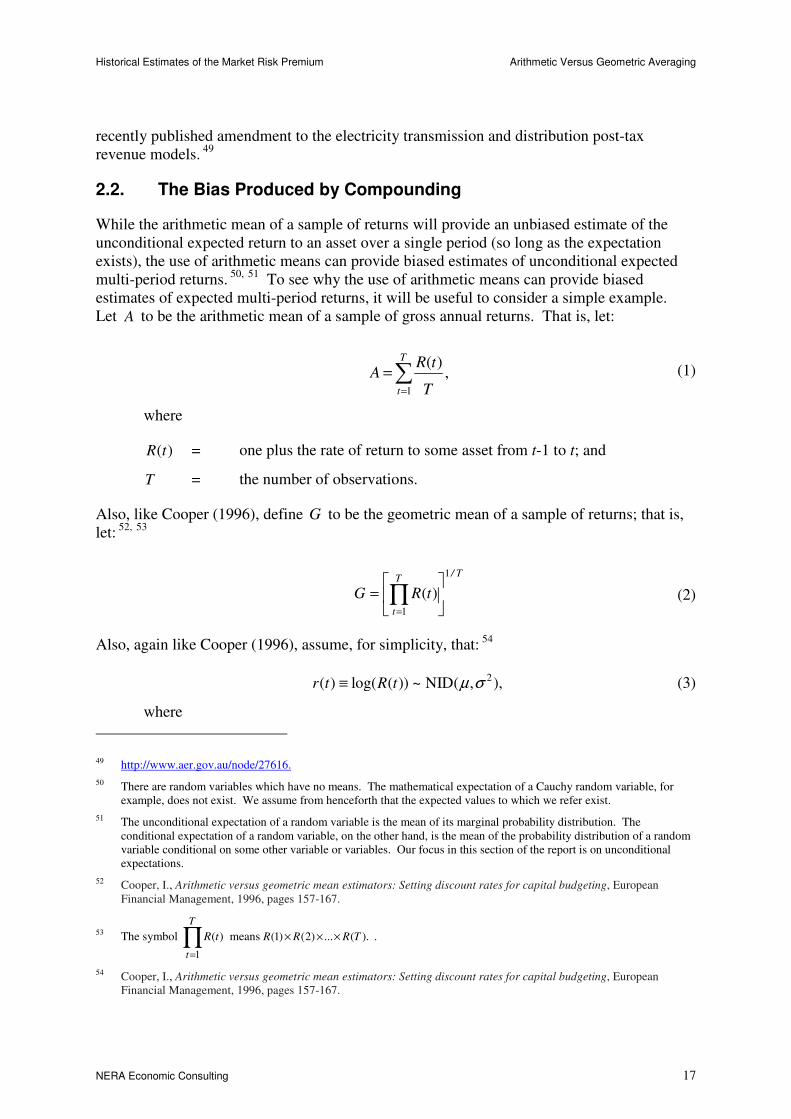
While the arithmetic mean of a sample of returns will provide an unbiased estimate of the unconditional expected return to an asset over a single period (so long as the expectation exists), the use of arithmetic means can provide biased estimates of unconditional expected multi-period returns. 50, 51 To see why the use of arithmetic means can provide biased estimates of expected multi-period returns, it will be useful to consider a simple example. Let A to be the arithmetic mean of a sample of gross annual returns. That is, let:
1
( ),
T
t
R tA
T=
=∑
(1)
where
( )R t = one plus the rate of return to some asset from t-1 to t; and
T = the number of observations.
Also, like Cooper (1996), define G to be the geometric mean of a sample of returns; that is, let: 52, 53
T/T
t
tRG
1
1
)(
= ∏
=
(2)
Also, again like Cooper (1996), assume, for simplicity, that: 54
2( ) log( ( )) ~ NID( , ),r t R t µ σ≡ (3)
where
49 http://www.aer.gov.au/node/27616.
50 There are random variables which have no means. The mathematical expectation of a Cauchy random variable, for example, does not exist. We assume from henceforth that the expected values to which we refer exist.
51 The unconditional expectation of a random variable is the mean of its marginal probability distribution. The conditional expectation of a random variable, on the other hand, is the mean of the probability distribution of a random variable conditional on some other variable or variables. Our focus in this section of the report is on unconditional expectations.
52 Cooper, I., Arithmetic versus geometric mean estimators: Setting discount rates for capital budgeting, European Financial Management, 1996, pages 157-167.
53 The symbol
1
( )
T
t
R t
=
∏ means (1) (2) ... ( ).R R R T× × × .
54 Cooper, I., Arithmetic versus geometric mean estimators: Setting discount rates for capital budgeting, European Financial Management, 1996, pages 157-167.
Historical Estimates of the Market Risk Premium Arithmetic Versus Geometric Averaging
NERA Economic Consulting 18
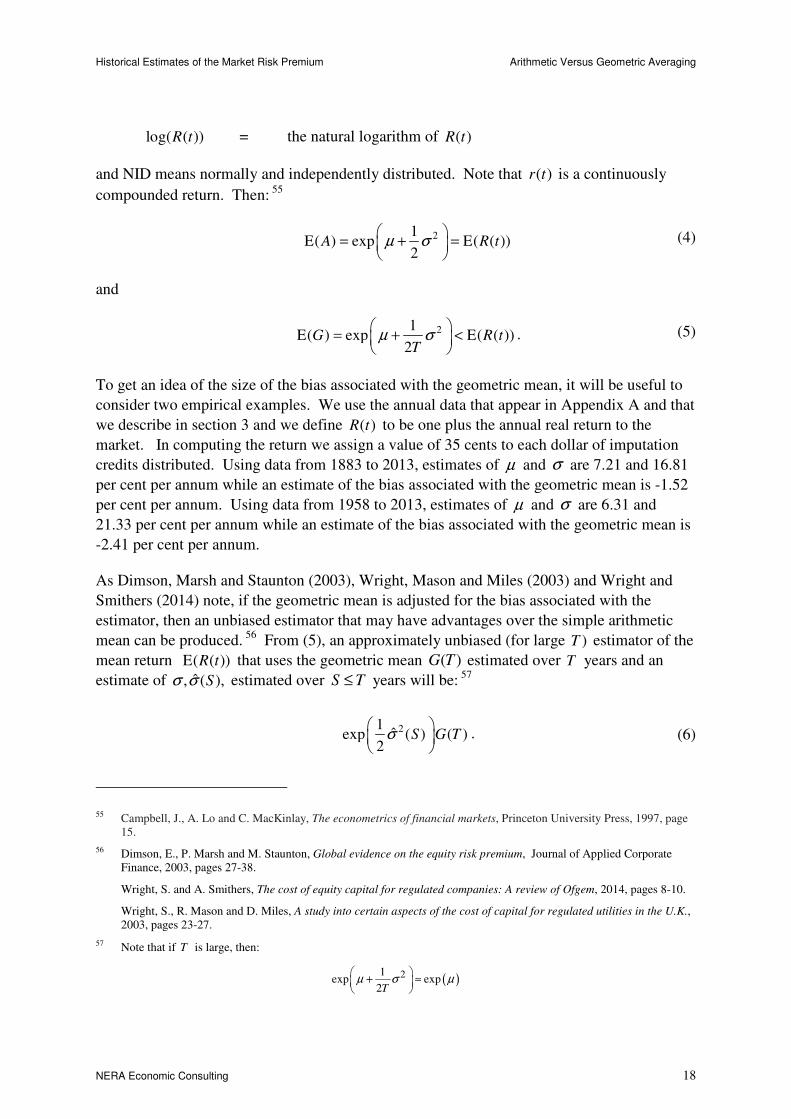
log( ( ))R t = the natural logarithm of ( )R t
and NID means normally and independently distributed. Note that ( )r t is a continuously
compounded return. Then: 55
21E( ) exp E( ( ))
2A R tµ σ
= + =
(4)
and
21E( ) exp E( ( ))
2G R t
Tµ σ
= + <
.
(5)
To get an idea of the size of the bias associated with the geometric mean, it will be useful to
consider two empirical examples. We use the annual data that appear in Appendix A and that
we describe in section 3 and we define ( )R t to be one plus the annual real return to the
market. In computing the return we assign a value of 35 cents to each dollar of imputation
credits distributed. Using data from 1883 to 2013, estimates of µ and σ are 7.21 and 16.81
per cent per annum while an estimate of the bias associated with the geometric mean is -1.52
per cent per annum. Using data from 1958 to 2013, estimates of µ and σ are 6.31 and
21.33 per cent per annum while an estimate of the bias associated with the geometric mean is
-2.41 per cent per annum.
As Dimson, Marsh and Staunton (2003), Wright, Mason and Miles (2003) and Wright and
Smithers (2014) note, if the geometric mean is adjusted for the bias associated with the
estimator, then an unbiased estimator that may have advantages over the simple arithmetic
mean can be produced. 56 From (5), an approximately unbiased (for large )T estimator of the
mean return E( ( ))R t that uses the geometric mean ( )G T estimated over T years and an
estimate of ˆ, ( ),Sσ σ estimated over S T≤ years will be: 57
21ˆexp ( ) ( )
2S G Tσ
.
(6)
55 Campbell, J., A. Lo and C. MacKinlay, The econometrics of financial markets, Princeton University Press, 1997, page 15.
56 Dimson, E., P. Marsh and M. Staunton, Global evidence on the equity risk premium, Journal of Applied Corporate Finance, 2003, pages 27-38.
Wright, S. and A. Smithers, The cost of equity capital for regulated companies: A review of Ofgem, 2014, pages 8-10.
Wright, S., R. Mason and D. Miles, A study into certain aspects of the cost of capital for regulated utilities in the U.K., 2003, pages 23-27.
57 Note that if T is large, then:
( )21exp exp
2Tµ σ µ
+ ≈
Historical Estimates of the Market Risk Premium Arithmetic Versus Geometric Averaging
NERA Economic Consulting 19
If the distribution of the return to the asset does not change through time, there will be no
benefit to using the estimator relative to using the arithmetic mean. If, however, the mean
continuously compounded return µ does not change through time but the volatility σ does
change through time, then there can be a benefit.
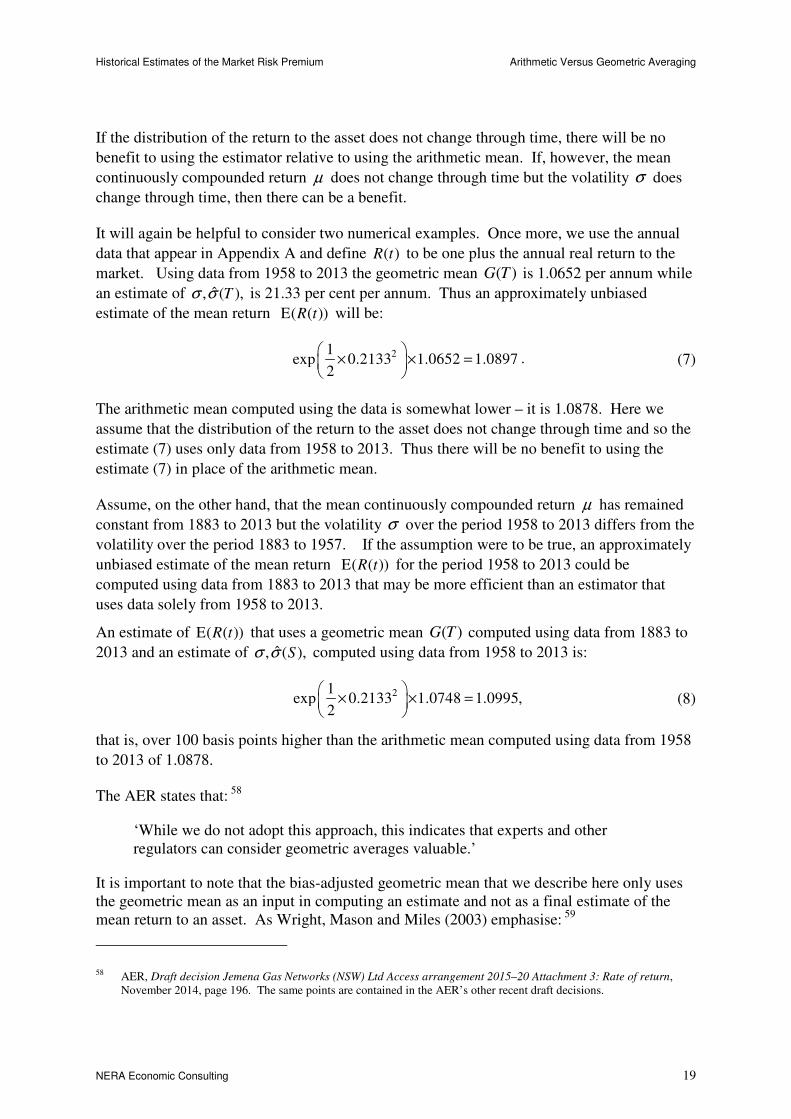
It will again be helpful to consider two numerical examples. Once more, we use the annual
data that appear in Appendix A and define ( )R t to be one plus the annual real return to the
market. Using data from 1958 to 2013 the geometric mean ( )G T is 1.0652 per annum while
an estimate of ˆ, ( ),Tσ σ is 21.33 per cent per annum. Thus an approximately unbiased
estimate of the mean return E( ( ))R t will be:
21exp 0.2133 1.0652 1.0897
2
× × =
.
(7)
The arithmetic mean computed using the data is somewhat lower – it is 1.0878. Here we
assume that the distribution of the return to the asset does not change through time and so the
estimate (7) uses only data from 1958 to 2013. Thus there will be no benefit to using the
estimate (7) in place of the arithmetic mean.
Assume, on the other hand, that the mean continuously compounded return µ has remained
constant from 1883 to 2013 but the volatility σ over the period 1958 to 2013 differs from the
volatility over the period 1883 to 1957. If the assumption were to be true, an approximately
unbiased estimate of the mean return E( ( ))R t for the period 1958 to 2013 could be
computed using data from 1883 to 2013 that may be more efficient than an estimator that
uses data solely from 1958 to 2013.
An estimate of E( ( ))R t that uses a geometric mean ( )G T computed using data from 1883 to
2013 and an estimate of ˆ, ( ),Sσ σ computed using data from 1958 to 2013 is:
21exp 0.2133 1.0748 1.0995,
2
× × =
(8)
that is, over 100 basis points higher than the arithmetic mean computed using data from 1958
to 2013 of 1.0878.
The AER states that: 58
‘While we do not adopt this approach, this indicates that experts and other regulators can consider geometric averages valuable.’
It is important to note that the bias-adjusted geometric mean that we describe here only uses the geometric mean as an input in computing an estimate and not as a final estimate of the mean return to an asset. As Wright, Mason and Miles (2003) emphasise: 59
58 AER, Draft decision Jemena Gas Networks (NSW) Ltd Access arrangement 2015–20 Attachment 3: Rate of return, November 2014, page 196. The same points are contained in the AER’s other recent draft decisions.
Historical Estimates of the Market Risk Premium Arithmetic Versus Geometric Averaging
NERA Economic Consulting 20
‘There is no doubt that the ultimate aim must be to derive an estimate of the arithmetic mean return, since, as noted above, this corresponds to the theoretically desirable true expectation.’
In other words, Wright, Mason and Miles are not advocating that a regulator place a weight on the geometric mean of a series of returns. Cooper (2004) makes this clear in a submission to the British regulator Ofcom: 60
‘Ofcom places weight on the geometric mean of historical returns, which is about two percent lower than the arithmetic mean. For its reliance on this number, it depends on Wright et al. Yet these authors favour the use of the geometric mean only as an interim step in the calculation of the arithmetic mean, not as an estimate in its own right, as used by Ofcom. Dimson et al reach a similar conclusion, and the vast majority of experts argue that unadjusted geometric averages are not the correct ones to use in setting the cost of capital for the application envisaged by Ofcom.’
Use of an adjusted geometric mean represents a reasonable alternative to the use of an arithmetic mean but we agree with Wright, Mason and Miles (2003) that trying to distinguish between the hypotheses that the mean continuously compounded return has remained constant through time and that the mean not continuously compounded return has remained constant through time will be difficult. 61
2.3. The AER Never Compounds
Our advice that for long-run estimates of the MRP the AER should rely solely on estimates that use arithmetic means and that the AER should place no weight on estimates that use geometric means arises from the observation that the AER never compounds an estimate of the MRP. To see that – aside from minor adjustments to the RAB and to the evolution of prices – the AER never compounds an estimate of the MRP, it will be helpful to understand how the present value principle and the revenue equation are linked.
The present value principle requires that:
59 Wright, S., R. Mason and D. Miles, A study into certain aspects of the cost of capital for regulated utilities in the U.K., 2003, pages 23-27.
60 Cooper, I., Comments on the Ofcom consultation document: Ofcom’s approach to risk in the assessment of the cost of capital. The equity market risk premium, London Business School, February 18 2004, page 10.
61 Wright, S., R. Mason and D. Miles, A study into certain aspects of the cost of capital for regulated utilities in the U.K., 2003, page 27.

Historical Estimates of the Market Risk Premium Arithmetic Versus Geometric Averaging
NERA Economic Consulting 21
,)(1
))5(E(
)(1
))(E())(E())(E())(E(
)(
5
5
1s
WACC
tRAB
WACC
stTAXstOPEXstCAPEXstREV
tRAB
s
+
++
+
+−+−+−+
=
∑=
(9)
where
( )RAB t = the regulated asset base of the firm at the end of year ;t
( )REV t = the firm’s revenue in year ;t
( )CAPEX t = capital expenditure in year ;t
( )OPEX t = operating expenditure in year ;t
( )TAX t = company tax paid in year ;t and
WACC = the firm’s WACC – a parameter unknown to the regulator.
Equation (9) states that the discounted value of the revenues that the RAB is expected to generate over the five years of the regulatory period plus the discounted value of the RAB five years from now must match the RAB today.
The present value principle also requires that:
5
1s 2
4
E( ( 1))
E( ( )) E( ( )) E( ( )) E( ( ))
(1 )
E( ( 5)),
(1 )
s
RAB t
REV t s CAPEX t s OPEX t s TAX t s
WACC
RAB t
WACC
−=
+ =
+ − + − + − +
+
++
+
∑
(10)
Multiplying (9) by (1 )WACC+ and then subtracting (10) from the result yields:
(1 ) ( ) E( ( 1))
E( ( 1)) E( ( 1)) E( ( 1)) E( ( 1))
WACC RAB t RAB t
REV t CAPEX t OPEX t TAX t
+ × − +
= + − + − + − +
(11)
The evolution of the RAB, however, is governed by the asset-base roll-forward equation:
( 1) ( ) ( 1) ( 1)RAB t RAB t CAPEX t DEP t+ = + + − + (12)
where
( )DEP t = depreciation in year t.
So, from (11) and (12), the present value principle requires that:
Historical Estimates of the Market Risk Premium Arithmetic Versus Geometric Averaging
NERA Economic Consulting 22
E( ( 1)) ( ) E( ( 1))
E( ( 1)) E( ( 1))
REV t WACC RAB t DEP t
OPEX t TAX t
+ = × + +
+ + + +
(13)
Equation (13) is the revenue equation and states that the revenue that the firm must earn must provide for a fair return on its assets, must cover the depreciation through time of those assets and must cover the firm’s operating expenditure and the taxes that it must pay. It is straightforward to show that a condition similar to (13) must hold for revenue in each year
, 1.t s s+ > So, if in each year revenue is generated using the revenue equation, then the present value principle will be satisfied.
If the regulator were to use, instead of (13), the revenue equation:
E( ( 1)) ( ) E( ( 1))
E( ( 1)) E( ( 1))
REV t ANYK RAB t DEP t
OPEX t TAX t
+ = × + +
+ + + +
(14)
where ANYK WACC≠ represents a return on the firm’s assets that is not a fair return, then, in general, the present value principle (9) would not be satisfied. The condition:
5
s 1
5
( )
E( ( )) E( ( )) E( ( )) E( ( ))
(1 )
E( ( 5)),
(1 )
s
RAB t
REV t s CAPEX t s OPEX t s TAX t s
ANYK
RAB t
ANYK
=
=
+ − + − + − +
+
++
+
∑
(15)
would, however, be satisfied. The right-hand side of (15), though, will not represent the discounted value of the revenues that the RAB is expected to generate over the five years of the regulatory period plus the discounted value of the RAB five years from now because
.ANYK WACC≠
In cell F64 of the worksheet ‘Analysis’ in the recently released workbook ‘Distribution post-tax revenue model - Version 3 - January 2015 - Appendix B.xlsm’ the AER checks that a condition like (15) is satisfied. 62 The asset-base roll-forward equation together with the revenue equation (14) dictate that the condition must be satisfied regardless of the properties
of the estimator .ANYK In other words, checking that the condition (15) is satisfied will
reveal nothing about the properties of the estimator .ANYK It is the properties of the estimator that a regulator employs that is our primary concern, however, and it is to this issue that we now turn.
Suppose that the regulator chooses to use the estimator AERK. Then expected revenue in
year t s+ will be:
62 http://www.aer.gov.au/node/27616.
Historical Estimates of the Market Risk Premium Arithmetic Versus Geometric Averaging
NERA Economic Consulting 23
,stTAXstOPEX
stDEPstRABAERKstREV
))(E())(E(
))(E())1(E())(E(
++++
++−+×=+
(16)
Note that, unlike the true WACC, AERK is not a parameter but is instead an estimator. In other words, AERK is a random variable. Substitution of the revenue equation (16) into the present value condition (9) yields:
,)(1
))5(E(
)(1
))EP(E())(E())1(E(
)(
5
5
1s
WACC
tRAB
WACC
stDstCAPEXstRABAERK
tRAB
s
+
+
+
+++−−+×
=
∑=
(17)
Substitution of the asset-base roll-forward equation (12) into the present value condition (17) yields the condition:
∑=
=+
−+−
5
1s
0)(1
))1(E()(
sWACC
stRABWACCAERK
(18)
This condition will be satisfied only if the value for the WACC that the regulator chooses, AERK, matches the firm’s WACC. The condition will be satisfied on average only if the value for the WACC that the regulator chooses, AERK, matches the firm’s WACC on average, that is, only if:
WACCAERK =)E( (19)
This condition states that the value for the one-period WACC that the regulator chooses, AERK, must be an unbiased predictor of the firm’s true one-period WACC. An estimate of the WACC that is based on the arithmetic mean of a sample of annual excess returns to the market portfolio will produce an unbiased estimate of the true WACC and so will lead the present value principle to be on average satisfied. In contrast, an estimate of the WACC that is based on an estimate of the MRP that places a positive weight on the geometric mean of a sample of annual excess returns to the market portfolio will produce a downwardly biased estimate of the true WACC and will lead the present value principle to be on average violated.
The return on capital typically makes up the largest single component of the building block revenue requirement and row 25 of the worksheet ‘Analysis’ in the recently released workbook ‘Distribution post-tax revenue model - Version 3 - January 2015 - Appendix B.xlsm’ clearly shows that in determining the return on equity the AER never compounds the
Historical Estimates of the Market Risk Premium Arithmetic Versus Geometric Averaging
NERA Economic Consulting 24
return on equity. 63, 64 In any year the return on equity is simply the product of the start-of-period equity portion of the RAB and the annual cost of equity – not compounded in any way.
63 For example, in the worksheet ‘Outputs|Revenue’ of the workbook ‘AER - Jemena Gas 2014 - total revenue - AER draft decision - Revenue model (public) - November 2014.xlsm’ the return on capital, depreciation, operating expenditure and taxes for the year 2016 represent $208.41 million, $64.40 million, $156.05 million and $8.77 million of a total revenue requirement of $437.63 million.
http://www.aer.gov.au/node/24741.
64 http://www.aer.gov.au/node/27616.
Historical Estimates of the Market Risk Premium Historical Estimates of the Market Risk Premium
NERA Economic Consulting 25
3. Historical Estimates of the Market Risk Premium
The AER, in its Draft decision Jemena Gas Networks (NSW) Ltd Access arrangement 2015-
20, provides estimates of the MRP computed using data that Brailsford, Handley and Maheswaran (2012) supply and that the AER updates. 65 The AER reports that an estimate of the MRP from 1883 to 2013 based on an arithmetic mean and the data is 6.3 per cent per annum under the assumption that a one dollar imputation credit distributed is worth 60 cents. In contrast, Dimson, Marsh and Staunton (2014) report that an estimate of the MRP from 1900 to 2013 based on an arithmetic mean and an alternative set of data is 7.0 per cent per annum under the assumption that the market places no value on imputation credits distributed. 66
The difference between the two estimates is largely explained by differences in the way in which the dividends distributed by a value-weighted portfolio of Australian stocks were determined by those who provided the data to the two sets of authors. 67 Dimson, Marsh and Staunton (2014) use a series of dividend yields provided to them by Professor Robert Officer of the University of Melbourne that is largely based on a series produced by Lamberton (1961). 68 Donald Lamberton (later a Professor of Economics at the University of Queensland) worked in the Research and Statistical Bureau of the Sydney Stock Exchange (SSE) from 1949 to 1953. 69 Brailsford, Handley and Maheswaran (2012) use a series of yields reportedly provided to them by an employee of the Australian Stock Exchange (ASX) with the yield series also largely based on Lamberton’s data. 70 The yields that Brailsford, Handley and Maheswaran use, however, have been adjusted downwards to take account of perceived deficiencies in the series that Lamberton provides. These deficiencies are that Lamberton’s yields are equally weighted, use only stocks that pay dividends and use more stocks than do the price indices which were also constructed by Lamberton (1958) for the SSE. The SSE price indices are employed by both Brailsford, Handley and Maheswaran and
65 AER, Draft decision Jemena Gas Networks (NSW) Ltd Access arrangement 2015–20 Attachment 3: Rate of return, November 2014, page 193. The same points are contained in the AER’s other recent draft decisions.
Brailsford, T., J. Handley and K. Maheswaran, The historical equity risk premium in Australia: Post-GFC and 128
years of data, Accounting and Finance, 2012, pages 237-247.
66 Dimson, E., P. Marsh and M. Staunton, Credit Suisse Global investment returns sourcebook 2014, Credit Suisse, February 2014.
67 Other factors affecting the difference are the different time periods that the AER and Dimson, Marsh and Staunton use, differences in the way that Brailsford, Handley and Maheswaran and Dimson, Marsh and Staunton compute bond returns and a difference in the assumption made about the value placed by the market on imputation credits distributed.
68 Dimson, E., P. Marsh and M. Staunton, Credit Suisse Global investment returns sourcebook 2014, Credit Suisse, February 2014.
Lamberton, D., Ordinary share yields: A new statistical series, Sydney Stock Exchange Official Gazette, 14 July 1961.
69 Lodewijks, J., Professor of foresight: An Interview with Donald Lamberton, Journal of Economic and Social Policy, 2007.
70 Brailsford, T., J. Handley and K. Maheswaran, The historical equity risk premium in Australia: Post-GFC and 128
years of data, Accounting and Finance, 2012, pages 237-247.
Historical Estimates of the Market Risk Premium Historical Estimates of the Market Risk Premium
NERA Economic Consulting 26
Dimson, Marsh and Staunton for years prior to 1958. 71 The yields that Dimson, Marsh and Staunton use have not been adjusted.
In June 2013 and October 2013 submissions to the AER on behalf of the ENA, NERA assesses whether the adjustment to Lamberton’s (1961) yield series over the period 1883 to 1957 in the data that Brailsford, Handley and Maheswaran (2012) employ is fully warranted and provide evidence that it is not. 72 Our evidence suggests that some adjustment should be made to Lamberton’s data but that the adjustment should be smaller than the adjustment made to the data with which Brailsford, Handley and Maheswaran were provided. An estimate of the downwards bias generated by the inappropriate adjustment of Lamberton’s yield series in Brailsford, Handley and Maheswaran’s data is only 18 basis points for the period that Dimson, Marsh and Staunton examine, 1900 to 2012, but is 36 basis points for the longer period, 1883 to 2012.
The estimates of the downward bias in our 2013 reports rely on Lamberton’s series, Brailsford, Handley and Maheswaran’s (2008) analysis of yield data for February 1966, our analysis of yield data for December 1891, December 1901, December 1911, December 1921, December 1931, December 1941, December 1951 and interpolation. 73
Here we update the data that we provide in our October 2013 report to the end of 2013. We find that to the nearest basis point, the downwards bias generated by the inappropriate adjustment of Lamberton’s yield series in Brailsford, Handley and Maheswaran’s data is 18 basis points for the period that Dimson, Marsh and Staunton examine, 1900 to 2013, and is 36 basis points for the longer period, 1883 to 2013. An estimate of the MRP based on an arithmetic mean using data for the period 1883 to 2013, appropriately adjusted is 6.56 per annum under the assumption that a one dollar imputation credit distributed is worth 35 cents.74
Before we discuss how we update the data, we respond to issues raised by the AER and its advisors.
71 Lamberton, D., Security prices and yields, Sydney Stock Exchange Official Gazette, 14 July 1958.
Lamberton, D., Share price indices in Australia, Sydney: Law Book Company, 1958.
72 Brailsford, T., J. Handley and K. Maheswaran, The historical equity risk premium in Australia: Post-GFC and 128
years of data, Accounting and Finance, 2012, pages 237-247.
Lamberton, D., Ordinary share yields: A new statistical series, Sydney Stock Exchange Official Gazette, 14 July 1961.
NERA, Market, size and value premiums: A report for the ENA, June 2013.
NERA, The market risk premium: Analysis in response to the AER’s Draft Rate of Return Guidelines, October 2013.
73 Brailsford, T., J. Handley and K. Maheswaran, Re-examination of the historical equity risk premium in Australia, Accounting and Finance 48, 2008, pages 73-97.
74 An estimate of the MRP based on an arithmetic mean using data appropriately adjusted is 6.65 per annum under the assumption that a one dollar imputation credit distributed is worth 60 cents. An estimate of the MRP based on an arithmetic mean using data appropriately adjusted is 6.44 per annum under the assumption that the market places no value on imputation credits distributed.
Historical Estimates of the Market Risk Premium Historical Estimates of the Market Risk Premium
NERA Economic Consulting 27
3.1. Lally
The AER’s advisor, Associate Professor Lally, in detailed advice provided in May 2014 to the Queensland Competition Authority, states that: 75
‘In forming their Ibbotson-type estimate of the MRP for Australia, using data from 1883, Brailsford et al (2008, section 3.2.1) use dividend yield data from Lamberton (1958) over the period 1883-1957 subject to reducing his dividend yields by 25% to account for Lamberton’s exclusion of zero-dividend stocks and use of an equally-weighted rather than a value-weighted average. The 25% reduction was an adjustment used by the Sydney Stock Exchange (SSE) and tested for reasonableness by Brailsford et al (2008, section 3.2.1). Their principal test was to compare the value-weighted dividend yield on all stocks with the dividend yield used by the SSE for February 1966, and this revealed that a downward adjustment of 33% was required to the latter. So, a deduction of 25% would seem to be conservative. NERA (2013, section 2) extends this testing process to the years 1891, 1901, 1911, 1921, 1931, 1941, and 1951 and concludes that the downward adjustment should have typically been less than 25%.’
‘Clearly, NERA’s process is superior to that of Brailsford et al (2008) because NERA examine results for seven years rather than only one month and these years are all within the relevant period (1883-1957). However, the seven years examined represent only seven of the 75 years in question. Thus, whilst they represent the best available estimate of the required correction to Lamberton’s work, they are inadequate in any absolute sense, i.e., each of the 75 years ought to have been adjusted in this way.’
‘In summary, the dividend adjustment proposed by NERA is better supported than that of Brailsford et al (2008). However neither is satisfactory in an absolute sense and both reflect adversely upon the quality of the data used (up until 1958) in estimating the MRP via the use of historical data.’
Lally makes a number of points and we respond to each in turn.
First, a general rule in statistics is that more data is better than less data unless there is something wrong with the data. Thus Lally rightly concludes that the adjustment that we make is better supported than the adjustment that Brailsford, Handley and Maheswaran make. We note, however, that we use not only our analysis of yield data at seven points in time each separated by 10 years but also Brailsford, Handley and Maheswaran’s (2008) analysis of yield data for February 1966. 76 Thus we state in our June 2013 report: 77
‘Our estimates of the downward bias rely on Lamberton’s series, Brailsford, Handley and Maheswaran’s analysis of yield data for February 1966, our analysis of yield data for December 1891, December 1901, December 1911, December 1921, December 1931, December 1941, December 1951 and interpolation.’
75 Lally, M., Review of submissions to the QCA on the MRP, risk-free rate and gamma, 12 March 2014, pages 5-6.
76 Brailsford, T., J. Handley and K. Maheswaran, Re-examination of the historical equity risk premium in Australia, Accounting and Finance 48, 2008, pages 73-97.
77 NERA, Market, size and value premiums: A report for the ENA, June 2013, page 4.
Historical Estimates of the Market Risk Premium Historical Estimates of the Market Risk Premium
NERA Economic Consulting 28
Second, Lally suggests that while our estimates represent the best available correction to Lamberton’s work, we should have examined more data. Again, more data are better than less data – there are, however, costs to collecting data and it is unclear how large the benefits of collecting more data would be. The evidence that we provide in our June 2013 and October 2013 reports suggests that the adjustment required of Lamberton’s series of yields drifts slowly through time. 78 It appears that the required adjustment has been slowly increasing through time – our evidence suggests that the adjustment required in December 1891 was to reduce Lamberton’s yield by around 5 per cent while the evidence that Brailsford, Handley and Maheswaran provide suggests that the adjustment required in February 1966 was to reduce the SSE yield by 33 per cent. If the adjustment required drifts slowly through time, then there will be very few benefits to collecting more data because interpolation will be a good substitute for collecting more data.
To provide an idea of just how small the benefit might be to collecting more data and how effective interpolation might be, it will be useful to describe how we went about examining what adjustments are required for Lamberton’s yields. We began the exercise by examining a single year – 1891. 80 We found that the necessary adjustment to make to Lamberton’s yield data for the last quarter of this year was to multiply his yield by 0.9543. Brailsford, Handley and Maheswaran’s (2008) analysis of yield data for February 1966 suggests that for that month the necessary adjustment is to multiply Lamberton’s yield by 0.67. Using these two adjustment factors and interpolation, we concluded that an estimate of the downwards bias generated by the inappropriate adjustment of Lamberton’s yield series was 42 basis points for the period 1883 to 2012. It is also 42 basis points – rounded to the nearest basis point – for the period 1883 to 2013. We subsequently collected data for six additional years, distributed approximately evenly over the period 1891 to 1966, and found that with these additional data an estimate of the downwards bias for the period 1883 to 2012 fell by just six basis points – an estimate of the bias for the period 1883 to 2013 also falls by six basis points. Thus our experience suggests that the benefits to collecting more data are likely to be very small.
Third, Lally suggests that the quality of the data before 1958 is low. While the quality of the data may be lower than the quality of recent data, there are large benefits to using the earlier data. The use of the earlier data allows one to compute a far more precise estimate of the MRP than can be computed using data only from 1958 onwards. This result arises partly because using a longer time series allows one to compute a more precise estimate of the MRP but also partly because, for reasons that are unclear, returns before 1958 are considerably less volatile than from 1958 onwards. 81
78 See, for example, Figure 2.1 in our June 2013 report reproduced as Figure 3.1 below.
NERA, Market, size and value premiums: A report for the ENA, June 2013, page 14.
80 We chose the year 1891 and the subsequent years 1901, 1911 and so on because these are the years in which censuses of the population were first carried out – first, in the Australian colonies and then in the Federation – and the exercise that we carry out resembles taking a series of censuses.
81 NERA, The market risk premium: A report for CitiPower, Jemena Electricity Networks, Powercor, SP AusNet and
United Energy Distribution, August 2011.
Historical Estimates of the Market Risk Premium Historical Estimates of the Market Risk Premium
NERA Economic Consulting 29
As Goetzmann and Ibbotson (2007) emphasise: 82
‘One of the major issues with statistical estimation of the realized equity risk premium is that a very long time series of stationary returns is required to achieve a high degree of confidence in the estimate. The longer the data series, the more accurate the equity risk premium calculation, as long as the fundamental expectations have remained the same.’
We report estimates of the MRP below that use the longest time series available to us and recommend that the AER – to the extent that it uses historical estimates of the MRP, mean real return on the market or mean nominal return on the market – rely on estimates that use the longest time series available.
3.2. Handley
Handley (2014) raises four concerns about our June 2013 and October 2013 submissions and we respond to each of these in turn. 83
First, Handley (2014) states that: 84
‘Before addressing NERA’s analysis, it is appropriate to clarify a very important misconception concerning the adjustment. Contrary to the claim by SFG – and it is not clear whether this view is also shared by NERA – the adjustment was not something which BHM took upon themselves to apply to the Lamberton data. Rather, the data that the ASX provided to BHM had already had been adjusted by the ASX. In other words, the ASX had many years earlier decided in their knowledge and wisdom that some adjustment was necessary and it was the ASX who determined the amount and adjusted the data accordingly. BHM simply sought to confirm their understanding of the data series provided by the ASX by reconciling it back to original sources.’
We note in our June 2013 report that Brailsford, Handley and Maheswaran make clear that the adjusted data were provided to them by an employee of the Australian Stock Exchange (ASX). In particular, we state that: 85
‘Brailsford, Handley and Maheswaran (2008, 2012) use data provided to them by the Australian Stock Exchange. Surprisingly, when we asked the Australian Stock Exchange for the data and a description of how the data were constructed, we were told no reference to the data provided to Brailsford, Handley and Maheswaran could be found.’
‘To be precise, we sent an email to the ASX on 17 August 2011 stating that:
82 Goetzmann, W.N. and R.G. Ibbotson, The equity premium over the very long run, in Handbook of the equity premium, ed. R. Mehra, Elsevier Science, 2007, Chapter 12.
83 Handley, J.C., Report prepared for the Australian Energy Regulator: Advice on the return on equity, University of Melbourne, 16 October 2014, pages 18-20.
84 Handley, J.C., Report prepared for the Australian Energy Regulator: Advice on the return on equity, University of Melbourne, 16 October 2014, page 19.
85 NERA, Market, size and value premiums: A report for the ENA, June 2013, page 6.
Historical Estimates of the Market Risk Premium Historical Estimates of the Market Risk Premium
NERA Economic Consulting 30
‘(we) would like to know from where the data Brailsford, Handley and Maheswaran are using came. They say the ASX but you tell (us) you know nothing about the data’
and were told by the ASX in an email dated 25 August 2011 that:
‘the employee of the ASX who specialises in the field of Index Data is Brian Goodman ... he could not find any reference to the indices mentioned in your email dated August 15.’
This correspondence does not imply that Brailsford, Handley and Maheswaran did not correspond with the ASX. It implies only that the ASX either do not possess or cannot find the data provided to Brailsford, Handley and Maheswaran.’
We note here that the knowledge and wisdom to which Handley refers is summarised by the following message from an employee of the ASX to Brailsford, Handley and Maheswaran: 86
‘the SSE determined that the reported Lamberton/SSE yield series was prima facie not appropriate for the purposes of constructing an accumulation index and ‘it was concluded that the real weighted dividend yield was probably overstated about a third on average and therefore the [Lamberton/SSE yield] was reduced by 25% in the early years of the accumulation index where we didn’t have any other dividend
yields to guide us.’’
[Emphasis added]
This correspondence clearly indicates that in the early years – a period that the SSE does not define in this correspondence – the 75 per cent adjustment factor was not based on any specific knowledge of the characteristics of the data because the SSE did not have any dividend yields to guide it.
A final point to make in regards to the issue of the origin of the yield adjustment that Brailsford, Handley and Maheswaran employ is that neither Brailsford, Handley and Maheswaran (2008) nor Brailsford, Handley and Maheswaran (2012) cite any publication produced by either the ASX or the SSE that uses the adjustment. 87 We have been similarly unable to find a publication authored by either the ASX or the SSE that uses the adjustment. Regardless of this issue, however, it remains a fact that the correspondence to which Brailsford, Handley and Maheswaran refer indicates that the adjustment was made without a knowledge of the characteristics of the early data. It follows that an examination of early data extracted from original sources will almost surely lead to an adjustment that is more accurate than the one contained in the data that Brailsford, Handley and Maheswaran employ.
86 Brailsford, T., J. Handley and K. Maheswaran, Re-examination of the historical equity risk premium in Australia, Accounting and Finance 48, 2008, page 80.
Handley, J.C., Report prepared for the Australian Energy Regulator: Advice on the return on equity, University of Melbourne, 16 October 2014, page 19.
87 Brailsford, T., J. Handley and K. Maheswaran, Re-examination of the historical equity risk premium in Australia, Accounting and Finance 48, 2008, pages 73-97.
Brailsford, T., J. Handley and K. Maheswaran, The historical equity risk premium in Australia: Post-GFC and 128
years of data, Accounting and Finance, 2012, pages 237-247.
Historical Estimates of the Market Risk Premium Historical Estimates of the Market Risk Premium
NERA Economic Consulting 31
The second concern expressed by Handley (2014) is that: 88
‘NERA have based their conclusion on a comparison of only seven data points – December 1891, December 1901, December 1911, December 1921, December 1931, December 1941 and December 1951 – out of the 300 possible quarters over the period 1883 to 1957. Further, in only four of their data points (December 1891, December 1901, December 1911, December 1921) is their estimated adjustment smaller than the adjustment applied by the ASX.’
As we make clear above, we use not only our analysis of yield data at seven points in time each separated by 10 years but also Brailsford, Handley and Maheswaran’s (2008) analysis of yield data for February 1966. 89 Thus one would expect our estimates of what adjustments should be made to Lamberton’s yields to be more accurate than the adjustment that Brailsford, Handley and Maheswaran employ because we use more data. Brailsford, Handley and Maheswaran examine what adjustment is required at one point in time – at the very end of the period from 1883 to 1966 – while we examine, in addition, what adjustment is required at seven other points in time scattered approximately evenly over this 75-year period.
Table 3.1 below shows the yields that Lamberton (1961) reports, the yields that we compute and the yields that Brailsford, Handley and Maheswaran (2008) use in conjunction with the adjustment factors that we compute and the single adjustment factor that Brailsford, Handley and Maheswaran employ. The table shows that five, rather than four, of the adjustment factors that we compute exceed the adjustment factor that Brailsford, Handley and Maheswaran use. The table also shows that the adjustment factors tend to be higher in the early data when yields are high. The impact of this relation between adjustment factors and yields is to magnify the impact on the MRP of the difference between the adjustment factors that we compute and the single adjustment factor upon which Brailsford, Handley and Maheswaran rely.
To produce an estimate of the adjustment that should be made to Lamberton’s data each year to reflect our analysis and the analysis of Brailsford, Handley and Maheswaran (2008), we use linear interpolation. 90 Figure 3.1 plots the adjustment factors that we produce in this way against time. To be conservative, we do not use extrapolation to estimate the adjustment factor before 1891 but instead use the 1891 adjustment factor of 95.43 per cent. Again, we use not only the seven adjustment factors that appear in Table 3.1 but the estimate of 0.670 that Brailsford, Handley and Maheswaran produce for February 1966.
Since the unadjusted Lamberton yield declines through time, the adjusted yield that we compute – the product of the unadjusted yield and the adjustment factor shown in Figure 3.1 – declines at an even faster pace. This feature of the data is illustrated in Figure 3.2. In addition, as we already note, the impact on the arithmetic mean of the yields of adjusting the
88 Handley, J.C., Report prepared for the Australian Energy Regulator: Advice on the return on equity, University of Melbourne, 16 October 2014, page 19.
89 Brailsford, T., J. Handley and K. Maheswaran, Re-examination of the historical equity risk premium in Australia, Accounting and Finance 48, 2008, pages 73-97.
90 Brailsford, T., J. Handley and K. Maheswaran, Re-examination of the historical equity risk premium in Australia, Accounting and Finance 48, 2008, pages 73-97.
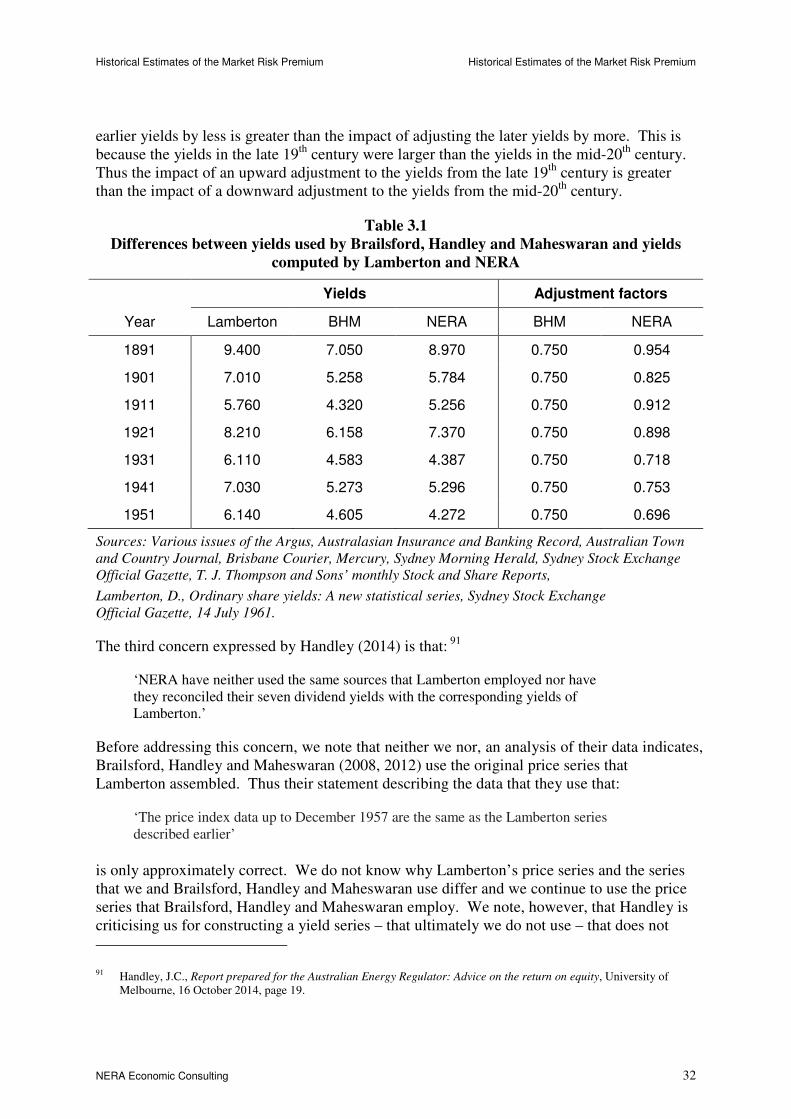
Historical Estimates of the Market Risk Premium Historical Estimates of the Market Risk Premium
NERA Economic Consulting 32
earlier yields by less is greater than the impact of adjusting the later yields by more. This is because the yields in the late 19th century were larger than the yields in the mid-20th century. Thus the impact of an upward adjustment to the yields from the late 19th century is greater than the impact of a downward adjustment to the yields from the mid-20th century.
Table 3.1
Differences between yields used by Brailsford, Handley and Maheswaran and yields
computed by Lamberton and NERA
Yields Adjustment factors
Year Lamberton BHM NERA BHM NERA
1891 9.400 7.050 8.970 0.750 0.954
1901 7.010 5.258 5.784 0.750 0.825
1911 5.760 4.320 5.256 0.750 0.912
1921 8.210 6.158 7.370 0.750 0.898
1931 6.110 4.583 4.387 0.750 0.718
1941 7.030 5.273 5.296 0.750 0.753
1951 6.140 4.605 4.272 0.750 0.696
Sources: Various issues of the Argus, Australasian Insurance and Banking Record, Australian Town
and Country Journal, Brisbane Courier, Mercury, Sydney Morning Herald, Sydney Stock Exchange
Official Gazette, T. J. Thompson and Sons’ monthly Stock and Share Reports,
Lamberton, D., Ordinary share yields: A new statistical series, Sydney Stock Exchange
Official Gazette, 14 July 1961.
The third concern expressed by Handley (2014) is that: 91
‘NERA have neither used the same sources that Lamberton employed nor have they reconciled their seven dividend yields with the corresponding yields of Lamberton.’
Before addressing this concern, we note that neither we nor, an analysis of their data indicates, Brailsford, Handley and Maheswaran (2008, 2012) use the original price series that Lamberton assembled. Thus their statement describing the data that they use that:
‘The price index data up to December 1957 are the same as the Lamberton series described earlier’
is only approximately correct. We do not know why Lamberton’s price series and the series that we and Brailsford, Handley and Maheswaran use differ and we continue to use the price series that Brailsford, Handley and Maheswaran employ. We note, however, that Handley is criticising us for constructing a yield series – that ultimately we do not use – that does not
91 Handley, J.C., Report prepared for the Australian Energy Regulator: Advice on the return on equity, University of Melbourne, 16 October 2014, page 19.
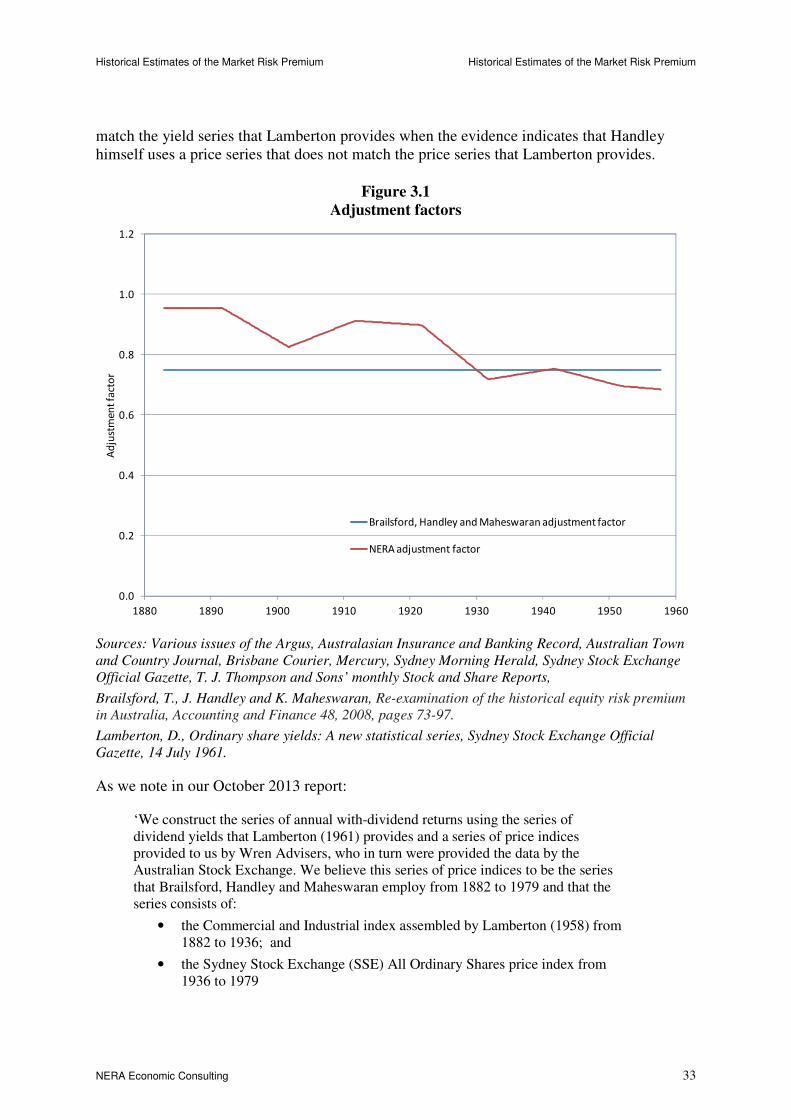
Historical Estimates of the Market Risk Premium Historical Estimates of the Market Risk Premium
NERA Economic Consulting 33
match the yield series that Lamberton provides when the evidence indicates that Handley himself uses a price series that does not match the price series that Lamberton provides.
Figure 3.1
Adjustment factors
Sources: Various issues of the Argus, Australasian Insurance and Banking Record, Australian Town
and Country Journal, Brisbane Courier, Mercury, Sydney Morning Herald, Sydney Stock Exchange
Official Gazette, T. J. Thompson and Sons’ monthly Stock and Share Reports,
Brailsford, T., J. Handley and K. Maheswaran, Re-examination of the historical equity risk premium
in Australia, Accounting and Finance 48, 2008, pages 73-97.
Lamberton, D., Ordinary share yields: A new statistical series, Sydney Stock Exchange Official
Gazette, 14 July 1961.
As we note in our October 2013 report:
‘We construct the series of annual with-dividend returns using the series of dividend yields that Lamberton (1961) provides and a series of price indices provided to us by Wren Advisers, who in turn were provided the data by the Australian Stock Exchange. We believe this series of price indices to be the series that Brailsford, Handley and Maheswaran employ from 1882 to 1979 and that the series consists of:
• the Commercial and Industrial index assembled by Lamberton (1958) from 1882 to 1936; and
• the Sydney Stock Exchange (SSE) All Ordinary Shares price index from 1936 to 1979
0.0
0.2
0.4
0.6
0.8
1.0
1.2
1880 1890 1900 1910 1920 1930 1940 1950 1960
Ad
just
me
nt
fact
or
Brailsford, Handley and Maheswaran adjustment factor
NERA adjustment factor
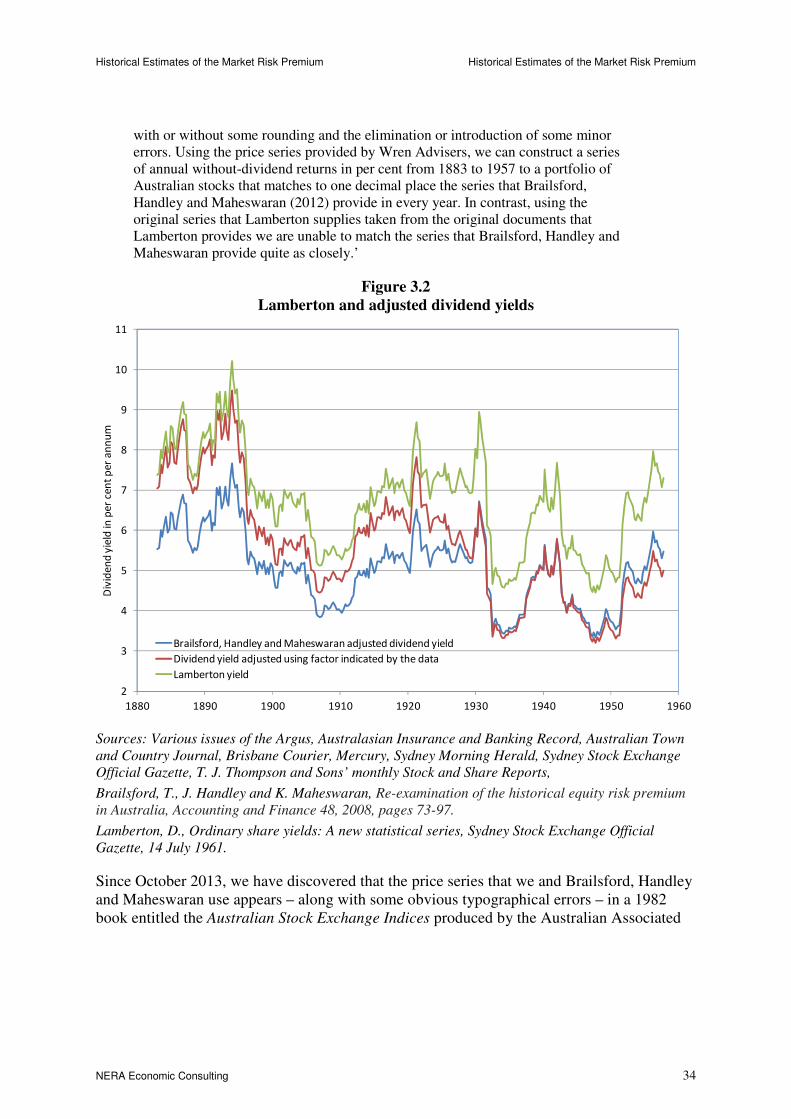
Historical Estimates of the Market Risk Premium Historical Estimates of the Market Risk Premium
NERA Economic Consulting 34
with or without some rounding and the elimination or introduction of some minor errors. Using the price series provided by Wren Advisers, we can construct a series of annual without-dividend returns in per cent from 1883 to 1957 to a portfolio of Australian stocks that matches to one decimal place the series that Brailsford, Handley and Maheswaran (2012) provide in every year. In contrast, using the original series that Lamberton supplies taken from the original documents that Lamberton provides we are unable to match the series that Brailsford, Handley and Maheswaran provide quite as closely.’
Figure 3.2
Lamberton and adjusted dividend yields
Sources: Various issues of the Argus, Australasian Insurance and Banking Record, Australian Town
and Country Journal, Brisbane Courier, Mercury, Sydney Morning Herald, Sydney Stock Exchange
Official Gazette, T. J. Thompson and Sons’ monthly Stock and Share Reports,
Brailsford, T., J. Handley and K. Maheswaran, Re-examination of the historical equity risk premium
in Australia, Accounting and Finance 48, 2008, pages 73-97.
Lamberton, D., Ordinary share yields: A new statistical series, Sydney Stock Exchange Official
Gazette, 14 July 1961.
Since October 2013, we have discovered that the price series that we and Brailsford, Handley and Maheswaran use appears – along with some obvious typographical errors – in a 1982 book entitled the Australian Stock Exchange Indices produced by the Australian Associated
2
3
4
5
6
7
8
9
10
11
1880 1890 1900 1910 1920 1930 1940 1950 1960
Div
ide
nd
yie
ld in
pe
r ce
nt
pe
r a
nn
um
Brailsford, Handley and Maheswaran adjusted dividend yield
Dividend yield adjusted using factor indicated by the data
Lamberton yield
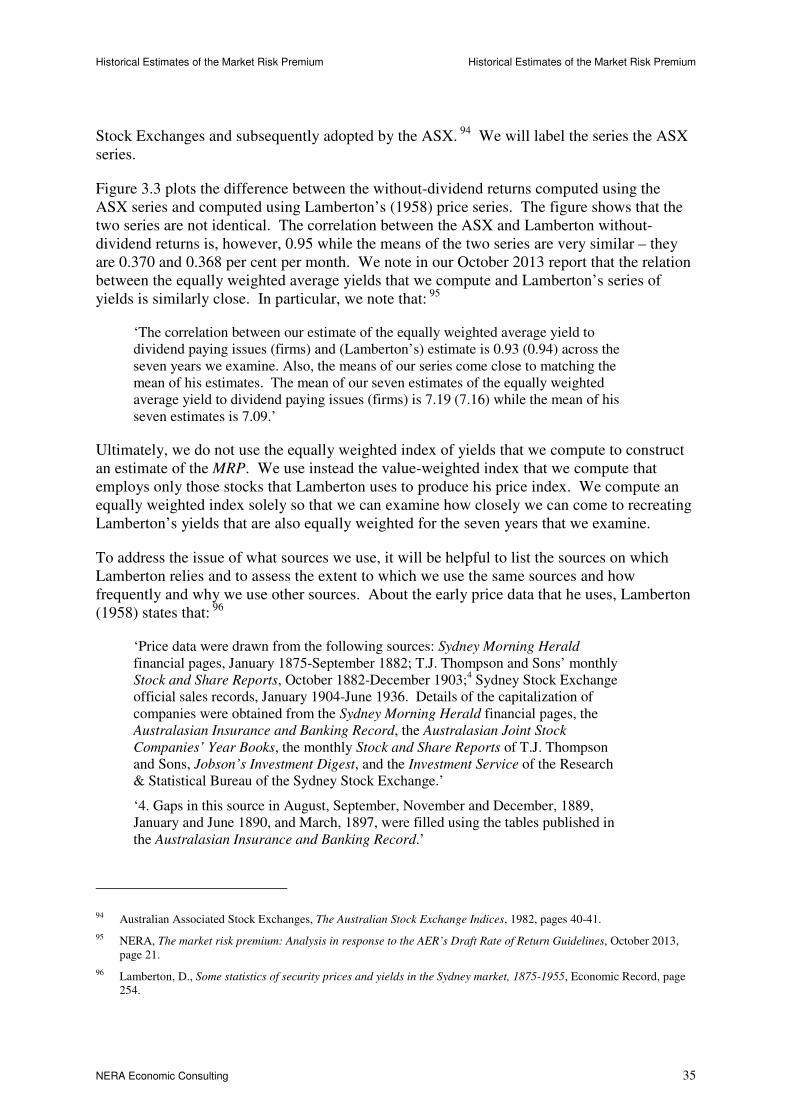
Historical Estimates of the Market Risk Premium Historical Estimates of the Market Risk Premium
NERA Economic Consulting 35
Stock Exchanges and subsequently adopted by the ASX. 94 We will label the series the ASX series.
Figure 3.3 plots the difference between the without-dividend returns computed using the ASX series and computed using Lamberton’s (1958) price series. The figure shows that the two series are not identical. The correlation between the ASX and Lamberton without-dividend returns is, however, 0.95 while the means of the two series are very similar – they are 0.370 and 0.368 per cent per month. We note in our October 2013 report that the relation between the equally weighted average yields that we compute and Lamberton’s series of yields is similarly close. In particular, we note that: 95
‘The correlation between our estimate of the equally weighted average yield to dividend paying issues (firms) and (Lamberton’s) estimate is 0.93 (0.94) across the seven years we examine. Also, the means of our series come close to matching the mean of his estimates. The mean of our seven estimates of the equally weighted average yield to dividend paying issues (firms) is 7.19 (7.16) while the mean of his seven estimates is 7.09.’
Ultimately, we do not use the equally weighted index of yields that we compute to construct an estimate of the MRP. We use instead the value-weighted index that we compute that employs only those stocks that Lamberton uses to produce his price index. We compute an equally weighted index solely so that we can examine how closely we can come to recreating Lamberton’s yields that are also equally weighted for the seven years that we examine.
To address the issue of what sources we use, it will be helpful to list the sources on which Lamberton relies and to assess the extent to which we use the same sources and how frequently and why we use other sources. About the early price data that he uses, Lamberton (1958) states that: 96
‘Price data were drawn from the following sources: Sydney Morning Herald financial pages, January 1875-September 1882; T.J. Thompson and Sons’ monthly Stock and Share Reports, October 1882-December 1903;4 Sydney Stock Exchange official sales records, January 1904-June 1936. Details of the capitalization of companies were obtained from the Sydney Morning Herald financial pages, the Australasian Insurance and Banking Record, the Australasian Joint Stock
Companies’ Year Books, the monthly Stock and Share Reports of T.J. Thompson and Sons, Jobson’s Investment Digest, and the Investment Service of the Research & Statistical Bureau of the Sydney Stock Exchange.’
‘4. Gaps in this source in August, September, November and December, 1889, January and June 1890, and March, 1897, were filled using the tables published in the Australasian Insurance and Banking Record.’
94 Australian Associated Stock Exchanges, The Australian Stock Exchange Indices, 1982, pages 40-41.
95 NERA, The market risk premium: Analysis in response to the AER’s Draft Rate of Return Guidelines, October 2013, page 21.
96 Lamberton, D., Some statistics of security prices and yields in the Sydney market, 1875-1955, Economic Record, page 254.
Historical Estimates of the Market Risk Premium Historical Estimates of the Market Risk Premium
NERA Economic Consulting 36
Figure 3.3
Difference between ASX and Lamberton without-dividend returns
Sources:
ASX All Ordinaries Index from http://www.wrenadvisers.com.au/downloads/
Lamberton, D., Security prices and yields, Sydney Stock Exchange Official Gazette, 14 July 1958.
Lamberton, D., Share price indices in Australia, Sydney: Law Book Company, 1958.
About the later price data that he uses, Lamberton (1958) states that: 97
‘The price data used in the calculations of the new indices were drawn from the official sales records of the Sydney Stock Exchange.’
‘Details of the capitalisation of companies included in the indices were obtained from the Sydney Stock Exchange “Official Gazette”, the Sydney Stock Exchange Research and Statistical Bureau Investment and Mining Service, “Jobson’s
Investment Digest”, and “Jobson’s Digest Year Book of Public Companies”. Other useful sources for terms of issues were the “Australian Financial Review” and the balance sheets and reports filed by listed companies with the Sydney Stock Exchange Research and Statistical Bureau.’
97 Lamberton, D., Share price indices in Australia, Sydney: Law Book Company, 1958, pages 48-49.
-15
-10
-5
0
5
10
15
20
1875 1885 1895 1905 1915 1925 1935 1945 1955
Dif
fere
nce
be
twe
en
AS
X a
nd
La
mb
ert
on
mo
nth
ly
wit
ho
ut-
div
ide
nd
re
turn
s
Historical Estimates of the Market Risk Premium Historical Estimates of the Market Risk Premium
NERA Economic Consulting 37
About the yield data that he uses, Lamberton (1958) states that: 98
‘The share yield is the arithmetic mean of the yields, computed by expressing the paid or indicated dividend as a percentage of price, of all ordinary shares for which data were available in the last month of each quarter. The data which relate to the end of the month, except from 1914 to 1936, when mid-month values were used, were taken from the Stock and Share Reports of T.J. Thompson and Sons (1882-1913) and the ‘Official Gazette’ of the Sydney Stock Exchange (1914-1955).’
Similarly, Lamberton (1961) states that: 99
‘The data, which relate to the end of the month except from 1914 to 1936 when mid-month values were used, were taken from the Stock and Share Reports of T.J. Thompson and Sons for the period 1882-1913, and from the Sydney Stock
Exchange Official Gazette beginning with 1914.’
We use data from the Australasian Insurance and Banking Record, the Sydney Morning
Herald, the Sydney Stock Exchange Official Gazette and T. J. Thompson and Sons’ monthly Stock and Share Reports. These are all publications that Lamberton employs. We also use a monthly share list prepared by brokers Joseph Palmer and Son that appeared in the Australian
Town and Country Journal, the Argus, Brisbane Courier and Mercury. These are not publications that Lamberton employs and we use these publications to fill in data that are missing.
Table 3.2 below provides the number of observations that we draw from sources that Lamberton uses and the number of observations that we draw from other sources. We use observations on dividend rates, bid and ask prices and two from: total paid up capital, paid up capital per share and number of shares. The table shows that 99.41 per cent of the observations that we use come from sources that Lamberton employs while 0.60 per cent (rounded to two decimal places) come from other sources.
Lamberton makes it clear exactly that he uses data from T.J. Thompson and Sons to compute yields from 1882 to 1913. Initially, we were unable to locate copies of T. J. Thompson and Sons’ monthly Stock and Share Reports and so, as an alternative, we began by using two of Lamberton’s other sources – the Australasian Insurance and Banking Record and the Sydney
Morning Herald – to compute yields. Subsequently, however, we located copies of T. J. Thompson and Sons’ Stock and Share Reports and so we checked the data that we had entered against the data from these reports.
The process that we ended up following was, as is made clear in the DVD that we sent to the AER in November 2013:
• to fill in as much data as we could using information from the Australasian Insurance
and Banking Record;
98 Lamberton, D., Security prices and yields, Sydney Stock Exchange Official Gazette, 14 August 1958, page 307.
99 Lamberton, D., Ordinary share yields: A new statistical series, Sydney Stock Exchange Official Gazette, 14 July 1961, page 341.
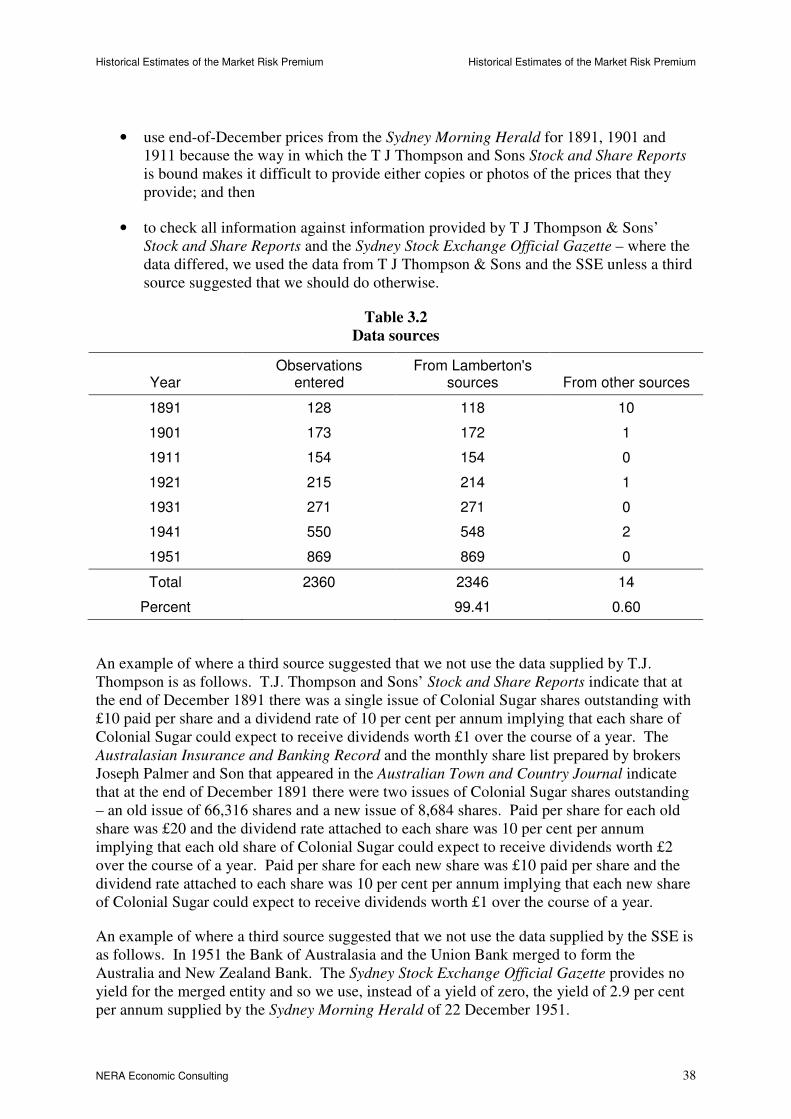
Historical Estimates of the Market Risk Premium Historical Estimates of the Market Risk Premium
NERA Economic Consulting 38
• use end-of-December prices from the Sydney Morning Herald for 1891, 1901 and 1911 because the way in which the T J Thompson and Sons Stock and Share Reports is bound makes it difficult to provide either copies or photos of the prices that they provide; and then
• to check all information against information provided by T J Thompson & Sons’ Stock and Share Reports and the Sydney Stock Exchange Official Gazette – where the data differed, we used the data from T J Thompson & Sons and the SSE unless a third source suggested that we should do otherwise.
Table 3.2
Data sources
Year Observations
entered From Lamberton's
sources From other sources
1891 128 118 10
1901 173 172 1
1911 154 154 0
1921 215 214 1
1931 271 271 0
1941 550 548 2
1951 869 869 0
Total 2360 2346 14
Percent 99.41 0.60
An example of where a third source suggested that we not use the data supplied by T.J. Thompson is as follows. T.J. Thompson and Sons’ Stock and Share Reports indicate that at the end of December 1891 there was a single issue of Colonial Sugar shares outstanding with £10 paid per share and a dividend rate of 10 per cent per annum implying that each share of Colonial Sugar could expect to receive dividends worth £1 over the course of a year. The Australasian Insurance and Banking Record and the monthly share list prepared by brokers Joseph Palmer and Son that appeared in the Australian Town and Country Journal indicate that at the end of December 1891 there were two issues of Colonial Sugar shares outstanding – an old issue of 66,316 shares and a new issue of 8,684 shares. Paid per share for each old share was £20 and the dividend rate attached to each share was 10 per cent per annum implying that each old share of Colonial Sugar could expect to receive dividends worth £2 over the course of a year. Paid per share for each new share was £10 paid per share and the dividend rate attached to each share was 10 per cent per annum implying that each new share of Colonial Sugar could expect to receive dividends worth £1 over the course of a year.
An example of where a third source suggested that we not use the data supplied by the SSE is as follows. In 1951 the Bank of Australasia and the Union Bank merged to form the Australia and New Zealand Bank. The Sydney Stock Exchange Official Gazette provides no yield for the merged entity and so we use, instead of a yield of zero, the yield of 2.9 per cent per annum supplied by the Sydney Morning Herald of 22 December 1951.
Historical Estimates of the Market Risk Premium Historical Estimates of the Market Risk Premium
NERA Economic Consulting 39
To summarise, NERA in general uses the same sources as Lamberton employs. Of the 2,360 observations that we enter, 99.41 per cent come from sources that Lamberton employs while 0.60 per cent (rounded to two decimal places) come from other sources. In the small number of cases where we use other sources, there is a justification for doing and we cannot be sure that Lamberton would not have followed the same strategy of using additional sources to check anomalous data.
Finally, we note that Handley (2014) states that: 100
‘More generally, NERA have considered the dividend yield issue in isolation of the other limitations with the historic (sic) data prior to 1958. To claim there is a downward bias in the BHM historic (sic) returns data set would require not only reconstructing the entire historic (sic) dividend yield series but to be sure, would probably require one to reconstruct the entire stock return series along similar lines to what Dimson, Marsh and Staunton have done in relation to U.K. stock return data.’
The almost sole contribution of Brailsford, Handley and Maheswaran (2012) relative to the work of Dimson, Marsh and Staunton (2011) is to provide a series of returns that has been adjusted in the way that Brailsford, Handley and Maheswaran (2008) describe. It is, therefore, quite reasonable that one ask whether the adjustment that Brailsford, Handley and Maheswaran employ is warranted. It is, on the other hand, quite unreasonable to conclude that if one finds that the adjustment is not fully warranted, the older data should be jettisoned. Unless one can show that there is a systematic bias associated with the older data, then the older data should be used to sharpen estimates of the MRP. As Goetzmann and Ibbotson (2007) emphasis, a larger sample size, as long as the fundamental expectations have remained the
same, will lead to a more accurate estimate of the MRP. 101
3.3. AER
The AER states that: 102
‘NERA used annual data, whereas Lamberton used quarterly data.’
This statement is incorrect. If NERA’s yields were annual whereas Lamberton’s yields were quarterly, one would expect NERA’s yields to be approximately four times as large as Lamberton’s yields – which is quite evidently not the case.
Lamberton (1961) reports for the last month of each quarter an equally weighted average of share yields where each yield is computed as the paid or indicated dividend per share per
100 Handley, J.C., Report prepared for the Australian Energy Regulator: Advice on the return on equity, University of Melbourne, 16 October 2014, page 20.
101 Goetzmann, W.N. and R.G. Ibbotson, The equity premium over the very long run, in Handbook of the equity premium, ed. R. Mehra, Elsevier Science, 2007, Chapter 12.
102 AER, Draft decision Jemena Gas Networks (NSW) Ltd Access arrangement 2015–20 Attachment 3: Rate of return, November 2014, page 198. The same points are contained in the AER’s other recent draft decisions.
Historical Estimates of the Market Risk Premium Historical Estimates of the Market Risk Premium
NERA Economic Consulting 40
annum divided by the price of the share either at the end of the last month of a quarter or, for the years 1914 to 1936, halfway through the last month of a quarter.
NERA (2013) examines data for the last quarters of 1891, 1901, 1911, 1921, 1931, 1941 and 1951. NERA reports for the last month of each of these quarters a value-weighted average of share yields where each yield is computed, in exactly the same way, as the paid or indicated dividend per share per annum divided by the price of the share either at the end of the last month of a quarter or, for the years 1921 and 1931, halfway through the last month of a quarter.
3.4. Update of the Data
Finally, we update the data that we provide in our October 2013 report. In our June 2013 and October 2013 reports we describe in detail how the estimates produced for the ENA were constructed and so we only briefly sketch how we update the data.
3.4.1. Data
We extract daily data (for days on which the market was open) for the All Ordinaries Index (AS30) and the All Ordinaries Accumulation Index (ASA30) from Bloomberg. Like Brailsford, Handley and Maheswaran (2008, 2012), we extract imputation credit yields for December of each year from the Australian Taxation Office. 103 Also, like Brailsford, Handley and Maheswaran, we take 90-day bank accepted bill rates, the yields on three-month Treasury notes and the yields on 10-year Commonwealth Government bonds from the Reserve Bank of Australia. 104 Finally, like Brailsford, Handley and Maheswaran, we use the percentage change in the All Groups CPI for Australia from the last quarter of one year to the last quarter of the next year, provided by the Australian Bureau of Statistics, as a measure of inflation. 105
3.4.2. Calculations
Like Brailsford, Handley and Maheswaran (2008, 2012), we compute the annual with-dividend return to the market portfolio in data from 1981 onwards as the percentage change from one year to the next in the average December level of the All Ordinaries Accumulation Index. To produce gross returns, we add to the with-dividend return 35 per cent of the credit return – that is, the ratio of the credits provided by the All Ordinaries within a year to the level of the index at the start of the year. We also examine the impact of adding to the with-dividend return 60 per cent of the credit return – as the AER does in its Jemena draft
103 https://www.ato.gov.au/rates/company-tax---imputation--average-franking-credit---rebate-yields/?page=2#List_of_yields
104 http://www.rba.gov.au/statistics/index.html
105 http://www.abs.gov.au/AUSSTATS/[email protected]/DetailsPage/6401.0Sep%202014?OpenDocument
Historical Estimates of the Market Risk Premium Historical Estimates of the Market Risk Premium
NERA Economic Consulting 41
decision. 106 In other words, we also examine the impact of setting theta – the value of a dollar of credits distributed – to 0.60.
Like Brailsford, Handley and Maheswaran (2008, 2012), we compute an estimate of the MRP by averaging the difference between each year’s gross return and the yield on a 10-year Commonwealth Government bond at the end of each year.
3.4.3. Estimates
The gross return to the All Ordinaries from December 2012 to December 2013 was 18.66 per cent while the yield on a 10-year Commonwealth Government bond at the end of 2013 was 4.23 per cent. Thus the excess return to the market portfolio computed in the same way that Brailsford, Handley and Maheswaran (2008, 2012) compute the return was 14.43 per cent – considerably above its long-run average. As a result, estimates of the MRP rise with the addition of 2013’s data. Table 3.3 below shows how estimates of the MRP have been affected by the addition of 2013’s data for a variety of sub-periods that the Australian Energy Regulator (AER) has in the past used. There are three points that are worth making about this table and these estimates.
First, as Table 3.3 makes clear, estimates of the MRP are imprecise and estimates that use shorter time series are less precise than estimates that use longer time series. As Dimson, Marsh and Staunton (2014) emphasise: 107
‘To understand risk and return, we must examine long periods of history. This is because asset returns, and especially equity returns, are very volatile. Even over periods as long as 20 years or more, we can still observe “unusual” returns.’
Dimson, Marsh and Staunton use data from 1900 rather than from 1883 because they use a common start-date for all the countries in their database. They state that:
‘The DMS series all start in 1900, and this common start-date aids international comparisons. Data availability and quality dictated this choice of start date, and for practical purposes, 1900 was the earliest plausible date for a comparative international database with broad coverage.’
Since we are not concerned here with estimating the MRP across a range of countries and so do not need to select a common start-date, we use all the data that are available to us in the interests of producing as precise as possible estimates of the MRP, mean real return to the market portfolio and mean nominal return to the market portfolio.
106 AER, Draft decision Jemena Gas Networks (NSW) Ltd Access arrangement 2015–20 Attachment 3: Rate of return, November 2014, page 195.
107 Dimson, E., P. Marsh and M. Staunton, Credit Suisse Global investment returns sourcebook 2014, Credit Suisse, February 2014, page 7.
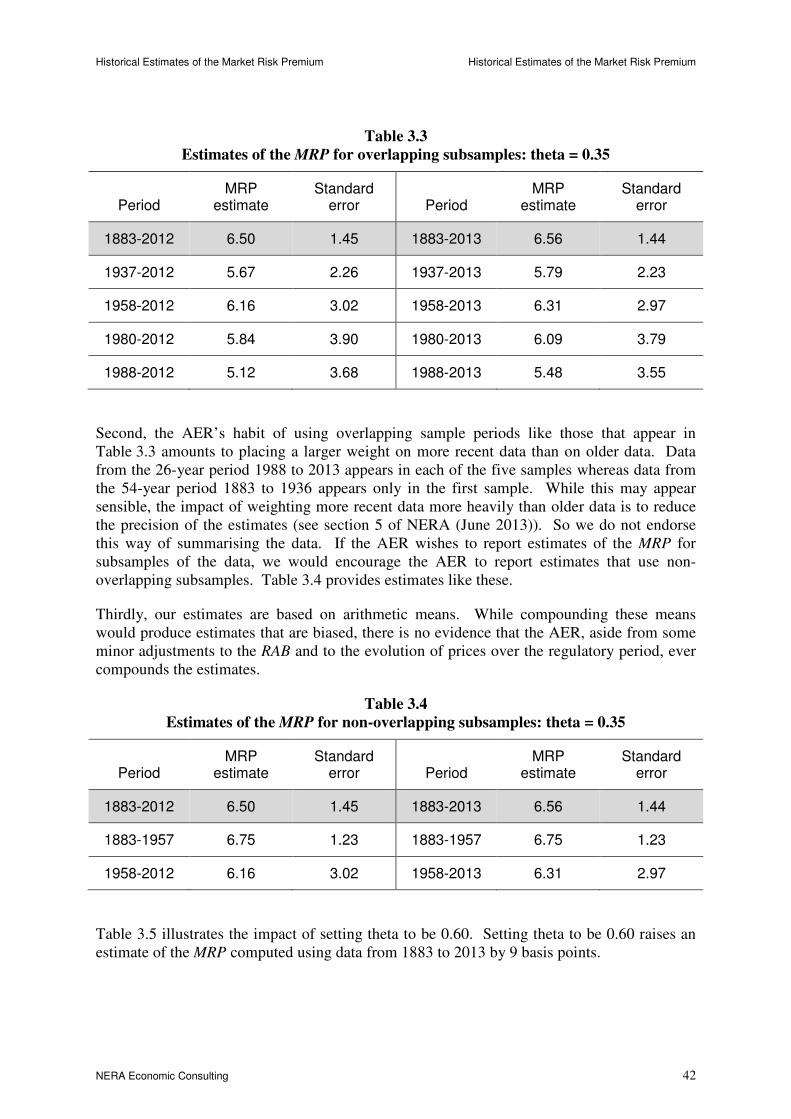
Historical Estimates of the Market Risk Premium Historical Estimates of the Market Risk Premium
NERA Economic Consulting 42
Table 3.3
Estimates of the MRP for overlapping subsamples: theta = 0.35
Period MRP
estimate Standard
error Period MRP
estimate Standard
error
1883-2012 6.50 1.45 1883-2013 6.56 1.44
1937-2012 5.67 2.26 1937-2013 5.79 2.23
1958-2012 6.16 3.02 1958-2013 6.31 2.97
1980-2012 5.84 3.90 1980-2013 6.09 3.79
1988-2012 5.12 3.68 1988-2013 5.48 3.55
Second, the AER’s habit of using overlapping sample periods like those that appear in Table 3.3 amounts to placing a larger weight on more recent data than on older data. Data from the 26-year period 1988 to 2013 appears in each of the five samples whereas data from the 54-year period 1883 to 1936 appears only in the first sample. While this may appear sensible, the impact of weighting more recent data more heavily than older data is to reduce the precision of the estimates (see section 5 of NERA (June 2013)). So we do not endorse this way of summarising the data. If the AER wishes to report estimates of the MRP for subsamples of the data, we would encourage the AER to report estimates that use non-overlapping subsamples. Table 3.4 provides estimates like these.
Thirdly, our estimates are based on arithmetic means. While compounding these means would produce estimates that are biased, there is no evidence that the AER, aside from some minor adjustments to the RAB and to the evolution of prices over the regulatory period, ever compounds the estimates.
Table 3.4
Estimates of the MRP for non-overlapping subsamples: theta = 0.35
Period MRP
estimate Standard
error Period MRP
estimate Standard
error
1883-2012 6.50 1.45 1883-2013 6.56 1.44
1883-1957 6.75 1.23 1883-1957 6.75 1.23
1958-2012 6.16 3.02 1958-2013 6.31 2.97
Table 3.5 illustrates the impact of setting theta to be 0.60. Setting theta to be 0.60 raises an estimate of the MRP computed using data from 1883 to 2013 by 9 basis points.
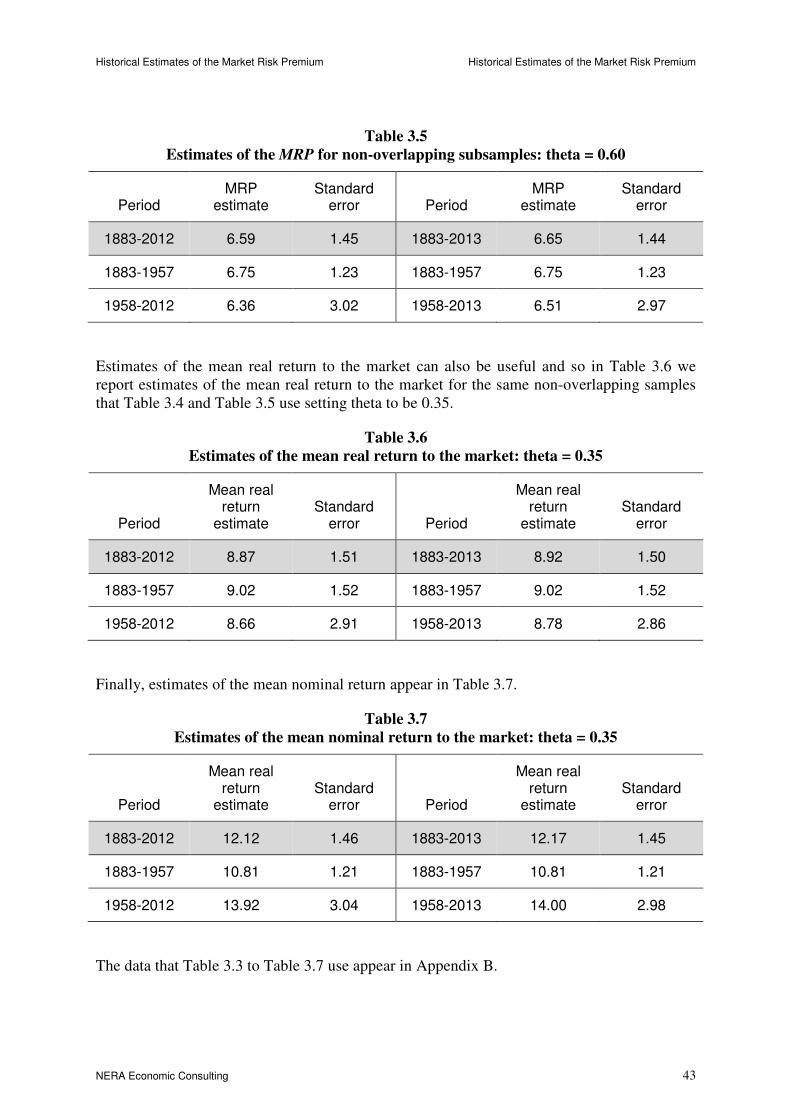
Historical Estimates of the Market Risk Premium Historical Estimates of the Market Risk Premium
NERA Economic Consulting 43
Table 3.5
Estimates of the MRP for non-overlapping subsamples: theta = 0.60
Period MRP
estimate Standard
error Period MRP
estimate Standard
error
1883-2012 6.59 1.45 1883-2013 6.65 1.44
1883-1957 6.75 1.23 1883-1957 6.75 1.23
1958-2012 6.36 3.02 1958-2013 6.51 2.97
Estimates of the mean real return to the market can also be useful and so in Table 3.6 we report estimates of the mean real return to the market for the same non-overlapping samples that Table 3.4 and Table 3.5 use setting theta to be 0.35.
Table 3.6
Estimates of the mean real return to the market: theta = 0.35
Period
Mean real return
estimate Standard
error Period
Mean real return
estimate Standard
error
1883-2012 8.87 1.51 1883-2013 8.92 1.50
1883-1957 9.02 1.52 1883-1957 9.02 1.52
1958-2012 8.66 2.91 1958-2013 8.78 2.86
Finally, estimates of the mean nominal return appear in Table 3.7.
Table 3.7
Estimates of the mean nominal return to the market: theta = 0.35
Period
Mean real return
estimate Standard
error Period
Mean real return
estimate Standard
error
1883-2012 12.12 1.46 1883-2013 12.17 1.45
1883-1957 10.81 1.21 1883-1957 10.81 1.21
1958-2012 13.92 3.04 1958-2013 14.00 2.98
The data that Table 3.3 to Table 3.7 use appear in Appendix B.
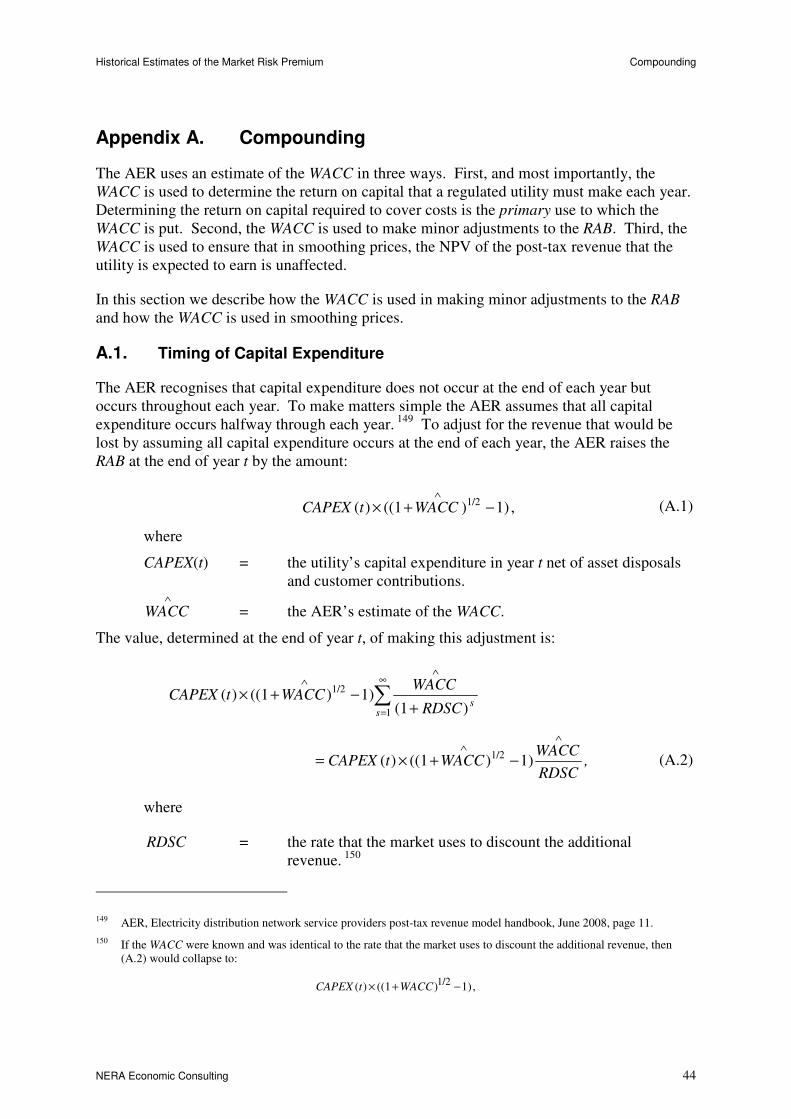
Historical Estimates of the Market Risk Premium Compounding
NERA Economic Consulting 44
Appendix A. Compounding
The AER uses an estimate of the WACC in three ways. First, and most importantly, the WACC is used to determine the return on capital that a regulated utility must make each year. Determining the return on capital required to cover costs is the primary use to which the WACC is put. Second, the WACC is used to make minor adjustments to the RAB. Third, the WACC is used to ensure that in smoothing prices, the NPV of the post-tax revenue that the utility is expected to earn is unaffected.
In this section we describe how the WACC is used in making minor adjustments to the RAB and how the WACC is used in smoothing prices.
A.1. Timing of Capital Expenditure
The AER recognises that capital expenditure does not occur at the end of each year but occurs throughout each year. To make matters simple the AER assumes that all capital expenditure occurs halfway through each year. 149 To adjust for the revenue that would be lost by assuming all capital expenditure occurs at the end of each year, the AER raises the RAB at the end of year t by the amount:
,1))((1)( 1/2 −+×
∧
WACCtCAPEX
(A.1)
where
CAPEX(t) = the utility’s capital expenditure in year t net of asset disposals and customer contributions.
∧
WACC = the AER’s estimate of the WACC.
The value, determined at the end of year t, of making this adjustment is:
,RDSC
WACCWACCtCAPEX
RDSC
WACCWACCtCAPEX
ss
∧∧
∞
=
∧∧
−+×=
+−+× ∑
1))((1)(
)(11))((1)(
1/2
1
1/2
(A.2)
where
RDSC = the rate that the market uses to discount the additional revenue. 150
149 AER, Electricity distribution network service providers post-tax revenue model handbook, June 2008, page 11.
150 If the WACC were known and was identical to the rate that the market uses to discount the additional revenue, then (A.2) would collapse to:
,1))((1)( 1/2 −+× WACCtCAPEX

Historical Estimates of the Market Risk Premium Compounding
NERA Economic Consulting 45
If the WACC is based solely on the arithmetic mean of a sample of annual excess returns to the market portfolio, then:
.WACCWACCWACCWACC 1))((11))((1E 1/21/2 −+>
−+
∧∧
(A.3)
Thus the AER’s adjustment to the RAB may be upwardly biased if the AER uses the arithmetic mean of a sample of annual excess returns to the market portfolio to compute an estimate of the WACC. Simulations whose results we summarise in an August 2011 report show, however, that the difference between the left- and right-hand sides of (A.3), the bias about which one might be concerned, is trivial. 151
A.2. Difference between Actual and Forecast Capital Expenditure
In each year of the regulatory period, revenue is determined in part by the RAB at the start of the year. In determining parameters for the next regulatory period, however, the AER will not know the RAB at the start of the regulatory period and so must rely on a forecast of the RAB. It will not know the RAB because it will not know what actual capital expenditure will be in the last year of the regulatory period and so will be forced to rely on a forecast of capital expenditure for the year. To adjust for differences between actual capital expenditure and forecast capital expenditure in the last year of a regulatory period, the AER adjusts the RAB at the end of the next regulatory period. 152 This adjustment includes a return on the difference between actual and forecast capital expenditure that is compounded.
The adjustment that the AER makes will be positive if actual capital expenditure exceeds forecast capital expenditure in the last year of a regulatory period. If the adjustment is positive, then the use of a WACC that is based solely on the arithmetic mean of a sample of annual excess returns to the market portfolio will produce an upwardly biased estimate of the adjustment because of the dependence of the adjustment on a compounded return. It is typically the case, though, that actual capital expenditure is below forecast capital expenditure in the last year of a regulatory period. 153 If actual capital expenditure is below forecast capital expenditure, the use of a WACC based solely on the arithmetic mean of a sample of annual excess returns to the market portfolio will produce a downwardly biased estimate of the adjustment.
Any bias is likely to be empirically unimportant, though, for two reasons:
• the adjustment is based on the difference between actual and forecast capital expenditure, not on the level of capital expenditure (either actual or forecast); and
which would match the revenue that one would expect to earn over half a year on capital of CAPEX(t).
151 NERA, The market risk premium: A report for CitiPower, Jemena Electricity Networks, Powercor, SP AusNet and
United Energy Distribution, August 2011.
152 AER, Electricity distribution network service providers roll forward model handbook, June 2008, pages 8-14.
153 For United Energy, actual capital expenditure fell below forecast capital expenditure by $59.26 million in 2005. See:
United Energy RFM Final Decision.xls
Historical Estimates of the Market Risk Premium Compounding
NERA Economic Consulting 46
• the adjustment is based on the difference between actual and forecast capital expenditure in only the last year of a regulatory period not on the difference in each of the five years of the regulatory period.
A.3. Smoothing Prices
Application of the building block approach can lead to volatility across time in the prices necessary to recover expected costs each year. To avoid this volatility, prices can be smoothed. The AER requires that they be smoothed, however, in such a way that the net present value (NPV) of the post-tax revenues that the regulated utility expects to receive is unaffected. Computing the NPV of post-tax revenues requires a series of discount factors. Estimates of these factors that use the arithmetic mean of a sample of annual excess returns to the market portfolio and estimates that use the geometric mean both tend to be biased.

Historical Estimates of the Market Risk Premium Annual Data
NERA Economic Consulting 47
Appendix B. Annual Data
This appendix provides the annual data that we construct from:
• the time series of price indices supplied by Wren Advisers;
• the yield series that Lamberton (1958, 1961) provides, adjusted in the way that we describe in section 2; and
• the data that Brailsford, Handley and Maheswaran (2012) provide.
The credit return is given by:
( )100 ,
( 1)
C t
P t×
− (B.1)
where ( )C t are the credits distributed in year t and ( 1)P t − is the level of the price index at
the end of year .t
Year
Without-
dividend return
With-dividend
return Credit return Bond yield Inflation
1883 21.9 31.0 3.8 -2.9
1884 -1.7 6.1 3.7 -8.8
1885 4.7 13.2 3.8 9.8
1886 -3.6 4.7 3.8 4.4
1887 20.6 30.3 3.6 -4.0
1888 19.5 28.1 3.4 -2.9
1889 -6.8 0.5 3.4 1.0
1890 -4.8 3.2 3.5 0.8
1891 -15.9 -8.9 3.8 0.1
1892 -0.7 8.1 3.8 -3.0
1893 -11.3 -3.3 3.8 -6.3
1894 2.9 12.4 3.5 -5.4
1895 12.6 21.7 3.3 0.8
1896 -3.7 2.7 3.2 1.2
1897 3.0 9.4 3.0 4.2
1898 9.7 16.4 3.3 -4.8
1899 6.7 12.9 3.5 0.3
1900 7.0 12.9 3.3 -0.4
1901 -7.9 -2.6 3.3 5.1
1902 9.8 16.2 3.5 6.4
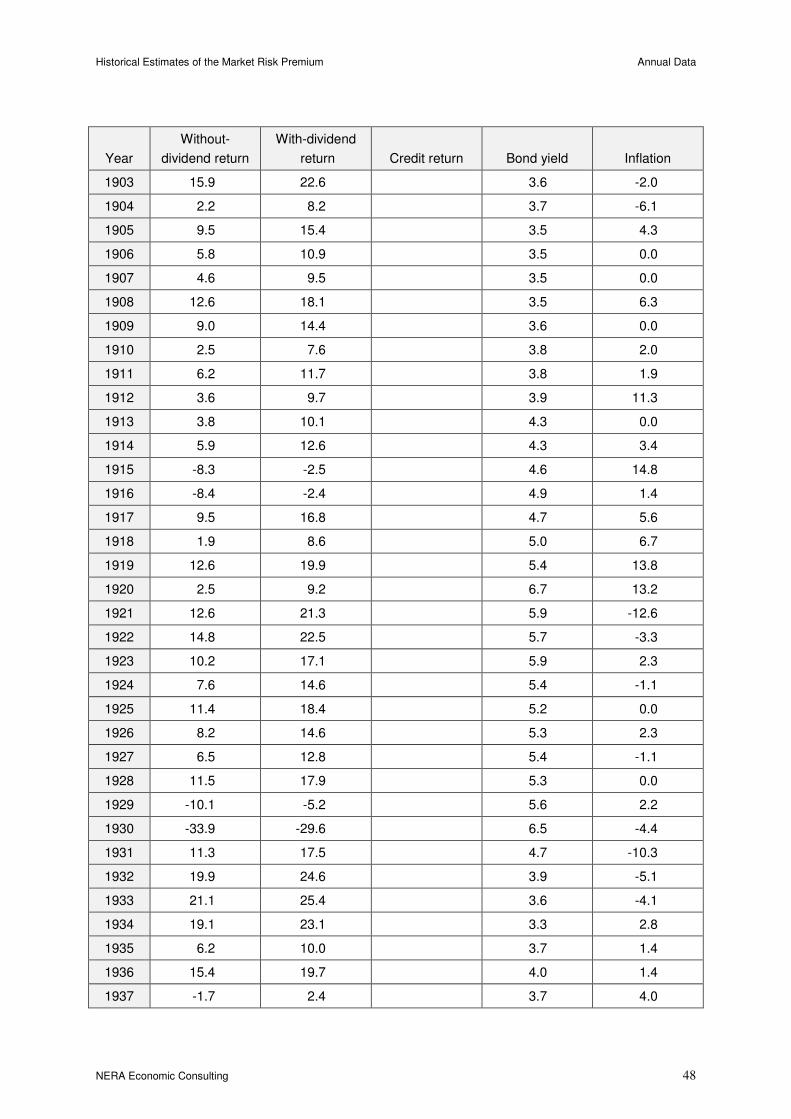
Historical Estimates of the Market Risk Premium Annual Data
NERA Economic Consulting 48
Year
Without-
dividend return
With-dividend
return Credit return Bond yield Inflation
1903 15.9 22.6 3.6 -2.0
1904 2.2 8.2 3.7 -6.1
1905 9.5 15.4 3.5 4.3
1906 5.8 10.9 3.5 0.0
1907 4.6 9.5 3.5 0.0
1908 12.6 18.1 3.5 6.3
1909 9.0 14.4 3.6 0.0
1910 2.5 7.6 3.8 2.0
1911 6.2 11.7 3.8 1.9
1912 3.6 9.7 3.9 11.3
1913 3.8 10.1 4.3 0.0
1914 5.9 12.6 4.3 3.4
1915 -8.3 -2.5 4.6 14.8
1916 -8.4 -2.4 4.9 1.4
1917 9.5 16.8 4.7 5.6
1918 1.9 8.6 5.0 6.7
1919 12.6 19.9 5.4 13.8
1920 2.5 9.2 6.7 13.2
1921 12.6 21.3 5.9 -12.6
1922 14.8 22.5 5.7 -3.3
1923 10.2 17.1 5.9 2.3
1924 7.6 14.6 5.4 -1.1
1925 11.4 18.4 5.2 0.0
1926 8.2 14.6 5.3 2.3
1927 6.5 12.8 5.4 -1.1
1928 11.5 17.9 5.3 0.0
1929 -10.1 -5.2 5.6 2.2
1930 -33.9 -29.6 6.5 -4.4
1931 11.3 17.5 4.7 -10.3
1932 19.9 24.6 3.9 -5.1
1933 21.1 25.4 3.6 -4.1
1934 19.1 23.1 3.3 2.8
1935 6.2 10.0 3.7 1.4
1936 15.4 19.7 4.0 1.4
1937 -1.7 2.4 3.7 4.0
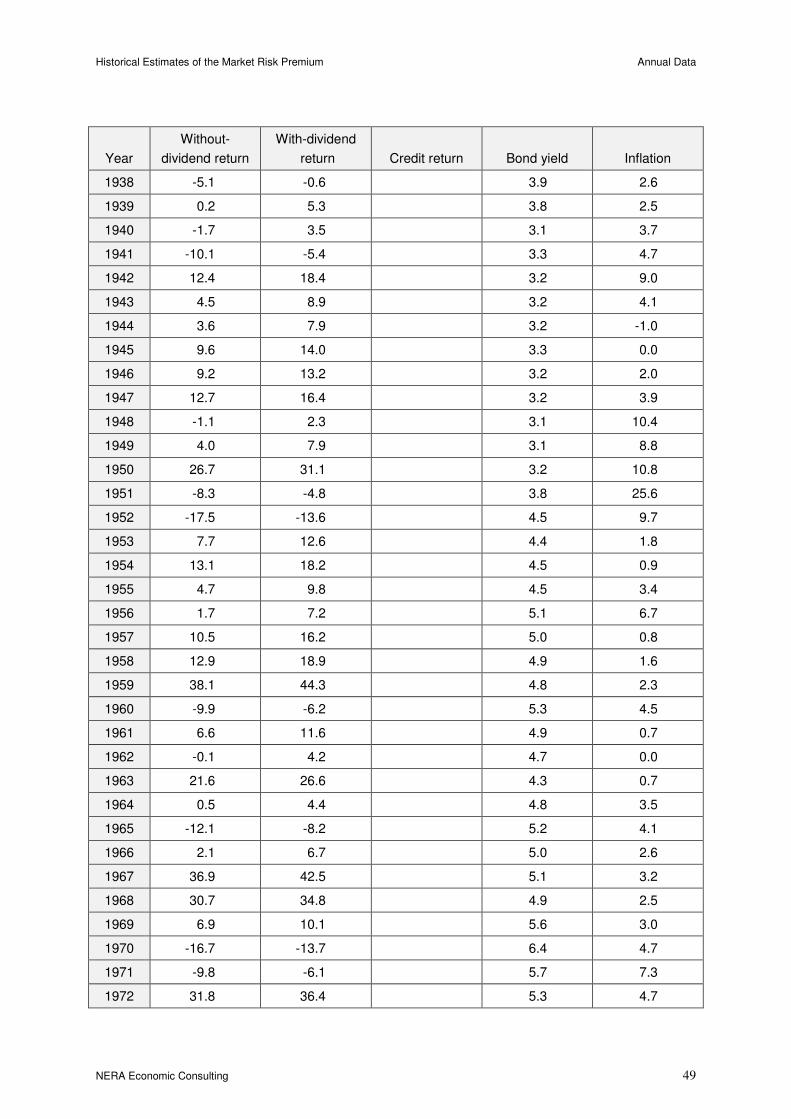
Historical Estimates of the Market Risk Premium Annual Data
NERA Economic Consulting 49
Year
Without-
dividend return
With-dividend
return Credit return Bond yield Inflation
1938 -5.1 -0.6 3.9 2.6
1939 0.2 5.3 3.8 2.5
1940 -1.7 3.5 3.1 3.7
1941 -10.1 -5.4 3.3 4.7
1942 12.4 18.4 3.2 9.0
1943 4.5 8.9 3.2 4.1
1944 3.6 7.9 3.2 -1.0
1945 9.6 14.0 3.3 0.0
1946 9.2 13.2 3.2 2.0
1947 12.7 16.4 3.2 3.9
1948 -1.1 2.3 3.1 10.4
1949 4.0 7.9 3.1 8.8
1950 26.7 31.1 3.2 10.8
1951 -8.3 -4.8 3.8 25.6
1952 -17.5 -13.6 4.5 9.7
1953 7.7 12.6 4.4 1.8
1954 13.1 18.2 4.5 0.9
1955 4.7 9.8 4.5 3.4
1956 1.7 7.2 5.1 6.7
1957 10.5 16.2 5.0 0.8
1958 12.9 18.9 4.9 1.6
1959 38.1 44.3 4.8 2.3
1960 -9.9 -6.2 5.3 4.5
1961 6.6 11.6 4.9 0.7
1962 -0.1 4.2 4.7 0.0
1963 21.6 26.6 4.3 0.7
1964 0.5 4.4 4.8 3.5
1965 -12.1 -8.2 5.2 4.1
1966 2.1 6.7 5.0 2.6
1967 36.9 42.5 5.1 3.2
1968 30.7 34.8 4.9 2.5
1969 6.9 10.1 5.6 3.0
1970 -16.7 -13.7 6.4 4.7
1971 -9.8 -6.1 5.7 7.3
1972 31.8 36.4 5.3 4.7
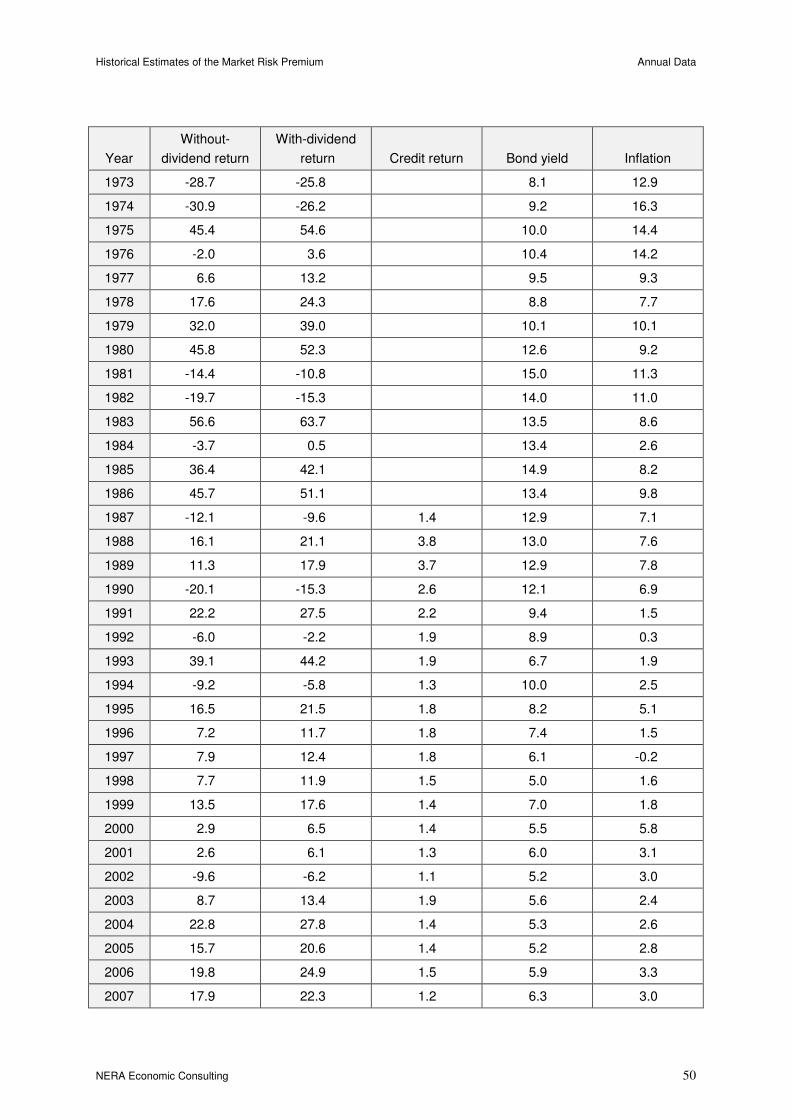
Historical Estimates of the Market Risk Premium Annual Data
NERA Economic Consulting 50
Year
Without-
dividend return
With-dividend
return Credit return Bond yield Inflation
1973 -28.7 -25.8 8.1 12.9
1974 -30.9 -26.2 9.2 16.3
1975 45.4 54.6 10.0 14.4
1976 -2.0 3.6 10.4 14.2
1977 6.6 13.2 9.5 9.3
1978 17.6 24.3 8.8 7.7
1979 32.0 39.0 10.1 10.1
1980 45.8 52.3 12.6 9.2
1981 -14.4 -10.8 15.0 11.3
1982 -19.7 -15.3 14.0 11.0
1983 56.6 63.7 13.5 8.6
1984 -3.7 0.5 13.4 2.6
1985 36.4 42.1 14.9 8.2
1986 45.7 51.1 13.4 9.8
1987 -12.1 -9.6 1.4 12.9 7.1
1988 16.1 21.1 3.8 13.0 7.6
1989 11.3 17.9 3.7 12.9 7.8
1990 -20.1 -15.3 2.6 12.1 6.9
1991 22.2 27.5 2.2 9.4 1.5
1992 -6.0 -2.2 1.9 8.9 0.3
1993 39.1 44.2 1.9 6.7 1.9
1994 -9.2 -5.8 1.3 10.0 2.5
1995 16.5 21.5 1.8 8.2 5.1
1996 7.2 11.7 1.8 7.4 1.5
1997 7.9 12.4 1.8 6.1 -0.2
1998 7.7 11.9 1.5 5.0 1.6
1999 13.5 17.6 1.4 7.0 1.8
2000 2.9 6.5 1.4 5.5 5.8
2001 2.6 6.1 1.3 6.0 3.1
2002 -9.6 -6.2 1.1 5.2 3.0
2003 8.7 13.4 1.9 5.6 2.4
2004 22.8 27.8 1.4 5.3 2.6
2005 15.7 20.6 1.4 5.2 2.8
2006 19.8 24.9 1.5 5.9 3.3
2007 17.9 22.3 1.2 6.3 3.0
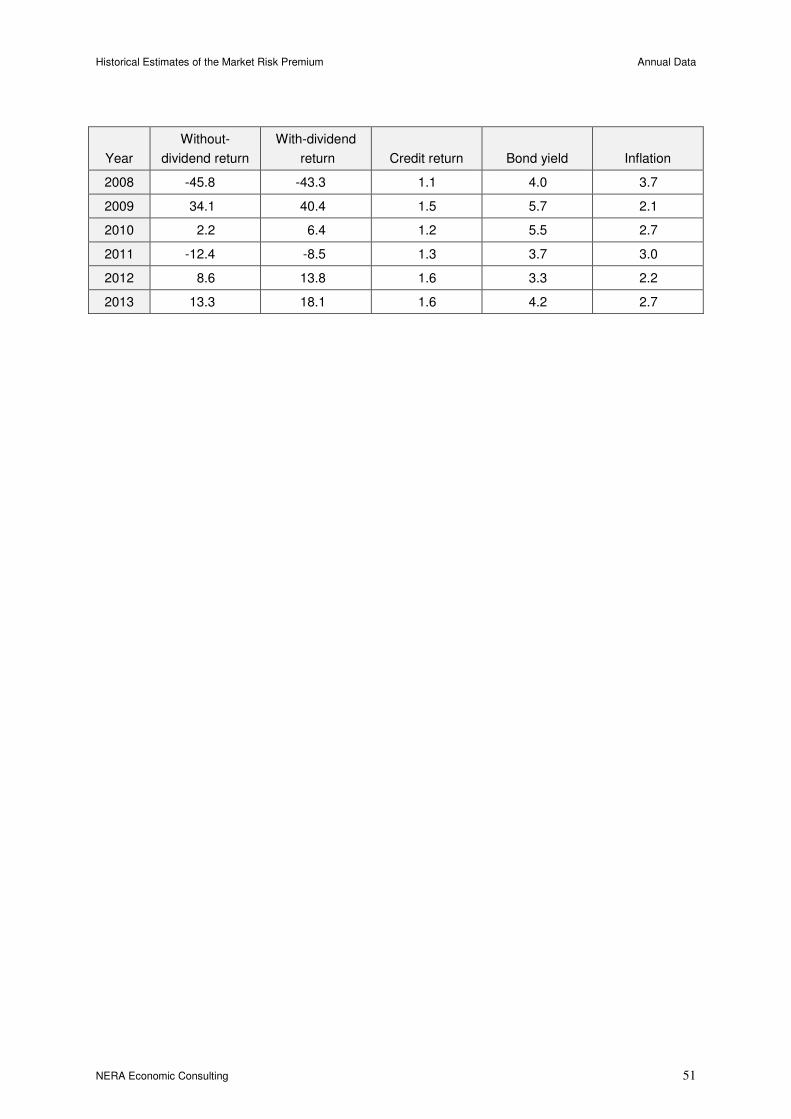
Historical Estimates of the Market Risk Premium Annual Data
NERA Economic Consulting 51
Year
Without-
dividend return
With-dividend
return Credit return Bond yield Inflation
2008 -45.8 -43.3 1.1 4.0 3.7
2009 34.1 40.4 1.5 5.7 2.1
2010 2.2 6.4 1.2 5.5 2.7
2011 -12.4 -8.5 1.3 3.7 3.0
2012 8.6 13.8 1.6 3.3 2.2
2013 13.3 18.1 1.6 4.2 2.7
Historical Estimates of the Market Risk Premium Terms of Reference
NERA Economic Consulting 52
Appendix C. Terms of Reference
Expert Terms of Reference
Update of historical return and premia estimates
Jemena Gas Networks 2015-20 Access Arrangement Review
AA15-570-0075 12 February 2015
1. Background
Jemena Gas Networks (JGN) is the major gas distribution service provider in New South Wales
(NSW). JGN owns more than 25,000 kilometres of natural gas distribution system, delivering
approximately 100 petajoules of natural gas to over one million homes, businesses and large
industrial consumers across NSW.
JGN submitted its revised Access Arrangement proposal (proposal) with supporting information for
the consideration of the Australian Energy Regulator (AER) on 30 June 2014. The revised access
arrangement will cover the period 1 July 2015 to 30 June 2020 (July to June financial years). The
AER published its draft decision on this proposal on 27 November 2014. JGN must submit any
additions or other amendments to its proposal by 27 February 2015.
As with all of its economic regulatory functions and powers, when assessing JGN’s revised Access
Arrangement under the National Gas Rules and the National Gas Law, the AER is required to do so in
a manner that will or is likely to contribute to the achievement of the National Gas Objective, which is:
“to promote efficient investment in, and efficient operation and use of, natural gas services for
the long term interests of consumers of natural gas with respect to price, quality, safety,
reliability and security of supply of natural gas.”
For electricity networks, the AER must assess regulatory proposals under the National Electricity
Rules and the National Electricity Law in a manner that will or is likely to achieve the National
Electricity Objective, as stated in section 7 of the National Electricity Law.
Where there are two or more possible decisions in relation to JGN’s revised Access Arrangement that
will or are likely to contribute to the achievement of the National Gas Objective, the AER is required to
make the decision that the AER is satisfied will or is likely to contribute to the achievement of the
National Gas Objective to the greatest degree.
The AER must also take into account the revenue and pricing principles in section 24 of the National
Gas Law and section 7A of the National Electricity Law, when exercising a discretion related to
reference tariffs. The revenue and pricing principles include the following:
“(2) A service provider should be provided with a reasonable opportunity to recover at least the
efficient costs the service provider incurs in—

Historical Estimates of the Market Risk Premium Terms of Reference
NERA Economic Consulting 53
a) providing reference services; and
b) complying with a regulatory obligation or requirement or making a regulatory payment.
(3) A service provider should be provided with effective incentives in order to promote economic
efficiency with respect to reference services the service provider provides. The economic
efficiency that should be promoted includes—
(a) efficient investment in, or in connection with, a pipeline with which the service provider
provides reference services…
[…]
(5) A reference tariff should allow for a return commensurate with the regulatory and commercial
risks involved in providing the reference service to which that tariff relates.
(6) Regard should be had to the economic costs and risks of the potential for under and over
investment by a service provider in a pipeline with which the service provider provides
pipeline services.”
Some of the key rules that are relevant to an access arrangement and its assessment are set out
below.
Rule 74 of the National Gas Rules, relating generally to forecasts and estimates, states:
(1) Information in the nature of a forecast or estimate must be supported by a statement of the
basis of the forecast or estimate.
(2) A forecast or estimate:
(a) must be arrived at on a reasonable basis; and
(b) must represent the best forecast or estimate possible in the circumstances.
Rule 87 of the National Gas Rules, relating to the allowed rate of return, states:
(1) Subject to rule 82(3), the return on the projected capital base for each regulatory year of the
access arrangement period is to be calculated by applying a rate of return that is determined
in accordance with this rule 87 (the allowed rate of return).
(2) The allowed rate of return is to be determined such that it achieves the allowed rate of return
objective.
(3) The allowed rate of return objective is that the rate of return for a service provider is to be
commensurate with the efficient financing costs of a benchmark efficient entity with a similar
degree of risk as that which applies to the service provider in respect of the provision of
reference services (the allowed rate of return objective).
(4) Subject to subrule (2), the allowed rate of return for a regulatory year is to be:
Historical Estimates of the Market Risk Premium Terms of Reference
NERA Economic Consulting 54
(a) a weighted average of the return on equity for the access arrangement period in which
that regulatory year occurs (as estimated under subrule (6)) and the return on debt for
that regulatory year (as estimated under subrule (8)); and
(b) determined on a nominal vanilla basis that is consistent with the estimate of the value of
imputation credits referred to in rule 87A.
(5) In determining the allowed rate of return, regard must be had to:
(a) relevant estimation methods, financial models, market data and other evidence;
(b) the desirability of using an approach that leads to the consistent application of any
estimates of financial parameters that are relevant to the estimates of, and that are
common to, the return on equity and the return on debt; and
(c) any interrelationships between estimates of financial parameters that are relevant to the
estimates of the return on equity and the return on debt.
Return on equity
(6) The return on equity for an access arrangement period is to be estimated such that it
contributes to the achievement of the allowed rate of return objective.
(7) In estimating the return on equity under subrule (6), regard must be had to the prevailing
conditions in the market for equity funds.
[Subrules (8)–(19) omitted].
The equivalent National Electricity Rules are in clauses 6A.6.2 (for electricity transmission) and 6.5.2
(for electricity distribution).
In its proposal, JGN submitted expert reports of NERA (the Earlier Report), as a suitable qualified
independent expert (Expert), which included estimates of historical market returns and historical
excess market returns.154
The estimates of historical market returns and historical excess market
returns included in the Earlier Report were used as inputs to determining the return on equity
component of the rate of return, in a way that complies with the requirements of the National Gas Law
and Rules and National Electricity Law and Rules, including as highlighted above. The AER draft
decision considered these Earlier Reports.
In this context, JGN seeks a further report from NERA that updates the estimates of historical market
returns and historical excess market returns from the Earlier Report and reviews and responds to
matters raised in the draft decision on using these to determine the return on equity. JGN seeks this
report on behalf of itself, Jemena Electricity Networks, ActewAGL, Ausgrid, AusNet Services,
Australian Gas Networks, CitiPower, Endeavour Energy, Energex, Ergon, Essential Energy, Powercor,
SA Power Networks and United Energy.
154 NERA, 11 October 2013, The market risk premium, analysis in response to the AER’s draft rate of return guideline: A
report for the Energy Networks Association.

Historical Estimates of the Market Risk Premium Terms of Reference
NERA Economic Consulting 55
2. Scope of Work
The Expert will provide an opinion report that:
1. Reviews and, where appropriate responds to matters raised in the draft decision on estimates of
historical market returns and historical excess market returns, including (but not limited to):
(a) datasets used to estimate historical returns, and any necessary adjustments to these datasets;
(b) appropriate time periods for estimation;
(c) using geometric and arithmetic averages; and
(d) whether and, if so, how to adjust for the value of imputation credits.
2. Insofar as practical, updates the estimates of historical market returns and historical excess
market returns from the Earlier Report for:
(a) new data available since the Earlier Report;
(b) matters raised in the draft decision; and
(c) any other matters considered relevant in light of the draft decision that were not considered in preparing the Earlier Report.
In preparing the report, the Expert will:
A. consider any comments raised by the AER, its experts and other regulators; and
B. use robust methods and data in producing any statistical estimates .
3. Information to be Considered
The Expert is also expected to consider the following additional information:
• such information that, in Expert’s opinion, should be taken into account to address the questions
outlined above;
• relevant literature on the rate of return;
• the AER’s rate of return guideline, including explanatory statements and supporting expert
material;
• material submitted to the AER as part of its consultation on the rate of return guideline; and
• previous decisions of the AER, other relevant regulators and the Australian Competition Tribunal
on the rate of return and any supporting expert material, including the recent draft decisions for
JGN and electricity networks in ACT, NSW and Tasmania.
4. Deliverables

Historical Estimates of the Market Risk Premium Terms of Reference
NERA Economic Consulting 56
At the completion of its review the Expert will provide an independent expert report which:
• is of a professional standard capable of being submitted to the AER;
• is prepared in accordance with the Federal Court Practice Note on Expert Witnesses in
Proceedings in the Federal Court of Australia (CM 7) set out in Attachment 1, and includes an
acknowledgement that the Expert has read the guidelines 156
;
• contains a section summarising the Expert’s experience and qualifications, and attaches the
Expert’s curriculum vitae (preferably in a schedule or annexure);
• identifies any person and their qualifications, who assists the Expert in preparing the report or in
carrying out any research or test for the purposes of the report;
• summarises JGN’s instructions and attaches these term of reference;
• includes an executive summary which highlights key aspects of the Expert’s work and
conclusions; and
• (without limiting the points above) carefully sets out the facts that the Expert has assumed in
putting together his or her report, as well as identifying any other assumptions made, and the
basis for those assumptions.
The Expert’s report will include the findings for each of the items defined in the scope of works
(Section 2).
5. Timetable
The Expert will deliver the final report to Jemena Regulation by 13 February 2015.
6. Terms of Engagement
The terms on which the Expert will be engaged to provide the requested advice shall be:
as provided in accordance with the Jemena Regulatory Consultancy Services Panel arrangements
applicable to the Expert.
156 Available at: http://www.federalcourt.gov.au/law-and-practice/practice-documents/practice-notes/cm7.
Historical Estimates of the Market Risk Premium Federal Court Guidelines
NERA Economic Consulting 57
Appendix D. Federal Court Guidelines
FEDERAL COURT OF AUSTRALIA
Practice Note CM 7
EXPERT WITNESSES IN PROCEEDINGS IN THE
FEDERAL COURT OF AUSTRALIA
Practice Note CM 7 issued on 1 August 2011 is revoked with effect from midnight on 3 June 2013 and the following Practice Note is substituted.
Commencement
1. This Practice Note commences on 4 June 2013.
Introduction
2. Rule 23.12 of the Federal Court Rules 2011 requires a party to give a copy of the following guidelines to any witness they propose to retain for the purpose of preparing a report or giving evidence in a proceeding as to an opinion held by the witness that is wholly or substantially based on the specialised knowledge of the witness (see Part 3.3
- Opinion of the Evidence Act 1995 (Cth)).
3. The guidelines are not intended to address all aspects of an expert witness’s duties, but are intended to facilitate the admission of opinion evidence158, and to assist experts to understand in general terms what the Court expects of them. Additionally, it is hoped that the guidelines will assist individual expert witnesses to avoid the criticism that is sometimes made (whether rightly or wrongly) that expert witnesses lack objectivity, or have coloured their evidence in favour of the party calling them.
Guidelines
1. General Duty to the Court159
1.1 An expert witness has an overriding duty to assist the Court on matters relevant to the expert’s area of expertise.
1.2 An expert witness is not an advocate for a party even when giving testimony that is necessarily evaluative rather than inferential.
1.3 An expert witness’s paramount duty is to the Court and not to the person retaining the expert.
158 As to the distinction between expert opinion evidence and expert assistance see Evans Deakin Pty Ltd v Sebel Furniture
Ltd [2003] FCA 171 per Allsop J at [676].
159The “Ikarian Reefer” (1993) 20 FSR 563 at 565-566.
Historical Estimates of the Market Risk Premium Federal Court Guidelines
NERA Economic Consulting 58
2. The Form of the Expert’s Report160
2.1 An expert’s written report must comply with Rule 23.13 and therefore must
(a) be signed by the expert who prepared the report; and
(b) contain an acknowledgement at the beginning of the report that the expert has read, understood and complied with the Practice Note; and
(c) contain particulars of the training, study or experience by which the expert has acquired specialised knowledge; and
(d) identify the questions that the expert was asked to address; and
(e) set out separately each of the factual findings or assumptions on which the expert’s opinion is based; and
(f) set out separately from the factual findings or assumptions each of the expert’s opinions; and
(g) set out the reasons for each of the expert’s opinions; and
(ga) contain an acknowledgment that the expert’s opinions are based wholly or substantially on the specialised knowledge mentioned in paragraph (c) above161; and
(h) comply with the Practice Note.
2.2 At the end of the report the expert should declare that “[the expert] has made all the
inquiries that [the expert] believes are desirable and appropriate and that no matters of
significance that [the expert] regards as relevant have, to [the expert’s] knowledge,
been withheld from the Court.”
2.3 There should be included in or attached to the report the documents and other materials that the expert has been instructed to consider.
2.4 If, after exchange of reports or at any other stage, an expert witness changes the expert’s opinion, having read another expert’s report or for any other reason, the change should be communicated as soon as practicable (through the party’s lawyers) to each party to whom the expert witness’s report has been provided and, when appropriate, to the Court162.
2.5 If an expert’s opinion is not fully researched because the expert considers that insufficient data are available, or for any other reason, this must be stated with an indication that the opinion is no more than a provisional one. Where an expert witness who has prepared a report believes that it may be incomplete or inaccurate without some qualification, that qualification must be stated in the report.
2.6 The expert should make it clear if a particular question or issue falls outside the relevant field of expertise.
160 Rule 23.13.
161 See also Dasreef Pty Limited v Nawaf Hawchar [2011] HCA 21.
162 The “Ikarian Reefer” [1993] 20 FSR 563 at 565
Historical Estimates of the Market Risk Premium Federal Court Guidelines
NERA Economic Consulting 59
2.7 Where an expert’s report refers to photographs, plans, calculations, analyses, measurements, survey reports or other extrinsic matter, these must be provided to the opposite party at the same time as the exchange of reports163.
3. Experts’ Conference
3.1 If experts retained by the parties meet at the direction of the Court, it would be improper for an expert to be given, or to accept, instructions not to reach agreement. If, at a meeting directed by the Court, the experts cannot reach agreement about matters of expert opinion, they should specify their reasons for being unable to do so.
J L B ALLSOP
Chief Justice
4 June 2013
163 The “Ikarian Reefer” [1993] 20 FSR 563 at 565-566. See also Ormrod “Scientific Evidence in Court” [1968] Crim LR 240

Historical Estimates of the Market Risk Premium Curriculum Vitae
NERA Economic Consulting 60
Appendix E. Curriculum Vitae
Simon M. Wheatley
Overview
Simon is a consultant and was until 2008 a Professor of Finance at the University of Melbourne. Since 2008, Simon has applied his finance expertise in investment management and consulting outside the university sector. Simon’s interests and expertise are in individual portfolio choice theory, testing asset-pricing models and determining the extent to which returns are predictable. Prior to joining the University of Melbourne, Simon taught finance at the Universities of British Columbia, Chicago, New South Wales, Rochester and Washington.
Personal
Nationalities: U.K. and U.S.
Permanent residency: Australia
Employment
� Affiliated Industry Expert, NERA Economic Consulting, 2014-
� Special Consultant, NERA Economic Consulting, 2009-2014
� External Consultant, NERA Economic Consulting, 2008-2009
� Quantitative Analyst, Victorian Funds Management Corporation, 2008-2009
� Adjunct, Melbourne Business School, 2008
� Professor, Department of Finance, University of Melbourne, 2001-2008
� Associate Professor, Department of Finance, University of Melbourne, 1999-2001
� Associate Professor, Australian Graduate School of Management, 1994-1999
� Visiting Assistant Professor, Graduate School of Business, University of Chicago, 1993-1994
� Visiting Assistant Professor, Faculty of Commerce, University of British Columbia, 1986
5 Maple Street Blackburn VIC 3130 Tel: +61 3 9878 7985 E-mail: [email protected]
Historical Estimates of the Market Risk Premium Curriculum Vitae
NERA Economic Consulting 61
� Assistant Professor, Graduate School of Business, University of Washington, 1984-1993
���� Education
� Ph.D., University of Rochester, USA, 1986; Major area: Finance; Minor area: Applied statistics; Thesis topic: Some tests of international equity market integration; Dissertation committee: Charles I. Plosser (chairman), Peter Garber, Clifford W. Smith, Rene M. Stulz
� M.A., Economics, Simon Fraser University, Canada, 1979
� M.A., Economics, Aberdeen University, Scotland, 1977
Publicly Available Reports
Imputation Credits and Equity Returns: A report for the Energy Networks Association, October 2013, http://www.aer.gov.au/sites/default/files/ENA,%20Attachment%204%20-%20NERA%20Report%20-%20Imputation%20Credits%20and%20Equity%20Prices,%20Submission%20to%20draft%20AER%20rate%20of%20return%20guideline%20-%2011%20Oct%202013.pdf The Fama-French Three-Factor Model: A report for the Energy Networks Association, October 2013, http://www.aer.gov.au/sites/default/files/Essential%20Energy%20-%20Attachment%207.9_NERA_The%20Fama-French%20Three-Factor%20Model%20-%202014.pdf The Market Risk Premium: Analysis in Response to the AER’s Draft Rate of Return Guidelines: A report for the Energy Networks Association, October 2013, http://www.aer.gov.au/sites/default/files/ENA,%20Attachment%203%20-%20NERA%20Report%20-%20The%20Market%20Risk%20Premiuml,%20Submission%20to%20draft%20AER%20rate%20of%20return%20guideline%20-%2011%20Oct%202013.pdf The Market, Size and Value Premiums: A report for the Energy Networks Association, June 2013, http://www.aer.gov.au/sites/default/files/Report%2015%20-%20ENAMRPReport28062013%20Final.pdf Estimates of the Zero-Beta Premium: A report for the Energy Networks Association, June 2013, http://www.aer.gov.au/sites/default/files/Report%202%20-%20Black%20CAPM%20Zero%20Beta%20Estimate%20(Final)%20-%2027%20June..pdf The Payout Ratio: A report for the Energy Networks Association, June 2013, http://www.aer.gov.au/sites/default/files/Report%2012%20-%20Payout%20Ratio%20(Final)%20-%20June%202013.pdf Review of Cost of Equity Models: A report for the Energy Networks Association, June 2013, http://www.aer.gov.au/sites/default/files/Report%201%20-%20Alternative%20Cost%20of%20Equity%20Models%20(Final)%20-%2026%20June.pdf
Historical Estimates of the Market Risk Premium Curriculum Vitae
NERA Economic Consulting 62
The Cost of Equity for a Regulated Energy Utility: A Response to the QCA Discussion Paper on the Risk-Free Rate and the MRP: A report for United Energy and Multinet Gas, March 2013, http://www.qca.org.au/files/CI-UEM-SubNERA-CCR1213-0413.pdf The Cost of Equity for a Regulated Energy Utility: A report for Multinet, February 2013, http://www.erawa.com.au/cproot/11197/2/20130312%20-%20D103642%20-%20Guidelines%20for%20the%20Rate%20of%20Return%20for%20Gas%20Transmission%20and%20Distribution%20Networks%20-%20United%20Energy%20and%20Multinet%20Gas.pdf The Black CAPM: A report for APA Group, Envestra, Multinet & SP AusNet, March 2012, http://www.aer.gov.au/sites/default/files/Attachment%209.6%20NERA%20-%20Black%20CAPM%20Report%20March%202012.pdf Prevailing Conditions and the Market Risk Premium: A report for APA Group, Envestra, Multinet & SP AusNet, March 2012, http://www.aer.gov.au/content/item.phtml?itemId=753605&nodeId=418ee68d5b881d58515e4f39d9d3aee3&fn=G-5%20NERA%20%20Prevailing%20Conditions%20and%20the%20Market%20Risk%20Premium%20March%202012.pdf The Market Risk Premium: A report for CitiPower, Jemena, Powercor, SP AusNet and United Energy, 20 February 2012, http://www.aer.gov.au/content/item.phtml?itemId=752660&nodeId=fe0280e7e2113c467dfc4b3b076e1623&fn=Vic%20DNSPs%20(NERA)%20-%2020%20February%202012.pdf Cost of Equity in the ERA DBNGP Draft Decision: A report for DBNGP, 17 May 2011, http://www.erawa.com.au/cproot/9669/2/20110620%20-%20DBNGP%20(WA)%20%20-%20Sub%2055%20-%20Att%207%20-%20NERA%20Economic%20Consulting%20Cost%20of%20equity%20in%20the%20draft%20decision.pdf The Market Risk Premium: A report for Multinet Gas and SP AusNet, 29 April 2011, http://www.aer.gov.au/content/index.phtml/itemId/745782 Cost of Capital for Water Infrastructure Company Report for the Queensland Competition Authority, 28 March 2011, http://www.qca.org.au/files/W-NERA-EconomicConsulting-FinalReport-WACC-0411.pdf The Cost of Equity: A report for Orion, 2 September 2010, http://www.comcom.govt.nz/assets/Pan-Industry/Input-Methodologies/Draft-Reasons-Papers/Draft-Reasons-EDBs/Draft-Determination-X-Sub/Orion-Cross-Submission-Attachment-on-EDBs-and-GPBs-Input-Methodologies-Draft-Determination-and-Reasons-Paper-NERA-Report-2-September-2010.pdf
Historical Estimates of the Market Risk Premium Curriculum Vitae
NERA Economic Consulting 63
New Gamma Issues Raised by AER Expert Consultants: A report for JGN, 17 May 2010, http://www.aer.gov.au/content/item.phtml?itemId=736652&nodeId=dea014515519350384275dccc6b56018&fn=JGN%20further%20submission%20on%20gamma%20(18%20May%202010).pdf
The Required Rate of Return on Equity for a Gas Transmission Pipeline: A Report for DBP, 31 March 2010, http://www.erawa.com.au/cproot/8512/2/20100503%20D29252%20DBNGP%20-%20Submission%208%20-%20Annexure%201%20-%20The%20Required%20Rate%20of%20Return%20on%20Equity%20for%20a%20Gas%20Transmission%20Pipeline.pdf
Jemena Access Arrangement Proposal for the NSW Gas Networks: AER Draft Decision: A report for Jemena, 19 March 2010, http://www.aer.gov.au/content/item.phtml?itemId=735229&nodeId=4dc041cfe6e30a2c2b91e833cad31191&fn=Appendix%205.1%20-%20NERA%20-%20FAMA%20French%20Report.pdf
Payout Ratio of Regulated Firms: A report for Gilbert + Tobin, 5 January 2010, http://www.aer.gov.au/content/item.phtml?itemId=735236&nodeId=10e87413b13d1da23cd55faf20a6918d&fn=Appendix%206.3D%20-%20NERA%20(4%20Jan%2010,%20ETSA)%20Payout%20ratio%20of%20regulated%20firms.pdf
Review of Da, Guo and Jagannathan Empirical Evidence on the CAPM: A report for Jemena Gas Networks, 21 December 2009, http://www.ipart.nsw.gov.au/files/Submission%20-%20Alternative%20approaches%20to%20the%20determination%20of%20the%20cost%20of%20equity%20-%20Jemena%20-%20Sandra%20Gamble%20-%2022%20December%202009%20-%20APD%20-%20Website.PDF
The Value of Imputation Credits for a Regulated Gas Distribution Business: A report for WA Gas Networks, 18 August 2009, summarized in: http://www.erawa.com.au/cproot/8357/2/20100215%20WAGN%20-%20Proposed%20Revisions%20to%20the%20AA%20for%20the%20WAGN%20Gas%20Distribution%20Systems%20Submission%20-%20Public%20Version.pdf
Cost Of Equity - Fama-French Three-Factor Model Jemena Gas Networks (NSW), 12 August 2009, http://www.aer.gov.au/content/item.phtml?itemId=730699&nodeId=4fcc57398775fe84685434e0b749d76a&fn=Appendix%209.1%20-%20NERA%20-%20Cost%20of%20equity%20-%20Fama-French%20Model.pdf
Estimates of the Cost of Equity: A report for WAGN, 22 April 2009, summarized in: http://www.erawa.com.au/cproot/8357/2/20100215%20WAGN%20-%20Proposed%20Revisions%20to%20the%20AA%20for%20the%20WAGN%20Gas%20Distribution%20Systems%20Submission%20-%20Public%20Version.pdf
Historical Estimates of the Market Risk Premium Curriculum Vitae
NERA Economic Consulting 64
AER’s Proposed WACC Statement – Gamma: A report for the Joint Industry Associations, 30 January 2009, http://www.aer.gov.au/content/item.phtml?itemId=726698&nodeId=80cf978278d317e99c34ae1878525573&fn=JIA%20Appendix%20Q%20-%20NERA%20-%20AER's%20proposed%20WACC%20statement-Gamma.pdf
The Value of Imputation Credits: A report for the ENA, Grid Australia and APIA, 11 September 2008, http://www.ena.asn.au/udocs/24092008aersub/Appendix%20K%20-%20The%20value%20of%20imputation%20credits%20-%20NERA.pdf
Consulting Experience
NERA, 2008-present
Lumina Foundation, Indianapolis, 2009
Industry Funds Management, 2010
Academic Publications
Imputation credits and equity returns, (with Paul Lajbcygier), 2012, Economic Record 88, 476-494.
Do measures of investor sentiment predict returns? (with Robert Neal), 1998, Journal of
Financial and Quantitative Analysis 33, 523-547.
Adverse selection and bid-ask spreads: Evidence from closed-end funds (with Robert Neal), 1998, Journal of Financial Markets 1, 121-149.
Shifts in the interest-rate response to money announcements: What can we say about when they occur? (with V. Vance Roley), 1996, Journal of Business and Economic
Statistics 14, 135-138.
International investment restrictions and closed-end country fund prices, (with Catherine Bonser-Neal, Greggory Brauer, and Robert Neal), 1990, Journal of Finance 45, 523-547 (reprinted in International Capital Markets Volume III, 2003, G. Andrew Karolyi and Rene M. Stulz, editors, Edward Elgar Publishing, Cheltenham, Glos).
A critique of latent variable tests of asset pricing models, 1989, Journal of Financial
Economics 21, 177-212.
Some tests of international equity market integration, 1988, Journal of Financial
Economics 21, 177-212 (reprinted in International Capital Markets Volume I, 2003, G. Andrew Karolyi and Rene M. Stulz, editors, Edward Elgar Publishing, Cheltenham, Glos).
Some tests of the consumption-based asset pricing model, 1988, Journal of Monetary
Economics 22, 193-215.

Historical Estimates of the Market Risk Premium Curriculum Vitae
NERA Economic Consulting 65
Working Papers
An evaluation of some alternative models for pricing Australian stocks (with Paul Lajbcygier), 2009.
Intertemporal substitution, small-sample bias, and the behaviour of U.S. household consumption (with Kogulakrishnan Maheswaran and Robert Porter), 2007.
Keeping up with the Joneses, human capital, and the home-equity bias (with En Te Chen), 2003.
Evaluating asset pricing models, 1998.
Time-non-separable preferences or artifact of temporal aggregation? (with Robert Porter), 2002.
Testing asset pricing models with infrequently measured factors, 1989.
Refereeing Experience
Referee for Accounting and Finance, the Australian Journal of Management, Economic Letters, Financial Analysts Journal, Financial Management, Journal of Accounting and Economics, Journal of Business, Journal of Empirical Finance, Journal of Finance, Journal of Financial and Quantitative Analysis, Journal of Financial Economics, Journal of Futures Markets, Journal of International Economics, Journal of International Money and Finance, Journal of Money, Credit, and Banking, Journal of Monetary Economics, Management Science, National Science Foundation, Pacific-Basin Finance Journal, and the Review of Financial Studies.
Program Committee for the Western Finance Association in 1989 and 2000.
Teaching Experience
International Finance, Melbourne Business School, 2008
Corporate Finance, International Finance, Investments, University of Melbourne, 1999-2008
Corporate Finance, International Finance, Investments, Australian Graduate School of Management, 1994-1999
Investments, University of Chicago, 1993-1994
Investments, University of British Columbia, 1986
International Finance, Investments, University of Washington, 1984-1993
Investments, Macroeconomics, Statistics, University of Rochester, 1982
Accounting, 1981, Australian Graduate School of Management, 1981
Historical Estimates of the Market Risk Premium Curriculum Vitae
NERA Economic Consulting 66
Teaching Awards
MBA Professor of the Quarter, Summer 1991, University of Washington
Computing Skills
User of SAS since 1980. EViews, Excel, EXP, LaTex, Matlab, Powerpoint, Visual Basic. Familiar with the Australian School of Business, Compustat and CRSP databases. Some familiarity with Bloomberg, FactSet and IRESS.
Board Membership
Anglican Funds Committee, Melbourne, 2008-2011
Honours
Elected a member of Beta Gamma Sigma, June 1986.
Fellowships
Earhart Foundation Award, 1982-1983
University of Rochester Fellowship, 1979-1984
Simon Fraser University Fellowship, 1979
Inner London Education Authority Award, 1973-1977
Historical Estimates of the Market, Size and Value Premiums
NERA Economic Consulting 67
Report qualifications/assumptions and limiting conditions
This report is for the exclusive use of the NERA Economic Consulting client named herein. This report is not intended for general circulation or publication, nor is it to be reproduced, quoted or distributed for any purpose without the prior written permission of NERA Economic Consulting. There are no third party beneficiaries with respect to this report, and NERA Economic Consulting does not accept any liability to any third party.
Information furnished by others, upon which all or portions of this report are based, is believed to be reliable but has not been independently verified, unless otherwise expressly indicated. Public information and industry and statistical data are from sources we deem to be reliable; however, we make no representation as to the accuracy or completeness of such information. The findings contained in this report may contain predictions based on current data and historical trends. Any such predictions are subject to inherent risks and uncertainties. NERA Economic Consulting accepts no responsibility for actual results or future events.
The opinions expressed in this report are valid only for the purpose stated herein and as of the date of this report. No obligation is assumed to revise this report to reflect changes, events or conditions, which occur subsequent to the date hereof.
All decisions in connection with the implementation or use of advice or recommendations contained in this report are the sole responsibility of the client. This report does not represent investment advice nor does it provide an opinion regarding the fairness of any transaction to any and all parties.
NERA Economic Consulting
Darling Park Tower 3
201 Sussex Street
Sydney NSW 2000
Australia
Tel: 61 2 8864 6500 Fax: 61 2 8864 6549
www.nera.com