jemena gas networks (nsw) ltd - aa review - 6 capex... · jemena gas networks (nsw) ltd ... content...
TRANSCRIPT
Jemena Gas Networks (NSW) Ltd
2015-20 Access Arrangement Information
Appendix 6.2
JGN Asset Management Plan 2015-20
Public
30 June 2014


Jemena Gas Networks AMP i
JEMENA GAS NETWORKS
ASSET MANAGEMENT PLAN
1 JULY 2014 TO 30 JUNE 2020
© Jemena Gas Networks (NSW) Ltd 2014. All rights reserved. Copyright in the whole and every
part of this document belongs to Jemena. The document cannot be used, transferred, copied or
reproduced in whole or in part in any manner or form or in any media to any person other than
with the prior written consent of Jemena.
Jemena Gas Networks AMP ii
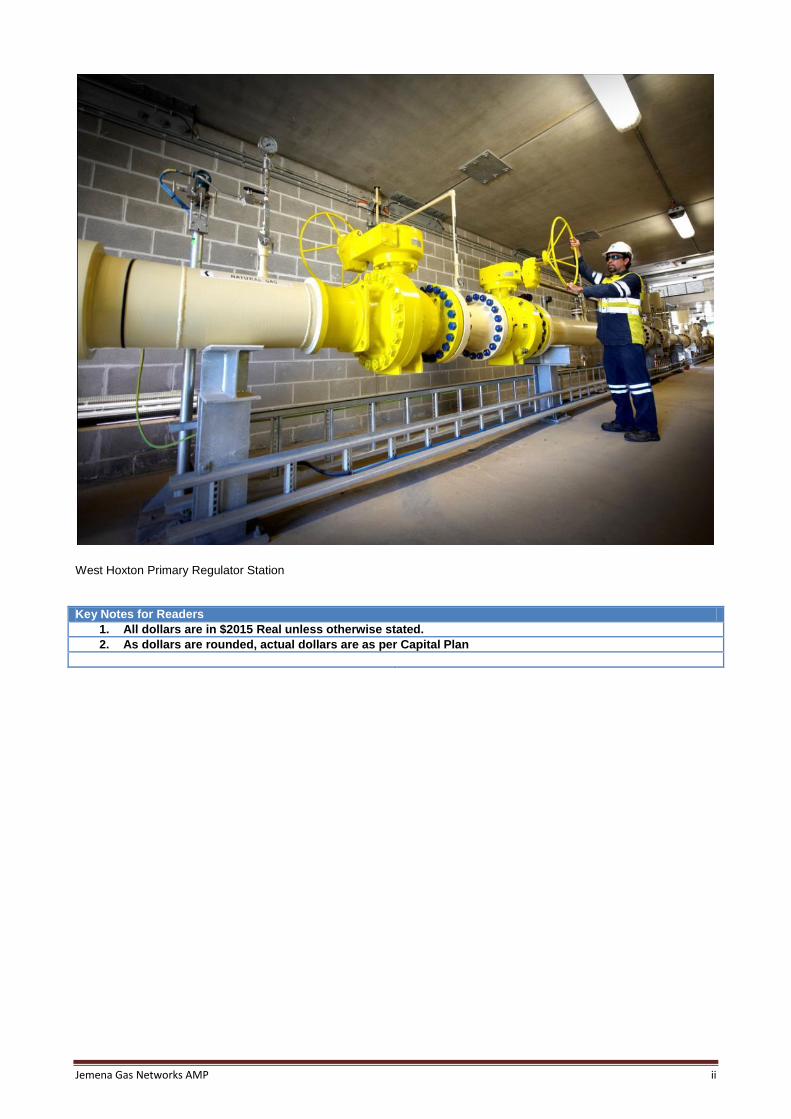
West Hoxton Primary Regulator Station
Key Notes for Readers
1. All dollars are in $2015 Real unless otherwise stated.
2. As dollars are rounded, actual dollars are as per Capital Plan

Jemena Gas Networks AMP iii
JEMENA GAS NETWORKS
ASSET MANAGEMENT PLAN
1 JULY 2014 to 30 JUNE 2020 (6 YEAR PLAN)
DOCUMENT CONTROL The Asset Management Plan is a Controlled Document with the Master Copy maintained in the Jemena Enterprise
Content Management System (ECMS).
This Master Copy is controlled by the Document Controller, in accordance with the approved Records Management
Plan.
The document is uncontrolled when printed.
SIGNATORIES

Jemena Gas Networks AMP iv
EXECUTIVE SUMMARY
This Asset Management Plan (AMP) describes JGN’s distribution and non-distribution capital and operating
plans over the period 1 July 2014 to 30 June 2020, which encompasses one year of the current Access
Arrangement (AA) period (i.e. regulatory year 2015 (RY15)) and the upcoming five year AA period (i.e.
regulatory years 2016-2020 (RY16-RY20)).
The AMP relates to JGN's gas distribution network, which is used to deliver gas in Sydney, Newcastle,
Wollongong, the Central Coast region and over 20 country centres within the Central Tablelands, Central
West, Southern Tablelands and Riverina regions of NSW. The network consists of over 25,000 km of mains
and pipelines, transporting natural gas to approximately 1.2 million customers who consume nearly 100
petajoules (PJ) of gas per annum. The value of the assets for regulatory purposes is $2,698.4 million as at
30 June 2013.
JGN incurs two broad types of costs or expenditure in providing gas services:
Capital expenditure — which is incurred in providing the physical assets, such as pipes, meters, and
computer systems that are required to deliver gas services. The capital expenditure incurred by
JGN ranges from small standard works, like installing a small length of pipe and a meter to connect
a new customer, to large multi-million dollar projects. The three categories of capital expenditure
that JGN incurs are:
o Market expansion capital expenditure – this category of capital expenditure includes the costs of
laying new pipes and installing meters to connect new customers
o Reinforcement, renewal and replacement capital expenditure – this category of capital
expenditure includes the costs associated with replacing old and/or broken pipes, gas stations
and meters, and installing ‘bigger’ pipes or gas pressure equipment to cater for peak demand
growth (also referred to as Capacity Development)
o Non-distribution capital expenditure – this category of capital expenditure includes the costs of
other supporting assets, such as information technology (IT), motor vehicles, buildings, land and
facilities.
Operating expenditure — which covers the ongoing cost of operating and maintaining the assets
(including emergency response) and performing related functions such as reading meters and
providing billing information to retailers. These costs are generally recurrent and are categorised by
JGN as follows:
o Operations and maintenance – this category of operating expenditure includes the costs of
operating and maintaining the network to ensure gas flows safely and reliably and also includes
meter reading costs
o Corporate support– this category of operating expenditure includes the costs of back-office
support and front-line staff (e.g. human resources and payroll legal and finance teams)
o Information technology– this category of operating expenditure includes the cost of specific IT
support, such as the IT help-desk
Jemena Gas Networks AMP v
o Government fees and levies – this category of operating expenditure includes the costs of
licences, fees and taxes, as well as costs associated with carbon emissions and unaccounted for
gas (UAG).1
This AMP outlines the basis for these two categories of expenditure.
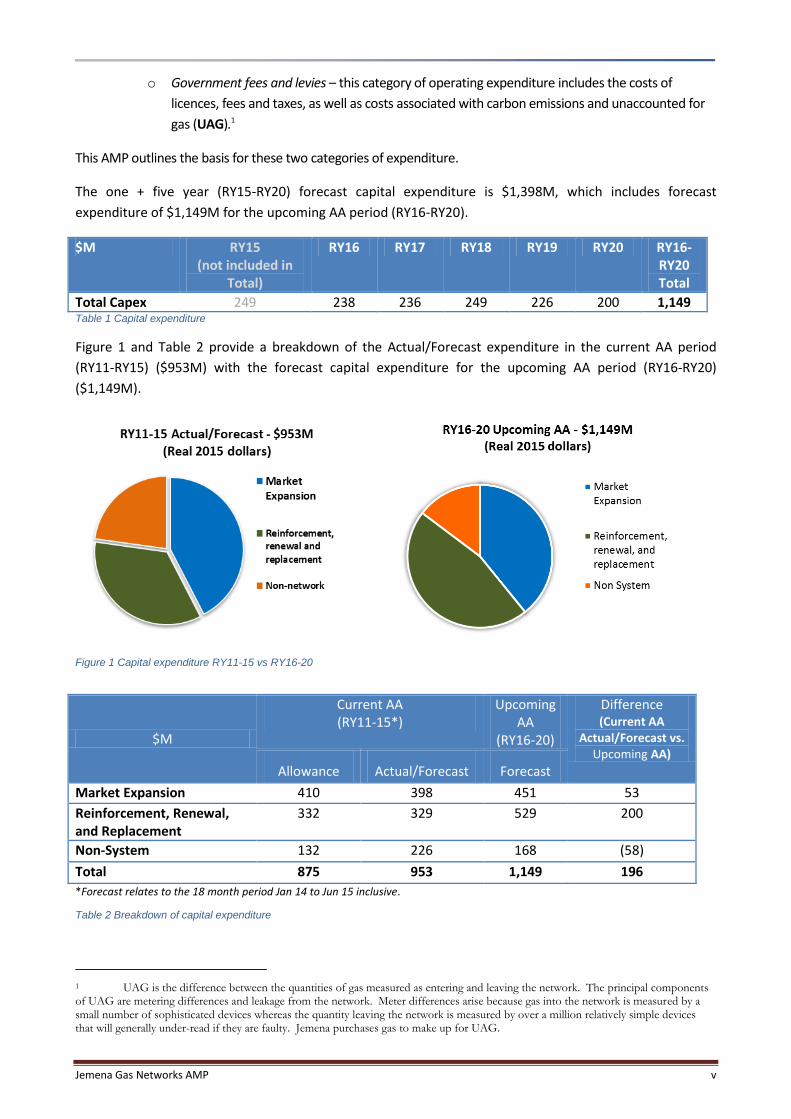
The one + five year (RY15-RY20) forecast capital expenditure is $1,398M, which includes forecast
expenditure of $1,149M for the upcoming AA period (RY16-RY20).
$M RY15 (not included in
Total)
RY16 RY17 RY18 RY19 RY20 RY16-RY20 Total
Total Capex 249 238 236 249 226 200 1,149 Table 1 Capital expenditure
Figure 1 and Table 2 provide a breakdown of the Actual/Forecast expenditure in the current AA period
(RY11-RY15) ($953M) with the forecast capital expenditure for the upcoming AA period (RY16-RY20)
($1,149M).
Figure 1 Capital expenditure RY11-15 vs RY16-20
$M
Current AA (RY11-15*)
Upcoming AA
(RY16-20)
Difference (Current AA
Actual/Forecast vs. Upcoming AA)
Allowance Actual/Forecast Forecast
Market Expansion 410 398 451 53 Reinforcement, Renewal, and Replacement
332 329 529 200
Non-System 132 226 168 (58) Total 875 953 1,149 196 *Forecast relates to the 18 month period Jan 14 to Jun 15 inclusive.
Table 2 Breakdown of capital expenditure
1 UAG is the difference between the quantities of gas measured as entering and leaving the network. The principal components of UAG are metering differences and leakage from the network. Meter differences arise because gas into the network is measured by a small number of sophisticated devices whereas the quantity leaving the network is measured by over a million relatively simple devices that will generally under-read if they are faulty. Jemena purchases gas to make up for UAG.

Jemena Gas Networks AMP vi
As Figure 1 and Table 2 indicate, capital expenditure is expected to increase in the upcoming AA period.
This increase can largely be attributed to the following projects:
Market Expansion:
o The Market Expansion new connection forecast for the RY16-RY20 period is higher than for the RY11-
RY15 period. RY16-RY20 connection numbers are based on CORE forecasts (Mar14) and additional
volume generated by increased marketing expenditure. Costs are based upon the northern and
southern tendered construction unit rates established in 2013.
Replacement, Reinforcement and Renewal:
o The increase in expenditure on Replacement, Reinforcement and Renewal can largely be attributed to
the following programs:
Metering renewal and upgrade - expenditure on this program is expected to increase
in the RY16-RY20 period as a result of an increase in the replacement of residential
meters and aged gas hot water system meters. The increased volumes are required to
meet regulatory requirements, and ensure the integrity of ageing, already life extended,
assets.
Other Stay in Business programs required to ensure the integrity of ageing assets, such
as:
Two key risk mitigation projects:
o The Penrith Primary Mains Thin Wall Project ($17M commencing in
RY15, with the majority of work to occur in the RY16-RY20 period).
This project will involve remediating a section of high pressure pipeline
to bring it into line with current integrity standards
o The Meter Data Logger Project - MDL ($32M commencing in RY15,
with the majority of works to occur in the RY16-RY20 period). This
project will mitigate a revenue risk that would otherwise occur with the
failure of the ageing MDL assets
Integrity digs and in-line inspection (ILI) projects to ensure the integrity of the
high pressure Trunk and Primary mains. These costs were treated as opex in
the RY11-RY15 period.
Two externally driven projects: the APA driven Riverina Packaged Off-take Station
(POTS) Upgrades ($15M for seven stations) and the Northern Trunk Pressure Increase
Mitigation Project ($16M for five stations). Both projects require upgrades to existing
stations, including gas pre-heating solutions due to increased operating pressures of the
pipelines as a result of upstream supply configuration changes supplying the JGN
distribution system.
The renewal of the Mt Druitt steel main, with expenditure of $16M (commencing in
RY15, with the majority of work to occur in the RY16-RY20 period ) expected to be
incurred across the project life.
Jemena Gas Networks AMP vii
While a number of significant Capacity Development projects are to occur in the RY16-
RY20 period, overall expenditure on these projects is expected to be lower than it was in
the RY11-RY15 period. One of the more significant Capacity Development projects to be
undertaken is the Northern Primary project , which will provide capacity to the North
East suburbs of Sydney. It is expected to cost $27M (commencing in RY15, with the
majority in the RY16-RY20 period) to secure land and extend the primary main. Land
acquisition is a key element of the long term strategy.
Non-distribution:
o Overall expenditure on the Non-distribution program is expected to be lower in the RY16-RY20 period
compared to the RY11-RY15 period.
o Leasehold improvements will be lower in RY16-RY20 period due to exceptional items within the RY11-
RY15 period, such as property relocation from existing sites at Sydney Olympic Park and North
Sydney, as wells as JGN’s contribution to the relocation of the Jemena’s corporate office.
o IT related expenditure is discussed in a separate IT specific AMP.
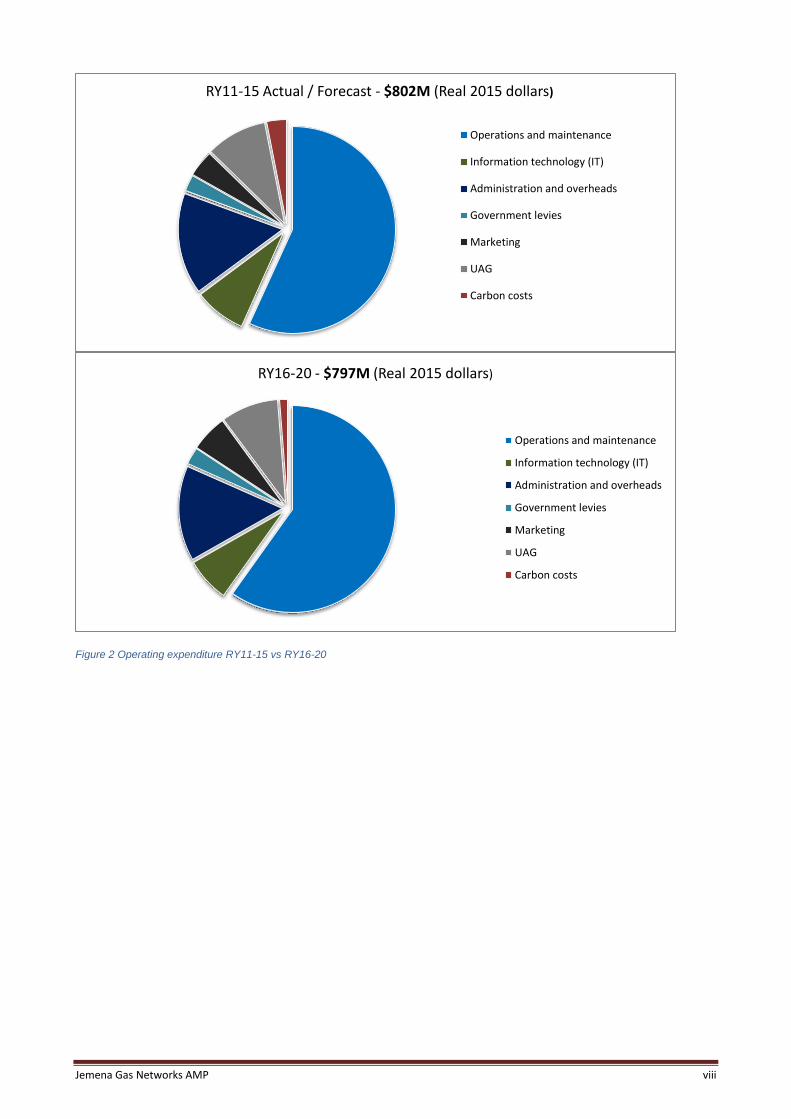
In relation to total operating expenditure, JGN is currently expecting a decrease in RY16-RY20. This is not
withstanding that JGN is forecasting additional operating expenditure due to the cost of changing systems
and additional resources to meet new regulatory obligations, such as AER regulatory reporting and the
National Energy Customer Framework (NECF). Figure 2 provides a breakdown of the operating expenditure
in the current AA period ($802M) and the upcoming AA period ($797M).
Jemena Gas Networks AMP viii
Figure 2 Operating expenditure RY11-15 vs RY16-20
RY11-15 Actual / Forecast - $802M (Real 2015 dollars)
Operations and maintenance
Information technology (IT)
Administration and overheads
Government levies
Marketing
UAG
Carbon costs
RY16-20 - $797M (Real 2015 dollars)
Operations and maintenance
Information technology (IT)
Administration and overheads
Government levies
Marketing
UAG
Carbon costs
Jemena Gas Networks AMP ix
TABLE OF CONTENTS
EXECUTIVE SUMMARY .................................................................................................................................. IV
ABBREVIATIONS .......................................................................................................................................... XIII
1 DOCUMENT OVERVIEW ...................................................................................................................... 1
1.1 PURPOSE .......................................................................................................................................................... 1 1.2 SCOPE ............................................................................................................................................................... 1 1.3 ASSET CATEGORIES ....................................................................................................................................... 2 1.4 ITEMS NOT COVERED BY THIS PLAN ............................................................................................................ 2 1.5 ASSET MANAGEMENT ..................................................................................................................................... 3 1.6 RELATION TO OTHER DOCUMENTS .............................................................................................................. 4
2 INTRODUCTION .................................................................................................................................... 6
2.1 ABOUT JEMENA ............................................................................................................................................... 6 2.2 ORGANISATION STRUCTURE ......................................................................................................................... 6 2.3 STRATEGIC OBJECTIVES ............................................................................................................................... 7 2.4 JEMENA’S VALUES .......................................................................................................................................... 8 2.5 NETWORK OVERVIEW ..................................................................................................................................... 8 2.6 STANDARDS ................................................................................................................................................... 12 2.7 JEMENA ASSET MANAGEMENT APPROACH .............................................................................................. 12
3 ASSET MANAGEMENT DRIVERS ..................................................................................................... 16
4 KEY SUCCESS FACTORS ................................................................................................................. 17
4.1 PUBLIC SAFETY INDICATORS ...................................................................................................................... 17 4.2 CUSTOMER RELIABILITY INDICATORS ....................................................................................................... 18 4.3 CUSTOMERS SERVICE INDICATORS ........................................................................................................... 20 4.4 RISK MITIGATION INDICATORS .................................................................................................................... 21 4.5 UNACCOUNTED FOR GAS ............................................................................................................................ 22
5 PROCESS AND SYSTEM DESIGN .................................................................................................... 24
5.1 RISK MANAGEMENT ...................................................................................................................................... 24 5.2 WORK, HEALTH & SAFETY MANAGEMENT ................................................................................................. 24 5.3 REGULATORY MANAGEMENT (TECHNICAL) .............................................................................................. 26 5.4 ENVIRONMENTAL MANAGEMENT ................................................................................................................ 27 5.5 ASSET MANAGEMENT ................................................................................................................................... 28 5.6 MAINTENANCE PLANNING ............................................................................................................................ 30 5.7 STAKEHOLDER MANAGEMENT .................................................................................................................... 31 5.8 LAND MANAGEMENT ..................................................................................................................................... 32
6 EXPENDITURE SUMMARY ................................................................................................................ 33
6.1 CAPITAL EXPENDITURE (CAPEX) – CAPITAL PLAN ................................................................................... 33 6.2 OPERATIONAL EXPENDITURE (OPEX) AND MAINTENANCE PLAN .......................................................... 33 6.3 CONSISTENCY OF CAPITAL AND MAINTENANCE PLANS WITH THE NGR AND NGL ............................. 34
7 DELIVERY STRATEGY....................................................................................................................... 36
7.1 SUMMARY ....................................................................................................................................................... 36 7.2 FRAMEWORK FOR DELIVERY ...................................................................................................................... 36 7.3 CURRENT DELIVERY ARRANGEMENTS AND PERFORMANCE ................................................................. 38 7.4 AA2015 DELIVERY STRATEGY ...................................................................................................................... 40 7.5 DELIVERY ASSESSMENT .............................................................................................................................. 42
8 ASSET STRATEGY ............................................................................................................................. 44
9 ASSET STRATEGY – PIPELINES AND MAINS ................................................................................ 45
9.1 SUMMARY ....................................................................................................................................................... 45 9.2 BACKGROUND................................................................................................................................................ 45 9.3 TRUNK PIPELINES ......................................................................................................................................... 47 9.4 PRIMARY MAINS ............................................................................................................................................. 51 9.5 SECONDARY MAINS ...................................................................................................................................... 55 9.6 MEDIUM AND LOW PRESSURE MAINS ........................................................................................................ 57
10 ASSET STRATEGY – FACILITIES ..................................................................................................... 62
10.1 SUMMARY ....................................................................................................................................................... 62
Jemena Gas Networks AMP x
10.2 BACKGROUND................................................................................................................................................ 62 10.3 ASSET CONDITION ........................................................................................................................................ 64 10.4 ASSET PERFORMANCE ................................................................................................................................. 65 10.5 CAPITAL REQUIREMENTS ............................................................................................................................ 65 10.6 OPERATIONAL REQUIREMENTS .................................................................................................................. 66
11 ASSET STRATEGY - REGULATOR SETS ........................................................................................ 67
11.1 SUMMARY ....................................................................................................................................................... 67 11.2 BACKGROUND................................................................................................................................................ 67 11.3 ASSET CONDITION ........................................................................................................................................ 68 11.4 ASSET PERFORMANCE ................................................................................................................................. 68 11.5 CAPITAL REQUIREMENTS ............................................................................................................................ 68 11.6 OPERATIONAL REQUIREMENTS .................................................................................................................. 69
12 ASSET STRATEGY – METERING ..................................................................................................... 70
12.1 SUMMARY ........................................................................................................................................................ 70 12.2 CUSTODY TRANSFER ..................................................................................................................................... 70 12.3 NON BILLING METERS – INTRA-NETWORK METERING ................................................................................. 71 12.4 INDUSTRIAL AND COMMERCIAL MEASUREMENT ........................................................................................ 74 12.5 RESIDENTIAL ................................................................................................................................................... 79
13 ASSET STRATEGY - SCADA & COMMUNICATIONS ...................................................................... 86
13.1 SUMMARY ....................................................................................................................................................... 86 13.2 ASSET CONDITION ........................................................................................................................................ 86 13.3 ASSET PERFORMANCE ................................................................................................................................. 86 13.4 CAPITAL REQUIREMENTS ............................................................................................................................ 87 13.5 OPERATIONAL REQUIREMENTS .................................................................................................................. 87
14 ASSET STRATEGY - NON-DISTRIBUTION ...................................................................................... 88
14.1 SUMMARY ....................................................................................................................................................... 88 14.2 INFORMATION TECHNOLOGY ...................................................................................................................... 88 14.3 BUILDINGS, LAND AND FACILITIES .............................................................................................................. 88 14.4 VEHICLES ....................................................................................................................................................... 90
15 APPENDIX 1 - ASSET MANAGEMENT POLICY ............................................................................... 92
16 APPENDIX 2 – HEALTH AND SAFETY POLICY .............................................................................. 93
17 APPENDIX 3 – ENVIRONMENTAL POLICY ...................................................................................... 94
Jemena Gas Networks AMP xi
FIGURE INDEX
Figure 1 Capital expenditure RY11-15 vs RY16-20 ............................................................................................................ v Figure 2 Operating expenditure RY11-15 vs RY16-20 ...................................................................................................... viii Figure 3 JGN process for making expenditure decisions: Planning and consultation ......................................................... 4 Figure 4 Document relationship .......................................................................................................................................... 5 Figure 5 Accountability of individual asset owners .............................................................................................................. 6 Figure 6 JGN strategy ......................................................................................................................................................... 7 Figure 7 JGN values ........................................................................................................................................................... 8 Figure 8 Network pipelines .................................................................................................................................................. 8 Figure 9 JGN network ......................................................................................................................................................... 9 Figure 10 Asset Management System planning timeline .................................................................................................. 13 Figure 11 JGN AMS planning cycle .................................................................................................................................. 14 Figure 12 AMP/Budget timelines ....................................................................................................................................... 14 Figure 13 Network incidents notifiable to technical regulator ............................................................................................ 17 Figure 14 Public reported escapes .................................................................................................................................... 18 Figure 15 SAIDI outcomes ................................................................................................................................................ 19 Figure 16 SAIFI ................................................................................................................................................................. 19 Figure 17 Poor gas supply incidents reported by the public .............................................................................................. 20 Figure 18 Percentage of standard electricity to gas (E-G) connections completed within 20 days ................................... 20 Figure 19 Emergency Response less than 60 minutes ..................................................................................................... 21 Figure 20 Pipeline patrol (distribution) ............................................................................................................................... 21 Figure 21 Leakage location ............................................................................................................................................... 22 Figure 22 Unaccounted for Gas ........................................................................................................................................ 23 Figure 23 Asset and public safety committee structure ..................................................................................................... 26 Figure 24 Capex Plan RY15 -RY20 .................................................................................................................................. 33 Figure 25 Opex Plan RY15- RY20 .................................................................................................................................... 34 Figure 26 Grouped asset classes ...................................................................................................................................... 44 Figure 27 Age profile of pipelines ...................................................................................................................................... 47 Figure 28 Exposing the Licence 1 pipeline at Simpsons Creek during mine subsidence works........................................ 48 Figure 29 Site preparation for protective works prior to a road crossing ........................................................................... 53 Figure 30 Steel main being laid ......................................................................................................................................... 56 Figure 31 Typical cast iron mains condition prior to rehabilitation ..................................................................................... 58 Figure 32 Insertion of nylon pipe as part of rehabilitation project ...................................................................................... 60 Figure 33 Underground PRS installation ........................................................................................................................... 62 Figure 34 Age Profile of Facilities ...................................................................................................................................... 64 Figure 35 Age profile of SRS ............................................................................................................................................. 67 Figure 36 Custody transfer station .................................................................................................................................... 71 Figure 37 Civil works for construction of Lane Cove PRS ................................................................................................. 73 Figure 38 Diaphragm meters age profile ........................................................................................................................... 75 Figure 39 Turbine meter age profile .................................................................................................................................. 75 Figure 40 Rotary meter age profile .................................................................................................................................... 75 Figure 41 Age profile of residential meter assets .............................................................................................................. 80 Figure 42 Residential gas meter ....................................................................................................................................... 82

Jemena Gas Networks AMP xii
TABLE INDEX
Table 1 Capital expenditure ................................................................................................................................................ v Table 2 Breakdown of capital expenditure .......................................................................................................................... v Table 3 Abbreviations........................................................................................................................................................ xv Table 4 Key asset categories .............................................................................................................................................. 2 Table 5 Five gas receipt points supplying Sydney, Newcastle, and Wollongong ................................................................ 9 Table 6 MSP pipeline sections .......................................................................................................................................... 10 Table 7 JGN network statistics .......................................................................................................................................... 10 Table 8 Scope of Asset and Public Safety Committees .................................................................................................... 26 Table 9 Delivery channels summary ................................................................................................................................. 39 Table 10 Programs and delivery channels ........................................................................................................................ 41 Table 11 Pipeline Assets ................................................................................................................................................... 46 Table 12 Trunk pipelines key features .............................................................................................................................. 48 Table 13 Program RY15-RY20 ......................................................................................................................................... 50 Table 14 Summary of Trunk mains Capital Plan ............................................................................................................... 51 Table 15 Primary mains .................................................................................................................................................... 51 Table 16 Program RY15-RY20 ......................................................................................................................................... 54 Table 17 Summary Primary mains Capital Plan ................................................................................................................ 54 Table 18 Summary Secondary mains Capital Plan ........................................................................................................... 57 Table 19 Summary of medium and low pressure mains Capital Plan ............................................................................... 61 Table 20 Trunk and primary facilities ................................................................................................................................ 63 Table 21 Summary trunk and primary facilities Capital Plan ............................................................................................. 66 Table 22 Summary DRS facilities Capital Plan ................................................................................................................. 69 Table 23 Summary Meter Capital Plan.............................................................................................................................. 70 Table 24 Custody transfer summary ................................................................................................................................. 72 Table 25 Summary of industrial and commercial meters................................................................................................... 74 Table 26 I&C Measurement replacement meter volumes ................................................................................................. 78 Table 27 New I&C meters - market expansion .................................................................................................................. 78 Table 28 Summary of I&C metering capital plan .............................................................................................................. 78 Table 29 Overview of residential meters ........................................................................................................................... 80 Table 30 New residential gas meters - market expansion ................................................................................................. 83 Table 31 Asset replacement program per category volumes ............................................................................................ 84 Table 32 Total residential meter capex ............................................................................................................................. 84 Table 33 Summary of SCADA facilities Capital Plan ......................................................................................................... 87 Table 34 Summary IT Capital Plan ................................................................................................................................... 88 Table 35 Summary Buildings, land and facilitates Capital Plan ......................................................................................... 90 Table 36 Vehicle summary ................................................................................................................................................ 90 Table 37 Summary of Vehicle Capital Plan ....................................................................................................................... 91

Jemena Gas Networks AMP xiii
ABBREVIATIONS
Acronym Description
AA Access Arrangement
ACQ Annual Contract Quantity (ACQ)
AER Australian Energy Regulator
ALARP As Low As Reasonably Practical
ALBV Automatic Line Break Valve
AMA Asset Management Agreement
AMP Asset Management Plan
APA Australian Pipeline Trust (part of the APA group listed on the ASX)
AS Australian Standard
CABS Contract Administration and Billing System
CDP Capacity Development Project
CEF Clean Energy Future
CHOS Consumers Hours Off Supply
CM Corrective Maintenance
CP Cathodic Protection
CTS Custody Transfer Station
CY Calendar Year
DBYD Dial Before You Dig
DCVG Direct Current Voltage Gradient
DPI Delivery Point Identifier
DRS District Regulator Set
DTIRIS NSW Department of Trade and Investment Regional Infrastructure and Services
EGP Eastern Gas Pipeline
E&I Electrical and Instrumentation
ELMS Emergency Load Management System
EMP Environment Management Plan
EMS Environmental Management System
EPA Environment Protection Authority
FA Feasibility Assessment
FEED Front-End Engineering Design
FIMPS Facility Integrity Management Plan
FSA Formal Safety Assessment
GASS Gas Accounting Service System
GAW Government Authority Work
GC Gas Chromatograph
GPS Global Positioning System

Jemena Gas Networks AMP xiv
Acronym Description
GST Gas Supply Technician
HDPE High Density Polyethylene
HP / LP / MP High Pressure / Low Pressure / Medium Pressure
HSEQ Health, Safety, Environment and Quality
I&C Industrial and Commercial
ICRC Independent Competition and Regulatory Commission
ICT Information and Communications Technology
ILI In-line Inspection
IT Information Technology
IPART Independent Pricing and Regulatory Tribunal
JAM Jemena Asset Management
JGN Jemena Gas Network (NSW) Ltd
KPI Key Performance Indicator
LMS Land Management System
LPRS Low Pressure Regulator Set
MAOP Maximum Allowable Operating Pressure
MHQ Maximum Hourly Quantity
MLV Main Line Valve
MOMs Munmorah Off take Metering Station
MPRS Medium Pressure Regulator Set
MTF Meter Testing Facility
NGR National Gas Rules
NGERS National Greenhouse and Energy Reporting Scheme
NECF National Energy Customer Framework
NGSF Newcastle Gas Storage Facilities
NPI National Pollutant Inventory
NRC Non-Routine Capital
OB Opportunity Brief
OH&S Occupational Health and Safety
O&M Operating and Maintenance
PE Polyethylene
PIG Pipeline Intelligent Gauge
PIMP Pipeline Integrity Management Plan
PM Planned Maintenance
PMM Project Management Methodology
POTS Packaged Off-take Station
PoW Program of Work
PPM Penrith Primary Main

Jemena Gas Networks AMP xv
Acronym Description
PRS Primary Receiving Station
QA Quality Assurance
RTU Remote Telemetry Unit
RUGS Request for Gas Supply
RY Regulatory Year
SAOP Safety and Operating Plan
SCADA Supervisory Control And Data Acquisition
SIMPS Secondary Integrity Management Plans
SMS Safety Management Study
SOE Software Operating Environment
SOP Sydney Olympic Park
SPL Sydney Primary Loop
SRS Secondary Regulator Set
TPRC Technical Policy Review Committee
TRS Trunk Receiving Station
UAG Unaccounted for Gas
WBH Water Bath Heater
Table 3 Abbreviations


Jemena Gas Networks AMP | 1
1 DOCUMENT OVERVIEW
1.1 PURPOSE
The primary purpose of this AMP is to describe the plans required to implement Jemena’s asset
management strategy and ultimately deliver Jemena’s asset management objectives for the NSW gas
distribution network for the period RY15-RY20. The plans cover the following lifecycle activities:
a) Creation, acquisition and enhancement of assets
b) Utilisation of assets
c) Maintenance of assets
d) Decommissioning and/or disposal of assets.
This document also provides an overview of the asset strategy, governance framework and key policies that
influence the ongoing investment, operation and maintenance of JGN’s NSW gas distribution network. This
AMP has also been prepared to assist internal and external stakeholders understand the key planning
inputs that underpin JGN’s approach to managing its network.
1.2 SCOPE
This AMP covers the NSW gas distribution network, which is owned and operated by JGN. The network is
broadly comprised of mains, services, pressure regulation facilities, metering, SCADA and communications
assets and other associated facilities and ancillary equipment. Network assets are generally categorised by
their operating pressure as follows:
Trunk (MAOP of 6,895kPa)
Primary (MAOP of 3,500kPa)
Secondary (MAOP of 1,050kPa)
Medium (MAOP of 210kPa)
Low Pressure (MAOP of either 2kPa or 7kPa).
In addition to the network assets there are the Information Technology (IT), vehicle fleet and property
assets, which are required to support operation of the network.

2 | Jemena Gas Networks AMP
1.3 ASSET CATEGORIES
To reflect how JGN plans and operates the network, the AMP is structured around the key asset groups
listed in the Table 4.
Asset Group Sub Category Section
Pipelines Trunk Pipelines 9.3
Primary Pipelines 9.4
Secondary Pipelines 9.5
Medium & Low Pressure Pipelines 9.6
Facilities Trunk Receiving Stations 10
Packaged Offtake Stations 10
Water Bath Heaters 10
Primary Regulating Stations 10
Automatic Line Break Valves 10
Metering Custody Transfer 12.2
Industrial & Commercial 12.4
Residential 12.5
Regulator Sets Secondary Regulator Sets 11
Medium Pressure Regulator Sets 11
Low Pressure Regulator Sets 11
SCADA and communications
13
Non Distribution Assets
Information Technology 14.2
Building, Lands & Facilities 14.3
Vehicles 14.4 Table 4 Key asset categories
For JGN’s principal asset classes, the plan focuses on optimising the lifecycle costs for that asset class
(including creation, operation, maintenance, renewal and disposal) to meet agreed service levels and future
demand and to ensure that costs, risks and asset system performance are controlled across phases of the
asset lifecycle.
While the AMP covers the six year period from 1 July 2014 to 30 June 2020, the focus of analysis is on the
first two years. Analysis beyond this period is necessarily indicative as it is based on longer term forecasts.
Activities described for that later period will be reviewed prior to their execution as new information
becomes available. Notwithstanding the above, JGN recognises that a longer term assessment of network
needs is an important part of delivering prudent, efficient and reliable gas distribution services for its
customers.
Over the RY15-RY20 period, JGN expects that new requirements will arise that have not currently been
identified. These requirements may lead to changes in the mix of projects that are executed over the
period as some existing projects are re-evaluated and consideration is given to new projects.
1.4 ITEMS NOT COVERED BY THIS PLAN
This AMP is focused on the operation and maintenance of, and investment in, the physical assets that
comprise the JGN NSW gas distribution network, other than IT assets. Consequently it does not cover
demand market and volume market pricing arrangements or commercial agreements with external parties.

Jemena Gas Networks AMP | 3
1.5 ASSET MANAGEMENT
Jemena is committed to being recognised as a world class owner and manager of energy delivery assets.
Jemena’s aim is to act in accordance with best practice asset management standards throughout the group
without compromising health and safety or the environment.
Jemena’s Asset Management Policy, which JGN complies with, is attached in APPENDIX 1 - Asset
Management Policy.
Good practice asset management is ultimately underpinned by the principles of prudent investment and
business management. In the context of JGN’s gas distribution network, this requires the consideration of a
combination of industry experience, sound business management practices and familiarity with the
relevant asset management standards, as well as a range of asset specific Australian and international
standards.
Asset management standards such as PAS55/ISO55000 broadly define an approach that starts with
establishing the overarching strategy for the asset (in this case the JGN’s gas distribution network), and
devolving this through policies, procedures and plans into all aspects of operations. Jemena’s asset
management practice is supported by well-developed documentation that records and provides assurance
that decisions are made to maximise the value of the services delivered by JGN’s gas distribution assets.
Sound capital governance is integral to good asset management practice, as demonstrated through
Jemena’s business management practices. This includes:
formal delegations from the board level through to Jemena’s operational level
supporting policies and procedures to control capital investment
appropriate audit and assurance measures.
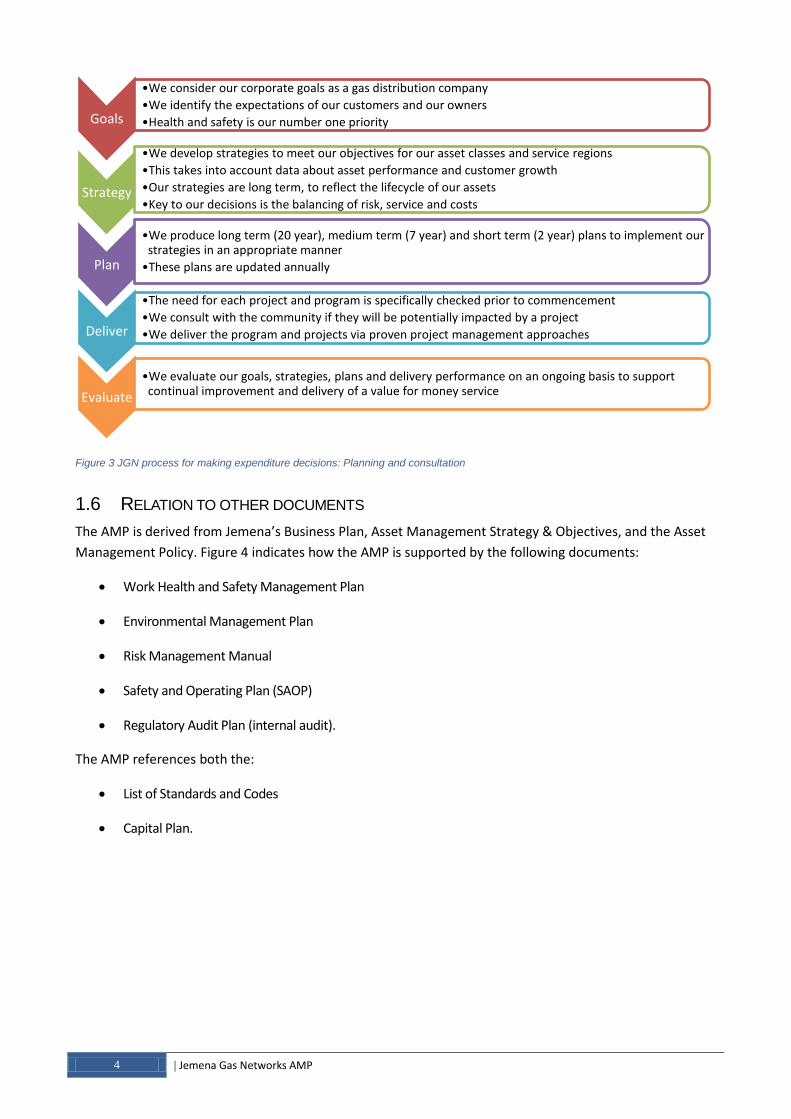
In addition to these governance controls, JGN’s capital investment decisions are evidenced through its
business documentation, which identify the driver for expenditure and demonstrates efficient decisions
throughout the entire asset lifecycle as outlined in Figure 3.
These practices are ultimately integrated with Jemena’s risk management, quality management,
compliance, work health and safety, and environmental management practices. These are outlined in the
following section.
Jemena develops a seven year AMP based on an April – March financial year basis. This AMP has been
recut for regulatory years (July-June) to support JGN’s AA submission.
4 | Jemena Gas Networks AMP
Figure 3 JGN process for making expenditure decisions: Planning and consultation
1.6 RELATION TO OTHER DOCUMENTS
The AMP is derived from Jemena’s Business Plan, Asset Management Strategy & Objectives, and the Asset
Management Policy. Figure 4 indicates how the AMP is supported by the following documents:
Work Health and Safety Management Plan
Environmental Management Plan
Risk Management Manual
Safety and Operating Plan (SAOP)
Regulatory Audit Plan (internal audit).
The AMP references both the:
List of Standards and Codes
Capital Plan.
Goals
•We consider our corporate goals as a gas distribution company
•We identify the expectations of our customers and our owners
•Health and safety is our number one priority
Strategy
•We develop strategies to meet our objectives for our asset classes and service regions
•This takes into account data about asset performance and customer growth
•Our strategies are long term, to reflect the lifecycle of our assets
•Key to our decisions is the balancing of risk, service and costs
Plan
•We produce long term (20 year), medium term (7 year) and short term (2 year) plans to implement our strategies in an appropriate manner
•These plans are updated annually
Deliver
•The need for each project and program is specifically checked prior to commencement
•We consult with the community if they will be potentially impacted by a project
•We deliver the program and projects via proven project management approaches
Evaluate
•We evaluate our goals, strategies, plans and delivery performance on an ongoing basis to support continual improvement and delivery of a value for money service

Jemena Gas Networks AMP | 5
Jemena Business Plan
Asset Management Strategy & Objectives
Asset Management Policy
Asset Management Plan
List of Standards and Codes
Capital Plan
Work Health & Safety
Management Plan
Environmental Management Plan
Risk Management Manual
Safety & Operating Plan (SAOP)
Regulatory Audit Plan (internal
audit)
Figure 4 Document relationship
6 | Jemena Gas Networks AMP
2 INTRODUCTION
2.1 ABOUT JEMENA
Jemena builds, owns and manages a portfolio of major electricity, gas and water assets. With over 1,300
employees across the country, Jemena manages more than $8.5 billion worth of Australian utilities assets
and specialises in gas transmission and distribution as well as electricity distribution.
JGN is a wholly owned by the Jemena group. It provides natural gas distribution services to users of the
JGN NSW gas distribution network.
The JGN NSW gas distribution network traces its origins back to 1837 when The Australian Gas Light
Company was formed to light the streets of Sydney. The network has grown through a combination of
extensions, new developments and acquisitions. It now provides gas to approximately 1.2 million
consumers across Sydney, Newcastle, the Central Coast, and Wollongong, and over 20 country centres
including those within the Central Tablelands, Central West, Southern Tablelands and Riverina districts of
NSW.
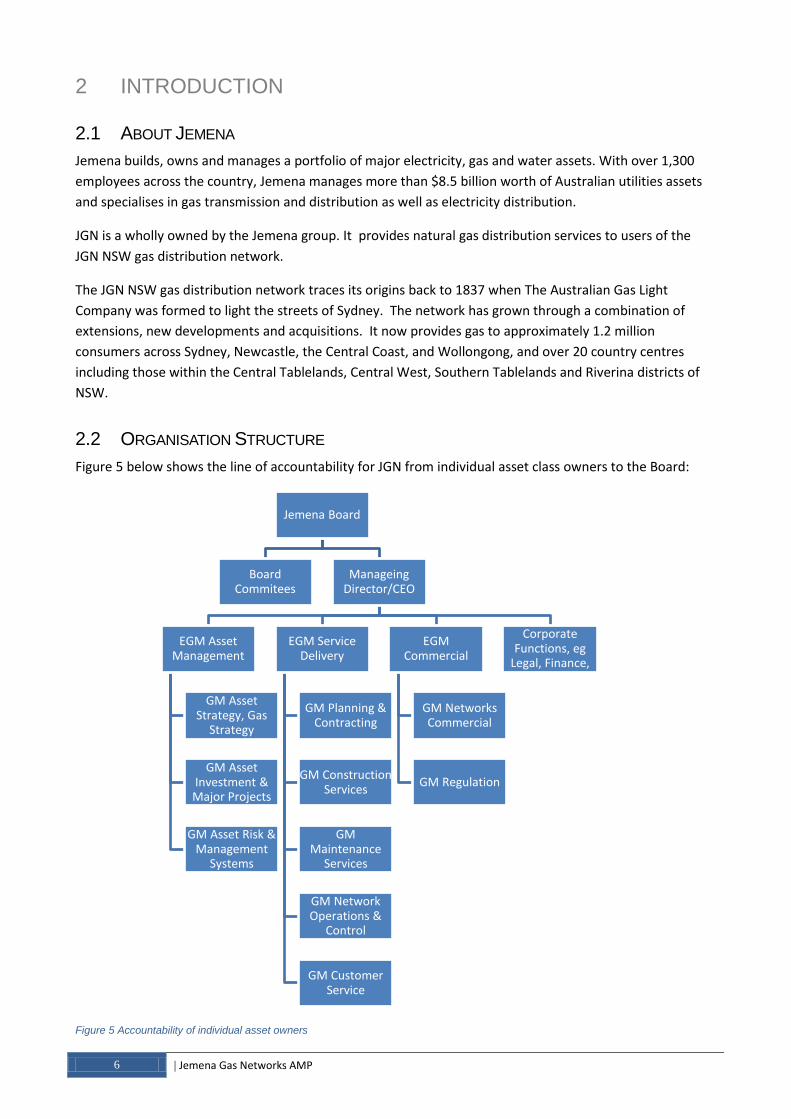
2.2 ORGANISATION STRUCTURE
Figure 5 below shows the line of accountability for JGN from individual asset class owners to the Board:
Figure 5 Accountability of individual asset owners
Jemena Board
Board Commitees
Manageing Director/CEO
EGM Asset Management
GM Asset Strategy, Gas
Strategy
GM Asset Investment & Major Projects
GM Asset Risk & Management
Systems
EGM Service Delivery
GM Planning & Contracting
GM Construction Services
GM Maintenance
Services
GM Network Operations &
Control
GM Customer Service
EGM Commercial
GM Networks Commercial
GM Regulation
Corporate Functions, eg
Legal, Finance,

Jemena Gas Networks AMP | 7
2.3 STRATEGIC OBJECTIVES
Jemena’s vision is to be recognised as a world class owner and manager of energy delivery assets and plans
to realise this vision through developing a corporate culture that achieves the following specific objectives
for its gas network:
Embed a world class safety culture
Be a high performing and engaged workplace that attracts, develops and retains industry leaders
Have highly efficient operations
Deliver customer focused operational excellence
Be an influential market leader with strong customer, regulatory, stakeholder and community
relationships
Deliver financial performance that is superior to industry peers
Achieve regulatory outcomes aligned to the business plan.
These objectives are supported by a strategy that establishes the core operations of the Jemena business,
pursues industry leadership and extends the business to capitalise on new opportunities. In turn, the
strategy is aligned to the five key success factors by which the business’ performance is measured.
The Jemena strategy, which links the vision, strategy and key success factors, has been summarised in a
‘one-page strategy statement’ and is reproduced in Figure 6
Figure 6 JGN strategy

8 | Jemena Gas Networks AMP
2.4 JEMENA’S VALUES
Achieving Jemena’s strategic objectives is reliant on an ongoing commitment to its core values and
behaviours of Health and Safety, Customer Focus, Excellence, Accountability and Teamwork as
represented in Figure 7.
Figure 7 JGN values
2.5 NETWORK OVERVIEW
JGN distributes natural gas from the transmission pipeline receipt points to NSW gas customers via a series
of pipelines. Figure 8 illustrates how the pressure steps down from 6,895kPa to a minimum of 2kPa
between these points via a series of receiving stations and regulators. The customer then receives gas via a
meter at the appropriate pressure. Residential and small commercial customers are generally connected to
the medium pressure and low pressure mains, whilst larger commercial and industrial customers are
connected at secondary or primary pressures.
Trunk Main
Trunk Receiving Stations (TRS)
Primary Mains
Primary Regulator
Stations (PRS)
Trunk Receiving Stations (TRS)
Secondary Mains
Receipt Point
Metering
Metering
Metering
MeteringMedium Pressure Mains
MeteringLow Pressure Mains
Secondary Regulator
Stations (SRS)
Medium Pressure Regulator Set (MPRS)
Packaged Off-Take Stations
(POTS)
Secondary Regulator
Stations (SRS)
Figure 8 Network pipelines

Jemena Gas Networks AMP | 9
The key supply points and JGN’s distribution areas are summarised below in Figure 9.
Figure 9 JGN network
In Figure 9, the areas shown in blue represent the geographical coverage of JGN’s distribution network. The
trunk pipelines are the backbone of the network in the Sydney, Newcastle and Wollongong region. The
Eastern Gas Pipeline (EGP) is a key supply artery between Victoria and NSW, while APA’s Moomba to
Sydney Pipeline (MSP) delivers gas from the Cooper Basin and Queensland to Sydney and JGN’s country
networks.
SUPPLY POINTS 2.5.1
The network section that supplies Sydney, Newcastle and Wollongong has five receipt points through which
it accepts gas from three principal sources as per Table 5.
Trunk Pipeline receipt point Owner Sources of Supply
Wilton receipt point
APA)
This receipt point is supplied via APA’s MSP, which is used to transport gas produced in the Cooper Basin and Queensland
Horsley Park receipt point Jemena-owned EGP (not-JGN)
These three receipt points are supplied via the EGP, which is used to transport gas from the Gippsland Basin
Port Kembla receipt point
Albion Park receipt point
Rosalind Park receipt point near Camden AGL Upstream Investments
This receipt point is supplied with coal seam methane produced in the Camden region
Table 5 Five gas receipt points supplying Sydney, Newcastle, and Wollongong
Additionally, a new supply point located adjacent to the existing JGN Hexham facility in the northern trunk
is proposed to be operational in RY15. This supply point is configured to both supply gas to, and receive gas
from, AGL’s Newcastle Gas Storage Facility (NGSF). Over the period this AMP covers, further supplies of
gas are anticipated either through this or additional facilities, and will require augmentation of other JGN
facilities.

10 | Jemena Gas Networks AMP
There are separate country receipt points for each of the country centres served by the JGN network. All of
the country centres are connected to APA’s MSP. The relevant sections of the MSP that are used to supply
these areas are set out in the table below.
MSP Pipelines Section Supply
MSP - Young to Lithgow lateral Cowra, Blayney, Orange, Millthorpe, Bathurst, Oberon, Lithgow, Wallerawang
MSP - Young to Wagga Wagga lateral Young, Cootamundra
MSP - Burnt Creek to Griffith lateral Junee, Coolamon, Ganmain, Narrandera, Rockdale Beef , Leeton, Murrami, Griffith
MSP - Young to Wilton Boorowa, Yass, Goulburn, Marulan, Moss Vale, Berrima, Bowral, Bargo, Sally’s Corner, Bingara Gorge, Wilton
Central West Pipeline – Marsden to Dubbo Dubbo, Dubbo West, Forbes, Parkes, Narromine, West Wyalong
Table 6 MSP pipeline sections
JGN NETWORK 2.5.2
As at 30 June 2013, JGN’s network had 1,174,552 connections (equating to greater than 1.2 million
customers) and delivered approximately 100PJ of gas per annum. Some other key network statistics are set
out in Table 7.
Network Statistic
Trunk Mains 267 km
Primary Mains 147 km
Mains <=1050kPa 24,963 km
Trunk Receiving Stations (incl. POTS) 55
Bulk Metering Stations 2
Primary Regulating Stations 17
Regulator Sets 619
Residential Gas Meters 1,121,553
Industrial and Commercial Gas Meters 43,865
Water Meters 173,188 units Table 7 JGN network statistics
REGULATORY FRAMEWORK 2.5.3
JGN is subject to a range of regulatory requirements, which are specific to its activities as a gas distribution
business.
Access regulation
JGN’s distribution network is a classified as a “covered pipeline” under the National Gas Law (NGL). As a
covered pipeline service provider, JGN must:
Prepare an AA which must be submitted to and approved by the Australian Energy Regulator (AER)
and then periodically reviewed and revised. The AA sets out the reference services that JGN offers
to network users (including prospective users) as well as the terms and conditions (including
prices), on which JGN will offer those services to network users.
Comply with a range of other obligations including those that deal with ring fencing.

Jemena Gas Networks AMP | 11
Licensing and licence-related obligations
As operator of a gas distribution pipeline, JGN must hold a reticulator’s authorisation under the Gas Supply
Act 1996 (NSW). Authorisations are granted by the NSW Minister for Resources and Energy on advice from
the NSW Independent Pricing and Regulatory Tribunal (IPART).
JGN also holds five pipeline licences under the Pipelines Act 1967 (NSW). The licences cover the
construction, operation and maintenance of its trunk pipelines. The licences have each been granted by
the Governor of NSW. Regulatory oversight of these pipelines and licences rests with the NSW Department
of Trade and Investment, Regional Infrastructure and Services (DTIRIS).
Between them, the Gas Supply Act 1996 and the Pipelines Act 1967 and Regulations made under these
Acts, as well as the authorisation and pipeline licences themselves, impose a significant number of
obligations on JGN, including obligations relating to metering, asset safety, and compliance with standards
and reporting.
The National Energy Customer Framework
The National Energy Retail Law (NERL) and National Energy Retail Rules (NERR) and associated
amendments to the National Gas Rules (NGR)2 as well as Regulations—together the National Energy
Customer Framework (NECF)—commenced in NSW, in transitional form, on 1 July 2013. The NECF imposes
a range of significant obligations on gas distributors including JGN. From JGN’s perspective, a key
dimension to NECF is the creation of new rights and obligations between JGN as the gas distributor and end
consumers, in addition to rights and obligations, as between JGN and network users (and retailers and end-
consumers). This includes a deemed contractual relationship between JGN and gas consumers. Other
requirements relate to, among other things, the classification of customers, the provision of information to
retailers and customers, billing as between JGN and retailers, and the provision of connection services.
THE ACCESS ARRANGEMENT 2.5.4
In the process of reviewing and approving JGN’s AA, the AER is required to approve the prices JGN proposes
to charge for defined reference services. The prices are set so as to provide JGN with “a reasonable
opportunity to recover at least the efficient costs [that JGN] incurs in”:
providing those services
complying with a regulatory obligation or requirement or making a regulatory payment.”3
The NGR specifies how the AER is to go about assessing the efficient level of costs. In principle, the levels of
capital and operating expenditure that the AER allows ‘… must be such as would be incurred by a prudent
service provider acting efficiently, in accordance with accepted good industry practice, to achieve the lowest
sustainable cost of providing services’.4
In addition to satisfying the above criteria, capital expenditure must be justifiable on the basis that the:5
2 Principally new parts 12A and 21 in the NGR.
3 NGL, section 24(2).
4 NGR, rules 79(1)(a) and 91.
5 NGR, rules 79(1)(b) and 79(2).
12 | Jemena Gas Networks AMP
(a) the overall economic value6 of the expenditure is positive,
(b) the present value of the additional revenue to be generated as a result of the expenditure exceeds the
present value of the capital expenditure, or
(c) the capital expenditure is necessary:
o to maintain and improve the safety of services or
o to maintain the integrity of services or
o to comply with a regulatory obligation or requirement or
o to maintain the service provider's capacity to meet levels of demand for services’ or
(d) the capital expenditure is an aggregate amount divisible into two parts, one referable to incremental
services and justifiable under paragraph (b) and the other referable to a purpose referred to in (c).
2.6 STANDARDS
JGN complies with the relevant guiding standards and codes. A register of the applicable standards is
available in JGN’s List of Standards and Codes.
2.7 JEMENA ASSET MANAGEMENT APPROACH
JGN operates under an integrated Asset Management System (AMS), which is designed to optimise the
performance of assets over its full life cycle. Jemena is in the process of reviewing its AMS and approaches
to leverage learnings and harmonise some processes with the Jemena Electricity Network and Jemena’s gas
transmission pipelines.
ASSET MANAGEMENT POLICY 2.7.1
Jemena’s Asset Management Policy (as applied by JGN) was established by the Asset Management System
Review Committee and approved by the Managing Director in January 2014. The policy is included in full in
APPENDIX 1 - Asset Management Policy.
The key features of the policy commit JGN to:
Manage the network in an environmentally friendly way with no compromise to health and safety
Become world class owners and managers of energy delivery assets
Comply with regulatory and legislative requirements
Deliver corporate objectives and policy
Establish, maintain and govern an effective AMS.
6 In deciding whether the overall economic value of capital expenditure is positive, consideration is to be given only to economic value directly accruing to the service provider, gas producers, users and end users
Jemena Gas Networks AMP | 13
PAS 55 2.7.2
One of Jemena’s key success factors is “Leading Asset Management”. As an outcome of the review of
initiatives to achieve this success factor, Jemena has committed to achieve PAS-55/ISO 55000 certification.
PAS-55 is a risk management focused approach to asset management. Certification requires the
demonstration of robust and transparent asset management processes, policies, procedures, practices and
a sustainable performance framework.
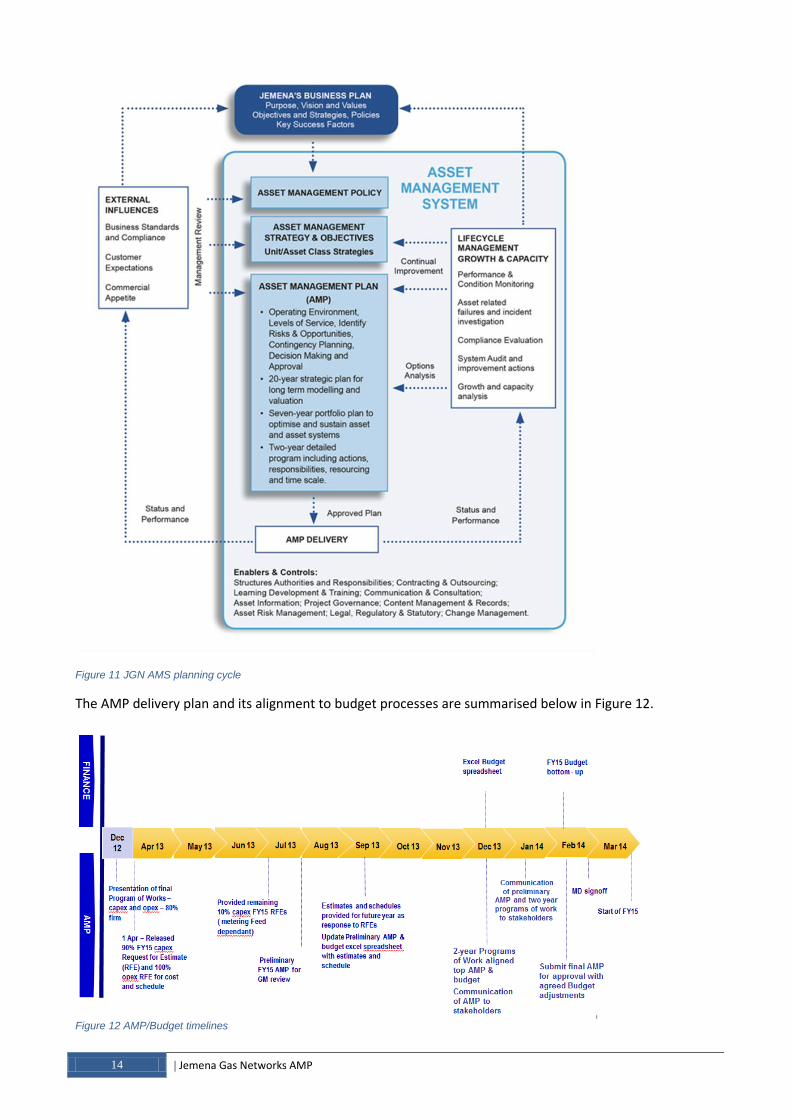
ASSET MANAGEMENT SYSTEM 2.7.3
The key linkage of JGN’s AMP to the business plan, strategy and objectives is the AMS7 document, which
provides a consistent, collaborative and integrated approach to the activities undertaken by JGN to manage
the lifecycle of its assets
Jemena’s AMS Diagram (see Figure 11), was endorsed by Jemena’s AMS Review Committee in December
2013. The structure allows for “line of sight” from the Jemena Business Plan through the 20 Year Asset Class
Strategies (incorporating the longer term asset management strategy and objectives, 20 year strategy and
asset class (or unit) strategies) onto the Asset Management Policy and then the two year Programs of Work
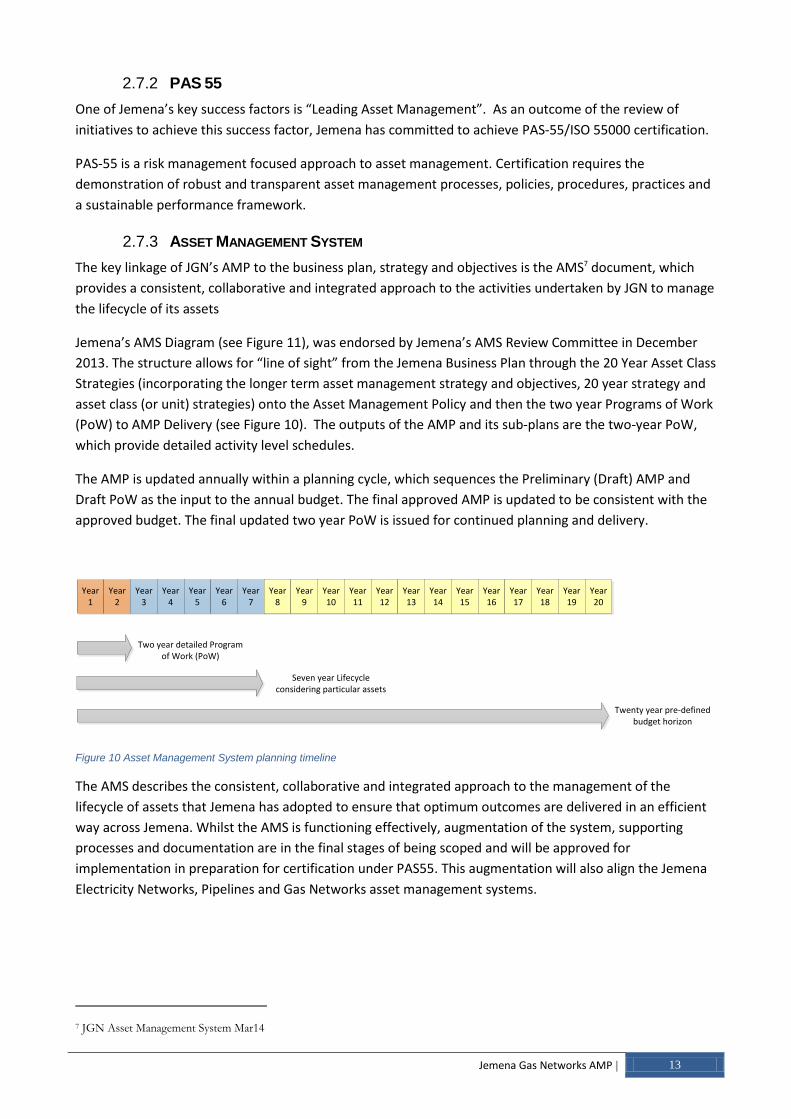
(PoW) to AMP Delivery (see Figure 10). The outputs of the AMP and its sub-plans are the two-year PoW,
which provide detailed activity level schedules.
The AMP is updated annually within a planning cycle, which sequences the Preliminary (Draft) AMP and
Draft PoW as the input to the annual budget. The final approved AMP is updated to be consistent with the
approved budget. The final updated two year PoW is issued for continued planning and delivery.
Year 1
Year 2
Year 3
Year 4
Year 5
Year 6
Year 7
Year 8
Year 9
Year 10
Year 11
Year 12
Year 13
Year 14
Year 15
Year 16
Year 17
Year 18
Year 19
Year 20
Two year detailed Program of Work (PoW)
Seven year Lifecycle considering particular assets
Twenty year pre-defined budget horizon
Figure 10 Asset Management System planning timeline
The AMS describes the consistent, collaborative and integrated approach to the management of the
lifecycle of assets that Jemena has adopted to ensure that optimum outcomes are delivered in an efficient
way across Jemena. Whilst the AMS is functioning effectively, augmentation of the system, supporting
processes and documentation are in the final stages of being scoped and will be approved for
implementation in preparation for certification under PAS55. This augmentation will also align the Jemena
Electricity Networks, Pipelines and Gas Networks asset management systems.
7 JGN Asset Management System Mar14
14 | Jemena Gas Networks AMP
Figure 11 JGN AMS planning cycle
The AMP delivery plan and its alignment to budget processes are summarised below in Figure 12.
Figure 12 AMP/Budget timelines
Jemena Gas Networks AMP | 15
PROGRAM OF WORK 2.7.4
The AMP is structured, as with the normal development cycle of activities, with greater detail for year one
and year two activities than for later years. The detail for years one and two is documented in a series of
PoW, including:
Capital PoW, which includes capital programs and individual projects
Operating/Maintenance PoW, which includes all maintenance related activities
Asset Management PoW, which includes the development of AMPs, technical compliance, project and
program development and other activities within the accountability of the Asset Management groups.
The PoWs initially reflect the two year budget cycle and are updated quarterly to provide a rolling two-year
cycle, setting out the actions, responsibilities, resourcing and time scales for the activities in the programs.
Capital PoW
The two year Capital PoW is currently being enhanced to become a rolling program, with quarterly updates
and a full annual reset with the release of the approved AMP. The key client of the two year PoW is the
Operations Program Management team, which uses the PoW to inform the detailed planning for the
delivery of the program. The Capital PoW provides input for scope definition at a project level to progress
the planning for delivery. As with any long-term program, as the actual delivery timeframe gets closer, the
level (and detail) of planning becomes more granular, reflecting the greater definition of the projects that
make up the program.
Maintenance PoW
JGN details its maintenance activities in the Maintenance PoW. The plan includes forecasted activity levels
for planned and unplanned repair and maintenance activities aimed at maintaining an acceptable level of
risk and integrity of services.
Asset Management PoW
The Asset Management PoW defines the detail, schedule and resource plan for development and
documentation of Asset Class Strategies, Regional Capacity Strategies, Opportunity Briefs (OB) and
Feasibility Assessments (FA). Other activities performed as part of the Asset Management PoW include
technical risk reviews, technical compliance reviews and audits and records management functions.

16 | Jemena Gas Networks AMP
3 ASSET MANAGEMENT DRIVERS
This section outlines the key drivers for JGN’s asset management decisions.
JGN has identified a series of strategic asset management drivers. Along with the drivers’ specific to a
particular asset class, these drivers are used as the basis for the development of the strategies adopted for
the management of the various asset classes forming the gas distribution network. Where there is
inconsistency between drivers, JGN uses its’ understanding of the drivers and its asset management
experience and expertise to balance the drivers in order to optimise the outcomes from the strategies.
These drivers include:
Community expectations
Integrity
Regulatory compliance
Health and safety
Capacity
Service age
New /changing supply sources
A detailed description of each of these drivers is contained in the JGN 20 year asset class strategies
(appendix 6.1 of the AA proposal).
Jemena Gas Networks AMP | 17
4 KEY SUCCESS FACTORS
JGN measures and records its historical network performance to assess success against the Jemena group’s
network objectives as well as for regulatory reporting purposes. Each measurement is a Key Performance
Indicator (KPI). These are then grouped and summarised into five performance areas that are reported
internally on a monthly basis. The five performance areas are:
Public Safety
Customer Reliability
Customer Service
Risk Mitigation
System Audits.
4.1 PUBLIC SAFETY INDICATORS
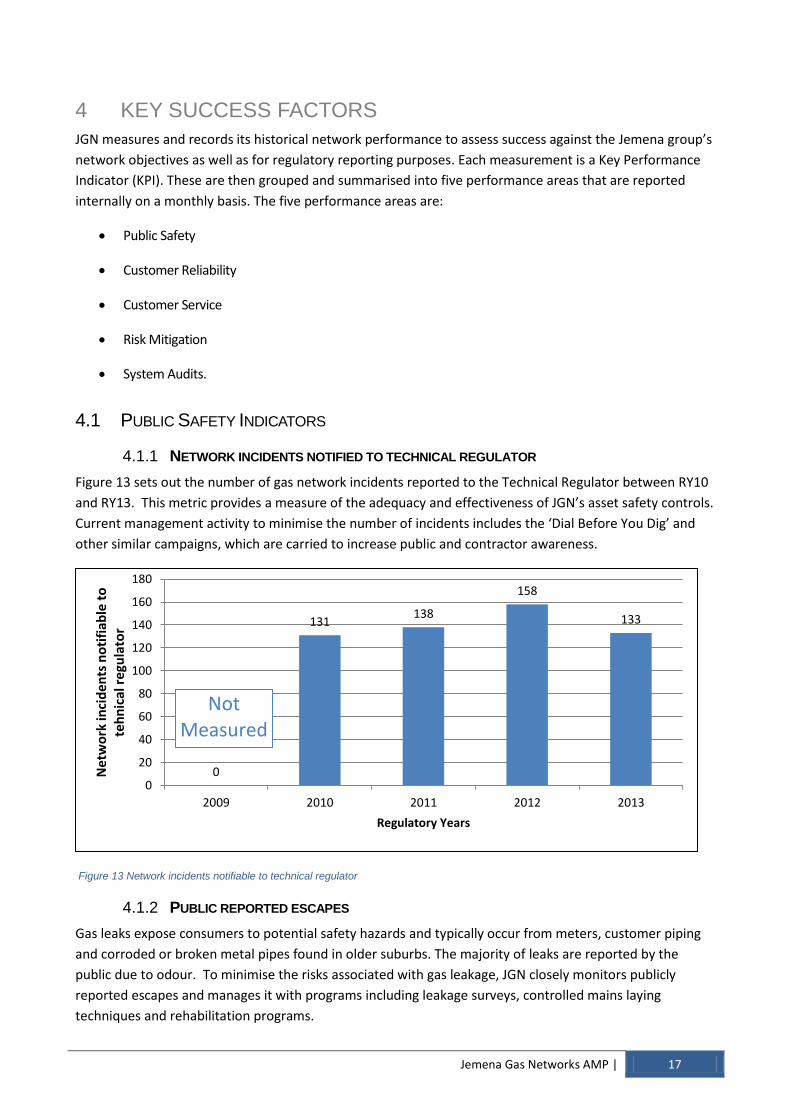
NETWORK INCIDENTS NOTIFIED TO TECHNICAL REGULATOR 4.1.1
Figure 13 sets out the number of gas network incidents reported to the Technical Regulator between RY10
and RY13. This metric provides a measure of the adequacy and effectiveness of JGN’s asset safety controls.
Current management activity to minimise the number of incidents includes the ‘Dial Before You Dig’ and
other similar campaigns, which are carried to increase public and contractor awareness.
Figure 13 Network incidents notifiable to technical regulator
PUBLIC REPORTED ESCAPES 4.1.2
Gas leaks expose consumers to potential safety hazards and typically occur from meters, customer piping
and corroded or broken metal pipes found in older suburbs. The majority of leaks are reported by the
public due to odour. To minimise the risks associated with gas leakage, JGN closely monitors publicly
reported escapes and manages it with programs including leakage surveys, controlled mains laying
techniques and rehabilitation programs.
0
131 138
158
133
0
20
40
60
80
100
120
140
160
180
2009 2010 2011 2012 2013
Net
wo
rk in
cid
ents
no
tifi
able
to
te
hn
ical
reg
ula
tor
Regulatory Years
Not Measured

18 | Jemena Gas Networks AMP
Figure 14 sets out the number of publicly reported gas leaks per km of pipeline between RY09 and RY13.
This metric is considered to be within acceptable levels. In its recent annual performance report, the
DTIRIS also made favourable comments about this metric, as reflected in the following extract:8
“Both the number of gas leaks reported per km and per 1000 customers remain at low levels.”
Figure 14 Public reported escapes
4.2 CUSTOMER RELIABILITY INDICATORS
SAIDI (System Average Interruption Duration Index) and SAIFI (System Average Interruption Frequency
Index) are indices used to measure distribution system reliability.
SAIDI 4.2.1
SAIDI is an indicator of distribution system reliability and is measured as the average duration of
interruptions per consumer during the year. Figure 15 sets out the SAIDI between RY09 and RY13. Before
examining this figure, it is worth noting that this indicator can be skewed by major incidents. For example:
In RY10, the Bowral Trunk Station suffered a failure (due to upstream causes unrelated to JGN), which
resulted in the loss of supply to almost 9,000 customers for an extended period. This was an abnormal
incident resulting from contaminated gas being delivered to the Trunk Station. Additional controls have
been implemented to minimise the risk of similar incidents in the future.
In RY12 there were two major incidents, including flooding across areas of the JGN gas distribution
network.
Once the effect of these incidents are removed, JGN’s performance can be considered quite positive, as
noted in the following statement by the DTIRIS in the 2012-13 Gas Networks Annual Performance Summary
Report: 9
“…the reliability indicators show that Network Operators continue to provide a reliable supply of
gas to consumers.”
8 DTIRE, NSW 2012-13 Gas Networks Annual Performance Summary Report, p15.
9 DTIRE, NSW 2012-13 Gas Networks Annual Performance Summary Report, p19.
0.5300 0.5100 0.5000
0.5600 0.5300
0.0
0.1
0.2
0.3
0.4
0.5
0.6
2009 2010 2011 2012 2013
Pu
blic
rep
ort
ed
esc
apes
per
km
of
pip
e
Regulatory Years

Jemena Gas Networks AMP | 19
Figure 15 SAIDI outcomes
SAIFI 4.2.2
SAIFI provides a measure of the number of interruptions per customer connection and is illustrated in
Figure 16 for the RY09-RY13 (Figure 16).
Figure 16 SAIFI
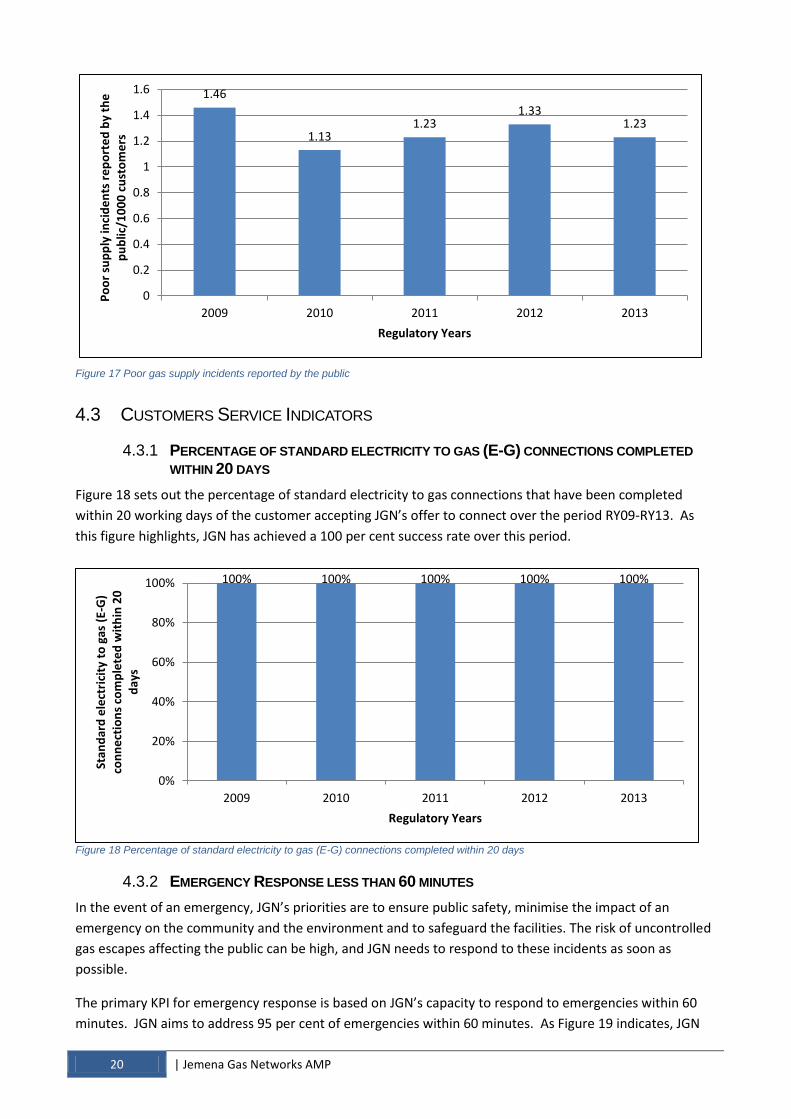
POOR GAS SUPPLY INCIDENTS REPORTED BY THE PUBLIC 4.2.3
Figure 17 sets out the number of poor gas supply incidents reported by the public, which are generally
associated with low network pressures. This indicator is measured by counting work codes relating to poor
gas supply. JGN only started monitoring this KPI in RY12 and is using it to identify areas that may need
system reinforcement or additional maintenance.
1.01
23.82
2.88 2.4 1.14
0
5
10
15
20
25
2009 2010 2011 2012 2013
SAID
I -
Ave
rage
min
ute
s lo
st/1
00
0
cust
om
ers
Regulatory Years
0.000038 0.000038 0.000041
0.000056
0.000037
0.000000
0.000010
0.000020
0.000030
0.000040
0.000050
0.000060
2009 2010 2011 2012 2013
SAIF
I - N
um
ber
of
inte
rru
pti
on
s/co
nsu
mer
Regulatory Years
20 | Jemena Gas Networks AMP
1.46
1.13 1.23
1.33 1.23
0
0.2
0.4
0.6
0.8
1
1.2
1.4
1.6
2009 2010 2011 2012 2013
Po
or
sup
ply
inci
de
nts
re
po
rte
d b
y th
e
pu
blic
/10
00
cu
sto
me
rs
Regulatory Years
Figure 17 Poor gas supply incidents reported by the public
4.3 CUSTOMERS SERVICE INDICATORS
PERCENTAGE OF STANDARD ELECTRICITY TO GAS (E-G) CONNECTIONS COMPLETED 4.3.1WITHIN 20 DAYS
Figure 18 sets out the percentage of standard electricity to gas connections that have been completed
within 20 working days of the customer accepting JGN’s offer to connect over the period RY09-RY13. As
this figure highlights, JGN has achieved a 100 per cent success rate over this period.
Figure 18 Percentage of standard electricity to gas (E-G) connections completed within 20 days
EMERGENCY RESPONSE LESS THAN 60 MINUTES 4.3.2
In the event of an emergency, JGN’s priorities are to ensure public safety, minimise the impact of an
emergency on the community and the environment and to safeguard the facilities. The risk of uncontrolled
gas escapes affecting the public can be high, and JGN needs to respond to these incidents as soon as
possible.
The primary KPI for emergency response is based on JGN’s capacity to respond to emergencies within 60
minutes. JGN aims to address 95 per cent of emergencies within 60 minutes. As Figure 19 indicates, JGN
100% 100% 100% 100% 100%
0%
20%
40%
60%
80%
100%
2009 2010 2011 2012 2013
Stan
dar
d e
lect
rici
ty t
o g
as (
E-G
) co
nn
ect
ion
s co
mp
lete
d w
ith
in 2
0
day
s
Regulatory Years

Jemena Gas Networks AMP | 21
has consistently surpassed this benchmark over the last five years. In its recent annual performance report,
the DTIRIS noted that while the response times to emergencies had increased slightly, the response times
“still remain strong”. 10
Figure 19 Emergency Response less than 60 minutes
4.4 RISK MITIGATION INDICATORS
PIPELINE PATROL 4.4.1
Pipeline patrol is a key activity in ensuring no interference on JGN’s higher risk assets. Figure 20 sets out the
percentage of pipeline patrol work completed on schedule over the last five years. As this figure indicates,
JGN has consistently carried out this work on schedule over this period.
Figure 20 Pipeline patrol (distribution)
LEAKAGE SURVEY (KPI 12) 4.4.2
This indicator monitors whether planned leakage surveys are being completed to schedule. JGN began
tracking this KPI in RY11 via job work codes. JGN’s performance in relation to this indicator is set out in
10 DTIRE, NSW 2012-13 Gas Networks Annual Performance Summary Report, p19.
98% 98% 97% 97% 97%
0%
20%
40%
60%
80%
100%
2009 2010 2011 2012 2013
Pe
rce
nta
ge o
f e
me
rge
ncy
re
spo
nse
jo
bs
att
en
de
d i
n le
ss t
han
60
min
s
Regulatory Years
100% 100% 100% 100% 100%
0%
20%
40%
60%
80%
100%
2009 2010 2011 2012 2013
Pe
rce
nta
ge o
f p
ipe
line
pat
rols
co
mp
lete
d o
n s
che
du
le
Regulatory Years

22 | Jemena Gas Networks AMP
Figure 21. As this figure indicates, JGN has performed strongly in this area over the last three years. In
relation to slight reduction in 2013, it is worth noting that bad weather across the Hunter and Newcastle in
September 2012 caused backlogs, which extended into RY13.
Figure 21 Leakage location
4.5 UNACCOUNTED FOR GAS
The prescribed UAG target for the RY11-RY15 period is 2.34 per cent of network receipts. JGN cannot
recover the cost of UAG in excess of the target. This provides an incentive for JGN to minimise UAG. The
main factors influencing this measure are:
Gas leakage, which can arise as a result of:
o physical leakage
o venting (insignificant).
Measurement error, which can be attributed to:11
o errors in meter reading (automated or manual)
11
The calculation of UAG is largely dependent on the timing of meter reads. All meters at network receipt points and at demand
market sites are read and reported daily. The daily quantities are aggregated into monthly totals. Calculation-based errors are
not introduced in this process. However, volume market meters are read monthly or quarterly on a continuous cycle and this
introduces three issues:
1. No daily information is available for quarterly-read or monthly-read meters
2. For any given time the Volume Market contribution to total sales can only be estimated because all volume meters are not and
cannot be read at the same time; and
3. Quarterly and monthly reads means that the information as to the volumes of sales cannot (by definition) be known until 90 and 30
days, respectively, from the first day of “gas sales” through the meter.
To deal with these three measurement related issues, JGN does the following:
1. To deal with the first issue, JGN assumes that the same daily profile (total of volume market usage and UAG for a day = total
receipts minus demand market usage on the day) applies to volume market meter readings for a specific period within the
cycle. This method appears to work satisfactorily during the summer and winter seasons where usage patterns are
relatively predictable. However, in the spring and autumn shoulders volume market usage changes rapidly and the
assumption to apply the daily profile introduces errors.
2. To deal with the second issue, JGN calculates UAG over a 12 month rolling period.
3. To deal with the third issue, UAG is reported with a three month lag.
0 0
100% 100% 99%
0%
20%
40%
60%
80%
100%
2009 2010 2011 2012 2013
Pe
rce
nta
ge o
f Le
akag
e lo
cati
on
ac
tivi
tie
s co
mp
lete
d o
n s
che
du
le
Regulatory Years
Not Measured
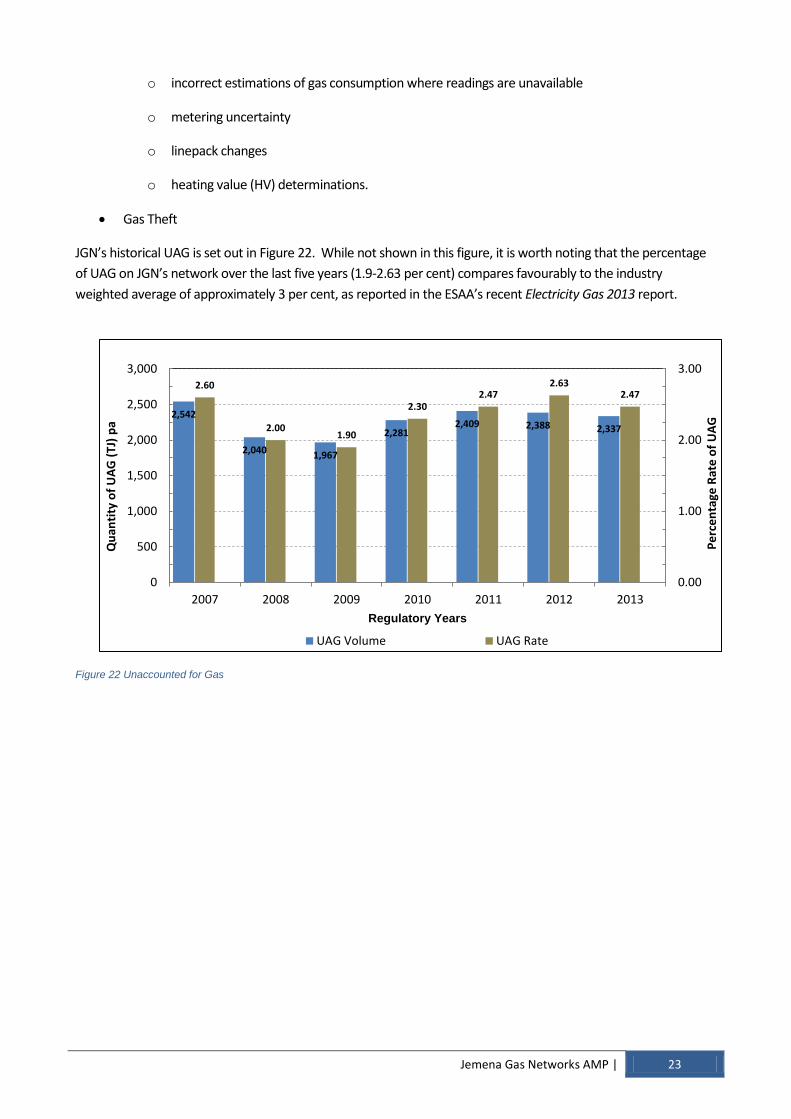
Jemena Gas Networks AMP | 23
o incorrect estimations of gas consumption where readings are unavailable
o metering uncertainty
o linepack changes
o heating value (HV) determinations.
Gas Theft
JGN’s historical UAG is set out in Figure 22. While not shown in this figure, it is worth noting that the percentage
of UAG on JGN’s network over the last five years (1.9-2.63 per cent) compares favourably to the industry
weighted average of approximately 3 per cent, as reported in the ESAA’s recent Electricity Gas 2013 report.
Figure 22 Unaccounted for Gas
2,542
2,040 1,967
2,281 2,409 2,388 2,337
2.60
2.00 1.90
2.30 2.47
2.63 2.47
0.00
1.00
2.00
3.00
0
500
1,000
1,500
2,000
2,500
3,000
2007 2008 2009 2010 2011 2012 2013
Pe
rce
nta
ge R
ate
of
UA
G
Qu
anti
ty o
f U
AG
(TJ
) p
a
Regulatory Years
UAG Volume UAG Rate

24 | Jemena Gas Networks AMP
5 PROCESS AND SYSTEM DESIGN
JGN employs a range of strategies and processes to manage the gas network to achieve the asset
management objectives and ultimately the business objectives. The strategies and processes contain
policies, a system and plan to implement and often a committee to own and oversee. These processes and
systems include:
Risk management
Work, health and safety
Regulatory management
Environmental management
Resource management
Asset management
Stakeholder management
Land management.
Each of these factors forms and integral part of the asset management process. Further detail on the
strategies, policies, processes and systems JGN uses across each of these areas is provided below.
5.1 RISK MANAGEMENT
RISK MANAGEMENT POLICY 5.1.1
JGN operates under Jemena’s Risk Management Policy (SPIAA PO 0050) and Group Risk Management
Manual (SPIAAMA 0050). These documents were developed in line with AS/NZS ISO31000: Risk
Management – Principles and Guidelines.
JEMENA COMPLIANCE AND RISK SYSTEM (JCARS) 5.1.2
JCARS is Jemena’s implementation of SAI Global’s Governance, Risk and Compliance (GRC) management
tool. The system has been implemented to assist in the management of compliance with access, licence
and licence-related, NECF and other relevant statutory obligations that apply to Jemena’s assets and
operations, including JGN.
JGN administers and maintains the JCARS content and obligation assignment and reports both internally
and externally on its compliance status.
5.2 WORK, HEALTH & SAFETY MANAGEMENT
This section refers to the occupational health and safety of Jemena employees and contractors working in
JGN and discusses the Jemena’s Health, Safety, Environment and Quality (HSEQ) Group and their activities.
REGULATORY REQUIREMENTS 5.2.1
The legislative obligations and internal requirements around employee and contractor health and safety
are managed by line managers and supported by the HSEQ team.
Jemena Gas Networks AMP | 25
HSEQ STRATEGIC DIRECTION 5.2.2
Jemena has, for some time, been actively building a World Class Generative HSEQ Culture. This culture
prompts employees to approach tasks in a manner to “entertain doubt”, or what is sometimes described as
“chronic unease”. This in turn prompts employees to look for what has been missed and what can be done
better.
Jemena maintains a company-wide Health and Safety Policy which expresses Jemena’s commitment, goals
and responsibilities for Health and Safety performance. The policy is reproduced in APPENDIX 2.
JEMENA HSEQ MANAGEMENT SYSTEM 5.2.3
JEM-PO-0025 Introduction to Jemena HSEQ Management System describes the processes required to
ensure that Jemena focuses on critical HSEQ needs as the basis for forecasting and allocation of resources.
This Management System sets the direction for HSEQ activities and consistently delivers improved HSEQ
performance for all business units within Jemena. HSEQ policy impacts the AMP in that all designs of
facilities consider HSEQ policy. Health and safety is a primary consideration in all projects and activities in
the AMP.
JEMENA HSE COUNCIL 5.2.4
The Charter (JEM-PO-0015) of the Jemena HSE Council states that the Council provides HSE leadership and
assists Jemena to fulfil its overall responsibilities in relation to HSE matters as they affect workers
(employees and contractors), customers and the community. Membership of the Council includes the
Managing Director as the Chair, all Executive General Managers and the General Manager of HSEQ.
The HSE Council has established an Asset and Public Safety sub-committee, which monitors and reports on
the effectiveness of strategies and practices to manage risks in this area. The sub-committee oversees a
number of operational and review committees which have specific objectives. The structure of this sub-
committee is set out in Figure 23, while the objectives of this sub-committee and a number of other sub-
committees that have been set up within JGN are set out in Table 8.

26 | Jemena Gas Networks AMP
Figure 23 Asset and public safety committee structure
Sub-Committee Objective
Asset and Public Safety Committee (APSC)
Reviews and monitors the operation of Jemena’s gas and electricity safety management processes and systems to ensure they deliver on Jemena’s corporate commitments.
Technical Policy Review Committee (TPRC)
Ensure appropriate technical policies are in place for gas assets under management by Jemena Networks and Pipes - Asset Management
AS2885 Pipeline code committee
An operational level committee with the purpose of developing operational excellence across all gas infrastructure assets governed by the AS 2885 suite of standards for gas pipelines and facilities
AS4645 Pipeline code committee
An operational level committee with the purpose of developing operational excellence across all gas infrastructure assets governed by the AS4645 Suite of standards for gas networks
Table 8 Scope of Asset and Public Safety Committees
5.3 REGULATORY MANAGEMENT (TECHNICAL)
MANAGING REGULATORY CHANGE 5.3.1
Compliance with legislation, regulations and standards is dependent on maintaining currency with
legislative changes. There are several mechanisms JGN uses to stay up to date with these types of changes,
including stakeholder management and industry representation.
Jemena Gas Networks AMP | 27
REGULATORY CHANGE AND IMPACT 5.3.2
JGN maintains a subscription with the external service provider SAI Global (Lawlex) for their legislative
alerts service, which provides alerts and a synopsis of changes for nominated legislation and jurisdictions.
Any updates to legislation, codes or other sources of obligations that apply to the business are reviewed
and entries in JCARS updated accordingly. This complements functions provided by Jemena’s legal team.
SAFETY AND OPERATING PLAN 5.3.3
JGN has developed and maintains a Non Conformance and Opportunity for Improvement tracking report,
which contains all regulatory and internal audit findings aimed at maintaining and improving safety of
services. Audit actions are tracked and progress on closing out issues is reported to management on a
monthly basis through management reports and through the Safety and Operating Plan (SAOP) Steering
Committee meeting.
The SAOP is a key component of the compliance management system and describes the safety
management system by which JGN fulfils its legal obligations under the Gas Supply Act 1996, the Pipelines
Act 1967 and relevant Australian Standards.
The SAOP has been developed as a reference document to Jemena’s Technical Policies and procedural
manuals and is implemented at a management level. Regulatory and internal audits are conducted to test
the implementation, compliance and accuracy of the systems and processes described by the SAOP.
REGULATORY AUDIT PLAN 5.3.4
The regulatory audit plan is a legislative requirement, which provides assurance to regulatory bodies that
the assets are operated and maintained in a safe manner as required by the licence and relevant Australian
Standards. The Jemena Technical Compliance Group monitors and utilises the information from regulatory
and internal audits to track trends across the business and provide assurance on the overall level of
compliance. The regulatory required audits are referred to as “Safety and Operating Plan audits”. JGN is
audited once each year by an external auditor.
Audit topics are selected by the auditor on a five yearly cycle and in consultation with JGN, based on past
performance and risk to the business. These topics are detailed in the relevant SAOP.
JGN develops an internal audit plan annually to complement the regulatory audits. It aims to provide
assurances regarding the adequacy and effectiveness of internal controls associated with the JGN safety
management system. The internal audit plan is developed based on risk and compliance management
requirements, trending from regulatory audits, performance of KPIs, and discussion with stakeholders
including regulators, management and owners.
INDUSTRY REPRESENTATION 5.3.5
JGN is a member of a number of industry bodies and committees including the Australian Standards
Committees, the Energy Networks Association, the Australian Pipeline Industry Association and others.
Representation on these committees provides a medium for JGN to develop relationships with other
stakeholders and to keep abreast of industry trends and additional insights into industry best practice.
5.4 ENVIRONMENTAL MANAGEMENT
Protection of the environment, as well as Jemena’s commitment to reducing its environmental footprint, is
integral to the philosophy of Jemena’s Environmental Management System. This system consists of the
28 | Jemena Gas Networks AMP
Environmental Policy, Environmental Management System Manual, various procedures and aspects of
impacts registers and has been designed in accordance with the ISO 14001:2004 Standard – Environmental
Management System.
JGN has developed an Environmental Management Plan (EMP) supported by two JGN Operational
Environmental Management Plans. One is for licensed transmission pipelines (JGN-PL-0061) and the other
is for gas distribution networks (AAM-PL-0064). The plans ensure that activities are undertaken
consistently and with minimal impact on the environment.
Environmental incidents and hazards are reported through Jemena’s integrated HSEQ Incident
Management System (IMS).
Environmental awareness training is provided to all the relevant Jemena managers, supervisors and field
staff to ensure that they are aware of their regulatory obligations and how to manage environmental issues
during their day-to-day work activities.
JEMENA ENVIRONMENTAL POLICY 5.4.1
Jemena maintains a company-wide Environmental Policy, which sets out Jemena’s commitment to reducing
its environmental footprint and makes high level statements about how that commitment will be achieved.
The policy is reproduced in APPENDIX 3.
ENVIRONMENTAL REPORTING 5.4.2
JGN is required to report the following:
National Pollutant Inventory Reporting - JGN is required to report on air emissions under the National
Environment Protection (National Pollutant Inventory (NPI)) Measures legislation. 12 NPI emission reports
are prepared for the Australian financial year and submitted to the relevant NSW EPA by September 30
each year.
The National Greenhouse and Energy Reporting Scheme (NGERS) – JGN is required to report annually on
greenhouse gas (GHG) emissions and energy data to the Clean Energy Regulator. JGN’s emissions
predominantly result from fugitive emissions, leakage of natural gas from pipelines and contractor fleet
fuel use (if major construction activities are being undertaken).
Carbon Tax and Clean Energy Future Legislation – Following the introduction of the Clean Energy Future
(CEF) legislation package in 2012, JGN has been subject to an annual carbon price obligation for its
combustion and fugitive (pipeline leakage) emissions. The first carbon price compliance year commenced
in July 2012 with annual emissions obligations based upon NGERS calculation methodologies. It is
unclear at this stage how much longer JGN will be subject to this obligation.
5.5 ASSET MANAGEMENT
ASSET MANAGEMENT POLICY 5.5.1
Jemena’s Asset Management Policy is detailed in Appendix 1. Supporting the Asset Management Policy is
the JGN Asset System Manual, the objective of which is to set out:
12 The threshold categories which are triggered are emissions to air from products of combustion (Categories 2a and 2b), triggered by
compressor stations, water bath heaters and generators and natural gas losses (Category 1a, use of Volatile Organic Compounds). The calculation and reporting of emissions uses fuel data provided and verified by the National Greenhouse and Energy Reporting Scheme (NGERS) process and published emission factors. The methodology has been approved by the EPA.

Jemena Gas Networks AMP | 29
a consistent, collaborative and integrated approach to the activities undertaken by JGN to manage the
lifecycle of its assets to ensure that optimum outcomes are delivered in an efficient way across JGN. This
document sets out the AMS to be used for JGN’s assets
how asset management is ‘done’ at JGN (i.e. how asset management is directed, coordinated and
controlled).
ASSET MANAGEMENT PLAN 5.5.2
This AMP is updated and released annually. At both the preliminary and finalisation stages, the AMP is
released and communicated with stakeholders, including the delivery groups responsible for the ultimate
delivery of the distribution portion of the Capital Plan. This enables stakeholders to have a long-term view
for their own planning purposes.
ASSET MANAGEMENT COMMITTEE 5.5.3
Jemena has formed an Asset Management Committee with the aim of incorporating PAS 55 into the
company. The committee has responsibility for the AMS across Jemena and its overarching purpose is to
strengthen the AMS by providing governance, alignment and review across Jemena. The committee
provides a senior management forum to ensure the system is fit for purpose and delivers the Jemena
business objectives.
UAG TASK FORCE 5.5.4
JGN has assembled a UAG Task Force to raise, monitor and manage issues related to UAG, in order to
ensure UAG is maintained at an efficient level. The objectives of the Task Force are to:
monitor the UAG trends and levels
identify sources of UAG
identify actions and controls
assign sponsors and responsible persons to actions and controls
report to management as part of the monthly reporting process
support knowledge management and retention.
Key areas of review include:
Monitoring and forecasting
Calculation processes
Metering
Gas quality
Billing
Operations
Maintenance

30 | Jemena Gas Networks AMP
Network protection.
5.6 MAINTENANCE PLANNING
JGN’s maintenance is undertaken to deliver a safe, reliable and efficient network. Maintenance planning
covers both planned and unplanned (including emergency response) elements of maintenance. JGN’s
maintenance planning is based upon ‘good industry practice’ as defined by the appropriate Australian
Standards suites - AS4645 and AS2885 – covering Gas Distribution Networks and Gas Pipelines respectively.
Both of these standards are founded on the performance (or risk) based approach.
JGN’s maintenance planning is aligned with Jemena’s Asset Management Policy and is designed to ensure
that sufficient controls are in place to manage the risks identified in technical risk reviews, being either
Formal Safety Assessments (FSA) or Safety Management Studies (SMS). The considerations used in
developing JGN’s maintenance strategy for its assets include:
Criticality of network assets, being either individual asset classes, components of these asset classes, or
individual assets within the asset class. Criticality for this purpose include the potential for the
consequences related to supply interruption, damage to property or personnel and/or environmental
damage
Asset specific criteria, which may include the current condition of the asset, design life or age, the cost of
the asset, available asset operating information, supplier recommendations and available support
(including spares availability), statutory requirements or the assets function within the distribution
system.
Based on the assessments above JGN implements one of the maintenance strategies below for a specific
asset class:
1. operate to failure
2. reliability-based approach
3. condition-based monitoring
4. scheduled maintenance.
JGN’s maintenance strategies are articulated in its SAOP, which in turn is underpinned by the Jemena
Technical Policies. These policies provide guidance on the development of maintenance scopes and
procedures.
The location of individual assets is a key input to the maintenance planning given the effect of travel times
(both for planned maintenance and unplanned maintenance, including incident response). So too does the
location of available and competent personnel.
The balance of resource capacity and capability and the proportion of planned and unplanned works are
used to develop the schedule of planned maintenance work as well as the balance of internal versus
external labour used to deliver the activities under the maintenance plan. Resource capacity and capability
considerations include:
the competence of personnel
level of competence of contractors
Jemena Gas Networks AMP | 31
equipment requirements.
Forecast levels of activities for emergency response, corrective (breakdown) maintenance and externally
generated works, such as standby activities for supervision, are based primarily on historical levels of
activity as they are effectively outside the control of JGN.
JGN’s uses its enterprise IT system to manage its maintenance activities. Planned maintenance activities
are loaded and scheduled. As corrective maintenance is identified, it is prioritised and scheduled and if
required planned maintenance activities rescheduled to maintain the resource balance. When an incident
requiring emergency response occurs, the response activities are inputted with planned maintenance
activities re-scheduled. This consolidation within the enterprise IT system provides an efficient process for
balancing of both maintenance priorities and the available resources.
A key component of any maintenance planning process is the commitment to ensure staff and contractors
are competent. JGN provides initial training to all maintenance staff and refreshes maintenance skills
through annual refresher training programs. JGN also ensures training associated with new technology and
new assets is provided as they are constructed and introduced.
5.7 STAKEHOLDER MANAGEMENT
DTIRIS 5.7.1
The Jemena Technical Compliance Group and Jemena generally, maintain a positive and open relationship
with DTIRIS. This ensures communications channels are open and DTIRIS is engaged early in projects that
are potentially affected by legislation and licence conditions. This plays a crucial role in JGN’s current and
future operating environment regarding network development, or changes that require technical
regulatory approval and or involvement.
CONSUMER ENGAGEMENT 5.7.2
Customer focus is one of JGN’s values. In particular, JGN strives to understand and meet the reasonable
expectations of customers and customer groups, and ensure that customer and stakeholder engagement
plays an important role in the prudent optimisation of JGN’s costs, services and prices.
The JGN Customer Council has been established to provide valuable insights on issues that are important to
customers and stakeholders. This includes issues relating to the services JGN provides, the forecast costs of
providing those services, and the prices JGN charges retailers for use of JGN’s distribution network.
Membership of the JGN Customer Council consists of representatives of a diverse set of consumer and
stakeholder organisations, advocating on behalf of residential, small business, vulnerable and industrial
customers as well as other stakeholders including energy retailers and local councils.
JGN also consults with the following stakeholders:
Direct customer engagement (small and large customers)
Retailer forums
One-on-one stakeholder engagement.
In engaging with its customers, JGN aims to:

32 | Jemena Gas Networks AMP
Assist customers to understand how gas services and prices are determined, including where
customers’ money goes
Inform customers of emerging factors influencing the gas market
Involve customers in JGN’s decision making and responding to customer feedback
Highlight what JGN can do to manage gas prices, what JGN can’t do, and what customers can do
Measure, report and improve the effectiveness of JGN’s engagement activities.
The AMP reflects customers’ preferences and concerns, and promotes their long-term interests. This has been validated through a series of forums where JGN engaged with customer, stakeholder and community groups.
At the forums, JGN explained the context for the AMP, including the role of gas as a competitive fuel in NSW, the different parts of the gas supply chain, the costs associated with each part and the roles of the AER in regulating reference services and IPART in regulating some retail prices.
During the forums, JGN explored the various stakeholder views on the decisions within the AMP, in particular the balance between the prices for services, the long-term safety of gas distribution network, and the service levels the gas distribution network provides to current and new customers.
JGN expects to continue consultation with customers during the AMP period on specific projects, which are likely to have a community interest.
5.8 LAND MANAGEMENT
JGN’s network extends across a significant area of land in NSW. This brings with it an extensive number of
lands management issues given the range of:
landowners involved (public13 and private)
unique land conditions (e.g. national parks and water ways)
uses of the land (existing and proposed).
TENURE OF LAND 5.8.1
Generally, JGN’s land rights are protected by easements, statutory rights or licence agreements. JGN
currently has easements registered in approximately 1150 land parcels.
LANDS MANAGEMENT SYSTEM 5.8.2
JGN’s Land Management System (LMS) is a database that contains information regarding land ownership
such as contact details, tenure, previous communications/contact and specific land requirements. An
annual mail out is sent out to landowners affected by JGN’s trunk pipelines, reminding owners of the risks
associated with activities near the pipeline and to obtain updated landowner details.
13
Some examples of public landowners include: Transport NSW and related agencies e.g. Roads and Maritime Services, Rail Corp;
local councils; Port corporations; Commonwealth of Australia (Crown Land); Australian Rail Track Corporation and National park
and wildlife agencies.

Jemena Gas Networks AMP | 33
6 EXPENDITURE SUMMARY
6.1 CAPITAL EXPENDITURE (CAPEX) – CAPITAL PLAN
The Capital Plan is a schedule of planned and proposed projects consistent with the 20 year asset class
strategies and the long-term plans for capacity requirements for the gas distribution network. The plan is
designed to ensure JGN’s objectives are implemented as efficiently as possible by capturing input from
multiple stakeholders.
The capital requirements outlined in the asset class strategies, in conjunction with the capacity
requirements, provide the ‘proposed’ projects that form the basis of the Capital Plan. These proposed
projects then become ‘planned’ when they are analysed as part of the Asset Management PoW. Activities
performed as part of the Asset Management PoW may include a review of potential options, provision of a
solution, including timing, cost estimation and scoped definition.
The timing of review of capital requirement as part of the Asset Management PoW is subject to the
scheduling, complexity or risk of the project and/or the interdependency with other projects.
Figure 24 provides a snapshot of the Capital Plan for the AMP period RY15 through to RY20.
Figure 24 Capex Plan RY15 -RY20
6.2 OPERATIONAL EXPENDITURE (OPEX) AND MAINTENANCE PLAN
Figure 25 illustrates JGN’s operation and maintenance plan for the RY15–RY20 period. The forecast
presented in this figure is based on estimated RY14 costs (i.e. the RY14 base year), adjusted for expected
step changes, cost escalators (for labour and materials), scale and productivity improvements. The RY14
estimate was sourced from a mix of actual and forecast costs.
0
50
100
150
200
250
300
RY15 RY16 RY17 RY18 RY19 RY20
Cap
ex
(Mill
ion
s)
Summary of Capital Plan
Market Expansion Capacity Development Mains & Services Renewal
Facilities Renewal Meter Renewal Other SIB
Non-Distribution Capital excl. AA costs
245 237 235 248
225
200

34 | Jemena Gas Networks AMP
Figure 25 Opex Plan RY15- RY20
6.3 CONSISTENCY OF CAPITAL AND MAINTENANCE PLANS WITH THE NGR AND NGL
The consistency of the proposed Capital and Maintenance plans for the upcoming AA period with rules 79
and 91(1) of the NGR is set out in detail in the AAI.
As noted in section 5.7.2, the development of the AMP has been heavily influenced by the feedback
provided by JGN’s Customer Council, customers, stakeholders and community groups on the appropriate
balance between prices, the long-term safety of the network and service levels and customer preferences,
more generally. The program of works identified in the Capital and Maintenance plans reflect these
preferences and at a more fundamental level have been designed to promote the long term interests of
consumers with respect to price, quality, safety, reliability and security of supply as required by the
National Gas Objective (NGO).
If JGN was faced with a lower allowance for capital or operating expenditure than set out above, it would
either defer or abandon plans for expenditure that would otherwise be efficient to undertake, including
expenditure to maintain network reliability or to extend services to new consumers.14 Reduced expenditure
on network reliability would result in:
longer response times to incidents
increased and more disruptive gas leaks
higher prices in the longer-term because there may be a need for ‘catch-up’ expenditure in future
periods and the costs of carrying out that expenditure may be higher.
14 JGN would not reduce expenditure on works and activities driven by perceived safety risks or concerns because ‘safety is non-
negotiable.’

Jemena Gas Networks AMP | 35
Reduced expenditure on connecting new customers would also result in higher prices in the longer term, as
the costs of operating the network are spread over a smaller customer base.
Viewed in this way it is clear that a decision not to allow any of the proposed capital or operating
expenditure specified in the Capital and Maintenance plans will adversely affect customers and will
therefore be contrary to the NGO and a number of revenue and pricing principles (e.g. sections 24(3), 24(6)
and (7)).
36 | Jemena Gas Networks AMP
7 DELIVERY STRATEGY
7.1 SUMMARY
JGN’s delivery strategy relates to all assets used in the delivery of gas from the receipt point to meter but
excludes IT and non-distribution assets. The remainder of this section provides a summary of:
the framework JGN will use to deliver the projects specified in the AMP
JGN’s assessment of the deliverability of the AMP, including the delivery approach.
7.2 FRAMEWORK FOR DELIVERY
JGN has identified a number of fundamentals that are critical to the delivery of the distribution portion of
the Capital Program. JGN applies these fundamentals to the delivery of the distribution portion of the
Capital Plan and as any improvements that may lead to increased effectiveness or efficiency are identified,
implements these improvements. This section summarises the fundamentals and improvements currently
being implemented.
INTEGRATION WITH ASSET MANAGEMENT PROCESSES 7.2.1
The distribution portion of the Capital Plan is ultimately an output from JGN’s AMS and this integration
provides for the iterative process of balancing the scheduling of proposed capital activities with the
effective and efficient delivery of these activities. The communications processes through the development
stages of capital activities under the auspices of the AMS, are one of the fundamentals that enable the
delivery of the distribution portion of the Capital Plan.
SCOPE DEFINITION 7.2.2
As with all long-term planning processes, the success of a project is enhanced through the systematic
development of the scope during initial phases within the lifecycle of the project. JGN prepares
Opportunity Briefs (OB) as an initial scope statement for projects to be included in the AMP. For more
complex projects, an enhancement of the scope is undertaken and documented in Feasibility Assessments
(FA).
The preparation of the OBs and FAs includes the key stakeholders and, upon completion, the finalised
documents are made available to stakeholders to assist the preparation of the AMP and planning for the
delivery of the projects.
SCHEDULING 7.2.3
For the purpose of assessing deliverability of the RY16 to RY20 program, the capital program has been
analysed to ensure that the spread of the projects across the period are optimised for efficient and
effective delivery. As the scope of projects are further defined through the early stages of the projects’
lifecycle (and program lifecycle), the delivery plan for the program will be adjusted accordingly as an
ongoing exercise. Amendments will be documented in the AMP and specified through the PoW and the
subsequent detailed planning processes.
Jemena Gas Networks AMP | 37
This optimisation of the program is undertaken to balance both the prudency of scheduled delivery of
projects and sub-programs, and the efficiency in the delivery of the projects vis-a-vis resourcing
requirements.
PROJECT GOVERNANCE 7.2.4
Effective project governance is an essential component to achieving effective and efficient project and
program outcomes. Within Jemena, project governance encompasses project management oversight and
timely and transparent decision-making. Project governance also needs to ensure that there is alignment
and consistency with Jemena’s corporate policies and procedures. The specific governance arrangements
for each project will change according to the risk and complexity of each project.
Regardless of the scale of governance required, project governance within Jemena is used to oversee the
key elements of projects.
Jemena continues to review and where necessary refine its governance processes.
FUNCTIONAL AND ORGANISATIONAL STRUCTURE 7.2.5
Jemena has recently implemented a number of organisational changes that have resulted in improved
efficiency and effectiveness in capital works delivery. The key improvements have included:
the formation of high and moderate complexity teams to better focus and specialise resources on
particular projects
centralisation of the Contracts and Procurement Team to provide more depth across the full range
of Jemena assets.
HUMAN RESOURCE MANAGEMENT 7.2.6
To ensure that Jemena is able to adapt to changing resourcing requirements, it has implemented a number
of initiatives that have increased the responsiveness of HR management across the business. These
include:
the re-contracting of ‘Preferred Supplier Agreements’, which provides a panel of specialist
employment agencies with agreed terms and conditions, briefed to Jemena’s requirements
(including technical, corporate culture and commercial) and includes the sourcing of permanent,
temporary or contract positions
allocation of specific positions within HR to manage the identification, employment and ‘on-
boarding’ of employees
electronic lodging of resource requests, reducing the processing time and ensuring faster approval
for vacancies.
PROCUREMENT MANAGEMENT 7.2.7
Over the past five years, Jemena has continued on a path of consolidating core support groups to ensure
efficiency and the ability for the various subject matter experts to work closely together to provide a more
integrated and consolidated approach.
38 | Jemena Gas Networks AMP
Procurement is now structured centrally but delivered regionally to provide a focused but flexible support
to the various delivery teams, including the JGN focused delivery teams.
The procurement team has been engaged in the preparation of the AMP as part of the strategy of ensuring
visibility to the various support groups in the business. Through this process, procurement has engaged in
commercial negotiations with key suppliers (primarily with the Standard Materials class suppliers and to a
lesser extent the Specialist material class suppliers) to ensure suppliers understand the demand for
materials and services, thus confirming availability of sufficient materials required to deliver the
distribution portion of the Capital Plan. The procurement teams also provide feedback to internal
stakeholders with any market intelligence that may influence delivery of the distribution portion of the
Capital Plan.
7.3 CURRENT DELIVERY ARRANGEMENTS AND PERFORMANCE
JGN adopts a balanced portfolio approach in relation to its available delivery channels, utilising a mix of
internal and external resources as part of its delivery strategy. The objectives of the balanced portfolio are
to:
improve the flexibility and responsiveness of JGN’s cost structure to changes in work volumes
maintain and grow core competencies
maintain control over high risk delivery areas
maintain a market position that ensures JGN remains an informed buyer and supplier value
ensure external delivery channels have sufficient information on likely work volumes and mixes to
encourage investment in capability and capacity (labour and fleet)
enable benchmarking across delivery mechanisms, so as to promote the pursuit of efficiency gains
through price and comparative competition.
Internal management resources are engaged in the planning, estimating, scheduling and delivery
management of externally delivered work. Internal construction crews are used in core competency areas
(high pressure crews, electrical and instrumentation technicians). JGN gas service technicians are used to
deliver a significant percentage of domestic meter replacements.
External delivery channels are implemented through competitive processes in accordance with our
procurement policy. Contractual terms (based on Jemena’s Procurement Policy) are reviewed and refined
continuously in light of on-going experience.
Table 9 provides an overview of the alternative delivery channels used by JGN.
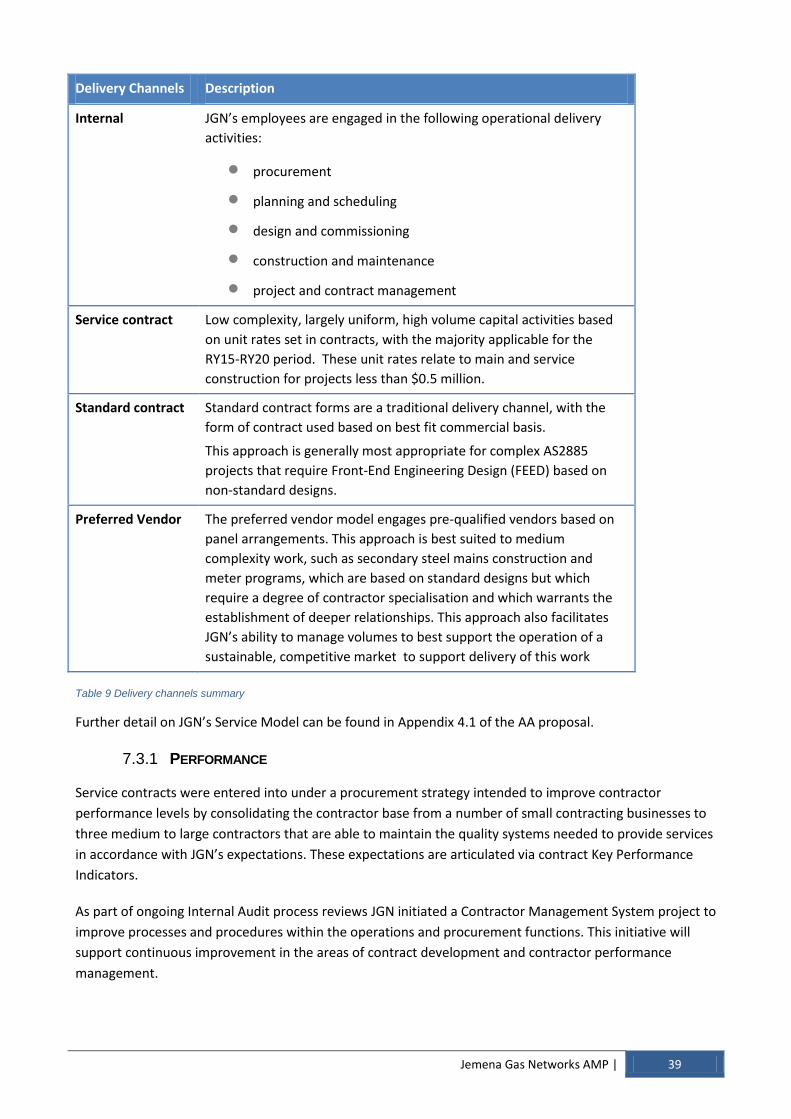
Jemena Gas Networks AMP | 39
Delivery Channels Description
Internal JGN’s employees are engaged in the following operational delivery
activities:
procurement planning and scheduling design and commissioning construction and maintenance project and contract management
Service contract Low complexity, largely uniform, high volume capital activities based
on unit rates set in contracts, with the majority applicable for the
RY15-RY20 period. These unit rates relate to main and service
construction for projects less than $0.5 million.
Standard contract Standard contract forms are a traditional delivery channel, with the
form of contract used based on best fit commercial basis. This approach is generally most appropriate for complex AS2885
projects that require Front-End Engineering Design (FEED) based on
non-standard designs.
Preferred Vendor The preferred vendor model engages pre-qualified vendors based on
panel arrangements. This approach is best suited to medium
complexity work, such as secondary steel mains construction and
meter programs, which are based on standard designs but which
require a degree of contractor specialisation and which warrants the
establishment of deeper relationships. This approach also facilitates
JGN’s ability to manage volumes to best support the operation of a
sustainable, competitive market to support delivery of this work
Table 9 Delivery channels summary
Further detail on JGN’s Service Model can be found in Appendix 4.1 of the AA proposal.
PERFORMANCE 7.3.1
Service contracts were entered into under a procurement strategy intended to improve contractor
performance levels by consolidating the contractor base from a number of small contracting businesses to
three medium to large contractors that are able to maintain the quality systems needed to provide services
in accordance with JGN’s expectations. These expectations are articulated via contract Key Performance
Indicators.
As part of ongoing Internal Audit process reviews JGN initiated a Contractor Management System project to
improve processes and procedures within the operations and procurement functions. This initiative will
support continuous improvement in the areas of contract development and contractor performance
management.

40 | Jemena Gas Networks AMP
7.4 AA2015 DELIVERY STRATEGY
JGN’s expenditure planning and governance processes are focused on ensuring that capital expenditure is
prudent and efficient.
The objective of the AA2015 Delivery Strategy (DS) is to ensure that the AA2015 program is delivered safely
and efficiently. The overarching objectives of the delivery strategy are:
safe and efficient delivery – maximising competition between external suppliers and optimising
internal processes to ensure efficiency without compromising safety
deliverability – ensuring that the optimal mix of labour, materials and fleet is available in
accordance with program requirements
building and retaining in house expertise – develop and retain planning and control of the works
delivery program in-house to enable to enable efficient resource and material management,
project development, and contact and commercial management
performance management – a focus on delivering to time, cost and quality requirements facilitated
by continuous improvement in project planning and controls as well as contractor management.
KEY FEATURES – INTERNAL AND EXTERNAL RESOURCES 7.4.1
The current portfolio of internal and external resources will continue to underpin the DS for the AA2015
program. Historically this approach has successfully provided an optimal mix of resources with the
capability and capacity to deliver.
An important consideration is that AA2015 program volumes are generally consistent with the recent past.
In the case of the Meter Replacement program where AA2015 volumes are significantly above recent
trend, JGN has engaged in preliminary commercial discussions with its contracting base and has developed
a delivery strategy to provide capacity to meet the increase in demand.
An associated factor is that the relative complexity of the programs, which also remain generally consistent
with recent past. Importantly, approximately 60 per cent of the work is low complexity, largely uniform,
high volume activities that are delivered via internal resources, service contracts or preferred vendor
arrangements. Internal management resources associated with this work have remained relatively
consistent with volume risk managed by the contracting base.
Outsourcing arrangements also provide the required flexibility to align delivery resources to medium and
complex work expenditure forecasts. Contract arrangements are commonly used to manage internal
management resources to meet peak demand.
Table 10 provides a summary of the allocation of program categories to main delivery channels

Jemena Gas Networks AMP | 41
Program Delivery Channel
Market Expansion Service Contracts Meter Renewal and Upgrade Internal & Preferred Vendor Growth Capacity Development Service Contracts, Preferred Vendor, Standard Contracts Mains and Service Renewals Preferred Vendor SIB Facilities and SCADA Standard Contracts Table 10 Programs and delivery channels
MATERIALS 7.4.2
JGN will continue with material supply arrangements, which have successfully supported delivery of
previous programs. In summary these include:
Nylon pipe, which is supplied by a single manufacturer who has proven track record in meeting
demand requirements. In the unlikely event that the supplier cannot meet future demand, JGN has
the flexibility to substitute polyethylene (PE) pipe
PE pipe is a commodity item, which JGN purchases from a panel of suppliers
Steel pipe is procured by JGN from two key suppliers, who are able to draw from a wide range of
international manufacturers, and is supported by long lead time forecasting processes to
accommodate more complex manufacturing processes compared to plastic pipe. Note that key
objective of demand planning for all key material classes, including plastic and steel pipes, is timely
delivery at best price
Meters are a commodity item supplied by a number of vendors depending on meter types. Based
upon ongoing commercial discussions and briefings, JGN is satisfied that suppliers will have the
capacity to meet forecast volume requirements.
CENTRALISED PLANNING 7.4.3
Integration between portfolio, program and project levels will be facilitated by a robust centralised
program planning function, which will optimise activity scheduling, resource planning, and material
demand planning.
JGN is currently implementing Microsoft Project Server (MSPS) to support the program management
function and replace an existing Microsoft Project based system. MSPS will be a significant improvement
over the current system because it will provide enhanced system stability and program scenario modelling.
PROJECT PLANNING AND CONTROLS 7.4.4
JGN continues to adopt a continuous improvement approach to ensuring best practice project planning and
controls underpin the management of capital delivery. Process and governance aspects have been
described above. Additionally, JGN has implemented a standardised approach to its project management
methodology across its three different asset groups, including JGN.

42 | Jemena Gas Networks AMP
A standard project management methodology will lead to standardised reporting and enable efficient
project management across the organisation. Also, this initiative will allow flexibility in the transfer of
project resources across groups.
7.5 DELIVERY ASSESSMENT
MARKET EXPANSION 7.5.1
JGN’s market expansion program volumes over the RY15-RY20 period are forecast to remain consistent
with recent years. The delivery strategy for this program will continue to be based on the use of mains and
service construction contractors with JGN staff providing contractor management services. Both internal
and contract resources have historically managed any inter or intra-year variations. As of 1 July 2013, the
JGN market expansion program is delivered using three primary contractors over two regions, Northern
and Southern NSW. The only exception to this is in country areas, where services will continue to be
delivered by local contractors with regional JGN staff providing management support. The majority of the
contracting arrangements applicable to the market expansion program have been secured for the RY15-
RY20 period.
METER RENEWAL AND UPGRADE 7.5.2
The JGN meter renewal and upgrade program volumes are forecast to experience significant growth over
the AA2015 period, primarily in domestic gas meter and domestic hot water replacement sub programs.
The delivery strategy will continue to be based on the use of gas supply technicians to replace 10,000
meters per year and to outsource the remainder of the volume. The remaining volumes will be replaced
using contractors under long term service style contracts with established service providers. To ensure
effective management of contractor resources into the future, JGN has implemented a program of industry
briefings with contractors and material suppliers to keep them abreast of future program requirements.
The briefings are intended to provide contractors and suppliers with adequate time to review their
resourcing levels and make necessary adjustments to meet forecast demand.
In FY 2015, JGN will also establish a Meter Testing Facility (MTF) and commence a series of meter testing
sub-programs. Operation of the MTF will be subcontracted.
GROWTH AND CAPACITY DEVELOPMENT 7.5.3
The JGN growth capacity development program volume and expenditure forecast shows some variability
across the period, including a peak associated with the Northern Primary Main Strategy in RY18. There is a
significant increase in expenditure forecast for general projects including main extensions and Cocon
installations compared to the recent past; however, the underlying pattern is similar to RY11 and RY12.
The program delivery strategy will continue to be based on outsourced construction activity under service
contracts, or preferred vendor arrangements, in accordance with individual project requirements.
Outsourcing of construction is the most efficient delivery model for JGN, which appropriately positions
construction risk with contracting businesses. JGN retains technical, project planning, and contractor
management capabilities to ensure that time, cost and quality objectives are met.

Jemena Gas Networks AMP | 43
Project planning and management will be performed by the Medium Complexity Projects Group in the JGN
Capital Projects Team to ensure delivery objectives are met. In RY11 and RY12 this approach safely and
successfully delivered a significantly larger JGN growth and capacity development program than is forecast
for any individual year during the AA2015 period.
MAINS AND SERVICES RENEWAL 7.5.4
The forecast expenditure for the JGN mains and services renewal program over the AA2015 period will
average approximately 177% above RY12-13 levels. This increase is primarily due to underlying cost
increases and the inclusion of the Mt Druitt steel main rehabilitation project ($16M) and the Penrith
Primary Thin Wall Project ($17M). However, the underlying standard rehabilitation levels remain generally
unchanged.
The program delivery strategy for the JGN Mains and Services Renewal program will continue to be based
on outsourced construction under preferred vendor arrangements, with project and construction
management provided by the Low Complexity Projects Group in the JGN Capital Projects Team to delivery
objectives are met.
STAY IN BUSINESS FACILITIES AND SCADA PROGRAM 7.5.5
The forecast expenditure for the JGN Stay in Business Facilities and SCADA program over the RY15-RY20
period will be significantly higher than RY11-RY13 levels. The increase is mainly due to the inclusion of in-
line inspections (ILI) and integrity digs in the program as well as the APA driven Riverina POTS upgrades
($15M) and the Northern Trunk Pressure Increase Mitigation Project ($16M).
The program delivery strategy for the JGN Stay in Business Facilities & SCADA program will continue to be
based on outsourced construction under standard contracts, with project and construction management
performed by the High Complexity Projects Group in the JGN Capital Projects Team.
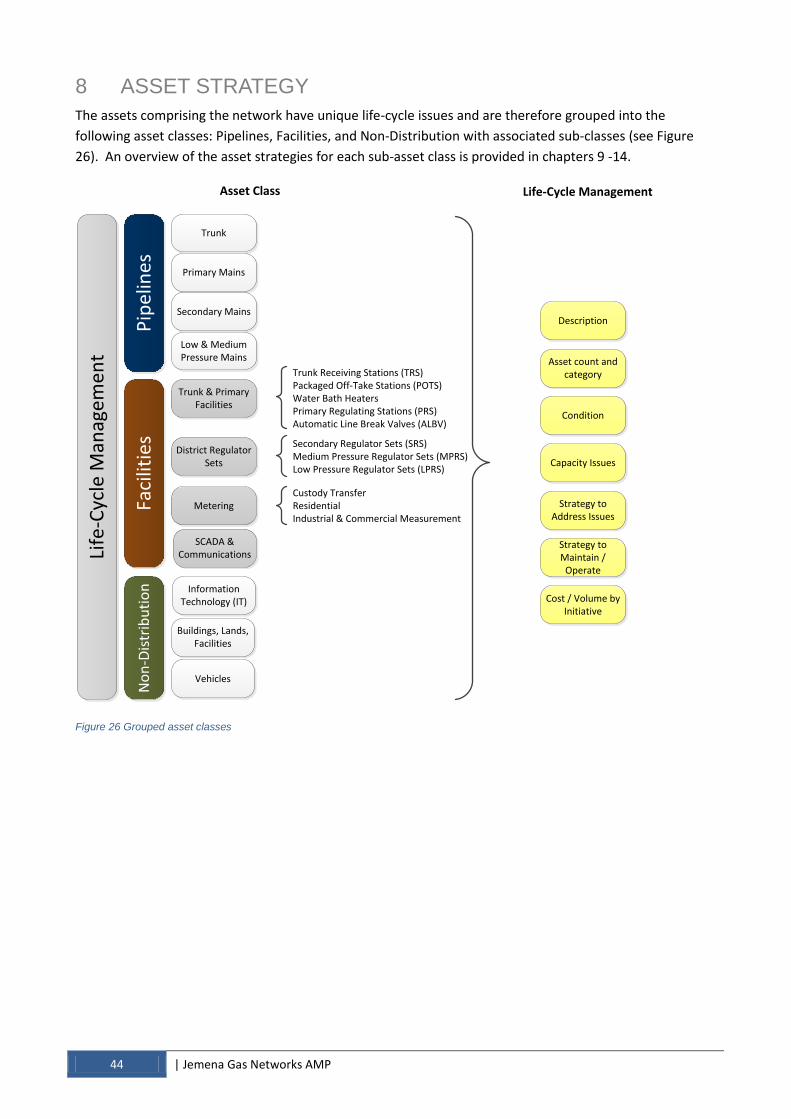
44 | Jemena Gas Networks AMP
8 ASSET STRATEGY
The assets comprising the network have unique life-cycle issues and are therefore grouped into the
following asset classes: Pipelines, Facilities, and Non-Distribution with associated sub-classes (see Figure
26). An overview of the asset strategies for each sub-asset class is provided in chapters 9 -14. P
ipe
line
s
Trunk
Primary Mains
Secondary Mains
Low & Medium Pressure Mains
Faci
litie
s
Trunk & Primary Facilities
Metering
District Regulator Sets
SCADA & Communications
Trunk Receiving Stations (TRS)Packaged Off-Take Stations (POTS)Water Bath HeatersPrimary Regulating Stations (PRS)Automatic Line Break Valves (ALBV)
Custody TransferResidentialIndustrial & Commercial Measurement
No
n-D
istr
ibu
tio
n Information Technology (IT)
Buildings, Lands, Facilities
Vehicles
Life
-Cyc
le M
anag
em
en
t
Description
Asset count and category
Condition
Capacity Issues
Strategy to Address Issues
Strategy to Maintain /
Operate
Cost / Volume by Initiative
Secondary Regulator Sets (SRS)Medium Pressure Regulator Sets (MPRS)Low Pressure Regulator Sets (LPRS)
Asset Class Life-Cycle Management
Figure 26 Grouped asset classes

Jemena Gas Networks AMP | 45
9 ASSET STRATEGY – PIPELINES AND MAINS
Pip
elin
es
Trunk
Primary Mains
Secondary Mains
Low & Medium Pressure MainsLi
fe-C
ycle
Man
age
me
nt
Asset Class
9.1 SUMMARY
JGN’s asset strategy for the pipelines and mains asset category over the AMP period is to ensure the safety
and integrity of the asset, meet regulatory requirements, and cater for growth of the network.
9.2 BACKGROUND
The JGN gas distribution network comprises approximately 25,000km of pipeline of various sizes and
operating pressures, ranging from 2kPa to 6,895kPa. These are divided into categories according to their
MAOP:
Trunk pipelines (MAOP of 6,895kPa), including:
o Licence 1: Central Trunk
o Licence 2: Southern Trunk
o Licence 3: Horsley Park to Plumpton
o Licence 7: Plumpton to Killingworth
o Licence 8: Killingworth to Kooragang Island
Primary mains , including:
o Sydney Primary Main & Sydney Primary Loop (MAOP of 3,500kPa)
o Wollongong Primary Main (MAOP of 3,500kPa)
o Penrith Primary Main( MAOP of 3,500kPa)
Secondary mains (MAOP of 1,050kPa)
Medium pressure mains (MAOP of 30kPa, 210kPa, 300kPa or 400kPa)
Low pressure mains (MAOP of either 2kPa or 7kPa)
These pipelines include the pipeline or mains and associated systems and services, such as cathodic
protection (CP) and valves. An overview of JGN’s pipeline assets is provided in Table 11.
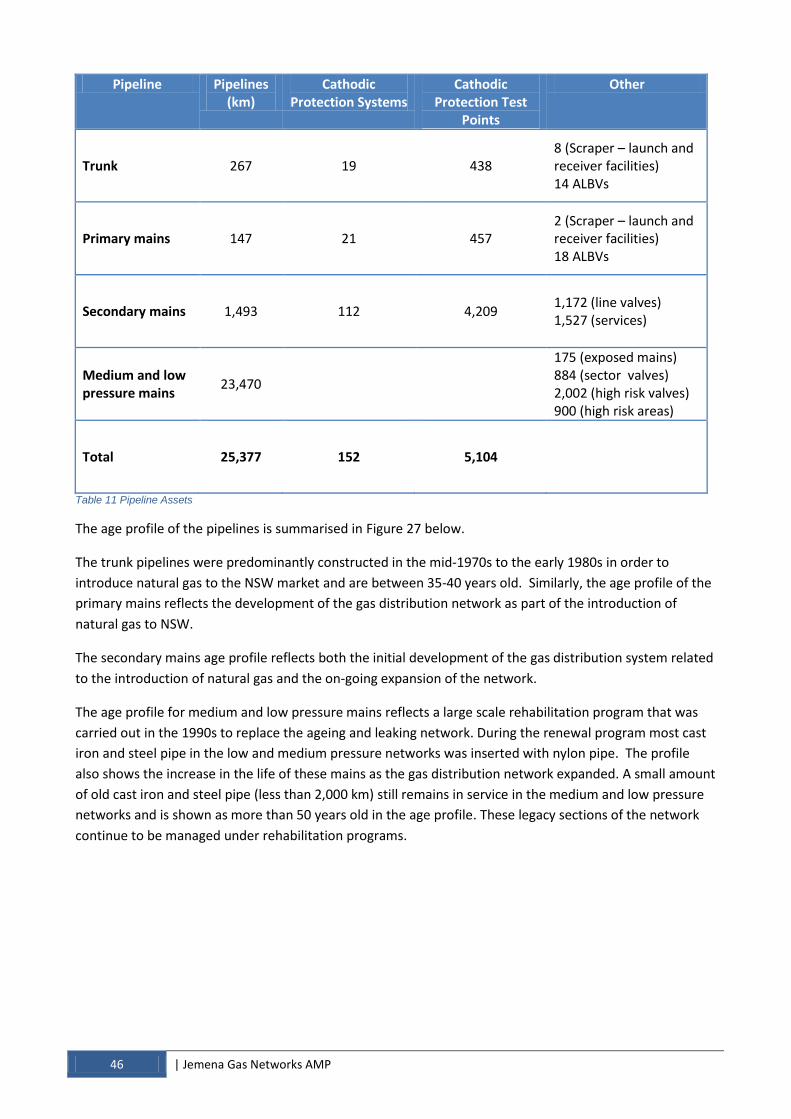
46 | Jemena Gas Networks AMP
Pipeline Pipelines (km)
Cathodic Protection Systems
Cathodic Protection Test
Points
Other
Trunk 267 19 438 8 (Scraper – launch and receiver facilities) 14 ALBVs
Primary mains 147 21 457 2 (Scraper – launch and receiver facilities) 18 ALBVs
Secondary mains 1,493 112 4,209 1,172 (line valves) 1,527 (services)
Medium and low pressure mains 23,470
175 (exposed mains) 884 (sector valves) 2,002 (high risk valves) 900 (high risk areas)
Total 25,377 152 5,104
Table 11 Pipeline Assets
The age profile of the pipelines is summarised in Figure 27 below.
The trunk pipelines were predominantly constructed in the mid-1970s to the early 1980s in order to
introduce natural gas to the NSW market and are between 35-40 years old. Similarly, the age profile of the
primary mains reflects the development of the gas distribution network as part of the introduction of
natural gas to NSW.
The secondary mains age profile reflects both the initial development of the gas distribution system related
to the introduction of natural gas and the on-going expansion of the network.
The age profile for medium and low pressure mains reflects a large scale rehabilitation program that was
carried out in the 1990s to replace the ageing and leaking network. During the renewal program most cast
iron and steel pipe in the low and medium pressure networks was inserted with nylon pipe. The profile
also shows the increase in the life of these mains as the gas distribution network expanded. A small amount
of old cast iron and steel pipe (less than 2,000 km) still remains in service in the medium and low pressure
networks and is shown as more than 50 years old in the age profile. These legacy sections of the network
continue to be managed under rehabilitation programs.

Jemena Gas Networks AMP | 47
0 1,000 2,000 3,000 4,000 5,000 6,000 7,000 8,000 9,000
5
10
15
20
25
30
35
40
45
50
Length (km)
Age
(ye
ars)
Age Profile of Pipelines
Low and Medium Pressure Secondary Mains Primary Trunk
Figure 27 Age profile of pipelines
9.3 TRUNK PIPELINES
Pip
elin
es
Trunk
Primary Mains
Secondary Mains
Low & Medium Pressure MainsLi
fe-C
ycle
Man
age
me
nt
Asset Class
The trunk pipelines consist of 267km of high-strength steel pipe with a MAOP of 6,895kPa. They are
internally and externally protected against corrosion by an anti-corrosion pipe coating and internal lining.
Additional protection is also achieved with a CP system.
The trunk pipeline system comprises the trunk pipelines, CP systems, pig launcher and receiving stations
and easements.
There are three trunk pipelines in JGN’s network:
the Central Trunk, which transports gas from Wilton to Horsley Park to serve the Sydney region and
onwards to the Northern Trunk
the Northern Trunk, which is an extension of the Central Trunk and transports gas from Horsley Park to
serve the Central Coast and Newcastle regions
the Southern Trunk, which transports gas from Wilton to serve the Wollongong region.
These are operated under licences issued in accordance with the Pipelines Act 1967 (NSW). The key
features of the trunk pipelines are set out in Table 12.
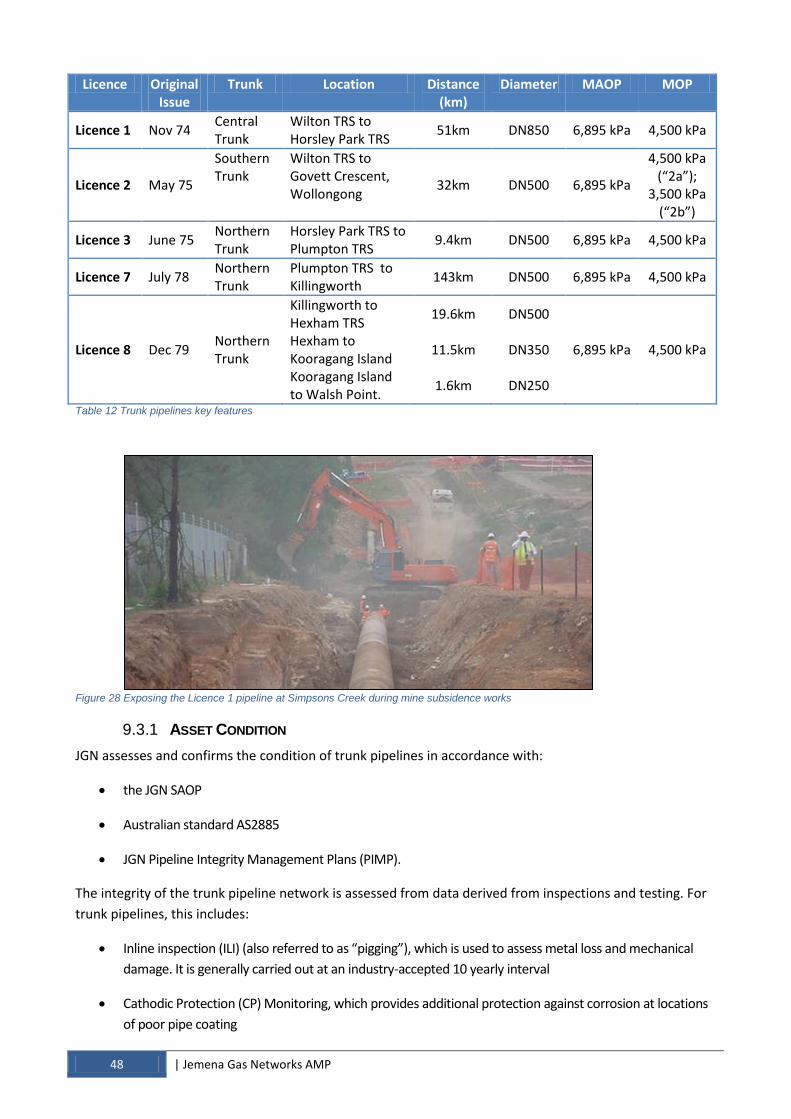
48 | Jemena Gas Networks AMP
Licence Original Issue
Trunk Location Distance (km)
Diameter MAOP MOP
Licence 1 Nov 74 Central Trunk
Wilton TRS to Horsley Park TRS
51km DN850 6,895 kPa 4,500 kPa
Licence 2 May 75
Southern Trunk
Wilton TRS to Govett Crescent, Wollongong
32km DN500 6,895 kPa
4,500 kPa (“2a”);
3,500 kPa (“2b”)
Licence 3 June 75 Northern Trunk
Horsley Park TRS to Plumpton TRS
9.4km DN500 6,895 kPa 4,500 kPa
Licence 7 July 78 Northern Trunk
Plumpton TRS to Killingworth
143km DN500 6,895 kPa 4,500 kPa
Licence 8 Dec 79 Northern Trunk
Killingworth to Hexham TRS Hexham to Kooragang Island Kooragang Island to Walsh Point.
19.6km
11.5km
1.6km
DN500
DN350
DN250
6,895 kPa 4,500 kPa
Table 12 Trunk pipelines key features
Figure 28 Exposing the Licence 1 pipeline at Simpsons Creek during mine subsidence works
ASSET CONDITION 9.3.1
JGN assesses and confirms the condition of trunk pipelines in accordance with:
the JGN SAOP
Australian standard AS2885
JGN Pipeline Integrity Management Plans (PIMP).
The integrity of the trunk pipeline network is assessed from data derived from inspections and testing. For
trunk pipelines, this includes:
Inline inspection (ILI) (also referred to as “pigging”), which is used to assess metal loss and mechanical
damage. It is generally carried out at an industry-accepted 10 yearly interval
Cathodic Protection (CP) Monitoring, which provides additional protection against corrosion at locations
of poor pipe coating

Jemena Gas Networks AMP | 49
Direct Current Voltage Gradient (DCVG) measurement, which provides an indication of coating defects
that can lead to corrosion under the coating
Integrity Digs, which provide measured pipe data at selected locations.
The data from this testing is compiled and reviewed during a five yearly SMS which also assesses pipeline
risk (safety, environmental and supply continuity), identifies threats, reviews controls and recommends
additional protection measures where existing mitigations are inadequate. The SMS considers all relevant
data obtained from inspection and testing activities to determine the pipeline integrity for purposes of
confirming (or validating) the pipeline MAOP.
The most recent SMS for the trunk pipelines was conducted in RY10 and identified:
No unauthorised landowner activities near the trunk pipelines. However, two commercial developments
were undertaken in close proximity to a pipeline, which were reviewed through the SMS
Minor metal loss from corrosion was reported via pigging data. The metal loss was assessed as not
affecting the pipeline integrity
River bank erosion was surveyed in multiple locations due to flooding, with Wyong River requiring
restoration works, which were completed as a joint project with the local council
Mine subsidence is managed through Mine Subsidence Management Plans. The SMS identified evidence
of subsidence effects on the Central Trunk, which requires rehabilitation and restoration of coal tar
enamel once the subsidence effects have stabilised.
The trunk pipelines are managed to ensure continued performance in accordance with their design and
operating requirements. There have been no failures of trunk pipelines.
To mitigate the risk of failure, the performance of trunk pipelines is managed through a condition
monitoring and inspection program to identify potential issues before they can lead to a degradation of
performance. For the pipeline operation, JGN complies with AS2885 to ensure “continued pipeline integrity
during the life of the pipeline”. Pipeline integrity is assessed and maintained through an integrated and
systematic program of pigging (where applicable), periodic SMS reviews (five-yearly and when changes are
made to the operating conditions) and integrity digs (based on operating and maintenance data).
The five yearly trunk pipeline SMS conducted in RY10 confirmed that all control measures, procedural and
physical, were implemented and remain effective.
There are no reported incidents, either operational or external, that have affected the integrity of the trunk
pipelines. The MAOPs for the pipelines were confirmed at the levels stated in Table 12.
ASSET PERFORMANCE 9.3.2
JGN’s trunk pipelines are critical assets that must perform reliably to avoid disruption to customer supply. A
trunk pipeline failure is likely to be catastrophic especially if the failure results in the ignition of gas.
Consequences are likely to include personal injury, property and environmental damages and/or loss of
supply.
The capacity of the Wilton to Newcastle section of the trunk pipeline is assessed to be adequate to meet
demand for the period of the AMP.
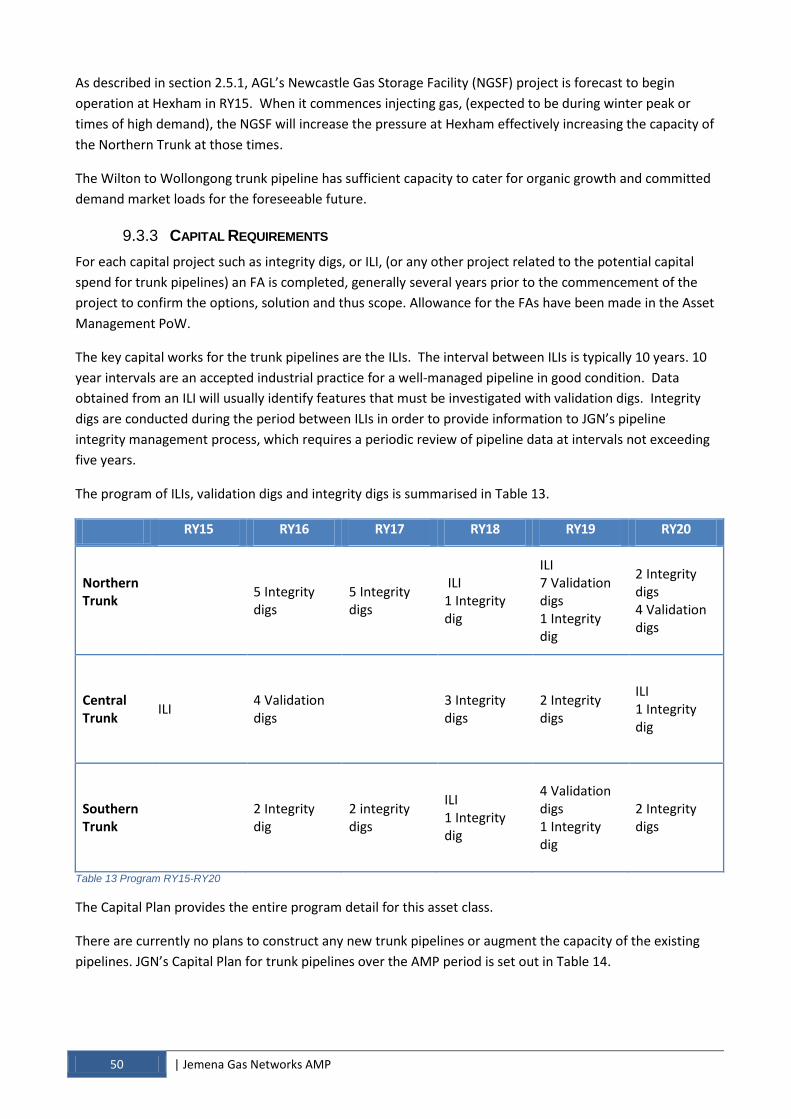
50 | Jemena Gas Networks AMP
As described in section 2.5.1, AGL’s Newcastle Gas Storage Facility (NGSF) project is forecast to begin
operation at Hexham in RY15. When it commences injecting gas, (expected to be during winter peak or
times of high demand), the NGSF will increase the pressure at Hexham effectively increasing the capacity of
the Northern Trunk at those times.
The Wilton to Wollongong trunk pipeline has sufficient capacity to cater for organic growth and committed
demand market loads for the foreseeable future.
CAPITAL REQUIREMENTS 9.3.3
For each capital project such as integrity digs, or ILI, (or any other project related to the potential capital
spend for trunk pipelines) an FA is completed, generally several years prior to the commencement of the
project to confirm the options, solution and thus scope. Allowance for the FAs have been made in the Asset
Management PoW.
The key capital works for the trunk pipelines are the ILIs. The interval between ILIs is typically 10 years. 10
year intervals are an accepted industrial practice for a well-managed pipeline in good condition. Data
obtained from an ILI will usually identify features that must be investigated with validation digs. Integrity
digs are conducted during the period between ILIs in order to provide information to JGN’s pipeline
integrity management process, which requires a periodic review of pipeline data at intervals not exceeding
five years.
The program of ILIs, validation digs and integrity digs is summarised in Table 13.
RY15 RY16 RY17 RY18 RY19 RY20
Northern Trunk
5 Integrity digs
5 Integrity digs
ILI 1 Integrity dig
ILI 7 Validation digs 1 Integrity dig
2 Integrity digs 4 Validation digs
Central Trunk ILI 4 Validation
digs 3 Integrity digs
2 Integrity digs
ILI 1 Integrity dig
Southern Trunk
2 Integrity dig
2 integrity digs
ILI 1 Integrity dig
4 Validation digs 1 Integrity dig
2 Integrity digs
Table 13 Program RY15-RY20
The Capital Plan provides the entire program detail for this asset class.
There are currently no plans to construct any new trunk pipelines or augment the capacity of the existing
pipelines. JGN’s Capital Plan for trunk pipelines over the AMP period is set out in Table 14.

Jemena Gas Networks AMP | 51
$’000s RY15 RY16 RY17 RY18 RY19 RY20
Trunk Pipelines Capex 1,357 5,407 2,081 3,098 3,947 3,256
Table 14 Summary of Trunk mains Capital Plan
MAINTENANCE REQUIREMENTS 9.3.4
The maintenance of the trunk pipelines includes planned and corrective activities. Most activities are
managed through JGN’s in-house enterprise IT system.
Examples of planned maintenance activities on the trunk pipelines include pipeline patrol, easement
maintenance and CP surveys.
Corrective maintenance activities may be initiated from actions arising from an integrity review or from
pipeline risk management, external activities and/or encroachment.
The following special maintenance project is included in the Maintenance Plan:
DCVG coating survey, which is used to locate and size pipe coating defects. The technique involves
measuring the voltage gradients in the soil above a cathodically protected pipeline. Several surveys are
planned for RY15 and RY18.
9.4 PRIMARY MAINS
Pip
elin
es
Trunk
Primary Mains
Secondary Mains
Low & Medium Pressure MainsLi
fe-C
ycle
Man
age
me
nt
Asset Class
The primary mains consist of 147km of high-strength steel pipe with a MAOP of 3,500kPa. There are
elements of the primary network in the Sydney and Wollongong distribution networks. The pipes are
internally and externally protected against corrosion by an anti-corrosion pipe coating and internal lining.
Additional protection is also achieved with a CP system.
The primary main system consists of various pipe sizes and configurations as follows in Table 15.
Primary Main Physical Description Diameter Length
Sydney Primary Main
Horsley Park to Mortlake and Mortlake to Banksmeadow Mortlake to Willoughby
DN550 DN550
DN500/DN200/DN150
30km 26km 17km
Sydney Primary Loop
West Hoxton to Casula and Casula to Tempe
DN550 DN500
11km 28km
Penrith Primary Main
Eastern Creek to Penrith and Penrith to Emu Plains
DN200 DN200
19km 3km
Wollongong Primary Mains Figtree to Wollongong DN200/DN150 7.3km
Table 15 Primary mains

52 | Jemena Gas Networks AMP
ASSET CONDITION 9.4.1
The primary mains are predominantly operating in an urban environment including areas of high density
population, schools and hospitals and greater concentration of services and utilities than the trunk
pipelines. The majority of the primary mains are laid in road reserve with only minimal areas covered by
easements. The primary mains need to meet the “no rupture” and “maximum gas release rate”
requirements of the AS2885 to prevent risk to community safety, property and environmental damages
and loss of supply.
JGN’s primary mains are critical assets that must perform reliably to avoid disruption to customer supply. A
primary main failure is likely to be catastrophic, especially if the failure results in the ignition of gas.
Consequences are likely to include personal injury, property and environmental damages and/or loss of
supply.
The primary mains are managed to ensure continued operating in accordance with their design and
operating requirements. There have been no significant failures of primary mains to date.
To mitigate the risk of failure, the condition of primary mains is managed through a rigorous condition
monitoring and inspection program to identify potential issues before they can lead to a degradation of
performance. For the pipeline operation, JGN complies with AS2885 to ensure “continued pipeline integrity
during the life of the pipeline”. Primary mains integrity is assessed and maintained through an integrated
and systematic program of pigging (where applicable), periodic SMS reviews (five yearly and when changes
are made to the operating conditions) and integrity digs (based on operating and maintenance data).
There are no reported incidents, either operational or external, that have affected the integrity of the
primary mains. The MAOPs for the pipelines were confirmed at the levels state in Table 12.
The primary mains’ integrity is assessed from the data that are produced from the following activities which
are assessed by the SMS in the five yearly integrity review:
Pipe wall condition: Inspection/testing using Pipeline pigging (as applicable) and/or integrity digs
Corrosion protection: CP monitoring (planned activity) with DCVG as required
Operation controls: pressure, temperature and gas quality monitoring
Maintenance activities: planned work to the approved procedures and work methods
External interference controls: SMS undertaken as required to assess, monitor and control proposed
work.
The data from testing is compiled and reviewed resulting in the following:
There are generally no unauthorised activities near the primary pipelines. However, the Penrith Primary
main contains a thin wall pipe section that is vulnerable to external interference of damage and is
therefore included in a replacement project in the Capital Plan
Minor surface pitting and coating anomalies were identified by integrity digs and coating surveys. The
corrosion features were assessed to not affect the MAOP. The identified areas are being repaired and re-
coated
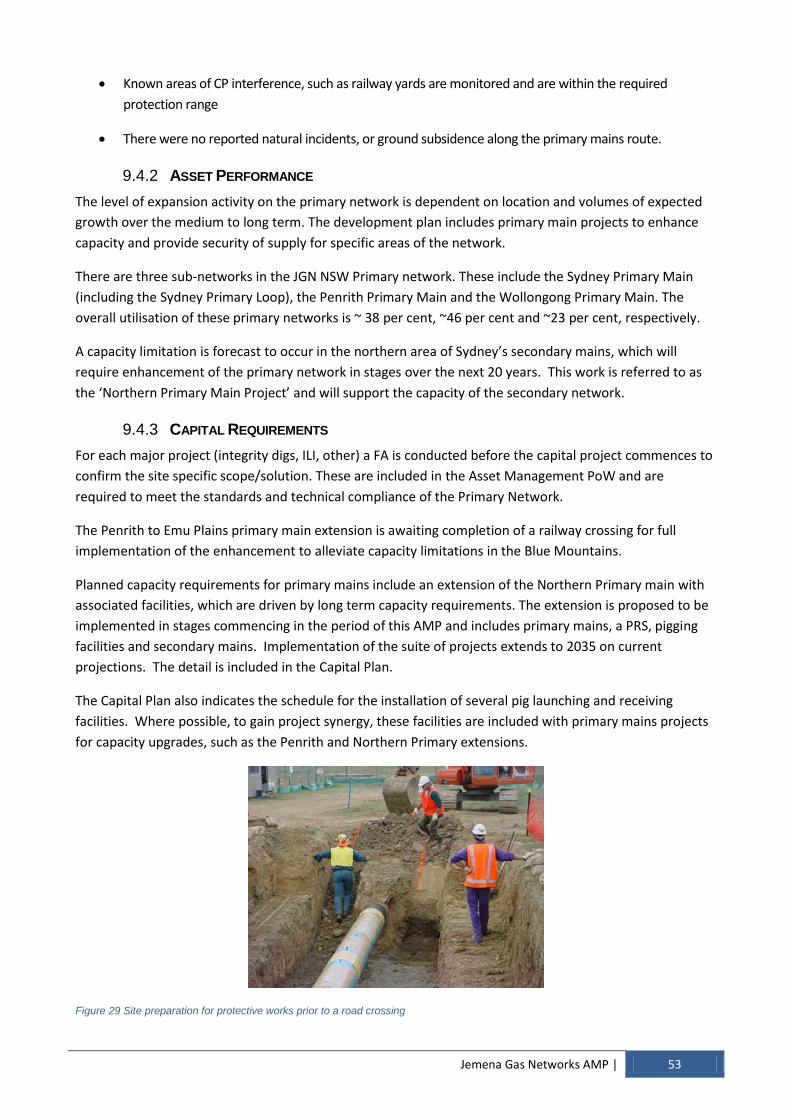
Jemena Gas Networks AMP | 53
Known areas of CP interference, such as railway yards are monitored and are within the required
protection range
There were no reported natural incidents, or ground subsidence along the primary mains route.
ASSET PERFORMANCE 9.4.2
The level of expansion activity on the primary network is dependent on location and volumes of expected
growth over the medium to long term. The development plan includes primary main projects to enhance
capacity and provide security of supply for specific areas of the network.
There are three sub-networks in the JGN NSW Primary network. These include the Sydney Primary Main
(including the Sydney Primary Loop), the Penrith Primary Main and the Wollongong Primary Main. The
overall utilisation of these primary networks is ~ 38 per cent, ~46 per cent and ~23 per cent, respectively.
A capacity limitation is forecast to occur in the northern area of Sydney’s secondary mains, which will
require enhancement of the primary network in stages over the next 20 years. This work is referred to as
the ‘Northern Primary Main Project’ and will support the capacity of the secondary network.
CAPITAL REQUIREMENTS 9.4.3
For each major project (integrity digs, ILI, other) a FA is conducted before the capital project commences to
confirm the site specific scope/solution. These are included in the Asset Management PoW and are
required to meet the standards and technical compliance of the Primary Network.
The Penrith to Emu Plains primary main extension is awaiting completion of a railway crossing for full
implementation of the enhancement to alleviate capacity limitations in the Blue Mountains.
Planned capacity requirements for primary mains include an extension of the Northern Primary main with
associated facilities, which are driven by long term capacity requirements. The extension is proposed to be
implemented in stages commencing in the period of this AMP and includes primary mains, a PRS, pigging
facilities and secondary mains. Implementation of the suite of projects extends to 2035 on current
projections. The detail is included in the Capital Plan.
The Capital Plan also indicates the schedule for the installation of several pig launching and receiving
facilities. Where possible, to gain project synergy, these facilities are included with primary mains projects
for capacity upgrades, such as the Penrith and Northern Primary extensions.
Figure 29 Site preparation for protective works prior to a road crossing
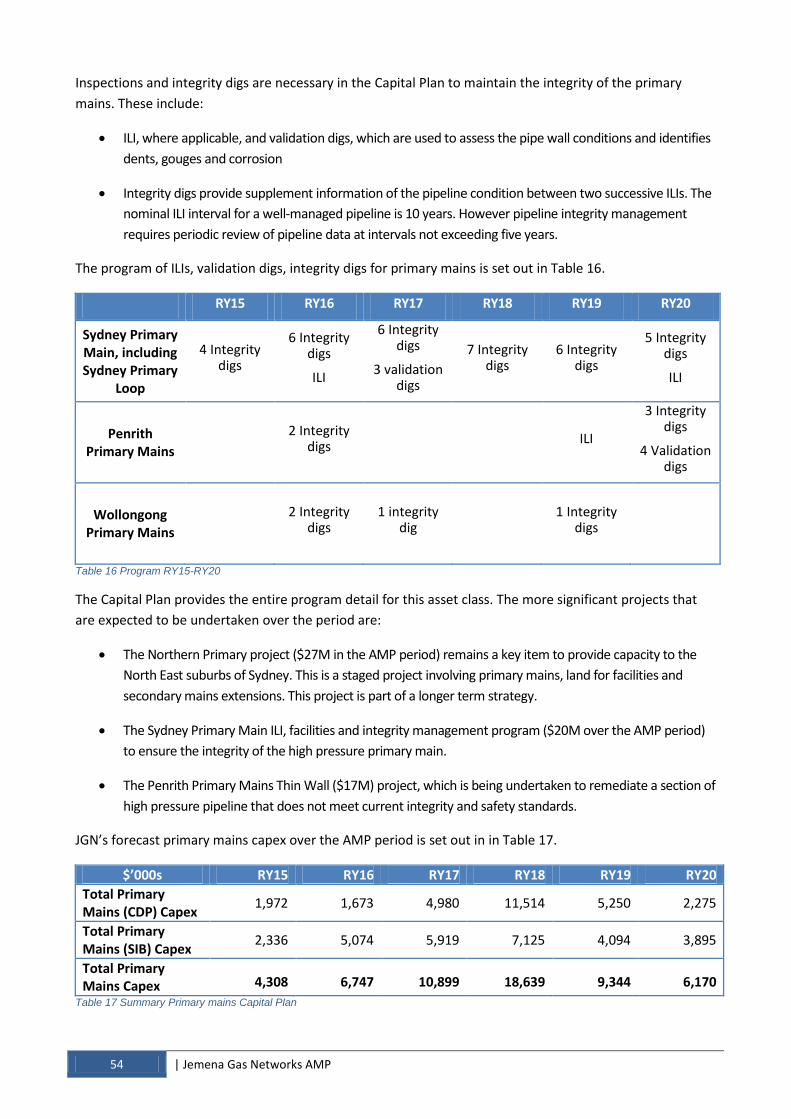
54 | Jemena Gas Networks AMP
Inspections and integrity digs are necessary in the Capital Plan to maintain the integrity of the primary
mains. These include:
ILI, where applicable, and validation digs, which are used to assess the pipe wall conditions and identifies
dents, gouges and corrosion
Integrity digs provide supplement information of the pipeline condition between two successive ILIs. The
nominal ILI interval for a well-managed pipeline is 10 years. However pipeline integrity management
requires periodic review of pipeline data at intervals not exceeding five years.
The program of ILIs, validation digs, integrity digs for primary mains is set out in Table 16.
RY15 RY16 RY17 RY18 RY19 RY20
Sydney Primary Main, including Sydney Primary
Loop
4 Integrity digs
6 Integrity digs
ILI
6 Integrity digs
3 validation digs
7 Integrity digs
6 Integrity digs
5 Integrity digs
ILI
Penrith Primary Mains
2 Integrity
digs ILI
3 Integrity digs
4 Validation digs
Wollongong Primary Mains
2 Integrity
digs 1 integrity
dig
1 Integrity digs
Table 16 Program RY15-RY20
The Capital Plan provides the entire program detail for this asset class. The more significant projects that
are expected to be undertaken over the period are:
The Northern Primary project ($27M in the AMP period) remains a key item to provide capacity to the
North East suburbs of Sydney. This is a staged project involving primary mains, land for facilities and
secondary mains extensions. This project is part of a longer term strategy.
The Sydney Primary Main ILI, facilities and integrity management program ($20M over the AMP period)
to ensure the integrity of the high pressure primary main.
The Penrith Primary Mains Thin Wall ($17M) project, which is being undertaken to remediate a section of
high pressure pipeline that does not meet current integrity and safety standards.
JGN’s forecast primary mains capex over the AMP period is set out in in Table 17.
$’000s RY15 RY16 RY17 RY18 RY19 RY20
Total Primary Mains (CDP) Capex
1,972 1,673 4,980 11,514 5,250 2,275
Total Primary Mains (SIB) Capex 2,336 5,074 5,919 7,125 4,094 3,895
Total Primary Mains Capex 4,308 6,747 10,899 18,639 9,344 6,170
Table 17 Summary Primary mains Capital Plan

Jemena Gas Networks AMP | 55
MAINTENANCE REQUIREMENTS 9.4.4
The maintenance of the primary mains includes planned and corrective activities. Most activities are
managed through JGN’s in-house enterprise IT system.
Examples of planned maintenance activities on the primary mains include pipeline patrol and CP surveys.
Corrective maintenance activities may be initiated from actions arising from an integrity review or from
pipeline risk management, external activities and/or encroachment.
The following special maintenance projects have been included in the Maintenance Plan:
Pipeline review including coating surveys and SMS workshops
DCVG coating surveys, which are used to locate and size pipe coating defects. The technique is
fundamentally based on measuring the voltage gradients in the soil above a cathodically protected
pipeline. Several surveys are planned for RY15 and RY18 with proposed number and locations over the
five year period for the respective pipelines.
9.5 SECONDARY MAINS
Pip
elin
es
Trunk
Primary Mains
Secondary Mains
Low & Medium Pressure MainsLi
fe-C
ycle
Man
age
me
nt
Asset Class
The secondary mains asset category consist of 1,493km of steel pipe, which is externally coated with High-
Density Polyethylene (HDPE) to protect it from corrosion and internally lined to reduce frictional loses and
provide some internal corrosion protection. A limited number of older mains have a coal tar coating.
Additional corrosion protection is also achieved with a CP system.
The secondary mains asset category also consists of secondary services, line valves and CP systems.
ASSET CONDITION 9.5.1
JGN assesses and confirms the condition of secondary mains in accordance with:
JGN SAOP
Australian AS4645 standards
JGN Distribution Integrity Management Plan (DIMP).
System integrity of the secondary mains is assessed through integrity and performance assessments, which
use indirect monitoring and performance methods, including leakage survey mains escapes, UAG, publicly
reported leaks, field reports and feedback, pipeline patrol and review of data from CP surveys and circuit
checks.
Integrity monitoring has identified the following issues:

56 | Jemena Gas Networks AMP
Two secondary mains have been affected by soil erosion and will require not only reinstatement of
ground cover, but management of the root cause. Work on the worst of these mains, Old Northern Road
Maroota, is scheduled to commence in RY14. An FA for the second site corner of Manns Road and Nells
Road Gosford is complete. The RY15 budget has an allocation to fund the works.
There are approximately 300 exposed mains across the JGN gas distribution network to manage, which
require inspection and potential rectification works. Exposed mains inspections are included in the opex
budget as non-routine maintenance step changes.
ASSET PERFORMANCE 9.5.2
Various projects have been identified in the Capital Plan through the network capacity validation and
planning process, to augment the capacity of the secondary mains to provide supply reliability for organic
growth. The level of expansion activity on the secondary mains is dependent on location and volumes of
load growth over the medium to long term.
New estate development areas are generally located along the fringes of established areas. The secondary
network is expanded into these new estates as land is released. Expansion activity is concentrated along
the growth corridors of the North West Sector and South West Sector within the Sydney Metropolitan area
and the West Dapto area in Wollongong, Newcastle and some areas of the Central Coast.
Figure 30 Steel main being laid
CAPITAL REQUIREMENTS 9.5.3
Current planning activities for secondary network creation include a number of secondary mains extensions
to improve capacity within the network in Rouse Hill, Kotara, Kellyville and Castle Hill. There are also some
long term projects planned for the Northwest Growth Sector, Sydney City and the Southwest Growth
Sector.
The Capital Plan provides the entire program detail for this asset class. The significant projects that are
expected to be undertaken over the period are:
the Rouse Hill Capacity Development project, which will involve laying approximately 7km of
secondary steel mains as part of a staged expansion into the North-West growth sector ($9M)
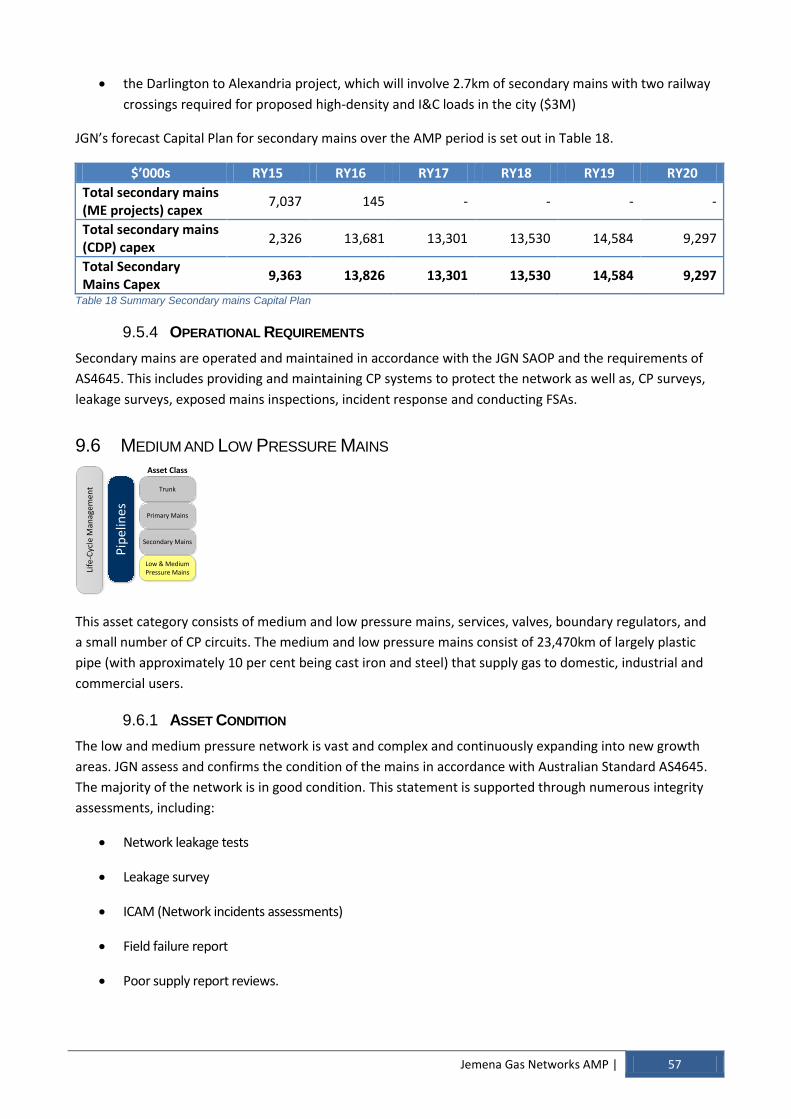
Jemena Gas Networks AMP | 57
the Darlington to Alexandria project, which will involve 2.7km of secondary mains with two railway
crossings required for proposed high-density and I&C loads in the city ($3M)
JGN’s forecast Capital Plan for secondary mains over the AMP period is set out in Table 18.
$’000s RY15 RY16 RY17 RY18 RY19 RY20
Total secondary mains (ME projects) capex
7,037 145 - - - -
Total secondary mains (CDP) capex
2,326 13,681 13,301 13,530 14,584 9,297
Total Secondary Mains Capex
9,363 13,826 13,301 13,530 14,584 9,297
Table 18 Summary Secondary mains Capital Plan
OPERATIONAL REQUIREMENTS 9.5.4
Secondary mains are operated and maintained in accordance with the JGN SAOP and the requirements of
AS4645. This includes providing and maintaining CP systems to protect the network as well as, CP surveys,
leakage surveys, exposed mains inspections, incident response and conducting FSAs.
9.6 MEDIUM AND LOW PRESSURE MAINS
Pip
elin
es
Trunk
Primary Mains
Secondary Mains
Low & Medium Pressure MainsLi
fe-C
ycle
Man
age
me
nt
Asset Class
This asset category consists of medium and low pressure mains, services, valves, boundary regulators, and
a small number of CP circuits. The medium and low pressure mains consist of 23,470km of largely plastic
pipe (with approximately 10 per cent being cast iron and steel) that supply gas to domestic, industrial and
commercial users.
ASSET CONDITION 9.6.1
The low and medium pressure network is vast and complex and continuously expanding into new growth
areas. JGN assess and confirms the condition of the mains in accordance with Australian Standard AS4645.
The majority of the network is in good condition. This statement is supported through numerous integrity
assessments, including:
Network leakage tests
Leakage survey
ICAM (Network incidents assessments)
Field failure report
Poor supply report reviews.

58 | Jemena Gas Networks AMP
Leakage surveys are a maintenance strategy employed by distribution businesses to locate leaks in gas
distribution networks. The frequency with which surveys are undertaken is based upon risk and past
performance, with all sections being surveyed at least once every five years (the minimum requirements of
AS4645). More frequent surveys are undertaken in high-risk areas and where previous surveys indicated an
excessive level of leaks. All gas leaks located are assessed.
The outcomes of leakage surveys, combined with leakage tests, help to identify poorly performing
networks that may need rehabilitation, such as Stockton, Warringah and Bowral. For example, results from
recent leakage tests revealed the Stockton 7kPa network leakage rate was 56 per cent of UAG, Warringah
210kPa network leakage rate was 36 per cent and Kensington 7kPa network in the order of 27 Per cent.
A number of leakage surveys are scheduled for RY15 in the following areas of the network:
Wollongong/ Coniston 7kPa network
Drummoyne 210kPa network
Goulburn Sector 2 7kPa network
Newcastle MP1 7kPa network
Bidwell 210kPa network.
In RY16 and RY17, JGN is planning a similar level of leakage survey of approximately four networks per
annum.
JGN is planning to investigate trends in leakage surveys that show an increase in minor leaks, which may in
time deteriorate to become major leaks. These observations coincide with more reliable electronic leak
surveys. The RY14 surveys will provide the first opportunity to compare two sets of data from the one
network.
Figure 31 Typical cast iron mains condition prior to rehabilitation
Network incidents are another indicator of network integrity and performance. An incident can be caused
by a component failure. Failed components (pipe and fittings) are sent to a laboratory for analysis. A
common cause of failure is poor joint quality, an issue that occurred during network construction.
Significant work has been undertaken to improve construction quality for polyethylene mains. Further work
is being undertaken to improve construction quality of the nylon system. JGN continues to monitor network
reliability closely and remains focused on improving asset integrity and management practices to reduce
installation related field failures on plastic distribution systems.

Jemena Gas Networks AMP | 59
To address the results from leakage surveys and network incidents, an asset renewal program strategy has
been developed. Renewal program strategies are driven by factors including age, condition, performance
and capacity. This was reviewed and has been updated for the AMP period, with an FA conducted for each
capex project.
In RY15, data generated from the laboratories field failure reports will be consolidated then reviewed. The
purpose of this review is to identify the root causes of failures and provide improvements in network
construction.
Some other aspects that will be investigated over RY15-RY20 are set out below:
Identify critical components of the JGN gas distribution network and how to support, for example where
imperial sized pipe may be damaged with no parts readily available to replace
Ensuring adequate high risk valving is installed due to commercial and residential developments changing
the risk profile across the JGN gas distribution network. Valves will be installed as part of the Capital Plan
and then tested as part of the maintenance plan to test valves can be operated to isolate the network
Review the Pennant Hills mains, which has known integrity issues that are causing leaks. The main is
difficult to reach at depths up to 3-4m and situated on a major arterial road.
ASSET PERFORMANCE 9.6.2
Network capacity validation and planning has identified projects to increase the capacity of the medium
and low pressure networks to ensure ongoing supply reliability. Drivers for the increase in capacity for
these assets include:
Growth in customer numbers, requiring both local and deep infrastructure enhancement to
provide supply and maintain security of supply
Changes in customer consumption patterns as customers move to higher efficiency appliances,
such as instantaneous hot water units that have a higher peak consumption compared to storage
hot water
Changes in population/housing density
Demographic and other changes.
The changes required in the gas distribution network configuration are localised. Projects are planned and
then confirmed through monitoring of pressure reduction in areas within the gas distribution network
followed by modelling of the areas to account for the variability of temperature effects. JGN utilises a 1 in
10 winter as the basis of modelling to minimise the potential temperature effects.
There are a large number of projects in this category. The key projects have been grouped by regions as
follows:
Central Coast and Newcastle
Illawarra
Country NSW and Southern Highlands
Sydney Metropolitan area, N/NW, West, South.

60 | Jemena Gas Networks AMP
The projects required to support the medium and low pressure networks are outlined in the Capital Plan.
There are still some remaining pockets of the network, including the majority of those rehabilitation
projects identified in the section above, that have not been rehabilitated. As a result these areas operate
at lower pressures, meaning customers in these areas may:
be restricted in their choice of appliances – for example, the pressure may be too low to operate
continuous flow hot water heaters and central heating systems, which consume gas at a high rate over
short periods
need to install more expensive pipework inside their properties in order to operate these appliances.
The projects above will install plastic pipes that can operate at higher pressures, allowing these customers
to enjoy the same quality of service as other customers across the JGN network. These are referred to as
mains and services renewal projects in the Capital Plan.
Figure 32 Insertion of nylon pipe as part of rehabilitation project
CAPITAL REQUIREMENTS 9.6.3
The Capital Plan provides the entire program detail for this asset class. The material projects over the
period are:
Low and medium pressure market expansion mains program
Low and medium pressure capacity development projects
Mt Druitt Steel Mains Renewal project, which spans multiple years and is required to ensure the integrity
of the asset. This project will occur in a staged manner because it requires significant mains (110 mm PE
and 160 mm PE) to be laid ( $16M over the RY15-RY20 period)
Wollongong Coniston Mains Renewal project also spans multiple years and is required to ensure the
integrity of the asset. The project involves mains upgrade through mains insertion ($7M over the RY15-
RY20 period).
JGN’s forecast Capital Plan for low and medium pressure mains over the AMP period is set out in Table 19.

Jemena Gas Networks AMP | 61
$’000s RY15 RY16 RY17 RY18 RY19 RY20
Total low and medium mains & services (ME) capex
63,874 66,644 69,924 69,154 69,138 70,266
Total low and medium mains (CDP) capex
3,821 5,824 3,390 2,117 2,816 7,212
Total low and medium mains (SIB) capex
9,727 15,453 19,845 15,916 11,090 12,568
Total Low and Medium Mains Capex
77,421 87,921 93,160 87,186 83,045 90,046
Table 19 Summary of medium and low pressure mains Capital Plan
OPERATIONAL REQUIREMENTS 9.6.4
Low and medium pressure mains and services are operated and maintained in accordance with the JGN
SAOP and DIMP. The plans include integrity reviews and maintenance activities representing an integrated
system of requirements reflected in AS4645 and other technical regulatory requirements.
The Maintenance Plan for these assets includes planned, corrective and emergency response activities.

62 | Jemena Gas Networks AMP
10 ASSET STRATEGY – FACILITIES
Faci
litie
sTrunk & Primary
Facilities
Metering
District Regulator Sets
SCADA & Communications
Life
-Cyc
le M
anag
emen
t
10.1 SUMMARY
JGN’s asset strategy for trunk and primary facilities over the AMP period is to ensure the safety and
integrity of the asset, meet regulatory requirements, and cater for growth of the network. The strategy
provides for the following projects:
Trunk Facilities:
o electrical and instrumentation upgrade to replace obsolete equipment and earthing refurbishment
o corrosion protection through recoating and CP refurbishment
o installation of station preheating in conjunction with new shippers’ delivery requiring pressure
enhancements
o mitigation against bushfire threats.
Primary Facilities:
o Replacement of quieter control valves to mitigate detrimental high level of vibration
o Concrete wall and lids refurbishment.
Figure 33 Underground PRS installation
10.2 BACKGROUND
JGN’s network consists of a number of facilities that enable the network to operate at a pressure of
between 2kPa and 6,895kPa, as highlighted in Table 20.
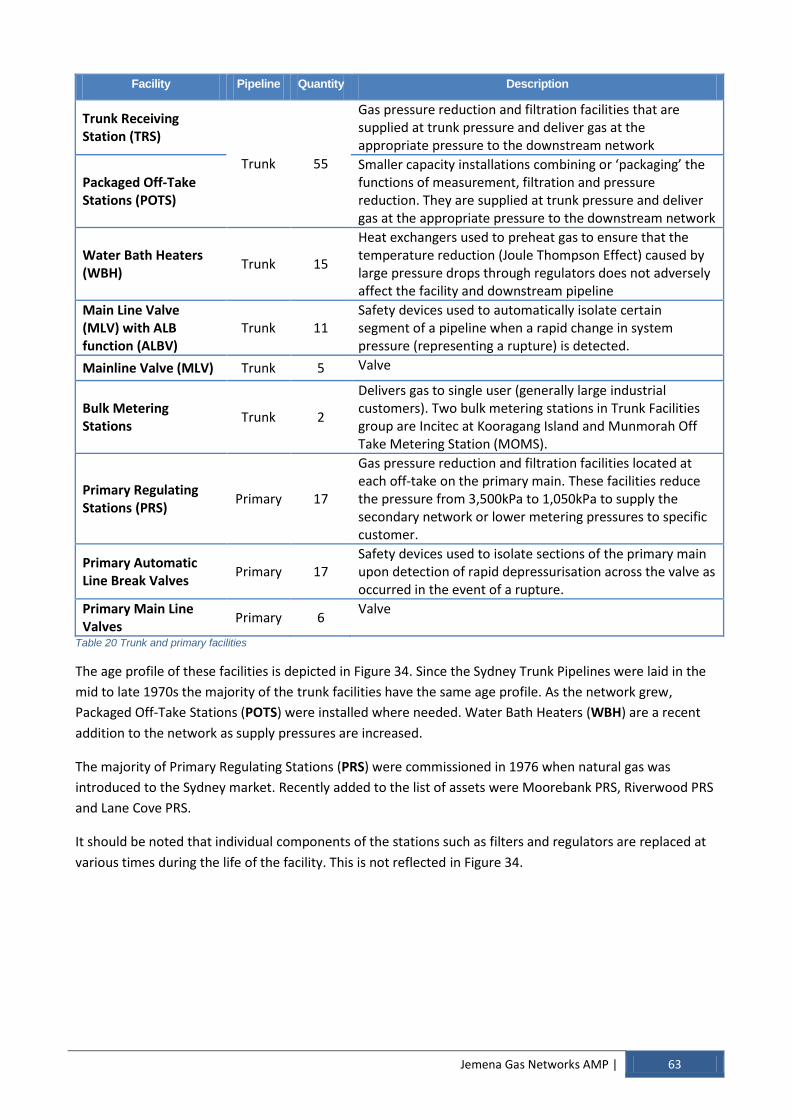
Jemena Gas Networks AMP | 63
Facility Pipeline Quantity Description
Trunk Receiving Station (TRS)
Trunk 55
Gas pressure reduction and filtration facilities that are supplied at trunk pressure and deliver gas at the appropriate pressure to the downstream network
Packaged Off-Take Stations (POTS)
Smaller capacity installations combining or ‘packaging’ the functions of measurement, filtration and pressure reduction. They are supplied at trunk pressure and deliver gas at the appropriate pressure to the downstream network
Water Bath Heaters (WBH) Trunk 15
Heat exchangers used to preheat gas to ensure that the temperature reduction (Joule Thompson Effect) caused by large pressure drops through regulators does not adversely affect the facility and downstream pipeline
Main Line Valve (MLV) with ALB function (ALBV)
Trunk 11 Safety devices used to automatically isolate certain segment of a pipeline when a rapid change in system pressure (representing a rupture) is detected.
Mainline Valve (MLV) Trunk 5 Valve
Bulk Metering Stations Trunk 2
Delivers gas to single user (generally large industrial customers). Two bulk metering stations in Trunk Facilities group are Incitec at Kooragang Island and Munmorah Off Take Metering Station (MOMS).
Primary Regulating Stations (PRS) Primary 17
Gas pressure reduction and filtration facilities located at each off-take on the primary main. These facilities reduce the pressure from 3,500kPa to 1,050kPa to supply the secondary network or lower metering pressures to specific customer.
Primary Automatic Line Break Valves Primary 17
Safety devices used to isolate sections of the primary main upon detection of rapid depressurisation across the valve as occurred in the event of a rupture.
Primary Main Line Valves Primary 6 Valve
Table 20 Trunk and primary facilities
The age profile of these facilities is depicted in Figure 34. Since the Sydney Trunk Pipelines were laid in the
mid to late 1970s the majority of the trunk facilities have the same age profile. As the network grew,
Packaged Off-Take Stations (POTS) were installed where needed. Water Bath Heaters (WBH) are a recent
addition to the network as supply pressures are increased.
The majority of Primary Regulating Stations (PRS) were commissioned in 1976 when natural gas was
introduced to the Sydney market. Recently added to the list of assets were Moorebank PRS, Riverwood PRS
and Lane Cove PRS.
It should be noted that individual components of the stations such as filters and regulators are replaced at
various times during the life of the facility. This is not reflected in Figure 34.
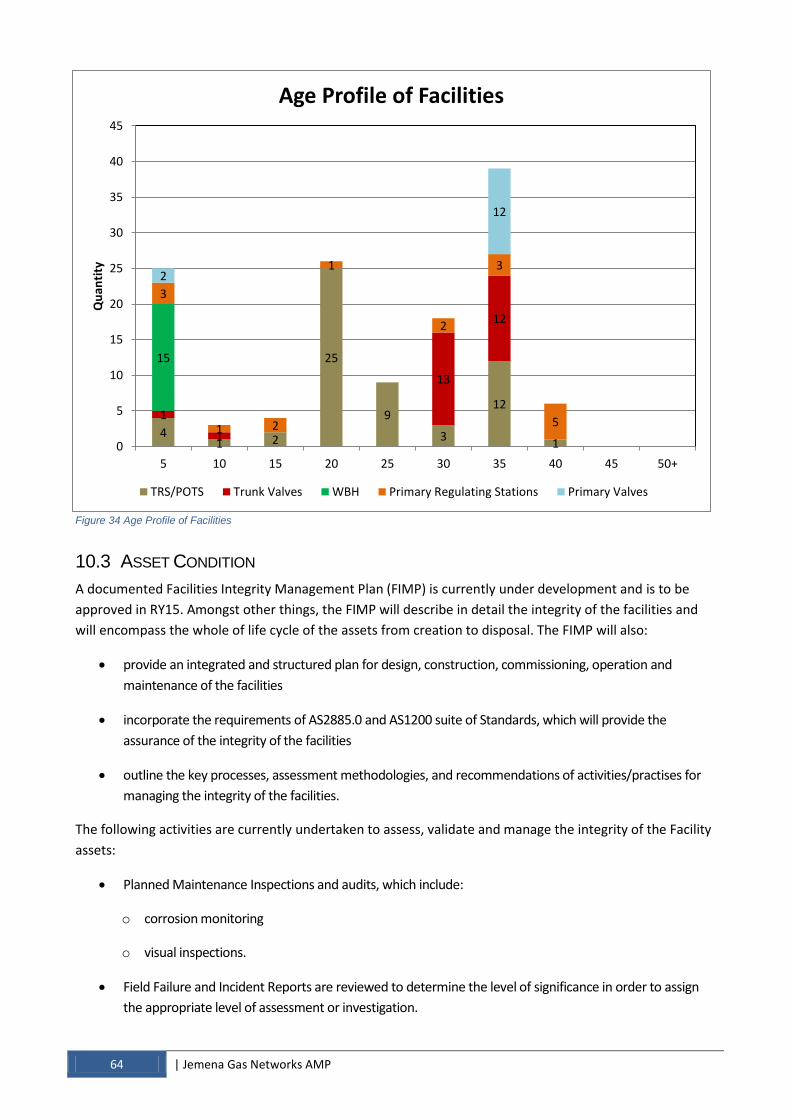
64 | Jemena Gas Networks AMP
4 1 2
25
9
3
12
1
1
1
13
12
15
3
1 2
1
2
3
5
2
12
0
5
10
15
20
25
30
35
40
45
5 10 15 20 25 30 35 40 45 50+
Qu
anti
ty
Age Profile of Facilities
TRS/POTS Trunk Valves WBH Primary Regulating Stations Primary Valves
Figure 34 Age Profile of Facilities
10.3 ASSET CONDITION
A documented Facilities Integrity Management Plan (FIMP) is currently under development and is to be
approved in RY15. Amongst other things, the FIMP will describe in detail the integrity of the facilities and
will encompass the whole of life cycle of the assets from creation to disposal. The FIMP will also:
provide an integrated and structured plan for design, construction, commissioning, operation and
maintenance of the facilities
incorporate the requirements of AS2885.0 and AS1200 suite of Standards, which will provide the
assurance of the integrity of the facilities
outline the key processes, assessment methodologies, and recommendations of activities/practises for
managing the integrity of the facilities.
The following activities are currently undertaken to assess, validate and manage the integrity of the Facility
assets:
Planned Maintenance Inspections and audits, which include:
o corrosion monitoring
o visual inspections.
Field Failure and Incident Reports are reviewed to determine the level of significance in order to assign
the appropriate level of assessment or investigation.
Jemena Gas Networks AMP | 65
The output of the activities is analysed with the following results:
Trunk Receiving Stations (TRS)/ POTS/ Automatic Line Break Valves (ALBV)/WBH/MOMs. The overall
structural integrity was found to be satisfactory for containment and reliability. The Electrical &
Instrumentation (E&I) components, which have a shorter design life than mechanical components, are in
need of refurbishment.
The trunk ALBV are deteriorating, showing signs of wear with components requiring replacement. A
refurbishment program will run between RY15 and RY20 to replace obsolete control panels and refurbish
actuators.
Extending the design life of the PRS as they are performing well and overall integrity is reasonable
considering their age.
The Primary ALBVs are currently being refurbished by replacement of seals on the actuator vanes and
replace obsolete control panels.
Corrosion of facilities equipment is a continual issue leading to leaks in the system. A recoating program
of the Trunk Receiving Stations was approved as an Opex step change. Additionally a replacement
program will be put in place for RY15 to install additional Double Block and Bleed (DBB) valves to bring
them in to line with new standards for working in confined spaces and to maintain integrity of the
network and safety of service.
10.4 ASSET PERFORMANCE
The consequence of Facilities failure can be catastrophic including fatalities, loss of assets and long term
interruption to supply. The most significant performance issue is abnormally high level of heavy
hydrocarbons (wax) in the gas received over the last 4-5 years, which was discovered through mitigation
programs and has resulted in total blockage of the regulator silencer trims that constituted to the
interruption of supply. Two new replacement silencers were installed as a trial for an effective permanent
solution.
10.5 CAPITAL REQUIREMENTS
Capital expenditure on trunk and primary facilities is primarily driven by demand growth. A number of
Trunk Receiving Stations (TRS) require upgrade over the next six years, including::
Windsor TRS
Yass
Appin
Flemington PRS, Mascot PRS, Auburn PRS, Tempe PRS, Horsley Park PRSA
A new above ground station at North Ryde also needs to be developed.
Asset integrity in the creation phase of the asset lifecycle is achieved by ensuring the design, construction
and commissioning of HP facilities complies with the established Codes and Standards.
The Capital Plan provides the entire program detail for this asset class. The most significant projects that
are expected to be carried out over the AMP period are:

66 | Jemena Gas Networks AMP
The APA driven Riverina POTs Upgrades ($16M for seven stations)15 and the Northern Trunk Pressure
Increase Mitigation Project ($15M for five stations). Both projects are externally driven and will require
upgrades to existing stations, including gas pre-heating solutions due to increased operating pressures of
the pipelines supplying the JGN distribution system, with Riverina also requiring additional land
Significant renewal of High Pressure E&I is required as a result of existing assets reaching the end of their
lives and compliance to new code ($5M program over the AMP period)
Program of TRS facility upgrade and renewal to meet Work Health & Safety and code requirements. This
includes installation of double block and bleed and valve control. ($9M over the AMP period).
JGN’s forecast Capital Plan for trunk and primary facilities over the AMP period is set out in Table 21.
$’000s RY15 RY16 RY17 RY18 RY19 RY20
Total Trunk Facilities Capex
7,983 6,353 5,845 11,317 16,232 8,542
Total Primary Facilities Capex
8,954 4,123 3,934 1,226 1,181 2,668
Total Trunk and Primary Facilities
16,937 10,476 9,779 12,543 17,413 11,210
Table 21 Summary trunk and primary facilities Capital Plan
10.6 OPERATIONAL REQUIREMENTS
Reviews of the key trunk and primary facilities are performed on a five year rolling program. The reviews
give an overall view of the condition of the facility and confirm the design and risk profile. Reviews are
mandated under AS2885 (Pipelines – Gas and Liquid Petroleum – Operation and Maintenance) and are to
be conducted at intervals of five years or whenever operating changes impact the facility. The reviews are
included in the Asset Management PoW and include the following activities:
Validate the accuracy of facility design
Site hazard identifications by expert team
SMS workshops and HAZOPS studies involving designers, controllers, field personnel and Operation
Engineering
Confirmation of routine and non-routing maintenance
Hazards mitigation action items list generated and tracked.
Hazard mitigations may involve minor site rectification, procedural amendments or capital work. These are
then generated into the PoW cycle.
15 Note: If the Riverina POTS upgrade timing is delayed, one of the stations (Coolamon POTS) will require capacity upgrade within the period.

Jemena Gas Networks AMP | 67
94
51
130
343
1 0
50
100
150
200
250
300
350
400
5 10 15 20 25
Qu
an
tity
Age (Years)
Age Profile of SRSs
11 ASSET STRATEGY - REGULATOR SETS
Faci
litie
sTrunk & Primary
Facilities
Metering
Regulator Sets
SCADA & Communications
Life
-Cyc
le M
anag
emen
t
11.1 SUMMARY
JGN’s asset strategy for regulator sets over the AMP period is to:
replace ageing district regulator sets with Cocon Regulators
undertake trial overhauls of corroded Secondary Regulator sets.
11.2 BACKGROUND
District Regulator Set (DRS) is the generic term used to describe regulators that supply medium and low-
pressure networks. There are three types of DRS in operation to provide regulation at different stages on
the network.
1. Secondary Regulator Sets (SRS) are installed at each off-take from the secondary network to supply
medium pressure networks. SRS reduce the inlet pressure from 1,050kPa to 400, 300, 210, 30 or
7kPa.
2. Medium Pressure Regulator Sets (MPRS) are installed at each off-take from the medium pressure
network to supply low pressure networks. MPRS reduce the pressure from 210 and 400kPa inlet to
7 or 2kPa.
3. Low Pressure Regulator Sets (LPRS) reduce an inlet pressure of 7kPa to 2kPa to supply low pressure
networks.
Most DRS are located on public land and are installed in underground boxes. A small number of DRSs are
above ground installations.
There are currently 619 DRS in service with an age profile shown in Figure 35.
Figure 35 Age profile of SRS
68 | Jemena Gas Networks AMP
11.3 ASSET CONDITION
While all DRS are operational, some DRS are in poor condition due to corrosion. This is a factor of design,
exposure to water ingress and other elements that aid corrosion. In 2008, a strategic decision was made to
replace DRS beyond economic repair. In 2013, further investigation was conducted to assess the integrity of
100 DRS. The operational performance of the DRS is considered satisfactory. However, a large number of
issues were identified in the review.
Most of the old black box designs have serious ergonomic and maintainability issues. Narrow boxes,
confined spaces, heavy cartridges, etc. are some of the issues that affect the maintainability of the DRS.
The outcome of this review was three-fold:
1. A number of DRS will need to be replaced
2. A number of DRS to have various levels of additional maintenance to address integrity issues
3. The remainder will have planned maintenance as they have no integrity issues.
In spite of the issues, the DRS do not pose significant threat to the safety of public or workers with the DRS
generally operated in a safe manner.
11.4 ASSET PERFORMANCE
The DRS have high reliability with respect to their primary function of delivering gas to the distribution
network. Despite the concerns over its condition, the performance is reasonable.
However, security of supply is at risk due to availability of the DRS because they do not have a fully
redundant standby with numerous DRS on the network operating as a one-way feed into the network.
11.5 CAPITAL REQUIREMENTS
Expenditure on DRS is driven either by demand growth (market expansion or capacity development) or
replacement due to asset condition or performance.
The planned asset renewal and upgrade program is continuing in accordance with the strategy to retrofit
the DRS.
DRS retired from service are inspected for serviceable components. The components are reconditioned and
re-stocked for future use to support the legacy population of DRS. Unserviceable DRS are scrapped.
The Capital Plan provides the entire program detail for this asset class. The material projects over the
period are:
A planned asset renewal and upgrade program, which is continuing in accordance with the strategy to
retrofit approximately 4-5 DRSs with Cocons per year
Regulatory replacement and boundary regulator upgrade projects.
JGN’s forecast Capital Plan for DRS over the AMP period is set out in Table 22.

Jemena Gas Networks AMP | 69
$’000s RY15 RY16 RY17 RY18 RY19 RY20
Total DRS Capex 3,675 3,061 2,924 2,531 2,522 2,386 Table 22 Summary DRS facilities Capital Plan
11.6 OPERATIONAL REQUIREMENTS
A FSA of the DRS was conducted by JGN in RY13. This indicated that the DRS asset class is generally
operating safely. The majority of the risks identified during this process were found to be low or negligible.
The FSA identified numerous internal systems and processes though that should be reviewed to ensure that
the network continues to operate safely in future. The next scheduled FSA for this asset category is in RY18.
The Maintenance Plan for DRS includes planned and corrective activities.
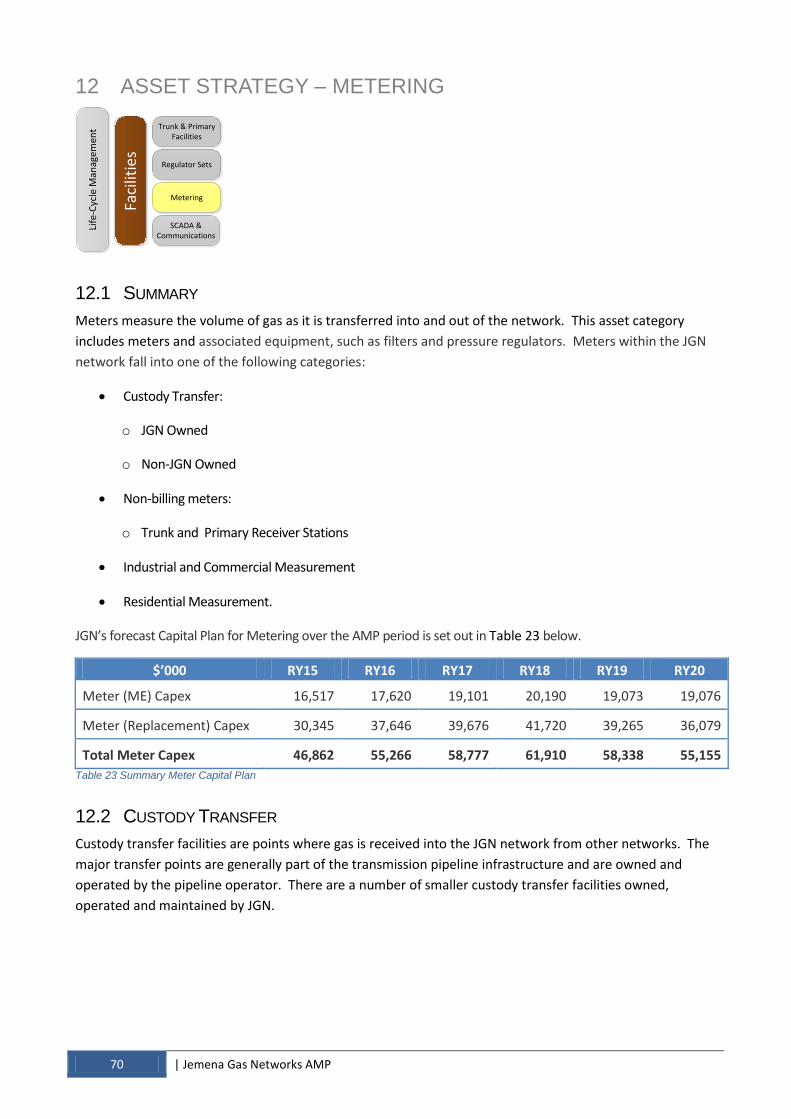
70 | Jemena Gas Networks AMP
12 ASSET STRATEGY – METERING
Faci
litie
sTrunk & Primary
Facilities
Metering
Regulator Sets
SCADA & Communications
Life
-Cyc
le M
anag
emen
t
12.1 SUMMARY
Meters measure the volume of gas as it is transferred into and out of the network. This asset category
includes meters and associated equipment, such as filters and pressure regulators. Meters within the JGN
network fall into one of the following categories:
Custody Transfer:
o JGN Owned
o Non-JGN Owned
Non-billing meters:
o Trunk and Primary Receiver Stations
Industrial and Commercial Measurement
Residential Measurement.
JGN’s forecast Capital Plan for Metering over the AMP period is set out in Table 23 below.
$’000 RY15 RY16 RY17 RY18 RY19 RY20
Meter (ME) Capex 16,517 17,620 19,101 20,190 19,073 19,076
Meter (Replacement) Capex 30,345 37,646 39,676 41,720 39,265 36,079
Total Meter Capex 46,862 55,266 58,777 61,910 58,338 55,155
Table 23 Summary Meter Capital Plan
12.2 CUSTODY TRANSFER
Custody transfer facilities are points where gas is received into the JGN network from other networks. The
major transfer points are generally part of the transmission pipeline infrastructure and are owned and
operated by the pipeline operator. There are a number of smaller custody transfer facilities owned,
operated and maintained by JGN.
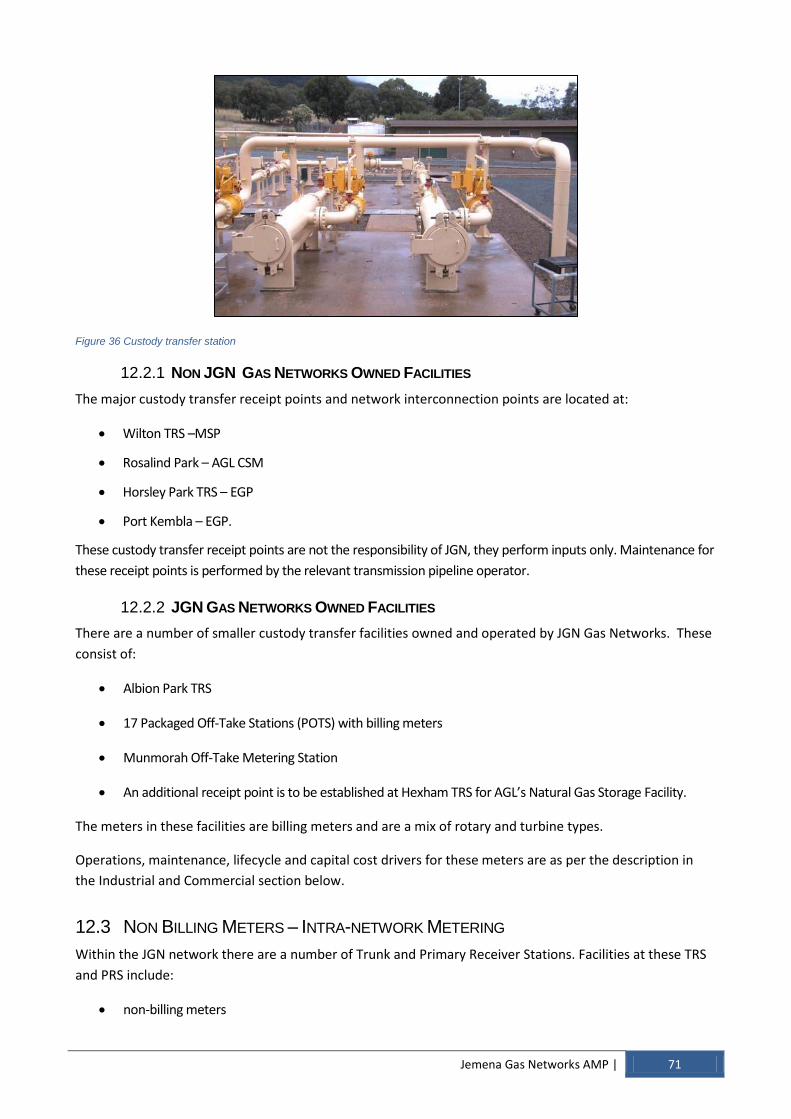
Jemena Gas Networks AMP | 71
Figure 36 Custody transfer station
NON JGN GAS NETWORKS OWNED FACILITIES 12.2.1
The major custody transfer receipt points and network interconnection points are located at:
Wilton TRS –MSP
Rosalind Park – AGL CSM
Horsley Park TRS – EGP
Port Kembla – EGP.
These custody transfer receipt points are not the responsibility of JGN, they perform inputs only. Maintenance for
these receipt points is performed by the relevant transmission pipeline operator.
JGN GAS NETWORKS OWNED FACILITIES 12.2.2
There are a number of smaller custody transfer facilities owned and operated by JGN Gas Networks. These
consist of:
Albion Park TRS
17 Packaged Off-Take Stations (POTS) with billing meters
Munmorah Off-Take Metering Station
An additional receipt point is to be established at Hexham TRS for AGL’s Natural Gas Storage Facility.
The meters in these facilities are billing meters and are a mix of rotary and turbine types.
Operations, maintenance, lifecycle and capital cost drivers for these meters are as per the description in
the Industrial and Commercial section below.
12.3 NON BILLING METERS – INTRA-NETWORK METERING
Within the JGN network there are a number of Trunk and Primary Receiver Stations. Facilities at these TRS
and PRS include:
non-billing meters

72 | Jemena Gas Networks AMP
gas chromatographs
flow computers
hydrocarbon and water dewpoint analysis.
The purpose of these meters and associated equipment is to monitor gas flow, and trunk balancing, heating
value calculation and measurement of WBH consumption. Gas flow data assists the capacity development
team in network modelling. Non-billing meters performance is monitored through the SCADA system.
These facilities are described in Table 24.
Description Type Number Description
Billing & Non-Billing Meter
TRS and PRS meters, 94 Installed where gas consumption needs to be measured but where no transaction takes place
Non billing (water bath, interconnect) meters
6
Gas Chromatographs
Horsley Park TRS, Plumpton TRS, West Hoxton TRS
3
Instruments that analyse the components of gas. From the components they calculate the specific gravity and heating value of the gas. This is used in general billing and in particular where different sources of gas are supplied to the network.
Flow Computers Various location 23
Collect actual volume, pressure and temperature and calculate a standard volume. They have two way communications with the SCADA. The flow computers communicate with gas chromatographs to calculate real time energy.
Hydrocarbon and Water Dewpoint analysis
Wilton TRS 1 Installed in meter stations to monitor the gas quality and provide alerts when the gas is out of specification
Plumpton TRS 1
Table 24 Custody transfer summary
ASSET CONDITION 12.3.1
Meters covered within this asset group include Barton and American Turbine Meters as well as a variety of
rotary type meters. All meters installed at TRS and PRS are classified as non-billing meters. There are
limited alternatives for the Barton meters without requiring upgrades to the piping. Refurbishment of these
meters and the turbine meters is the preferred strategy.
Gas chromatographs are prone to occasional communication losses with the SCADA, drift in calibrations
and failure of measuring elements. The method of monitoring the performance of gas chromatographs is
through daily analysis and trending through the SCADA system. In addition the gas chromatographs are
configured in parallel, which enables the instruments to perform not only individual self-testing, but
perform verification testing on each other.
Flow computers performance is currently monitored through the SCADA system. However, the flow
computers are prone to occasional communication losses with the SCADA.
ASSET PERFORMANCE 12.3.2
The non-billing meters have a measurement accuracy of +/-5 per cent. This uncertainty is considered
adequate. The meters are between 10-15 years old. A FA is being drafted for the replacement of some

Jemena Gas Networks AMP | 73
turbine type meters that may be suffering bearing issues. The project includes an option to replace TRS
meters.
Figure 37 Civil works for construction of Lane Cove PRS
CAPITAL REQUIREMENTS 12.3.3
The strategy for lifecycle management of the meters is to refurbish and recalibrate at a frequency of five
years.
Non-billing meters
There is no requirement to procure additional meters at this time as there are sufficient meter spares to
establish a maintenance refurbishment program through all the TRSs over the AMP period.
The ‘Barton’ turbine meters are expected to be refurbished through the JGN Meter Centre.
Gas chromatographs (GC)
The suppliers of GCs introduce new technologies and stop supporting existing GCs every five to eight years.
Therefore, the strategy for managing gas chromatographs is to keep abreast of new technologies and to
use an eight year replacement period as a starting point.
Flow computers
Models of flow computers become obsolete every five to eight years as new technologies become available
and suppliers stop supporting them. The strategy for managing flow computers is to replace them every
eight years. The replacement plan is therefore based upon an age profile of the asset.
OPERATIONAL REQUIREMENTS 12.3.4
Non-billing meters
A FA is being drafted on whether TRS meters should undergo a planned replacement program.
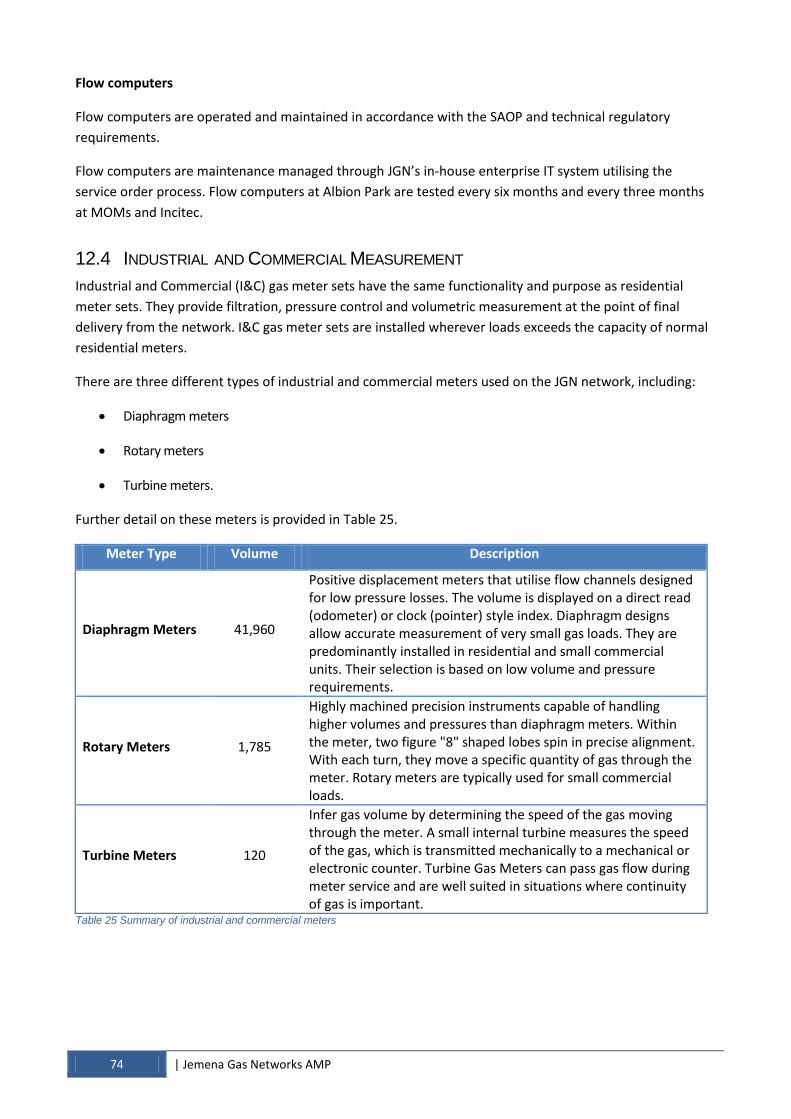
74 | Jemena Gas Networks AMP
Flow computers
Flow computers are operated and maintained in accordance with the SAOP and technical regulatory
requirements.
Flow computers are maintenance managed through JGN’s in-house enterprise IT system utilising the
service order process. Flow computers at Albion Park are tested every six months and every three months
at MOMs and Incitec.
12.4 INDUSTRIAL AND COMMERCIAL MEASUREMENT
Industrial and Commercial (I&C) gas meter sets have the same functionality and purpose as residential
meter sets. They provide filtration, pressure control and volumetric measurement at the point of final
delivery from the network. I&C gas meter sets are installed wherever loads exceeds the capacity of normal
residential meters.
There are three different types of industrial and commercial meters used on the JGN network, including:
Diaphragm meters
Rotary meters
Turbine meters.
Further detail on these meters is provided in Table 25.
Meter Type Volume Description
Diaphragm Meters 41,960
Positive displacement meters that utilise flow channels designed for low pressure losses. The volume is displayed on a direct read (odometer) or clock (pointer) style index. Diaphragm designs allow accurate measurement of very small gas loads. They are predominantly installed in residential and small commercial units. Their selection is based on low volume and pressure requirements.
Rotary Meters 1,785
Highly machined precision instruments capable of handling higher volumes and pressures than diaphragm meters. Within the meter, two figure "8" shaped lobes spin in precise alignment. With each turn, they move a specific quantity of gas through the meter. Rotary meters are typically used for small commercial loads.
Turbine Meters 120
Infer gas volume by determining the speed of the gas moving through the meter. A small internal turbine measures the speed of the gas, which is transmitted mechanically to a mechanical or electronic counter. Turbine Gas Meters can pass gas flow during meter service and are well suited in situations where continuity of gas is important.
Table 25 Summary of industrial and commercial meters
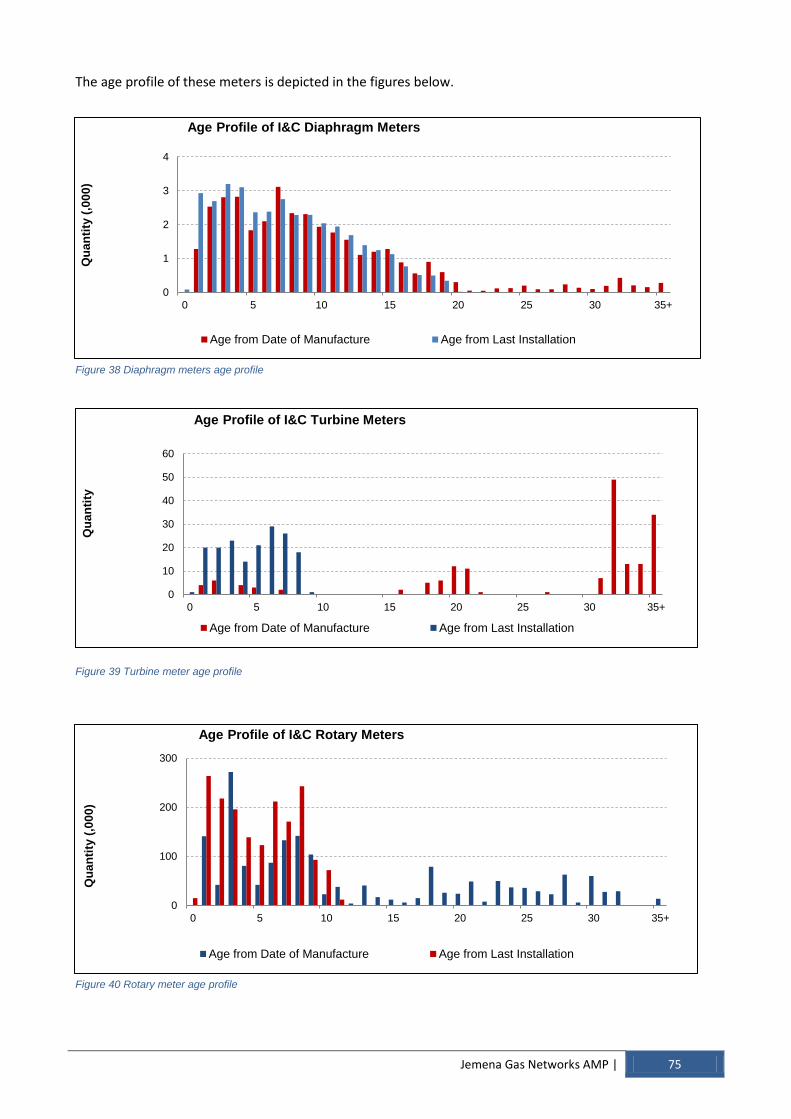
Jemena Gas Networks AMP | 75
0
100
200
300
0 5 10 15 20 25 30 35+
Qu
an
tity
(,0
00
)
Age Profile of I&C Rotary Meters
Age from Date of Manufacture Age from Last Installation
0
1
2
3
4
0 5 10 15 20 25 30 35+
Qu
an
tity
(,0
00
)
Age Profile of I&C Diaphragm Meters
Age from Date of Manufacture Age from Last Installation
The age profile of these meters is depicted in the figures below.
Figure 38 Diaphragm meters age profile
Figure 39 Turbine meter age profile
Figure 40 Rotary meter age profile
0
10
20
30
40
50
60
0 5 10 15 20 25 30 35+
Qu
an
tity
Age Profile of I&C Turbine Meters
Age from Date of Manufacture Age from Last Installation
76 | Jemena Gas Networks AMP
ASSET CONDITION 12.4.1
Diaphragm meters
The population of diaphragm meters is generally in good condition. There is an existing program to replace
some small volumes and types of diaphragm meters (e.g. Rockwell M12 and Simbrunt G6 & G16 ) that are
prone to development of excessive corrosion in their indexes. These meters are being replaced with AL425
and AL1000 meters under replacement programs.
There is a limited supply of AL2300 and AL5000 meters as the production of these types of meters has
ceased. This issue is being managed by a meter resizing and a replacement program. Meters are replaced
where possible with other meters more suitable for the application. The surplus AL2300 and AL5000
meters are being refurbished and stocked for reuse where required.
Rotary meters
The condition of the I&C rotary meter populations is mixed. The aged meter populations are deteriorating.
High service life is eroding dimensional tolerances and reducing meter accuracy. Failures of Instrument
meters caused by index failures have led to this type of rotary meter being replaced with the iMeter
through the aged replacement program. JGN is planning to limit meter life to 20 years.
Turbine meters
The condition of the I&C turbine meter population is deteriorating. Although the majority of JGN’s turbine
meters are recently refurbished, high service life is impacting reliability.
The majority of turbine meters are between 15 and 20 years old and have been refurbished up to three
times. Some meters are over 30 years old and have been refurbished up to six times.
ASSET PERFORMANCE 12.4.2
Diaphragm meters
The I&C diaphragm meter population are installed for a period of 15 years and managed through the GASS
system for meter family statistical sampling and replacement.
There are several meter families with a history of failing indexes that are subjects of replacement programs.
Rotary meters
The accuracy of aged meters is decaying. Increasing dimensional tolerances are a product of wear and tear
through high service life. Refurbishment cannot rectify tolerance issues. The ageing population exposes JGN
to increasing risks of meter integrity, specifically, the under-registration of gas flow. JGN is planning to limit
meter life to 20 years.
Turbine meters
Although the majority of JGN’s turbine meters are recently refurbished high service life is impacting
reliability. Due to the high service life of older turbine meters an FA has been drafted and titled
‘Replacement of Turbine Meters-30 years and older’. The FA recommends the progressive replacement of
the ageing meters.
Jemena Gas Networks AMP | 77
CAPITAL REQUIREMENTS 12.4.3
The strategy for lifecycle management of the meters is in accordance of AS4944.
Diaphragm meters
The volume of new assets created is driven by market expansion. Meter selection is based on the capacity
requirement of the customer.
The primary drivers for the renewal and upgrade plan are accuracy and integrity. JGN has created a
replacement plan based on initial integrity activities.
Diaphragm meters are retired after 15 years of service with the exception of type AL425 and AL1000. These
meters may be granted a life extension on successful sampling data. This strategy ensures the population is
maintained in good condition.
Diaphragm meters that fail or are removed from service are refurbished and re-stocked for future use
where commercially and technically justified.
Rotary meters
The volume of new assets created is driven by market expansion. Meters selection is based on the capacity
requirement of the customer.
A renewal and upgrade program has been developed. The primary drivers for the renewal and upgrade are
operational deficiency and asset integrity. As per JGN’s policy (TPC PROC 4.99.7), rotary meters are
scheduled for replacement on a 10 year cycle. This is shorter than the statutory life of 15 years and reflects
feedback from integrity review activities.
Where commercially and technically feasible rotary meters are refurbished and reused.
Turbine Meters
The volume of new assets created is driven by market expansion. Meters selection is determined by the
capacity requirement of the customer.
Turbine meters are used to measure some of the largest consumers in JGN’s network. Inaccurate metering
can expose JGN to significant financial impacts. The primary drivers for the renewal and upgrade plan for
gas meters are operational deficiency and asset integrity. Turbine meters are scheduled for replacement on
a 5 year cycle. This is shorter than the statutory life of 15 years and reflects feedback from integrity review
activities. Where commercially and technically feasible turbine meters are refurbished and reused.
The volume of replacement meters over the AMP period is set out in Table 26.
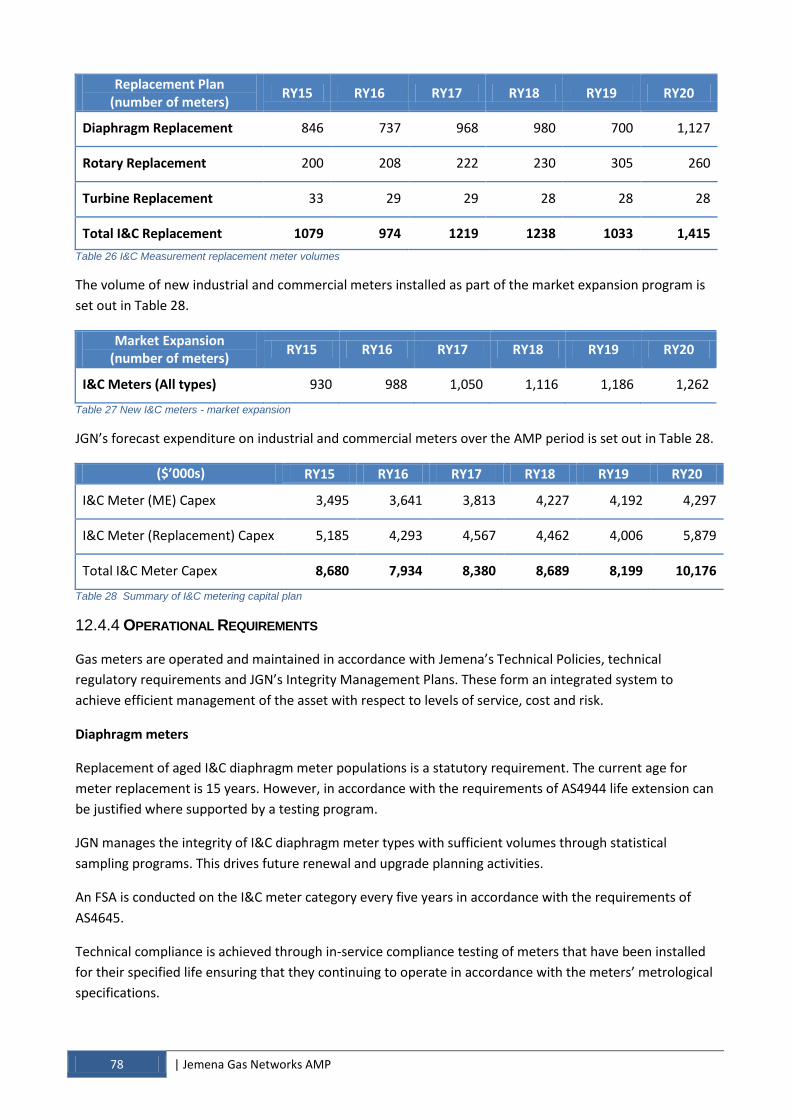
78 | Jemena Gas Networks AMP
Replacement Plan (number of meters)
RY15 RY16 RY17 RY18 RY19 RY20
Diaphragm Replacement 846 737 968 980 700 1,127
Rotary Replacement 200 208 222 230 305 260
Turbine Replacement 33 29 29 28 28 28
Total I&C Replacement 1079 974 1219 1238 1033 1,415
Table 26 I&C Measurement replacement meter volumes
The volume of new industrial and commercial meters installed as part of the market expansion program is
set out in Table 28.
Market Expansion (number of meters)
RY15 RY16 RY17 RY18 RY19 RY20
I&C Meters (All types) 930 988 1,050 1,116 1,186 1,262 Table 27 New I&C meters - market expansion
JGN’s forecast expenditure on industrial and commercial meters over the AMP period is set out in Table 28.
($’000s) RY15 RY16 RY17 RY18 RY19 RY20
I&C Meter (ME) Capex 3,495 3,641 3,813 4,227 4,192 4,297
I&C Meter (Replacement) Capex 5,185 4,293 4,567 4,462 4,006 5,879
Total I&C Meter Capex 8,680 7,934 8,380 8,689 8,199 10,176
Table 28 Summary of I&C metering capital plan
OPERATIONAL REQUIREMENTS 12.4.4
Gas meters are operated and maintained in accordance with Jemena’s Technical Policies, technical
regulatory requirements and JGN’s Integrity Management Plans. These form an integrated system to
achieve efficient management of the asset with respect to levels of service, cost and risk.
Diaphragm meters
Replacement of aged I&C diaphragm meter populations is a statutory requirement. The current age for
meter replacement is 15 years. However, in accordance with the requirements of AS4944 life extension can
be justified where supported by a testing program.
JGN manages the integrity of I&C diaphragm meter types with sufficient volumes through statistical
sampling programs. This drives future renewal and upgrade planning activities.
An FSA is conducted on the I&C meter category every five years in accordance with the requirements of
AS4645.
Technical compliance is achieved through in-service compliance testing of meters that have been installed
for their specified life ensuring that they continuing to operate in accordance with the meters’ metrological
specifications.
Jemena Gas Networks AMP | 79
A review of the assets operating environment and to ensure compliance for diaphragm meters an FSA is
conducted at a period not exceeding five years in accordance with the requirements of AS4645.
Rotary meters
Rotary meter populations are installed for a period of 10 years and managed through the GASS+ system for
downsizing and corrective maintenance programs. Historical as well as on-going monitoring of
performance data for meter families is achieved through data obtained the Metretek system, which enable
predicative condition monitoring through its service life.
I&C rotary meters installed in medium and low pressure installations are assessed under the FEED program
for review and condition of the meter set. In addition, quantities of rotary meters are performance tested
for accuracy prior to refurbishment and results recorded.
The current replacement frequency for rotary meters is 10 years. Meters that have been installed for this
period are refurbished and performance tested where possible and returned to service.
In accordance with the requirements of AS4645, an FSA of the I&C rotary meters and the assets operating
environment is to be conducted at a period not exceeding five years.
Turbine meters
Turbine meter populations are installed for a period of five years and managed through the GASS+ system
for downsizing and corrective maintenance programs. Historical as well as on-going monitoring of
performance data for meter families is achieved through data obtained the Metretek system, which enable
predicative condition monitoring through its service life
Integrity reviews provide information required for integrity management and drives future renewal and
upgrade planning activities. The statutory requirement for aged meter replacement is 15 years. However,
JGN removes turbine meters for overhaul after five years of service. This strategy is based on historical and
trend information.
JGN is planning the following integrity review activities over the next five years.
Used meter assessment - All turbine meters removed from service will be tested for accuracy and
inspected for features which may impact reliability. The analysis will provide input into future
replacement plans
Customer load review - A load assessment will be carried out on customers with dropping consumption
rates. The analysis will be used to revise the replacement plan for meter matching to ensure accuracy of
metering across the full range of gas demand by the customer.
12.5 RESIDENTIAL
Residential gas meter sets provide filtration, pressure regulation and metering to small end-point users
connected to the network. These meter sets have capacities of up to 380MJ/h and can be configured for
connection to low pressure networks (< 7kPa) and medium pressure networks (< 400kPa).
Residential metering is divided into the following sub-classes:
Residential gas meters and regulators

80 | Jemena Gas Networks AMP
Hot water meters
Meter data loggers.
Further detail on these assets is provided in Table 29.
Type Volume Description
Residential Gas meters
1,121,553 Gas meter sets provide filtration, pressure regulation and metering to small end-point users connected to the network
Hot water meters 163,371 hot
9,817 cold
Residential Water Meters are used to measure the consumption of hot water in medium density developments. Typical medium density developments have centralised hot water systems which consist of one or more hot water heaters with master gas and cold water meters and a circulating ring main system serving a number of residential customers through a domestic hot water meter. These meters are used to apportion the gas measured at the master gas meter.
Meter data loggers 8,791 Meter data loggers (MDL) are remote electronic devices installed in the JGN to record and transmit the consumption of gas and/or hot water meters from apartment blocks.
Table 29 Overview of residential meters
The age profile of these assets is illustrated in Figure 41.
Figure 41 Age profile of residential meter assets
ASSET CONDITION 12.5.1
Gas meters
The condition of residential gas meter populations is maintained through integrity activities enforced
through AS/NZS 4944. The requirement to replace meter populations failing statistical sampling programs
ensures a healthy asset base.
Residential gas regulators
Although statistics are not available to report an age profile for residential gas regulators, there is growing
awareness that the general population of residential regulators in service is ageing. JGN is performing
analysis on this asset in order to baseline volumes of regulators replaced annually through defective
replacement program in order to establish an aged replacement program.
0
20000
40000
60000
80000
0 1 2 3 4 5 6 7 8 9 1011121314151617181920212223242526272829
Qu
anti
ty
Age
Age Profile of Meters
Data loggers
Water meters
gas meter
Jemena Gas Networks AMP | 81
Hot water meters
The condition of hot water meters in service is deteriorating with increasing volumes of failures over the
last five years. Current assessment estimates in excess of 10,000 faulty units remain in the network. The
volume of faulty units is expected to accelerate over the coming years. There is a planned replacement
program to replace the type of faulty meter over a six year period.
A review of hot water metering assets has been performed with initial alternative assets acquired during
RY14.
Meter data loggers
The current technology installed requires a physical connection (cable) between the customer’s meter and
the data logger. The current approach to obtain readings from in-accessible meters is to ask customers to
complete self-read cards.
Approximately 2700 realignments are done annually. Misalignments between the meter and the data
logger occur for various reasons including meter faults, cable faults and power failures. The lack or loss of
meter data leads to inaccurate billing and customer complaints.
ASSET PERFORMANCE 12.5.2
Gas meters
The strategy for managing residential gas meters is in accordance with the requirements of AS4944. Meters
are retired after 15 years of service unless granted a life extension.
Residential gas regulators
The strategy for lifecycle management of residential gas regulators is to operate to failure and replace. All
medium pressure horizontal regulators are replaced when found. This group of regulators are susceptible
to moisture condensation, freezing and corrosion and present high risks of failing.
JGN is reviewing the strategy of operating gas regulators to failure. At present aged regulators are replaced
during the residential aged gas meter replacement program. The replacement of regulators is based on 60
per cent change-out, with horizontally mounted given priority, of yearly residential gas meter
replacements.
Hot water meters
The current strategy for lifecycle management of water meters is to commence an aged replacement
program and progresses from the previous strategy of operate to failure and replace. Where drivers exist
strategies will be developed to address specific issues. This includes renewal and upgrade and sampling
plans.
Meter data loggers
The strategy for lifecycle management of MDLs is to operate to failure and replace. JGN is reviewing this
strategy due to the cost of failures and maintenance, the rollout of the National Broadband Network and
the improvements in Radio Frequency (RF) technologies.

82 | Jemena Gas Networks AMP
CAPITAL REQUIREMENTS 12.5.3
Gas meters
Planning activity for new gas meters is driven by market expansion.
The renewal and upgrade plan for residential gas meters is driven by the integrity review plan, specifically
the statistical sampling program. Statistical sampling programs are performed two years before a
population is due for renewal.
The current strategy for domestic gas meter disposal is to scrap all meters when they are retired. It was
determined they were uneconomical to overhaul. Refurbished meters have lower standards than new
meters and are less likely to pass life extension criteria. Bench tests revealed high levels (>2 per cent) of
refurbished meters failed compliance tests.
Figure 42 Residential gas meter
Residential gas regulators
Planning activity for new gas regulators is driven by market expansion.
JGN is constantly reviewing new technology from different vendors. All new regulators purchased are
sample tested before installation to maintain quality control.
There is no statutory requirement to replace regulators. The primary drivers when developing a renewal
and upgrade strategy for gas regulators is operational deficiency and asset integrity.
Hot water meters
The volume of new assets commissioned is driven by the level of market expansion.
Replacement of aged residential water meter populations is not a statutory requirement. The primary
drivers when developing a renewal and upgrade strategy for water meters is accuracy and integrity.
Water meters are replaced when they become operationally deficient. This is driven by sizing requirements
or critical failure. The planned replacement program for water meter populations is driven by the results of
the integrity activities. Implementing a policy for aged meter replacement aims to reduce the volume of
corrective maintenance.
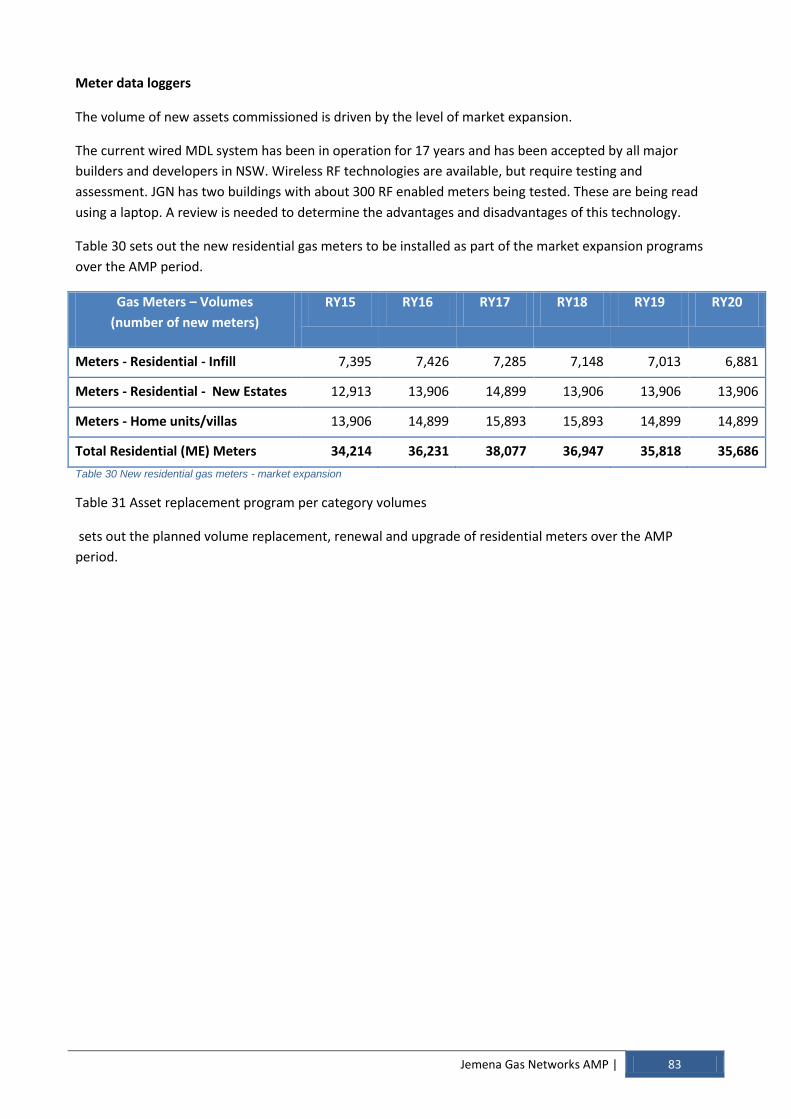
Jemena Gas Networks AMP | 83
Meter data loggers
The volume of new assets commissioned is driven by the level of market expansion.
The current wired MDL system has been in operation for 17 years and has been accepted by all major
builders and developers in NSW. Wireless RF technologies are available, but require testing and
assessment. JGN has two buildings with about 300 RF enabled meters being tested. These are being read
using a laptop. A review is needed to determine the advantages and disadvantages of this technology.
Table 30 sets out the new residential gas meters to be installed as part of the market expansion programs
over the AMP period.
Gas Meters – Volumes
(number of new meters)
RY15 RY16 RY17 RY18 RY19 RY20
Meters - Residential - Infill 7,395 7,426 7,285 7,148 7,013 6,881
Meters - Residential - New Estates 12,913 13,906 14,899 13,906 13,906 13,906
Meters - Home units/villas 13,906 14,899 15,893 15,893 14,899 14,899
Total Residential (ME) Meters 34,214 36,231 38,077 36,947 35,818 35,686
Table 30 New residential gas meters - market expansion
Table 31 Asset replacement program per category volumes
sets out the planned volume replacement, renewal and upgrade of residential meters over the AMP
period.
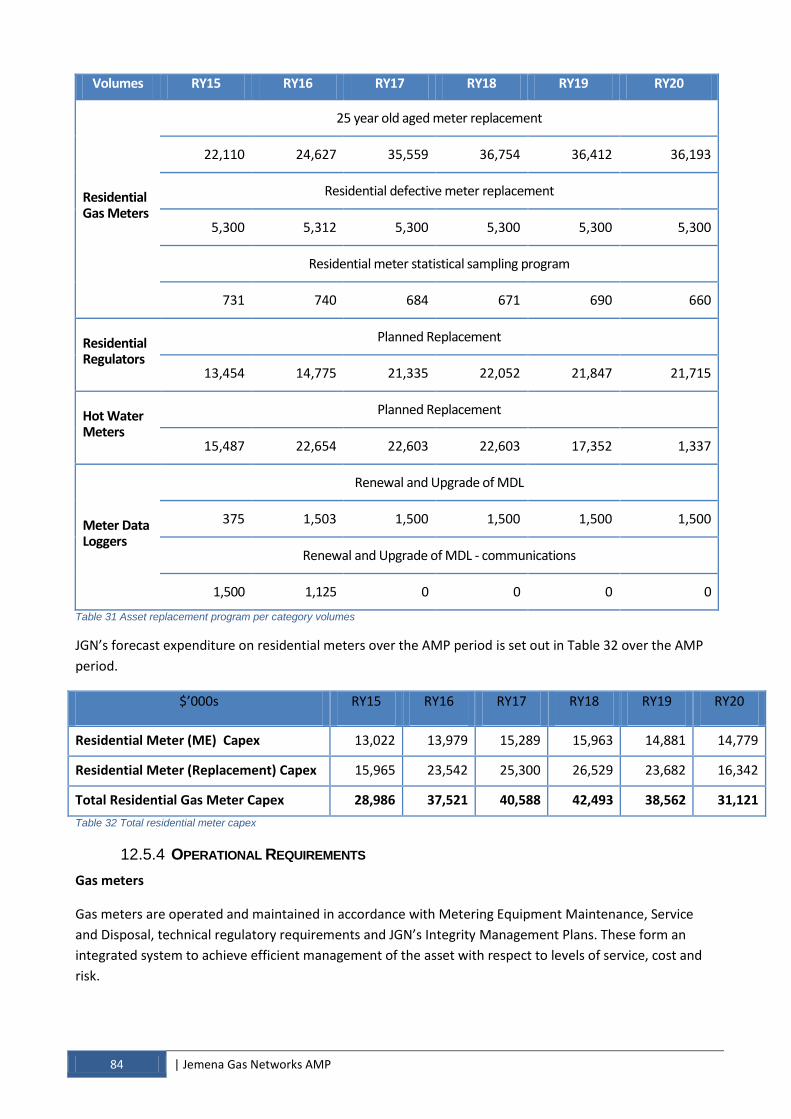
84 | Jemena Gas Networks AMP
Volumes RY15 RY16 RY17 RY18 RY19 RY20
Residential Gas Meters
25 year old aged meter replacement
22,110 24,627 35,559 36,754 36,412 36,193
Residential defective meter replacement
5,300 5,312 5,300 5,300 5,300 5,300
Residential meter statistical sampling program
731 740 684 671 690 660
Residential Regulators
Planned Replacement
13,454 14,775 21,335 22,052 21,847 21,715
Hot Water Meters
Planned Replacement
15,487 22,654 22,603 22,603 17,352 1,337
Meter Data Loggers
Renewal and Upgrade of MDL
375 1,503 1,500 1,500 1,500 1,500
Renewal and Upgrade of MDL - communications
1,500 1,125 0 0 0 0 Table 31 Asset replacement program per category volumes
JGN’s forecast expenditure on residential meters over the AMP period is set out in Table 32 over the AMP
period.
$’000s RY15 RY16 RY17 RY18 RY19 RY20
Residential Meter (ME) Capex 13,022 13,979 15,289 15,963 14,881 14,779
Residential Meter (Replacement) Capex 15,965 23,542 25,300 26,529 23,682 16,342
Total Residential Gas Meter Capex 28,986 37,521 40,588 42,493 38,562 31,121
Table 32 Total residential meter capex
OPERATIONAL REQUIREMENTS 12.5.4
Gas meters
Gas meters are operated and maintained in accordance with Metering Equipment Maintenance, Service
and Disposal, technical regulatory requirements and JGN’s Integrity Management Plans. These form an
integrated system to achieve efficient management of the asset with respect to levels of service, cost and
risk.

Jemena Gas Networks AMP | 85
Replacement of aged meter populations is a statutory requirement with current age for meter replacement
15 years. In accordance with the requirements of AS4944 life extension can be justified where supported by
a testing program.
JGN manages the integrity of residential gas meters through statistical sampling programs. This drives
future renewal and upgrade planning activities.
A review of the assets operating environment and to ensure compliance for residential meters a FSA is
conducted at a period not exceeding five years in accordance with the requirements of AS4645.
Residential gas regulators
Gas regulators are operated and maintained in accordance with technical regulatory requirements and JGN
Policy - Metering Equipment Maintenance, Service and Disposal. This forms an integrated system to
achieve efficient management of the asset with respect to levels of service, cost and risk.
There is limited data on residential regulator modes of failure and service life. Failure analysis will bridge
this gap. Future renewal and upgrade programs will be driven by feedback from the integrity review plan.
Integrity review activities forecast include a failure mode analysis which is an ongoing activity through
RY15.
A review of the assets operating environment and to ensure compliance for residential regulators a FSA is
conducted at a period not exceeding five years in accordance with the requirements of AS4645.
Hot water meters
JGN does not have a policy for operating and maintaining water meters. However, work is progressing on
developing a system to achieve efficient management of the asset with respect to levels of service, cost and
risk.
Planned integrity reviews include endurance performance accuracy testing, lifecycle analysis, failure mode
analysis and a statistical sampling program. The results will assist with the identification of a maximum
service life and provide the information required to develop an aged replacement program.
Meter data loggers
An FA is planned to review the proposed MDL replacement program. This is included in the engineering
PoW.
MDL’s are operated and maintained in accordance with technical regulatory requirements and JGN Policy -
Metering Equipment Maintenance, Service and Disposal.
The maintenance strategy for meter data loggers is limited to the following activities:
weekly dial-up data collection of all MDL sites
weekly data audits to identify problematic MDL’s
MDL battery replacements at 4.5 year intervals.
In general terms the devices are operated to failure. The estimated volume of faulty MDLs replaced per
year is 150 units.

86 | Jemena Gas Networks AMP
13 ASSET STRATEGY - SCADA & COMMUNICATIONS
Faci
litie
sTrunk & Primary
Facilities
Metering
Regulator Sets
SCADA & Communications
Life
-Cyc
le M
anag
emen
t
13.1 SUMMARY
JGN Supervisory Control And Data Acquisition (SCADA) and communication assets are infrastructure JGN
uses to monitor and control its network assets.
Generally, the SCADA system includes gas network monitoring and control signal hardware (input and
output), controllers, SCADA and telemetry data networks, user interface (HMI), telecommunications
equipment and software.
SCADA and communications assets are critical infrastructure to JGN’s core business functions, such as
billings, gas dispatch/distribution and demand management.
JGN’s asset strategy for SCADA and communications over the AMP period is to ensure:
the SCADA system continues to function at high levels of reliability and availability
the continuity, availability and integrity of operational and business intelligence data to Control Centre
operations, Real Time system business users and business stakeholders
plan for end-of life
mitigation of SCADA operations risks
enhancements to improve the efficiency and effectiveness of SCADA operations.
13.2 ASSET CONDITION
Conditions of all JGN SCADA and communications are detailed in the NSW/ACT SCADA and Communications
Asset Strategy document. This document is reviewed on an annual basis or whenever there is any business,
facility, system or functionality change, which significantly affects this document.
13.3 ASSET PERFORMANCE
Assets are scheduled for daily, weekly and monthly operational checks. The types of inspections and tests
vary for the different SCADA and communication asset classes. The key objectives for the scheduled
operational checks are to see if the agreed asset availability and operating pattern are achieved, and if the
asset’s ability to facilitate transportation of the required quantity and quality of gas is within the JGN’s
designed operating condition and safety standards, at minimum resource cost with respect to the asset
class’s specific purposes are met.

Jemena Gas Networks AMP | 87
13.4 CAPITAL REQUIREMENTS
There are plans to invest in several areas of the SCADA network over the AMP period. Additional telemetry
is planned for installation to support network growth. Other proposals include Metretek redundancy and
SCADA backup.
JGN forecasts six to eight additional telemetry per annum due to network growth over the AMP period.
Asset renewal and upgrade strategies for SCADA and communications equipment are driven by expected
operating life and expected usage life.
The most material asset renewal project during the AMP period is the GENe and SCADA System
Replacement project ($6M) to ensure alignment and cost effective integration of technologies deployed by
the industry and Jemena as a whole.
The Capital Plan for RY15 to RY20 also includes remote telemetry unit (RTU) end-of-life replacement,
SCADA security on-going review and upgrade, and Digital Mobile Radios end-of-life replacement.
Assets are disposed of in accordance with the JGN security policy for hardware disposal. JGN is planning to
dispose all replaced SCADA, telemetry and digital mobile radio hardware over the AMP period.
JGN’s forecast Capital Plan for SCADA over the AMP period is set out in Table 33.
$’000s RY15 RY16 RY17 RY18 RY19 RY20
Total SCADA Capex 965 1,317 2,706 2,767 2,177 745
Table 33 Summary of SCADA facilities Capital Plan
13.5 OPERATIONAL REQUIREMENTS
The NSW SCADA and communications asset strategy is updated annually. It was last updated in July 2013.
SCADA and communications assets are required to operate continuously for as long as possible. There is
little to no window for off-line maintenance. Therefore, subsystems are designed with built in
redundancies.
The JGN SCADA and communications asset is operated and maintained in accordance with the SAOP,
technical regulatory requirements and JGN’s integrity management plans. These form an integrated system
of processes and procedures to achieve efficient management of the asset with respect to levels of service,
cost and risk.
The nature of the JGN SCADA and communications asset and environment it operates in, drives the current
strategy of “operate to failure and replace”. However, there are ongoing maintenance activities performed
on the assets to ensure the assets remain serviceable. These activities include preventative maintenance
and corrective maintenance, as well as specialised maintenance projects or step change activities.
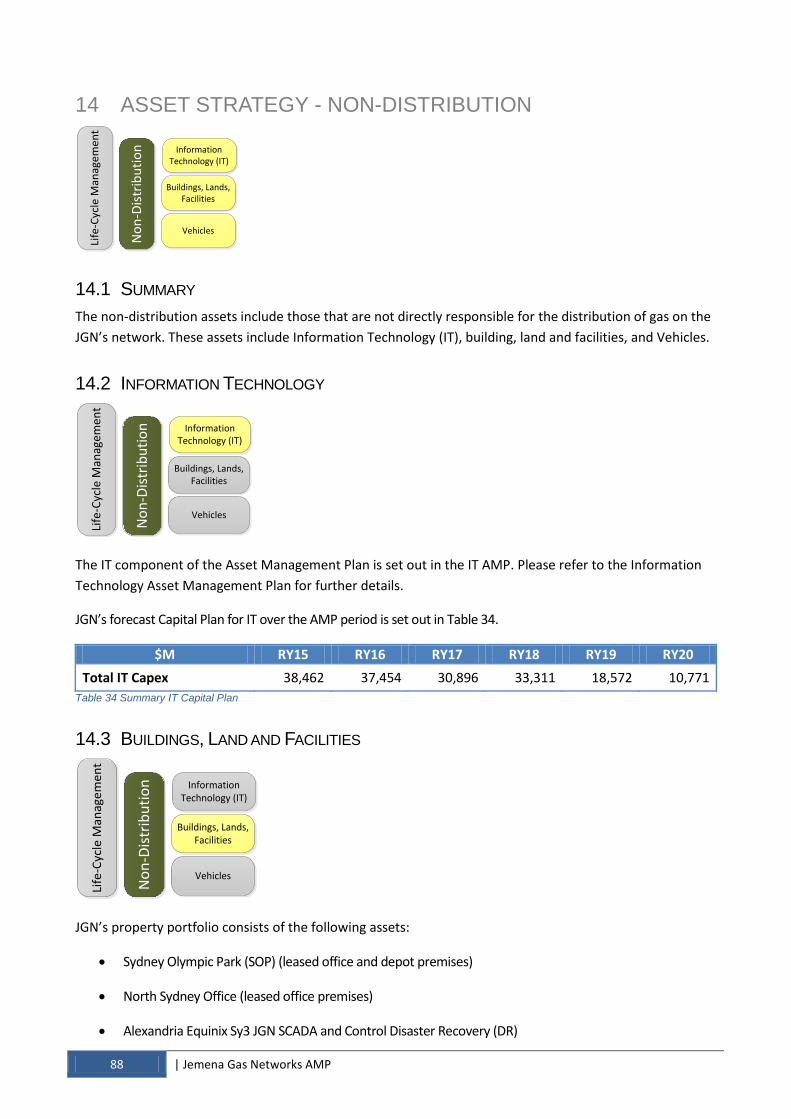
88 | Jemena Gas Networks AMP
14 ASSET STRATEGY - NON-DISTRIBUTION
No
n-D
istr
ibu
tio
n Information Technology (IT)
Buildings, Lands, Facilities
Vehicles
Life
-Cyc
le M
anag
em
en
t
14.1 SUMMARY
The non-distribution assets include those that are not directly responsible for the distribution of gas on the
JGN’s network. These assets include Information Technology (IT), building, land and facilities, and Vehicles.
14.2 INFORMATION TECHNOLOGY
No
n-D
istr
ibu
tio
n Information Technology (IT)
Buildings, Lands, Facilities
Vehicles
Life
-Cyc
le M
anag
emen
t
The IT component of the Asset Management Plan is set out in the IT AMP. Please refer to the Information
Technology Asset Management Plan for further details.
JGN’s forecast Capital Plan for IT over the AMP period is set out in Table 34.
$M RY15 RY16 RY17 RY18 RY19 RY20
Total IT Capex 38,462 37,454 30,896 33,311 18,572 10,771
Table 34 Summary IT Capital Plan
14.3 BUILDINGS, LAND AND FACILITIES
No
n-D
istr
ibu
tio
n Information Technology (IT)
Buildings, Lands, Facilities
Vehicles
Life
-Cyc
le M
anag
em
en
t
JGN’s property portfolio consists of the following assets:
Sydney Olympic Park (SOP) (leased office and depot premises)
North Sydney Office (leased office premises)
Alexandria Equinix Sy3 JGN SCADA and Control Disaster Recovery (DR)

Jemena Gas Networks AMP | 89
NSW Training Facility Chullora
Meter Test Facility (MTC)
Emergency Equipment Holding Areas (EEHAs)
Depots
High-pressure sites.
ASSET CONDITION 14.3.1
JGN has established a set of property principles under which all significant property decisions are tested
against. These principles include:
Being financially sustainable
Being cognisant of employee impacts
Seek to co-locate and seek collaboration across groups
Being mindful of proximity to JGN Assets
Facilitate JGN’s future operating model and the “Jemena Way”.
Property and land performance are periodically reviewed and measured against current and future
operational requirements. These assessments generally coincide with lease expiries and renewals for
existing premises and the procurement of new premises taking into consideration:
Opex/Capex expenditure budgets
Size/capacity
Configuration
Age and condition of the premises
Geographical location
Health Safety and Environment.
The SOP lease expires on 30 April 2015 while the North Sydney lease expires on 30 June 2015. JGN will
therefore be required to source new accommodation in the next year.
JGN also plans to establish a new training facility to replace the current arrangement with Chullora TAFE by
May 2015 (the Chullora TAFE has limited facilities). JGN and the NSW Gas Industry Training Advisory Bodies
(ITAB) are embarking on a significant upgrade of its national skills qualifications with the field based
documentary proof (“the passport”), which will increase diligence in the areas of induction and
accreditation training. Improving training facilities will ensure that going forward, JGN field delivery teams
will always be competently trained and equipped to work on JGN assets.
CAPITAL REQUIREMENTS 14.3.2
Key strategic property activities for the period are as follows:

90 | Jemena Gas Networks AMP
the purchase of land and establishment of a depot and training facility strategically placed within the JGN
network
Cardiff Depot replacement (Project underway) with expenditure to continue in 2015
Relocation of functions currently located at the SOP and North Sydney premises during the 1st half of
2015.
These decisions will trigger the following associated activities:
The leasing and fit out of suitable office accommodation for approximately 410 employees
Relocation of SCADA boxes from the SOP Control Room/Response Centre to a managed data centre
environment
Upgrade of existing EEHAs at Seven Hills, Warriewood and Riverwood as well as the High Pressure site at
Horsley Park to provide additional storage capability
Unspecified capital works allocated throughout the period for both owned and leased premises.
The existing Emergency Equipment Holding Area (EEHA) on leased premises at Wetherill Park with services
provided from the new depot will be closed.
JGN’s forecast Capital Plan for Buildings over the AMP period is shown in Table 35 below.
$’000s RY15 RY16 RY17 RY18 RY19 RY20
Total Buildings Capex 39,522 3,793 428 476 477 478
Table 35 Summary Buildings, land and facilitates Capital Plan
14.4 VEHICLES
No
n-D
istr
ibu
tio
n Information Technology (IT)
Buildings, Lands, Facilities
Vehicles
Life
-Cyc
le M
anag
em
en
t
JGN owns an array of vehicles, plant and equipment (fleet), which consists of standard passenger vehicles
through to specialised light/heavy commercial vehicles and plant (trailers, forklifts etc.). Table 36 sets out
the number of vehicles in JGN’s fleet.
Vehicle Type Number of vehicles
Heavy Commercial Vehicles 19
Light Commercial Vehicles 205
Passenger Vehicles 29
Plant 13
Trailers 40
Total 306 Table 36 Vehicle summary

Jemena Gas Networks AMP | 91
JGN has outsourced the Fleet Management functions. The Fleet Management Strategy for vehicle
replacement is based around the following principles:
fit for purpose vehicle selected for the task at hand
least cent per kilometre methodology
up to date safety features at hand
mitigation of age related failures and potential consequences of personnel injury
decreased response times
reduction in operational costs (service, repairs and fuel).
CAPITAL REQUIREMENTS 14.4.1
JGN’s forecast Capital Plan for vehicles over the AMP period is set out in Table 37.
$’000s RY15 RY16 RY17 RY18 RY19 RY20
Vehicles 2,519 2,520 2,060 2,729 6,136 3,402
Table 37 Summary of Vehicle Capital Plan
OPERATIONAL REQUIREMENTS 14.4.2
All fleet assets are maintained in line with the manufacturers recommended service schedules. This is
managed via an array of reports provided by a fleet management company.

92 | Jemena Gas Networks AMP
15 APPENDIX 1 - ASSET MANAGEMENT POLICY
Jemena Gas Networks AMP | 93
16 APPENDIX 2 – HEALTH AND SAFETY POLICY

94 | Jemena Gas Networks AMP
17 APPENDIX 3 – ENVIRONMENTAL POLICY