historical research report - iom-world.org · not for publication report no. tm/70/3 institute of...
TRANSCRIPT
HISTORICAL RESEARCH REPORTResearch Report TM/70/06
1970
Environmental conditions at Morrison Busty Colliery, March 1966 to August 1968 (Gravimetric dust concentrations) Edwards J, Annis R

Copyright © 2006 Institute of Occupational Medicine. INSTITUTE OF OCCUPATIONAL MEDICINE No part of this publication may be reproduced, stored Research Avenue North, Riccarton, Edinburgh, EH14 4AP or transmitted in any form or by any means without Tel: +44 (0)870 850 5131 Fax: +44 (0)870 850 5132 written permission from the IOM e-mail [email protected]
Environmental conditions at Morrison Busty Colliery, March 1966 to August 1968 (Gravimetric dust
concentrations)
Edwards J, Annis R This document is a facsimile of an original copy of the report, which has been scanned as an image, with searchable text. Because the quality of this scanned image is determined by the clarity of the original text pages, there may be variations in the overall appearance of pages within the report. The scanning of this and the other historical reports in the Research Reports series was funded by a grant from the Wellcome Trust. The IOM’s research reports are freely available for download as PDF files from our web site: http://www.iom-world.org/research/libraryentry.php
HISTORICAL RESEARCH REPORTResearch Report TM/70/06
1970

ii Research Report TM/70/06

NOT FOR PUBLICATION Report No. TM/70/3
I N S T I T U T E OF O C C U P A T I O N A L M E D I C I N E
Environmental Conditions at Morrison Busty Colliery
March 1DSG to August 1968
(Gravimetric Duct Concentrations)
by
J. Edwards and R. Annis
Environmental Branch,Institute of Occupational Medicine,Roxburgh Place,Edinburgh, EH3 9SU(Tel. 031-G37 5131) OCTOBER 1070

Report No. TM/70/6
Environmental Conditions at Morrison Busty Colliery
March 1936 - August 1968
(Gravimetric Duct Concentrations)
by
J, Edv/ards and R. Annis
C O N T E N T S
S U M M A R Y
1. INTRODUCTION
2. INVESTIGATORS
3. METHOD OF WORKING
4. SAMPLING AND EVALUATION '
4.1 S, T. P. Samples: 18th Environmental Survey
4. 2 The Gravimetric Sampling Trial
4. 3 Compositional Analyses
5. RESULTS AND DISCUSSION
5. 1 Respirable Dust Concentrations
5. 2 Composition of Samples
REFERENCES
TABLES 2 -4
Report No. TM/70/6
I N S T I T U T E OF O C C U P A T I O N A L M E D I C I N E
Environmental Conditions at Morrison Busty Colliery
March 1966 - August 196S
(Gravimentric Dust Concentrations)
by
J. Edv/ards and R. Annis
S U M M A R Y
gThe report tabulates the dust concentrations in rng/m for the period
March 196G to August 1968 covering the 18th Environmental Survey and theGravimetric Sampling Trial at Morrison Eusty Colliery. The method of
o oconverting concentrations previous!}' quoted in particles/cm to mg/m°
is described.
The concentrations of the total respirable fraction of the airborne dust,
and of various mineral constituents, are given for each occupational group.Where estimates have been required to fill gaps in the data, sources arestated.
Morrison Busty Colliery had a coalface (all shifts) mean dust concentration
of 4. 2 rng/m ° containing 31 per cent ash. The mean quartz concentration3was 0. 2 rng/ni .
EEnvironmental Conditions at Morrison Busty Colliery
. March 1836 - August 1968
(Gravimetric Dust Concentrations)
by
J. Ed ward c and R. Annis
1. INTRODUCTION
Environmental (dust) measurements in the first phase of the Pneumoconiosis
Field Research (up to the third medical survey) were made by thermalo
precipitator (S. T.P.) and reported in terms of particles/cm . These results
were subsequently converted to estimated mass concentrations and used in the
Interim Standards Study to derive new gravimetric dust standards (Jacobsen,
Rae & Walton, 1039). For the second phase of the Research, it was decidedto change, as soon as possible, to gravimetric sampling (based, on the I/i.R. E,
Gravimetric Dust Sampler, Type USA) and. to report the results directly in •fi
gravimetric terms, mg/mu.
The measurements made at Morrison Busty Colliery in the 1st phase of theResearch have been summarised by Edv/ards & Annis (1933b). At thiscolliery the third medical survey took place in March, 1G6G towards the endof the series, but dust sampling by thermal precipitator continued for a period
thereafter (iSth Environmental Survey, June 1263 - March 19S7) and was
reported in the original manner (Edv/ards & Annis,' IGGoa). There was also
a period when both sampling methods were employed side -by- side (GravimetricSampling Trial, April 19G7 to April 1863) in order to establish mass-number
indices (1/1,11,1.) for the conversion of the earlier results to mass units, asreported by Edwards & Haclden (13G8). Gravimetric sampling started on a
routine basis in August I8GG when sufficient new instruments had become
available.
It was therefore necessary to convert the particle concentrations measured
by thermal precipitator, since March 1830, .to mass units, so that they mightbe linked with mass values, subsequently measured directly, to provide
homogeneous data for Phase II. The mass concentrations recorded in the
Gravimetric Sampling Trial also required adjustment to a full shift basis, asit had not been possible to sample during the period of the shift spenttravelling, when using two instruments side-by-side, but only at the place ofwork.
This report describes the methods of conversion and tabulates the results^
which are to be used as a starting point for the environmental measurementsin/

2.
in the second phase of the Research. It gives the mean mass concentrations
for current occupational groups for the period between the third medical
survey, March 1933, and the start of the routine gravimetric sampling in
August 1963 and. also presents the dust compositional data for these groups,
based on the analysis of samples taken during the- gravimetric trial. The
method of working at the colliery is briefly reviewed.,
2. . INVESTIGATORS
The staff employed in the Research at Morrison Bust}' Colliery were as
listed below:- .
Senior Investigators
'Mr. R. Annis -
Mr. J. Edwards -
assisted by: •
Mr. A. Williams -
Mr. IT. F. Nattrass
Mr. 3. Gibbon -
Mr. T. Sadler -
Regional Investigator
Mr. G. G. Hadden
until November 19 G 3
after November 1SGG
until September 19GG
until September 18
after August 19G7
after Auus t I9G7
GG
3. METHOD OF WORKING-
Morrison Busty Colliery, which is situated in the North West Durham
Coalfield worked, during this period, three seams, details of which are given
in the following table.
TABLE I/

TABLE 1
Details of Seams v7orked
o.
;; Name ox • •S Seam1
• Earvey(Tovmeley)I
1 Busty Top; Bottomii - . • , , ,
• Erockwell
National Gearn jCorrelation Code
iii
iI ,- ~ ,_ , r
. '"'''• "•- •' (.
i
. . . ' . . . i .
I
02:470 |
1T.C.E. Coal i TAg®^2®Bank Code nr-^ ^\\ i.'-.ctrCf_ij
SOlb 0. 5S
SOI'?. 1.04SOla 0. PI
tSOla { O.C !J
In the Harvey Seam, the coal hac been v/on by plough or ccraper on 100 rnlongv/all advancing faces. v
The top cection of the Bucty Geani in the Charley North District was extractedby plough or. single unit Ipngv/all advancing faces about 100 rn in length, -but inthe South side of the colliery the coal in this seam (bottom leaf only) was v/onby pneumatic pick on longv/all faces.
The Brocl'well Cearn vrac v,rorl:ed mainly on single unit longwall advancingfaces, about GE m long, using scraper loaders or.pneumatic picks. A ploughwas used on the only double unit in this seam and a Lovat loader was triedunsuccessfully in one district.
The Harvey, Busty (South side) and Brockwell workings were naturally wetand some faces were eventually abandoned because of the make of water.Edwards & Annie (19G8b) noted that from ISGO'onwards, in spite of a reductionin the number of production faces due to mechanisation, colliery output had beenmaintained at about 40,000 tons per month until 10SG, but from June I960 tillI/larch 1937, the output dropped, to below 3G,COC tons per month and was stillat this level during the following year.
A list of working places and average monthly outputs is given in Table 2.
'i. CAKPLIITC AID EVALUATION
-•l S.T.F, Samples: ISth Environmental Survey
The design and. procedures of the 13th- curves'- were as in phase I of theResearch, and are well documented in the series of -P.-F, R.Environmental Survey Reports. The results, for I/Iorrison EustyColliery, were reported by Edwards & Annis (1038a) in terms ofoccupational group mean number concentrations.
In/
4.3
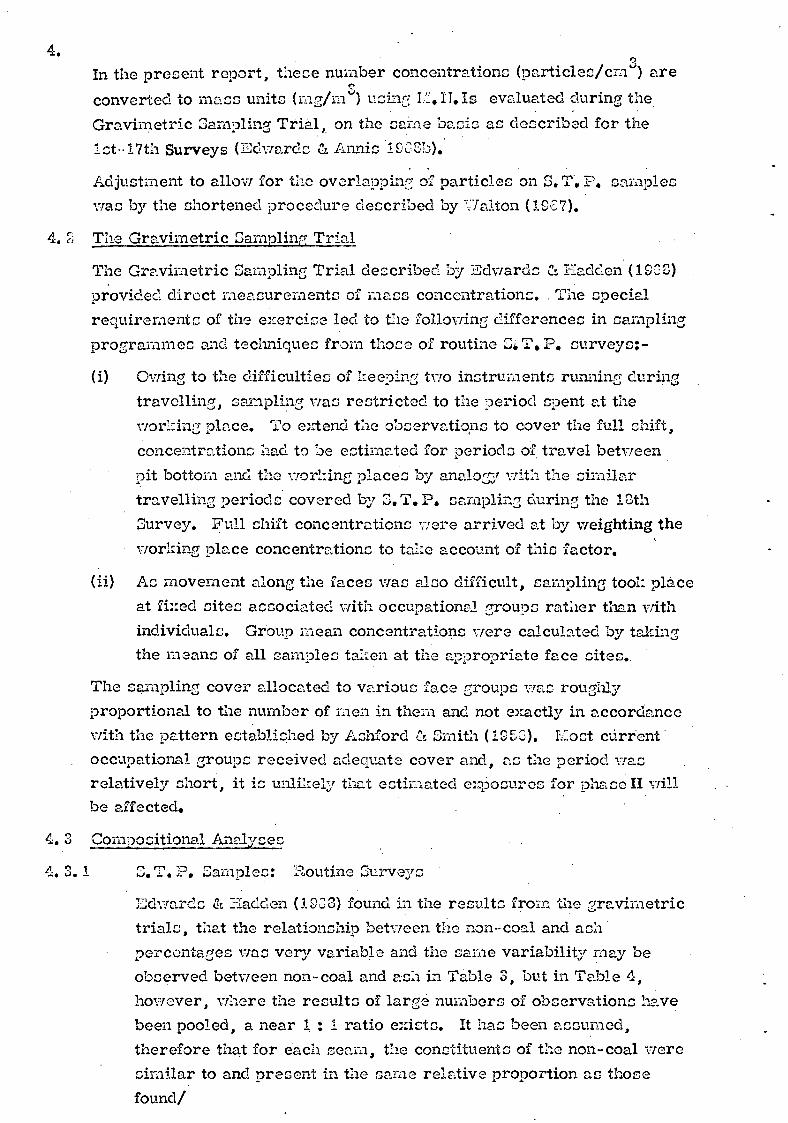
4.In the present report, these number concentrations (particles/cm.^) are
r>
converted to mass units (mg/mu) using I,_. II.Is evaluated during the
Gravimetric Sampling Trial, on the same basis as described for the
1st-17th Surveys (Edwards & Annis IQGSb).
Adjustment to allow for the overlapping of particles on S. T. P. samplesv/as by the shortened procedure described by WrJton (1G£7).
4. 2 The Gravimetric Sampling Tria_l .
The Gravimetric Sampling Trial described by Edwards & Hadden (1GG3) .
provided direct measurements of mass concentrations. . The special
requirements of the exercise led to the following differences in sampling
programmes and techniques from those of routine S*T,P. surveys;-
(i) Owing to the difficulties of keeping two instruments running during
travelling, sampling v/as restricted to the period spent at the
working place. To extend the observations to cover the full shift,
concentrations had. to be estimated for periods of travel between
pit bottom and the working places by analogy with the similar
travelling periods covered by S,T.P. sampling during the 18thSurvey. Full shift concentrations were arrived at by weighting the
working place concentrations to take account of this factor.
(ii) As movement along the faces was also difficult, sampling took placeat fixed sites associated with occupational groups rather than with
individuals. Group mean concentrations were calculated by talcingthe means of all camples taken at the appropriate face sites..
The sampling cover allocated to various face groups was roughlyproportional to the number of men in them and not exactly in accordancewith the pattern established by Ashford & Smith (105G). T.cost currentoccupational groups received adequate cover and, as the period, v/asrelatively short, it is unlikely that estimated exposures for phase II willbe affected.
Cornpo sitional Analys e c
4.3.1 S.T. P. Samples: Routine Survey's
Edwards & Hadden (1803) found in the results from the gravimetrictrials, that the relationship between the non-coal and ash
percentages was very variable and the same variability may beobserved between non-coal and ash in Table 3, but in Table 4,
however, where the results of large numbers of observations havebeen pooled, a near 1:1 ratio exists. It has been assumed,
therefore that for each seam, the constituents of the non-coal weresimilar to and present in the same relative proportion as thosefound/
found in the a ah from the filter ducts, obtained during the
' gravimetric campling trial.
The analyses of samples for the various occupational groups made
by infra-red spcctroscopy and chemical methods during the
Gravimetric Sampling Trial are taken to describe adequately the
the composition of the mineral content of the S. T. P. camples
obtained for the groups, during the 18th Environmental Survey.
V/here no figure was available, a general estimate was used for
each seam, based equally on the results of the gravimetric campling
trial and those obtained during the routine sampling in 1023 afterthe period covered by this report (unpublished data).
4, 3. 2 Gravimetric Sampling Trial
The dust from filter samples was bulbed, by operation, before
ashing and subsequent determinations of the contents of quarts,kaolin and mica were made on the bulked aches by infr-a- red
cpectroccopy.
The calcium, magnesium and iron contents were obtained by acid
treatment of the ash and subsequent chemical analysis (Dodgson &Harrison, 1SGG).
5. RESULTS AND DISCUSSION
In Table S the results for each occupational group are given, including
estimates where necessary. Table 4 summarises the data by general "class
of envirdnment",
5.1 Respirable Dust Concentrationsr*
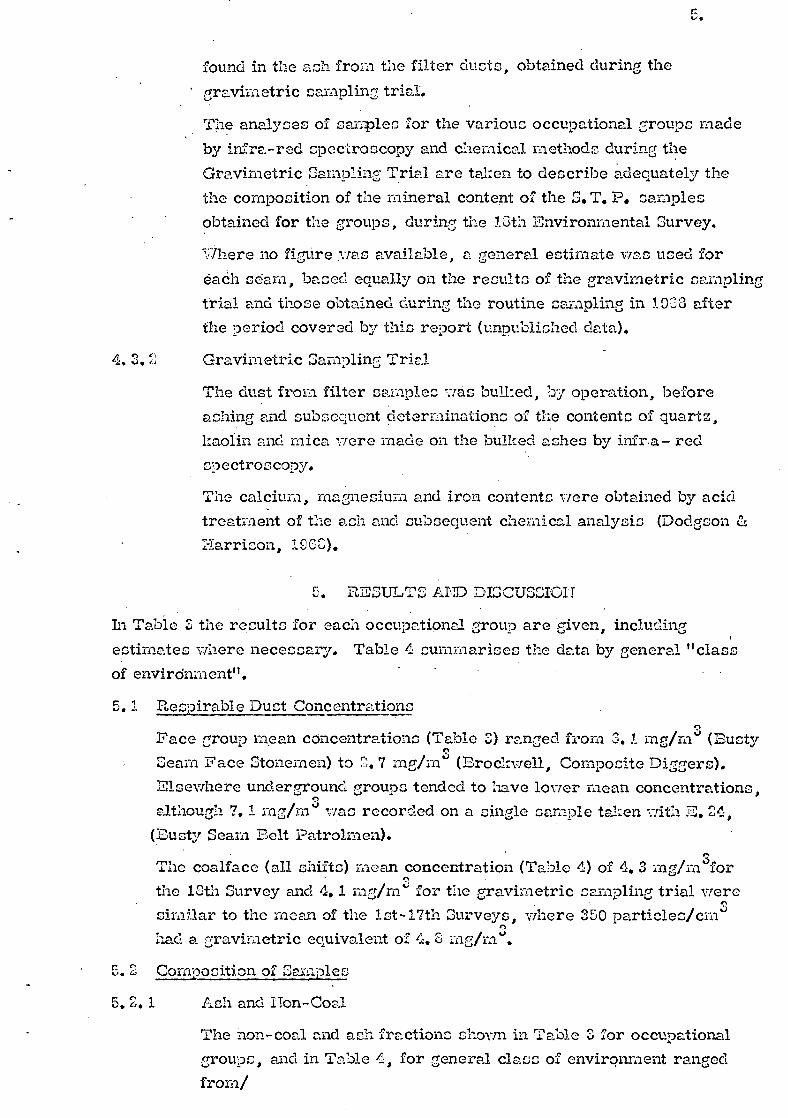
Face group mean concentrations (Table 3) ranged, from 3.1 mg/mu (Bustyr>
Seam Face Stonernen) to 2. 7 mg/m° (Brockwell, Composite Diggers).
Elsewhere underground groups tended to have lower mean concentrations,2
although 7.1 mg/ni was recorded on a cingle sample taken with E. 24,(Busty Seam Belt Patrolmen).
2The coalface (all shifts) mean concentration (Table 4) of 4. 3 mg/m for
o
the 18th Survey and 4. 1 mg/m° for the gravimetric campling trial were3similar to the mean of the 1st-17th Surveys, v/here 350 particles/cm
rs
had a gravimetric equivalent of 4. 8 rng/m0.
5. 2 Composition of Samples
5. 2. 1 Ash and lion-Coal
The non-coal and ash fractions shown in Table 3 for occupational
groups, and in Table 4, for general class of environment rangedfrom/

6.
from 10 to 70 per cent for non-coal and from 7. 3 to G4. 3 per cent
for ash but, as noted in section 4. 3.1, there was no clear
relationship between observations for individual groups.
5.2.2 Mineral Content'of .the Filter Ash
5. 2. 2.1 Quartz made up 13. 1 per cent of the ash of camples in the Busty
Seam, 7. G per cent in the Brockwell and 10* G per cent in the
Harvey. The highest quartz in ash, 30. 1 per cent, was foundin samples taken with the Shotfirers Group, F. 30.
The range of quartz concentration, directly measured, waso
from 0, 04 mg/ni*' with the haulage workers, Group H. 34, to0.45 rng/rn3 for Face Beltman S, 55.
5. 2. 2. 2 Kaolin and Mica, were determined separately by infra-red
spectroscope'' but were reported as a combined silicates figure
to keep the results in line with those of collieries where the
use of interference microscopy allowed no breakdown. The
range of 'silicates' content in ash was from 39. G per cent for
some elsewhere vinderground groups to 73. 9 per cent for Face
Stonemen in the Busty Seam. Elsewhere underground, the
silicates concentrations were from 0. 2 mg/rn" (outbye Officials)3
to 1. 7 rng/rh (Busty Seam, Face Stonemen).
The higher.percentages of silicates in ash recorded occurred insamples where the quartz in ash figure was also high.
5. 2.2. 3 Calcium, Magnesium and Iron in the ashes were detected and •.
measured as carbonates. In the samples taken at the coalface(Table 4) calcium and magnesium carbonates represented 3.5
per cent of the ach but the elsewhere underground value was
. 10.1 per cent. Iron contents tended, to be higher, the mean forall underground samples was S. G per cent,
No analyses were available for surface groups.
The concentrations of calcium and magnesium carbonates were' o
similar to'those of iron, the ranges being 0.01 nig/m to
0.1 mg/niu.

REFERENCES
Ashford, J. R. & Smith. P. H. (1G5G). The allocation of sampling effortin environmental surveys. N. C» B, Report No. SC. 370/ER/28.
Dodgson, J. & Harrison, G. S. (1968). The compositional analysis ofgravimetric samples taken at Morrison Busty Colliery. !• Q, M, FileNo. BP. 31124.
Edwards, J. & Amis, R. (19S8a). Report on the seventeenth and eighteenthenvironmental surveys at Morrison Busty Colliery; N, C; B, Report No.PFR/ER/284.
Edwards, J. &Annis, R. (IGSSb). Summary report on environmentalmeasurements at Morrison Busty Colliery 1954 to 1967. N, C,B. ReportNo. PFR/ER/321.
Edwards, J. & Hadden, G. G. (19G8). Report on the gravimetric samplingtrial at Morrison Busty Colliery April" 19S7 to April 1938.N.C.B. Report No. PFR/ER/320.
Jacobsen, M. , Rae, S. , & Walton, W. H. (1969). The relationship betweendust and pneumoconiosis as the basis of a gravimetric standard forairborne dust underground. N» C« B» Report No. ISM/P(S9)lj..
Walton, W. H. (1937). Correction of dust counts for overlap. I»O. M, FileNo. BP. 31105 (15/9/19G7).
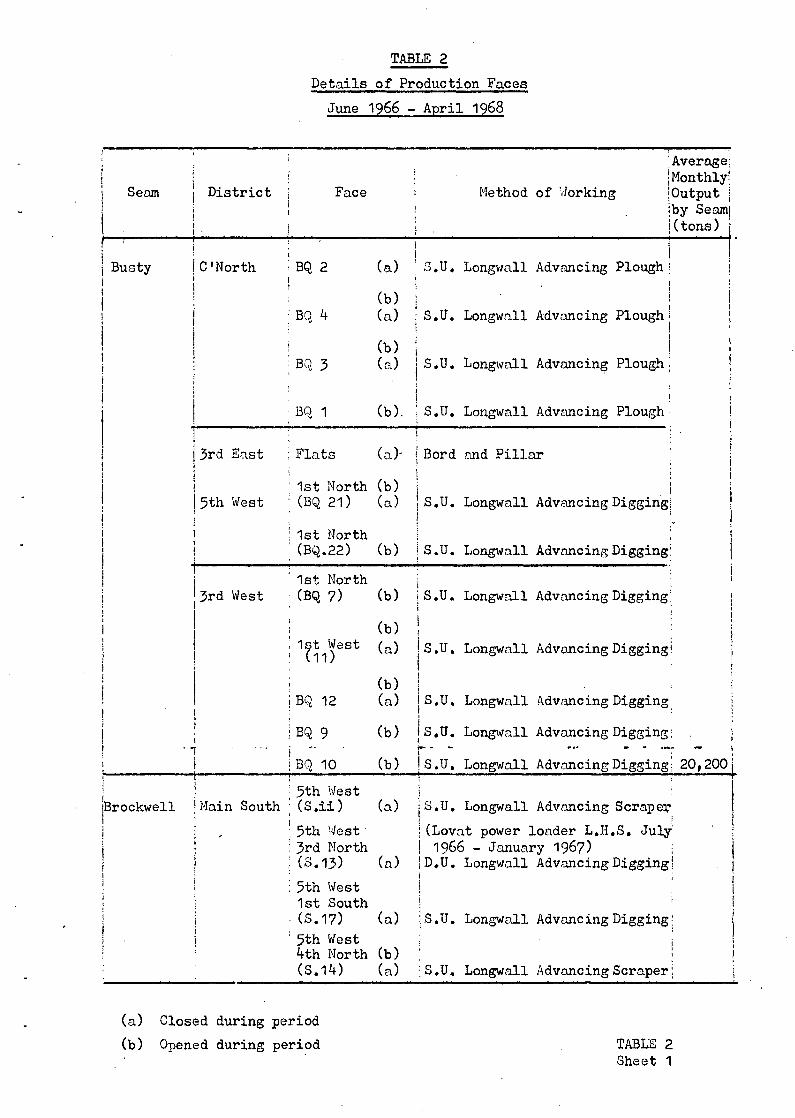
TABLE 2
Details of Production Faces
June 1966 - April 1968
;
Seam District j Facel
i
Busty C' North • BQ 2 (a);'• (b);BQ.lf (a)
i (b); BQ 3 (a)
ii :
BQ 1 (b).
3rd East ; Flats (a)-
; 1st North (b)5th West : (BQ 21) (a)
! 1st North(BQ.22) (b)
I ;1st North
3rd West (BQ 7) (b)
I (b)Ist^West (a)
i
! (b)
i BQ 12 (a)
| ;BQ 9 (b). , . ... . ..
>BQ 10 (b)
i 5th WesttBrockwell Main South : (S.ii) (a)I '
; 5th West: 3rd Northi (S.13) (a); 5th West
* 1st South(S.17) (a)
: 5th Westi lrth North (b)
Average| Monthly
Method of W or king | Outputjby SeamI (tons)
iS.U. Longwall Advancing Plough;
ii
S.U. Longwall Advancing Plough >ii!
S.U. Longwall Advancing Plough j
iS.U. Longwall Advancing Plough'
Bord and Pillar ;
t
S.U. Longwall AdvancingDiggingj
:"
S.U. Longwall Advancing Digging:
;S.U. Longwall Advancing Digging;
;
S.U. Longwall Advancing Digging!
S.U. Longwall Advancing Digging
S.U. Longwall Advancing Digging; .- ... _ ,«.. _
S.U. Longwall Advancing Digging; 20,200
•S.U. Longwall Advancing Scraper
j
(Lovat power loader L.H.S. July1966 - January 1967) ;D.U. Longwall AdvancingDiggingj
.'
S.U. Longwall Advancing Digging' :;i
; (S.14) (a) ;S.U. Longwall Advancing Scraper j
(a) Closed during period
(b) Opened during period . TABLE 2Sheet 1

TABLE 2 (Contd.)
Details of Production Faces
June 1966 - April 1968
Seain
Brockwell(contd. )
Harvey(Towneley)
iDistrict i Face
i!iI
3rd West JNo.2 (a)!(Drift (a)j(S.3) (b)I
Drift ; ?th EastI (N.7) (a)iI| 5th West (a)iI 8th EastIN. 8jMain South! •
JN. 11 (a); (b)iN. 12 (a)
•N.9 (b)
N.13 (b)
Method of Working.
S.U. Longwall Advancing Plough
S.U. Longwall Advancing Scraper
D.U. Longwall Advancing Scraper
S.U. Longwall Advancing Plough
D.U. Longwall Advancing ScraperTraining Face (Scraperinstalled March, 196?)
S.U. Longwall Advancing
S.U. Longwall Advancing Plough
D.U. Longwall Advancing Scraper
D.U. Longwall Advancing Scraper
Average Monthly Output
Average Monthly Outputduring 1?th Survey
Average ;MonthlyOutputby Seam(tons)
'
5,800
12,300
35,700
41, 400
See footnote Page 1
TABLE 2Sheet 2
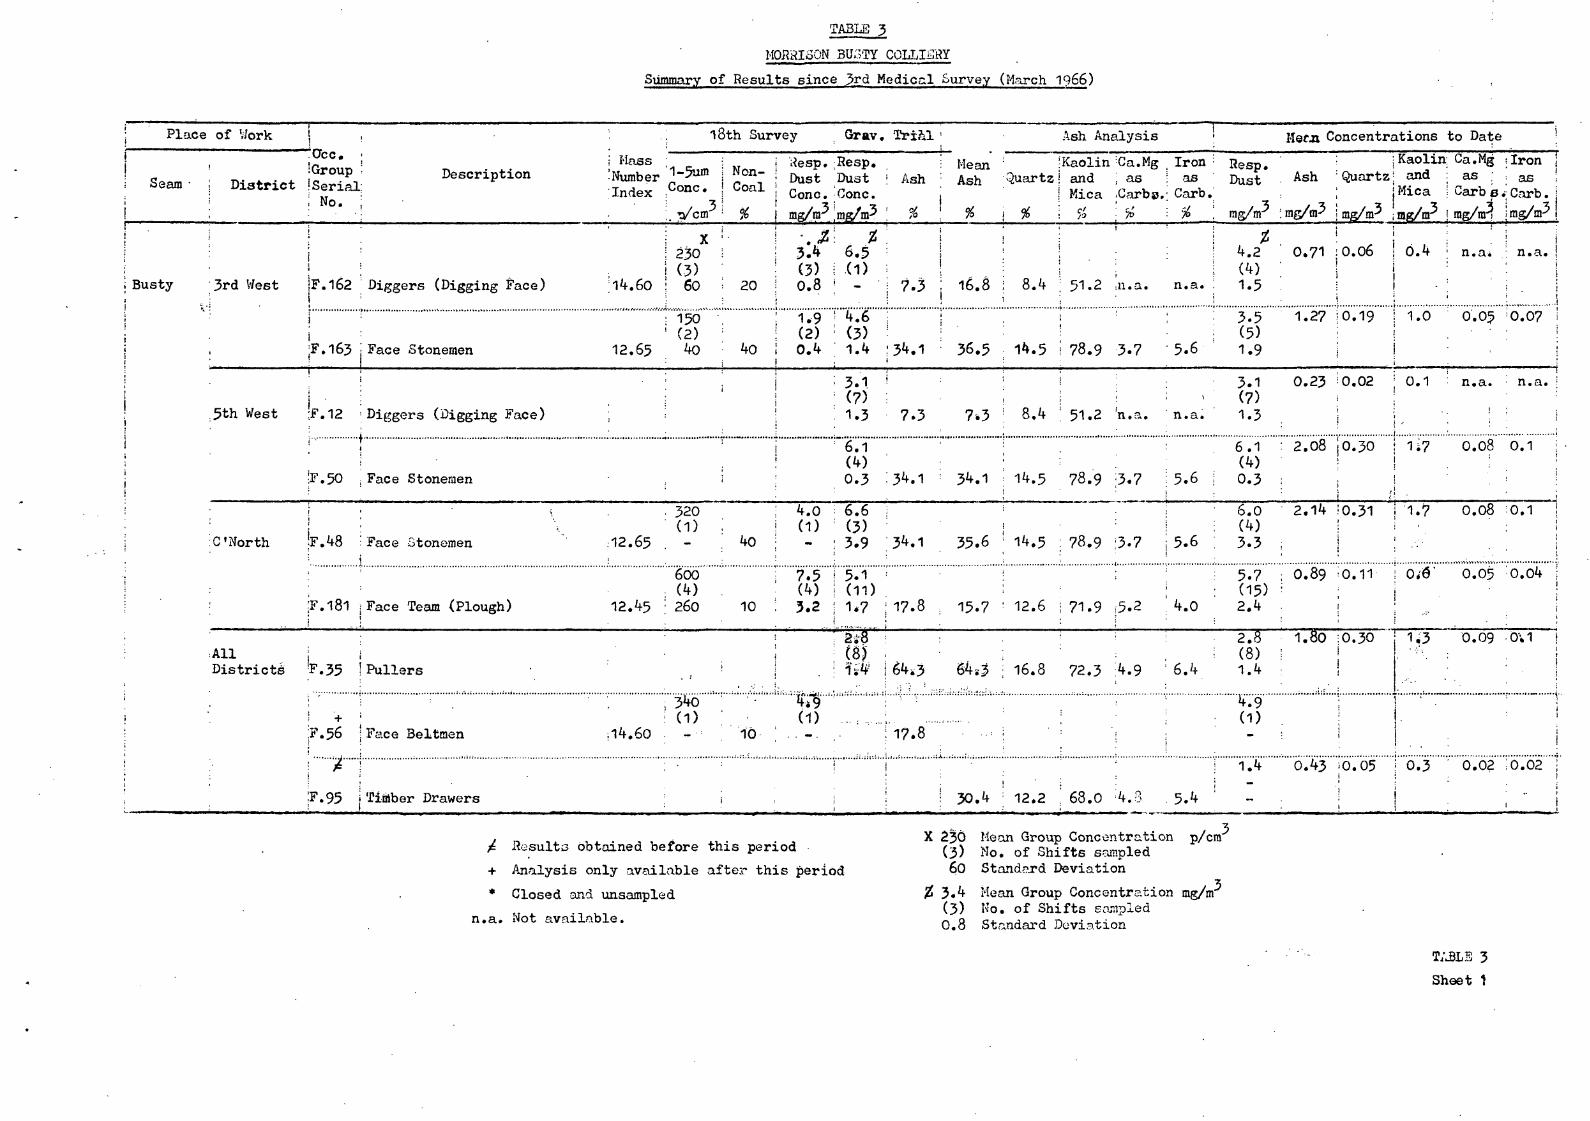
TABLE 3
MORRISON BUSTY COLLIERY
Summary _of Results since 3rd Medical Survey (March 1966)
; Place of Work \.Dec.
1 'Groupi Seam • | District 'Serial
; M• No.
I
ii Busty 3rd West JF.162
ii
i • i, :F.163
•!
i •.5th West ;F.12
;•••
^IF. 50
: • ;• '<
I
i :C 'North 'F.48:
; JF.181!
;A11 jDistricts F.35
; '
I +
:F.56j
' g: i
|F.95
i MassDescription ! Number
Index
•
Diggers (Digging Face) ;14.60
Face Stonemen 12.65
Diggers (Digging Face) ;
Face Stoneraen
ii.
Face Stonemen .12.65!
Face Team {Plough) 12.45
Pullers
Face Beltmen |14.60
Timber Drawers
18th Sui-
1-5um Non-Cone . Coal
. Vcm3 %
j£230(3)60 20
150(2)40 40
i
i
i
320(1) .
40
666'(4)260 10
• '340(1)- 16
i
irey Grav. Trial
Hesp. ;Resp. HeanDust Dust ; Ash AshCone. -Cone.mg/nr |mg/nK ; % %
\ . '.Ju • Jt
3 6.5(3) I (D0.8 j - 7.3 16.8
1.9 ' 4.6(2) ; (3)0.4 ; 1.4 34.1 36.5
; 3.1
1.3 7.3 7*3
6.1(4)0.3 :34.1 ! 34.1
4.0 • 6.6 !(1) ! (3)- ; 3.9 34.1 35.6
!
7.5 ! 5.1(4) i (11)3.2 I 1*7 17.8 : 15.7
i
2i8: (8Ji 1 64,3 64*3
(1) ...:
. , -. , 17.8
i ! .
i ! ! 30.4
Quartz
fo
8.4
14.5
8.4
14.5
14.5
12.6
16.8
12.2
Ash Analysis ; Hef ji C<
Kaolin ;Ca.Mg Iron ; ReSp.and ; as ; as Dust AshMica iCarbs.' Carb. :t P -.% '- c/o '• % rag/m : mg/m-
t -
7*• : 4.2 0.71, C*)
51.2 ,n.a. n.a. 1.5
: 3.5 1.27(5)
78.9 3.7 5.6 1.9
: 3.1 0.23\ ^ (7)
51.2 'n.a. n.a. 1.3
6.1 : 2.08(4)
78.9 :3.7 \ 5.6 i 0.3 ;i . :
i 6.0 2.14i : (4)
78.9 :3.7 i 5.6 ; 3.3 ;! - '; : ; 5.7 ; 0.89
; : (15) '•• 71.9 |5.2 : 4.0 2.4; ! ' ; :
: 2.8 1.80I (8) i
72.3 :4.9 ' 6.4 1.4 :
i i : (i) .i
i 1.4 6.43
! 68.0 ;4.3 . 5.4 '' » .
jncentrz
Quartz
mg/m3
0.06
0.19
0.02
0.30
/
0.31
0.11
0.30
0.05
I
itions to Date '
Kaolin Ca.Mg ilron |and : as ; ; as !Mica ! Carb e » Carb . i
mg/m^ ! mg/m-! jrag/nK I;
i . I i6.4 ; n.a< .: n.a. !
|i . i; „- ,..-!
1.0 0.05 ;0.07 i• • I
i
0.1 : n.a. n.a. j
! ! :
1;7 0.08 0.1 jIi
1.7 0.08 :0.1 |•i
. , j• • i
Oi6' 0.05 0.04 ;I
i... i
• .: '1^3 0.09 Oil j' '•'"'. : '
i
! ' : !
; j
0.3 ' 0.02 ;0.02 1i
.- i
4 Results obtained before this period
+ Analysis only available after this period
* Closed and unsampled
n.a. Not available.
X 236 Mean Group Concentration p/cm"(3) No. of Shifts sampled60 Standard Deviation
#3.4 Mean Group Concentration mg/m(3) Mo. of Shifts sampled0.8 Standard Deviation
TABLE 3
Sheet 1

TABLE 3 (Contd.)
MORRISON BUSTY COLLIERY
Suooary of Results since 3rd Medical Survey (March 1966)
i Place of Work
Seam
Busty(contd.)
District
AllDistricts
"Occ.Group DescriptionSerial,No.
(S tent on, )• Diggers' Mothergate )
F.161 . '(and Composite)(contd.)
Ii .F.169 Cuttermen and Scuff lers
!!
i
!
(F.lS f j Spare Facemen
1 .[j
E.12 Loaders
£.21 Belt Patrolmen
+IS.32 Locomotive Drivers
»4. |
S.43
E.641 1
i2.69
i t,
+Brockwell Main South JF. 138
i 18th SurveyMass iNumber i ~-?um
Index JConc-
i p/cmi
120(1)
13.96;110(D
i 150(D
14.60
i
i
i 540! (1)
13.21
! 90(1)
13.21
t 176(1)
Deputies 16.89 i -
| 40Haulage, Haulermen i (2)and Wagonwaymen 13.21 20
j
General Workers (incl.Whitewashers and Shifters)
Non-coal
10
Kesp.DustCone,mg/m?
rlfl
1.7(1)
—1.6(1)
20
40
H
2.1(1)
7.1(1)10
-
1.21 (1)
Grav. Trial
Reap.DustCone,mg/m^
AshMeanAsh
T27.-0
5.6*(2)3.0 22.2
Ash Analysis Mean Concentrations to Date
;Kaolin ICa.Mg Iron Re , -Quartz i and as as Ash
i Mica Garbs i Garb.
I z'• -\ n
i ! (1)i
—
j 1.6 0.43I i
i Kaolin Ca.Mg | ironQuartz i and as i as
j Mica Carte- j Garb .
mg/m5 | mg/nr mg/m i mg/m5
0.05(1)
12.2 68.0 4.8 5.4i
I ' 2.1i
54.0 12.2
PP~P 7 7C-d + C. ( + (
\
f
40 -.
!'2.9 T f I(1)20 | -
i0.5
i
i3.2
! (2) (1)30 { 0.3
!29.7
i129J9
4.6(2)
| 1.0 26.2 V26.2
i ! ! i 'i 160 i i 2.9 i
Diisers (l>iesing Face ) ( 1 ) j ( 1 )(and Mothergate) 18.23 - : 10 ! -
i
1 1(1)68.0
59.1
!
9*1 39;9
9.2 42.6
4.8 j 5.4 ! -. . .i i
I i; .5.6i (2)
11-.8 I 6.2 3-.0
\,„ „ i
7.1(1)
—1.2(1)
11.1
9.8
_
!
!2.9(1)_
'1.4I (3)
n;3 ji.6|4.6(2)
9.9 1.0i2.9'(1)
1.13 0.14"
1.24 0.10
t
i
iIr0.42 i 0.04
1.30 0.11
!
1
i ;
0.3 0.02
6.8 0.05
0.7
0.2
0.5
0.1
»•
.i0.02 f
0.06 '
0.08
i; !
„ j
0,05 '0.05 i
I \0.1 |0.1 I
;! I
1 i
:
I I i i I : ! . . ; . i
For footnotes, see Sheet 1 T/J3J.E 3Sheet 2
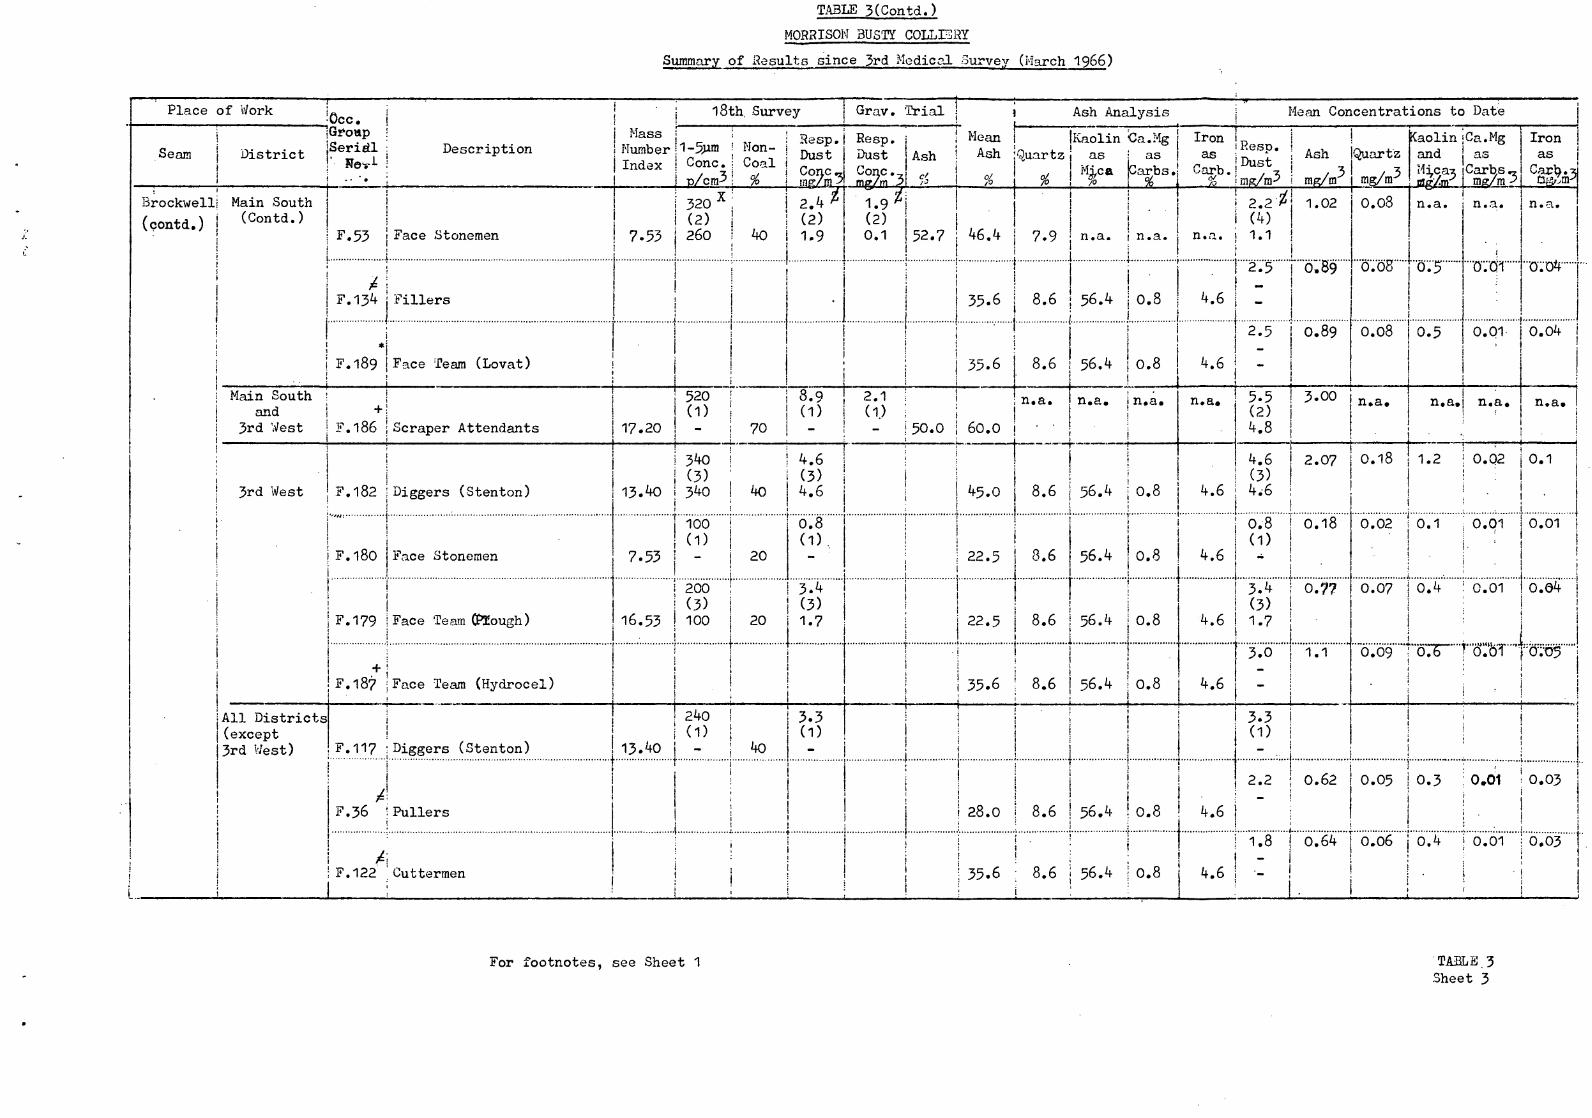
TABLE 3(Contd.)
MORRISON BUSTY COLLERY
Summary of Results since 3rd Medical Survey (March 1966)
Place of Work L•Occ.
Seam
Brockwell
(contd.)
"Group
District . .
• - * " •
Main South(Contd.)
F.53
F.134
F.189
Main Southand +
3rd West I F.186
3rd West F.182
I
F.180
F.179
•fF.187
All Districts(except3rd West) F.117
i 4F.36
i ^i F.122
18th. Survey Grav. Trial j Ash Analysis Mean Concentrations to Date
DescriptionMass jNumber ;1-5umIndex ! Cone.
j 320 X
(2)Face Stonemen 7.53 260
Fillers
if
i
Face Team (Lovat)
! 520(1)
Scraper Attendants 17.20, 1
340(3)
Diggers (Stenton) 13. 40 340
Face Stonemen
Face Team (Hough)
r 100(1)
7.53 j -
., ; i?esp.Mon- i _. ^,-, n i DustCoal i „0, \ Cone-% fiig/m y
2.4I (2)
40 1.9
Resp.DustCone...mp/m J
1.9(2)0.1
!
}
8.9(1)
2.1(1)
70
! 4.6(3)
40 4.6
6:8(1)
20
200 3.4(3) (3)
16.53 100 20 1.71i
Face Team (Hydrocel) i
240 3.3(1) (1)
Diggers (Stenton) 13.40 j - 40I
PullersI . i
! Mean (Kaolin Ca.MgAsh ! Ash iQuartz j as as
i'3 /o /o /o %
Iron pas J£SP' j Ash IQuartzGarb . i s. -z , J> , 3
% I ins/m- i ing/m mg/m
I 1 2.2 1.02 0.08i (4)
52.7 : 46.4 7.9 n.a. n.a. n.a. j 1.1 |L i
; i
iI 2.5 6.89
35.6 i 8.6 56.4 0.8 4.6i j i 1| | I 2.5 0.89j :35.6 8.6 56.4 0.8
ii ' t " •
, n.a. n.a. n.a.
50.0 60.0 • •! 1
1
45.0 8.6 | 56.4
I 22.5 8.6 56.4
22.5 8.6 56.4i.... _.
j i
i '
35.6 ; 8.6 56.4
'i
ji
i28.0 ! 8.6 56.4
1
iCuttermen i J 35.6 8.6 56.4
0.8
—4.6
6.08 "
KaolinandMd^ca-z
Ca.Mg Ironas asGarbs „ Carb.-zmg/m J ty.^m-'
n.a. n.a. n.a.
'"075i
'O.Q'1 0.04
j
0.08 0.5 0.01 0.04
n.a. 5.5 3-00 n>a-
4.8
4.6! (3)
4.6 ! 4 6
| 0.8
0.8
0.8
0.8
(1)4.6
3.4(3)
4.6 1.7
3.0_
4.6
i 3.3| (D) ~1 :....i
2.2_
0.8 4.6!I 1.8
2.07
6.18
0.77
1.1
n.a.
0.18 1.2I
i
0.02
0.07
0.09
0.62 0.05
l_ ':
0.64 T 0.06
—0.8i i i ! :
4.6 •-
0.1
0.4
"o7o~"
0.3
0.4
n.a. n.a.
.. 1
0.02 0.1
i0.01 0.01
0.61 6.04
I
"•raH-OTs•
, i0.01 0.03
I6.61 6.63
i! * 1
For footnotes, see Sheet 1 TABLE.3Sheet 3
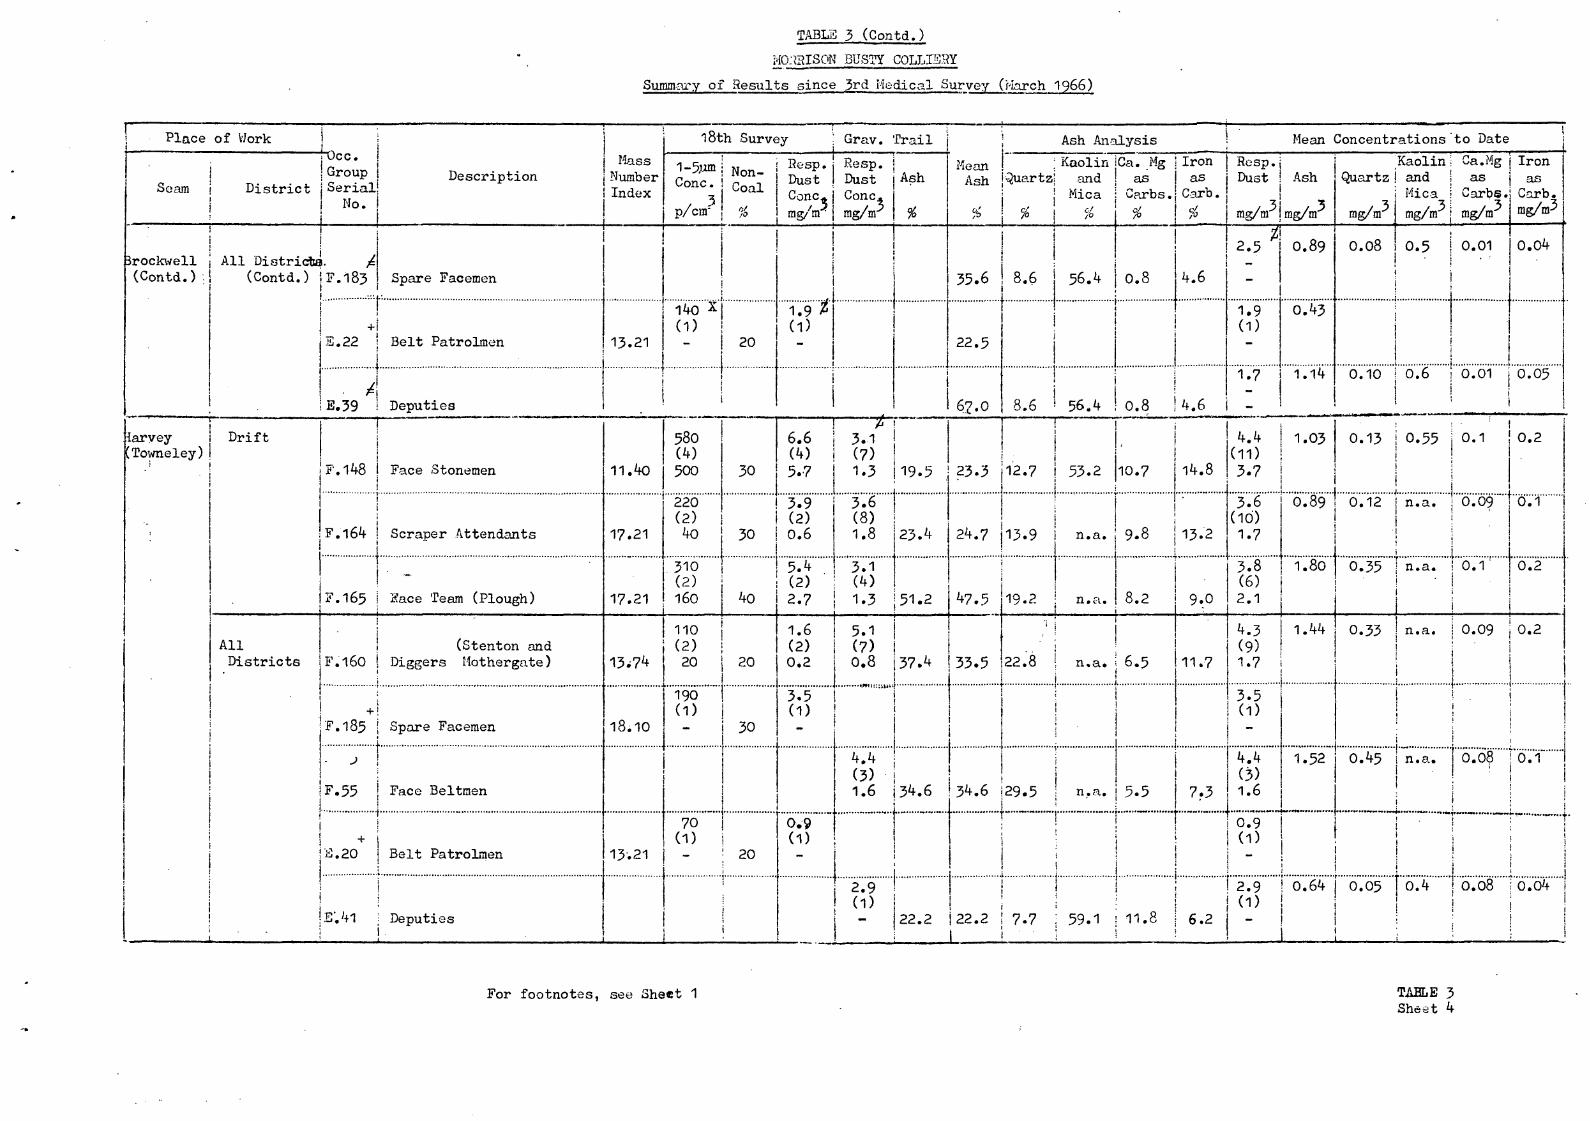
TABL5 3 (Contd.)
MORRISON BUSTY COLLISHY
Summary of Results since 3rd Medical Survey (March 1966)
1 Place of Workt
Occ' Massi Gr°up Description Number
Seam i District Serial IndexNo.
!•
Brockwell j All Districts. 4(Contd.) . (Contd.) !F. 183i
...
+3.22
j
. 4' . ! E.39
larvey(Towneley)
j
Drift
AllDistricts
.
F.148
F.164
1
F.165
F.160
+F.185
F.55'
I •*•33.20
E'.41
Spare FacemenL:I
Belt Patrolmen
18th Survey
1-5um Non_Conc- Coal
Sesp .Dust
p/cm- % mg/nrij
13.21•
i
140 X(1)
20j I7
Deputies
Face Stonemen
Scraper Attendants
."•"
2ace Team (Plough)
(Stenton andDiggers Mothergate )
Spare Facemen
Face Beltmen
Belt Patrolmen
Deputies.
11.40
17.21
17.21
580(4)
1.9 *(1)-
6.6(4)
500 30 5.7
220 3.9(2) (2)40 j 30 0.6
310 ] 5.4(2) (2)160 40
110
13 74
18.10
(2)20 20
2.7
1.6(2)0*2
196(1)
30t
1I
.M».i70(1)
13-.21 - ! 20
I
Iii
3.5(1)-
0.9(1)_
Grav. Trail
Resp.DustCone.mg/m
Ash
%
i
MeanAsh
Ash Analysis Mean Concentrations to Date
; Kaolin iCa. Mg IronQuartzl and as as
Mica i Garbs. Garb.
% %
\
35.6 8.6
22.5
£i3.1(7)
67.0 8.6
i1.3 19.5 ,| 23.3
3.6(8)1.8 23.4
3.1(4)1.3 51.2
5.1(7)0.8 37.4
I
12.7
i
24.7 J13.9i
i
47.5 19.2
"•
33.5 22.8j
4.4i
(3) !1.6 34.6 34.6 I29.5
„ i. „
i
iti
i
;} 2.9'"
(1 ) ' i
I • 22.2 22.2 ! 7.7
% % ^%
Resp.jDust Ash
mg/m I mg/mrf\
2.5 ' 0.89
56.4 0.8I
I
i —4.6
—
1.9(1)
-
1.7
0.43
1.14
Kaolin \ Ca.Mg IronQuartz and as as
Mica I Garbs. Garb./ 3 / 3 ' / 3 mo./«3mg/m mg/m mg/m mg/ra
i
0.08 0.5 0.01 0.04i ' :
1
i ii Ij
6.16 I 6.6 b'.bi' 6.65i
56.4 0.8 4.6 - '
53.2 10.7 14.8
i
n.a. 9.8 13.2
n.a.
i .. .
8.2 9.0
!•
n.a. i 6.5]
11.7
1
i
4.4 1.03(11)
0.13 0.55 0.1 0.2ii
3.7
3.6 6.89 6.12 n.a. 6.69 6.1(10)1.7
0.35 i n.a. 0.1 0.2<,&; ' ! '2.1
4.3(9)
1.44
1.7 i
3.5(1)
1i _... .„..
n.a. 5.5 7.3
4.4(3)1.6
' 1 . , _.„! * ] 0.9
1.52
i (1)
Ii
0.33 n.a. 0.09 0.2
i
:
0.45 n.a. 0.08 6.1
i
2.9 0.64 0.05 o.4 0.08 6.64i i (1)
; 59.1 | 11.8 6.2i
| j
For footnotes, see Sheet 1 TABLE 3Sheet 4

TA3LS 1) (Contd.)
MOHHI30N BUSTY
Summary of Results since_3rd Medical Survey .(March 1966)
i Place of Work 0cC0
Seam
:
Harvyy(Totoeley)(Contd.)
District
AllDistricts
(contd.)
i1
ii
\
i
i
GroupSerialMo.
+E.54
E.63
E.70
F.60
p. 111
+F.128
3.28
3; 29
S.30
E.31
E.34
1
i iI 18th Surveyi
!
Description
Stonemen ( outbye )
Haulage , Haulerinenand Wagonwaymen
General Workers (incl.)Whitewashers & Shifters)
•Shotfirers
Timber Leaders
Borers (Coal and Stone)
Salvage
Stonedusters
(Full-timeFi tters (underground )
1 Pipemen
Masons
MassNumberIndex
11.61
13.21
16.89
1-5,umCone.
p/cra
Non-Coal
%
X60(1)
,
170(1)_
20
30
!
290
(2)160
i
16.89
20
i.. , ..;.{ „ .. .
180 i(1)
30
i
iI
Sesp .DustCone.rng/m3
%0.7(1)-
2.3(1)
4.9(2)2,8
3.1(1)-
iGrav. Trial
I esp.DustCone,mg/nr
w*(1)-
2.6(1)_
4.3(4)1.2
3.8(3)0.5
3.6(3)1.9
3.7(2)0.7
3.8(2)3.0
i
|
j
i
2.5(1)_
2.7
Ash
#
29.7
.22.6
10.8
34.6
22.6
22.6
22:2
29.7
(1)1 29.7!
MeanAsh
%
29.7
26.3
13.9
34.6
22.6
22.6
22.2
Ash Analysis
i
Quartz
%
\
9.1
9.2
30.1
29.5
9i2
9.2
7.7
29.7 9.-1
29.7 I 9.-1;
Kaolinand
Mica%
39.9
45.3
n.a.
n.a.
45.3
45.3
59.1
Ca.MgasGarbs •%
11.1
IronasGarb.%
11.3
8.4 8.4iIi
n.a.
5.5
8.4
n.a.
7.3
8.4i
8;4
11.8
39.9'
39.'9
11.1
8.4
6.2
Mean Concentrations to Date
Resp .Dust
mg/m
i0.7(1)
-3.2(1)-
2.4(2)
I 0.7
4.5(6)1.5
3.8(3)0.5
Ash
mg/m
0.95
0.63
0.63
• -
Quartz,
mg/m
i
0.09\
0.06
0.19
I1.31 0.39
3.1(1)-
3.6(3)1.9
3.7(2)0.7
3.8(2)3.0
2.5! (1)
11.3 -i..._I 2.7(1)
11.1 11 .3i
i _
0.81 0.08
10.84 0.08
KaolinandMicamg/m
0.4
0.3
n.a.
Ca.MgasGarbs-mg/m
0.1
0.05
n.a.
n.a.
0.4
1 0.4
o.84 0:06
0.74 0.'07i
0.5
0.3
0.07
IronasCarb.mg/m-^
0.1
0.05
n.a.
6.1
i
0.07 0.07
i
0.07 6.07
0.1
0.08
i
r ...j. a L _0.8o 0.07
I{
i
0.3 0.09
0.05
0.08
0.09
:
i
For footnotes, see Sheet 1 TABLE 3Sheet 5

TABLS 4
MORRISON BUSTY COLLIERY
Summary of Mean Concentrations and Composition of Airborne Dust" • by Environment
Mean ConcentrationC O M P O S I T I O N A L A N . - A L Y S I S
Environment
MechanisedFilling
Hand Filling
Preparation
18thSurvey
p/on3
370(1Q)
280(8)
290(8)
Development in > 2.60Coal
COALFACE(All Shifts)
Hand Heading
(5)'320(40)
(0)
Elsewhere 90Underground ( 1 1 )
Surface (All 90 .Occupations) (2) :
18thSurvey
mg/m5.0(19)4.2(8;3.5(8)3.5(5)4.3(40)
„ • MeanGrav. . toTria1 Date
rag/m mg/o4.1(39)3.7(9)
3.8(18)4.8(9)4.1(75)
i
(o) ! (o)
4.4(58)?-9x(17)
3.7(26)4.3(14)4.2(115)
(0)
1.2 " 3.5 2.7 "*(11) I (21)
1.0 i 1.2
(32)
1.1(2) i (4) i (6)
, Non-Coal18thSurvey%
30
15
30
30
30
—
IA 1 'Ash-
Grav.Trial
•%
28.2
11.1
44.3
31.5
30.9_
30 25.4
"MeanAsh
%
28.8\ '12.9
Ash Analysis Mean Concentrations to Date
Quartz
%
..16.6
9.3
39.9 15.1
31.0 24.4
30.6 16.5_ _
27.0 9.7
KaolinandMica%
69.8 ....
55.2
70.3
n.a..
67.5.,
Ca.MgasGarbs.%
7..Q .
3.7
5.8
IronasGarb.%
. »,3
5.6
8.0
Ash iQuartz
3 • 3mg/m [mg/m
KaolinandMica,
• mg/nr1.27 0.21 0.9
0.50 0.05i
1.48
1.336.5 11.7
6.5
47.6 J10.1i
i
15 27.7 ! 23.5 n.a. ! n.a. n.a.
r8.6
0.22
C.33
1.29 0.21
~
! 0.738.7
-
0.07
0.3
1.1
n.a.
0.9
-a. Mgas
Garbs.mg/m
0.09
0.02
0.09
0.09
0.08
- -
0.3
.; 0.26 j n.a. ; n.a.n.a. •• i
0.07
n.a.
IronasGarb.mg/m30.1
0.03
0.1
0.2
0.1
-
O.c6
n.a.1
Figures in brackets indicate number of shifts
t?d•£>
n.a. not available

MOgni^ON BUS-:.'i CDLLIggY
Summary of Results since 3rd Medical Survey ('March 1966)
Place of Work
Seam
All Seams
Surface
Occ.iGroup
District |SerialNo.
AllDistricts
/
3.37
f2.73
4JS.77
All Districtsother thanGeneral E.66
S.11
ISO -i
i
.
Description
Onsetters
Steel Checkers
(Eug)
Fitters and Electricians
Other Officials
V/ashery (incl.Wagonmen) -
MassNumberIndex
13.21
13.21
10.94
Others
18th Survey
1-5umCone.
•2
p/crn
X110(1)-
70(1)-
90(2)100
Non-Coal
%
Resp.DustCone.rag/m3
it""~ ""'"2
40
40
15t
•
1.5(V-
1.0(1)- •
0.9(2)1.1
Grav, Trial [
Hesp .DustCone.
J3.0(1)-
1.8(2)0.0
1.0(3)0.0
1.6 ,.(i) '
—
Ash
0>/o
22.2
29.7
27.7
KofcnAsh
29.0
Ash Analysis.
Quartz
0'10
*
11.6
tI
31.1
27.0
34.3
23.5!
"T"i
27.7 | 27.7
7.7
•
Kaolinas
Mica%
• -•>
51.1
59.1
11.6 51.1| i
9.1
n.a.
39.9
Ca.Mgas
Garbs.%
IronasGarb.
L %
. l-
6.8 7.8
11.8
6.8
11.1i
n.a. n.a.j
6.2,.
7.8
11.3
n.a.
•
• i • • •n . ci . n . a c In . a .
Mean Gohcentrat.ions -to^ Datei
.Rcsp.Dust
me/m
i. 0.3
_
2.2(2)1.2
2.0
-
1.5(3)0.6
1.0(5)0.5
1.6(1)
n.a, -.
Ash
mg/m
0.09
0.68
0.54
0.52
0.24
Quartz
mg/m
Kaolin Ca.Mgand as
Mica Garbs.
mg/m mg/m
0.01 0.04
0.05
0.06
0.05
n.a.
0.44
0.01.
0.4 0.08
0.3
0.2
n.a.
in.a.
i
n.a.
0.04
0.06
IronasGarb.ing/ra5
0.01
0.04
0.04
0.06
in.a. in. a.
1
. n.a. n.a.
For footnotes, see Sheet 1 TABLE 3Sheet 6

HEAD OFFICE:
Research Avenue North,Riccarton,Edinburgh, EH14 4AP, United KingdomTelephone: +44 (0)870 850 5131Facsimile: +44 (0)870 850 5132
Email: [email protected]
Tapton Park Innovation Centre,Brimington Road, Tapton,Chesterfield, Derbyshire, S41 0TZ, United KingdomTelephone: +44 (0)1246 557866Facsimile: +44 (0)1246 551212
Research House Business Centre,Fraser Road, Perivale, Middlesex, UB6 7AQ,United KingdomTelephone: +44 (0)208 537 3491/2Facsimile: +44 (0)208 537 3493
Brookside Business Park, Cold Meece, Stone, Staffs, ST15 0RZ,United KingdomTelephone: +44 (0)1785 764810Facsimile: +44 (0)1785 764811
(A20115) IOM (R) ReportCov art 3/15/06 12:32 PM Page 2