historical research report - iom-world.org · morrison busty colliery, which came into production...
TRANSCRIPT

HISTORICAL RESEARCH REPORTResearch Report TM/76/01
1976
Pneumoconiosis Field Research: Summary report on environmental conditions at Morrison Busty Colliery, 1966-1973 Annis R, Bradley A, Thomas P


Copyright © 2006 Institute of Occupational Medicine. INSTITUTE OF OCCUPATIONAL MEDICINE No part of this publication may be reproduced, stored Research Avenue North, Riccarton, Edinburgh, EH14 4AP or transmitted in any form or by any means without Tel: +44 (0)870 850 5131 Fax: +44 (0)870 850 5132 written permission from the IOM e-mail [email protected]
Pneumoconiosis Field Research: Summary report on environmental conditions at Morrison Busty Colliery,
1966-1973
Annis R, Bradley A, Thomas P This document is a facsimile of an original copy of the report, which has been scanned as an image, with searchable text. Because the quality of this scanned image is determined by the clarity of the original text pages, there may be variations in the overall appearance of pages within the report. The scanning of this and the other historical reports in the Research Reports series was funded by a grant from the Wellcome Trust. The IOM’s research reports are freely available for download as PDF files from our web site: http://www.iom-world.org/research/libraryentry.php
HISTORICAL RESEARCH REPORTResearch Report TM/76/01
1976

ii Research Report TM/76/01
Report No. TM /76/1 . . Not for Publication
UDC 622.872
Pneumoconiosis Field
Research: Summary
Report on Environmental
Conditions at Morrison
Busty Colliery, 1966-1973.
R. Annis, A. Bradley
and P. Thomas.
August 1976
Environmental Branch,Institute of Occupational Medicine,Roxburgh Place,Edinburgh, EH8 9SU(Tel. 031-667 5131)


1 Report No. TM/76/1\
I N S T I T U T E O F O C C U P A T I O N A L M E D I C I N E
PNEUMOOONIOSIS FIELD RESEARCH
SUMMARY REPORT ON ENVIRONMENTAL CONDITIONS AT MORRISON
BUSTY COLLIERY, 1966-1973
by
R. Annis, A. Bradley and P. Thomas
CONTENTS
SUMMARY
1. INTRODUCTION
2. MORRISON BUSTY COLLIERY
2. 1 Seams, methods of working and output
2. 2 Ventilation
2. 3 Dust control
2.4 Manpower
2. 5 Manpower records
2. 6 Medical surveys
2. 7 Staff
3. SAMPLING AND EVALUATION
3. 1 Sampling strategies and instruments used
3. 2 Stratification and allocation of sampling effort
3. 3 Evaluation of samples and reporting of results
4. ENVIRONMENTAL OBSERVATIONS
4. 1 Coal faces
4. 2 Elsewhere underground
4.3 Surface
4. 4 Total dust concentrations
4. 5 Composition of dust
4. 6 Relationship between control point and face concentrations
4. 7 Sumsnary of results
5. OTHER INVESTIGATIONS

CONTENTS (Contd. )
REFERENCES
TABLES'V3_2, 7, 9, 14, 15, I6a, I6b,
FIGURES if and 2/

Report No. TM/76/1
I N S T I T U T E O F O C C U P A T I O N A L M E D I C I N E
PNEUMOCONIOSIS FIELD RESEARCH
SUMMARY REPORT ON ENVIRONMENTAL CONDITIONS AT MORRISON
BUSTY COLLIERY, 1966-1973
byR. Annis, A. Bradley and P. Thomas
SUMMARY
This report summarises the environmental measurements made atMorrison Busty Colliery during Phase II of the Pneumoconiosis FieldResearch and covers the period from April 1966 to the closure ofthe colliery in June 1973.
A brief description is given of the colliery, the seams worked, themining methods, the techniques and results of environmental sampling.The dust concentrations, which are in gravimetric units, are tabulatedand discussed in relation to the mining activities.
Both respirable and 'total dust1 concentrations are given for all occupa-tional groups and where there was no direct sampling, estimates havebeen obtained by comparison with similar groups and conditions. Thecomposition of the respirable dust for the various general environmentsis also discussed.
Throughout this period Morrison Bust^ Colliery had a coalface (all shifts)mean respirable dust concentration of(4.Img/m3. The ash content of therespirable dust was 22. 5 per cent and the mean quartz in sample was
\3 iQ per cent (concentration 0.

PNEUMOCONIOSIS FIELD RESEARCH
SUMMARY REPORT ON ENVIRONMENTAL CONDITIONS AT MORRISON
BUSTY COLLIERY, 1966-1973
by
R. Annis, A. Bradley and P. .Thomas
1. INTRODUCTION
Environmental sampling has been carried out at Morrison Busty Colliery,one of the original 24 collieries In the'Pneumoconiosis Field Research,since July, 1954. The first phase of this work was summarised byEdwards and Annis (1968).
With the completion of the Interim Standards Study in 1968, ([Jacpbsen,... ";Rae & Walton, 1969) further detailed research was continued at tencollieries, Morrison Busty being one. This report summarises thissecond phase of the work from April, 1966 until the closure of the collieryin June 1973, with particular empnasis on the' mean dust concentrationsto which occupational groups were exposed. These are required forfurther analysis of dust/disease relationships.
During this second phase of the Research two types of instrument wereused, the Standard Thermal Precipitator (S. T.P.) which allowed the dustconcentrations to be reported as the number of particles in unit volumeof air (p.p. c. c.) and the M.R. E. Gravimetric Dust Sampler, Type 113Awhich gave results in gravimetric units (mg/m^). In the GravimetricTrial, April 1967 to April 1968, both instruments were used in side-by-side sampling, thus enabling previous results to be converted to gravi-metric units (Edwards •-,.&. Hadden, 1968).
Detailed results have been given in a series of annual reports, eachcovering the period from April of one year to March of the following year(see References).
Compositional analysis of all gravimetric samples was carried out on anoccupational group basis at the Institute of Occupational Medicine for ash,quartz, kaolin, mica and acid soluble carbonates of calcium, magnesium)and iron; these results are reviewed.
Since 1971, estimates of the 'total dust' concentrations have been madeon a proportion of the samples from most occupational groups by washingout the dust collected in the elutriator and adding this weight of dust tothe respirablej fraction collected on the filter. Where there was nodirect sampling estimated 'total dust' concentrations have been made v>-(Annis & Hadden, 1976). These results are recorded and discussed.
The report records the dust concentrations at control sampling pointsin return roadways and examines the relationship between these concen-trations and face mean concentrations.
2.
The several special investigations, which include a check on the effect-of the change in a sampling strategy and wearer trials with dust respi-rators and protective clothing are described.
Two medical surveys, March-April, 1970 and June 1973 have been madeby Medieal Branch of the Institute of Occupational Medicine (Rae, 1970;Burns, 1973). The medical surveys, along with estimates of individualdust exposure derived from the environmental surveys and colliery timerecords are the principal factors in the study of the dust-disease rela-tionships.
2. MORRISON BUSTY COLLIERY
Morrison Busty Colliery, which came into production in 1926 and closedin 1973, was situated in the north-Western part of the Durbam coalfieldat Annfield Plain, some 10 miles south-west of Newcastle-upon-Tyne.
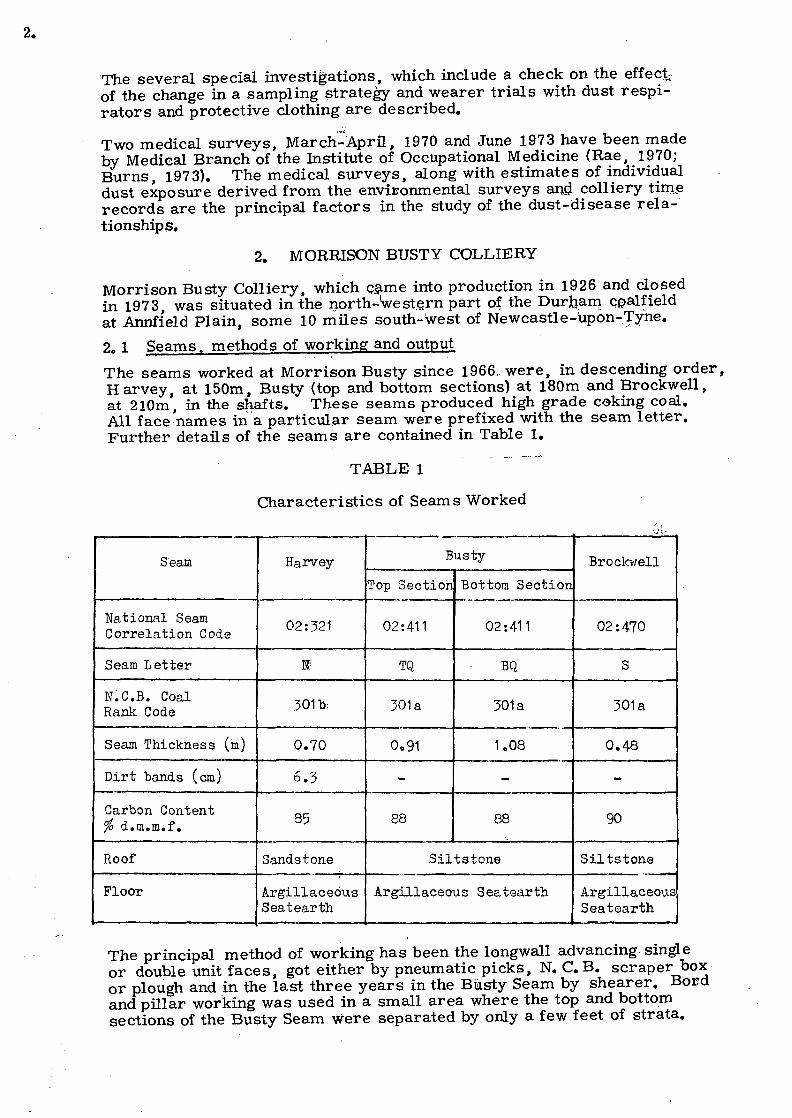
2.1 Seams, methods of working and output
The seams worked at Morrison Busty since 1966,. were, in descending order,Harvey, at 150m, Busty (top and bottom sections) at 180m and Brockwell,at 210m, in the shafts. These seams produced high grade coking coal.All face names in a particular seam were prefixed with the seam letter.Further details of the seams are contained in Table 1.
TABLE 1
Characteristics of Seams Worked
Seam
National SeamCorrelation Code
Seam Letter
N.C.3. CoalRank Code
Seam Thickness (in)
Dirt bands (cm)
Carbon Content/a a.m.m.i.
Roof
Floor
Harvey
02:321
M
301 b;
0.70
6.3
85
Sandstone ,
ArgillaceousSeatearth
Busty
Top Section
02:411
TQ
301 a
0.91
-
88
Bottom Section
02:411
BQ
301 a
1008
-
88
Siltstone
Argillaceous Seatearth
Brockwell
02 : 470
S
301 a
0.48
-
90
Siltstone
ArgillaceousSeatearth
The principal method of working has been the longwall advancing singleor double unit faces, got either by pneumatic picks, N. C. B. scraper boxor plough and in the last three years in the Busty Seam by shearer. Bordand pillar working was used in a small area where the top and bottomsections of the Busty Seam were separated by only a few feet of strata.
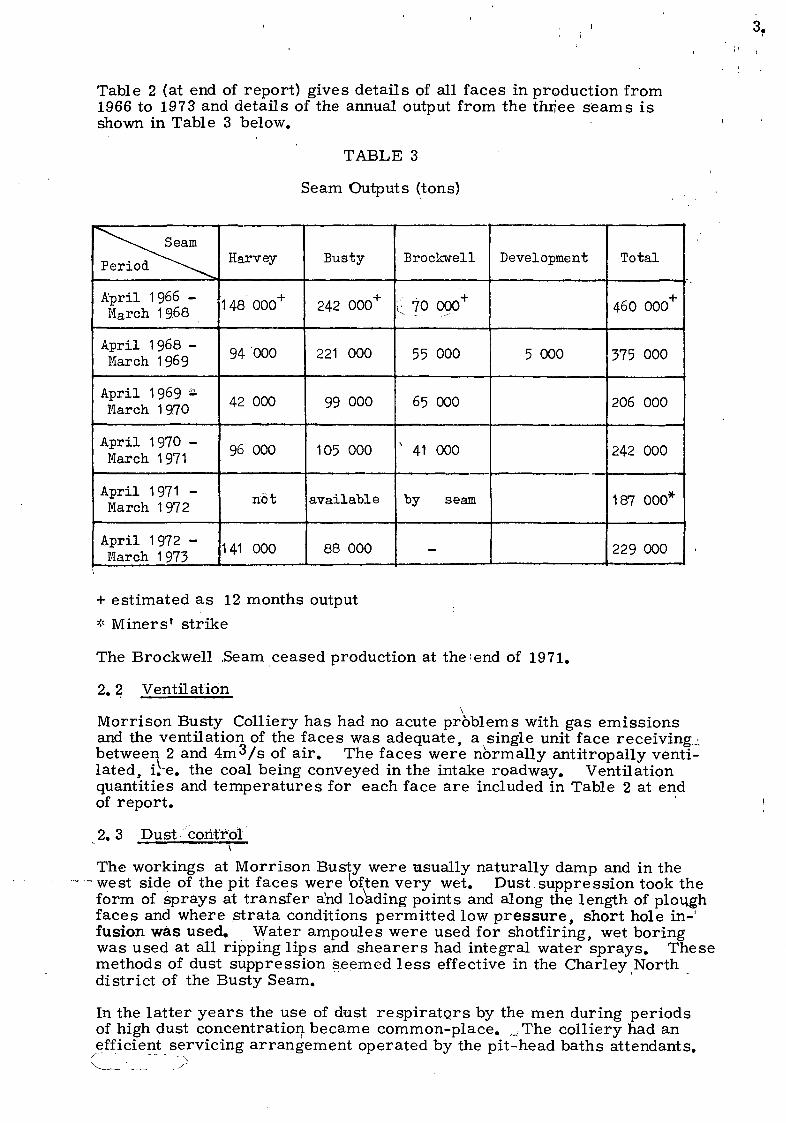
Table 2 (at end of report) gives details of all faces in production from1966 to 1973 and details of the annual output from the three seams isshown in Table 3 below.
TABLE 3
Seam Outputs (tons)
^ ^ Seam
Period "\ ^
April 1966 -March 19.68
April 1968 -March 1969
April 1969 -March 1970
April 1970 -March 1971
April 1971 -March 1972
April 1972 -March 1973
Harvey
1 48 000+
94 000
42 000
96 000
not
141 000
Busty
242 000+
221 000
99 000
105 000
available
88 000
Brockwell
' 70 OOO"1"
55 000
65 000
" 41 000
by seam
-
Development
5 000
Total
460 000+
375 000
206 000
242 000
187 000*
229 000
+ estimated as 12 months output
* Miners' strike
The Brockwell .Seam ceased production at the'end of 1971.
2.2 Ventilation\
Morrison Busty Colliery has had no acute problems with gas emissionsand the ventilation of the faces was adequate, a single unit face receiving..;between 2 and 4m«Vs of air. The faces were normally antitropally venti-lated, i.e. the coal being conveyed in the intake roadway. Ventilationquantities and temperatures for each face are included in Table 2 at endof report.
2.3 Dust control
The workings at Morrison Busty were usually naturally damp and in the•west side of the pit faces were often very wet. Dust.suppression took theform of sprays at transfer and loading points and along the length of ploughfaces and where strata conditions permitted low pressure, short hole in-'fusion was used. Water ampoules were used for shotfiring, wet boringwas used at all ripping lips and shearers had integral water sprays. Thesemethods of dust suppression seemed less effective in the Charley Northdistrict of the Busty Seam.
In the latter years the use of dust respirators by the men during periodsof high dust concentration became common-place. ,.,rThe colliery had anefficient servicing arrangement operated by the pit-head baths attendants.
4.
Martindale Type 'UT and Baxter Pneu-Seal were the two types of respi-rators available.
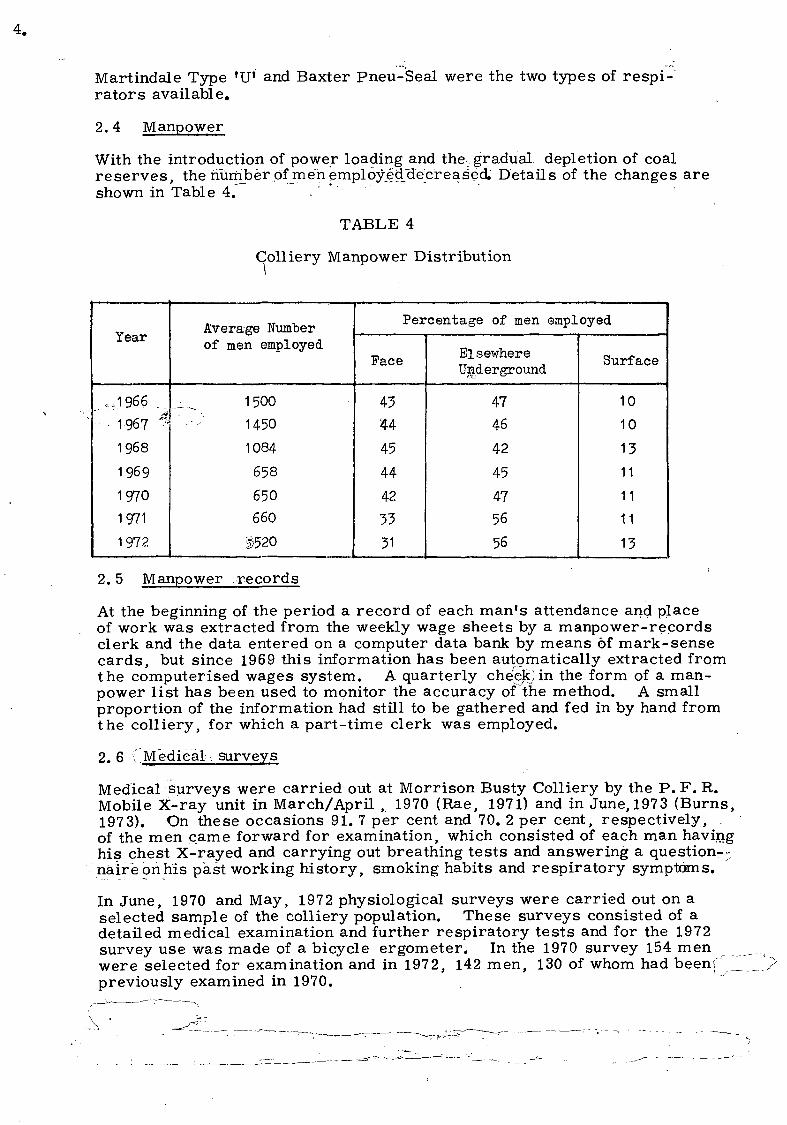
2.4 Manpower
With the introduction of power loading and the.gradual depletion of coalreserves, the riuniber of menemployjHclecreased. Details of the changes areshown in Table 4. ,
TABLE 4
Colliery Manpower Distribution
Year
,,,.1966 .
- 1967 ~
1968
19691970
19711972
Average Numberof men employed
__^ 1500
" • • - ' 1450
1084
658
650
660
§520
Per
Pace
43
U
45
44
42
33
31
centage of men empl
ElsewhereUnderground
4746
42
45
4756
56
oyed
Surface
10
10
13
11
11
11
13
2.5 Manpower records
At the beginning of the period a record of each man's attendance and placeof work was extracted from the weekly wage sheets by a manpower-recordsclerk and the data entered on a computer data bank by means of mark-sensecards, but since 1969 this information has been automatically extracted fromthe computerised wages system. A quarterly che'ekjin the form of a man-power list has been used to monitor the accuracy of the method. A smallproportion of the information had still to be gathered and fed in by hand fromthe colliery, for which a part-time clerk was employed.
2. 6 f Medical surveys
Medical surveys were carried out at Morrison Busty Colliery by the P. F. R.Mobile X-ray unit in March/April , 1970 (Rae, 1971) and in June, 1973 (Burns,1973). On these occasions 91. 7 per cent and 70. 2 per cent, respectively, .of the men came forward for examination, which consisted of each man havinghis chest X-rayed and carrying out breathing tests and answering a question-;nairepnhis past working history, smoking habits and respiratory symptoms.
In June, 1970 and May, 1972 physiological surveys were carried out on aselected sample of the colliery population. These surveys consisted of adetailed medical examination and further respiratory tests and for the 1972survey use was made of a bicycle ergometer. In the 1970 survey 154 menwere selected for examination and in 1972, 142 men, 130 of whom had been["previously examined in 1970.

2.7 Staff
The following: staff supervised or carried out the sampling at MorrisonBusty.
Regional Investigators
Mr. G.G. Hadden 1966 - 1970Mr. A. Bradley 1970 - 1973
Senior Investigators
Mr. J. Edwards 1966 - Aug 69Mr. A. Bradley Feb. 70 - 1973
Assistant Investigator
Mr. E. Gibbon
3. SAMPLING AND EVALUATION
3. 1 Sampling strategies and instruments used
As reported previously by Edwards and Annis (1968), the random colliertechnique, with the thermal precipitator (S. T. P.) as sampling instrument,was employed until March,.! 1967 and the dust concentrations recorded asthe number of particles in unit volume of air (p.p. c. c.).
In the gravimetric trial, April 1967 to April 1968, side-by-side samplingwith the thermal precipitator and the M.R. E, Gravimetric Dust Sampler,Type 113A were used, thus enabling previous results to be converted tomass units (mg/m3). There followed, until October, 1970 a period ofsampling with the M. R. E. Gravimetric Sampler based on the 'randomcollier1 technique and more recently, since November, 1970, samplinghas been carried out by recruiting volunteer instrument carriers whocarried and operated the M.|R. E. Sampler during the whole shift under-ground.
3. 1. 1 Standard thermal precipit ator and random collier This methodof sampling consisted of taking a continuous sequence of thermal precipitatorsamples while accompanying a randomly selected member of an occupationalgroup throughout the working shift, portal to portal. On all shifts, thesampling was carried out close to the representative workman to obtain areliable estimate of conditions in his immediate environment. This was thesampling method used thoughout Phase I of the research (Edwards & Annis1968).
3.1.2 Gravimetric trial in the mid-sixties the M. R. E. Gravimetric DustSampler, Type 113A (N. C.B. , M. R. D. E. , 1971) became readily availableand made it possible to measure dust concentrations in terms of the massof respirable dust per unit volume •-. a more suitable parameter for assessing,dust exposures. The gravimetric trial took the form of side-by-side sampl-ing with the thermal precipitator and the M. Rf E. Gravimetric Sampler atvarious face sites and outbye locations. The purpose of this was to establishmass-number indices (M.N. I.) expressed .in mg/m3 per 1000 p.p. c. c. forthe various occupational groups (Edwards and Hadden, 1968). These M. N. I.swere later used to convert p^st number concentrations and the correspondingexposure indices to mass concentrations and equivalent mass exposure indices(Dodgson, Harrison •& Thorpe, 1970).
3. 1. 3 M.R.E. Gravimetric Sampler and volunteer instrument carriers Withthe M.R.E. Gravimetric Sampler, which unlike the T. P. required the minimumof attention to operate, it became possible to recruit volunteers from most

6.
occupational groups to carry sampling instruments to their places ofwork to sample their own environment during the whole of the workingshift. It was Considered that instruments, by being placed nearer
•-..the"representative,?:, would give a more accurate measure of the dustin the environment than had been previously possible, and also thatthe' increased sampling frequency this method allowed would improvethe confidence limits of the exposure estimates.
The procedure adopted at Morrison Busty (Bradley1 & Gibbon, 1972)was that sampling instruments were given out on the surface to anumber of volunteers who, on reaching pit bottom switched on theinstruments, carried them to their working place and hung them insuitable positions. At the end of the shift a carrier returned theinstrument to the surface having switched off before ascending theshaft. Investigators usually went underground and supervised thesampling - making notes on the sampling conditions, checking ifthe instrument was working properly and whether it had been positionedcorrectly.
It was difficult at times to have volunteers carry instruments whentheir normal occupation required them to carry other equipment orwhen involved in extensive travelling. To cover such occupationsand, indeed any occupational group for which-the estimates of meanconcentration was likely to be inadequate or biased, additional 'randomcollier' sampling was undertaken.
To check if any bias had been introduced by the change in sampling methodfrom 'random collier' to volunteer carriers, 'random collier' samples weretaken with an elsewhere underground occupational group on the days whenthe group's volunteer instrument carriers were sampling. The result ofthis check showed that there was no significant difference between the twosets of results obtained by the different sampling techniques.
In February, 1971 a new type of nosepiece was fitted to the M.R. E.Gravimetric Samplers. This was designed to minimise the effect ofturbulence due to high ambient air speeds.
At the beginning/of the 1971 dust year (April) the taking of samples atthe control point, 70m back in the return roadway, was established asa routine. These samples were taken only for the time the men wereon the face and not portal to portal like all other routine samples.
;fFr.onY"197l onwarda^-a proportion of samples covering most occupational-groups were evaluated for 'total dust'; i.e. the total dust collected bythe M. R. E. Sampler, elutriator and filter.
3. 2 ; Stratification-and allocation of sampling effort •
The colliery population continued to be divided into three main classes:-
(a) Faceworkers
(b) Nonrfaceworkers Elsewhere Underground
(c) Surface workers
These men were further subdivided by occupation and place of work intoOccupational Groups, made up of men exposed to substantially the same,.:working environment. With the run-down in manpower, and the concen-tration of production into a few face areas, a review of the structure ofoccupational grouping was made in April, 1970 ( Bradley, Gibbon & •Thomas, 1972). This resulted in the closing of a number of face occupa-tional groups associated with handfilled faces and replacing all the 29

7.
elsewhere underground groups with five new groups. Table 5 gives detailsof the distribution of occupational groups over the period 1966 to 1973.
TABLE 5
Distribution of Occupational Groups
Period
April 1966to
March 1968
April 1968to
March 1969
April 1969to
March 1970
April 1970to
March 1971
April 1971to
March 1972
March 1972to
June 1973
Open at beginningOpenedClosed
Open at beginningOpenedClosed
Open at beginningOpenedClosed
Open at beginningOpenedClosed
Open at beginningOpenedClosed
Open at beginningOpenedClosed
Op,en at end
No. of., Occupational .Groups- Y '" """ IJ
Face
41112
3024
2804
2400
2479
22922
9
,- E.U.-G.
3211
3214
29029
06 •2
400
432
5
i a . _. •—
Surface
30®0
300
300
30OS
306
311
3
" Total
762
13
6538
600 .33
2762
3179
291325
17
The total number of occupational groups at Morrison Busty Collieryduring the review period was:-'
Eace groups 60
Elsewhere underground groups 43
Surface groups 4
making a total of 107 groups.
During the period of 'random collier' sampling the number of samplesobtained was at the rate of about three per week, but with thejntroductionof volunteer instrument carrier during I969cthe Irate .of^.sampling" ~~~~.~^increased considerably. Carriers were recruited for a year and usually^carried an instrument about twenty times each. The number of samplesobtained was proportional to the number of volunteers recruited annually;in 1970 the number recruited was 68 of whom 54 were faceworkers, 5developers and 9 non-faceworkers elsewhere underground, but with thedecrease in colliery population the number recruited in 1972/73 was 44.
All samples with surface workers were taken by the Unit Investigatorsusing the 'random collier1 technique. Table 6 shows the number ofsamples obtained in the three main classes of environment by the twosampling instruments and by the different sampling techniques.

8.
TABLE 6
Allocation of Sampling Effort
s^ _" ' """^vinstrument ;C
Period1 ^\^^
^^March 1 966
toAug. 1968*
Aug. 1968to
Jan. 1969
Mftrch 1969to
March 1970
April 1970to
March 1971
April 1971to
March 1972
April 1972to
June 1973
Standard Thermal ' -- Precipita-tor - . . -
PaceE. U/gSurface
PaceE. U/gSurface
PaceE. U/gSurface
PaceE. U/gSurface
FaceE. U/gSurface
PaceE. U/gSurface
RandomCollier
116316
VolunteerCarriers
mm
—-
M.R.E. GravimetricSampler
PaceE.. U/gSurface
PaceE. U/g'Surface
PaceE. U/gSurface-
PaceE. U/gSurface
PaceE.vU/gSurface
PaceE. U/gSurface
RandomCollier
76 .20 ;4;,!-
69(2)2713
M
_
24
645013
—_
76
—
10109
VolunteerCarriers
— m
--
••
-
—470
62-
433(10)88-
875(41)287
-
854(41 )465
-
^Includes 100 S. T. P. samples taken side-by-side with M.R.E. inGravimetric Trial
( ) No. of Control Position Samples
3. 3 'Evaluation of-samples and reporting of result's '
The thermal precipitator samples were counted under the supervisionof J. Edwards whose counting bias as measured by the counting courseswas 0. 94 of the mean of the Master Counters (Edwards and Annis, 1969).The results were reported to Headquarters on a standard form (P. F. R. /I)and later occupational group .mean concentrations were converted to massconcentrations by applying the^relevant mass-number index determinedin the Gravimetric Trial.
The filters used for collecting the respirable dust in the M.R. E. Gravi-metric Sampler were 50mm Sartorius Membrane filter, 8. Ojum pore size.
The routine adopted was that a batch of filters, ususally 50 in number,were exposed for 24 hours to attain stable condition! and then weighedon.a semi-micro balance. After a further 24 hours the filters werere-weighed and if the changes in weight of the individual filters werewithin + 0. Img of the mean change in weight of all the filters, thesewere then considered acceptable. If any filters showed a change inweight outside the + 0. Img limit, the whole batch was again re-weighed
9.
after a further period of 24 hours. If any filter was still outside theaccepted limit, it was discarded.
When the filters were used, every fifth filter was retained as a controlso that any correction due to change in humidity could be calculatedand applied to the other filters. After the whole batch of filters hadbeen used they were re-weighed using the same procedure describedabove.
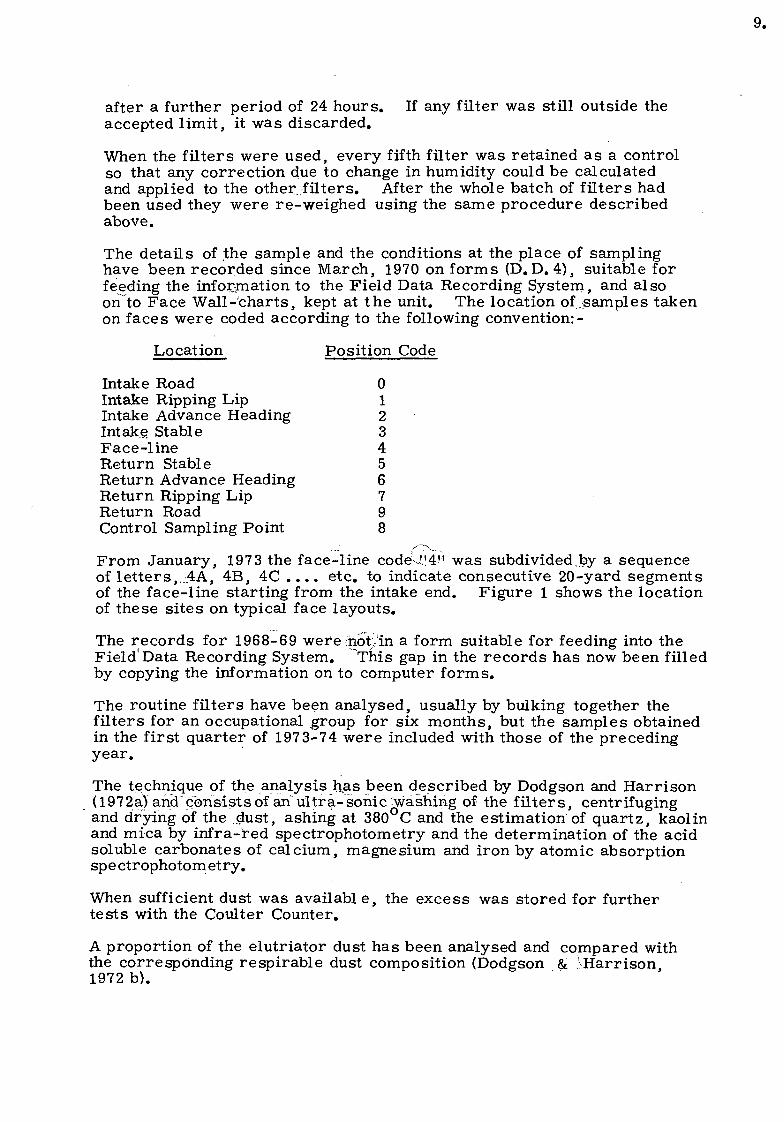
The details of the sample and the conditions at the place of samplinghave been recorded since March, 1970 on forms (D.D. 4), suitable forfeeding the information to the Field Data Recording System, and alsoon~to Face Wall-charts, kept at the unit. The location of..-samples takenon faces were coded according to the following convention: -
Location Position Code
Intake Road 0Intake Ripping Lip 1Intake Advance Heading 2Intake Stable 3Face-line 4Return Stable 5Return Advance Heading 6Return Ripping Lip 7Return Road 9Control Sampling Point 8
From January, 1973 the face-line code!<!4" was subdivided,by a sequenceof letters,...4A, 4B, 4C .... etc. to indicate consecutive 20-yard segmentsof the face-line starting from the intake end. Figure 1 shows the locationof these sites on typical face layouts.
The records for 1968-69 weremotyin a form suitable for feeding into theField'Data Recording System. 'This gap in the records has now been filledby copying the information on to computer forms.
The routine filters have been analysed, usually by bulking together thefilters for an occupational group for six months, but the samples obtainedin the first quarter of 1973-74 were included with those of the precedingyear.
The technique of the analysis has been described by Dodgson and Harrison(1972ajandTconsists of an" ultra- sonic 'washing of the filters, centrifugingand drying of the .dust, ashing at 380 C and the estimation of quartz, kaolinand mica by infra-red spectrophotometry and the determination of the acidsoluble carbonates of calcium, magnesium and iron by atomic absorptionspectrophotometry.
When sufficient dust was available, the excess was stored for furthertests with the Coulter Counter.
A proportion of the elutriator dust has been analysed and compared withthe corresponding respirable dust composition (Dodgson & 'Harrison1972 b).

4. ENVIRONMENTAL OBSERVATIONS
4. 1 Coal faces
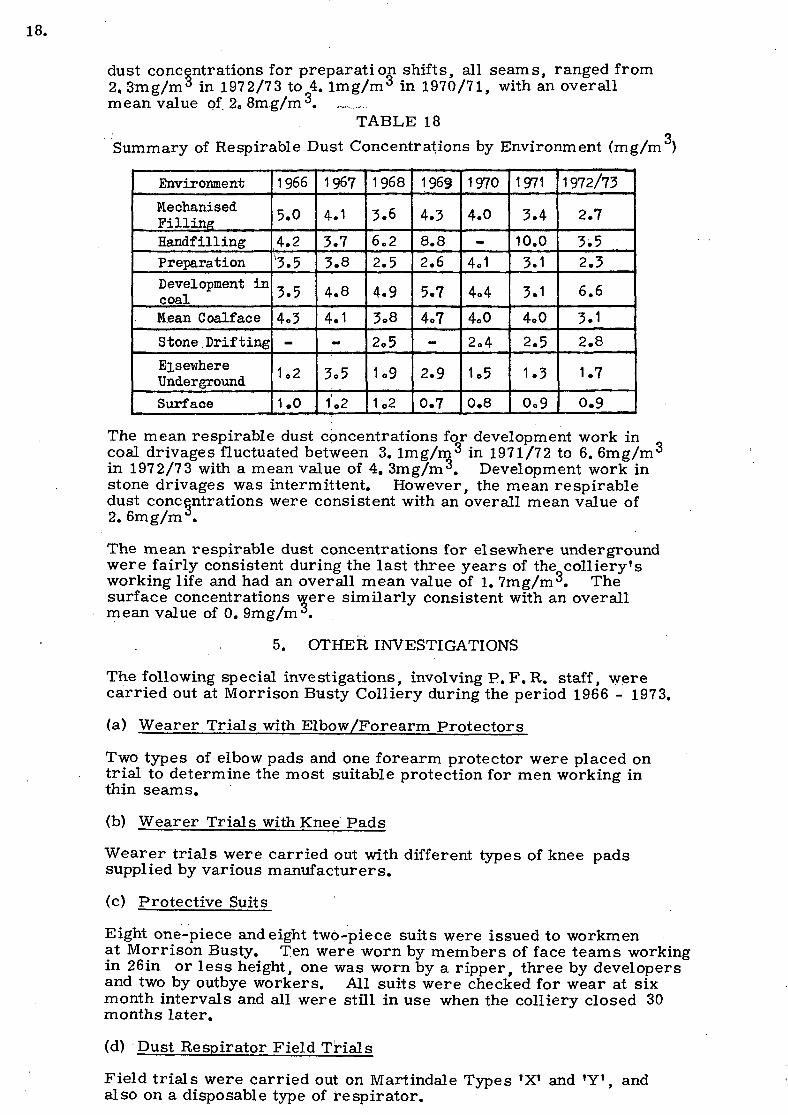
Table 7 (at,.end of report) lists the mean respirable dust concentrationduring coal-'getting operations for each face site at which samplingtook place. From 1966 to 1970 face mean concentrations were calcu-lated on the basis of the number of samples taken, but for the facesin production from 1970 onwards, a man-weighted basis to take accountof the distribution of men in the face occupational groups has been used.In general, there was little.difference between the values obtained by thetwo methods of calculating-the face mean concentrations (Bradley, Gibbon.& . Thomas, 1972).
4. 1. 1 Harvey Seam s^;'All {faces in the Harvey Seam were power-loadedeither by N. C. B. ;scraper box or by plough. Face mean respirable dustconcentrations ranged from 1. 9mg/m3 for the N22 face to 6. 8mg/m3 forthe 5.th West face. The highest site mean concentration (4. 3mg/m3)occurred at return advance headings (site 6). In general- the mean concen-trations for plough faces tended to be lower than those for scraper boxfaces.
4.1. 2 Busty Seam Of the 21 faces in the Busty Seam that were in pro-'.:,duction during the review period, three BQ6, BQ12, BQ25 used both haridp..,filling and power-loading at different periods, but there were no dust meas-urements on BQ12 during its period of hand filling. Concentrations on BQ6and BQ25 were notably higher during hand filling, compared with mechanisedmining.
qFor the 11 hand filled faces the overall face mean concentration was 7. 2mg/mwith the dustier faces in the Charley North District. Those faces had anaverage concentration of 9. Img/m^ compared with 4. 7mg/m3 and 4. 6mg/m3
for the 3rd West and 5th West districts respectively. The highest site meanconcentrations were at the return roadheads (site 7) where four faces had ....concentrations in excess of 10. Omg/m3. The overall site mean concentra-tion was 8. 9mg/m3.
The face mean respirable dust concentrations on the 10 power loaded faces werealso higher in the Charley North District and ranged from 3. 5mg/m3 forBQ4 face to 7. 4mg/m3 for both BQl and BQ2 faces. The two faces in the 33rd West District, BQ12 and BQ13, had face mean concentrations of 3. 2mg/niand 3. lmg/m3 respectively. • The highest site mean concentration (8. 3mg/m3)occurred at return advance headings in Charley North District.
One bord and pillar unit was also worked.
The results obtained for respirable dust concentrations'in. the -Busty Seamshow that the faces in the Charley North District were "dustier than thosein the two other districts and that the dust suppression methods appearedless effective in Charley North District.
4. 1. 3 Brockwell Seam Production ceased in th.e Brockwell Seam at theend of 1971. All the faces sampled were power-loaded except for S17face which was hand filled. This face had a mean respirable dust concen-tration of 3. 5mg/m3 for only three samples.
The face mean respirable dust concentrations for mechanised faces rangedfrom 1. 2mg/m3 for the S19 face to 6. 4mg/m3 for the Sll face. The meanconcentration for all the faces was 3. 2mg/m3 with the return roadheads(site 7) having the highest mean value at 4. Omg/m3.
11.
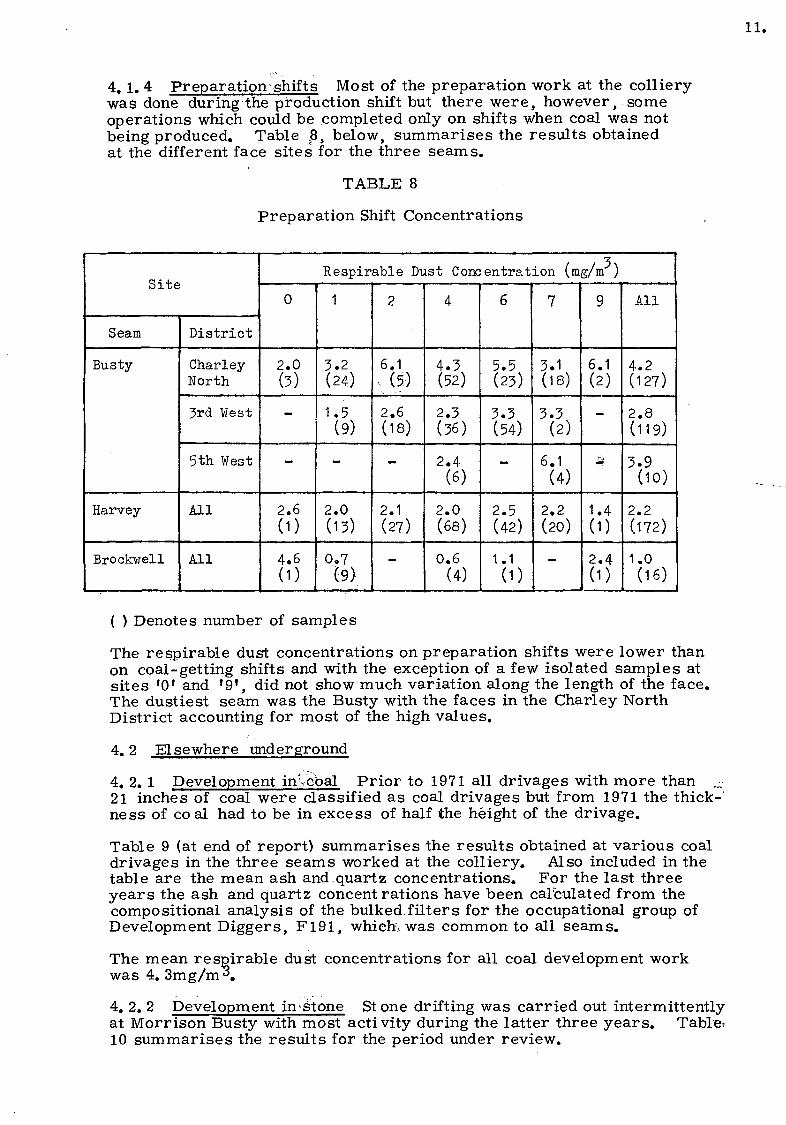
4. 1. 4 Preparation shifts Most of the preparation work at the collierywas done during the production shift but there were, however, someoperations which could be completed only on shifts when coal was notbeing produced. Table .8, below, summarises the results obtainedat the different face sites for the three seams.
TABLE 8
Preparation Shift Concentrations
Site
Seam
Busty
Harvey
Brockwell
District
CharleyNorth
3rd West
5th West
All
All
Respiratde Dust Concentration (mg/m )
0
2.0(3)
^
w
2.6(D
4.6(D
1
3.2(24)
1.5(9)_
2.0(13)
0.7(9)
2
6.1(5)
2.6(18)
M
2.1(27)_
4
4.3(52)
2.3(36)
2.4(6)
2.0(68)
0.6(4)
6
5.5(23)
3.3(54)
M
2.5(42)
1.1(D
7
3.1(18)
3.3(2)
6.1(4)
2.2(20)_
9
6.1(2)_
»
1.4(D
2.4(D
All
4.2(127)
2.8(119)
3.9(10)
2.2(172)
1.0(16)
( ) Denotes number of samples
The respirable dust concentrations on preparation shifts were lower thanon coal-getting shifts and with the exception of a few isolated samples atsites '0' and !9', did not show much variation along the length of the face.The dustiest seam was the Busty with the faces in the Charley NorthDistrict accounting for most of the high values.
4.2 Elsewhere underground
4. 2. 1 Development inkcbal Prior to 1971 all drivages with more than ,,,v21 inches of coal were classified as coal drivages but from 1971 the thick-ness of co al had to be in excess of half the height of the drivage.
Table 9 (at end of report) summarises the results obtained at various coaldrivages in the three seams worked at the colliery. Also included in thetable are the mean ash and.quartz concentrations. For the last threeyears the ash and quartz concentrations have been calculated from thecompositional analysis of the bulked filters for the occupational group ofDevelopment Diggers, F191, whieh\ was common to all seams.
The mean respirable dust concentrations for all coal development workwas 4. Smg/m^.
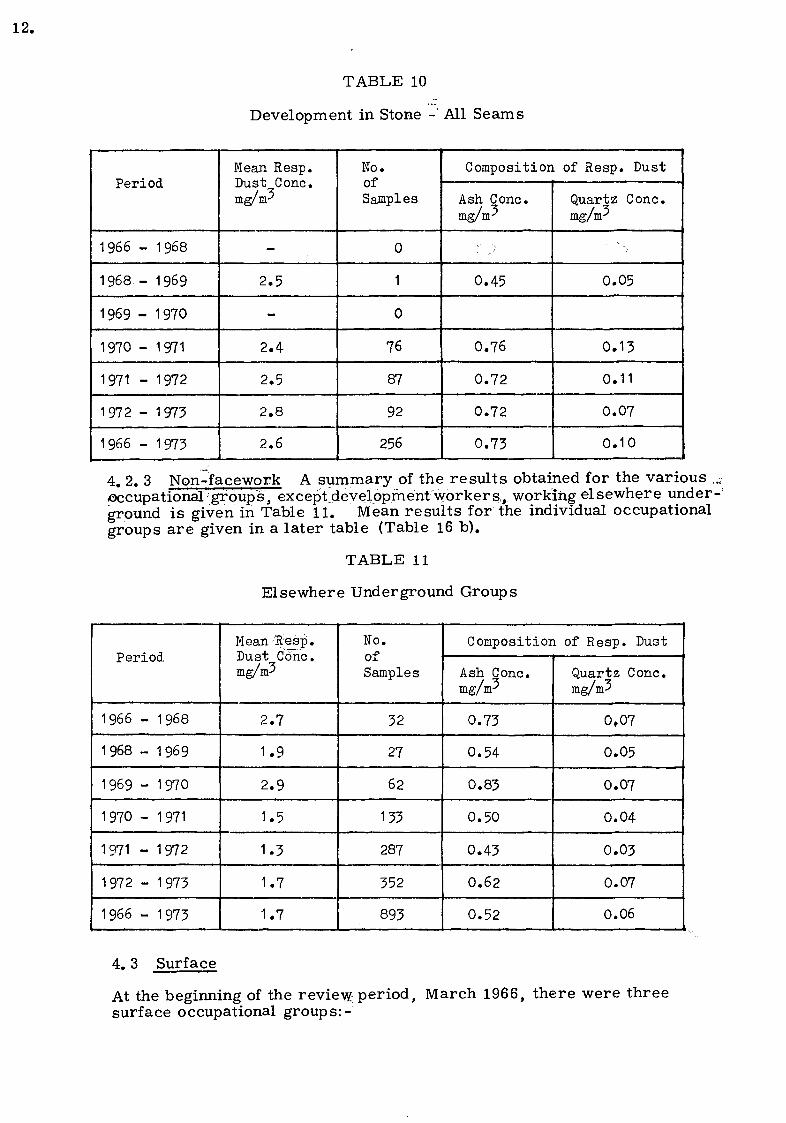
4. 2. 2 Development in'Stone St one drifting was carried out intermittentlyat Morrison Busty with most activity during the latter three years. Table-10 summarises the results for the period under review.
12.
TABLE 10
Development in Stone - All Seams
Period
1966 - 1968
1968 - 1969
1969 - 1970
1970 - 1971
1971 - 1972
1 972 - 1 973
1966 - 1973
Mean Resp.Dust Cone.mg/m^
-
2.5
-
2.4
2.5
2.8
2.6
No.ofSamples
0
1
0
76
87
92
256
Composition of Resp. Dust
Ash Cone.mg/nr
:~ „>
0.45
0.76
0.72
0.72
0.73
Quartz Cone.mg/m^
' " " ;•>
0.05
0.13
0.11
0.07
0.10
4. 2. 3 Non-facewor.k A summary of the results obtained for the various ..^cupational groups, except.developmentrworkers,, working elsewhere under-ground is given in Table 11. Mean results for the individual occupationalgroups are given in a later table (Table 16 b).
TABLE 11
Elsewhere Underground Groups
Period
1966 - 1968
1968 - 1969
1969 - 1970
1970 - 1971
1971 - 1972
1972 - 1973
1966 - 1973
Mean-Rasp.Dust Cone.mg/m^
2.7
1.9
2.9
1.5
1.3
1.7
1.7
No.ofSamples
32
27
62
133
287
352
893
Composition of Resp. Dust
Ash Cone.mg/nr
0.73
0.54
0.83
0.50
0.43
0.62
0.52
Quartz Cone.mg/m^
0,07
0.05
0.07
0.04
0.03
0.07
0.06
4.3 Surface
At the beginning of the review period, March 1966, there were threesurface occupational groups:-

13.
511 Washery Attendants (including waggonmen)
512 Heap stead Attendants
SO Others
During the last year that the colliery was in production, occupationalgroup 'S12' was closed and the men included with the 'SO1 group and anew occupational group, S13, was opened to cover Welders and Burners.
Table 12 gives a summary of the respirable dust concentrations forSurface Workers.
TABLE 12
Surface Occupational Groups
Period
1966 - 1968
1968 - 1969
1969 - 1970
1970 - 1971
1971 - 1972
1972 - 1973
1966 - 1973
Mean Resp.Dust- Cone.mg/nr
1.1
1.2
05-7
0.8
0.9
0.9
0.9
No.ofSamples
6
13
24
20
76
123
262
Composition of Resp. Dust
Ash Cone.mg/nK
0.26
0.15
0.11
0.09
0.15
0.23
0.16
Quartz Cone.mg/nr
'•"•n.a.;
0.02
0.01
0.01
0,01
0.01
0.01
n. a. not available.4. 4 Total .dust concentrations
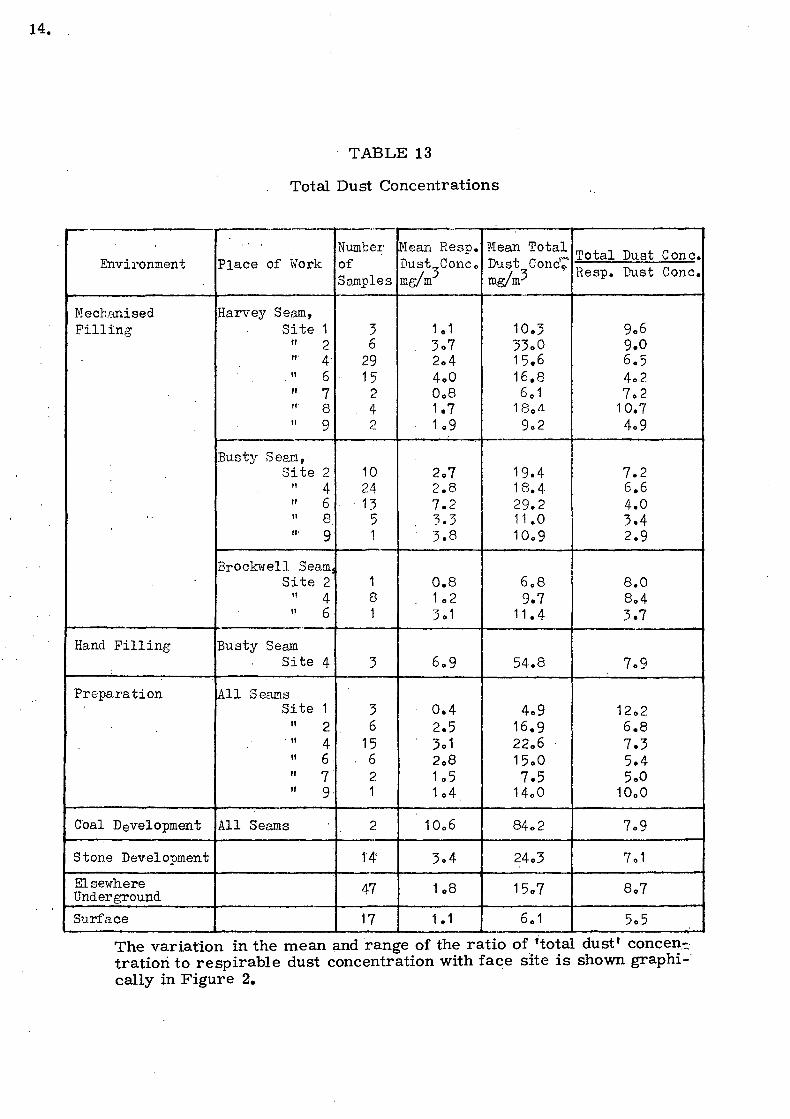
Because of increased interest in a possible association between dust ex-posure and bronchitis (Rae, Walker „&, Attfield, 1971), 'total dust'determinations for most occupational groups have been made on a routinebasis at Morrison Busty since 1971.
'Total dust' (i> g. / the total amount of dust entering the sampling instrument)concentrations were obtained by washing out the elutriator of the M.R..E.,..Dust Sampler with a weak soap solution and recovering the dust on a mem-brane filter. After drying, the weight of elutriator dust was added to thecorresponding weight of respirable dust and the concentration of 'totaldust' calculated in the usual manner.
The mean 'total dust' concentrations together with the corresponding meanrespirable dust concentrations for the various environments are given inTable 13.
14.
TABLE 13
Total Dust Concentrations
Environment
MechanisedFilling
Hand Pilling
Preparation
Coal Development
Stone Development
ElsewhereUnderground
Surface
Place of Work
Harvey Seam,Site 1n 2
"• 46
" 7. '«• 8" 9
Busty Seam,Site 2" 4'" 6
8,"' 9
Brockwell Seam,Site 2" 4
6
Busty SeamSite 4
All SeamsSite 1„ 2
" 4" 6" 7ii 9
All Seams
NumberofSamples
162915242
1024
• 135i
181
3
3615
. 621
2
14
47
17
Kean Resp.Dust Cone cmg/m
1.13.72o44oO0081.71.9
2.72.87.23.3
' 3.8
0.81,23.1
6.9
0.42.53.12o81.51.4.
10o6
3.4
1.8
1.1
Mean TotalDust Conc7mg/m-'
10.333.015.616.86.118,49.2
19.418.429.211.010o9
6089.7
11.4
54.8
4.916.922.615.07.514oO
84.2
24.3
15.7
6.1
Total Dust Cone.Resp. Dust Cone.
9.69.06.54o27.210.74.9
7.26.64.03.42.9
8.08.43.7
7.9
12.26.87.35.45.010.0
7.9
7.1
8.7
5.5
The variation in the mean and range of the ratio of 'total dust' concen-tration to respirable dust concentration with face site is shown graphi-cally in Figure 2.

15.
For face samples, there was a tendency for the higher values of the'total1 to respirable ratio to occur at the intake ends of faces.
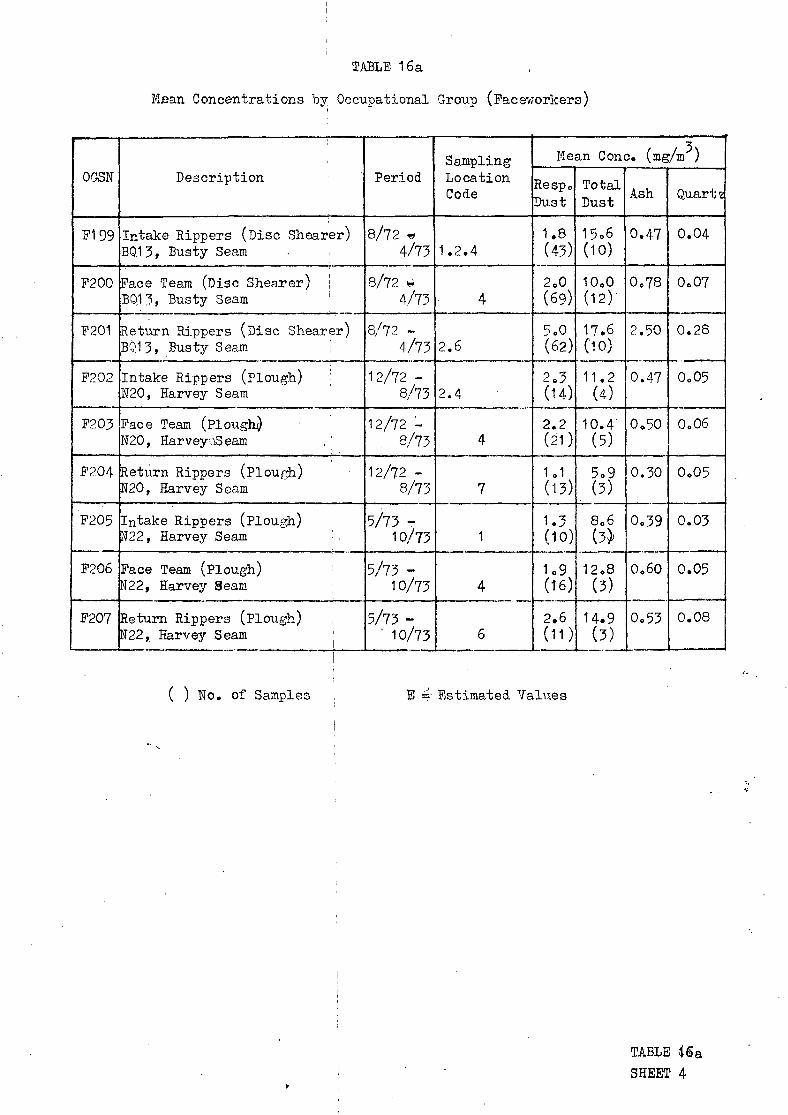
The 'total dust' concentrations for various occupational groups areincluded in Table 16 (at end of report). These values have been Calculatedby applying the mean ratio of total dust obtained from the paired resultsfor an occupational group to the mean respirable dust concentrationcalculated from all the samples taken in that particular group. For anyoccupational group that was not sampled an estimated 'total dust'concentration was obtained by comparison with similar groups.
The method of applying total/respirable ratios to groups not directlysampled or where there are only a few results is the subject of aTechnical Memorandum shortly to be issued (Annis & Hadden, 1976).
On a colliery basis, the total dust concentrations at Morrison Bustywere about seven times the respirable concentrations.
4. 5 Composition of dust
The compositional analysis of respirable dust was reported on a six-monthly basis until March, 1972 but for the period April, 1972 to theclosure of the colliery in June, 1973 the results were issued as a singlereport (Harrison, 1968-74). The values for 1966-68 were obtainedfrom the samples taken in the gravimetric trial (Hadden & Edwards,1968).
Table 14 (at end of report) gives a summary of the composition of thedust for coal-getting shifts by seam and method of working. In general,the ash content for mechanised filling in the three seams were similar,but for hand filling in/the Busty Seam the percentage ash in sample wasmuch lower. The quartz content was highest in the Harvey Seam, them ean value over the seven year period being 3. 8 per cent, more thanfour times the value of 0. 9 per cent for hand filling in the Busty Seam.It is worth noting that the most predominant non-coal mineral in the air-borne dust was kaolin.
Table 15 (at end of report) summarises the compositional analysis bygeneral environment. The mean ash content was highest for samplesobtained elsewhere underground (31.0%) and lowest for surface samples(19. 7%). The highest quartz content was found in samples from devel-opment in coal, the mean value being 4. 5 perceent.
During the .period April, 1972 to July, 1973 elutriator dust samples fromeigth occupational groups were matched with their corresponding respirabledust samples. The composition of the respirable and elutriator bulksamples was then determined using the routine method of analysis.
Table 17 shows the paired results for eight occupational groups.

TABLE 17
Dust Composition of Groups for Respirable and Elutriator Samples
Occupational Group
F148Face StonemenHarvey Seam
F191 (Stone)Diggers (Development)All Seams
F191 (Coal)Diggers (Development)All Seams
F196Intake Rippers (Plough)1121 , Harvey Seam
F197Face Team (Plough)N21 , Harvey Seam
F201Return Rippers (Shearer)BQ13, Busty Seam
E84Haulage General WorkersAll Seams
E86Coal TransportAll Seams
TypeofDust
AB
AB
AB
AB
AB
AB
AB
A 'B
io Composition of Dust
Ash
37.436.1
33.050.5
14.314.5
28.835.8
39.542.4
64.750.1
38.233.9
33.442.5
Quartz
1.61.4
3.01.7
1.00.9
4.22.3
1.41.9
6.23.1
1.11.5
1.32.0
Kaolin
2.53.3
4.73.6
5.34.4
6.26.1
3.7 ;
7.1 .
11.810.3 '
4.0".5.5
5.96.8
Micaj
0.2.9
3.8'3.3
3.82.8
6.96.2
2.87.6
3.95.1
05.4
4.86.6
CQ + Mo
as CO,
1.31.3
9.822.2
1.53.0
5.612.9
7.00.9
1.31.5
0.90.8
10.015.3
Feas CO^
2.01.1
7.96.1
0.71.0
3.73.8
4.21.7
3.54.9
2.7.1.6
2.22.0
A Respirable Dust
B Elutriator Dust
The composition of the respirable and elutriator fractions show quitelarge differences in some groups. Those differences may be due, atleast in part, to differences in the mean size of the particles in thetwo fractions (Dodgson & \ Harri son, 1974).
4. 6 Relationship between control point and face concentrations
The relationship between control point and face concentrations continuedto be studied throughout the review period. In April, 1970 the controlposition was changed from 25 yards back in return roads to 70m, asit was con sidered that atCthe new position the airborne dust cloudwould be more homogeneous across the roadway and the instrumentsafe from shotfiring.
As can be seen from Table 7 (at enol of report), the ratio of control

17.
point concentration to face concentration ranged from 0. 52 for theBQ6 face to 1. 72 for the Si8 face.
The ratio of the mean concentration of all samples taken at the controlpoint on the coal-getting shifts to the mean of all the face samplesexcluding preparation and development work, was 1. 03, a value lowerthan the 1. 4 used in the Interim Standard Study (Jacobsen, Rae &Walton, 1969).
4. 7 Summary of results
4. 7. 1 By Occupational Group Tables I6a, b and c (at end of report)list the mean values for respirable dust, total dust, ash and quartzconcentrations for all face; elsewhere underground and surfaceoccupational groups.
The highest mean respirable dust concentration for faceworkers was9. 8mg/m3 for Diggers (F63) on hand filled faces in the Charley Northdistrict of the Busty Seam. The mean ash and quartz concentrationsfor this occupational group were 0. 92mg/m3 and 0. 05mg/m3 respectively.
For elsewhere underground workers the occupational group exposed 3to the highest measured mean respirable dust concentration (4. 7mg/m )was Outbye Stbnemen (E53) in the Busty Seam. However, the unsampledgroup, Instructors and Trainers (E75), Busty Seam was given anestimated concentration of 5. 8mg/m3 because the group worked in adevelopment district in the Busty Seam (Charley North).
In general, ash and quartz concentrations for the elsewhere under-ground groups were lower than those for the face groups.
The mean respirable dust concentrations for surface occupational groupswere low and ranged from 0. 4mg/m3 to 1. 3mg/m3. The ash and quartzconcentrations were correspondingly low.
4.7. 2 By General Environment Table 18, overleaf shows the annualmean respirable dust concentrations for the various general environments,whilst Table I9((at end of report) gives the mean concentrations ofrespirable dust, total dust, ash and quartz, together with the meancomposition of the respirable dust by the broad classes of environmentfor the whole of Phase II of the research. Similar results for Phase Iare given for comparison. -
During the review period the mean respirable dust concentration forcoal-getting operations on mechanised faces was highest for facesin the BtBty Seam, especially in Charley North district. The annualmean value for Busty faces ranged from 3. lmg/m3 in 1972/73 to6.4mg/m3 in 1969/70.
The overall mean respirable dust concentrations for mechani^ed-faees-in the Harvey and Brockwell Seams were similar at 2. 6mg/m^ and 2. 5mg/m3
respectively.
The mean respirable dust concentrations for coal-getting on hand filledfaces in the Busty Seam were much higher and ranged from 3. 5mg/m3
in 1972/73 to 10. Omg/m3 in 1971/72 with a mean value of 8. lmg/m3.
The mean dust concentrations measured on preparation shifts wereusually lower than those on coal-getting shifts in individual seams, butthe preparation shift concentrations in.the Busty Seam were generallyhigher than the concentrations on coal-getting or preparation shiftsin the other seams. During the review period the mean respirable
18.
dust concentrations for preparation shifts, all seams, ranged from2, 3mg/m3 in 1972/73 to 4. lmg/m3 in 1970/71, with an overallmean value of. 2. 8mg/m3.
TABLE 183Summary of Respirable Dust Concentrations by Environment (mg/m )
Environment
MechanisedPillingHandfillingPreparationDevelopment in_ __n
coalRean Coalface
Stone .Drifting
ElsewhereUnderground
Surface
1966
5.0
4.2V3.5
3.5
4.3
-1.2
1.0
1967
4.1
3.73.8
4.8
4.1mm
3o5
io2
1968
3.6
6.22.5
4.9
3o8
2o5
1.9
1o2
1969
4.3
8.82.6
5.7
4o7
-2.9
0.7
1970
4.0
-4.1
4o4
4oO
2o4
1.5
0.8
1971
3.4
10.03.1
3.1
4oO
2.5
1.3
Oo9
1972/73
2.7
3.52.3
6.6
3.12.8
1.7
0.9
The mean respirable dust concentrations for development work incoal drivages fluctuated between 3. lmg/m3 in 1971/72 to 6. 6mg/m3
in 1972/73 with a mean value of 4. 3mg/m3. Development work instone drivages was intermittent. However, the mean respirabledust concentrations were consistent with an overall mean value of2. Bmg/m6.
The mean respirable dust concentrations for elsewhere undergroundwere fairly consistent during the last three years of the colliery'sworking life and had an overall mean value of 1. 7mg/m3. Thesurface concentrations were similarly consistent with an overallmean value of 0. 9mg/m3.
5. OTHER INVESTIGATIONS
The following special investigations, involving P. F.R. staff, werecarried out at Morrison Busty Colliery during the period 1966 - 1973.
(a) Wearer Trials with Elbow/Forearm Protectors
Two types of elbow pads and one forearm protector were placed ontrial to determine the most suitable protection for men working inthin seams.
(b) Wearer Trials with Knee Pads
Wearer trials were carried put with different types of knee padssupplied by various manufacturers.
(c) Protective Suits
Eight one-piece and eight two-piece suits were issued to workmenat Morrison Busty. Ten were worn by members of face teams workingin 26in or less height, one was worn by a ripper, three by developersand two by outbye workers. All suits were checked for wear at sixmonth intervals and all were still in use when the colliery closed 30months later.
(d) Dust Respirator Field Trials
Field trials were carried out on Martindale Types !X' and 'Y', andalso on a disposable type of respirator.

REFERENCES-
Annis, R. & Hadden, G. G. (1976) ; Total?dust measurement
(to be published).
Ashford, J. R. & Smith, P. H. (1956) The allocation'of sampling
effort in environmental surveys. N. C.B. Report No. SC370/ER/28
Bradley, A. & Gibbon, E. (1971) Environmental conditions at
Morrison Busty Colliery, 1968. Institute of Occupational Medicine
Report No. TM/71/18
Bradley, A. & Gibbon, E. (1972) Environmental conditions at
Morrison Busty Colliery, 1969. Institute of Occupational Medicine
Report No. TM/72/15
Bradley, A. , Gibbon, E. & Thomas, P. (1972) Environmental
conditions at Morrison Busty Colliery, 1970. Institute of Occupational
Medicine Report No. TM/72/25
Bradley, A. , Gibbon, E. & Annis, R. (1973). Environmental
conditions at Morrison Busty Colliery, 1971. Institute of Occupational
Medicine Report No. TM/73/6
Bradley, A. & Annis, R. (1974) Environmental conditions at Morrison
Busty Colliery, April 1972 - June 1973. Institute of OccupationalA
Medicine Repoort No. TM/74/6
Burns, J. (1973) Report on the 5th and Final Radiological Survey\ •/ ~"
at Morrison Busty Colliery (1970 - 1973). Institute of Occupational
Medicine Report No. TM/73/16
Dodgson, J. , Harrison, G. E. & ThojEpe, H. L. (1970) An Addendum
to the Summary Report on Environmental Measurement at Morrison
Busty Colliery. N. C. B. Report No. PFR/ER/321/Ad
Dodgson, J. & Harrison, G. E. (197£a) The Composition of the
Respirable Dust in some British Coalmines. Institute of Occupational
Medicine Report No. TM/72/3
Dodgson, J. & Harri son, G. E. (1972b) Compositional Analysis of
Elutriator Dust Samples. Institute of Occupational Medicine
File No. BP 31059

REFERENCES (Contd.)
Edwards, J. & Annis, R. (1968) Summary Report on Environmental
Measurements at Morrison Busty Colliery, 1954 - 1967. N. C. B. t,
Report No. PFR/ER/321
Edwards, J. & Hadden, G. G. (1968) Report on Gravimetric Sampling
Trial at Morrison Busty Colliery, April 1967 to April 1968. N. C. B.
Report No. PFR/ER/320
Edwards, J. & Annis, R. (1970) Environmental Conditions at Morrison
Busty Colliery, March 1966 to August 1968 (Gravimetric dust
concentrations). Institute of Occupational Medicine Report No. TM/70/6
Jacobsenf M., Rae, S. & Walton, W.H. (1969) The relationship between
dust and pneumoconiosis as a basis of a gravimetric standard for air-
borne dust underground. N. C. B. Report No. ISM/P(69)11
National Coal Board (1965) The Sampling of Airborne Bust for the Testing
of 'Approved Dust Conditions1. N. C. B. Handbook F 3837
National Coal Board (1969) Approved Conditions for Airborne Dust.
Standards and Procedures for Sampling. F4040
National Coal Board, Mining Research and Development Establishment (1971).
M. R. E. Gravimetric Dust Sampler, Type 113A. Instructions for Operation
and Maintenance. MRDE Handbook No. 4
Bae,, S. (1971) Report on the 4th Radiological Survey at Morrison
Busty Colliery, March - April 1970. Institute of Occupational
Medicine Report No. PM/71/3
Rae, S. , Walker, D.D. & Attfield, M.D. (1971) Chronic Bronchitis
and Dust Exposure in British Coalmines. Inhaled Particles III,
Vol. 2. Ed. W.H. Walton

TABLE 2
Details of Production Faces
April 1966-June 1973
Seam
Harvey
Busty
District
Drift
3rd West
Charley North
5th West
Fac6i-
7th East (N7)5th West8th East (N8)Main South (N11)
N12N9N13N10N14N21N20N22
BQ2BQ4BQ3BQ1TQ2TQ1BQ26BQ27BQ25
BQ6BQ5South Pillars
BQ21BQ22BQ24
- "Periodf Worked
2/64- 4/678/64- 1/67
11/65-8/685/66- 3/68
1/67- 2/682/68- 5/692/68-5/709/69- 9/705/70- 8/72
12/71- 3/7312/72- 8/735/73-10/73
1/66- 7/6710/66- 9/679/67- 3/683/68- 6/687/68- 4/69/9/68- 2/69
11/68- 7/692/69- 6/694/69- 5/695/69- 9/69
10/70- 9/711/70- 6/71
10/71- 4/72
10/66-11/672/67- 5/685/69- 7/69
Type of Face
D.U. Longwall advancingS.U. Longwall advancingDJJ. Longwall advancingSJJ. Longwall advancing(Training Face)S.U. Longwall advancingDJJ. Longwall advancingDJJ. Longwall advancingD.U. Longwall advancingD.U. Lonawall advancinaSJJ. Longwall advancingS.U. Longwall advancingS.U. Longwall advancing
S.U. Longwall advancingS.U. Longwall advancingS.U. Longwall advancingSJJ. Longwall advancingS.U. Longwall advancingS.U. Longwall advancingS.U. Longwall advancingS.U. Longwall advancingS.U. Longwall advancingS.U. Longwall advancingS.U. Longwall advancingSJJ. Longwall advancingS.U. Longwall advancing
S.U. Longwall advancingS.U. Longwall advancingS.U. Longnall advancing
Method of Workingand Cycle of Operations
N.C.B. Scraper Box F.F.P.O)Power loaded by Plough F.F.P.N.C.B. Scraper Box F.F.P.N.C.B. Scraper Box F.F.P.
Power loaded by Plough F.F.P.N.C.B. Scraper Box ^F.F.P.N.C.B. Scraper Box F.F.F.P.N.C.B. Scraper Box F.F.F.P.N.C.B. Scraoer Box F.F.F.P.Power loaded by Reischaken Plough, F.F.P.Power loaded by Reischaken Plough, F.F.P.Power loaded by Reischaken Plough, F.F.P.
Power loaded by Plough F.P.F.P.Power loaded by Plough F.P.F«P.Power loaded by Plough F.P.F.P.Power loaded by Plough F.P.F.P.Hand-filling, pneumatic picks. F.F.P.Power loaded by Reischaken Plough, F.F.P.Handfilled, pneumatic picks, F.F.P.Handfilled, pneumatic picks, F.P.P.Handfilled, pneumatic picks, F.F.P.Power loaded by Reischaken Plough, F.F.P.Power loaded by Reischaken Plough, F.P.P.Power loaded by Reischaken Plough, F.F.P.P.Machine cut, hand-filled, Composite
HandfilledHandfilledHandfilled, pneumatic picks F.F.P.
Mean Air ,Quantity (c^/s)
0.90.91.50.9
4.11.41.62.31.81.82.42.4
1.31.22.71.52.62.92.02.32.02.04.55.06.0
1.53.52.0
Mean DryBulb Temp. (°C)
18.019.018.017.0
18.017.021.020.019 J19.016.116.1
17.427.027.018.017.020.018.018.019.019.021.123.315.0
17.017.218.0
Mean Rel.Humidity (56)
. 82 •-858579
7885908385849292
88848384848087908587899181
818583
(1) F = Filling Shift Pc.» Preparation Shift

TABLE 2
Details of Production Faces
April 1966-June 1973
Seam
Busty
Brock-well
.District
3rd West
3rd East
Main South
3rd West
Face
BQ7BQ11BQ12
BQ9BQ10BQ13
Flats
West (S11)S13S17S14S15S18S19
No. 2S3
PeriodWorked
2/64-11/687/66-11/689/66-11/677/69-11/694/71- 7/72
11/67- 4/6811/67-4/688/72- 4/73
9/66- 9/67
11/65- 7/6711/65- 9/674/66- 2/672/67- 4/675/68- 3/695/69-11/705/71-12/71
5/65- 8/666/67-11/67
Type of Face
SJJ. Longwall advancingS.U. Longwall advancingS.U. Longwall advancingS.U. Longwall advancingSJJ. Longwall advancingSA Longwall advancingSJJ. Longwall advancingS.U. Longwall advancing
Bord and Pillar
S.U. Longwall advancingJ)JJ2 Longwall advancingS.U. Longwall advancingSJJ. Longwall advancingDJJ. Longwall advancingDJJ. Longwall advancingO.U. Longwall advancing
SJJ. Longwall advancingSJJ. Longwall advancing
Method of Workingand Cycle of Operations
Handfilled, pneumatic picks, F.F.P.Handfilled, pneumatic picks, F.F.P.Handfilled, pneumatic picks, F.F.P.Power loaded by Plough F.F.P.Power loaded by Anderton Shearer F.F.P.Handfilled, pneumatic picks F.F.P.Handfilled, pneumatic picks F.F.P.Power loaded by Shearer F.F.P.
Handfilled, pneumatic picks F.F.P.
N.C.B. Scraper Box F.F.P.P.Handfilled, pneumatic picks F.F.P.P.Handfilled, pneumatic picks F.F.P.N.C.B. Scraper Box . F.F.P.P.N.C.B., Scraper Box F.F.F.P.N.C.B. Scraper Box F.F.F.N.C.B. Scraper Box F.F.F.
Power loaded by PloughN.C.B. Scraper Box
Mean Air ,'Quantity (nrYs)
2.11.41.32.72.21.51.42.0
1.61.20.82.72.42.63.0
4.14.1
Mean DryBulb Temp. (°C)
19.019.020.019.019.418.518.018.3
18.818.020.020.019.019.021.0
17.018.0
Mean Rel.'Humidity (%)
8585858786889077
8585 ...86 .-v*90909184
8184
(2) Both Top and Bottom sections of Seam
m ro—i mr\» ro
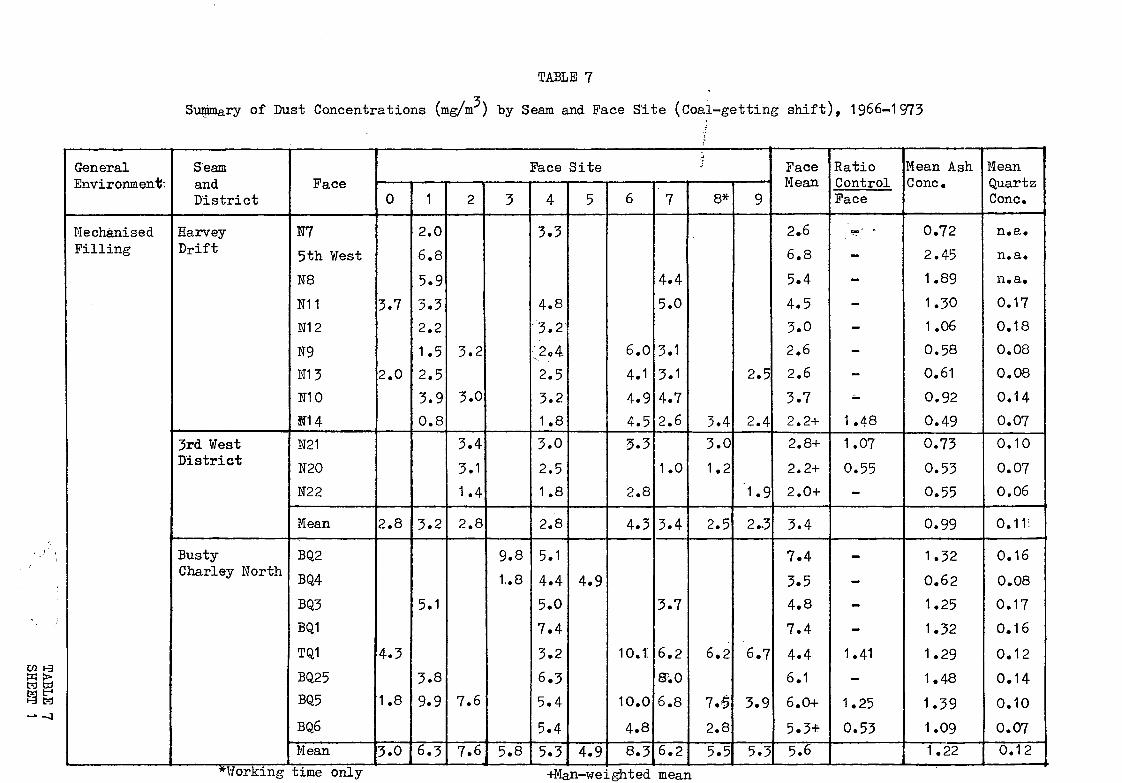
TABLE 7
Summary of Dust Concentrations (mg/m ) by Seam and Pace Site (Coal-getting shift), 1966-1973
GeneralEnvironment:
MechanisedFilling
SeamandDistrict
HarveyDrift
3rd WestDistrict
BustyCharley North
Face
F7
5th West
N8
FI1
N12
N9
N13
moST14
N21
N20
N22
Mean
BQ2
BQ4
BQ3
BQ1
TQ1
BQ25
BQ5
BQ6
Mean
•Face Site :;
0
3.7
2.0
2.8
4.3
1.8
3.0
1
2.0
6.8
5.9
3.32.2
1.5
2.5
3.9
0.8
3.2
5.1
3.8
9.9
6.3
2
3.2
3.0
3.4
3.1
1.4
2.8
7.6
7.6
3
9.8
1..8
5.8
4
3.3
4.8
3.2
;2042.5
3.2
1.8
3.0
2.5
1.8
2.8
5.1
4.4
5.0
7.4
3.2
6.35.4
5.4
5.3
5
4.9
4.9
6
6.0
4.1
4.9
4.55.3
2.8
4.3
10.1:
10.0
4.8
8.3
7
4.4
5.0
3.1
3.1
4.72.6
1.0
3.4
3.7
6.2
ffiO
6.8
6.2
8*
3.43.0
1.2
2.5
6.2
7.6
2.8
5.5
9
2.5
2.4
1.9
2. .3
6.7
3.9
5.3
FaceMean
2.6
6.8
5.4
4.5
3.0
2.6
2.6
3.7
2.2+
2.8+
2.2+
2.0+
3.4
7.4
3.5
4.8
7.4
4.4
6.1
6.0+
5.3+
5.6
RatioControlFace
— • -
-
-
-
-
-
-
-
1.48
1.07
0.55
-
_
-
-
-
1.41-
1.25
0.53
I
Mean AshCone.
0.72
2.45
1.89
1.30
1.06
0.58
0.61
0.92
0.49
0.73
0.53
0.55
0.99
1.32
0.621.25
1.32
1.291.48
1.39
1.091.22
MeanQuartzCone.
n.a.
n.a.
11. a.
0.170.18
0.08
0.08
0.14
0.070.10
0.070.06
0.1 1i
0.16
0.08
0.170.16
0.12
0.14
0.10
0.070.12
^Working time only +Man-weighted mean
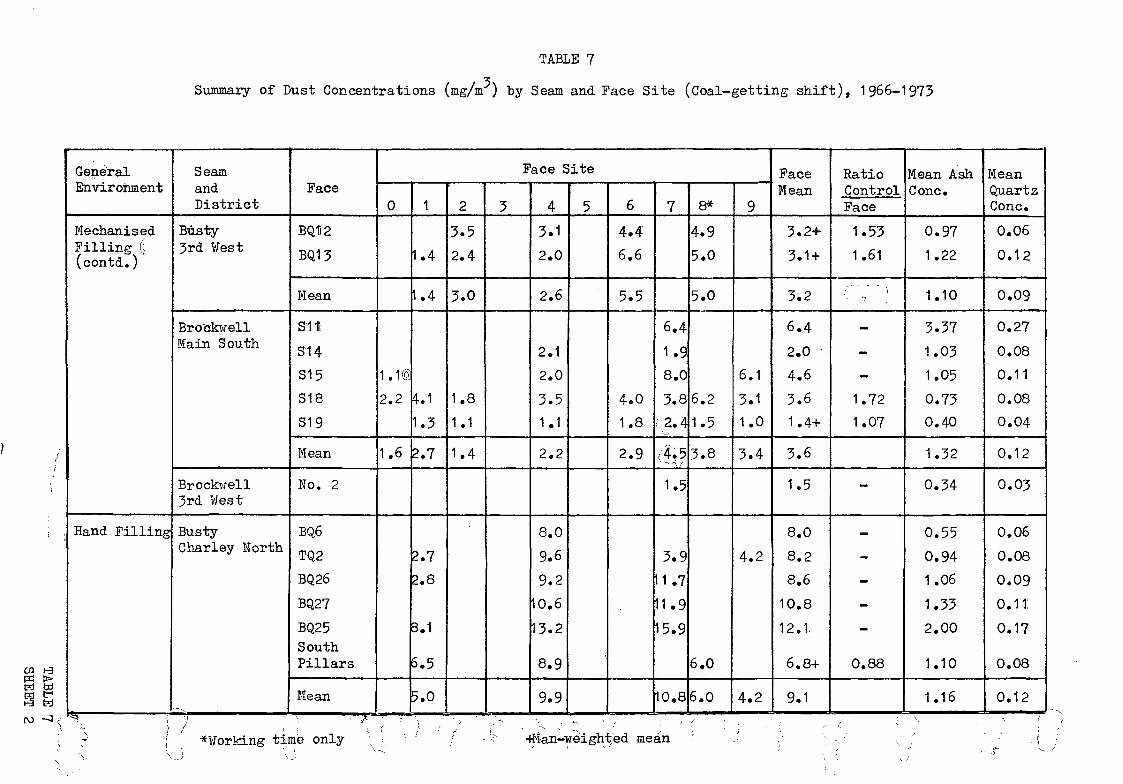
TABLE 7
Summary of Dust Concentrations (mg/m ) by Seam and Face Site (Coal-getting shift), 1966-1973
GeneralEnvironment
MechanisedPilling (((contd.)
Hand Filling
SeamandDistrict
Busty3rd West
BrockwellMain South
Brockwell3rd West
BustyCharley North
Face
BQ12
BQ13
Mean
31 Ti
SI 4
S15
S18
SI 9
Mean
No. 2
BQ6
TQ2
BQ26
BQ27
BQ25SouthPillars
Mean
Face Site
0
1.1(8
2.2
1.6
1
1.4
1.4
4.1
1.3
2.7
2.7
2.8
8.1
6.5
5.0
2
3.5
2.4
3.0
1.8
1.1
1.4
3 4
3.1
2.0
2.6
2.1
2.0
3.5
1.1
2.2
8.0
9.6
9.2
10.6
13.2
8.9
9.9
5 6
4.46.6
5.5
4.0
1.8
2.9
7
6.4
1.98.0
3.8
•2.*
$?
1.5
3.9
1.7
11.9
5.9
10.8
8*
4.9
5.0
5.0
6.2
1.5
3.8
6.0
6.0
9
6.1
3.11.0
3.4
4.2
4.2
FaceMean
3.2+
3.1 +
3.2
6.4
2.0
4.6
3.6
1.4+
3.6
1.5
8.0
8.2
8.6
10.8
12.1.
6.8+
9.1
RatioControlFace
1.53
1.61
-'- -_
—-1.72
1.07
M
_
—-
-
-
0.88
Mean AshCone.
0.97
1.22
1.10
3.37
1.03
1.05
0.73
0.40
1.32
0.34
0.55
0.94
1.06
1.332.00
1.10
1.16
MeanQuartzCone.
0.06
0.12
0.09
0.27
0.08
0.11
0.08
0.04
0.12
0.03
0.06
0.08
0.09
0.11;0.17
0.08
0.12tdro
*¥orking time only •(Man-weighted mean
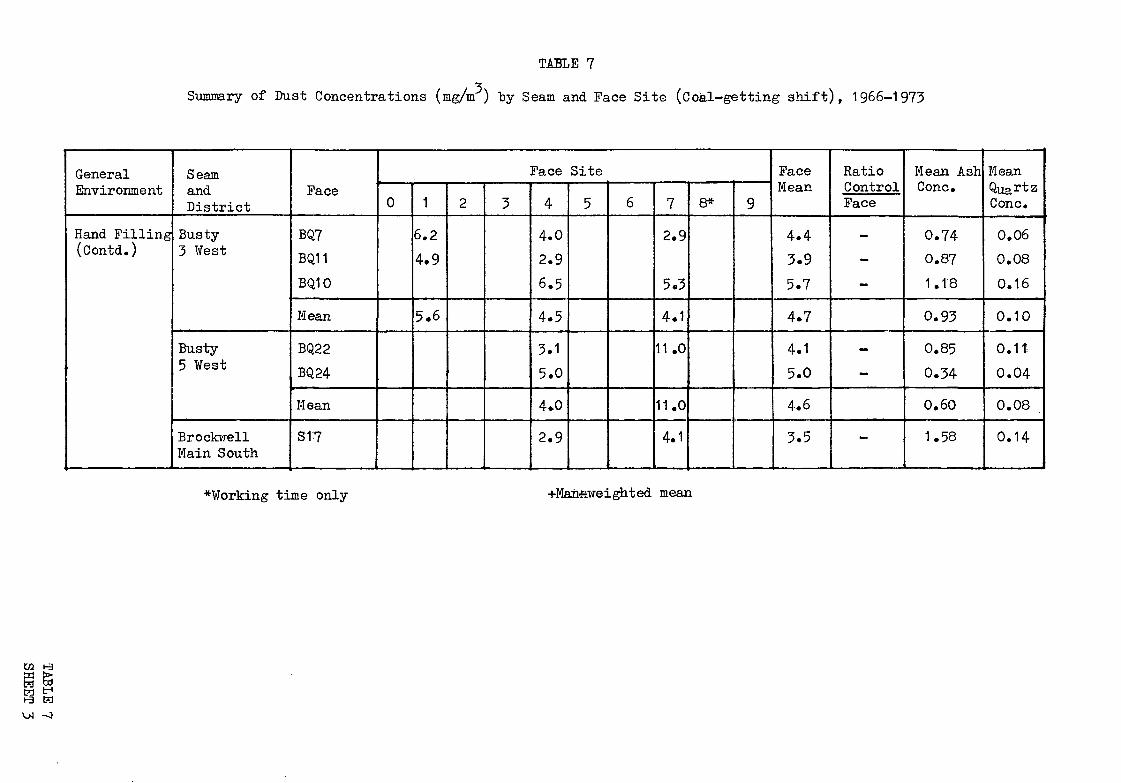
TABLE 7
Summary of Dust Concentrations (mg/m ) "by Seam and Face Site (Coal-getting shift), 1966-1973
GeneralEnvironment
Hand Pilling(Contd.)
SeamandDistrict
Busty3 West
Busty5 West
BrockwellMain South
Face
BQ7
BQ11
BQ10
Mean
BQ22
BQ24
Mean
SI 7
Face Site
0 1
6.2
4.9
5.6
2 3 4
4.0
2.96.5
4.5
3.15.0
4.0
2.9
5 6 7
2.9
5.3
4.1
11 .0
11.0
4.1
8* 9
FaceMean
4.4
3.9
5.7
4.7
4.15.0
4.6
3.5
RatioControlFace
^
-
-
_
-
_
Mean AshCone.
0.74
0.87
1.18
0.93
0.85
0.34
0.60
1.58
MeanQuartzCone.
0.06
0.08
0.16
0.10
0.111
0.04
0.08
0.14
*¥orking time only +Mansweighted mean
CO i-3

TABLE 9
Summary of Results for Development in Coal
S'eam
"Period '
1966 - 1968
1968 - 1969
1969 - 1970
1970 - 1971 +
1971 - 1972+
1972 - 1973+
1 966 - 1 973
^ Harvey
Mean Resp.Dust Cone,mg/m^
:4.3* (9)1.8-
4.4 (3)3.4
4.5 (9)6.1
-
3.1 (29)3.7
8.2 (8).7
4.3 (58)4.6
AshCone.mg/m^
1.61^
0.51
0.96
-
0.89
2.12
1.22
QuartzCone.mg/nK
0.33,
0.06
0.17
-
0.17
0.20
0.19
Busty
Mean Resp.Dust Cone.mg/m5
3.1 (3)1.6
6.1 (4)1.5
6.4 (10)6.5
3.6 (6)1.8
3.2 (27)2.0
2.2 (3).7
3.9 (53)2.2
AshCone.mg/m5
0.43
3.80
1.36
1.13
0.92
0.57
1.37
QuartzCone.*mg/m
0.13
0.40
0.23
0.19
0.17
0.05
0.20
Brookwell
Mean Resp.Dust-,Conc.mg/m
6.0 (2)2.6
4.1 (5)3.2
6.2 (8)6.4
4.9 (9)3.0
5.3 (34)4.3
AshCone.mg/m5
1.17
0.54
1.35
1.54
1.14
QuartzCone.mg/m5
0.1-0
0.04
0.24
0.26
0.16
All
Mean Resp.Dust Cone.mg/m5
4.3 (14)2.0
4.9 (12)2.6
5.7 (27)6.2
4.4 (15)2.6
3.1 (56)3.0
6.6 (11).3
4.3(135)3*8
AshCone.mg/m5
t.33
1.43
1.211
1.38
0.89
1.70
1.32
QuartzCone.mg/m5
0.32
0.13
0.21
0.23
0.17
0.16
0.20
*4.3 - mean resp. dust cone.(9) - No. of samples1.8 - Standard deviation
+See section 4.2.1
tr1td
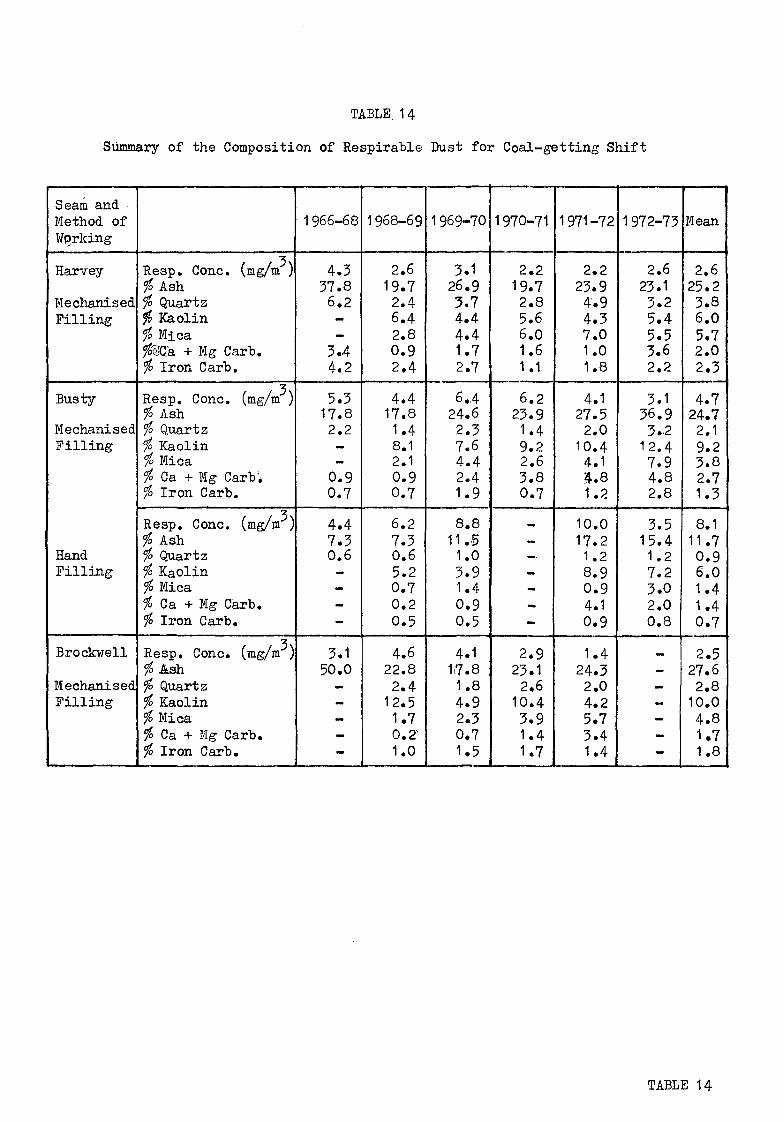
TABLE. 14
Summary of the Composition of Respirable Dust for Coal-getting Shift
Seam andMethod ofWorking
Harvey
MechanisedFilling
Busty
MechanisedPilling
HandFilling
Brockwell
MechanisedFilling
Resp. Cone, (mg/m )% Ash% Quartz% Kaolin% Mica$S/C,a + Mg Garb.% Iron Carb.
•zResp. Cone, (mg/m )% Ash% Quartz% Kaolinfo Micafo Ca + Mg Garb;fo Iron Carb.
Resp. Cone, (mg/m }fo Ashfo Quartzfo Kaolinfo Micafo Ca + Mg Carb.f> Iron Carb.
Resp. Cone, (mg/m )fo Ashfo Quartzfo Kaolinfo Micafo Ca + Mg Carb.fo Iron Carb.
1 966-68
4.337.86.2--
3.44.2
5.317.82.2__
0.90.7
4.47.30.6_
---
3.150.0
——---
1 968-69
2.619.72.46.42.80.92.4
4.417.81.48.12.10.90.7
6.27.30.65.20.70.20.5
4.622.82.4
12.51.70.2'1.0
1 969-70
3.126.93.74.44.41.72.7
6.424.62.37.64.42.41.9
8.811.51.03.91.40.90.5
4.117.81.84.92.30.71.5
1 970-71
2.219.72.85.66.01.6
L_ U1
6.223.91.49.22.63.80.7
»_
_._
---
2.923.12.6
10.43.91.41.7
1971-72
2.223.94.94.37.01.01.8
4.127.52.0
10.44.13.81.2
10.017.21.28.90.94.10.9
1.424.32.04.25.73.41.4
1 972-73
2.623.13.25.45.53.62.2
3.136.93. .2
12.47.94.82.8
3.515.41.27.23.02.00.8
_
——_
---
Mean
2.625.23.86.05.72.02.3
4.724.7
2.19.23.82.71.3
8.111.70.96.01.41.40.7
2.527.62.8
10.04.81.71.8
TABLE 14

TABLE 15
Summary of the Composition of the Dust by General Environment
Environment
C'oal Face
C'oal gettingShifts
Coal Face
Preparation
Developmentin coal
Developmentin stone
Elsewhereund erground
Surface:
Resp. Cone, (mg/m )i> Ash$$2uartz% Kaolin% Micafo Ca + Mg Garb.fo Iron Garb.
•zResp. Cone, (mg/m )fo Ash% Quartz% Kaolin% Mica% Ca + Mg Garb.% Iron Garb.
Resp. Cone, (mg/m )$ Ash% Quartz<f° Kaolin% Mica-% Ca + Mg Garb.% Iron Garb.
Resp. Cone, (mg/m )% Ash$ Quartz'$ Kaolin% Mica$ Ga + Mg Garb.% Iron Garb.
R'esp. Cone, (mg/m )% Ash^ Quartz$ Kaolin<fo Mica^ Ca + Mg Garb.% Iron Garb.
Resp. Cone, (mg/m )# Ash$ Quartz% Kaolin% Mica% Cai + Mg Garb.$ Iron Garb,
1 966-68
4.330.65.0
/ >~\f~\ ^7< 20.7
2.02.6
3.739.96.0
( ?fi 0\ £.<->• w
2.53.2
4.331.07.6
——2.0
3.6
M
—--_
--
2.727.0
2.6/ 1 O ft< 12.9
2.72.3
1.123.5_
-
—--
1 968-69
3.923.52.5
10.53.00.91.6
2.532.14.0
H.94.81.72.3
4.029.22.6
t2.43.80.91.7
2.518.12'.1
10.32.00^220.7
1.928aj22.59.32.64.41.4
1.212.11.42.6
—--
1 969-fO
5.022.22.65.53.41.61.9
2.626.13.25.93.52.52.2
5.7211.33.75.55.30.311.6_
——-
—_
-
2.928.?2.48.92.84.72.0
0.716.4U42.90.1--
1 970-71
4.022.82.37.84.52.71.0
4.126.11.87.63.64.40.5
4.431.55.38.19.64.82.0
2.431.55.38.19v64.82.0
U533.22,7
12.84.66.51.6
0.810.91.03*52.6
—-
1971-72
2.924.72.96.25.43.01.4
3.124'.'t2.47.84.14.31.3
3.128.75.57.116.62.92.4
2.528.65.77.06.82.42.4
1.332.7
2.68.06.57.72.0
0.916.50.92.42.51.21.2
1 972-73
2.828.33.47.66.54.42.4
2.128.73.47.56.55.12.4
6.625.9'2.56.45.65.62.5
2.825.92.56.45.65.62.5
1.736.43.8
10.37.47.22.8
0.929.8
U3:3.62.75. .55.2
Mean
3.625.43.17.94.72.41.8
2.829.53.49.34.83.61.9
4.327.94.58.06.32.82.3
2.626.03.88.65.73.01-.9
1.731.02.79.64.65.42.0
0.919.7U53.91.92.52.5
TABLE 15

TABLE 16a
Mean Concentrations by Occupational Group (Paceworkers)
OGSN
F12
F35
F36
F48
F50
F53
F55
F56
F57
F60
F63
F85
F95
F111
F1112
F117
F1T8
Description
Diggers, Digging Face5th West Busty Seam
Pullers, All DistrictsBusty Seam
Pullers, All Districts;Brockvrell Seam
Face StonemenCharley North, Busty Seam
Face Stonemen5th West, Busty Seam
Face StonemenMain South, Brockwell Seam
Face BeltmenAll Districts, Harvey Seam
Face BeltmenAll Districts, Busty Seam
Face BeltmenAll Districts, Brockwell Seam
ShotfirersAll Districts, All Seams
Diggers, Digging FaceCharley North, .Busty Seam
Belt ExtendersAll Districts, All Seams
Timber DrawersAll Districts, Busty Seam
Timber LeadersAll Districts, All Seams
LinesmenAll Districts, All Seams
Diggers (stenton)All Districts (ex 3w) Brockwell
PuttersAll Districts, Busty Seam
Period
to 1 /72
to 6/72
to 9/67
to 6/72
to 3/68
to 12/71
to 8/72
to 8/72
to 12/71'
to 7/73
to 1 /72
to 6/72
to 6/66
to 6/72
to 6/72
to 1/69
to 8/67
SamplingLocationCode
G 4
'J 4
—
1.2.4.6.7
-
1.2.4.6.7.9
4.9
1.4
4.9
0.9
4
0
0.9
0.9
0.9
0
0
Mean Cone, (mg/m )
Resp.Dust
4.6(20)
2.8(15)
2.2(E)
6.5(I8t)
6.1(4)
2.6(408)
2.1(96)
3.8(13)
1.5(71)
3.2(24)
9.8(39)
2.6(2)
1.4(E)
3.0(14)
1.0(5)
2.8(5)
2.6(E)
TotalDust
61.0(E)
30.1(E)
15.8(E)
32.6(3)
30.6(E)
17.6(3)
23.6(3)
33.0(E)
19.6(3)
18.2(3)
.109i9(E)
15.1(E)
15.7(E)
1.5.0(E)
5.5(E)
14.6(E)
13.6(E)
A^h
0.34
1.36
0.62
2.03
2.07
0.54
0.46
0.73
0.34
0..56
0.92
0.31
0.43
0.91
0.22
Oi43
0.90
Quartz
0.03
0.17
0,05
0.22
0.30 -
0.06
0.07
0.03
0.03
0.12
0.05
0.03
0.05
0.17
0.02
0.03
0.08
( ) No. of Samples E «• Estimated Values TABLE 16a
SHEET 1
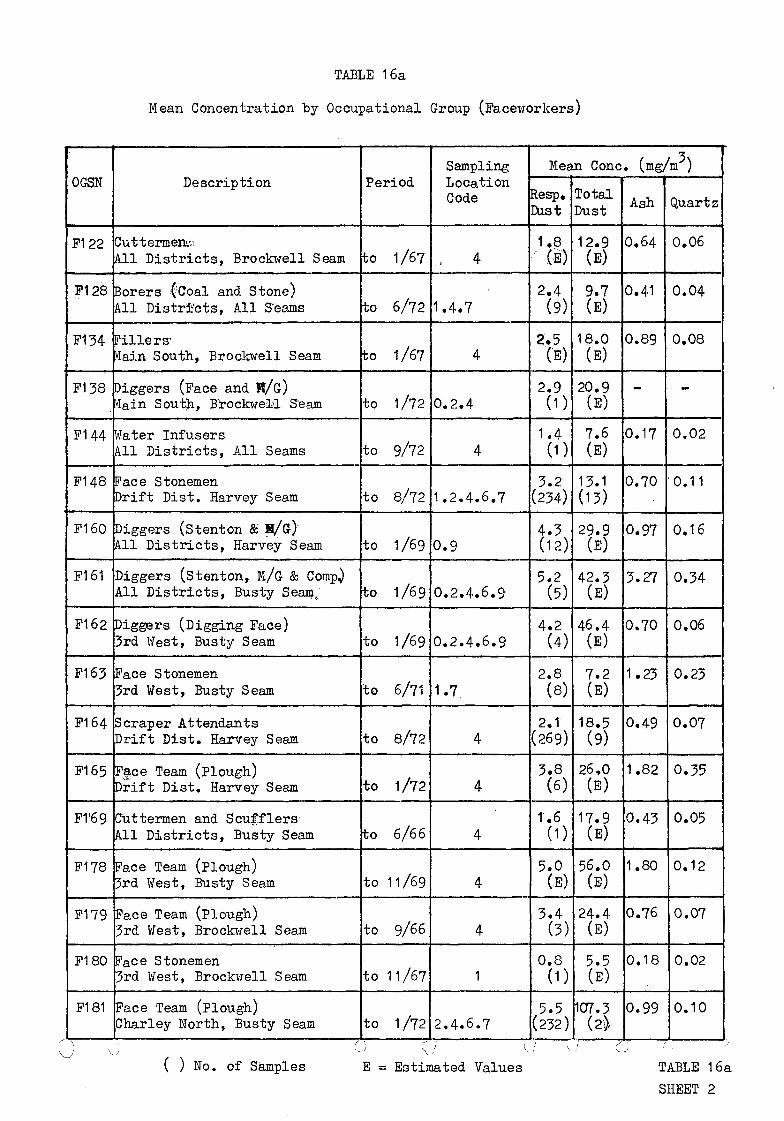
TABLE 16a
Mean Concentration by Occupational Group (Faceiirorkers)
OGSN
F122
F128
F134
F138
F144
F148
F160
F161
F162
F163
F164
F165
FT69
F178
F179
F180
F181
Description
CuttermenwAll Districts, Brockwell Seam
Borers (:Coal and Stone)All Districts, All S'eams
Fillers1
ain South, Brockwell Seam
Diggers (Face and H/G)viain South, Brockwell S'eam
tfater InfusersAll Districts, All Seams
Face StonemenDrift Dist. Harvey Seam
Diggers (S tent on &' H/&)All Districts, Harvey Seam
Diggers (Stenton, M/G & CompelAll Districts, Busty Seam;
Diggers (Digging Face)3rd West, Busty Seam
Face Stonemen3rd West, Busty Seam
Scraper AttendantsDrift Dist. Harvey Seam
rgce Team (Plough))rif t Dist. Harvey Seam
Cuttermen and ScufflersAll Districts, Busty Seam
Face Team (Plough)3rd West, Busty Seam
Face Team (Plough)3rd West, Brockwell Seam
Pace Stonemen3rd West, Brockwell Seam
Face Team (Plough)Charley North, Busty Seam
Period
to 1/67
to 6/72
bo 1/67
to 1/72
to 9/72
to 8/72
to 1/69
to 1/69
to 1/69
to 6/71
to 8/72
to 1/72
bo 6/66
to 11/69
to 9/66
to 11/67
to 1 /72
SamplingLocationCode
4
1.4.7
4
0.2.4
4
1.2.4.6.7
0.9
0.2.4.6.9
0.2.4.6.9
1.7.
4
4
4
4
4
1
2.4.6.7
Mean Cone, (mg/m )
Resp.Dust
1.8••- (E)
2.4(9)
2.5CB)
2.9(1)1.40)
3.2(234)
4.3(12)
5.2(5)
4.2(4)
2.8(8)
2.1(269)
3.8(6)
T.6(D
5.0(E)
3.4(3)
0.8(D
5.5(232)
TotalDust
12.9(E)
9.7(E)
18.0(E)
20.9(E)
7.6(E)
13.1(13)
29.9(E)
42.3(E)
46.4(E)
7.2(E)
18.5(9)
26,0(E)
17.9(E)
56.0(E)
24.4(E)
5.5(E)
107.3(2*
Ash
0.64
0.41
0.89
_
0.17
0.70
0.97
3.27
0.70
1.23
0.49
1.82
0.43
1.80
0.76
0.18
0.99
Quartz
0.06
0.04
0.08
_
0.02
0.11
0.16
0.34
0.06
0.23
0.07
0.35
0.05
0.12
0.07
0.02
0.10
( ) No. of Samples E = Estimated Values TABLE 16aSHEET 2

TABLE !6a
Mean Concentration by Occupational Group (Faceworkers)
OGSN
F182
P1I83
P184
F185
P186
P187
P188
P189
F190
P191
P192
F193
F194
F195
F196
F197
F198
Description
Diggers (stenton)3rd West, Brockwell Seam
Spare FacemenAll Districts, Brockwell Seam
Spare FacemenAll Districts, Busty Seam
Spare PacemenAll Districts, Harvey Seam
Scraper AttendantsMain South & 3rd West,Brockwell S'eam
Face Team (Hydrocel)3rd West, Brockwell Seam
Instructors & TraineesDrift Dist., Harvey Seam
Face Team (Lovat Loader)Main South, Brockwell Seam
Face FittersAll faces, All Seams
Diggers (Development)All Districts, All Seams
Face Stonemen (Disc Shearer)Intake BQ1i2, Busty Seam
Face Team (Disc Shearer)BQ1 2, Busty Seam
Face Stonemen (Disc Shearer)Return BQ12, Busty Seam
Composite Face TeamSouth Pillars, Busty Seam
Intake Rippers (Plough)N'21 , Harvey Seam
Face Team (Plough)N21 , Harvey Seam
Return Rippers (Plough)N21 , Harvey Seam
Period
to, 11/6?
to 12/69
to H2/69
to -12/69
to 12/71
3/66 -10/66
to 6/72
10/66 -11/66
1/69 -7/73
1/69 -7/73
6/71 -7/72
6/71 @7/72
6/71 -7/72
10/71 -'4/72
12/71 -3/73
12/71 -3/73
12/71 -3/73
SamplingLocationCode
2.6
4
) 4.2.4. 6.7.91
3.1.2.4.6.7.9
0.4.9
4
4
0.4.9
0.1.2.4.6.7.9
2.4
4
4.6
2.4
2.4
4
4.6
•z
Mean Cone, (mg/m )
Resp.Dust;
4.6(3)
3.0(2)
2.10)
3.5(1)
2.4(188)
3.0(E)
5 ..3(E)
2.5(E)
3.3(31)
3.1(365)
3.0(51)
3.0(86)
3.7(69)
8.4$32)
2.6(60)
2.9(11T)
3.0(51)
TotalDust
35.1(E)
21.8(E)
23.5(E)
23.7(E)
re. 4(5)
21.6(E)
36.3(E)
18.0(E)
13.7(3)
21.5(16)
22.3(7.)
16.2(12)
21 ..7(9)
71.6(5)
24.6(7)
T6.3(8)
16.7*7)
Ash
2.08
0.75
1.13
— —
0.98
1.07
1.60
0.89
0.59
0.79
0.92
1.02
1.05
1.41'
0.67
0.76
0.67
Quartz
0.18
0.08
0.14
^
0.04
0.09
0.13
0.08
0.05
0.11
0.06
0.08
0.08
0.10
0.07i
0.09
0.17
( ) No. of Samples E= Estimated Values TABLE 16aSHEET 3
i TABLE 16a
Mean Concentrations by Occupational Group (Faceworkers)
OGSN"
F199
F200
P201
F202
F203
F204
Description
Intake Rippers (Disc Shearer)BQ1 3 , Busty Seam
Pace Team (Disc Shearer)BQ13, Busty Seam !
Return Rippers (Disc Shearer)BQ13, Busty Seam |
Intake Rippers (Plough)N20, Harvey Seam
Face Team (PloughN20, Harvey oS earn
Return Rippers (Plough) . •N20, Harvey Seam
F205 (Intake Rippers (Plough)
F206
F207
1T22, Harvey Seam
Face Team (Plough)W22, Harvey 3 earn
Return Rippers (Plough) ,p22, Harvey Seam
Period
8/72 «4/73
8/72 *4/73
8/72 -4/73
12/72 -8/73
12/72 -8/73
12/72 -8/73
5/73 -10/73
5/73 -10/73
5/73 -' 10/73
SamplingLocationCode
1.2.4
4
2.6
2.4
4
7
1
4
6
Mean Conce (mg/m )
RespeDust
1.8(43)
200(69)
5oO(62)
2o3(H)
2.2(21)
1.1(13)
1.3(10)
1.906)
2.6(11)
TotalDust
15.6(10)
10»0(12)
17.6(io)
11.2(4)
10.4(5)
5c9(3)
806(3)
12.8(3)
14.9(3)
Ash
0.47
0078
2.50
0.47
0.50
0.30
Oo39
0060
Oo53
Quartz
0.04
Oo07
0.28
0=05
Oo06
0.05
0.03
0.05
0.08
( ) Wo. of Samples E =s Estimated Values
TABLE i6 aSHEET 4
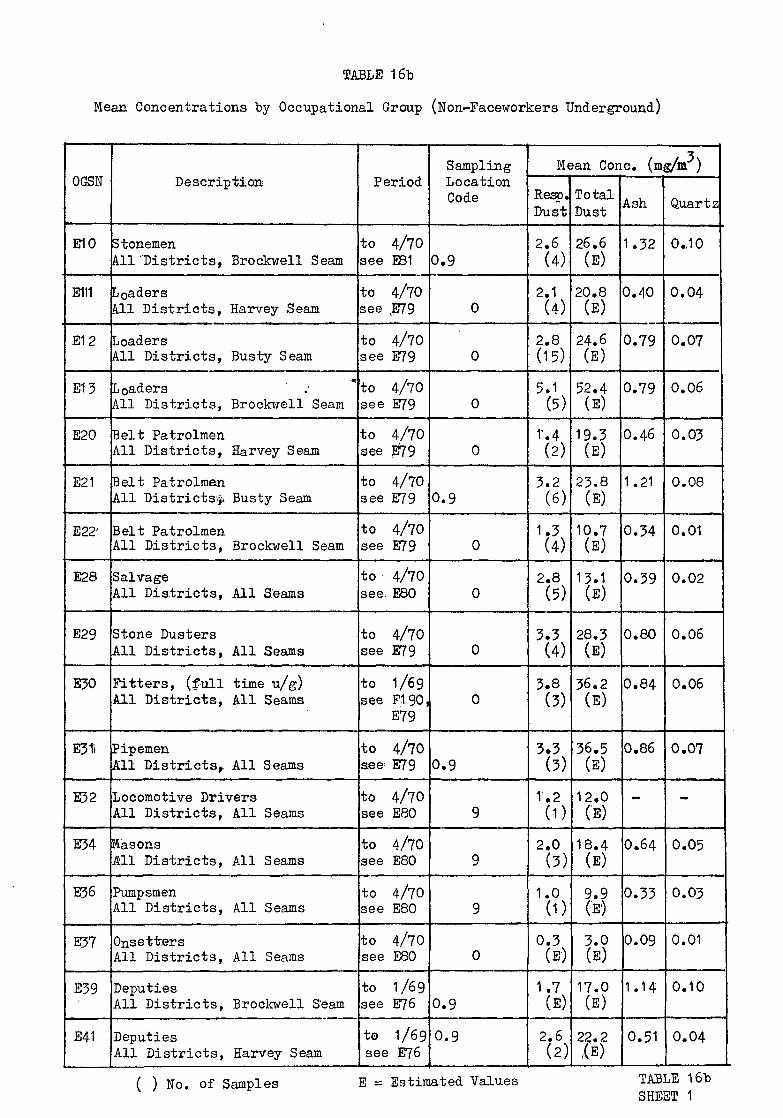
TABLE 16b
Mean Concentrations by Occupational Group (Non-Faceworkers Underground)
OGSN
BIO
E111
E12
El 3
E20
E21
E22'
E28
E29
E30
E31i
E52
E34
E36
E37
E39
E41
Description
StonemenA.11 "Districts, Brockwell Seam
L0adersA.11 Districts, Harvey Seam
LoadersAll Districts, Busty Seam
L0aders .• ,All Districts, Brockwell Seam
Belt PatrolmenAll Districts, Harvey Seam
Belt PatrolmenAll Districts.^ Busty Seam
Belt PatrolmenAll Districts, Brockwell Seam
SalvageAll Districts, All Seams
Stone DustersAll Districts, All Seams
Fitters, (full time u/g)All Districts, All Seams
PipemenAll Districts,. All Seams
Locomotive DriversAll Districts, All Seams
4'asonsAll Districts, All Seams
PumpsmenAll Districts, All Seams
OnsetirersAll Districts, All Seams
DeputiesAll Districts, Brockwell S'eam
DeputiesAll Districts, Harvey Seam
Period
to 4/70see EB1
to 4/70see ,E79
to 4/70see E79
to 4/70see E79
to 4/70see E79
to 4/70see E79
to 4/70see E79
to 4/70see. E80
to 4/70see E79
to 1/69see F190,
E79
to 4/70see- E79
to 4/70see E80
to 4/70see E80
to 4/70see E80
to 4/70see E80
to 1/69see E76
to 1/69see E76
SamplingLocationCode
0.9
0
0
0
0
0.9
0
0
0
0
0.9
9
9
9
0
0.9
0.9
Mean Cone, (mg/m )^ ^ iResp.Dust
2.6(4)
2.1(4)
2.8(15)
5.1(5)
T.4(2)
3.2(6)
1.3(4)
2.8(5)
3.3(4)
3.8(3)
3.3(3)
1.2(D
2.0(3)
1.0(1)0.3(E')
1.7IE)
2.6(2)
TotalDust
26.6(E)
20.8(E)
24.6(E)
52.4(E)
19.3(E)
23.8(E)
10.7(E)
13.1(E)
28.3(E)
36.2(E)
36.5(E)
12.0(E)
18.4(E)
9.9(E)
3.0(E)
17.0(E)
22.2,(E)
Ash
1.32
0.40
0.79
0.79
0.46
1.21
0.34
0.39
0.80
0.84
0.86
mm
0.64
0.33
0.09
1.14
0.51
Quartz
0..10
0.04
0.07
0.06
0.03
0.08
0.01
0.02
0.06
0.06
0.07
^
0.05
0.03
0.01
0.10
0.04
( ) No. of Samples E = Estimated Values TABLESHEET 1
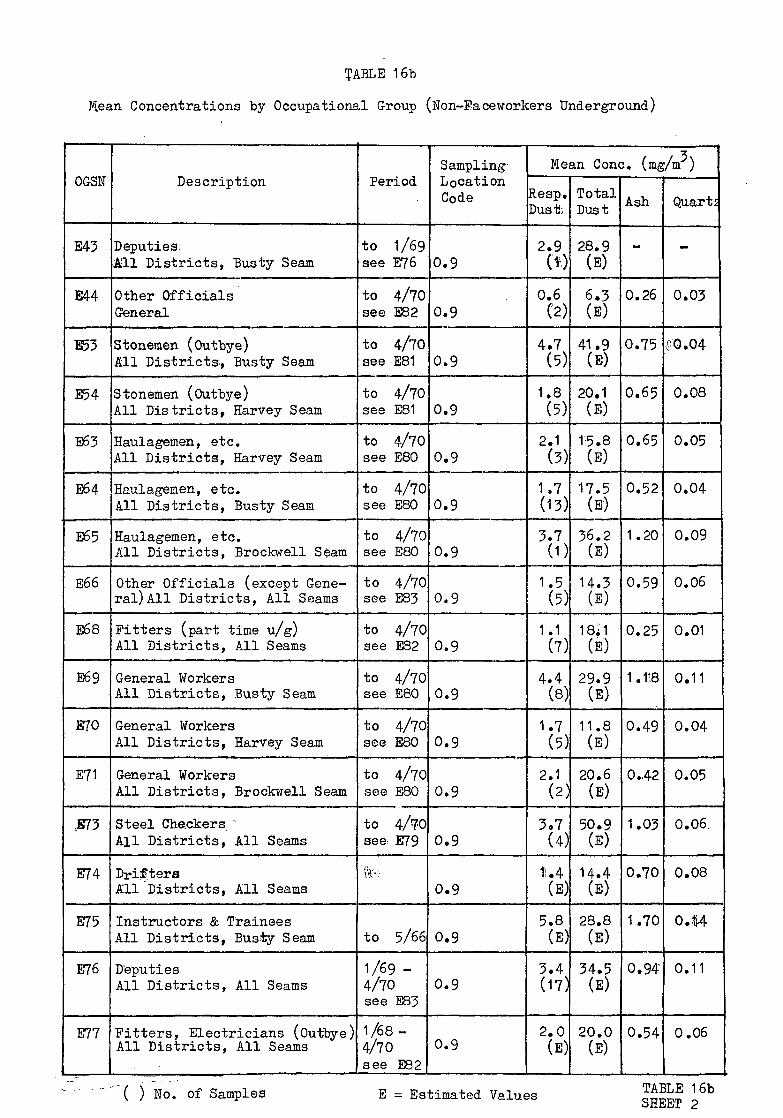
TABLE 16b
Concentrations by Occupational Group (Non-Eaceworkers Underground)
OGSN
E43
E44
E53
E54
E63
E64
E65
E66
E68
E69
E70
E?1
#73
E74
E75
E76
E77
Description
DeputiesAll Districts, Busty Seam
Other OfficialsGeneral
Stonemen ( Outbye)All Districts, Busty Seam
Stonemen (Outbye)All Districts, Harvey Seam
Haulagemen, etc.All Districts, Harvey Seam
Haulagemen, etc.All Districts, Busty Seam
Haulagemen, etc.All Districts, Brockwell Seam
Other Officials (except Gene-ral) All Districts, All Seams
Fitters (part time u/g)All Districts, All Seams
General WorkersAll Districts, Busty Seam
General WorkersAll Districts, Harvey Seam
General WorkersAll Districts, Brockwell Seam
Steel CheckersAll Districts, All Seams
DriftersAll Districts, All Seams
Instructors & TraineesAll Districts, Busty Seam
D'eputiesAll Districts, All Seams
Fitters, Electricians (Outbye)All Districts, All Seams
Period
to 1/69see E?6
to 4/70see E82
to 4/70see E81
to 4/70see E81
to 4/70see E80
to 4/70see E80
to 4/70see E80
to 4/70see E83
to 4/70see E82
to 4/70see E80
to 4/70see E80
to 4/70see E80
to 4/70see: E79
i"!-,.-.,•&:•
to 5/66
1/69 -4/70see E83
1/68-4/70see E82
SamplingLocationCode
0.9
0.9
0.9
0.9
0.9
0.9
0.9
0.9
0.9
0.9
0.9
0.9
0.9
0.9
0.9
0.9
0.9
Mean Cone, (mg/m )
Resp.Dust;
2.9C*>
0.6(2)
4.7(5)
1.8(5)
2.1(3)
1.7(13)
3.7(D
1.5(5)
1.1(7)
4.4(8)
1.7(5)
2.1(2)
3.7(4)
11.4(E)
5.8(E)
3.4
TotalDust
28.9(E)
6.3(E)
41.9(E)
20.1(E)
T5.8(E)
17.5(E)
36.2(E)
14.3(E)
18i1(E)
29.9(E)
11.8(E)
20.6(E)
50.9(E)
14.4(E)
28.8(E)
34.5(17) (E)
2.0(E)
20.0(E)
Ash
^
0.26
0.75
0.65
0.65
0.52
1.20
0.59
0.25
1.118
0.49
0.42
1.03
0.70
1.70
0.94
0.54
Quarts
<w
0.03
£0.04
0.08
0.05
0.04
0.09
0.06
0.01
0.11
0.04
0.05
0.06.
0.08
0.14
0.11
0.06
' ( j No. of Samples E = Estimated Values TABLE I6bSHEET 2

TABLE 16b
Mean Concentrations by Occupational Group (Non-Faceworkers Underground)
OGSH
E78
E79
E80
BB1
EB2
E83
E84
E85
';E86
E87
Description
Belt MaintenanceAll Districts, All Seams
ConveyingAll Districts, All Seams
Haulage & General WorkersAll Districts, All Seams
Stonemen (Outbye)All Districts, All Seams
Tradesmen & Other OfficialsAll Districts, All Seams
Deputies & OvermenAll Districts, All Seams
Haulage & General WorkersAll Districts1, All Seams
SalvagemenAll Districts, All Seams
C'oal TransportAll Districts, All Seams
General WorkersAll Districts, All Seams
Period
4/69 -4/70see E79
4/70 -10/70see E84
4/70 -10/70see B34
4/70 -8/72see E85f86, 87
4/70 -
4/70 -
10/70 -8/72See E85,86, 87
8/72--
8/72 -
8/72 -
SamplingLocationCode
0.9
0.9
0.9
0.9
0.9
0.9
4.9
0.9
0.9
0.9
Mean Cone, (mg/m )
lesp.Dust
1.3(E)
2.1(18)
11.6(2t)
1.9(122)
0.5(26)
1.3(9)
t'.3(394)
0.8U#o2.0(101)
1.9(66)
FotalDust
13. 3;(E)
20.6(E)
16.0(E)
8.7(6)
4.6(E)
17.6(3)
re. 2(15)
1Q.9t40)
17.r(11)
11.1(9)
Ash
0.43
0.64
0.52
0.75
0.15
0.38
0.43
0.33
0.79
0.74
Quartz
0.04'
0.04
0.04
0.08
0.01
0.04
0.03
0.03
0.08
0.09
( ) No. of Samples E = Estimated Values
TABLE 16bSHEET 3
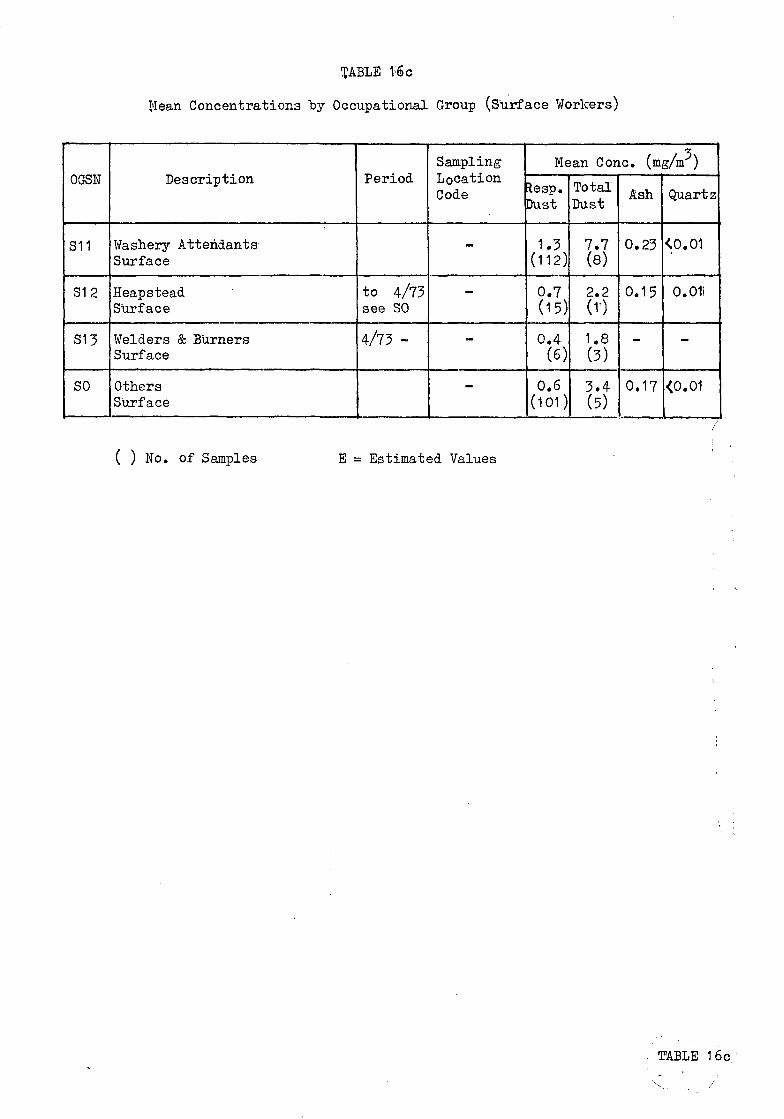
tABLE ISc
Mean Concentrations by Occupational Group (Surface Workers)
OGSN
311
S12
313
SO
'
Description
Washery AttendantsSurface
HeapsteadSurface
Welders & BurnersSurface
OthersSurface
Period
to 4/73see SO
4/73 -
SamplingLocationCode
m m
_
.
_
•7
Mean Cone, (mg/m )
lesp.Dust
1.3(112)
0.7(15)
0.4(6)
0.6(101)
TotalDust
7.7(8)
2.2(T)
1.8(3)
3.4(5)
Ash
0.23
0.15
_
0.17
Quartz
<0.01
O.Oli
_
<0.01
( ) No. of Samples E = Estimated Values
. TABLE 16c,

TABLE 19
Summary of Results by Class of Environment
Class ofEnvironment
MechanisedPilling
Handfilling
Preparation
Development inC'oal
Coal Face(All Shifts)
Stone Drifting
ElsewhereUnderground
Surface
Seam
Harvey
Busty
Brockwell
B'iisty
B'rockwell
All Seams
All Seams
All Seams
All Seams
All Seams
•y
Mean Concentrations mg/m
Bssp~. Dust.Phase I
5.8
5.9
4.2
6.7
4.9
3.1
5.0
4.6
1.4
1.2
1.1
( ) Number of Samples
Phase II
2.6(783)
^ 4!*T(604)
2.5(368)
8.1(102)
3.5(2)
2.8(443)
4.3(135)
4.1(2437)
2.6(256)
J.7,(893)
0.9(262)
TotalDust
16.6
26.8
15.5
61.6
25.9*
20.4
34.0
22.5
18.5
14.8
•?530
Ash
0.66
1.16
0.69
0.95
1.56
0.83
1.32
0.87
0.73
0.52
0.16
Quartz
0.10
0.10
0.07
0.08
0.14
0.09
0.20
0.10
0.10
0.06
0.01
AshinSample%
25.2
24.7
21. &
11.7
45.0
29.5
27.9
25.8
26.0
31.0
19.7
Composition of Samples
Quartz%
3. .8
2.1
2.8
0.9
3.9
3.4
4.5
3.0
3.8
2.7
1.5
Kaolin%
6.0
9.2
10.0
5.6
25.4+
9.4
8.0
8.2
8.6
9.6
3.9
Mica%
5.T'
3.8
4.8
1.4
4.9
6.3
4.8
5.7
4.6
1.9
Ca. Mg.Garbs. %
2.0
2.7'
1.7
1.4
0.4
3.6
2.8
2.4
3.0
5.4
2.5
IronGarb, fo
2.3
1.3
1.8
0.7
2.1
1.9
2.3
1.8
1.9
2.0
2.5
^Estimated Value + Includes mica content
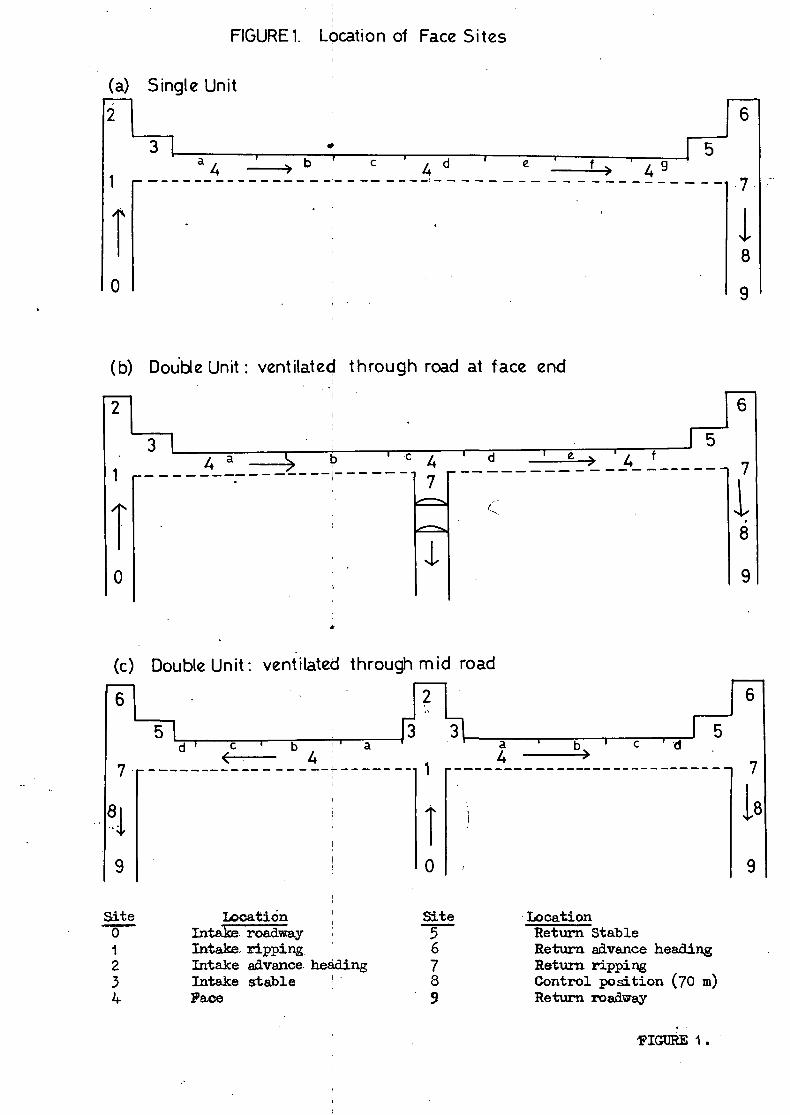
FIGURE 1. Location of Face Sites
(a) Single Unit
2
ii
T
0
(b)
2
1
0
(c)
6
7
8i9
Site01234
3 • 53 / ^ b1 c , d ' e. f •> / q
*•* *-T *+
"
i ' •
Double Unit : ventilated through road at face end
i
1 1 *
1 7^ ^ <^
: ^^
i
Double Uni t : ventilated through mid road
2
5 1 [ 3 3 ] 5d ' c ' b a a b ' c < J .
<- A A >
t! 0 -
Location Site LocationIntaloe roadway 5 Return StableIntake, ripping 6 Return advance headingIntake advance heading 7 Return rippingIntake stable ' 8 Control position (70 m)Face 9 Return roadway
6
• •
18
9
6
7
18
9
6
le
9
FIGURE 1 .
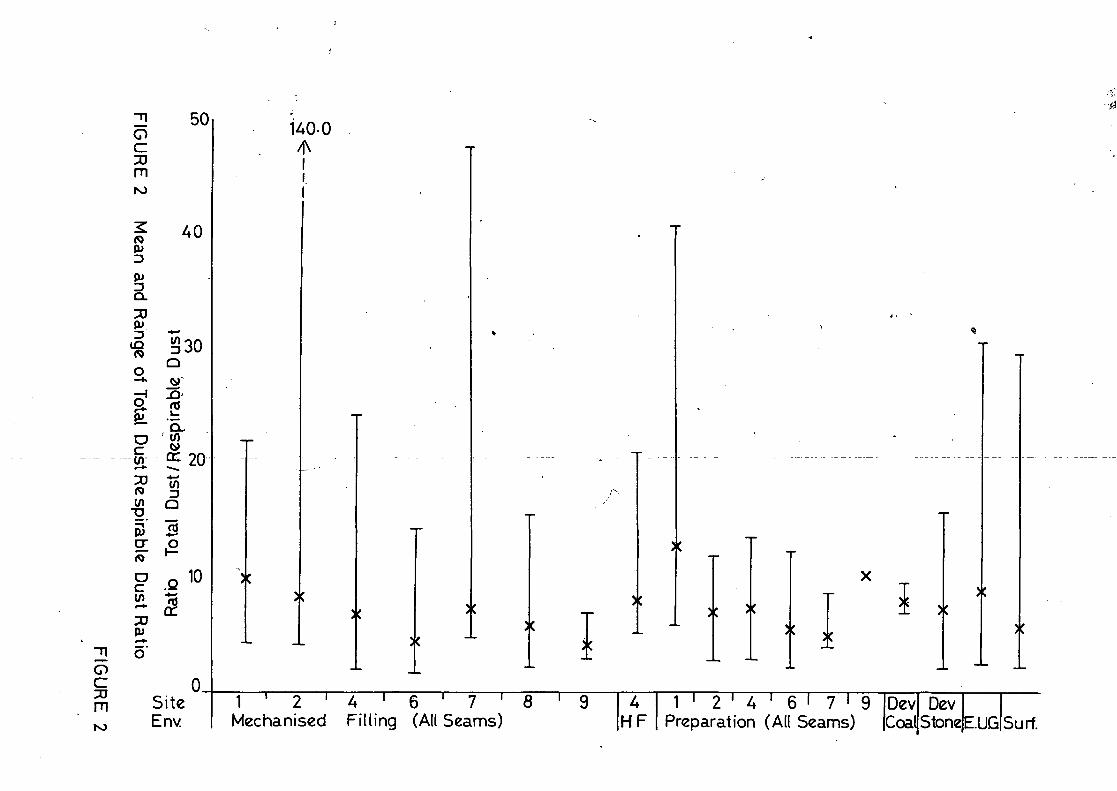
CD
m
ocr33m
(U
CL
JU
cur
pucr
Oc
50
6'
50
40
Q.
10
SiteEnv
1AO-0
)C i
1 ' 2 ' 4 ' 6 ' 7 ' 8Mechanised Filling (All Seams)
AHF
1 i 2 ' A ' 6 ' 7 ' 9Preparation (All Seams)
Dev DevCoal|Stone|E.UGSurf.

FIGURE 1. Location of Face Sites
(a) Single Unit
2
ii
/
0
(
2
ii
/
C
i*
b)
«v
)
3 1 , ,
Double Unit: ventilated through
3 1
A c
roa
A7
•
e f > ' A q
d at face end
d _J £_> 4 f __
5
1 5
6
18
9
6
7
I8
9
(c) Double Unit: ventilated through mid road
6
5 1 (3ri ' c ' b a
2
3 J l 51 a ' b. ' c • d
6
< ~ A . A >7
8!9
1
i0
/
Is
9

2]o
rn
oc33rn
so
tu
o^
o*
ow
330a
S
a.
•g __
cr o
c .2
£ 2(u
10
SiteEnv.
140-0
1 ' 2 ' 4 ' 6 ' 7 ' 8Mechanised Filling (All Seams)
x „
4HF
1 ' 2 ' 4 ' 6 ' 7 ' 9 pev|Dev|Preparation (All Seams) |CoayStone|E.UG
I °Surf.

HEAD OFFICE:
Research Avenue North,Riccarton,Edinburgh, EH14 4AP, United KingdomTelephone: +44 (0)870 850 5131Facsimile: +44 (0)870 850 5132
Email: [email protected]
Tapton Park Innovation Centre,Brimington Road, Tapton,Chesterfield, Derbyshire, S41 0TZ, United KingdomTelephone: +44 (0)1246 557866Facsimile: +44 (0)1246 551212
Research House Business Centre,Fraser Road, Perivale, Middlesex, UB6 7AQ,United KingdomTelephone: +44 (0)208 537 3491/2Facsimile: +44 (0)208 537 3493
Brookside Business Park, Cold Meece, Stone, Staffs, ST15 0RZ,United KingdomTelephone: +44 (0)1785 764810Facsimile: +44 (0)1785 764811
(A20115) IOM (R) ReportCov art 3/15/06 12:32 PM Page 2