hmda data analysis for the cities of muskegon, muskegon ...€¦ · hmda data analysis for the...
TRANSCRIPT
HMDA Data Analysis for the Cities of Muskegon, Muskegon Heights, and
Norton Shores
July 2019
Prepared for:
City of Muskegon City of Muskegon Heights City of Norton Shores 933 Terrace 2724 Peck Street 4814 Henry Street Muskegon, MI 49440 Muskegon Heights, MI 49444 Norton Shores, MI 49441
Prepared by:
Fair Housing Center of West Michigan 20 Hall Street SE Grand Rapids, MI 49507
HMDA Data Analysis for the Cities of Muskegon, Muskegon Heights, and Norton Shores July 2019
Introduction
The Fair Housing Center of West Michigan (FHCWM) conducted this analysis of Home Mortgage Disclosure Act (HMDA) data at the request of the Cities of Muskegon, Muskegon Heights, and Norton Shores (herein collectively “the Cities” or “Tri City region”) in order to address a recommendation in the “2015 Analysis of Impediments to Fair Housing Choice” completed for the County of Muskegon and the Cities. The recommendation, restated from the Cities’ “2009 Analysis of Impediments to Fair Housing Choice”, reads as follows:
2009 Banking & Investment Recommendation #1: Mortgage Data and Policy: We recommend that a full-scale analysis of HMDA data – and disparities based on race, ethnicity, and poverty – be completed, and used to identify policies and other areas that need improvement.
HMDA requires many financial institutions to maintain, report, and publicly disclose loan-level information about mortgages. These data help show whether lenders are serving the housing needs of their communities; they give public officials information that helps them make decisions and policies; and they shed light on lending patterns that could be discriminatory. The public data are modified to protect applicant and borrower privacy. This regulation applies to certain financial institutions, including banks, savings associations, credit unions, and other mortgage lending institutions.
To conduct this analysis, the FHCWM utilized the software LendingPatternsTM – Premier, a product of CLC Compliance Technologies Inc. The FHCWM generated reports in LendingPatternsTM derived from the 2017 HMDA-Loan Application Registry (LAR) data published by the Federal Financial Institutions Examination Council (FFIEC). All LendingPatternsTM reports utilized in this analysis are included as appendices. Any errors or omissions in this report are the responsibility of the Fair Housing Center of West Michigan.
Data controls: The FHCWM looked only at Home Purchase loans for the Property Type of 1-4 Family properties. Therefore, this analysis did not include Loan Purpose of Home Improvement or Refinance Loans, or loans for Property Type of Multi-family or Manufactured housing. Loan Types considered included Conventional, and those made or guaranteed by the Federal Housing Administration (FHA), Veterans Affairs (VA), and Farm Service Agency (FSA)/Department of Agriculture Rural Housing Service (RHS). Further, the FHCWM excluded the Action Taken “Purchased” to exclude loans purchased by an institution in order to limit analysis to loans purchased by individuals. Therefore, any reference herein to loans, applications, denials, originations, properties, etc. has been controlled by the aforementioned factors. Please see the appendices for more detailed information regarding the data parameters for each report.
HMDA Data Analysis for the Cities of Muskegon, Muskegon Heights, and Norton Shores July 2019
Table of Contents Market Overview ..................................................................................................................1 - 9
Where loans were made ...................................................................................................1 Which borrowers got loans ...............................................................................................3 Which institutions were getting the most applications and making the most loans .............7 Why loans were not originated .........................................................................................10
Disparity Analysis .................................................................................................................11 - 12 Redlining Risk Factor .........................................................................................................11 Top 5 Lender’s Originations in Majority White and Majority Minority Census Tracts in the Tri City Region ......................................................................................................12
Primary Conclusions ............................................................................................................13 - 15
Recommendations ................................................................................................................16 - 18
Appendix A: LendingPatternsTM Lender’s HMDA Overview reports
Appendix B: LendingPatternsTM Population Penetration Profile (Hispanic not a race) reports
Appendix C: LendingPatternsTM Lender Market Share reports and Table of Branch Locations of Top 5 Lenders
Appendix D: LendingPatternsTM Denial Reason Distribution reports
Appendix E: LendingPatternsTM FFIEC Redlining Risk Factor R2 reports
Appendix F: LendingPatternsTM Rank Lenders by Community Lending Performance report
Market Overview
1 HMDA Data Analysis for the Cities of Muskegon, Muskegon Heights, and Norton Shores July 2019
76.4%
44.8%
83.1% 79.1%
0%20%40%60%80%
100%
Muskegon MuskegonHeights
NortonShores
Total
Origination Rate by City
Market Overview
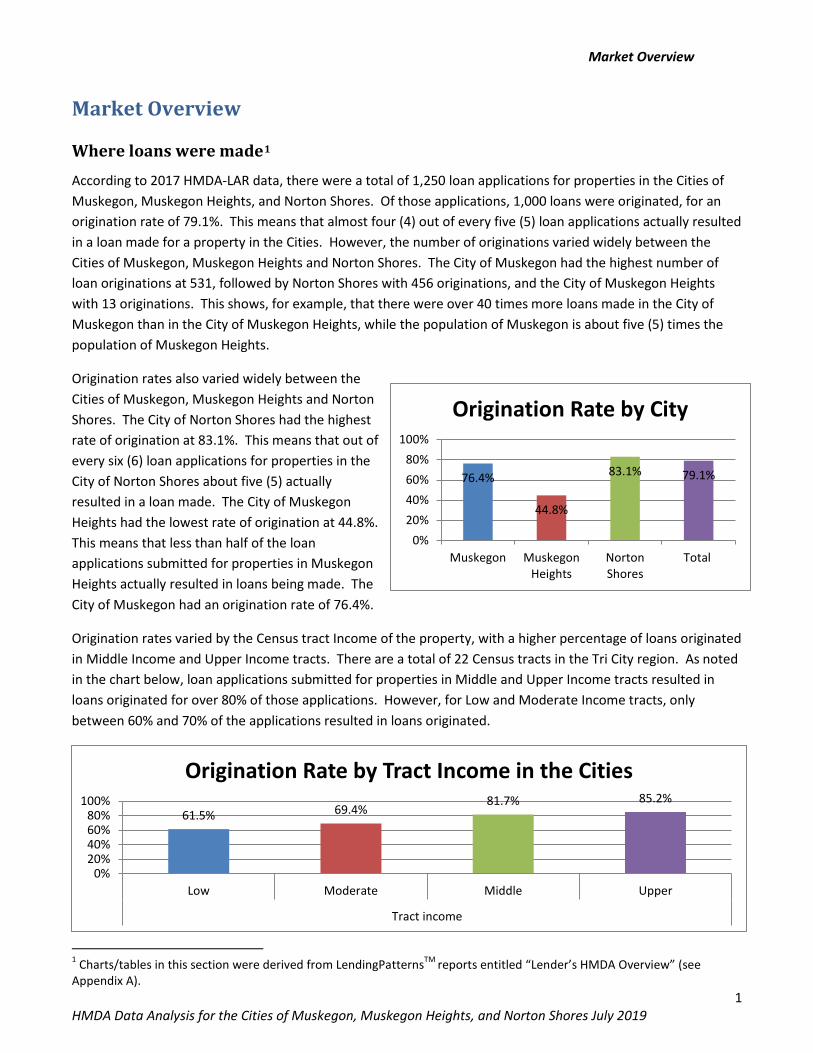
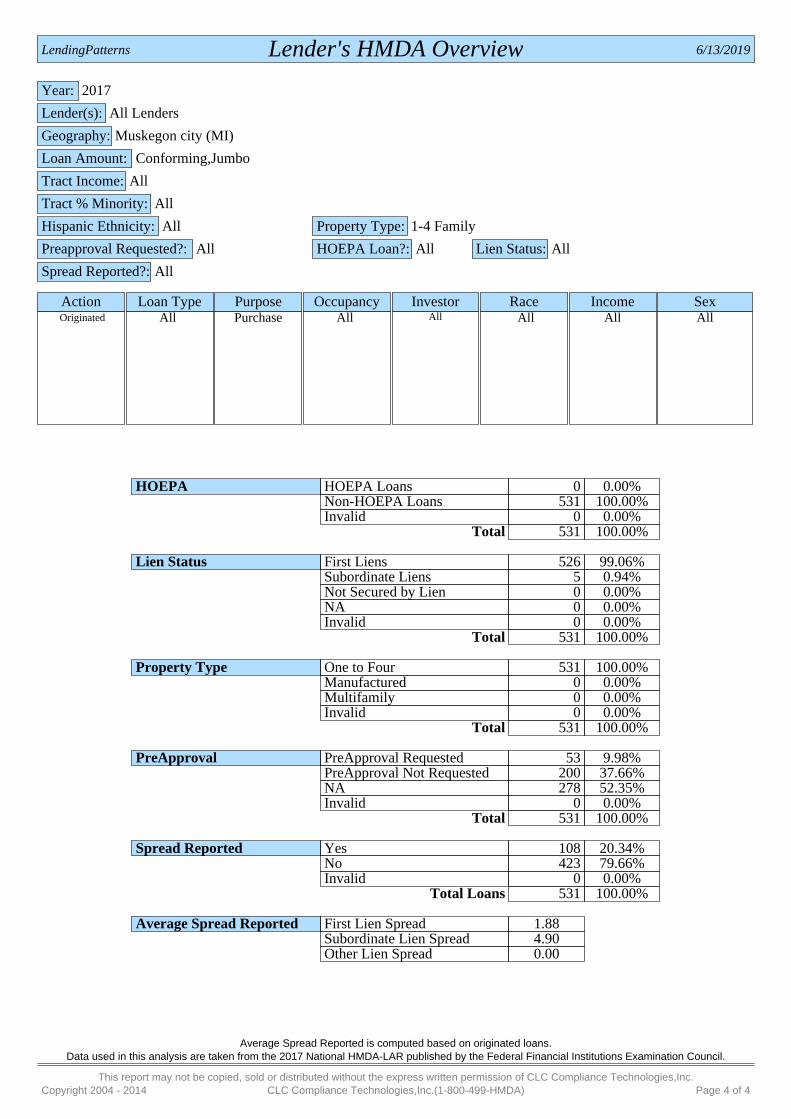
Where loans were made1 According to 2017 HMDA-LAR data, there were a total of 1,250 loan applications for properties in the Cities of Muskegon, Muskegon Heights, and Norton Shores. Of those applications, 1,000 loans were originated, for an origination rate of 79.1%. This means that almost four (4) out of every five (5) loan applications actually resulted in a loan made for a property in the Cities. However, the number of originations varied widely between the Cities of Muskegon, Muskegon Heights and Norton Shores. The City of Muskegon had the highest number of loan originations at 531, followed by Norton Shores with 456 originations, and the City of Muskegon Heights with 13 originations. This shows, for example, that there were over 40 times more loans made in the City of Muskegon than in the City of Muskegon Heights, while the population of Muskegon is about five (5) times the population of Muskegon Heights.
Origination rates also varied widely between the Cities of Muskegon, Muskegon Heights and Norton Shores. The City of Norton Shores had the highest rate of origination at 83.1%. This means that out of every six (6) loan applications for properties in the City of Norton Shores about five (5) actually resulted in a loan made. The City of Muskegon Heights had the lowest rate of origination at 44.8%. This means that less than half of the loan applications submitted for properties in Muskegon Heights actually resulted in loans being made. The City of Muskegon had an origination rate of 76.4%.
Origination rates varied by the Census tract Income of the property, with a higher percentage of loans originated in Middle Income and Upper Income tracts. There are a total of 22 Census tracts in the Tri City region. As noted in the chart below, loan applications submitted for properties in Middle and Upper Income tracts resulted in loans originated for over 80% of those applications. However, for Low and Moderate Income tracts, only between 60% and 70% of the applications resulted in loans originated.
1 Charts/tables in this section were derived from LendingPatternsTM reports entitled “Lender’s HMDA Overview” (see Appendix A).
61.5% 69.4% 81.7% 85.2%
0%20%40%60%80%
100%
Low Moderate Middle Upper
Tract income
Origination Rate by Tract Income in the Cities
Market Overview
2 HMDA Data Analysis for the Cities of Muskegon, Muskegon Heights, and Norton Shores July 2019
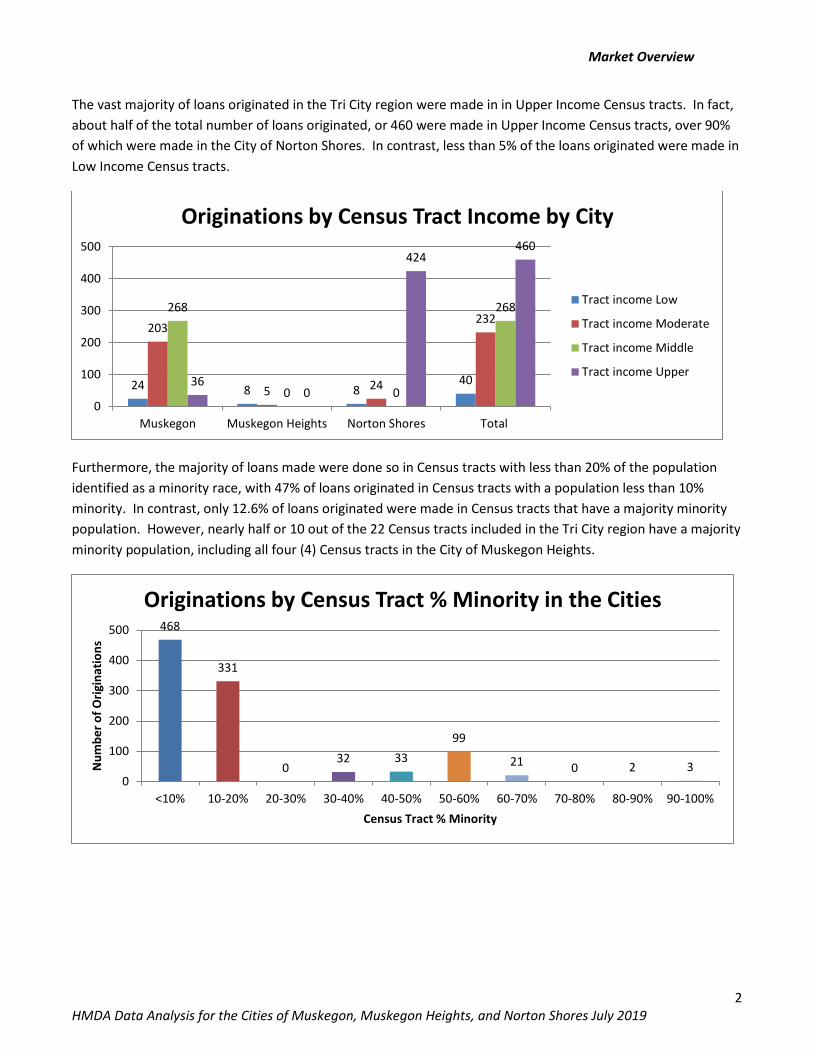
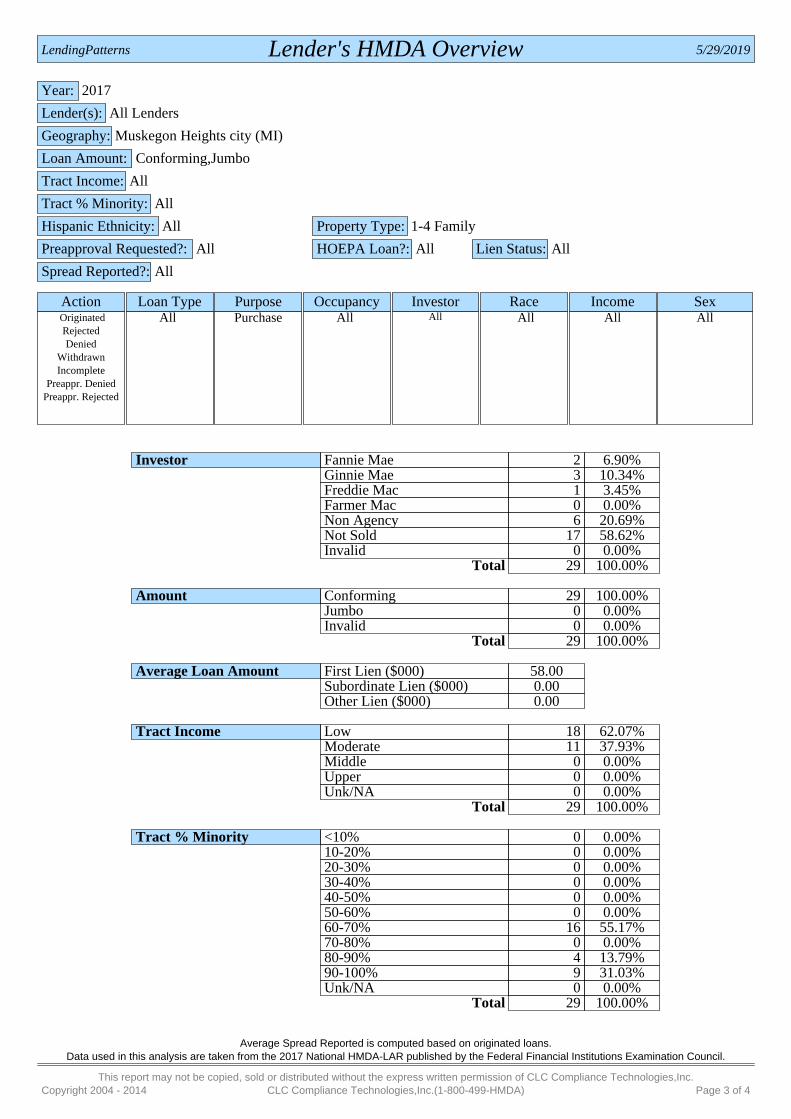
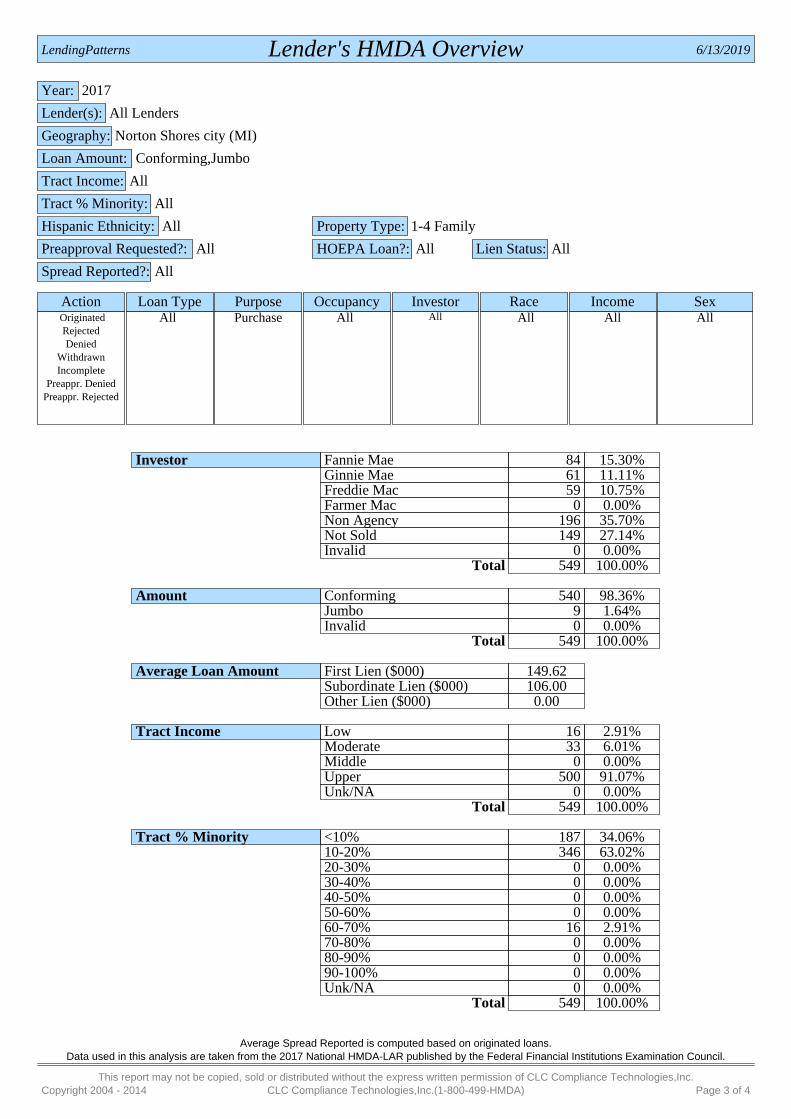
The vast majority of loans originated in the Tri City region were made in in Upper Income Census tracts. In fact, about half of the total number of loans originated, or 460 were made in Upper Income Census tracts, over 90% of which were made in the City of Norton Shores. In contrast, less than 5% of the loans originated were made in Low Income Census tracts.
Furthermore, the majority of loans made were done so in Census tracts with less than 20% of the population identified as a minority race, with 47% of loans originated in Census tracts with a population less than 10% minority. In contrast, only 12.6% of loans originated were made in Census tracts that have a majority minority population. However, nearly half or 10 out of the 22 Census tracts included in the Tri City region have a majority minority population, including all four (4) Census tracts in the City of Muskegon Heights.
24 8 8 40
203
5 24
232 268
0 0
268
36 0
424 460
0
100
200
300
400
500
Muskegon Muskegon Heights Norton Shores Total
Originations by Census Tract Income by City
Tract income Low
Tract income Moderate
Tract income Middle
Tract income Upper
468
331
0 32 33
99
21 0 2 3 0
100
200
300
400
500
<10% 10-20% 20-30% 30-40% 40-50% 50-60% 60-70% 70-80% 80-90% 90-100%
Num
ber o
f Orig
inat
ions
Census Tract % Minority
Originations by Census Tract % Minority in the Cities
Market Overview
3 HMDA Data Analysis for the Cities of Muskegon, Muskegon Heights, and Norton Shores July 2019
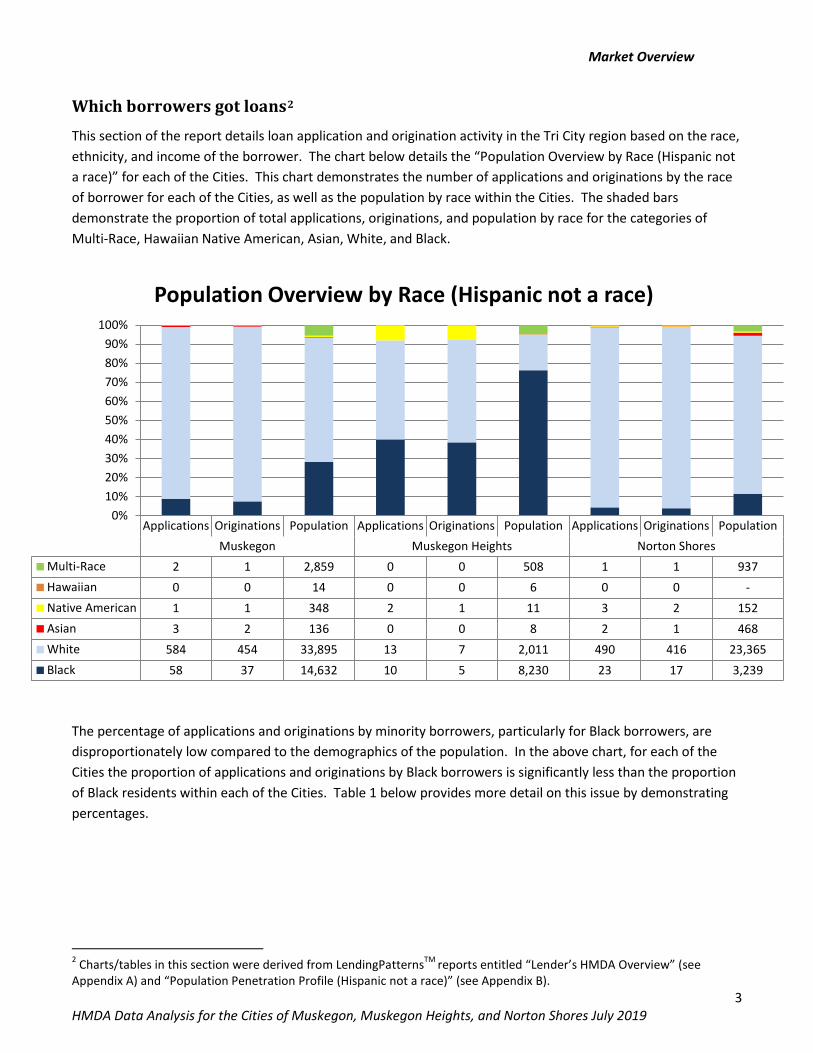
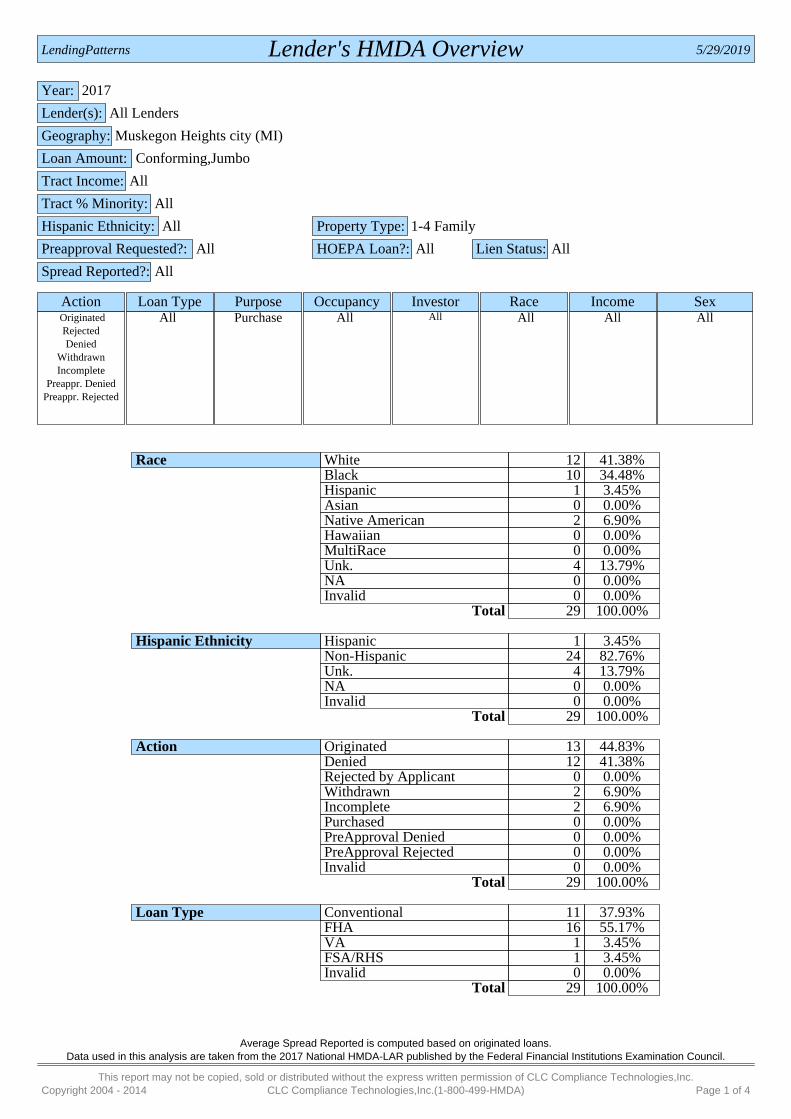
Which borrowers got loans2 This section of the report details loan application and origination activity in the Tri City region based on the race, ethnicity, and income of the borrower. The chart below details the “Population Overview by Race (Hispanic not a race)” for each of the Cities. This chart demonstrates the number of applications and originations by the race of borrower for each of the Cities, as well as the population by race within the Cities. The shaded bars demonstrate the proportion of total applications, originations, and population by race for the categories of Multi-Race, Hawaiian Native American, Asian, White, and Black.
The percentage of applications and originations by minority borrowers, particularly for Black borrowers, are disproportionately low compared to the demographics of the population. In the above chart, for each of the Cities the proportion of applications and originations by Black borrowers is significantly less than the proportion of Black residents within each of the Cities. Table 1 below provides more detail on this issue by demonstrating percentages.
2 Charts/tables in this section were derived from LendingPatternsTM reports entitled “Lender’s HMDA Overview” (see Appendix A) and “Population Penetration Profile (Hispanic not a race)” (see Appendix B).
Applications Originations Population Applications Originations Population Applications Originations PopulationMuskegon Muskegon Heights Norton Shores
Multi-Race 2 1 2,859 0 0 508 1 1 937Hawaiian 0 0 14 0 0 6 0 0 -Native American 1 1 348 2 1 11 3 2 152Asian 3 2 136 0 0 8 2 1 468White 584 454 33,895 13 7 2,011 490 416 23,365Black 58 37 14,632 10 5 8,230 23 17 3,239
0%10%20%30%40%50%60%70%80%90%
100%
Population Overview by Race (Hispanic not a race)
Market Overview
4 HMDA Data Analysis for the Cities of Muskegon, Muskegon Heights, and Norton Shores July 2019
Table 1: Population Penetration Profile – Race Black Applications Originations Population Muskegon 58 8.95% 37 7.47% 14,632 28.20% Muskegon Heights 10 40.00% 5 38.46% 8,230 76.39% Norton Shores 23 4.43% 17 3.89% 3,239 11.50% Tri City region 83 7.08% 55 5.89% 21,559 25.53%
As noted in Table 1, 28.2% of the residents of the City of Muskegon identify as Black; however, Black borrowers represented only 8.95% of the loan applications and only 7.47% of the loan originations in the City of Muskegon. This represents a gap of over 20% of Black borrowers in the loan applications and originations in the City of Muskegon. For the City of Muskegon Heights, 76.39% of the residents identify as Black; Black borrowers only represented 40% of the loan applications and 38.46% of the originations in the City of Muskegon Heights. This is a gap of over 30%. For the City of Norton Shores, 11.50% of the population identifies as Black, with only 4.43% of the applications and originations made by Black borrowers. This is a gap of over 7%. Overall, the gap in the Tri City region is just under 20%.
Using similar data based on Hispanic ethnicity, as seen in Table 2, the disparities between the population and the share of application and originations for Hispanic borrowers are far less than the disparities for Black borrowers. However, some disparities do exist. Across the Tri City region, Hispanics make up 5.19% of the population, while Hispanic borrowers represented less than 4% of the applications and originations. Thus, Hispanic borrowers are also underrepresented in loan applications and originations as compared to the population.
Table 2: Population Penetration Profile - Ethnicity Hispanic Applications Originations Population Muskegon 21 3.24% 17 3.43% 3,092 5.92% Muskegon Heights 1 4.00% 0 0.00% 275 2.54% Norton Shores 24 4.63% 20 4.62% 1,198 4.24% Tri City region 45 3.84% 37 3.97% 4,403 5.19%
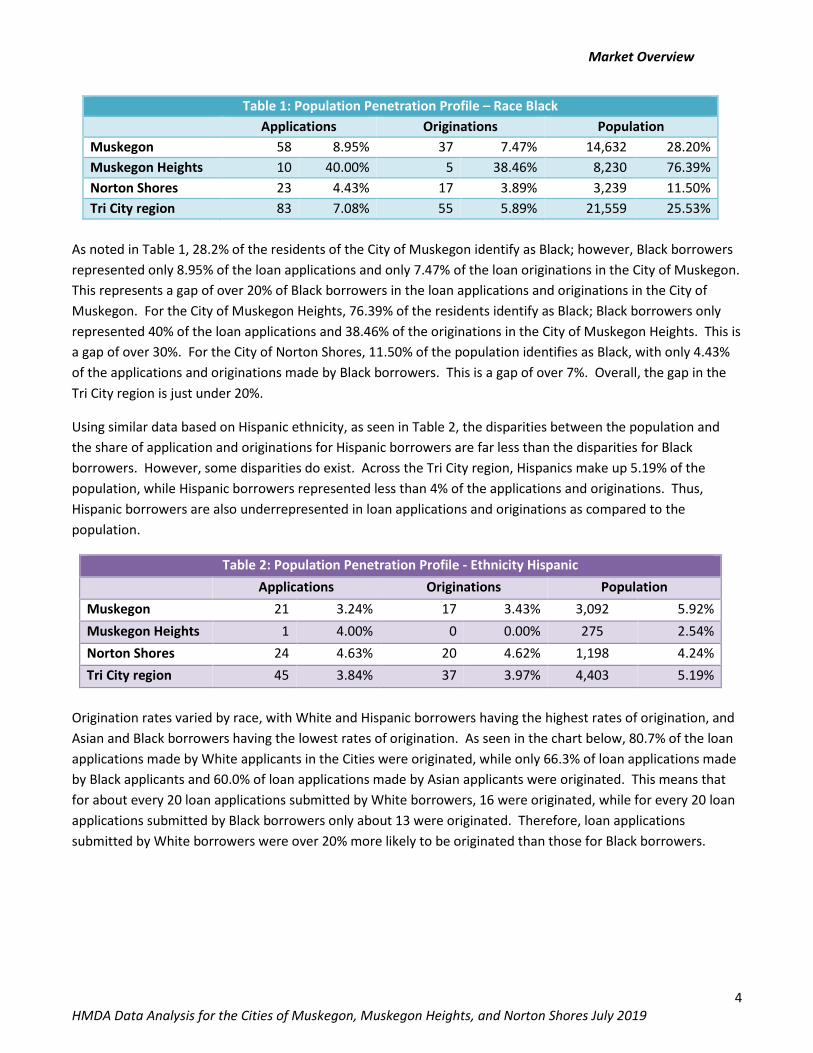
Origination rates varied by race, with White and Hispanic borrowers having the highest rates of origination, and Asian and Black borrowers having the lowest rates of origination. As seen in the chart below, 80.7% of the loan applications made by White applicants in the Cities were originated, while only 66.3% of loan applications made by Black applicants and 60.0% of loan applications made by Asian applicants were originated. This means that for about every 20 loan applications submitted by White borrowers, 16 were originated, while for every 20 loan applications submitted by Black borrowers only about 13 were originated. Therefore, loan applications submitted by White borrowers were over 20% more likely to be originated than those for Black borrowers.
Market Overview
5 HMDA Data Analysis for the Cities of Muskegon, Muskegon Heights, and Norton Shores July 2019
57
2 29
86
165
6
112
277
132
3
121
253
176
2
191
369
0
50
100
150
200
250
300
350
400
Muskegon Muskegon Heights Norton Shores Total
Originations by Borrower Income by City
Income Low
Income Moderate
Income Middle
Income Upper
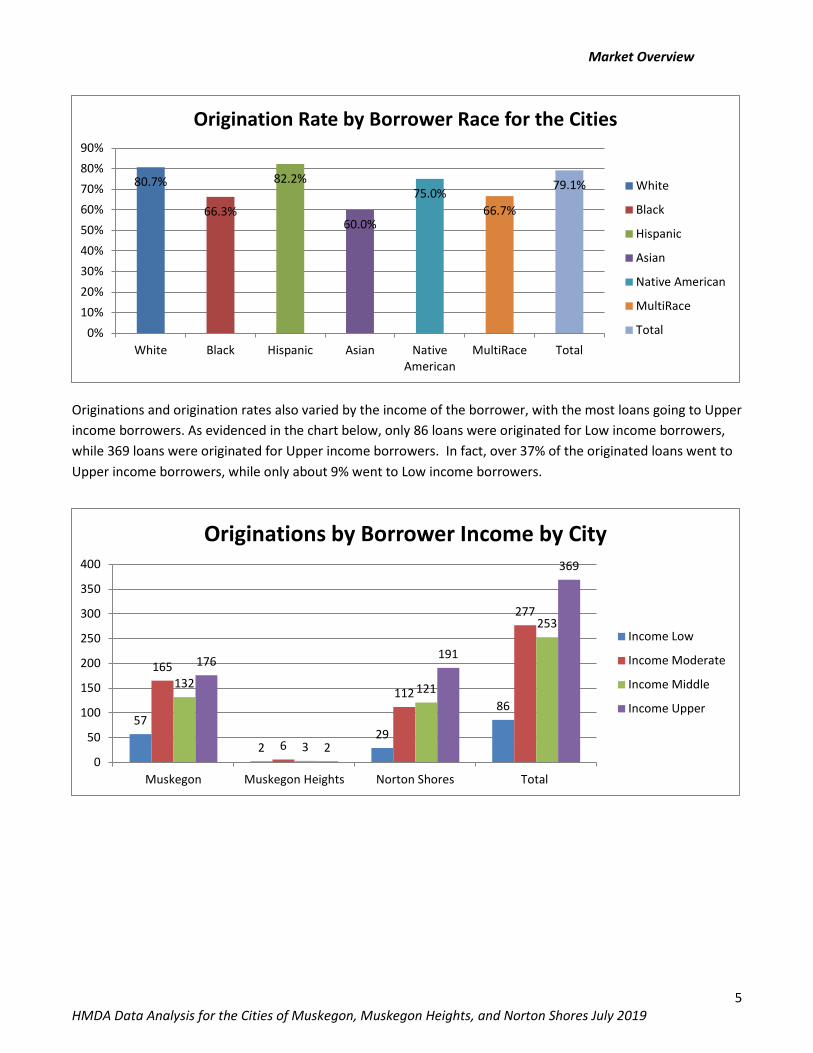
Originations and origination rates also varied by the income of the borrower, with the most loans going to Upper income borrowers. As evidenced in the chart below, only 86 loans were originated for Low income borrowers, while 369 loans were originated for Upper income borrowers. In fact, over 37% of the originated loans went to Upper income borrowers, while only about 9% went to Low income borrowers.
80.7%
66.3%
82.2%
60.0%
75.0% 66.7%
79.1%
0%10%20%30%40%50%60%70%80%90%
White Black Hispanic Asian NativeAmerican
MultiRace Total
Origination Rate by Borrower Race for the Cities
White
Black
Hispanic
Asian
Native American
MultiRace
Total
Market Overview
6 HMDA Data Analysis for the Cities of Muskegon, Muskegon Heights, and Norton Shores July 2019
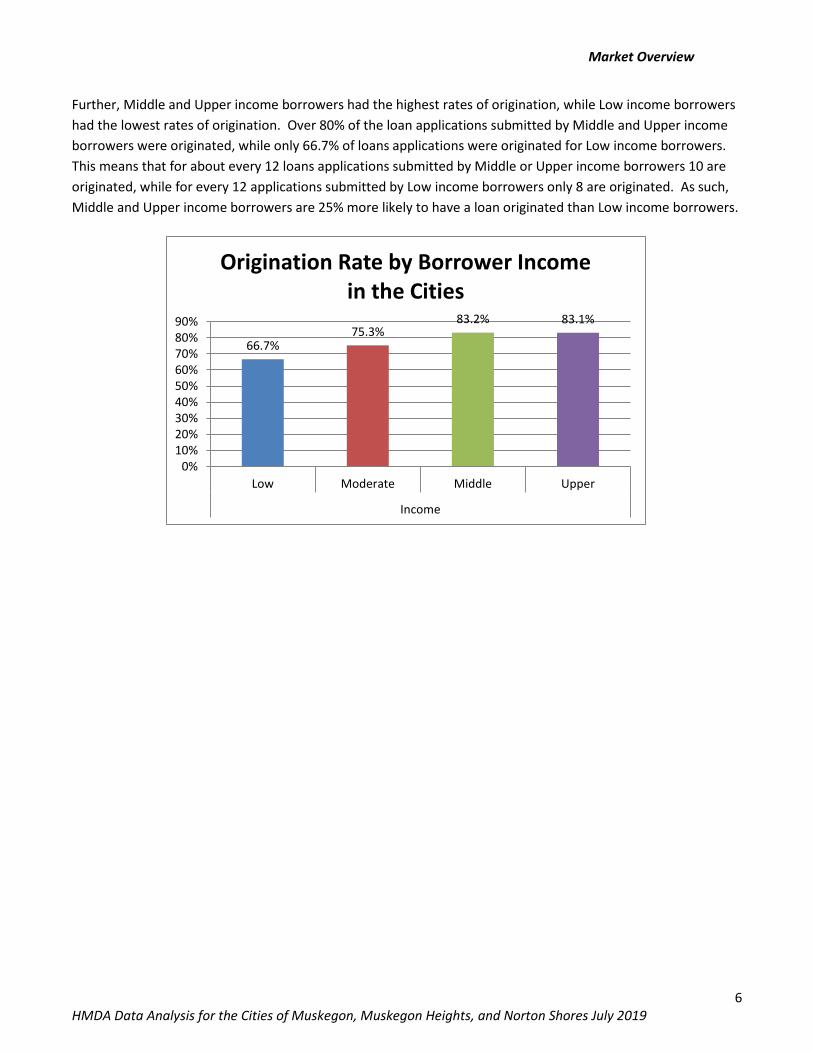
66.7% 75.3%
83.2% 83.1%
0%10%20%30%40%50%60%70%80%90%
Low Moderate Middle Upper
Income
Origination Rate by Borrower Income in the Cities
Further, Middle and Upper income borrowers had the highest rates of origination, while Low income borrowers had the lowest rates of origination. Over 80% of the loan applications submitted by Middle and Upper income borrowers were originated, while only 66.7% of loans applications were originated for Low income borrowers. This means that for about every 12 loans applications submitted by Middle or Upper income borrowers 10 are originated, while for every 12 applications submitted by Low income borrowers only 8 are originated. As such, Middle and Upper income borrowers are 25% more likely to have a loan originated than Low income borrowers.
Market Overview
7 HMDA Data Analysis for the Cities of Muskegon, Muskegon Heights, and Norton Shores July 2019
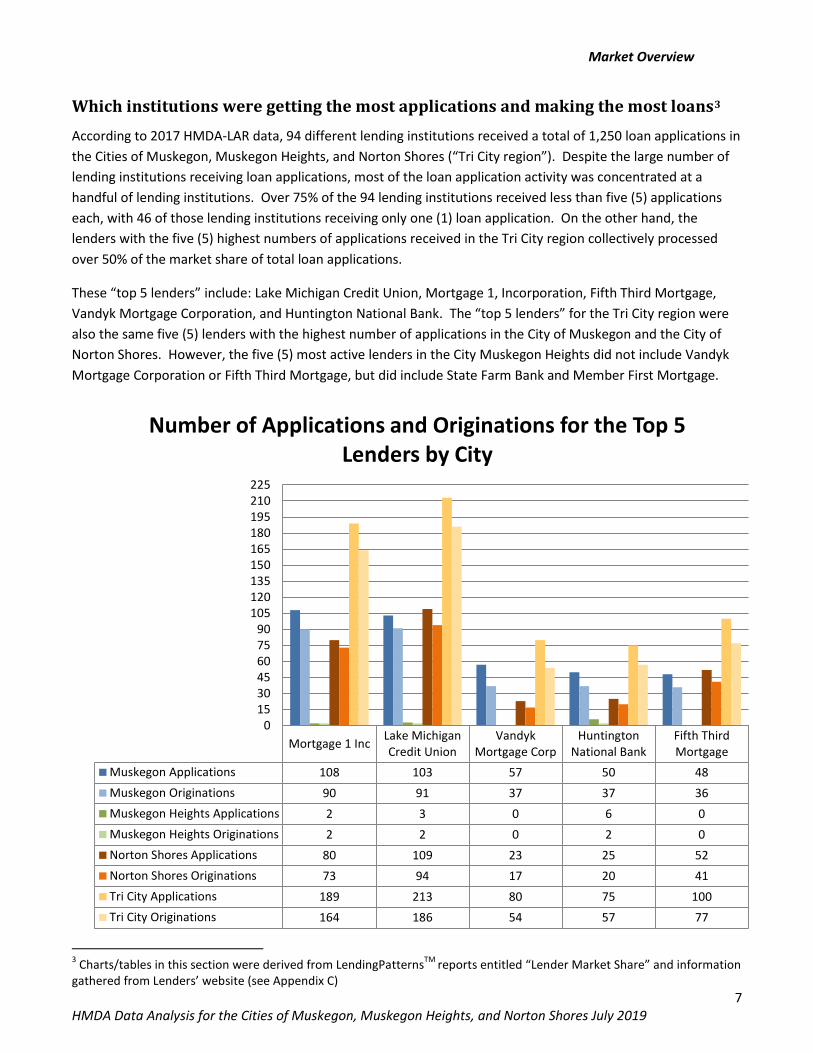
Which institutions were getting the most applications and making the most loans3 According to 2017 HMDA-LAR data, 94 different lending institutions received a total of 1,250 loan applications in the Cities of Muskegon, Muskegon Heights, and Norton Shores (“Tri City region”). Despite the large number of lending institutions receiving loan applications, most of the loan application activity was concentrated at a handful of lending institutions. Over 75% of the 94 lending institutions received less than five (5) applications each, with 46 of those lending institutions receiving only one (1) loan application. On the other hand, the lenders with the five (5) highest numbers of applications received in the Tri City region collectively processed over 50% of the market share of total loan applications.
These “top 5 lenders” include: Lake Michigan Credit Union, Mortgage 1, Incorporation, Fifth Third Mortgage, Vandyk Mortgage Corporation, and Huntington National Bank. The “top 5 lenders” for the Tri City region were also the same five (5) lenders with the highest number of applications in the City of Muskegon and the City of Norton Shores. However, the five (5) most active lenders in the City Muskegon Heights did not include Vandyk Mortgage Corporation or Fifth Third Mortgage, but did include State Farm Bank and Member First Mortgage.
3 Charts/tables in this section were derived from LendingPatternsTM reports entitled “Lender Market Share” and information gathered from Lenders’ website (see Appendix C)
Mortgage 1 Inc Lake MichiganCredit Union
VandykMortgage Corp
HuntingtonNational Bank
Fifth ThirdMortgage
Muskegon Applications 108 103 57 50 48Muskegon Originations 90 91 37 37 36Muskegon Heights Applications 2 3 0 6 0Muskegon Heights Originations 2 2 0 2 0Norton Shores Applications 80 109 23 25 52Norton Shores Originations 73 94 17 20 41Tri City Applications 189 213 80 75 100Tri City Originations 164 186 54 57 77
0153045607590
105120135150165180195210225
Number of Applications and Originations for the Top 5 Lenders by City
Market Overview
8 HMDA Data Analysis for the Cities of Muskegon, Muskegon Heights, and Norton Shores July 2019
Of the 94 different lending institutions receiving loan applications, 83 lending institutions originated a total of 989 loans throughout the Tri City region. The “top 5 lenders” that processed the largest market share of applications were the same five (5) lenders with the most originations in the Tri City region. These “top 5 lenders” were responsible for over 50% of the loans originated in the Cities. In the City of Muskegon, Lake Michigan Credit Union originated the most loans with 91 originations, followed closely by Mortgage 1, Inc. with 90 originations. In the City of Norton Shores, again Lake Michigan Credit Union originated the most loans with 94 originations. In the City of Muskegon Heights, Lake Michigan Credit Union, Mortgage 1, Inc. and Huntington National Bank tied for the most originations, each originating 2 loans.
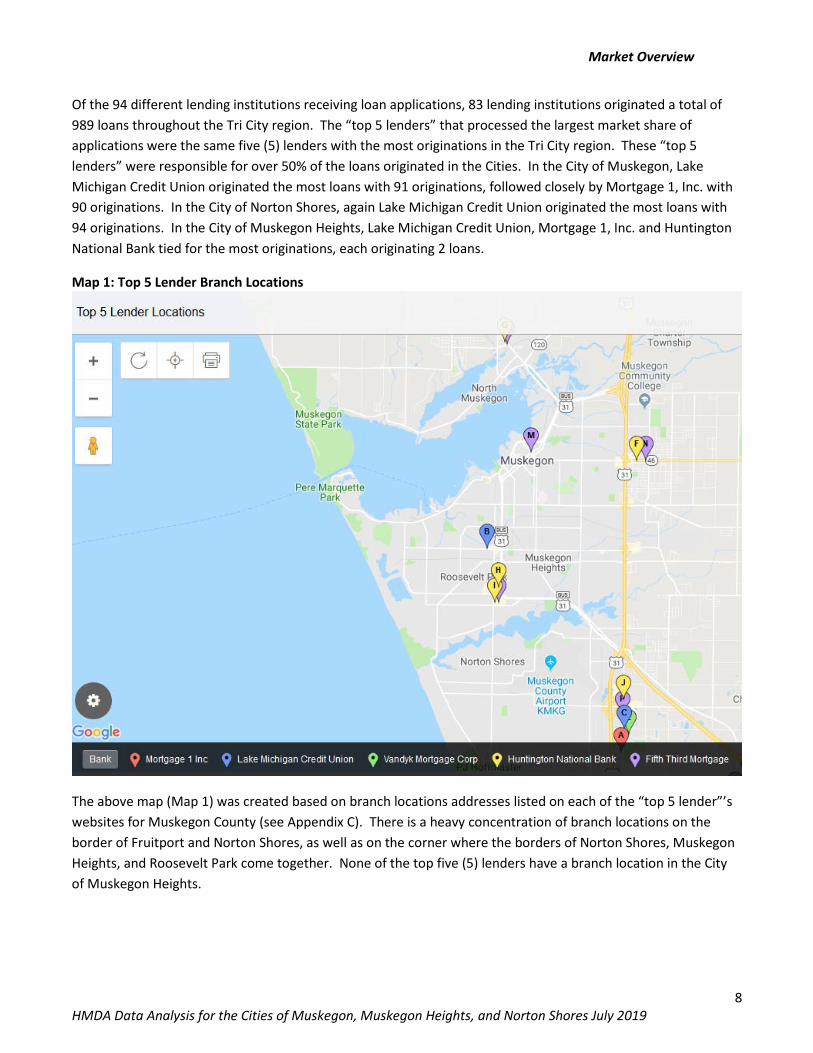
Map 1: Top 5 Lender Branch Locations
The above map (Map 1) was created based on branch locations addresses listed on each of the “top 5 lender”’s websites for Muskegon County (see Appendix C). There is a heavy concentration of branch locations on the border of Fruitport and Norton Shores, as well as on the corner where the borders of Norton Shores, Muskegon Heights, and Roosevelt Park come together. None of the top five (5) lenders have a branch location in the City of Muskegon Heights.
Market Overview
9 HMDA Data Analysis for the Cities of Muskegon, Muskegon Heights, and Norton Shores July 2019
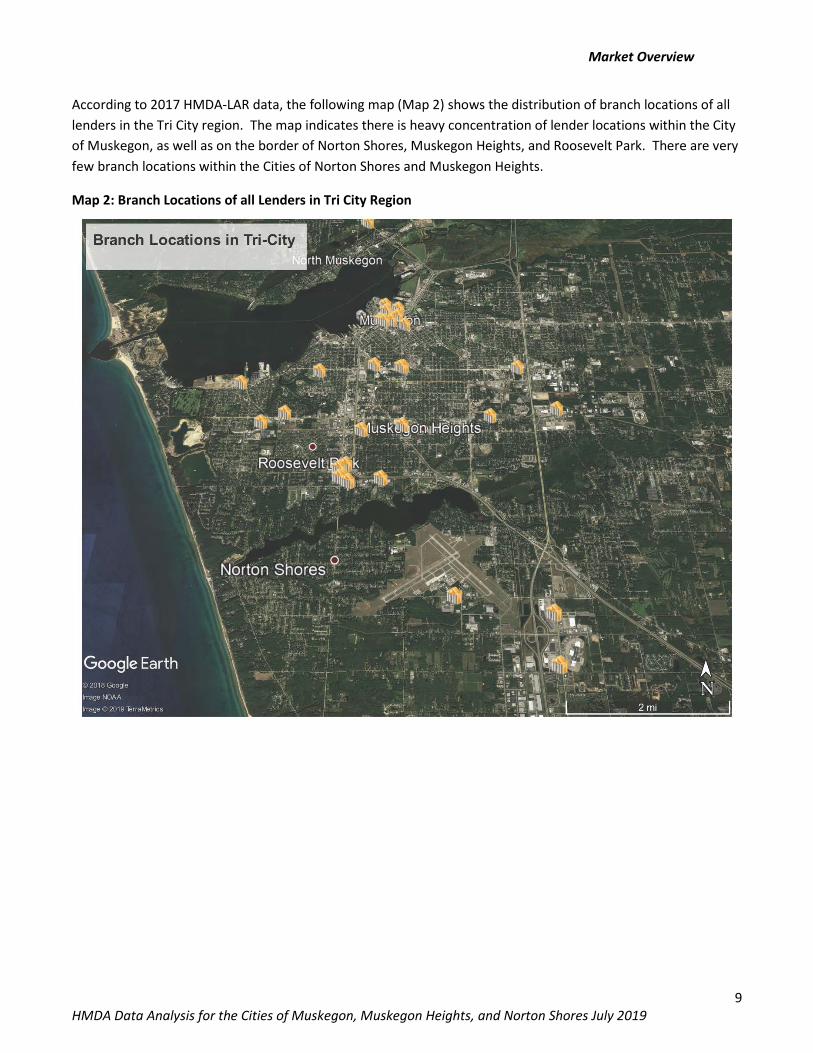
According to 2017 HMDA-LAR data, the following map (Map 2) shows the distribution of branch locations of all lenders in the Tri City region. The map indicates there is heavy concentration of lender locations within the City of Muskegon, as well as on the border of Norton Shores, Muskegon Heights, and Roosevelt Park. There are very few branch locations within the Cities of Norton Shores and Muskegon Heights.
Map 2: Branch Locations of all Lenders in Tri City Region
Market Overview
10 HMDA Data Analysis for the Cities of Muskegon, Muskegon Heights, and Norton Shores July 2019
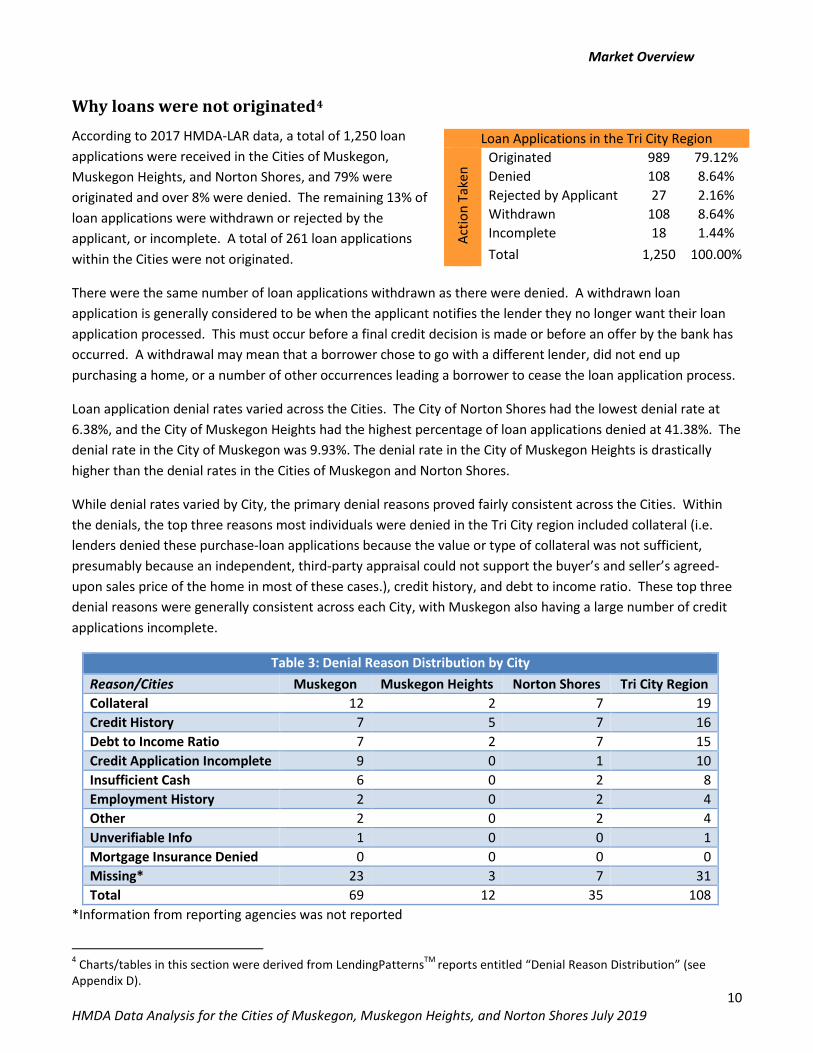
Why loans were not originated4 According to 2017 HMDA-LAR data, a total of 1,250 loan applications were received in the Cities of Muskegon, Muskegon Heights, and Norton Shores, and 79% were originated and over 8% were denied. The remaining 13% of loan applications were withdrawn or rejected by the applicant, or incomplete. A total of 261 loan applications within the Cities were not originated.
There were the same number of loan applications withdrawn as there were denied. A withdrawn loan application is generally considered to be when the applicant notifies the lender they no longer want their loan application processed. This must occur before a final credit decision is made or before an offer by the bank has occurred. A withdrawal may mean that a borrower chose to go with a different lender, did not end up purchasing a home, or a number of other occurrences leading a borrower to cease the loan application process.
Loan application denial rates varied across the Cities. The City of Norton Shores had the lowest denial rate at 6.38%, and the City of Muskegon Heights had the highest percentage of loan applications denied at 41.38%. The denial rate in the City of Muskegon was 9.93%. The denial rate in the City of Muskegon Heights is drastically higher than the denial rates in the Cities of Muskegon and Norton Shores.
While denial rates varied by City, the primary denial reasons proved fairly consistent across the Cities. Within the denials, the top three reasons most individuals were denied in the Tri City region included collateral (i.e. lenders denied these purchase-loan applications because the value or type of collateral was not sufficient, presumably because an independent, third-party appraisal could not support the buyer’s and seller’s agreed-upon sales price of the home in most of these cases.), credit history, and debt to income ratio. These top three denial reasons were generally consistent across each City, with Muskegon also having a large number of credit applications incomplete.
Table 3: Denial Reason Distribution by City Reason/Cities Muskegon Muskegon Heights Norton Shores Tri City Region Collateral 12 2 7 19 Credit History 7 5 7 16 Debt to Income Ratio 7 2 7 15 Credit Application Incomplete 9 0 1 10 Insufficient Cash 6 0 2 8 Employment History 2 0 2 4 Other 2 0 2 4 Unverifiable Info 1 0 0 1 Mortgage Insurance Denied 0 0 0 0 Missing* 23 3 7 31 Total 69 12 35 108
*Information from reporting agencies was not reported
4 Charts/tables in this section were derived from LendingPatternsTM reports entitled “Denial Reason Distribution” (see Appendix D).
Loan Applications in the Tri City Region
Act
ion
Take
n
Originated 989 79.12% Denied 108 8.64% Rejected by Applicant 27 2.16% Withdrawn 108 8.64% Incomplete 18 1.44% Total 1,250 100.00%
Disparity Analysis
11 HMDA Data Analysis for the Cities of Muskegon, Muskegon Heights, and Norton Shores July 2019
Disparity Analysis
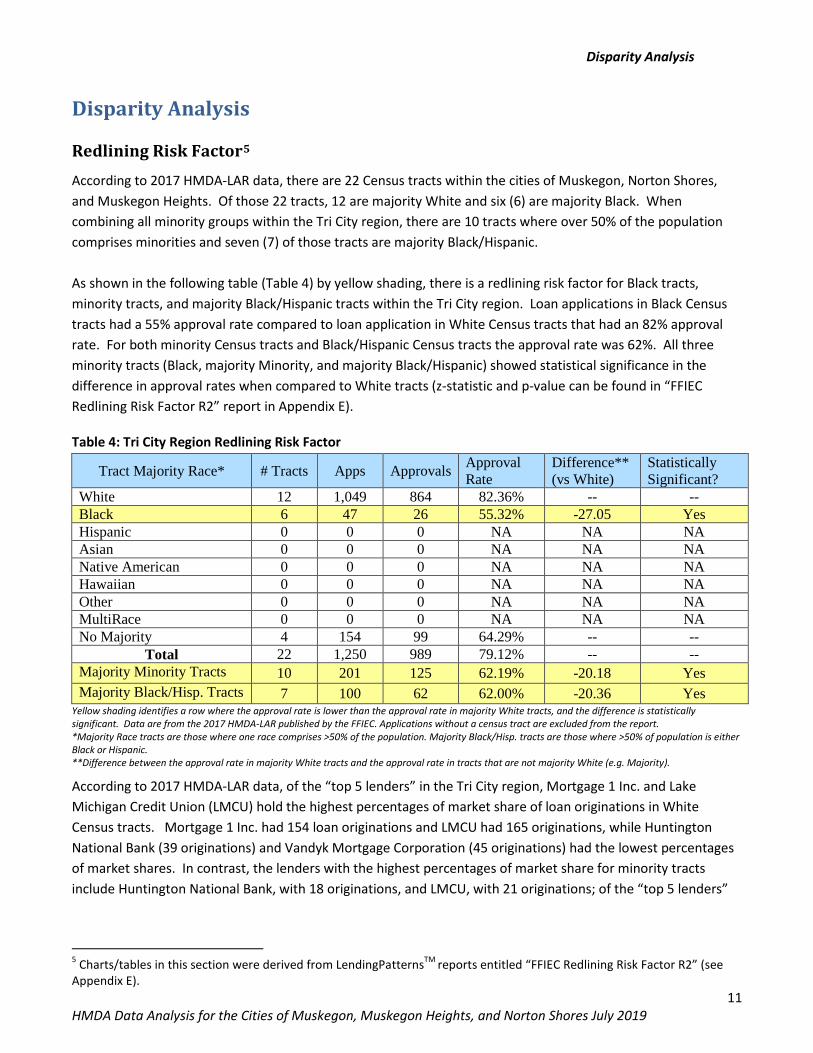
Redlining Risk Factor5 According to 2017 HMDA-LAR data, there are 22 Census tracts within the cities of Muskegon, Norton Shores, and Muskegon Heights. Of those 22 tracts, 12 are majority White and six (6) are majority Black. When combining all minority groups within the Tri City region, there are 10 tracts where over 50% of the population comprises minorities and seven (7) of those tracts are majority Black/Hispanic. As shown in the following table (Table 4) by yellow shading, there is a redlining risk factor for Black tracts, minority tracts, and majority Black/Hispanic tracts within the Tri City region. Loan applications in Black Census tracts had a 55% approval rate compared to loan application in White Census tracts that had an 82% approval rate. For both minority Census tracts and Black/Hispanic Census tracts the approval rate was 62%. All three minority tracts (Black, majority Minority, and majority Black/Hispanic) showed statistical significance in the difference in approval rates when compared to White tracts (z-statistic and p-value can be found in “FFIEC Redlining Risk Factor R2” report in Appendix E).
Table 4: Tri City Region Redlining Risk Factor
Tract Majority Race* # Tracts Apps Approvals Approval Rate
Difference** (vs White)
Statistically Significant?
White 12 1,049 864 82.36% -- -- Black 6 47 26 55.32% -27.05 Yes Hispanic 0 0 0 NA NA NA Asian 0 0 0 NA NA NA Native American 0 0 0 NA NA NA Hawaiian 0 0 0 NA NA NA Other 0 0 0 NA NA NA MultiRace 0 0 0 NA NA NA No Majority 4 154 99 64.29% -- --
Total 22 1,250 989 79.12% -- -- Majority Minority Tracts 10 201 125 62.19% -20.18 Yes Majority Black/Hisp. Tracts 7 100 62 62.00% -20.36 Yes
Yellow shading identifies a row where the approval rate is lower than the approval rate in majority White tracts, and the difference is statistically significant. Data are from the 2017 HMDA-LAR published by the FFIEC. Applications without a census tract are excluded from the report. *Majority Race tracts are those where one race comprises >50% of the population. Majority Black/Hisp. tracts are those where >50% of population is either Black or Hispanic. **Difference between the approval rate in majority White tracts and the approval rate in tracts that are not majority White (e.g. Majority).
According to 2017 HMDA-LAR data, of the “top 5 lenders” in the Tri City region, Mortgage 1 Inc. and Lake Michigan Credit Union (LMCU) hold the highest percentages of market share of loan originations in White Census tracts. Mortgage 1 Inc. had 154 loan originations and LMCU had 165 originations, while Huntington National Bank (39 originations) and Vandyk Mortgage Corporation (45 originations) had the lowest percentages of market shares. In contrast, the lenders with the highest percentages of market share for minority tracts include Huntington National Bank, with 18 originations, and LMCU, with 21 originations; of the “top 5 lenders”
5 Charts/tables in this section were derived from LendingPatternsTM reports entitled “FFIEC Redlining Risk Factor R2” (see Appendix E).
Disparity Analysis
12 HMDA Data Analysis for the Cities of Muskegon, Muskegon Heights, and Norton Shores July 2019
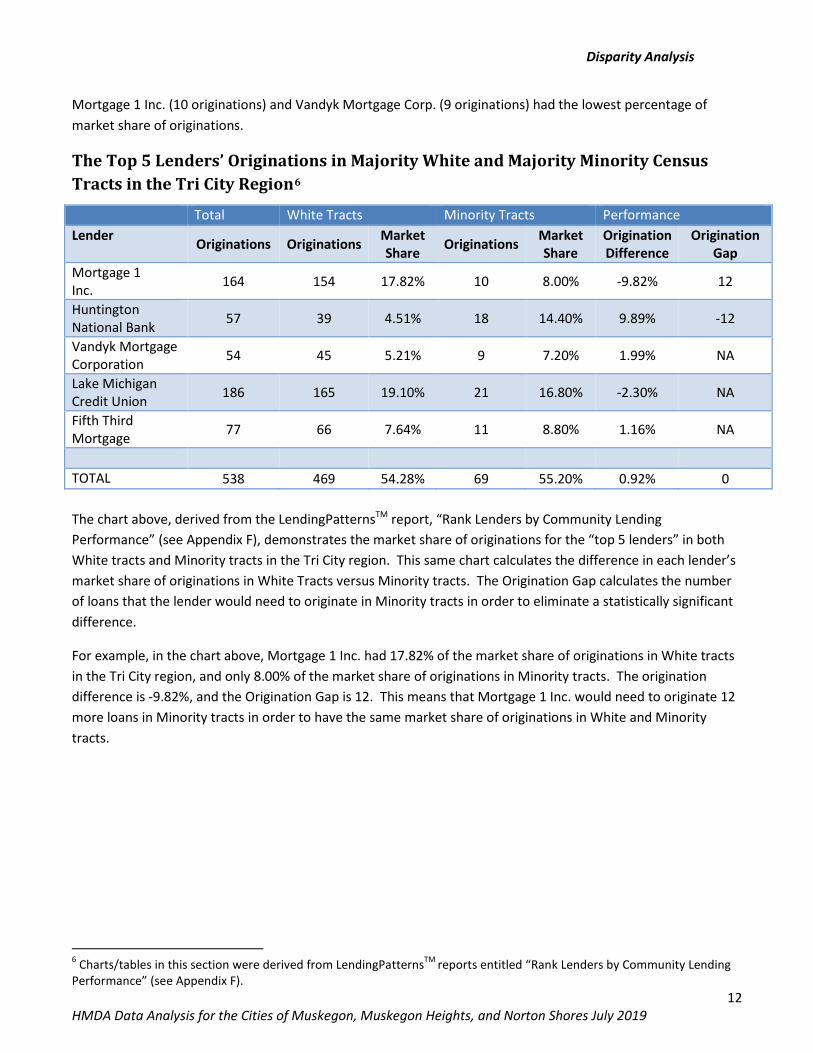
Mortgage 1 Inc. (10 originations) and Vandyk Mortgage Corp. (9 originations) had the lowest percentage of market share of originations.
The Top 5 Lenders’ Originations in Majority White and Majority Minority Census Tracts in the Tri City Region6
Total White Tracts Minority Tracts Performance Lender Originations Originations Market
Share Originations Market Share
Origination Difference
Origination Gap
Mortgage 1 Inc. 164 154 17.82% 10 8.00% -9.82% 12
Huntington National Bank 57 39 4.51% 18 14.40% 9.89% -12
Vandyk Mortgage Corporation 54 45 5.21% 9 7.20% 1.99% NA
Lake Michigan Credit Union 186 165 19.10% 21 16.80% -2.30% NA
Fifth Third Mortgage 77 66 7.64% 11 8.80% 1.16% NA
TOTAL 538 469 54.28% 69 55.20% 0.92% 0 The chart above, derived from the LendingPatternsTM report, “Rank Lenders by Community Lending Performance” (see Appendix F), demonstrates the market share of originations for the “top 5 lenders” in both White tracts and Minority tracts in the Tri City region. This same chart calculates the difference in each lender’s market share of originations in White Tracts versus Minority tracts. The Origination Gap calculates the number of loans that the lender would need to originate in Minority tracts in order to eliminate a statistically significant difference.
For example, in the chart above, Mortgage 1 Inc. had 17.82% of the market share of originations in White tracts in the Tri City region, and only 8.00% of the market share of originations in Minority tracts. The origination difference is -9.82%, and the Origination Gap is 12. This means that Mortgage 1 Inc. would need to originate 12 more loans in Minority tracts in order to have the same market share of originations in White and Minority tracts.
6 Charts/tables in this section were derived from LendingPatternsTM reports entitled “Rank Lenders by Community Lending Performance” (see Appendix F).
Primary Conclusions
13 HMDA Data Analysis for the Cities of Muskegon, Muskegon Heights, and Norton Shores July 2019
Primary Conclusions
Market Overview
Where loans were made
Based upon 2017 HMDA data, Minority and Low and Middle Income Census tracts throughout the Tri City region are underrepresented in the total number of loans made. This is especially true in Muskegon Heights where a total of only 13 home purchase loans were originated in 2017.
• Of the 3 Cities, loan applications made in Norton Shores were the most likely to be originated, and applications in Muskegon Heights were the least likely to be originated.
• Both loan applications and loan originations from Low and Middle Income Census tracts throughout the three (3) Cities were underrepresented when compared to the relevant population and loans applied for and originated in High Income Census tracts.
• Loan applications and originations in Minority Census tracts in the Tri City region were also underrepresented as compared to the relevant population and loans applied for and originated in Non-Minority Census tracts.
• There were over 40 times more loans made in the City of Muskegon than in the City of Muskegon Heights, while the population of Muskegon is only about five (5) times the population of Muskegon Heights
• Muskegon Heights had a strikingly low number of loan activity. There were only 25 loan applications submitted for properties in Muskegon Heights during the year and only 13 loans originated.
Which borrowers got loans
Based upon 2017 HMDA data, White borrowers disproportionately applied for and received loans throughout the Tri City region. This was regardless of the racial demographics of the City. Further, Middle and Upper Income borrowers were 25% more likely to have their loan originated than a Low to Moderate Income borrower.
• The percentage of both applications and originations by minority borrowers, particularly for Black borrowers in each of the Cities, were disproportionately lower than the percentage of minorities within each of the Cities.
• Throughout the Cities, Low Income borrowers received very few loans, and experienced higher rates of denial.
Which institutions were getting the most applications and making the most loans
While the banking industry continues to change to meet the needs of its clients and the communities they serve, the location of branches and the types of services provided, including access to mortgage lenders does seem to impact the quantity, amount, and location of loan activity of the institution.
• The mortgage market in the Tri City region is very segmented in that 89 different lending institutions own 50% of the market share, many of whom received only 1 loan application each. Many of these
Primary Conclusions
14 HMDA Data Analysis for the Cities of Muskegon, Muskegon Heights, and Norton Shores July 2019
lenders have no physical presence in the Tri City region. On the other hand, the “top 5 lenders” own the other 50% of the market share and do have branches located in certain parts of the Tri City region.
• There is a correlation between the access to physical branch locations and the number of applications received by each of the Cities.
o There were only 25 loan applications submitted in Muskegon Heights during 2017, 11 of which were submitted to the “top 5 lenders”. Not one of the “top 5 lenders” appears to have a branch located within the boundaries of Muskegon Heights.
o Despite the fact that the Cities of Muskegon Heights and Norton Shores both have few branch locations within the City limits, the City of Norton Shores had significantly more loan applications and originations than the City of Muskegon Heights.
Why loans were not originated
Over 20% of loan applications were not originated, primarily due to withdrawn and denied loan applications. The overall denial rate for mortgage applications was 8% for the Tri City region.
• Housing loan applications were denied by financial institutions for a variety of reasons, but credit history, a high amount of debt relative to income, and lack of collateral were the top three reasons for loan application denial across the Tri City region.
o Collateral – in many cases this means that the appraised value of the property was too low to support the loan amount. Some contributing factors to low appraised values could include, but not be limited to, lack of available sales comparables (especially due to sales inactivity in Muskegon Heights), lasting impact of the foreclosure crisis and lack of maintenance of Real Estate Owned properties, and underwriting issues that keep the valuations down. Appraisals that fail to support sufficient collateral for the loan amount have ripple effects on successful loan applications. When mortgages are not made for homes sold on a multiple listing service, there then can lack sufficient adequate comparables to support future appraisals or to support mortgages on new homes built in low income neighborhoods.
o Debt-to-income ratio and credit history were main barriers to getting a loan. Socio-economic factors continue to impact a borrower’s ability to access home loans. These factors may include stagnant wages for low to moderate income households, the rising cost of healthcare, the cost of college education, and others that can severely limit a borrower’s ability to qualify for a mortgage.
• The City of Muskegon Heights had over 40% of loan applications denied, a denial rate over 30% higher than the Cities of Muskegon or Norton Shores.
Disparity Analysis
The disparity between the loan application and origination rates among White applicants and minority applicants is significant as compared to the demographics of the Cities. Disparity in lending activity suggests that a higher proportion of minority households will be distanced from homeownership opportunities, thereby limiting the potential for these households to build equity and generational wealth through homeownership.
Primary Conclusions
15 HMDA Data Analysis for the Cities of Muskegon, Muskegon Heights, and Norton Shores July 2019
Redlining risk factor
• Minority Census tracts are underrepresented in loan applications and originations. Loan applications in Black Census tracts had a 55% approval rate compared to loan applications in White Census tracts that had an 82% approval rate. For both Minority Census tracts and Black/Hispanic Census tracts, the approval rate was 62%.
The Top 5 Lenders’ Originations in Majority White and Majority Minority Census Tracts
• Two (2) out of the “top 5 lenders” have disproportionate origination rates in White and Minority Census tracts, according to LendingPatternsTM. For example, Mortgage 1 had 17.82% of the market share of originations in White Census tracts in the Tri City region, but only 8.00% of the market share of originations in Minority Census tracts. The origination difference is -9.82%, and the Origination Gap is 12. This means that Mortgage 1 Inc. would need to originate 12 more loans in Minority Census tracts in order to have the same market share of originations in White and Minority Census tracts. This level of disparity is identified as statistically significant in a LendingPatternsTM redlining risk analysis.
Recommendations
16 HMDA Data Analysis for the Cities of Muskegon, Muskegon Heights, and Norton Shores July 2019
Recommendations
How the Cities of Muskegon, Muskegon Heights and Norton Shores might use this HMDA data
With the information in this report, the Cities of Muskegon, Muskegon Heights, and Norton Shores can decide what steps should be taken to address any disparities or issues that may serve as impediments to access to mortgage loans for its residents. These steps might include, but not be limited to, outreach and education efforts, homebuyer education programs and other programs for low-income borrowers, neighborhood stabilization efforts, collaborations with lending institutions and the real estate industry, community partnerships, and investigation of individuals or entities that appear to be in violation of fair housing laws. The Cities should consider the following recommendations in order to address the disparities and conclusions identified in this report:
RECOMMENDATION: Provide the public with information about the lending performance of institutions reporting under HMDA by making this report and any other relevant reports publicly available via accessible online and print venues.
RECOMMENDATION: Increase the number applications and originations from Minority and Low to Moderate Income borrowers and borrowers in Minority and Low to Moderate Income Census tracts.
Potential Action Steps:
o Expend resources on homebuyer outreach and education initiatives in order to increase the number of Minority and Low to Moderate Income borrowers who apply for loans.
o Partner with non-profit and faith-based organizations, real estate agents, lenders and others to provide greater education and outreach to Minority and Low to Moderate Income Census tracts to increase understanding of the dangers of and lessen the use of predatory lenders, reverse mortgages and other products that can reduce equity.
o Partner with non-profit and faith-based organizations, real estate agents, lenders and others to support the delivery of financial literacy classes and information to potential borrowers in preparation for seeking a mortgage as well as for students as a part of their high school and college curriculum. Financial literacy prepares households to qualify with the best credit terms, eliminates the major obstacles in the home buying process, and makes it possible for households to build equity through homeownership. Ensure that the information is provided in languages other than English to meet the needs of the community.
o Conduct creative, engaging efforts to help create demand for loans in Minority and Low to Moderate Income Census tracts. This could include outreach to real estate agents and brokers, lenders, and others regarding community assets. This could also include tours or promotional events in partnership with neighborhood organizations, business associations, Chambers of Commerce, etc. to bring real estate industry members, potential buyers, lenders and other into these Census tracts.
Recommendations
17 HMDA Data Analysis for the Cities of Muskegon, Muskegon Heights, and Norton Shores July 2019
RECOMMENDATION: Support the loan-readiness of borrowers to reduce the number of loan applications denied due to credit history or debt-to-income ratio.
Potential Action Steps:
o Partner with non-profit and faith-based organizations, real estate agents, lenders and others to support the delivery of credit counseling/credit repair to help prepare households to qualify for a mortgage loan. Ensure that the information is provided in languages other than English to meet the needs of the community.
o Partner with non-profit and faith-based organizations, real estate agents, lenders and others to create micro loan programs and other banking products to help potential borrowers remediate their deficient credit history.
RECOMMENDATION: Determine specific objectives regarding making loans and otherwise promoting greater investment activity in low-income and minority neighborhoods through discussions with lending institutions subject to the Community Reinvestment Act.
Potential Action Steps:
o Encourage lending institutions to ensure that banking services are extended to all Minority and Low to Moderate Income Census tracts and that banking branches are located in places that are convenient to those Census tracts.
o Limit the spread of predatory lenders such as payday lenders or check cashing services by working with traditional financial institutions to offer products and services that help households establish or re-establish checking, savings, and credit accounts.
o Work with underwriters to examine and adjust the criteria used by lenders to better reflect risk and value and to develop a more creative approach that better meets the needs of Minority and Low to Moderate Income Census tracts.
o The Cities can urge lenders to undertake a thorough review of their policies and practices to determine where disparities might exist. This information should be a basis for developing new loan origination and other decision making processes in an aggressive marketing plan to turn around the traditional treatment of minority homeseekers and the neighborhoods where they wish to purchase or improve housing. This requires setting goals, conveying the message to all levels of employees, aggressive outreach to people in minority, racially changing, and lower-income areas, and, where appropriate, providing new programs to reach potential lower-income borrowers. Such programs include reducing down payments and incorporating rehabilitation and "sweat equity" in mortgages.
Recommendations
18 HMDA Data Analysis for the Cities of Muskegon, Muskegon Heights, and Norton Shores July 2019
RECOMMENDATION: Develop and implement innovative and effective solutions to reduce the number of loan applications denied due to collateral and authentically increase and stabilize property valuations.
Potential Action Steps:
o Evaluate the feasibility of creating maintenance and small improvement escrow accounts or other home modification programs for affordable home buyers and/or existing homeowners that can be supplemented with local, state, or federal dollars to help cover the cost of repairs and increase property values.
o Evaluate the feasibility of creating and implementing post-purchase support programs in conjunction with non-profit development partners to provide preventative maintenance training as well as organize neighborhood programming such as associations, crime watch, and other initiatives aimed at strengthening and maintaining neighborhood stability.
o Promote fundamental changes in the criteria used by appraisers and real estate brokers who together with lending institutions play a part in the ultimate decisions about making credit available to potential borrowers.
Work with the appraisal industry to develop a more creative approach that better meets the needs of Minority and Low to Moderate Income Census tracts.
Encourage comparability studies to identify real estate comparables that more realistically reflect the values of homes being built in low income areas and areas that have similar housing that can be used for comparison in establishing real estate values.
Consider incentives for lower loan amounts.
RECOMMENDATION: Identify lending institutions that should be contacted to explain their lending policies and/or practices. Questions could include asking such institutions if they have reviewed and documented the reasons for discrepancies in lending rates by race or ethnicity, and if not, why not. Lending institutions should carry out a thorough self-assessment of policies and procedures to determine where unnecessary and inappropriate criteria or assumptions serve as barriers to providing credit in such neighborhoods to such potential borrowers.
RECOMMENDATION: Support research, investigations, and enforcement of lending institutions and mortgage companies pertaining to disparities, predatory lending, redlining and other practices and policies that may limit fair access to credit opportunity and homeownership.
HMDA Data Analysis for the Cities of Muskegon, Muskegon Heights, and Norton Shores July 2019
Appendix A
Lender's HMDA OverviewLendingPatterns 6/13/2019
Year: 2017
Lender(s): All Lenders
Geography: Muskegon city (MI)
Loan Amount: Conforming,Jumbo
Tract Income: All
Tract % Minority: All
Hispanic Ethnicity: All Property Type: 1-4 Family
Preapproval Requested?: All HOEPA Loan?: All Lien Status: All
Spread Reported?: All
Action Loan Type Purpose Occupancy Investor Race Income Sex Originated
RejectedDenied
WithdrawnIncomplete
Preappr. DeniedPreappr. Rejected
All Purchase All All All All All
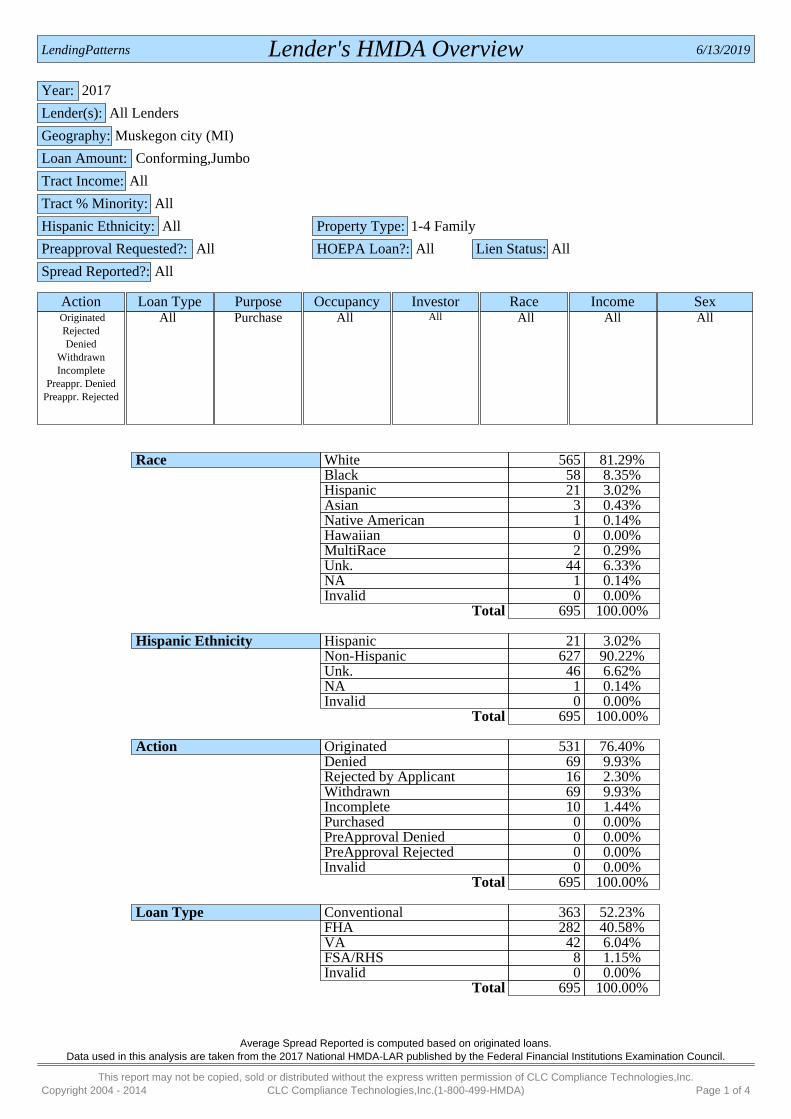
Race White 565 81.29%Black 58 8.35%Hispanic 21 3.02%Asian 3 0.43%Native American 1 0.14%Hawaiian 0 0.00%MultiRace 2 0.29%Unk. 44 6.33%NA 1 0.14%Invalid 0 0.00%
Total 695 100.00%
Hispanic Ethnicity Hispanic 21 3.02%Non-Hispanic 627 90.22%Unk. 46 6.62%NA 1 0.14%Invalid 0 0.00%
Total 695 100.00%
Action Originated 531 76.40%Denied 69 9.93%Rejected by Applicant 16 2.30%Withdrawn 69 9.93%Incomplete 10 1.44%Purchased 0 0.00%PreApproval Denied 0 0.00%PreApproval Rejected 0 0.00%Invalid 0 0.00%
Total 695 100.00%
Loan Type Conventional 363 52.23%FHA 282 40.58%VA 42 6.04%FSA/RHS 8 1.15%Invalid 0 0.00%
Total 695 100.00%
Average Spread Reported is computed based on originated loans.Data used in this analysis are taken from the 2017 National HMDA-LAR published by the Federal Financial Institutions Examination Council.
This report may not be copied, sold or distributed without the express written permission of CLC Compliance Technologies,Inc.Copyright 2004 - 2014 CLC Compliance Technologies,Inc.(1-800-499-HMDA) Page 1 of 4

Lender's HMDA OverviewLendingPatterns 6/13/2019
Year: 2017
Lender(s): All Lenders
Geography: Muskegon city (MI)
Loan Amount: Conforming,Jumbo
Tract Income: All
Tract % Minority: All
Hispanic Ethnicity: All Property Type: 1-4 Family
Preapproval Requested?: All HOEPA Loan?: All Lien Status: All
Spread Reported?: All
Action Loan Type Purpose Occupancy Investor Race Income Sex Originated
RejectedDenied
WithdrawnIncomplete
Preappr. DeniedPreappr. Rejected
All Purchase All All All All All
Occupancy Owner Occupied 641 92.23%Non-Owner Occupied 53 7.63%NA 1 0.14%Invalid 0 0.00%
Total 695 100.00%
Purpose Purchase 695 100.00%Home Improvement 0 0.00%Refinance 0 0.00%Invalid 0 0.00%
Total 695 100.00%
Income Low 92 13.24%Moderate 231 33.24%Middle 161 23.17%Upper 210 30.22%Unk/NA 1 0.14%Invalid 0 0.00%
Total 695 100.00%
Gender Male Primary 148 21.29%Female Primary 49 7.05%Female (no co-app.) 192 27.63%Male (no co-app.) 266 38.27%Same Gender 13 1.87%Unk 26 3.74%NA 1 0.14%Invalid 0 0.00%
Total 695 100.00%
Apps with at least one Male vs. Female(s) with no Male.Gender Rollup Male 468 67.34%
Female 199 28.63%Other 28 4.03%Invalid 0 0.00%
Total 695 100.00%
Average Spread Reported is computed based on originated loans.Data used in this analysis are taken from the 2017 National HMDA-LAR published by the Federal Financial Institutions Examination Council.
This report may not be copied, sold or distributed without the express written permission of CLC Compliance Technologies,Inc.Copyright 2004 - 2014 CLC Compliance Technologies,Inc.(1-800-499-HMDA) Page 2 of 4

Lender's HMDA OverviewLendingPatterns 6/13/2019
Year: 2017
Lender(s): All Lenders
Geography: Muskegon city (MI)
Loan Amount: Conforming,Jumbo
Tract Income: All
Tract % Minority: All
Hispanic Ethnicity: All Property Type: 1-4 Family
Preapproval Requested?: All HOEPA Loan?: All Lien Status: All
Spread Reported?: All
Action Loan Type Purpose Occupancy Investor Race Income Sex Originated
RejectedDenied
WithdrawnIncomplete
Preappr. DeniedPreappr. Rejected
All Purchase All All All All All
Investor Fannie Mae 84 12.09%Ginnie Mae 95 13.67%Freddie Mac 58 8.35%Farmer Mac 0 0.00%Non Agency 209 30.07%Not Sold 249 35.83%Invalid 0 0.00%
Total 695 100.00%
Amount Conforming 694 99.86%Jumbo 1 0.14%Invalid 0 0.00%
Total 695 100.00%
Average Loan Amount First Lien ($000) 106.72Subordinate Lien ($000) 11.60Other Lien ($000) 0.00
Tract Income Low 34 4.89%Moderate 293 42.16%Middle 328 47.19%Upper 40 5.76%Unk/NA 0 0.00%
Total 695 100.00%
Tract % Minority <10% 368 52.95%10-20% 66 9.50%20-30% 0 0.00%30-40% 41 5.90%40-50% 41 5.90%50-60% 154 22.16%60-70% 18 2.59%70-80% 0 0.00%80-90% 0 0.00%90-100% 7 1.01%Unk/NA 0 0.00%
Total 695 100.00%
Average Spread Reported is computed based on originated loans.Data used in this analysis are taken from the 2017 National HMDA-LAR published by the Federal Financial Institutions Examination Council.
This report may not be copied, sold or distributed without the express written permission of CLC Compliance Technologies,Inc.Copyright 2004 - 2014 CLC Compliance Technologies,Inc.(1-800-499-HMDA) Page 3 of 4

Lender's HMDA OverviewLendingPatterns 6/13/2019
Year: 2017
Lender(s): All Lenders
Geography: Muskegon city (MI)
Loan Amount: Conforming,Jumbo
Tract Income: All
Tract % Minority: All
Hispanic Ethnicity: All Property Type: 1-4 Family
Preapproval Requested?: All HOEPA Loan?: All Lien Status: All
Spread Reported?: All
Action Loan Type Purpose Occupancy Investor Race Income Sex Originated
RejectedDenied
WithdrawnIncomplete
Preappr. DeniedPreappr. Rejected
All Purchase All All All All All
HOEPA HOEPA Loans 0 0.00%Non-HOEPA Loans 695 100.00%Invalid 0 0.00%
Total 695 100.00%
Lien Status First Liens 690 99.28%Subordinate Liens 5 0.72%Not Secured by Lien 0 0.00%NA 0 0.00%Invalid 0 0.00%
Total 695 100.00%
Property Type One to Four 695 100.00%Manufactured 0 0.00%Multifamily 0 0.00%Invalid 0 0.00%
Total 695 100.00%
PreApproval PreApproval Requested 74 10.65%PreApproval Not Requested 260 37.41%NA 361 51.94%Invalid 0 0.00%
Total 695 100.00%
Spread Reported Yes 108 20.34%No 423 79.66%Invalid 0 0.00%
Total Loans 531 100.00%
Average Spread Reported First Lien Spread 1.88Subordinate Lien Spread 4.90Other Lien Spread 0.00
Average Spread Reported is computed based on originated loans.Data used in this analysis are taken from the 2017 National HMDA-LAR published by the Federal Financial Institutions Examination Council.
This report may not be copied, sold or distributed without the express written permission of CLC Compliance Technologies,Inc.Copyright 2004 - 2014 CLC Compliance Technologies,Inc.(1-800-499-HMDA) Page 4 of 4

Lender's HMDA OverviewLendingPatterns 6/13/2019
Year: 2017
Lender(s): All Lenders
Geography: Muskegon city (MI)
Loan Amount: Conforming,Jumbo
Tract Income: All
Tract % Minority: All
Hispanic Ethnicity: All Property Type: 1-4 Family
Preapproval Requested?: All HOEPA Loan?: All Lien Status: All
Spread Reported?: All
Action Loan Type Purpose Occupancy Investor Race Income Sex Originated All Purchase All All All All All
Race White 439 82.67%Black 37 6.97%Hispanic 17 3.20%Asian 2 0.38%Native American 1 0.19%Hawaiian 0 0.00%MultiRace 1 0.19%Unk. 33 6.21%NA 1 0.19%Invalid 0 0.00%
Total 531 100.00%
Hispanic Ethnicity Hispanic 17 3.20%Non-Hispanic 479 90.21%Unk. 34 6.40%NA 1 0.19%Invalid 0 0.00%
Total 531 100.00%
Action Originated 531 100.00%Denied 0 0.00%Rejected by Applicant 0 0.00%Withdrawn 0 0.00%Incomplete 0 0.00%Purchased 0 0.00%PreApproval Denied 0 0.00%PreApproval Rejected 0 0.00%Invalid 0 0.00%
Total 531 100.00%
Loan Type Conventional 296 55.74%FHA 199 37.48%VA 31 5.84%FSA/RHS 5 0.94%Invalid 0 0.00%
Total 531 100.00%
Average Spread Reported is computed based on originated loans.Data used in this analysis are taken from the 2017 National HMDA-LAR published by the Federal Financial Institutions Examination Council.
This report may not be copied, sold or distributed without the express written permission of CLC Compliance Technologies,Inc.Copyright 2004 - 2014 CLC Compliance Technologies,Inc.(1-800-499-HMDA) Page 1 of 4

Lender's HMDA OverviewLendingPatterns 6/13/2019
Year: 2017
Lender(s): All Lenders
Geography: Muskegon city (MI)
Loan Amount: Conforming,Jumbo
Tract Income: All
Tract % Minority: All
Hispanic Ethnicity: All Property Type: 1-4 Family
Preapproval Requested?: All HOEPA Loan?: All Lien Status: All
Spread Reported?: All
Action Loan Type Purpose Occupancy Investor Race Income Sex Originated All Purchase All All All All All
Occupancy Owner Occupied 489 92.09%Non-Owner Occupied 41 7.72%NA 1 0.19%Invalid 0 0.00%
Total 531 100.00%
Purpose Purchase 531 100.00%Home Improvement 0 0.00%Refinance 0 0.00%Invalid 0 0.00%
Total 531 100.00%
Income Low 57 10.73%Moderate 165 31.07%Middle 132 24.86%Upper 176 33.15%Unk/NA 1 0.19%Invalid 0 0.00%
Total 531 100.00%
Gender Male Primary 123 23.16%Female Primary 38 7.16%Female (no co-app.) 137 25.80%Male (no co-app.) 205 38.61%Same Gender 8 1.51%Unk 19 3.58%NA 1 0.19%Invalid 0 0.00%
Total 531 100.00%
Apps with at least one Male vs. Female(s) with no Male.Gender Rollup Male 369 69.49%
Female 141 26.55%Other 21 3.95%Invalid 0 0.00%
Total 531 100.00%
Average Spread Reported is computed based on originated loans.Data used in this analysis are taken from the 2017 National HMDA-LAR published by the Federal Financial Institutions Examination Council.
This report may not be copied, sold or distributed without the express written permission of CLC Compliance Technologies,Inc.Copyright 2004 - 2014 CLC Compliance Technologies,Inc.(1-800-499-HMDA) Page 2 of 4
Lender's HMDA OverviewLendingPatterns 6/13/2019
Year: 2017
Lender(s): All Lenders
Geography: Muskegon city (MI)
Loan Amount: Conforming,Jumbo
Tract Income: All
Tract % Minority: All
Hispanic Ethnicity: All Property Type: 1-4 Family
Preapproval Requested?: All HOEPA Loan?: All Lien Status: All
Spread Reported?: All
Action Loan Type Purpose Occupancy Investor Race Income Sex Originated All Purchase All All All All All
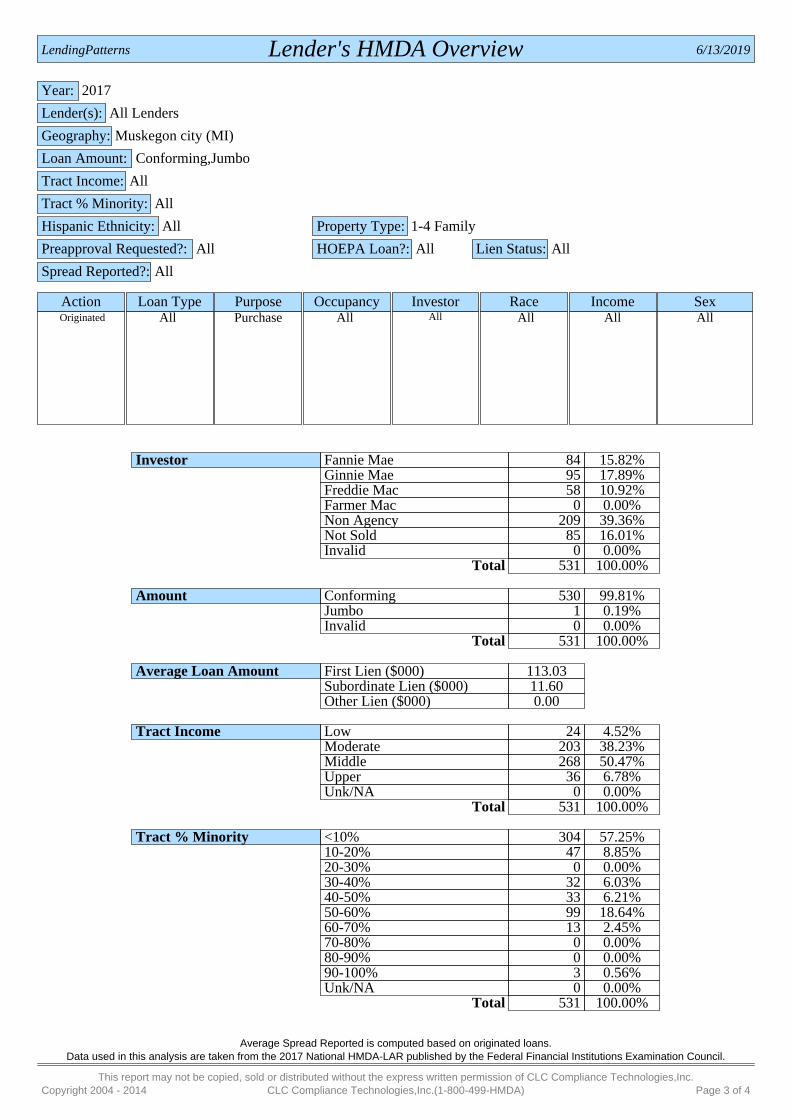
Investor Fannie Mae 84 15.82%Ginnie Mae 95 17.89%Freddie Mac 58 10.92%Farmer Mac 0 0.00%Non Agency 209 39.36%Not Sold 85 16.01%Invalid 0 0.00%
Total 531 100.00%
Amount Conforming 530 99.81%Jumbo 1 0.19%Invalid 0 0.00%
Total 531 100.00%
Average Loan Amount First Lien ($000) 113.03Subordinate Lien ($000) 11.60Other Lien ($000) 0.00
Tract Income Low 24 4.52%Moderate 203 38.23%Middle 268 50.47%Upper 36 6.78%Unk/NA 0 0.00%
Total 531 100.00%
Tract % Minority <10% 304 57.25%10-20% 47 8.85%20-30% 0 0.00%30-40% 32 6.03%40-50% 33 6.21%50-60% 99 18.64%60-70% 13 2.45%70-80% 0 0.00%80-90% 0 0.00%90-100% 3 0.56%Unk/NA 0 0.00%
Total 531 100.00%
Average Spread Reported is computed based on originated loans.Data used in this analysis are taken from the 2017 National HMDA-LAR published by the Federal Financial Institutions Examination Council.
This report may not be copied, sold or distributed without the express written permission of CLC Compliance Technologies,Inc.Copyright 2004 - 2014 CLC Compliance Technologies,Inc.(1-800-499-HMDA) Page 3 of 4
Lender's HMDA OverviewLendingPatterns 6/13/2019
Year: 2017
Lender(s): All Lenders
Geography: Muskegon city (MI)
Loan Amount: Conforming,Jumbo
Tract Income: All
Tract % Minority: All
Hispanic Ethnicity: All Property Type: 1-4 Family
Preapproval Requested?: All HOEPA Loan?: All Lien Status: All
Spread Reported?: All
Action Loan Type Purpose Occupancy Investor Race Income Sex Originated All Purchase All All All All All
HOEPA HOEPA Loans 0 0.00%Non-HOEPA Loans 531 100.00%Invalid 0 0.00%
Total 531 100.00%
Lien Status First Liens 526 99.06%Subordinate Liens 5 0.94%Not Secured by Lien 0 0.00%NA 0 0.00%Invalid 0 0.00%
Total 531 100.00%
Property Type One to Four 531 100.00%Manufactured 0 0.00%Multifamily 0 0.00%Invalid 0 0.00%
Total 531 100.00%
PreApproval PreApproval Requested 53 9.98%PreApproval Not Requested 200 37.66%NA 278 52.35%Invalid 0 0.00%
Total 531 100.00%
Spread Reported Yes 108 20.34%No 423 79.66%Invalid 0 0.00%
Total Loans 531 100.00%
Average Spread Reported First Lien Spread 1.88Subordinate Lien Spread 4.90Other Lien Spread 0.00
Average Spread Reported is computed based on originated loans.Data used in this analysis are taken from the 2017 National HMDA-LAR published by the Federal Financial Institutions Examination Council.
This report may not be copied, sold or distributed without the express written permission of CLC Compliance Technologies,Inc.Copyright 2004 - 2014 CLC Compliance Technologies,Inc.(1-800-499-HMDA) Page 4 of 4
Lender's HMDA OverviewLendingPatterns 5/29/2019
Year: 2017
Lender(s): All Lenders
Geography: Muskegon Heights city (MI)
Loan Amount: Conforming,Jumbo
Tract Income: All
Tract % Minority: All
Hispanic Ethnicity: All Property Type: 1-4 Family
Preapproval Requested?: All HOEPA Loan?: All Lien Status: All
Spread Reported?: All
Action Loan Type Purpose Occupancy Investor Race Income Sex Originated
RejectedDenied
WithdrawnIncomplete
Preappr. DeniedPreappr. Rejected
All Purchase All All All All All
Race White 12 41.38%Black 10 34.48%Hispanic 1 3.45%Asian 0 0.00%Native American 2 6.90%Hawaiian 0 0.00%MultiRace 0 0.00%Unk. 4 13.79%NA 0 0.00%Invalid 0 0.00%
Total 29 100.00%
Hispanic Ethnicity Hispanic 1 3.45%Non-Hispanic 24 82.76%Unk. 4 13.79%NA 0 0.00%Invalid 0 0.00%
Total 29 100.00%
Action Originated 13 44.83%Denied 12 41.38%Rejected by Applicant 0 0.00%Withdrawn 2 6.90%Incomplete 2 6.90%Purchased 0 0.00%PreApproval Denied 0 0.00%PreApproval Rejected 0 0.00%Invalid 0 0.00%
Total 29 100.00%
Loan Type Conventional 11 37.93%FHA 16 55.17%VA 1 3.45%FSA/RHS 1 3.45%Invalid 0 0.00%
Total 29 100.00%
Average Spread Reported is computed based on originated loans.Data used in this analysis are taken from the 2017 National HMDA-LAR published by the Federal Financial Institutions Examination Council.
This report may not be copied, sold or distributed without the express written permission of CLC Compliance Technologies,Inc.Copyright 2004 - 2014 CLC Compliance Technologies,Inc.(1-800-499-HMDA) Page 1 of 4

Lender's HMDA OverviewLendingPatterns 5/29/2019
Year: 2017
Lender(s): All Lenders
Geography: Muskegon Heights city (MI)
Loan Amount: Conforming,Jumbo
Tract Income: All
Tract % Minority: All
Hispanic Ethnicity: All Property Type: 1-4 Family
Preapproval Requested?: All HOEPA Loan?: All Lien Status: All
Spread Reported?: All
Action Loan Type Purpose Occupancy Investor Race Income Sex Originated
RejectedDenied
WithdrawnIncomplete
Preappr. DeniedPreappr. Rejected
All Purchase All All All All All
Occupancy Owner Occupied 25 86.21%Non-Owner Occupied 4 13.79%NA 0 0.00%Invalid 0 0.00%
Total 29 100.00%
Purpose Purchase 29 100.00%Home Improvement 0 0.00%Refinance 0 0.00%Invalid 0 0.00%
Total 29 100.00%
Income Low 5 17.24%Moderate 9 31.03%Middle 7 24.14%Upper 8 27.59%Unk/NA 0 0.00%Invalid 0 0.00%
Total 29 100.00%
Gender Male Primary 4 13.79%Female Primary 0 0.00%Female (no co-app.) 5 17.24%Male (no co-app.) 17 58.62%Same Gender 1 3.45%Unk 2 6.90%NA 0 0.00%Invalid 0 0.00%
Total 29 100.00%
Apps with at least one Male vs. Female(s) with no Male.Gender Rollup Male 22 75.86%
Female 5 17.24%Other 2 6.90%Invalid 0 0.00%
Total 29 100.00%
Average Spread Reported is computed based on originated loans.Data used in this analysis are taken from the 2017 National HMDA-LAR published by the Federal Financial Institutions Examination Council.
This report may not be copied, sold or distributed without the express written permission of CLC Compliance Technologies,Inc.Copyright 2004 - 2014 CLC Compliance Technologies,Inc.(1-800-499-HMDA) Page 2 of 4
Lender's HMDA OverviewLendingPatterns 5/29/2019
Year: 2017
Lender(s): All Lenders
Geography: Muskegon Heights city (MI)
Loan Amount: Conforming,Jumbo
Tract Income: All
Tract % Minority: All
Hispanic Ethnicity: All Property Type: 1-4 Family
Preapproval Requested?: All HOEPA Loan?: All Lien Status: All
Spread Reported?: All
Action Loan Type Purpose Occupancy Investor Race Income Sex Originated
RejectedDenied
WithdrawnIncomplete
Preappr. DeniedPreappr. Rejected
All Purchase All All All All All
Investor Fannie Mae 2 6.90%Ginnie Mae 3 10.34%Freddie Mac 1 3.45%Farmer Mac 0 0.00%Non Agency 6 20.69%Not Sold 17 58.62%Invalid 0 0.00%
Total 29 100.00%
Amount Conforming 29 100.00%Jumbo 0 0.00%Invalid 0 0.00%
Total 29 100.00%
Average Loan Amount First Lien ($000) 58.00Subordinate Lien ($000) 0.00Other Lien ($000) 0.00
Tract Income Low 18 62.07%Moderate 11 37.93%Middle 0 0.00%Upper 0 0.00%Unk/NA 0 0.00%
Total 29 100.00%
Tract % Minority <10% 0 0.00%10-20% 0 0.00%20-30% 0 0.00%30-40% 0 0.00%40-50% 0 0.00%50-60% 0 0.00%60-70% 16 55.17%70-80% 0 0.00%80-90% 4 13.79%90-100% 9 31.03%Unk/NA 0 0.00%
Total 29 100.00%
Average Spread Reported is computed based on originated loans.Data used in this analysis are taken from the 2017 National HMDA-LAR published by the Federal Financial Institutions Examination Council.
This report may not be copied, sold or distributed without the express written permission of CLC Compliance Technologies,Inc.Copyright 2004 - 2014 CLC Compliance Technologies,Inc.(1-800-499-HMDA) Page 3 of 4

Lender's HMDA OverviewLendingPatterns 5/29/2019
Year: 2017
Lender(s): All Lenders
Geography: Muskegon Heights city (MI)
Loan Amount: Conforming,Jumbo
Tract Income: All
Tract % Minority: All
Hispanic Ethnicity: All Property Type: 1-4 Family
Preapproval Requested?: All HOEPA Loan?: All Lien Status: All
Spread Reported?: All
Action Loan Type Purpose Occupancy Investor Race Income Sex Originated
RejectedDenied
WithdrawnIncomplete
Preappr. DeniedPreappr. Rejected
All Purchase All All All All All
HOEPA HOEPA Loans 0 0.00%Non-HOEPA Loans 29 100.00%Invalid 0 0.00%
Total 29 100.00%
Lien Status First Liens 29 100.00%Subordinate Liens 0 0.00%Not Secured by Lien 0 0.00%NA 0 0.00%Invalid 0 0.00%
Total 29 100.00%
Property Type One to Four 29 100.00%Manufactured 0 0.00%Multifamily 0 0.00%Invalid 0 0.00%
Total 29 100.00%
PreApproval PreApproval Requested 2 6.90%PreApproval Not Requested 8 27.59%NA 19 65.52%Invalid 0 0.00%
Total 29 100.00%
Spread Reported Yes 7 53.85%No 6 46.15%Invalid 0 0.00%
Total Loans 13 100.00%
Average Spread Reported First Lien Spread 2.12Subordinate Lien Spread 0.00Other Lien Spread 0.00
Average Spread Reported is computed based on originated loans.Data used in this analysis are taken from the 2017 National HMDA-LAR published by the Federal Financial Institutions Examination Council.
This report may not be copied, sold or distributed without the express written permission of CLC Compliance Technologies,Inc.Copyright 2004 - 2014 CLC Compliance Technologies,Inc.(1-800-499-HMDA) Page 4 of 4

Lender's HMDA OverviewLendingPatterns 6/13/2019
Year: 2017
Lender(s): All Lenders
Geography: Muskegon Heights city (MI)
Loan Amount: Conforming,Jumbo
Tract Income: All
Tract % Minority: All
Hispanic Ethnicity: All Property Type: 1-4 Family
Preapproval Requested?: All HOEPA Loan?: All Lien Status: All
Spread Reported?: All
Action Loan Type Purpose Occupancy Investor Race Income Sex Originated All Purchase All All All All All
Race White 7 53.85%Black 5 38.46%Hispanic 0 0.00%Asian 0 0.00%Native American 1 7.69%Hawaiian 0 0.00%MultiRace 0 0.00%Unk. 0 0.00%NA 0 0.00%Invalid 0 0.00%
Total 13 100.00%
Hispanic Ethnicity Hispanic 0 0.00%Non-Hispanic 12 92.31%Unk. 1 7.69%NA 0 0.00%Invalid 0 0.00%
Total 13 100.00%
Action Originated 13 100.00%Denied 0 0.00%Rejected by Applicant 0 0.00%Withdrawn 0 0.00%Incomplete 0 0.00%Purchased 0 0.00%PreApproval Denied 0 0.00%PreApproval Rejected 0 0.00%Invalid 0 0.00%
Total 13 100.00%
Loan Type Conventional 4 30.77%FHA 9 69.23%VA 0 0.00%FSA/RHS 0 0.00%Invalid 0 0.00%
Total 13 100.00%
Average Spread Reported is computed based on originated loans.Data used in this analysis are taken from the 2017 National HMDA-LAR published by the Federal Financial Institutions Examination Council.
This report may not be copied, sold or distributed without the express written permission of CLC Compliance Technologies,Inc.Copyright 2004 - 2014 CLC Compliance Technologies,Inc.(1-800-499-HMDA) Page 1 of 4

Lender's HMDA OverviewLendingPatterns 6/13/2019
Year: 2017
Lender(s): All Lenders
Geography: Muskegon Heights city (MI)
Loan Amount: Conforming,Jumbo
Tract Income: All
Tract % Minority: All
Hispanic Ethnicity: All Property Type: 1-4 Family
Preapproval Requested?: All HOEPA Loan?: All Lien Status: All
Spread Reported?: All
Action Loan Type Purpose Occupancy Investor Race Income Sex Originated All Purchase All All All All All
Occupancy Owner Occupied 12 92.31%Non-Owner Occupied 1 7.69%NA 0 0.00%Invalid 0 0.00%
Total 13 100.00%
Purpose Purchase 13 100.00%Home Improvement 0 0.00%Refinance 0 0.00%Invalid 0 0.00%
Total 13 100.00%
Income Low 2 15.38%Moderate 6 46.15%Middle 3 23.08%Upper 2 15.38%Unk/NA 0 0.00%Invalid 0 0.00%
Total 13 100.00%
Gender Male Primary 1 7.69%Female Primary 0 0.00%Female (no co-app.) 4 30.77%Male (no co-app.) 8 61.54%Same Gender 0 0.00%Unk 0 0.00%NA 0 0.00%Invalid 0 0.00%
Total 13 100.00%
Apps with at least one Male vs. Female(s) with no Male.Gender Rollup Male 9 69.23%
Female 4 30.77%Other 0 0.00%Invalid 0 0.00%
Total 13 100.00%
Average Spread Reported is computed based on originated loans.Data used in this analysis are taken from the 2017 National HMDA-LAR published by the Federal Financial Institutions Examination Council.
This report may not be copied, sold or distributed without the express written permission of CLC Compliance Technologies,Inc.Copyright 2004 - 2014 CLC Compliance Technologies,Inc.(1-800-499-HMDA) Page 2 of 4

Lender's HMDA OverviewLendingPatterns 6/13/2019
Year: 2017
Lender(s): All Lenders
Geography: Muskegon Heights city (MI)
Loan Amount: Conforming,Jumbo
Tract Income: All
Tract % Minority: All
Hispanic Ethnicity: All Property Type: 1-4 Family
Preapproval Requested?: All HOEPA Loan?: All Lien Status: All
Spread Reported?: All
Action Loan Type Purpose Occupancy Investor Race Income Sex Originated All Purchase All All All All All
Investor Fannie Mae 2 15.38%Ginnie Mae 3 23.08%Freddie Mac 1 7.69%Farmer Mac 0 0.00%Non Agency 6 46.15%Not Sold 1 7.69%Invalid 0 0.00%
Total 13 100.00%
Amount Conforming 13 100.00%Jumbo 0 0.00%Invalid 0 0.00%
Total 13 100.00%
Average Loan Amount First Lien ($000) 59.23Subordinate Lien ($000) 0.00Other Lien ($000) 0.00
Tract Income Low 8 61.54%Moderate 5 38.46%Middle 0 0.00%Upper 0 0.00%Unk/NA 0 0.00%
Total 13 100.00%
Tract % Minority <10% 0 0.00%10-20% 0 0.00%20-30% 0 0.00%30-40% 0 0.00%40-50% 0 0.00%50-60% 0 0.00%60-70% 8 61.54%70-80% 0 0.00%80-90% 2 15.38%90-100% 3 23.08%Unk/NA 0 0.00%
Total 13 100.00%
Average Spread Reported is computed based on originated loans.Data used in this analysis are taken from the 2017 National HMDA-LAR published by the Federal Financial Institutions Examination Council.
This report may not be copied, sold or distributed without the express written permission of CLC Compliance Technologies,Inc.Copyright 2004 - 2014 CLC Compliance Technologies,Inc.(1-800-499-HMDA) Page 3 of 4

Lender's HMDA OverviewLendingPatterns 6/13/2019
Year: 2017
Lender(s): All Lenders
Geography: Muskegon Heights city (MI)
Loan Amount: Conforming,Jumbo
Tract Income: All
Tract % Minority: All
Hispanic Ethnicity: All Property Type: 1-4 Family
Preapproval Requested?: All HOEPA Loan?: All Lien Status: All
Spread Reported?: All
Action Loan Type Purpose Occupancy Investor Race Income Sex Originated All Purchase All All All All All
HOEPA HOEPA Loans 0 0.00%Non-HOEPA Loans 13 100.00%Invalid 0 0.00%
Total 13 100.00%
Lien Status First Liens 13 100.00%Subordinate Liens 0 0.00%Not Secured by Lien 0 0.00%NA 0 0.00%Invalid 0 0.00%
Total 13 100.00%
Property Type One to Four 13 100.00%Manufactured 0 0.00%Multifamily 0 0.00%Invalid 0 0.00%
Total 13 100.00%
PreApproval PreApproval Requested 1 7.69%PreApproval Not Requested 6 46.15%NA 6 46.15%Invalid 0 0.00%
Total 13 100.00%
Spread Reported Yes 7 53.85%No 6 46.15%Invalid 0 0.00%
Total Loans 13 100.00%
Average Spread Reported First Lien Spread 2.12Subordinate Lien Spread 0.00Other Lien Spread 0.00
Average Spread Reported is computed based on originated loans.Data used in this analysis are taken from the 2017 National HMDA-LAR published by the Federal Financial Institutions Examination Council.
This report may not be copied, sold or distributed without the express written permission of CLC Compliance Technologies,Inc.Copyright 2004 - 2014 CLC Compliance Technologies,Inc.(1-800-499-HMDA) Page 4 of 4

Lender's HMDA OverviewLendingPatterns 6/13/2019
Year: 2017
Lender(s): All Lenders
Geography: Norton Shores city (MI)
Loan Amount: Conforming,Jumbo
Tract Income: All
Tract % Minority: All
Hispanic Ethnicity: All Property Type: 1-4 Family
Preapproval Requested?: All HOEPA Loan?: All Lien Status: All
Spread Reported?: All
Action Loan Type Purpose Occupancy Investor Race Income Sex Originated
RejectedDenied
WithdrawnIncomplete
Preappr. DeniedPreappr. Rejected
All Purchase All All All All All
Race White 469 85.43%Black 23 4.19%Hispanic 24 4.37%Asian 2 0.36%Native American 3 0.55%Hawaiian 0 0.00%MultiRace 1 0.18%Unk. 27 4.92%NA 0 0.00%Invalid 0 0.00%
Total 549 100.00%
Hispanic Ethnicity Hispanic 24 4.37%Non-Hispanic 494 89.98%Unk. 31 5.65%NA 0 0.00%Invalid 0 0.00%
Total 549 100.00%
Action Originated 456 83.06%Denied 35 6.38%Rejected by Applicant 11 2.00%Withdrawn 39 7.10%Incomplete 8 1.46%Purchased 0 0.00%PreApproval Denied 0 0.00%PreApproval Rejected 0 0.00%Invalid 0 0.00%
Total 549 100.00%
Loan Type Conventional 359 65.39%FHA 158 28.78%VA 32 5.83%FSA/RHS 0 0.00%Invalid 0 0.00%
Total 549 100.00%
Average Spread Reported is computed based on originated loans.Data used in this analysis are taken from the 2017 National HMDA-LAR published by the Federal Financial Institutions Examination Council.
This report may not be copied, sold or distributed without the express written permission of CLC Compliance Technologies,Inc.Copyright 2004 - 2014 CLC Compliance Technologies,Inc.(1-800-499-HMDA) Page 1 of 4

Lender's HMDA OverviewLendingPatterns 6/13/2019
Year: 2017
Lender(s): All Lenders
Geography: Norton Shores city (MI)
Loan Amount: Conforming,Jumbo
Tract Income: All
Tract % Minority: All
Hispanic Ethnicity: All Property Type: 1-4 Family
Preapproval Requested?: All HOEPA Loan?: All Lien Status: All
Spread Reported?: All
Action Loan Type Purpose Occupancy Investor Race Income Sex Originated
RejectedDenied
WithdrawnIncomplete
Preappr. DeniedPreappr. Rejected
All Purchase All All All All All
Occupancy Owner Occupied 513 93.44%Non-Owner Occupied 35 6.38%NA 1 0.18%Invalid 0 0.00%
Total 549 100.00%
Purpose Purchase 549 100.00%Home Improvement 0 0.00%Refinance 0 0.00%Invalid 0 0.00%
Total 549 100.00%
Income Low 37 6.74%Moderate 136 24.77%Middle 143 26.05%Upper 229 41.71%Unk/NA 4 0.73%Invalid 0 0.00%
Total 549 100.00%
Gender Male Primary 152 27.69%Female Primary 37 6.74%Female (no co-app.) 125 22.77%Male (no co-app.) 199 36.25%Same Gender 18 3.28%Unk 18 3.28%NA 0 0.00%Invalid 0 0.00%
Total 549 100.00%
Apps with at least one Male vs. Female(s) with no Male.Gender Rollup Male 399 72.68%
Female 132 24.04%Other 18 3.28%Invalid 0 0.00%
Total 549 100.00%
Average Spread Reported is computed based on originated loans.Data used in this analysis are taken from the 2017 National HMDA-LAR published by the Federal Financial Institutions Examination Council.
This report may not be copied, sold or distributed without the express written permission of CLC Compliance Technologies,Inc.Copyright 2004 - 2014 CLC Compliance Technologies,Inc.(1-800-499-HMDA) Page 2 of 4
Lender's HMDA OverviewLendingPatterns 6/13/2019
Year: 2017
Lender(s): All Lenders
Geography: Norton Shores city (MI)
Loan Amount: Conforming,Jumbo
Tract Income: All
Tract % Minority: All
Hispanic Ethnicity: All Property Type: 1-4 Family
Preapproval Requested?: All HOEPA Loan?: All Lien Status: All
Spread Reported?: All
Action Loan Type Purpose Occupancy Investor Race Income Sex Originated
RejectedDenied
WithdrawnIncomplete
Preappr. DeniedPreappr. Rejected
All Purchase All All All All All
Investor Fannie Mae 84 15.30%Ginnie Mae 61 11.11%Freddie Mac 59 10.75%Farmer Mac 0 0.00%Non Agency 196 35.70%Not Sold 149 27.14%Invalid 0 0.00%
Total 549 100.00%
Amount Conforming 540 98.36%Jumbo 9 1.64%Invalid 0 0.00%
Total 549 100.00%
Average Loan Amount First Lien ($000) 149.62Subordinate Lien ($000) 106.00Other Lien ($000) 0.00
Tract Income Low 16 2.91%Moderate 33 6.01%Middle 0 0.00%Upper 500 91.07%Unk/NA 0 0.00%
Total 549 100.00%
Tract % Minority <10% 187 34.06%10-20% 346 63.02%20-30% 0 0.00%30-40% 0 0.00%40-50% 0 0.00%50-60% 0 0.00%60-70% 16 2.91%70-80% 0 0.00%80-90% 0 0.00%90-100% 0 0.00%Unk/NA 0 0.00%
Total 549 100.00%
Average Spread Reported is computed based on originated loans.Data used in this analysis are taken from the 2017 National HMDA-LAR published by the Federal Financial Institutions Examination Council.
This report may not be copied, sold or distributed without the express written permission of CLC Compliance Technologies,Inc.Copyright 2004 - 2014 CLC Compliance Technologies,Inc.(1-800-499-HMDA) Page 3 of 4

Lender's HMDA OverviewLendingPatterns 6/13/2019
Year: 2017
Lender(s): All Lenders
Geography: Norton Shores city (MI)
Loan Amount: Conforming,Jumbo
Tract Income: All
Tract % Minority: All
Hispanic Ethnicity: All Property Type: 1-4 Family
Preapproval Requested?: All HOEPA Loan?: All Lien Status: All
Spread Reported?: All
Action Loan Type Purpose Occupancy Investor Race Income Sex Originated
RejectedDenied
WithdrawnIncomplete
Preappr. DeniedPreappr. Rejected
All Purchase All All All All All
HOEPA HOEPA Loans 0 0.00%Non-HOEPA Loans 549 100.00%Invalid 0 0.00%
Total 549 100.00%
Lien Status First Liens 547 99.64%Subordinate Liens 2 0.36%Not Secured by Lien 0 0.00%NA 0 0.00%Invalid 0 0.00%
Total 549 100.00%
Property Type One to Four 549 100.00%Manufactured 0 0.00%Multifamily 0 0.00%Invalid 0 0.00%
Total 549 100.00%
PreApproval PreApproval Requested 44 8.01%PreApproval Not Requested 197 35.88%NA 308 56.10%Invalid 0 0.00%
Total 549 100.00%
Spread Reported Yes 50 10.96%No 406 89.04%Invalid 0 0.00%
Total Loans 456 100.00%
Average Spread Reported First Lien Spread 1.85Subordinate Lien Spread 0.00Other Lien Spread 0.00
Average Spread Reported is computed based on originated loans.Data used in this analysis are taken from the 2017 National HMDA-LAR published by the Federal Financial Institutions Examination Council.
This report may not be copied, sold or distributed without the express written permission of CLC Compliance Technologies,Inc.Copyright 2004 - 2014 CLC Compliance Technologies,Inc.(1-800-499-HMDA) Page 4 of 4
Lender's HMDA OverviewLendingPatterns 6/13/2019
Year: 2017
Lender(s): All Lenders
Geography: Norton Shores city (MI)
Loan Amount: Conforming,Jumbo
Tract Income: All
Tract % Minority: All
Hispanic Ethnicity: All Property Type: 1-4 Family
Preapproval Requested?: All HOEPA Loan?: All Lien Status: All
Spread Reported?: All
Action Loan Type Purpose Occupancy Investor Race Income Sex Originated All Purchase All All All All All
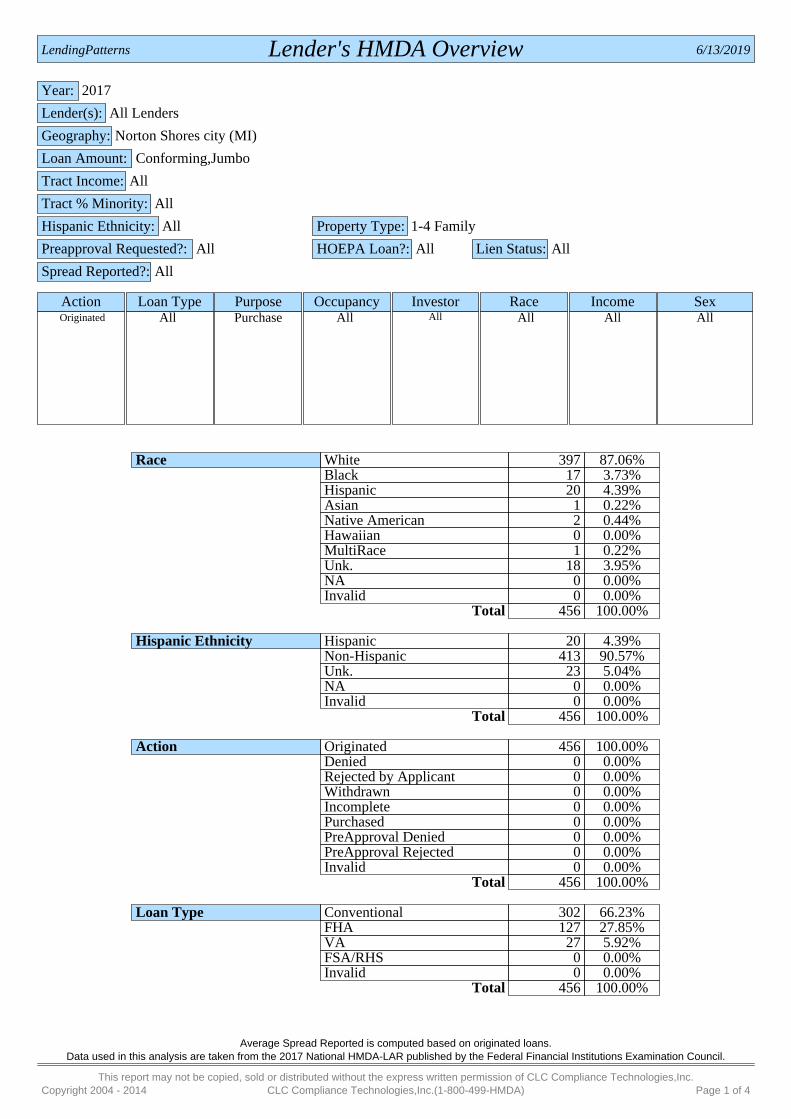
Race White 397 87.06%Black 17 3.73%Hispanic 20 4.39%Asian 1 0.22%Native American 2 0.44%Hawaiian 0 0.00%MultiRace 1 0.22%Unk. 18 3.95%NA 0 0.00%Invalid 0 0.00%
Total 456 100.00%
Hispanic Ethnicity Hispanic 20 4.39%Non-Hispanic 413 90.57%Unk. 23 5.04%NA 0 0.00%Invalid 0 0.00%
Total 456 100.00%
Action Originated 456 100.00%Denied 0 0.00%Rejected by Applicant 0 0.00%Withdrawn 0 0.00%Incomplete 0 0.00%Purchased 0 0.00%PreApproval Denied 0 0.00%PreApproval Rejected 0 0.00%Invalid 0 0.00%
Total 456 100.00%
Loan Type Conventional 302 66.23%FHA 127 27.85%VA 27 5.92%FSA/RHS 0 0.00%Invalid 0 0.00%
Total 456 100.00%
Average Spread Reported is computed based on originated loans.Data used in this analysis are taken from the 2017 National HMDA-LAR published by the Federal Financial Institutions Examination Council.
This report may not be copied, sold or distributed without the express written permission of CLC Compliance Technologies,Inc.Copyright 2004 - 2014 CLC Compliance Technologies,Inc.(1-800-499-HMDA) Page 1 of 4
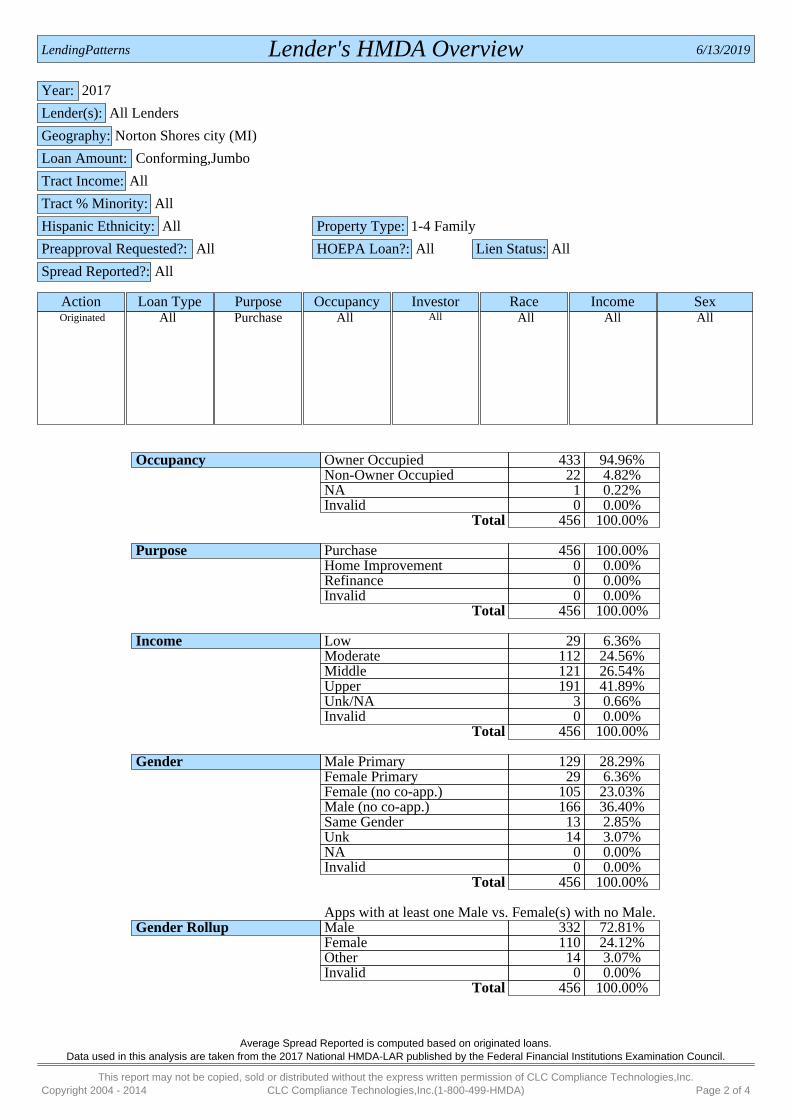
Lender's HMDA OverviewLendingPatterns 6/13/2019
Year: 2017
Lender(s): All Lenders
Geography: Norton Shores city (MI)
Loan Amount: Conforming,Jumbo
Tract Income: All
Tract % Minority: All
Hispanic Ethnicity: All Property Type: 1-4 Family
Preapproval Requested?: All HOEPA Loan?: All Lien Status: All
Spread Reported?: All
Action Loan Type Purpose Occupancy Investor Race Income Sex Originated All Purchase All All All All All
Occupancy Owner Occupied 433 94.96%Non-Owner Occupied 22 4.82%NA 1 0.22%Invalid 0 0.00%
Total 456 100.00%
Purpose Purchase 456 100.00%Home Improvement 0 0.00%Refinance 0 0.00%Invalid 0 0.00%
Total 456 100.00%
Income Low 29 6.36%Moderate 112 24.56%Middle 121 26.54%Upper 191 41.89%Unk/NA 3 0.66%Invalid 0 0.00%
Total 456 100.00%
Gender Male Primary 129 28.29%Female Primary 29 6.36%Female (no co-app.) 105 23.03%Male (no co-app.) 166 36.40%Same Gender 13 2.85%Unk 14 3.07%NA 0 0.00%Invalid 0 0.00%
Total 456 100.00%
Apps with at least one Male vs. Female(s) with no Male.Gender Rollup Male 332 72.81%
Female 110 24.12%Other 14 3.07%Invalid 0 0.00%
Total 456 100.00%
Average Spread Reported is computed based on originated loans.Data used in this analysis are taken from the 2017 National HMDA-LAR published by the Federal Financial Institutions Examination Council.
This report may not be copied, sold or distributed without the express written permission of CLC Compliance Technologies,Inc.Copyright 2004 - 2014 CLC Compliance Technologies,Inc.(1-800-499-HMDA) Page 2 of 4

Lender's HMDA OverviewLendingPatterns 6/13/2019
Year: 2017
Lender(s): All Lenders
Geography: Norton Shores city (MI)
Loan Amount: Conforming,Jumbo
Tract Income: All
Tract % Minority: All
Hispanic Ethnicity: All Property Type: 1-4 Family
Preapproval Requested?: All HOEPA Loan?: All Lien Status: All
Spread Reported?: All
Action Loan Type Purpose Occupancy Investor Race Income Sex Originated All Purchase All All All All All
Investor Fannie Mae 84 18.42%Ginnie Mae 61 13.38%Freddie Mac 59 12.94%Farmer Mac 0 0.00%Non Agency 196 42.98%Not Sold 56 12.28%Invalid 0 0.00%
Total 456 100.00%
Amount Conforming 447 98.03%Jumbo 9 1.97%Invalid 0 0.00%
Total 456 100.00%
Average Loan Amount First Lien ($000) 154.41Subordinate Lien ($000) 112.00Other Lien ($000) 0.00
Tract Income Low 8 1.75%Moderate 24 5.26%Middle 0 0.00%Upper 424 92.98%Unk/NA 0 0.00%
Total 456 100.00%
Tract % Minority <10% 164 35.96%10-20% 284 62.28%20-30% 0 0.00%30-40% 0 0.00%40-50% 0 0.00%50-60% 0 0.00%60-70% 8 1.75%70-80% 0 0.00%80-90% 0 0.00%90-100% 0 0.00%Unk/NA 0 0.00%
Total 456 100.00%
Average Spread Reported is computed based on originated loans.Data used in this analysis are taken from the 2017 National HMDA-LAR published by the Federal Financial Institutions Examination Council.
This report may not be copied, sold or distributed without the express written permission of CLC Compliance Technologies,Inc.Copyright 2004 - 2014 CLC Compliance Technologies,Inc.(1-800-499-HMDA) Page 3 of 4
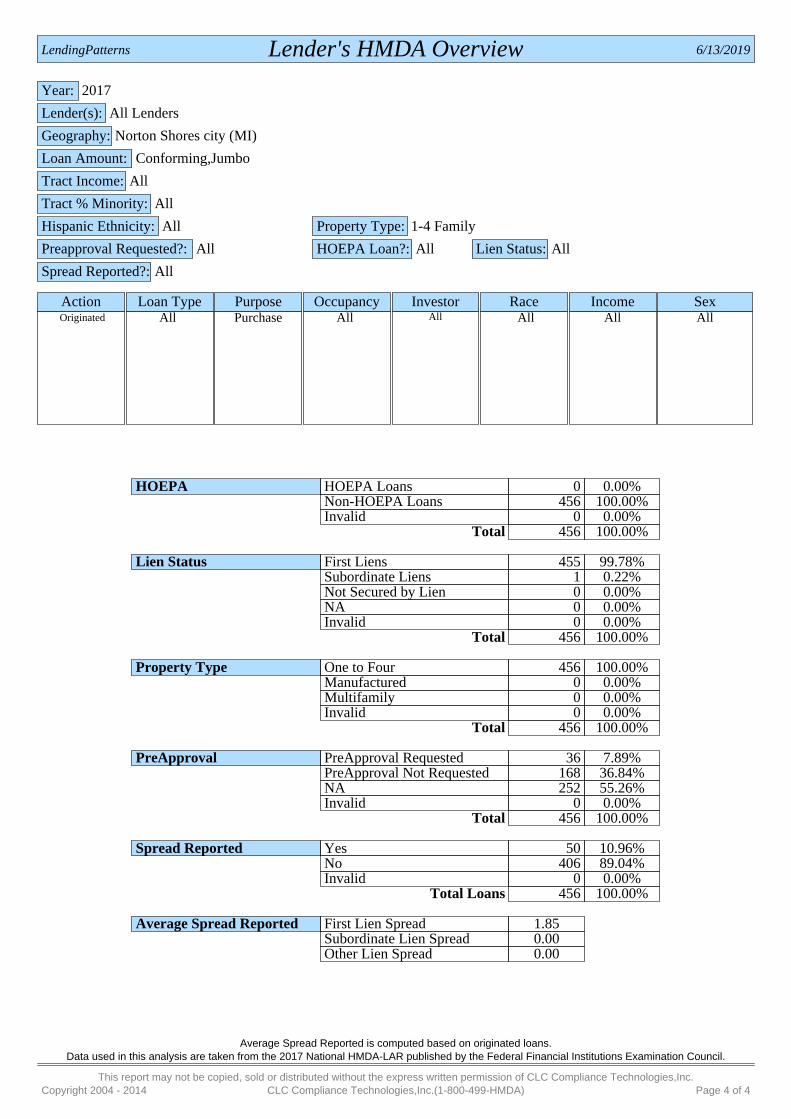
Lender's HMDA OverviewLendingPatterns 6/13/2019
Year: 2017
Lender(s): All Lenders
Geography: Norton Shores city (MI)
Loan Amount: Conforming,Jumbo
Tract Income: All
Tract % Minority: All
Hispanic Ethnicity: All Property Type: 1-4 Family
Preapproval Requested?: All HOEPA Loan?: All Lien Status: All
Spread Reported?: All
Action Loan Type Purpose Occupancy Investor Race Income Sex Originated All Purchase All All All All All
HOEPA HOEPA Loans 0 0.00%Non-HOEPA Loans 456 100.00%Invalid 0 0.00%
Total 456 100.00%
Lien Status First Liens 455 99.78%Subordinate Liens 1 0.22%Not Secured by Lien 0 0.00%NA 0 0.00%Invalid 0 0.00%
Total 456 100.00%
Property Type One to Four 456 100.00%Manufactured 0 0.00%Multifamily 0 0.00%Invalid 0 0.00%
Total 456 100.00%
PreApproval PreApproval Requested 36 7.89%PreApproval Not Requested 168 36.84%NA 252 55.26%Invalid 0 0.00%
Total 456 100.00%
Spread Reported Yes 50 10.96%No 406 89.04%Invalid 0 0.00%
Total Loans 456 100.00%
Average Spread Reported First Lien Spread 1.85Subordinate Lien Spread 0.00Other Lien Spread 0.00
Average Spread Reported is computed based on originated loans.Data used in this analysis are taken from the 2017 National HMDA-LAR published by the Federal Financial Institutions Examination Council.
This report may not be copied, sold or distributed without the express written permission of CLC Compliance Technologies,Inc.Copyright 2004 - 2014 CLC Compliance Technologies,Inc.(1-800-499-HMDA) Page 4 of 4

Lender's HMDA OverviewLendingPatterns 6/20/2019
Year: 2017
Lender(s): All Lenders
Geography: Muskegon_MuskegonHeights_NortonShores (Custom Area)
Loan Amount: Conforming,Jumbo
Tract Income: All
Tract % Minority: All
Hispanic Ethnicity: All Property Type: 1-4 Family
Preapproval Requested?: All HOEPA Loan?: All Lien Status: All
Spread Reported?: All
Action Loan Type Purpose Occupancy Investor Race Income Sex Originated
RejectedDenied
WithdrawnIncomplete
Preappr. DeniedPreappr. Rejected
All Purchase All All All All All
Race White 1,037 82.96%Black 83 6.64%Hispanic 45 3.60%Asian 5 0.40%Native American 4 0.32%Hawaiian 0 0.00%MultiRace 3 0.24%Unk. 72 5.76%NA 1 0.08%Invalid 0 0.00%
Total 1,250 100.00%
Hispanic Ethnicity Hispanic 45 3.60%Non-Hispanic 1,126 90.08%Unk. 78 6.24%NA 1 0.08%Invalid 0 0.00%
Total 1,250 100.00%
Action Originated 989 79.12%Denied 108 8.64%Rejected by Applicant 27 2.16%Withdrawn 108 8.64%Incomplete 18 1.44%Purchased 0 0.00%PreApproval Denied 0 0.00%PreApproval Rejected 0 0.00%Invalid 0 0.00%
Total 1,250 100.00%
Loan Type Conventional 725 58.00%FHA 442 35.36%VA 74 5.92%FSA/RHS 9 0.72%Invalid 0 0.00%
Total 1,250 100.00%
Average Spread Reported is computed based on originated loans.Data used in this analysis are taken from the 2017 National HMDA-LAR published by the Federal Financial Institutions Examination Council.
This report may not be copied, sold or distributed without the express written permission of CLC Compliance Technologies,Inc.Copyright 2004 - 2014 CLC Compliance Technologies,Inc.(1-800-499-HMDA) Page 1 of 4
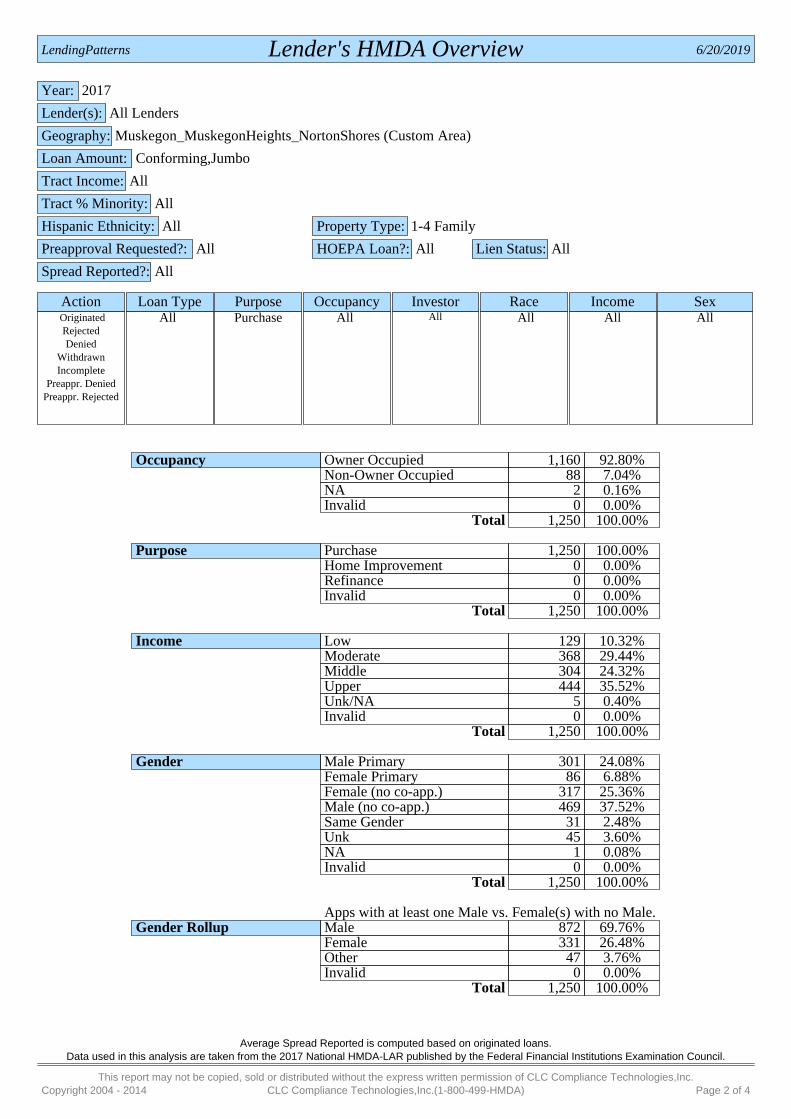
Lender's HMDA OverviewLendingPatterns 6/20/2019
Year: 2017
Lender(s): All Lenders
Geography: Muskegon_MuskegonHeights_NortonShores (Custom Area)
Loan Amount: Conforming,Jumbo
Tract Income: All
Tract % Minority: All
Hispanic Ethnicity: All Property Type: 1-4 Family
Preapproval Requested?: All HOEPA Loan?: All Lien Status: All
Spread Reported?: All
Action Loan Type Purpose Occupancy Investor Race Income Sex Originated
RejectedDenied
WithdrawnIncomplete
Preappr. DeniedPreappr. Rejected
All Purchase All All All All All
Occupancy Owner Occupied 1,160 92.80%Non-Owner Occupied 88 7.04%NA 2 0.16%Invalid 0 0.00%
Total 1,250 100.00%
Purpose Purchase 1,250 100.00%Home Improvement 0 0.00%Refinance 0 0.00%Invalid 0 0.00%
Total 1,250 100.00%
Income Low 129 10.32%Moderate 368 29.44%Middle 304 24.32%Upper 444 35.52%Unk/NA 5 0.40%Invalid 0 0.00%
Total 1,250 100.00%
Gender Male Primary 301 24.08%Female Primary 86 6.88%Female (no co-app.) 317 25.36%Male (no co-app.) 469 37.52%Same Gender 31 2.48%Unk 45 3.60%NA 1 0.08%Invalid 0 0.00%
Total 1,250 100.00%
Apps with at least one Male vs. Female(s) with no Male.Gender Rollup Male 872 69.76%
Female 331 26.48%Other 47 3.76%Invalid 0 0.00%
Total 1,250 100.00%
Average Spread Reported is computed based on originated loans.Data used in this analysis are taken from the 2017 National HMDA-LAR published by the Federal Financial Institutions Examination Council.
This report may not be copied, sold or distributed without the express written permission of CLC Compliance Technologies,Inc.Copyright 2004 - 2014 CLC Compliance Technologies,Inc.(1-800-499-HMDA) Page 2 of 4
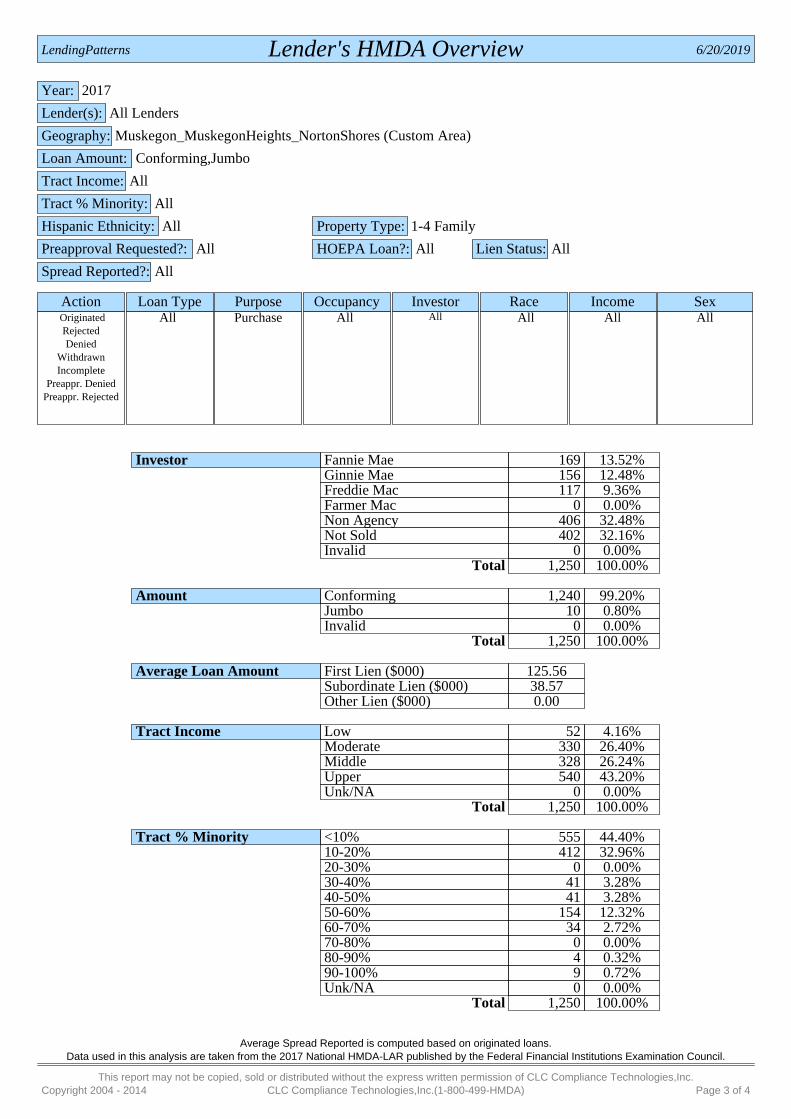
Lender's HMDA OverviewLendingPatterns 6/20/2019
Year: 2017
Lender(s): All Lenders
Geography: Muskegon_MuskegonHeights_NortonShores (Custom Area)
Loan Amount: Conforming,Jumbo
Tract Income: All
Tract % Minority: All
Hispanic Ethnicity: All Property Type: 1-4 Family
Preapproval Requested?: All HOEPA Loan?: All Lien Status: All
Spread Reported?: All
Action Loan Type Purpose Occupancy Investor Race Income Sex Originated
RejectedDenied
WithdrawnIncomplete
Preappr. DeniedPreappr. Rejected
All Purchase All All All All All
Investor Fannie Mae 169 13.52%Ginnie Mae 156 12.48%Freddie Mac 117 9.36%Farmer Mac 0 0.00%Non Agency 406 32.48%Not Sold 402 32.16%Invalid 0 0.00%
Total 1,250 100.00%
Amount Conforming 1,240 99.20%Jumbo 10 0.80%Invalid 0 0.00%
Total 1,250 100.00%
Average Loan Amount First Lien ($000) 125.56Subordinate Lien ($000) 38.57Other Lien ($000) 0.00
Tract Income Low 52 4.16%Moderate 330 26.40%Middle 328 26.24%Upper 540 43.20%Unk/NA 0 0.00%
Total 1,250 100.00%
Tract % Minority <10% 555 44.40%10-20% 412 32.96%20-30% 0 0.00%30-40% 41 3.28%40-50% 41 3.28%50-60% 154 12.32%60-70% 34 2.72%70-80% 0 0.00%80-90% 4 0.32%90-100% 9 0.72%Unk/NA 0 0.00%
Total 1,250 100.00%
Average Spread Reported is computed based on originated loans.Data used in this analysis are taken from the 2017 National HMDA-LAR published by the Federal Financial Institutions Examination Council.
This report may not be copied, sold or distributed without the express written permission of CLC Compliance Technologies,Inc.Copyright 2004 - 2014 CLC Compliance Technologies,Inc.(1-800-499-HMDA) Page 3 of 4

Lender's HMDA OverviewLendingPatterns 6/20/2019
Year: 2017
Lender(s): All Lenders
Geography: Muskegon_MuskegonHeights_NortonShores (Custom Area)
Loan Amount: Conforming,Jumbo
Tract Income: All
Tract % Minority: All
Hispanic Ethnicity: All Property Type: 1-4 Family
Preapproval Requested?: All HOEPA Loan?: All Lien Status: All
Spread Reported?: All
Action Loan Type Purpose Occupancy Investor Race Income Sex Originated
RejectedDenied
WithdrawnIncomplete
Preappr. DeniedPreappr. Rejected
All Purchase All All All All All
HOEPA HOEPA Loans 0 0.00%Non-HOEPA Loans 1,250 100.00%Invalid 0 0.00%
Total 1,250 100.00%
Lien Status First Liens 1,243 99.44%Subordinate Liens 7 0.56%Not Secured by Lien 0 0.00%NA 0 0.00%Invalid 0 0.00%
Total 1,250 100.00%
Property Type One to Four 1,250 100.00%Manufactured 0 0.00%Multifamily 0 0.00%Invalid 0 0.00%
Total 1,250 100.00%
PreApproval PreApproval Requested 118 9.44%PreApproval Not Requested 459 36.72%NA 673 53.84%Invalid 0 0.00%
Total 1,250 100.00%
Spread Reported Yes 159 16.08%No 830 83.92%Invalid 0 0.00%
Total Loans 989 100.00%
Average Spread Reported First Lien Spread 1.88Subordinate Lien Spread 4.90Other Lien Spread 0.00
Average Spread Reported is computed based on originated loans.Data used in this analysis are taken from the 2017 National HMDA-LAR published by the Federal Financial Institutions Examination Council.
This report may not be copied, sold or distributed without the express written permission of CLC Compliance Technologies,Inc.Copyright 2004 - 2014 CLC Compliance Technologies,Inc.(1-800-499-HMDA) Page 4 of 4

Lender's HMDA OverviewLendingPatterns 7/15/2019
Year: 2017
Lender(s): All Lenders
Geography: Muskegon_MuskegonHeights_NortonShores (Custom Area)
Loan Amount: Conforming,Jumbo
Tract Income: All
Tract % Minority: All
Hispanic Ethnicity: All Property Type: 1-4 Family
Preapproval Requested?: All HOEPA Loan?: All Lien Status: All
Spread Reported?: All
Action Loan Type Purpose Occupancy Investor Race Income Sex Originated All Purchase All All All All All
Race White 837 84.63%Black 55 5.56%Hispanic 37 3.74%Asian 3 0.30%Native American 3 0.30%Hawaiian 0 0.00%MultiRace 2 0.20%Unk. 51 5.16%NA 1 0.10%Invalid 0 0.00%
Total 989 100.00%
Hispanic Ethnicity Hispanic 37 3.74%Non-Hispanic 894 90.39%Unk. 57 5.76%NA 1 0.10%Invalid 0 0.00%
Total 989 100.00%
Action Originated 989 100.00%Denied 0 0.00%Rejected by Applicant 0 0.00%Withdrawn 0 0.00%Incomplete 0 0.00%Purchased 0 0.00%PreApproval Denied 0 0.00%PreApproval Rejected 0 0.00%Invalid 0 0.00%
Total 989 100.00%
Loan Type Conventional 599 60.57%FHA 327 33.06%VA 58 5.86%FSA/RHS 5 0.51%Invalid 0 0.00%
Total 989 100.00%
Average Spread Reported is computed based on originated loans.Data used in this analysis are taken from the 2017 National HMDA-LAR published by the Federal Financial Institutions Examination Council.
This report may not be copied, sold or distributed without the express written permission of CLC Compliance Technologies,Inc.Copyright 2004 - 2014 CLC Compliance Technologies,Inc.(1-800-499-HMDA) Page 1 of 4
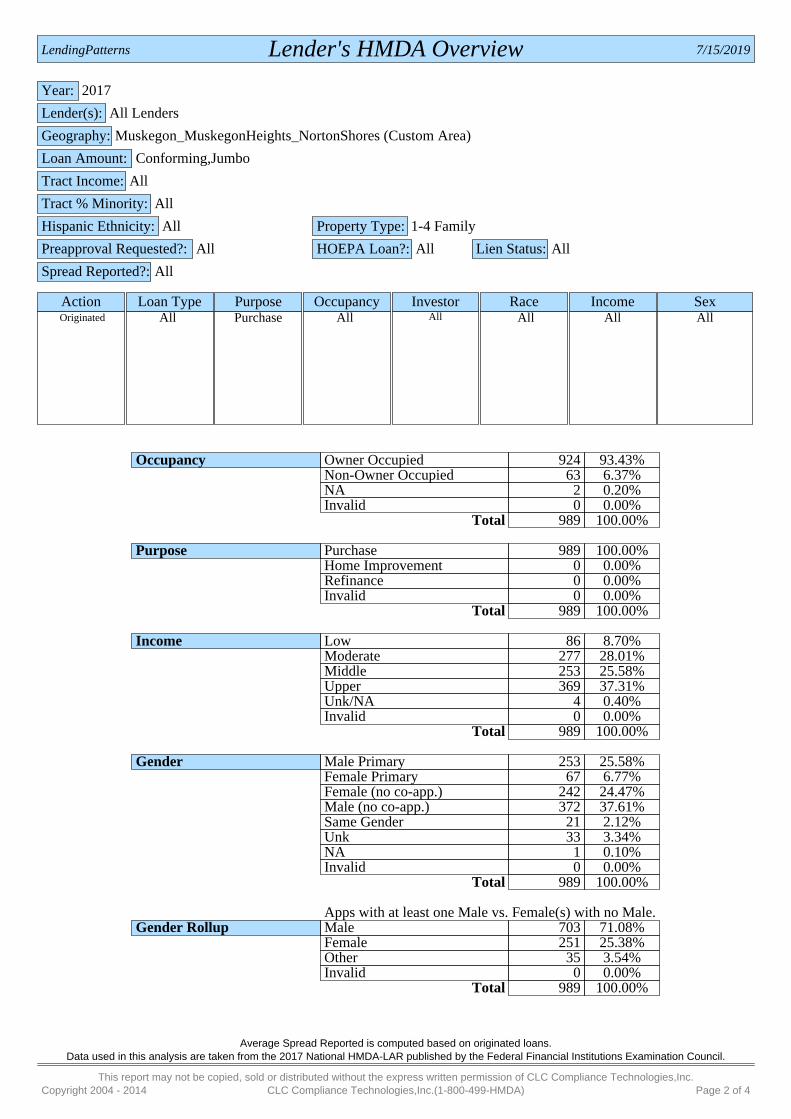
Lender's HMDA OverviewLendingPatterns 7/15/2019
Year: 2017
Lender(s): All Lenders
Geography: Muskegon_MuskegonHeights_NortonShores (Custom Area)
Loan Amount: Conforming,Jumbo
Tract Income: All
Tract % Minority: All
Hispanic Ethnicity: All Property Type: 1-4 Family
Preapproval Requested?: All HOEPA Loan?: All Lien Status: All
Spread Reported?: All
Action Loan Type Purpose Occupancy Investor Race Income Sex Originated All Purchase All All All All All
Occupancy Owner Occupied 924 93.43%Non-Owner Occupied 63 6.37%NA 2 0.20%Invalid 0 0.00%
Total 989 100.00%
Purpose Purchase 989 100.00%Home Improvement 0 0.00%Refinance 0 0.00%Invalid 0 0.00%
Total 989 100.00%
Income Low 86 8.70%Moderate 277 28.01%Middle 253 25.58%Upper 369 37.31%Unk/NA 4 0.40%Invalid 0 0.00%
Total 989 100.00%
Gender Male Primary 253 25.58%Female Primary 67 6.77%Female (no co-app.) 242 24.47%Male (no co-app.) 372 37.61%Same Gender 21 2.12%Unk 33 3.34%NA 1 0.10%Invalid 0 0.00%
Total 989 100.00%
Apps with at least one Male vs. Female(s) with no Male.Gender Rollup Male 703 71.08%
Female 251 25.38%Other 35 3.54%Invalid 0 0.00%
Total 989 100.00%
Average Spread Reported is computed based on originated loans.Data used in this analysis are taken from the 2017 National HMDA-LAR published by the Federal Financial Institutions Examination Council.
This report may not be copied, sold or distributed without the express written permission of CLC Compliance Technologies,Inc.Copyright 2004 - 2014 CLC Compliance Technologies,Inc.(1-800-499-HMDA) Page 2 of 4

Lender's HMDA OverviewLendingPatterns 7/15/2019
Year: 2017
Lender(s): All Lenders
Geography: Muskegon_MuskegonHeights_NortonShores (Custom Area)
Loan Amount: Conforming,Jumbo
Tract Income: All
Tract % Minority: All
Hispanic Ethnicity: All Property Type: 1-4 Family
Preapproval Requested?: All HOEPA Loan?: All Lien Status: All
Spread Reported?: All
Action Loan Type Purpose Occupancy Investor Race Income Sex Originated All Purchase All All All All All
Investor Fannie Mae 169 17.09%Ginnie Mae 156 15.77%Freddie Mac 117 11.83%Farmer Mac 0 0.00%Non Agency 406 41.05%Not Sold 141 14.26%Invalid 0 0.00%
Total 989 100.00%
Amount Conforming 979 98.99%Jumbo 10 1.01%Invalid 0 0.00%
Total 989 100.00%
Average Loan Amount First Lien ($000) 132.23Subordinate Lien ($000) 28.33Other Lien ($000) 0.00
Tract Income Low 32 3.24%Moderate 229 23.15%Middle 268 27.10%Upper 460 46.51%Unk/NA 0 0.00%
Total 989 100.00%
Tract % Minority <10% 468 47.32%10-20% 331 33.47%20-30% 0 0.00%30-40% 32 3.24%40-50% 33 3.34%50-60% 99 10.01%60-70% 21 2.12%70-80% 0 0.00%80-90% 2 0.20%90-100% 3 0.30%Unk/NA 0 0.00%
Total 989 100.00%
Average Spread Reported is computed based on originated loans.Data used in this analysis are taken from the 2017 National HMDA-LAR published by the Federal Financial Institutions Examination Council.
This report may not be copied, sold or distributed without the express written permission of CLC Compliance Technologies,Inc.Copyright 2004 - 2014 CLC Compliance Technologies,Inc.(1-800-499-HMDA) Page 3 of 4

Lender's HMDA OverviewLendingPatterns 7/15/2019
Year: 2017
Lender(s): All Lenders
Geography: Muskegon_MuskegonHeights_NortonShores (Custom Area)
Loan Amount: Conforming,Jumbo
Tract Income: All
Tract % Minority: All
Hispanic Ethnicity: All Property Type: 1-4 Family
Preapproval Requested?: All HOEPA Loan?: All Lien Status: All
Spread Reported?: All
Action Loan Type Purpose Occupancy Investor Race Income Sex Originated All Purchase All All All All All
HOEPA HOEPA Loans 0 0.00%Non-HOEPA Loans 989 100.00%Invalid 0 0.00%
Total 989 100.00%
Lien Status First Liens 983 99.39%Subordinate Liens 6 0.61%Not Secured by Lien 0 0.00%NA 0 0.00%Invalid 0 0.00%
Total 989 100.00%
Property Type One to Four 989 100.00%Manufactured 0 0.00%Multifamily 0 0.00%Invalid 0 0.00%
Total 989 100.00%
PreApproval PreApproval Requested 89 9.00%PreApproval Not Requested 369 37.31%NA 531 53.69%Invalid 0 0.00%
Total 989 100.00%
Spread Reported Yes 159 16.08%No 830 83.92%Invalid 0 0.00%
Total Loans 989 100.00%
Average Spread Reported First Lien Spread 1.88Subordinate Lien Spread 4.90Other Lien Spread 0.00
Average Spread Reported is computed based on originated loans.Data used in this analysis are taken from the 2017 National HMDA-LAR published by the Federal Financial Institutions Examination Council.
This report may not be copied, sold or distributed without the express written permission of CLC Compliance Technologies,Inc.Copyright 2004 - 2014 CLC Compliance Technologies,Inc.(1-800-499-HMDA) Page 4 of 4
HMDA Data Analysis for the Cities of Muskegon, Muskegon Heights, and Norton Shores July 2019
Appendix B

Population Penetration Profile (Hispanic not a race)LendingPatterns 5/29/2019
Year: 2017
Lender(s): All Lenders
Geography: Muskegon city (MI)
Loan Amount: Conforming,Jumbo
Tract Income: All
Tract % Minority: All
Hispanic Ethnicity: All Property Type: 1-4 Family
Preapproval Requested?: All HOEPA Loan?: All Lien Status: All
Spread Reported?: All
Action Loan Type Purpose Occupancy Investor Race Income Sex Originated
RejectedDenied
WithdrawnIncomplete
Preappr. DeniedPreappr. Rejected
All Purchase All All All All All
Applications Population RatioRace White 584 90.12% 33,895 65.33% 1.38
Black 58 8.95% 14,632 28.20% 0.32Asian 3 0.46% 136 0.26% 1.77Native American 1 0.15% 348 0.67% 0.23Hawaiian 0 0.00% 14 0.03% NAMultiRace 2 0.31% 2,859 5.51% 0.06
Totals 648 100.00% 51,884 100.00% 1.00 *This section ignores applications and population for race categories not shown.
Applications Population RatioHispanic Ethnicity Hispanic 21 3.24% 3,092 5.92% 0.55
Non-Hispanic 627 96.76% 49,152 94.08% 1.03Totals 648 100.00% 52,244 100.00% 1.00
*This section ignores applications and population for ethnicity categories not shown.
Applications Population RatioTract Income Low 34 4.89% 12,063 23.09% 0.21
Moderate 293 42.16% 23,488 44.96% 0.94Middle 328 47.19% 15,512 29.69% 1.59Upper 40 5.76% 1,181 2.26% 2.55
Totals 695 100.00% 52,244 100.00% 1.00 *This section ignores applications and population for tract income categories not shown.
Applications Population RatioTract % Minority <10% 368 52.95% 16,693 31.95% 1.66
10-20% 66 9.50% 3,273 6.26% 1.5220-30% 0 0.00% 0 0.00% NA30-40% 41 5.90% 3,362 6.44% 0.9240-50% 41 5.90% 4,866 9.31% 0.6350-60% 154 22.16% 14,281 27.34% 0.8160-70% 18 2.59% 7,622 14.59% 0.1870-80% 0 0.00% 0 0.00% NA80-90% 0 0.00% 0 0.00% NA90-100% 7 1.01% 2,147 4.11% 0.25
Totals 695 100.00% 52,244 100.00% 1.00 *This section ignores applications and population for tract minority categories not shown.
The population displayed (and used in calculations) is based on 2015 ACS data for the geography, tract, race and ethnicity selections.Data used in this analysis are taken from the 2017 National HMDA-LAR published by the Federal Financial Institutions Examination Council.
This report may not be copied, sold or distributed without the express written permission of CLC Compliance Technologies,Inc.Copyright 2004 - 2014 CLC Compliance Technologies,Inc.(1-800-499-HMDA) Page 1 of 1
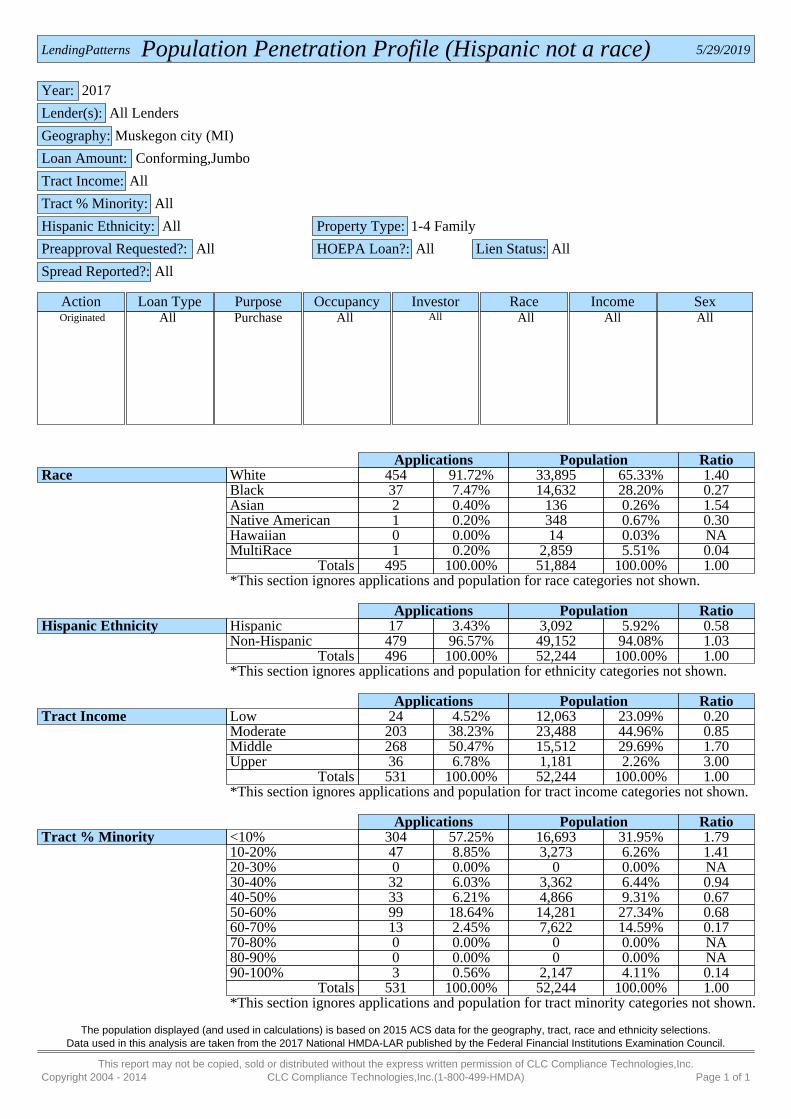
Population Penetration Profile (Hispanic not a race)LendingPatterns 5/29/2019
Year: 2017
Lender(s): All Lenders
Geography: Muskegon city (MI)
Loan Amount: Conforming,Jumbo
Tract Income: All
Tract % Minority: All
Hispanic Ethnicity: All Property Type: 1-4 Family
Preapproval Requested?: All HOEPA Loan?: All Lien Status: All
Spread Reported?: All
Action Loan Type Purpose Occupancy Investor Race Income Sex Originated All Purchase All All All All All
Applications Population RatioRace White 454 91.72% 33,895 65.33% 1.40
Black 37 7.47% 14,632 28.20% 0.27Asian 2 0.40% 136 0.26% 1.54Native American 1 0.20% 348 0.67% 0.30Hawaiian 0 0.00% 14 0.03% NAMultiRace 1 0.20% 2,859 5.51% 0.04
Totals 495 100.00% 51,884 100.00% 1.00 *This section ignores applications and population for race categories not shown.
Applications Population RatioHispanic Ethnicity Hispanic 17 3.43% 3,092 5.92% 0.58
Non-Hispanic 479 96.57% 49,152 94.08% 1.03Totals 496 100.00% 52,244 100.00% 1.00
*This section ignores applications and population for ethnicity categories not shown.
Applications Population RatioTract Income Low 24 4.52% 12,063 23.09% 0.20
Moderate 203 38.23% 23,488 44.96% 0.85Middle 268 50.47% 15,512 29.69% 1.70Upper 36 6.78% 1,181 2.26% 3.00
Totals 531 100.00% 52,244 100.00% 1.00 *This section ignores applications and population for tract income categories not shown.
Applications Population RatioTract % Minority <10% 304 57.25% 16,693 31.95% 1.79
10-20% 47 8.85% 3,273 6.26% 1.4120-30% 0 0.00% 0 0.00% NA30-40% 32 6.03% 3,362 6.44% 0.9440-50% 33 6.21% 4,866 9.31% 0.6750-60% 99 18.64% 14,281 27.34% 0.6860-70% 13 2.45% 7,622 14.59% 0.1770-80% 0 0.00% 0 0.00% NA80-90% 0 0.00% 0 0.00% NA90-100% 3 0.56% 2,147 4.11% 0.14
Totals 531 100.00% 52,244 100.00% 1.00 *This section ignores applications and population for tract minority categories not shown.
The population displayed (and used in calculations) is based on 2015 ACS data for the geography, tract, race and ethnicity selections.Data used in this analysis are taken from the 2017 National HMDA-LAR published by the Federal Financial Institutions Examination Council.
This report may not be copied, sold or distributed without the express written permission of CLC Compliance Technologies,Inc.Copyright 2004 - 2014 CLC Compliance Technologies,Inc.(1-800-499-HMDA) Page 1 of 1
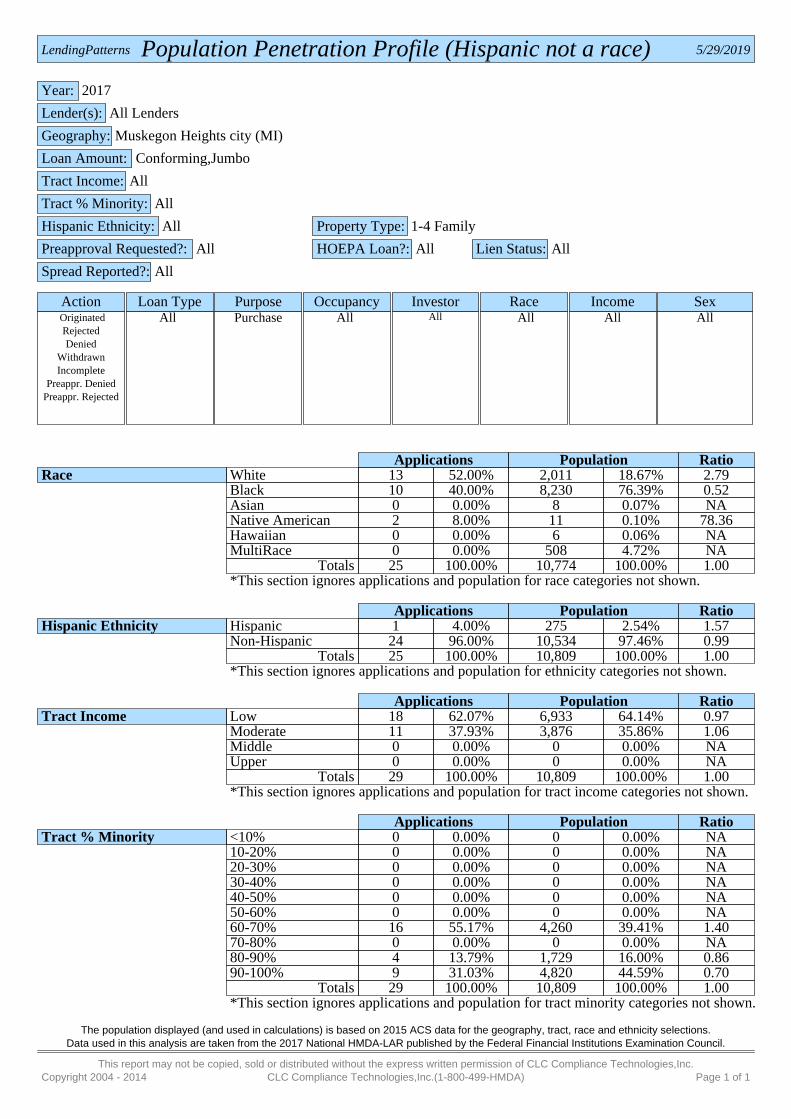
Population Penetration Profile (Hispanic not a race)LendingPatterns 5/29/2019
Year: 2017
Lender(s): All Lenders
Geography: Muskegon Heights city (MI)
Loan Amount: Conforming,Jumbo
Tract Income: All
Tract % Minority: All
Hispanic Ethnicity: All Property Type: 1-4 Family
Preapproval Requested?: All HOEPA Loan?: All Lien Status: All
Spread Reported?: All
Action Loan Type Purpose Occupancy Investor Race Income Sex Originated
RejectedDenied
WithdrawnIncomplete
Preappr. DeniedPreappr. Rejected
All Purchase All All All All All
Applications Population RatioRace White 13 52.00% 2,011 18.67% 2.79
Black 10 40.00% 8,230 76.39% 0.52Asian 0 0.00% 8 0.07% NANative American 2 8.00% 11 0.10% 78.36Hawaiian 0 0.00% 6 0.06% NAMultiRace 0 0.00% 508 4.72% NA
Totals 25 100.00% 10,774 100.00% 1.00 *This section ignores applications and population for race categories not shown.
Applications Population RatioHispanic Ethnicity Hispanic 1 4.00% 275 2.54% 1.57
Non-Hispanic 24 96.00% 10,534 97.46% 0.99Totals 25 100.00% 10,809 100.00% 1.00
*This section ignores applications and population for ethnicity categories not shown.
Applications Population RatioTract Income Low 18 62.07% 6,933 64.14% 0.97
Moderate 11 37.93% 3,876 35.86% 1.06Middle 0 0.00% 0 0.00% NAUpper 0 0.00% 0 0.00% NA
Totals 29 100.00% 10,809 100.00% 1.00 *This section ignores applications and population for tract income categories not shown.
Applications Population RatioTract % Minority <10% 0 0.00% 0 0.00% NA
10-20% 0 0.00% 0 0.00% NA20-30% 0 0.00% 0 0.00% NA30-40% 0 0.00% 0 0.00% NA40-50% 0 0.00% 0 0.00% NA50-60% 0 0.00% 0 0.00% NA60-70% 16 55.17% 4,260 39.41% 1.4070-80% 0 0.00% 0 0.00% NA80-90% 4 13.79% 1,729 16.00% 0.8690-100% 9 31.03% 4,820 44.59% 0.70
Totals 29 100.00% 10,809 100.00% 1.00 *This section ignores applications and population for tract minority categories not shown.
The population displayed (and used in calculations) is based on 2015 ACS data for the geography, tract, race and ethnicity selections.Data used in this analysis are taken from the 2017 National HMDA-LAR published by the Federal Financial Institutions Examination Council.
This report may not be copied, sold or distributed without the express written permission of CLC Compliance Technologies,Inc.Copyright 2004 - 2014 CLC Compliance Technologies,Inc.(1-800-499-HMDA) Page 1 of 1

Population Penetration Profile (Hispanic not a race)LendingPatterns 5/29/2019
Year: 2017
Lender(s): All Lenders
Geography: Muskegon Heights city (MI)
Loan Amount: Conforming,Jumbo
Tract Income: All
Tract % Minority: All
Hispanic Ethnicity: All Property Type: 1-4 Family
Preapproval Requested?: All HOEPA Loan?: All Lien Status: All
Spread Reported?: All
Action Loan Type Purpose Occupancy Investor Race Income Sex Originated All Purchase All All All All All
Applications Population RatioRace White 7 53.85% 2,011 18.67% 2.88
Black 5 38.46% 8,230 76.39% 0.50Asian 0 0.00% 8 0.07% NANative American 1 7.69% 11 0.10% 75.34Hawaiian 0 0.00% 6 0.06% NAMultiRace 0 0.00% 508 4.72% NA
Totals 13 100.00% 10,774 100.00% 1.00 *This section ignores applications and population for race categories not shown.
Applications Population RatioHispanic Ethnicity Hispanic 0 0.00% 275 2.54% NA
Non-Hispanic 12 100.00% 10,534 97.46% 1.03Totals 12 100.00% 10,809 100.00% 1.00
*This section ignores applications and population for ethnicity categories not shown.
Applications Population RatioTract Income Low 8 61.54% 6,933 64.14% 0.96
Moderate 5 38.46% 3,876 35.86% 1.07Middle 0 0.00% 0 0.00% NAUpper 0 0.00% 0 0.00% NA
Totals 13 100.00% 10,809 100.00% 1.00 *This section ignores applications and population for tract income categories not shown.
Applications Population RatioTract % Minority <10% 0 0.00% 0 0.00% NA
10-20% 0 0.00% 0 0.00% NA20-30% 0 0.00% 0 0.00% NA30-40% 0 0.00% 0 0.00% NA40-50% 0 0.00% 0 0.00% NA50-60% 0 0.00% 0 0.00% NA60-70% 8 61.54% 4,260 39.41% 1.5670-80% 0 0.00% 0 0.00% NA80-90% 2 15.38% 1,729 16.00% 0.9690-100% 3 23.08% 4,820 44.59% 0.52
Totals 13 100.00% 10,809 100.00% 1.00 *This section ignores applications and population for tract minority categories not shown.
The population displayed (and used in calculations) is based on 2015 ACS data for the geography, tract, race and ethnicity selections.Data used in this analysis are taken from the 2017 National HMDA-LAR published by the Federal Financial Institutions Examination Council.
This report may not be copied, sold or distributed without the express written permission of CLC Compliance Technologies,Inc.Copyright 2004 - 2014 CLC Compliance Technologies,Inc.(1-800-499-HMDA) Page 1 of 1

Population Penetration Profile (Hispanic not a race)LendingPatterns 5/29/2019
Year: 2017
Lender(s): All Lenders
Geography: Norton Shores city (MI)
Loan Amount: Conforming,Jumbo
Tract Income: All
Tract % Minority: All
Hispanic Ethnicity: All Property Type: 1-4 Family
Preapproval Requested?: All HOEPA Loan?: All Lien Status: All
Spread Reported?: All
Action Loan Type Purpose Occupancy Investor Race Income Sex Originated
RejectedDenied
WithdrawnIncomplete
Preappr. DeniedPreappr. Rejected
All Purchase All All All All All
Applications Population RatioRace White 490 94.41% 23,365 82.97% 1.14
Black 23 4.43% 3,239 11.50% 0.39Asian 2 0.39% 468 1.66% 0.23Native American 3 0.58% 152 0.54% 1.07Hawaiian 0 0.00% 0 0.00% NAMultiRace 1 0.19% 937 3.33% 0.06
Totals 519 100.00% 28,161 100.00% 1.00 *This section ignores applications and population for race categories not shown.
Applications Population RatioHispanic Ethnicity Hispanic 24 4.63% 1,198 4.24% 1.09
Non-Hispanic 494 95.37% 27,044 95.76% 1.00Totals 518 100.00% 28,242 100.00% 1.00
*This section ignores applications and population for ethnicity categories not shown.
Applications Population RatioTract Income Low 16 2.91% 4,260 15.08% 0.19
Moderate 33 6.01% 3,449 12.21% 0.49Middle 0 0.00% 0 0.00% NAUpper 500 91.07% 20,533 72.70% 1.25
Totals 549 100.00% 28,242 100.00% 1.00 *This section ignores applications and population for tract income categories not shown.
Applications Population RatioTract % Minority <10% 187 34.06% 7,400 26.20% 1.30
10-20% 346 63.02% 16,582 58.71% 1.0720-30% 0 0.00% 0 0.00% NA30-40% 0 0.00% 0 0.00% NA40-50% 0 0.00% 0 0.00% NA50-60% 0 0.00% 0 0.00% NA60-70% 16 2.91% 4,260 15.08% 0.1970-80% 0 0.00% 0 0.00% NA80-90% 0 0.00% 0 0.00% NA90-100% 0 0.00% 0 0.00% NA
Totals 549 100.00% 28,242 100.00% 1.00 *This section ignores applications and population for tract minority categories not shown.
The population displayed (and used in calculations) is based on 2015 ACS data for the geography, tract, race and ethnicity selections.Data used in this analysis are taken from the 2017 National HMDA-LAR published by the Federal Financial Institutions Examination Council.
This report may not be copied, sold or distributed without the express written permission of CLC Compliance Technologies,Inc.Copyright 2004 - 2014 CLC Compliance Technologies,Inc.(1-800-499-HMDA) Page 1 of 1
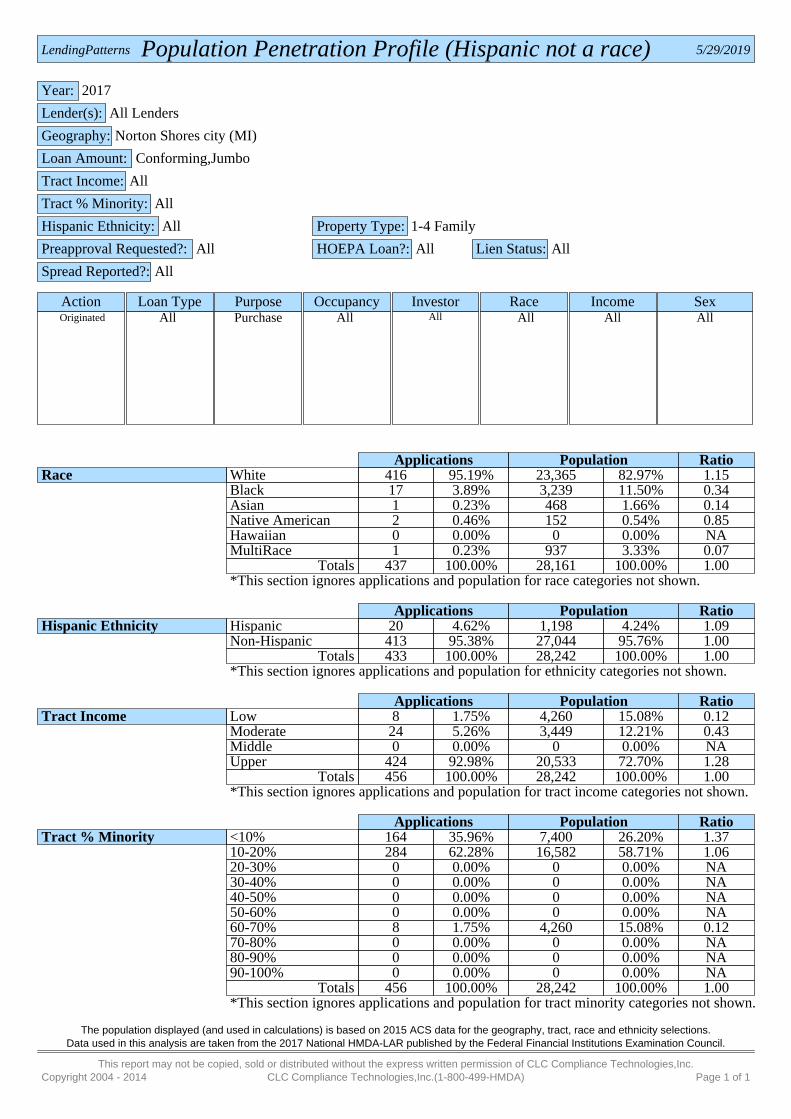
Population Penetration Profile (Hispanic not a race)LendingPatterns 5/29/2019
Year: 2017
Lender(s): All Lenders
Geography: Norton Shores city (MI)
Loan Amount: Conforming,Jumbo
Tract Income: All
Tract % Minority: All
Hispanic Ethnicity: All Property Type: 1-4 Family
Preapproval Requested?: All HOEPA Loan?: All Lien Status: All
Spread Reported?: All
Action Loan Type Purpose Occupancy Investor Race Income Sex Originated All Purchase All All All All All
Applications Population RatioRace White 416 95.19% 23,365 82.97% 1.15
Black 17 3.89% 3,239 11.50% 0.34Asian 1 0.23% 468 1.66% 0.14Native American 2 0.46% 152 0.54% 0.85Hawaiian 0 0.00% 0 0.00% NAMultiRace 1 0.23% 937 3.33% 0.07
Totals 437 100.00% 28,161 100.00% 1.00 *This section ignores applications and population for race categories not shown.
Applications Population RatioHispanic Ethnicity Hispanic 20 4.62% 1,198 4.24% 1.09
Non-Hispanic 413 95.38% 27,044 95.76% 1.00Totals 433 100.00% 28,242 100.00% 1.00
*This section ignores applications and population for ethnicity categories not shown.
Applications Population RatioTract Income Low 8 1.75% 4,260 15.08% 0.12
Moderate 24 5.26% 3,449 12.21% 0.43Middle 0 0.00% 0 0.00% NAUpper 424 92.98% 20,533 72.70% 1.28
Totals 456 100.00% 28,242 100.00% 1.00 *This section ignores applications and population for tract income categories not shown.
Applications Population RatioTract % Minority <10% 164 35.96% 7,400 26.20% 1.37
10-20% 284 62.28% 16,582 58.71% 1.0620-30% 0 0.00% 0 0.00% NA30-40% 0 0.00% 0 0.00% NA40-50% 0 0.00% 0 0.00% NA50-60% 0 0.00% 0 0.00% NA60-70% 8 1.75% 4,260 15.08% 0.1270-80% 0 0.00% 0 0.00% NA80-90% 0 0.00% 0 0.00% NA90-100% 0 0.00% 0 0.00% NA
Totals 456 100.00% 28,242 100.00% 1.00 *This section ignores applications and population for tract minority categories not shown.
The population displayed (and used in calculations) is based on 2015 ACS data for the geography, tract, race and ethnicity selections.Data used in this analysis are taken from the 2017 National HMDA-LAR published by the Federal Financial Institutions Examination Council.
This report may not be copied, sold or distributed without the express written permission of CLC Compliance Technologies,Inc.Copyright 2004 - 2014 CLC Compliance Technologies,Inc.(1-800-499-HMDA) Page 1 of 1

Population Penetration Profile (Hispanic not a race)LendingPatterns 5/29/2019
Year: 2017
Lender(s): All Lenders
Geography: Muskegon_MuskegonHeights_NortonShores (Custom Area)
Loan Amount: Conforming,Jumbo
Tract Income: All
Tract % Minority: All
Hispanic Ethnicity: All Property Type: 1-4 Family
Preapproval Requested?: All HOEPA Loan?: All Lien Status: All
Spread Reported?: All
Action Loan Type Purpose Occupancy Investor Race Income Sex Originated
RejectedDenied
WithdrawnIncomplete
Preappr. DeniedPreappr. Rejected
All Purchase All All All All All
Applications Population RatioRace White 1,077 91.89% 57,729 68.37% 1.34
Black 83 7.08% 21,559 25.53% 0.28Asian 5 0.43% 612 0.72% 0.59Native American 4 0.34% 500 0.59% 0.58Hawaiian 0 0.00% 14 0.02% NAMultiRace 3 0.26% 4,018 4.76% 0.05
Totals 1,172 100.00% 84,432 100.00% 1.00 *This section ignores applications and population for race categories not shown.
Applications Population RatioHispanic Ethnicity Hispanic 45 3.84% 4,403 5.19% 0.74
Non-Hispanic 1,126 96.16% 80,485 94.81% 1.01Totals 1,171 100.00% 84,888 100.00% 1.00
*This section ignores applications and population for ethnicity categories not shown.
Applications Population RatioTract Income Low 52 4.16% 18,996 22.38% 0.19
Moderate 330 26.40% 28,666 33.77% 0.78Middle 328 26.24% 15,512 18.27% 1.44Upper 540 43.20% 21,714 25.58% 1.69
Totals 1,250 100.00% 84,888 100.00% 1.00 *This section ignores applications and population for tract income categories not shown.
Applications Population RatioTract % Minority <10% 555 44.40% 24,093 28.38% 1.56
10-20% 412 32.96% 19,855 23.39% 1.4120-30% 0 0.00% 0 0.00% NA30-40% 41 3.28% 3,362 3.96% 0.8340-50% 41 3.28% 4,866 5.73% 0.5750-60% 154 12.32% 14,281 16.82% 0.7360-70% 34 2.72% 11,882 14.00% 0.1970-80% 0 0.00% 0 0.00% NA80-90% 4 0.32% 1,729 2.04% 0.1690-100% 9 0.72% 4,820 5.68% 0.13
Totals 1,250 100.00% 84,888 100.00% 1.00 *This section ignores applications and population for tract minority categories not shown.
The population displayed (and used in calculations) is based on 2015 ACS data for the geography, tract, race and ethnicity selections.Data used in this analysis are taken from the 2017 National HMDA-LAR published by the Federal Financial Institutions Examination Council.
This report may not be copied, sold or distributed without the express written permission of CLC Compliance Technologies,Inc.Copyright 2004 - 2014 CLC Compliance Technologies,Inc.(1-800-499-HMDA) Page 1 of 1

Population Penetration Profile (Hispanic not a race)LendingPatterns 5/29/2019
Year: 2017
Lender(s): All Lenders
Geography: Muskegon_MuskegonHeights_NortonShores (Custom Area)
Loan Amount: Conforming,Jumbo
Tract Income: All
Tract % Minority: All
Hispanic Ethnicity: All Property Type: 1-4 Family
Preapproval Requested?: All HOEPA Loan?: All Lien Status: All
Spread Reported?: All
Action Loan Type Purpose Occupancy Investor Race Income Sex Originated All Purchase All All All All All
Applications Population RatioRace White 871 93.25% 57,729 68.37% 1.36
Black 55 5.89% 21,559 25.53% 0.23Asian 3 0.32% 612 0.72% 0.44Native American 3 0.32% 500 0.59% 0.54Hawaiian 0 0.00% 14 0.02% NAMultiRace 2 0.21% 4,018 4.76% 0.04
Totals 934 100.00% 84,432 100.00% 1.00 *This section ignores applications and population for race categories not shown.
Applications Population RatioHispanic Ethnicity Hispanic 37 3.97% 4,403 5.19% 0.77
Non-Hispanic 894 96.03% 80,485 94.81% 1.01Totals 931 100.00% 84,888 100.00% 1.00
*This section ignores applications and population for ethnicity categories not shown.
Applications Population RatioTract Income Low 32 3.24% 18,996 22.38% 0.14
Moderate 229 23.15% 28,666 33.77% 0.69Middle 268 27.10% 15,512 18.27% 1.48Upper 460 46.51% 21,714 25.58% 1.82
Totals 989 100.00% 84,888 100.00% 1.00 *This section ignores applications and population for tract income categories not shown.
Applications Population RatioTract % Minority <10% 468 47.32% 24,093 28.38% 1.67
10-20% 331 33.47% 19,855 23.39% 1.4320-30% 0 0.00% 0 0.00% NA30-40% 32 3.24% 3,362 3.96% 0.8240-50% 33 3.34% 4,866 5.73% 0.5850-60% 99 10.01% 14,281 16.82% 0.6060-70% 21 2.12% 11,882 14.00% 0.1570-80% 0 0.00% 0 0.00% NA80-90% 2 0.20% 1,729 2.04% 0.1090-100% 3 0.30% 4,820 5.68% 0.05
Totals 989 100.00% 84,888 100.00% 1.00 *This section ignores applications and population for tract minority categories not shown.
The population displayed (and used in calculations) is based on 2015 ACS data for the geography, tract, race and ethnicity selections.Data used in this analysis are taken from the 2017 National HMDA-LAR published by the Federal Financial Institutions Examination Council.
This report may not be copied, sold or distributed without the express written permission of CLC Compliance Technologies,Inc.Copyright 2004 - 2014 CLC Compliance Technologies,Inc.(1-800-499-HMDA) Page 1 of 1

HMDA Data Analysis for the Cities of Muskegon, Muskegon Heights, and Norton Shores July 2019
Appendix C
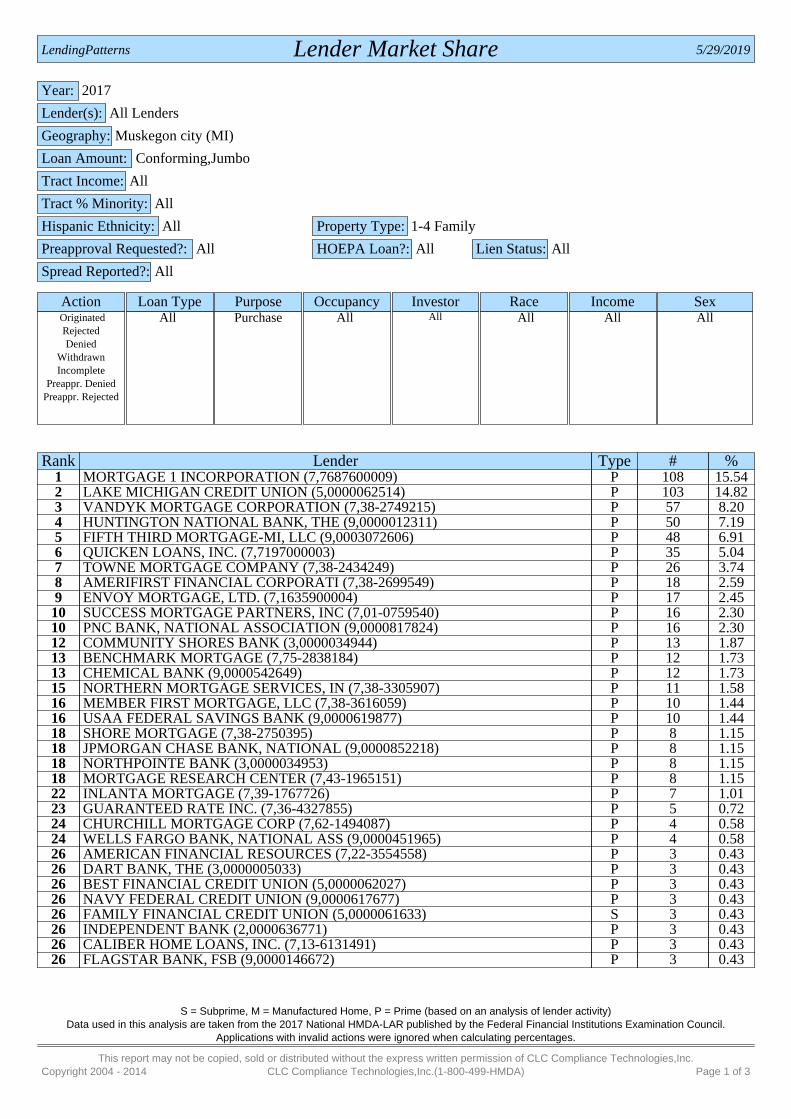
Lender Market ShareLendingPatterns 5/29/2019
Year: 2017
Lender(s): All Lenders
Geography: Muskegon city (MI)
Loan Amount: Conforming,Jumbo
Tract Income: All
Tract % Minority: All
Hispanic Ethnicity: All Property Type: 1-4 Family
Preapproval Requested?: All HOEPA Loan?: All Lien Status: All
Spread Reported?: All
Action Loan Type Purpose Occupancy Investor Race Income Sex Originated
RejectedDenied
WithdrawnIncomplete
Preappr. DeniedPreappr. Rejected
All Purchase All All All All All
Rank Lender Type # %1 MORTGAGE 1 INCORPORATION (7,7687600009) P 108 15.542 LAKE MICHIGAN CREDIT UNION (5,0000062514) P 103 14.823 VANDYK MORTGAGE CORPORATION (7,38-2749215) P 57 8.204 HUNTINGTON NATIONAL BANK, THE (9,0000012311) P 50 7.195 FIFTH THIRD MORTGAGE-MI, LLC (9,0003072606) P 48 6.916 QUICKEN LOANS, INC. (7,7197000003) P 35 5.047 TOWNE MORTGAGE COMPANY (7,38-2434249) P 26 3.748 AMERIFIRST FINANCIAL CORPORATI (7,38-2699549) P 18 2.599 ENVOY MORTGAGE, LTD. (7,1635900004) P 17 2.4510 SUCCESS MORTGAGE PARTNERS, INC (7,01-0759540) P 16 2.3010 PNC BANK, NATIONAL ASSOCIATION (9,0000817824) P 16 2.3012 COMMUNITY SHORES BANK (3,0000034944) P 13 1.8713 BENCHMARK MORTGAGE (7,75-2838184) P 12 1.7313 CHEMICAL BANK (9,0000542649) P 12 1.7315 NORTHERN MORTGAGE SERVICES, IN (7,38-3305907) P 11 1.5816 MEMBER FIRST MORTGAGE, LLC (7,38-3616059) P 10 1.4416 USAA FEDERAL SAVINGS BANK (9,0000619877) P 10 1.4418 SHORE MORTGAGE (7,38-2750395) P 8 1.1518 JPMORGAN CHASE BANK, NATIONAL (9,0000852218) P 8 1.1518 NORTHPOINTE BANK (3,0000034953) P 8 1.1518 MORTGAGE RESEARCH CENTER (7,43-1965151) P 8 1.1522 INLANTA MORTGAGE (7,39-1767726) P 7 1.0123 GUARANTEED RATE INC. (7,36-4327855) P 5 0.7224 CHURCHILL MORTGAGE CORP (7,62-1494087) P 4 0.5824 WELLS FARGO BANK, NATIONAL ASS (9,0000451965) P 4 0.5826 AMERICAN FINANCIAL RESOURCES (7,22-3554558) P 3 0.4326 DART BANK, THE (3,0000005033) P 3 0.4326 BEST FINANCIAL CREDIT UNION (5,0000062027) P 3 0.4326 NAVY FEDERAL CREDIT UNION (9,0000617677) P 3 0.4326 FAMILY FINANCIAL CREDIT UNION (5,0000061633) S 3 0.4326 INDEPENDENT BANK (2,0000636771) P 3 0.4326 CALIBER HOME LOANS, INC. (7,13-6131491) P 3 0.4326 FLAGSTAR BANK, FSB (9,0000146672) P 3 0.43
S = Subprime, M = Manufactured Home, P = Prime (based on an analysis of lender activity)Data used in this analysis are taken from the 2017 National HMDA-LAR published by the Federal Financial Institutions Examination Council.
Applications with invalid actions were ignored when calculating percentages.
This report may not be copied, sold or distributed without the express written permission of CLC Compliance Technologies,Inc.Copyright 2004 - 2014 CLC Compliance Technologies,Inc.(1-800-499-HMDA) Page 1 of 3
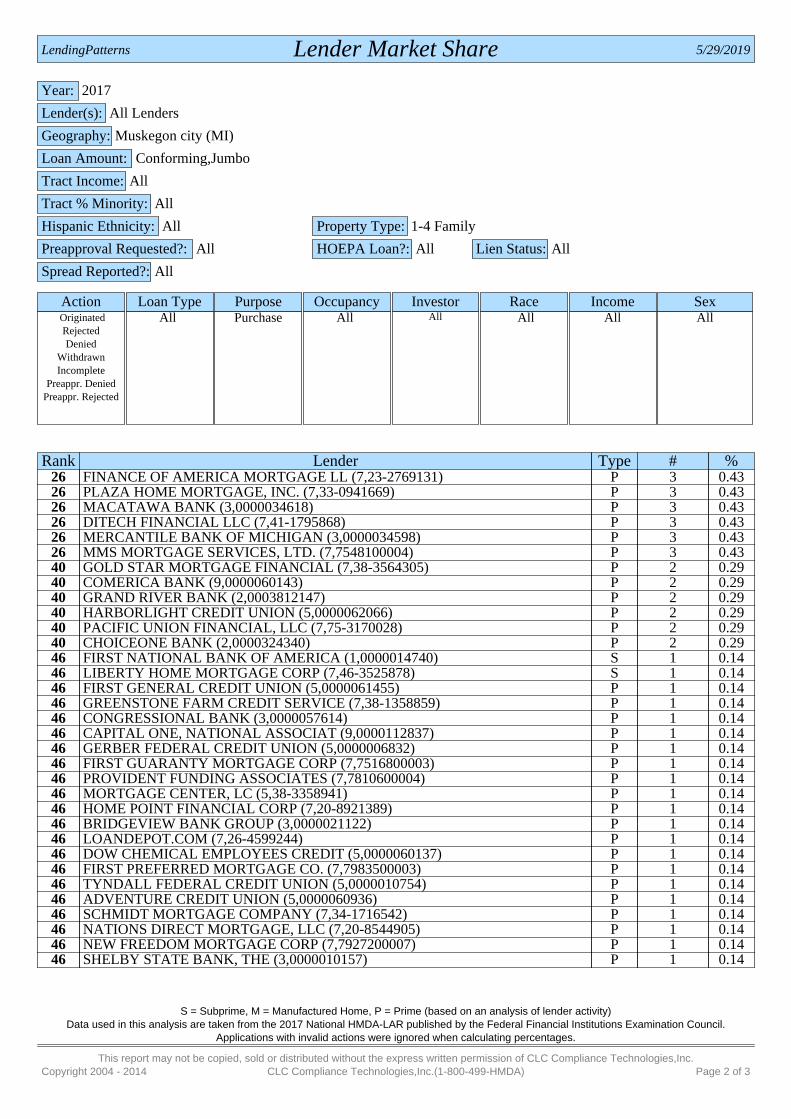
Lender Market ShareLendingPatterns 5/29/2019
Year: 2017
Lender(s): All Lenders
Geography: Muskegon city (MI)
Loan Amount: Conforming,Jumbo
Tract Income: All
Tract % Minority: All
Hispanic Ethnicity: All Property Type: 1-4 Family
Preapproval Requested?: All HOEPA Loan?: All Lien Status: All
Spread Reported?: All
Action Loan Type Purpose Occupancy Investor Race Income Sex Originated
RejectedDenied
WithdrawnIncomplete
Preappr. DeniedPreappr. Rejected
All Purchase All All All All All
Rank Lender Type # %26 FINANCE OF AMERICA MORTGAGE LL (7,23-2769131) P 3 0.4326 PLAZA HOME MORTGAGE, INC. (7,33-0941669) P 3 0.4326 MACATAWA BANK (3,0000034618) P 3 0.4326 DITECH FINANCIAL LLC (7,41-1795868) P 3 0.4326 MERCANTILE BANK OF MICHIGAN (3,0000034598) P 3 0.4326 MMS MORTGAGE SERVICES, LTD. (7,7548100004) P 3 0.4340 GOLD STAR MORTGAGE FINANCIAL (7,38-3564305) P 2 0.2940 COMERICA BANK (9,0000060143) P 2 0.2940 GRAND RIVER BANK (2,0003812147) P 2 0.2940 HARBORLIGHT CREDIT UNION (5,0000062066) P 2 0.2940 PACIFIC UNION FINANCIAL, LLC (7,75-3170028) P 2 0.2940 CHOICEONE BANK (2,0000324340) P 2 0.2946 FIRST NATIONAL BANK OF AMERICA (1,0000014740) S 1 0.1446 LIBERTY HOME MORTGAGE CORP (7,46-3525878) S 1 0.1446 FIRST GENERAL CREDIT UNION (5,0000061455) P 1 0.1446 GREENSTONE FARM CREDIT SERVICE (7,38-1358859) P 1 0.1446 CONGRESSIONAL BANK (3,0000057614) P 1 0.1446 CAPITAL ONE, NATIONAL ASSOCIAT (9,0000112837) P 1 0.1446 GERBER FEDERAL CREDIT UNION (5,0000006832) P 1 0.1446 FIRST GUARANTY MORTGAGE CORP (7,7516800003) P 1 0.1446 PROVIDENT FUNDING ASSOCIATES (7,7810600004) P 1 0.1446 MORTGAGE CENTER, LC (5,38-3358941) P 1 0.1446 HOME POINT FINANCIAL CORP (7,20-8921389) P 1 0.1446 BRIDGEVIEW BANK GROUP (3,0000021122) P 1 0.1446 LOANDEPOT.COM (7,26-4599244) P 1 0.1446 DOW CHEMICAL EMPLOYEES CREDIT (5,0000060137) P 1 0.1446 FIRST PREFERRED MORTGAGE CO. (7,7983500003) P 1 0.1446 TYNDALL FEDERAL CREDIT UNION (5,0000010754) P 1 0.1446 ADVENTURE CREDIT UNION (5,0000060936) P 1 0.1446 SCHMIDT MORTGAGE COMPANY (7,34-1716542) P 1 0.1446 NATIONS DIRECT MORTGAGE, LLC (7,20-8544905) P 1 0.1446 NEW FREEDOM MORTGAGE CORP (7,7927200007) P 1 0.1446 SHELBY STATE BANK, THE (3,0000010157) P 1 0.14
S = Subprime, M = Manufactured Home, P = Prime (based on an analysis of lender activity)Data used in this analysis are taken from the 2017 National HMDA-LAR published by the Federal Financial Institutions Examination Council.
Applications with invalid actions were ignored when calculating percentages.
This report may not be copied, sold or distributed without the express written permission of CLC Compliance Technologies,Inc.Copyright 2004 - 2014 CLC Compliance Technologies,Inc.(1-800-499-HMDA) Page 2 of 3
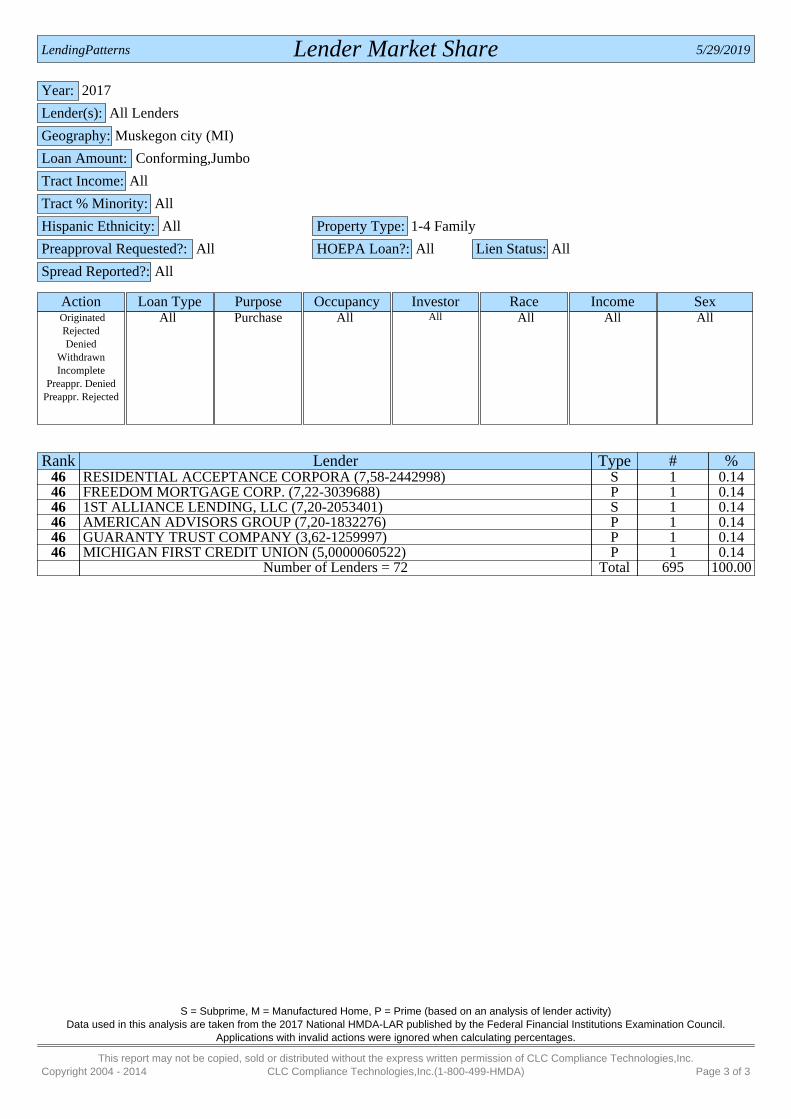
Lender Market ShareLendingPatterns 5/29/2019
Year: 2017
Lender(s): All Lenders
Geography: Muskegon city (MI)
Loan Amount: Conforming,Jumbo
Tract Income: All
Tract % Minority: All
Hispanic Ethnicity: All Property Type: 1-4 Family
Preapproval Requested?: All HOEPA Loan?: All Lien Status: All
Spread Reported?: All
Action Loan Type Purpose Occupancy Investor Race Income Sex Originated
RejectedDenied
WithdrawnIncomplete
Preappr. DeniedPreappr. Rejected
All Purchase All All All All All
Rank Lender Type # %46 RESIDENTIAL ACCEPTANCE CORPORA (7,58-2442998) S 1 0.1446 FREEDOM MORTGAGE CORP. (7,22-3039688) P 1 0.1446 1ST ALLIANCE LENDING, LLC (7,20-2053401) S 1 0.1446 AMERICAN ADVISORS GROUP (7,20-1832276) P 1 0.1446 GUARANTY TRUST COMPANY (3,62-1259997) P 1 0.1446 MICHIGAN FIRST CREDIT UNION (5,0000060522) P 1 0.14
Number of Lenders = 72 Total 695 100.00
S = Subprime, M = Manufactured Home, P = Prime (based on an analysis of lender activity)Data used in this analysis are taken from the 2017 National HMDA-LAR published by the Federal Financial Institutions Examination Council.
Applications with invalid actions were ignored when calculating percentages.
This report may not be copied, sold or distributed without the express written permission of CLC Compliance Technologies,Inc.Copyright 2004 - 2014 CLC Compliance Technologies,Inc.(1-800-499-HMDA) Page 3 of 3
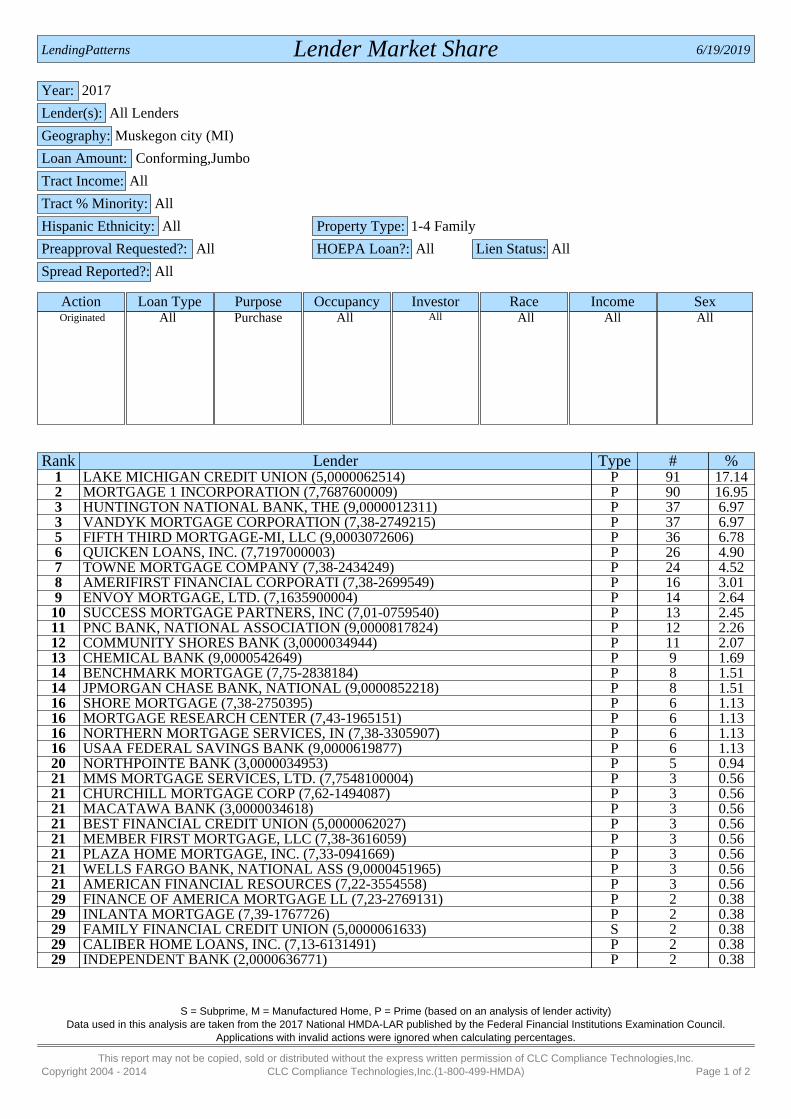
Lender Market ShareLendingPatterns 6/19/2019
Year: 2017
Lender(s): All Lenders
Geography: Muskegon city (MI)
Loan Amount: Conforming,Jumbo
Tract Income: All
Tract % Minority: All
Hispanic Ethnicity: All Property Type: 1-4 Family
Preapproval Requested?: All HOEPA Loan?: All Lien Status: All
Spread Reported?: All
Action Loan Type Purpose Occupancy Investor Race Income Sex Originated All Purchase All All All All All
Rank Lender Type # %1 LAKE MICHIGAN CREDIT UNION (5,0000062514) P 91 17.142 MORTGAGE 1 INCORPORATION (7,7687600009) P 90 16.953 HUNTINGTON NATIONAL BANK, THE (9,0000012311) P 37 6.973 VANDYK MORTGAGE CORPORATION (7,38-2749215) P 37 6.975 FIFTH THIRD MORTGAGE-MI, LLC (9,0003072606) P 36 6.786 QUICKEN LOANS, INC. (7,7197000003) P 26 4.907 TOWNE MORTGAGE COMPANY (7,38-2434249) P 24 4.528 AMERIFIRST FINANCIAL CORPORATI (7,38-2699549) P 16 3.019 ENVOY MORTGAGE, LTD. (7,1635900004) P 14 2.6410 SUCCESS MORTGAGE PARTNERS, INC (7,01-0759540) P 13 2.4511 PNC BANK, NATIONAL ASSOCIATION (9,0000817824) P 12 2.2612 COMMUNITY SHORES BANK (3,0000034944) P 11 2.0713 CHEMICAL BANK (9,0000542649) P 9 1.6914 BENCHMARK MORTGAGE (7,75-2838184) P 8 1.5114 JPMORGAN CHASE BANK, NATIONAL (9,0000852218) P 8 1.5116 SHORE MORTGAGE (7,38-2750395) P 6 1.1316 MORTGAGE RESEARCH CENTER (7,43-1965151) P 6 1.1316 NORTHERN MORTGAGE SERVICES, IN (7,38-3305907) P 6 1.1316 USAA FEDERAL SAVINGS BANK (9,0000619877) P 6 1.1320 NORTHPOINTE BANK (3,0000034953) P 5 0.9421 MMS MORTGAGE SERVICES, LTD. (7,7548100004) P 3 0.5621 CHURCHILL MORTGAGE CORP (7,62-1494087) P 3 0.5621 MACATAWA BANK (3,0000034618) P 3 0.5621 BEST FINANCIAL CREDIT UNION (5,0000062027) P 3 0.5621 MEMBER FIRST MORTGAGE, LLC (7,38-3616059) P 3 0.5621 PLAZA HOME MORTGAGE, INC. (7,33-0941669) P 3 0.5621 WELLS FARGO BANK, NATIONAL ASS (9,0000451965) P 3 0.5621 AMERICAN FINANCIAL RESOURCES (7,22-3554558) P 3 0.5629 FINANCE OF AMERICA MORTGAGE LL (7,23-2769131) P 2 0.3829 INLANTA MORTGAGE (7,39-1767726) P 2 0.3829 FAMILY FINANCIAL CREDIT UNION (5,0000061633) S 2 0.3829 CALIBER HOME LOANS, INC. (7,13-6131491) P 2 0.3829 INDEPENDENT BANK (2,0000636771) P 2 0.38
S = Subprime, M = Manufactured Home, P = Prime (based on an analysis of lender activity)Data used in this analysis are taken from the 2017 National HMDA-LAR published by the Federal Financial Institutions Examination Council.
Applications with invalid actions were ignored when calculating percentages.
This report may not be copied, sold or distributed without the express written permission of CLC Compliance Technologies,Inc.Copyright 2004 - 2014 CLC Compliance Technologies,Inc.(1-800-499-HMDA) Page 1 of 2
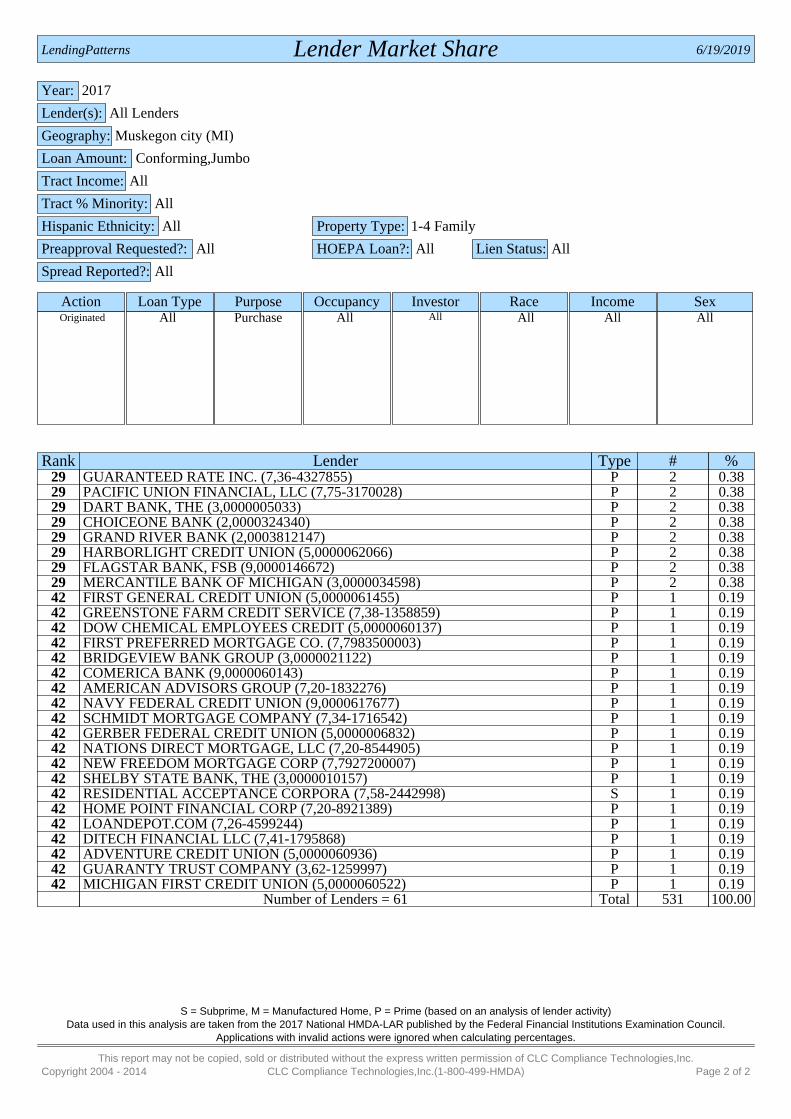
Lender Market ShareLendingPatterns 6/19/2019
Year: 2017
Lender(s): All Lenders
Geography: Muskegon city (MI)
Loan Amount: Conforming,Jumbo
Tract Income: All
Tract % Minority: All
Hispanic Ethnicity: All Property Type: 1-4 Family
Preapproval Requested?: All HOEPA Loan?: All Lien Status: All
Spread Reported?: All
Action Loan Type Purpose Occupancy Investor Race Income Sex Originated All Purchase All All All All All
Rank Lender Type # %29 GUARANTEED RATE INC. (7,36-4327855) P 2 0.3829 PACIFIC UNION FINANCIAL, LLC (7,75-3170028) P 2 0.3829 DART BANK, THE (3,0000005033) P 2 0.3829 CHOICEONE BANK (2,0000324340) P 2 0.3829 GRAND RIVER BANK (2,0003812147) P 2 0.3829 HARBORLIGHT CREDIT UNION (5,0000062066) P 2 0.3829 FLAGSTAR BANK, FSB (9,0000146672) P 2 0.3829 MERCANTILE BANK OF MICHIGAN (3,0000034598) P 2 0.3842 FIRST GENERAL CREDIT UNION (5,0000061455) P 1 0.1942 GREENSTONE FARM CREDIT SERVICE (7,38-1358859) P 1 0.1942 DOW CHEMICAL EMPLOYEES CREDIT (5,0000060137) P 1 0.1942 FIRST PREFERRED MORTGAGE CO. (7,7983500003) P 1 0.1942 BRIDGEVIEW BANK GROUP (3,0000021122) P 1 0.1942 COMERICA BANK (9,0000060143) P 1 0.1942 AMERICAN ADVISORS GROUP (7,20-1832276) P 1 0.1942 NAVY FEDERAL CREDIT UNION (9,0000617677) P 1 0.1942 SCHMIDT MORTGAGE COMPANY (7,34-1716542) P 1 0.1942 GERBER FEDERAL CREDIT UNION (5,0000006832) P 1 0.1942 NATIONS DIRECT MORTGAGE, LLC (7,20-8544905) P 1 0.1942 NEW FREEDOM MORTGAGE CORP (7,7927200007) P 1 0.1942 SHELBY STATE BANK, THE (3,0000010157) P 1 0.1942 RESIDENTIAL ACCEPTANCE CORPORA (7,58-2442998) S 1 0.1942 HOME POINT FINANCIAL CORP (7,20-8921389) P 1 0.1942 LOANDEPOT.COM (7,26-4599244) P 1 0.1942 DITECH FINANCIAL LLC (7,41-1795868) P 1 0.1942 ADVENTURE CREDIT UNION (5,0000060936) P 1 0.1942 GUARANTY TRUST COMPANY (3,62-1259997) P 1 0.1942 MICHIGAN FIRST CREDIT UNION (5,0000060522) P 1 0.19
Number of Lenders = 61 Total 531 100.00
S = Subprime, M = Manufactured Home, P = Prime (based on an analysis of lender activity)Data used in this analysis are taken from the 2017 National HMDA-LAR published by the Federal Financial Institutions Examination Council.
Applications with invalid actions were ignored when calculating percentages.
This report may not be copied, sold or distributed without the express written permission of CLC Compliance Technologies,Inc.Copyright 2004 - 2014 CLC Compliance Technologies,Inc.(1-800-499-HMDA) Page 2 of 2
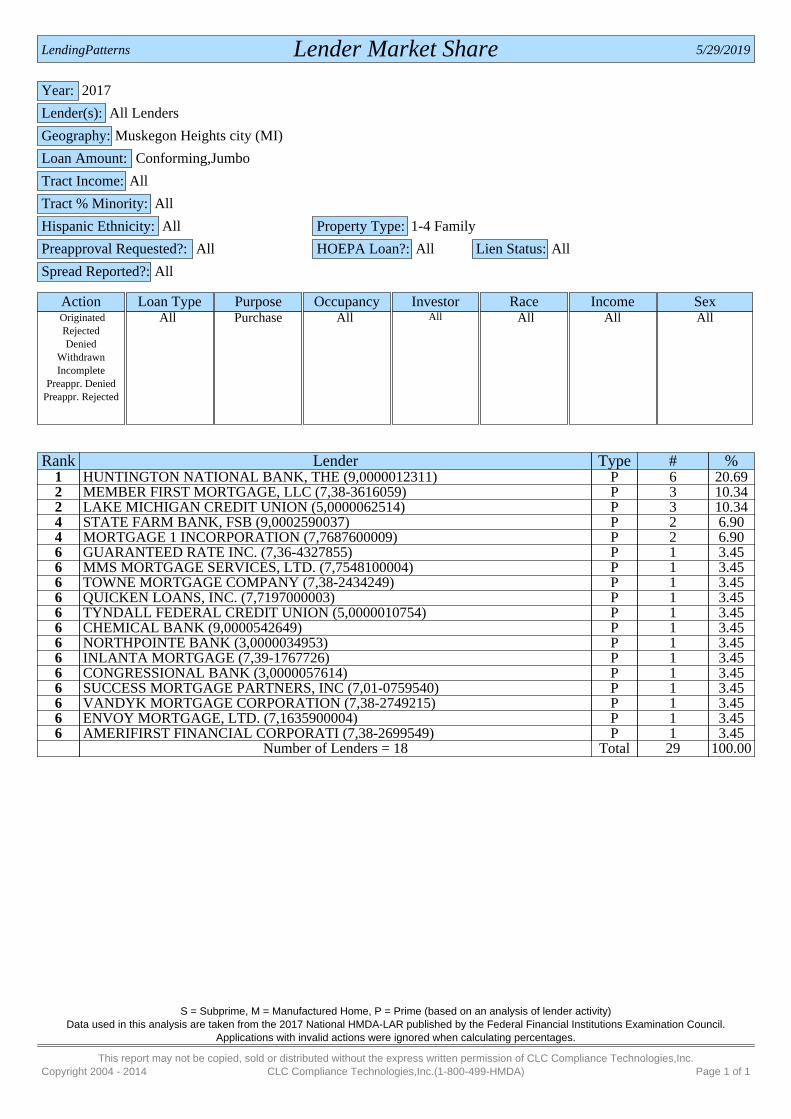
Lender Market ShareLendingPatterns 5/29/2019
Year: 2017
Lender(s): All Lenders
Geography: Muskegon Heights city (MI)
Loan Amount: Conforming,Jumbo
Tract Income: All
Tract % Minority: All
Hispanic Ethnicity: All Property Type: 1-4 Family
Preapproval Requested?: All HOEPA Loan?: All Lien Status: All
Spread Reported?: All
Action Loan Type Purpose Occupancy Investor Race Income Sex Originated
RejectedDenied
WithdrawnIncomplete
Preappr. DeniedPreappr. Rejected
All Purchase All All All All All
Rank Lender Type # %1 HUNTINGTON NATIONAL BANK, THE (9,0000012311) P 6 20.692 MEMBER FIRST MORTGAGE, LLC (7,38-3616059) P 3 10.342 LAKE MICHIGAN CREDIT UNION (5,0000062514) P 3 10.344 STATE FARM BANK, FSB (9,0002590037) P 2 6.904 MORTGAGE 1 INCORPORATION (7,7687600009) P 2 6.906 GUARANTEED RATE INC. (7,36-4327855) P 1 3.456 MMS MORTGAGE SERVICES, LTD. (7,7548100004) P 1 3.456 TOWNE MORTGAGE COMPANY (7,38-2434249) P 1 3.456 QUICKEN LOANS, INC. (7,7197000003) P 1 3.456 TYNDALL FEDERAL CREDIT UNION (5,0000010754) P 1 3.456 CHEMICAL BANK (9,0000542649) P 1 3.456 NORTHPOINTE BANK (3,0000034953) P 1 3.456 INLANTA MORTGAGE (7,39-1767726) P 1 3.456 CONGRESSIONAL BANK (3,0000057614) P 1 3.456 SUCCESS MORTGAGE PARTNERS, INC (7,01-0759540) P 1 3.456 VANDYK MORTGAGE CORPORATION (7,38-2749215) P 1 3.456 ENVOY MORTGAGE, LTD. (7,1635900004) P 1 3.456 AMERIFIRST FINANCIAL CORPORATI (7,38-2699549) P 1 3.45
Number of Lenders = 18 Total 29 100.00
S = Subprime, M = Manufactured Home, P = Prime (based on an analysis of lender activity)Data used in this analysis are taken from the 2017 National HMDA-LAR published by the Federal Financial Institutions Examination Council.
Applications with invalid actions were ignored when calculating percentages.
This report may not be copied, sold or distributed without the express written permission of CLC Compliance Technologies,Inc.Copyright 2004 - 2014 CLC Compliance Technologies,Inc.(1-800-499-HMDA) Page 1 of 1
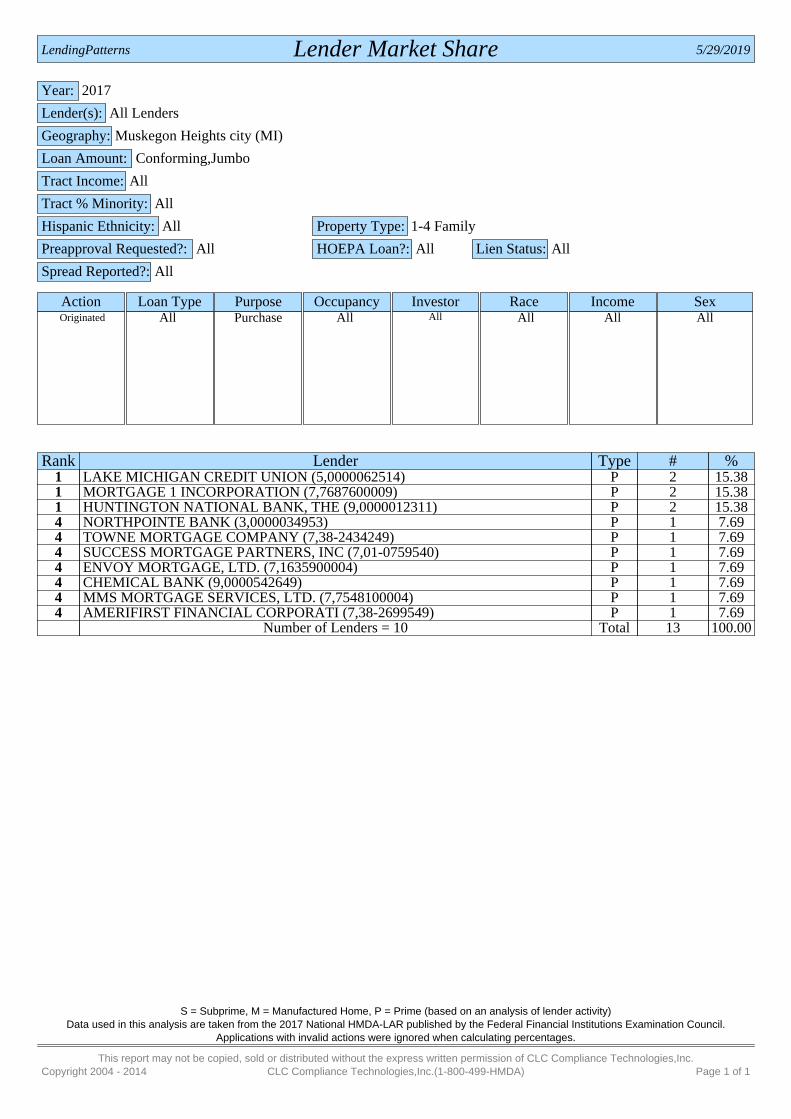
Lender Market ShareLendingPatterns 5/29/2019
Year: 2017
Lender(s): All Lenders
Geography: Muskegon Heights city (MI)
Loan Amount: Conforming,Jumbo
Tract Income: All
Tract % Minority: All
Hispanic Ethnicity: All Property Type: 1-4 Family
Preapproval Requested?: All HOEPA Loan?: All Lien Status: All
Spread Reported?: All
Action Loan Type Purpose Occupancy Investor Race Income Sex Originated All Purchase All All All All All
Rank Lender Type # %1 LAKE MICHIGAN CREDIT UNION (5,0000062514) P 2 15.381 MORTGAGE 1 INCORPORATION (7,7687600009) P 2 15.381 HUNTINGTON NATIONAL BANK, THE (9,0000012311) P 2 15.384 NORTHPOINTE BANK (3,0000034953) P 1 7.694 TOWNE MORTGAGE COMPANY (7,38-2434249) P 1 7.694 SUCCESS MORTGAGE PARTNERS, INC (7,01-0759540) P 1 7.694 ENVOY MORTGAGE, LTD. (7,1635900004) P 1 7.694 CHEMICAL BANK (9,0000542649) P 1 7.694 MMS MORTGAGE SERVICES, LTD. (7,7548100004) P 1 7.694 AMERIFIRST FINANCIAL CORPORATI (7,38-2699549) P 1 7.69
Number of Lenders = 10 Total 13 100.00
S = Subprime, M = Manufactured Home, P = Prime (based on an analysis of lender activity)Data used in this analysis are taken from the 2017 National HMDA-LAR published by the Federal Financial Institutions Examination Council.
Applications with invalid actions were ignored when calculating percentages.
This report may not be copied, sold or distributed without the express written permission of CLC Compliance Technologies,Inc.Copyright 2004 - 2014 CLC Compliance Technologies,Inc.(1-800-499-HMDA) Page 1 of 1
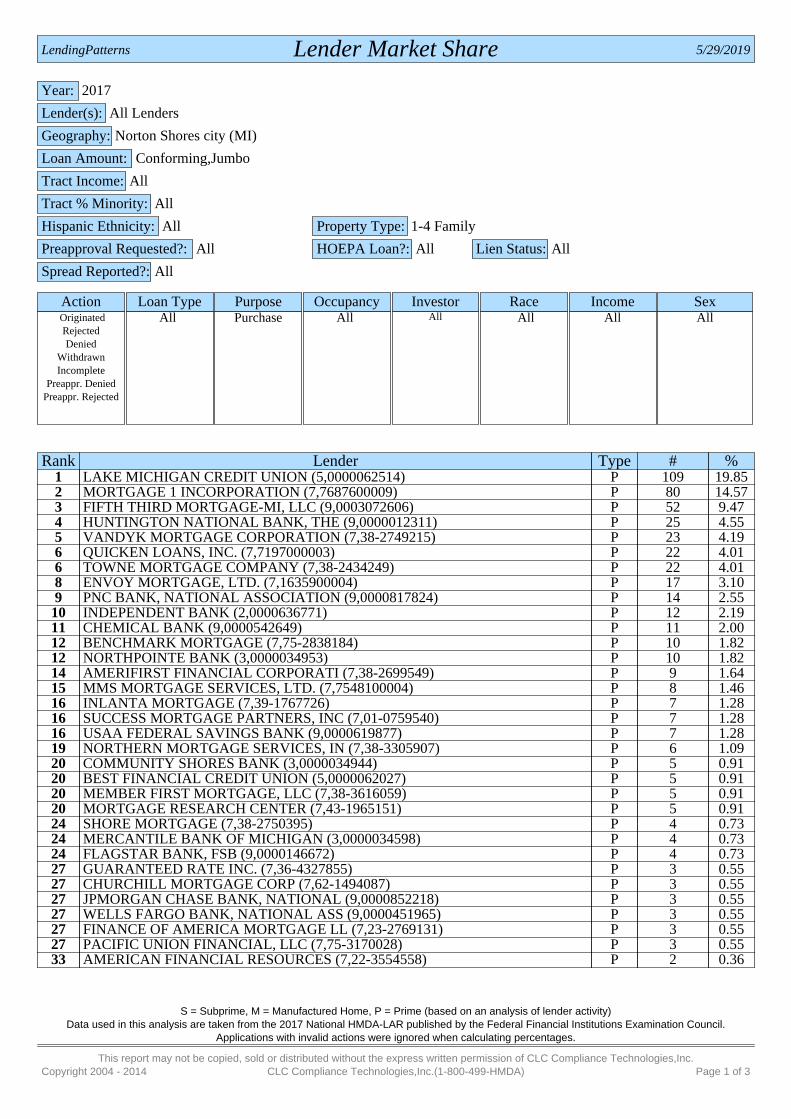
Lender Market ShareLendingPatterns 5/29/2019
Year: 2017
Lender(s): All Lenders
Geography: Norton Shores city (MI)
Loan Amount: Conforming,Jumbo
Tract Income: All
Tract % Minority: All
Hispanic Ethnicity: All Property Type: 1-4 Family
Preapproval Requested?: All HOEPA Loan?: All Lien Status: All
Spread Reported?: All
Action Loan Type Purpose Occupancy Investor Race Income Sex Originated
RejectedDenied
WithdrawnIncomplete
Preappr. DeniedPreappr. Rejected
All Purchase All All All All All
Rank Lender Type # %1 LAKE MICHIGAN CREDIT UNION (5,0000062514) P 109 19.852 MORTGAGE 1 INCORPORATION (7,7687600009) P 80 14.573 FIFTH THIRD MORTGAGE-MI, LLC (9,0003072606) P 52 9.474 HUNTINGTON NATIONAL BANK, THE (9,0000012311) P 25 4.555 VANDYK MORTGAGE CORPORATION (7,38-2749215) P 23 4.196 QUICKEN LOANS, INC. (7,7197000003) P 22 4.016 TOWNE MORTGAGE COMPANY (7,38-2434249) P 22 4.018 ENVOY MORTGAGE, LTD. (7,1635900004) P 17 3.109 PNC BANK, NATIONAL ASSOCIATION (9,0000817824) P 14 2.5510 INDEPENDENT BANK (2,0000636771) P 12 2.1911 CHEMICAL BANK (9,0000542649) P 11 2.0012 BENCHMARK MORTGAGE (7,75-2838184) P 10 1.8212 NORTHPOINTE BANK (3,0000034953) P 10 1.8214 AMERIFIRST FINANCIAL CORPORATI (7,38-2699549) P 9 1.6415 MMS MORTGAGE SERVICES, LTD. (7,7548100004) P 8 1.4616 INLANTA MORTGAGE (7,39-1767726) P 7 1.2816 SUCCESS MORTGAGE PARTNERS, INC (7,01-0759540) P 7 1.2816 USAA FEDERAL SAVINGS BANK (9,0000619877) P 7 1.2819 NORTHERN MORTGAGE SERVICES, IN (7,38-3305907) P 6 1.0920 COMMUNITY SHORES BANK (3,0000034944) P 5 0.9120 BEST FINANCIAL CREDIT UNION (5,0000062027) P 5 0.9120 MEMBER FIRST MORTGAGE, LLC (7,38-3616059) P 5 0.9120 MORTGAGE RESEARCH CENTER (7,43-1965151) P 5 0.9124 SHORE MORTGAGE (7,38-2750395) P 4 0.7324 MERCANTILE BANK OF MICHIGAN (3,0000034598) P 4 0.7324 FLAGSTAR BANK, FSB (9,0000146672) P 4 0.7327 GUARANTEED RATE INC. (7,36-4327855) P 3 0.5527 CHURCHILL MORTGAGE CORP (7,62-1494087) P 3 0.5527 JPMORGAN CHASE BANK, NATIONAL (9,0000852218) P 3 0.5527 WELLS FARGO BANK, NATIONAL ASS (9,0000451965) P 3 0.5527 FINANCE OF AMERICA MORTGAGE LL (7,23-2769131) P 3 0.5527 PACIFIC UNION FINANCIAL, LLC (7,75-3170028) P 3 0.5533 AMERICAN FINANCIAL RESOURCES (7,22-3554558) P 2 0.36
S = Subprime, M = Manufactured Home, P = Prime (based on an analysis of lender activity)Data used in this analysis are taken from the 2017 National HMDA-LAR published by the Federal Financial Institutions Examination Council.
Applications with invalid actions were ignored when calculating percentages.
This report may not be copied, sold or distributed without the express written permission of CLC Compliance Technologies,Inc.Copyright 2004 - 2014 CLC Compliance Technologies,Inc.(1-800-499-HMDA) Page 1 of 3
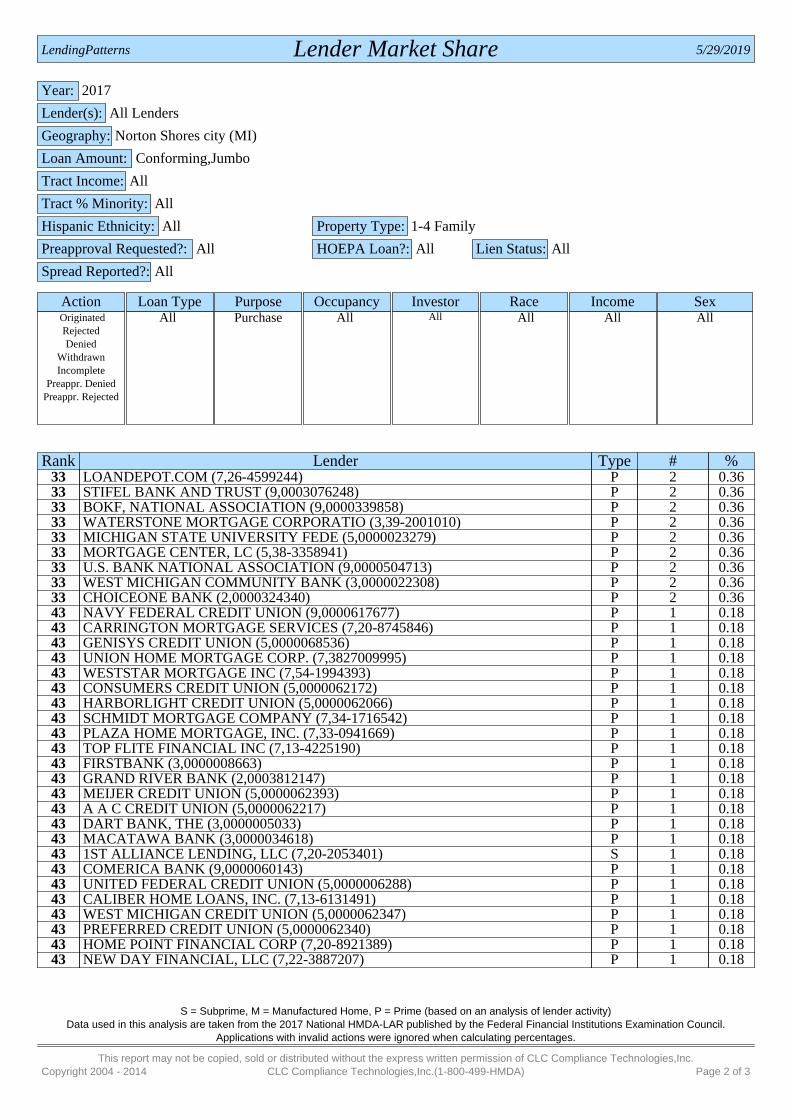
Lender Market ShareLendingPatterns 5/29/2019
Year: 2017
Lender(s): All Lenders
Geography: Norton Shores city (MI)
Loan Amount: Conforming,Jumbo
Tract Income: All
Tract % Minority: All
Hispanic Ethnicity: All Property Type: 1-4 Family
Preapproval Requested?: All HOEPA Loan?: All Lien Status: All
Spread Reported?: All
Action Loan Type Purpose Occupancy Investor Race Income Sex Originated
RejectedDenied
WithdrawnIncomplete
Preappr. DeniedPreappr. Rejected
All Purchase All All All All All
Rank Lender Type # %33 LOANDEPOT.COM (7,26-4599244) P 2 0.3633 STIFEL BANK AND TRUST (9,0003076248) P 2 0.3633 BOKF, NATIONAL ASSOCIATION (9,0000339858) P 2 0.3633 WATERSTONE MORTGAGE CORPORATIO (3,39-2001010) P 2 0.3633 MICHIGAN STATE UNIVERSITY FEDE (5,0000023279) P 2 0.3633 MORTGAGE CENTER, LC (5,38-3358941) P 2 0.3633 U.S. BANK NATIONAL ASSOCIATION (9,0000504713) P 2 0.3633 WEST MICHIGAN COMMUNITY BANK (3,0000022308) P 2 0.3633 CHOICEONE BANK (2,0000324340) P 2 0.3643 NAVY FEDERAL CREDIT UNION (9,0000617677) P 1 0.1843 CARRINGTON MORTGAGE SERVICES (7,20-8745846) P 1 0.1843 GENISYS CREDIT UNION (5,0000068536) P 1 0.1843 UNION HOME MORTGAGE CORP. (7,3827009995) P 1 0.1843 WESTSTAR MORTGAGE INC (7,54-1994393) P 1 0.1843 CONSUMERS CREDIT UNION (5,0000062172) P 1 0.1843 HARBORLIGHT CREDIT UNION (5,0000062066) P 1 0.1843 SCHMIDT MORTGAGE COMPANY (7,34-1716542) P 1 0.1843 PLAZA HOME MORTGAGE, INC. (7,33-0941669) P 1 0.1843 TOP FLITE FINANCIAL INC (7,13-4225190) P 1 0.1843 FIRSTBANK (3,0000008663) P 1 0.1843 GRAND RIVER BANK (2,0003812147) P 1 0.1843 MEIJER CREDIT UNION (5,0000062393) P 1 0.1843 A A C CREDIT UNION (5,0000062217) P 1 0.1843 DART BANK, THE (3,0000005033) P 1 0.1843 MACATAWA BANK (3,0000034618) P 1 0.1843 1ST ALLIANCE LENDING, LLC (7,20-2053401) S 1 0.1843 COMERICA BANK (9,0000060143) P 1 0.1843 UNITED FEDERAL CREDIT UNION (5,0000006288) P 1 0.1843 CALIBER HOME LOANS, INC. (7,13-6131491) P 1 0.1843 WEST MICHIGAN CREDIT UNION (5,0000062347) P 1 0.1843 PREFERRED CREDIT UNION (5,0000062340) P 1 0.1843 HOME POINT FINANCIAL CORP (7,20-8921389) P 1 0.1843 NEW DAY FINANCIAL, LLC (7,22-3887207) P 1 0.18
S = Subprime, M = Manufactured Home, P = Prime (based on an analysis of lender activity)Data used in this analysis are taken from the 2017 National HMDA-LAR published by the Federal Financial Institutions Examination Council.
Applications with invalid actions were ignored when calculating percentages.
This report may not be copied, sold or distributed without the express written permission of CLC Compliance Technologies,Inc.Copyright 2004 - 2014 CLC Compliance Technologies,Inc.(1-800-499-HMDA) Page 2 of 3
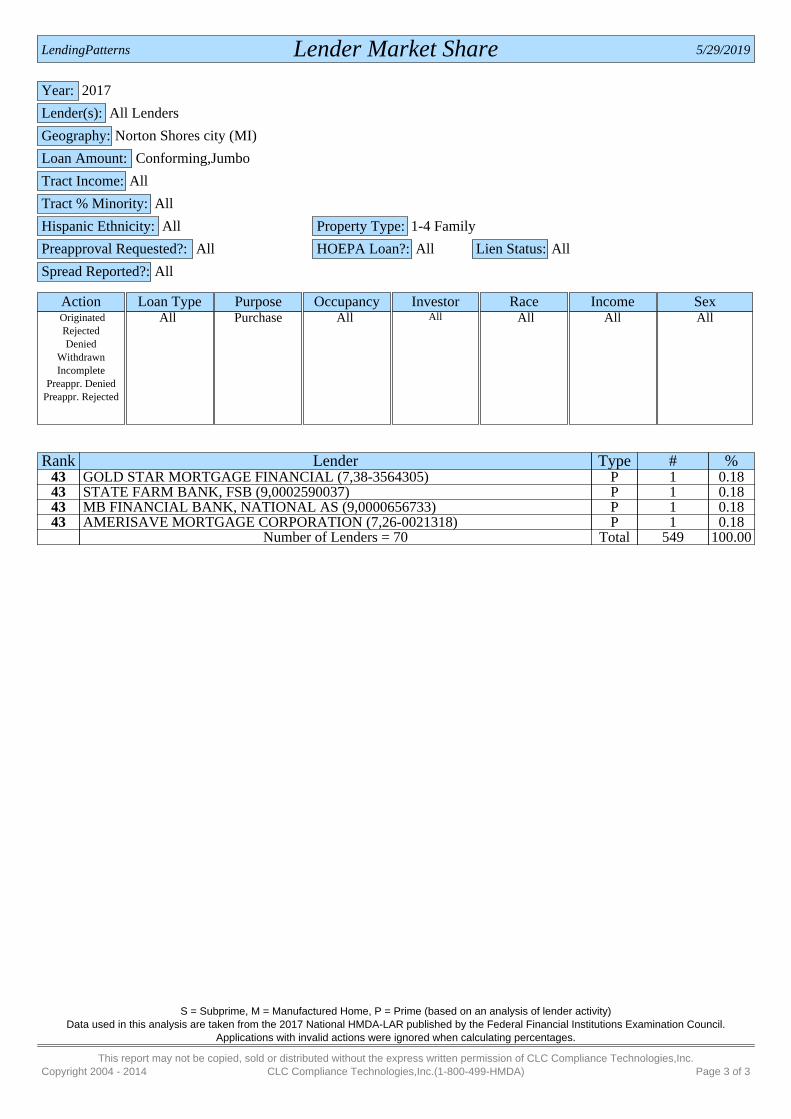
Lender Market ShareLendingPatterns 5/29/2019
Year: 2017
Lender(s): All Lenders
Geography: Norton Shores city (MI)
Loan Amount: Conforming,Jumbo
Tract Income: All
Tract % Minority: All
Hispanic Ethnicity: All Property Type: 1-4 Family
Preapproval Requested?: All HOEPA Loan?: All Lien Status: All
Spread Reported?: All
Action Loan Type Purpose Occupancy Investor Race Income Sex Originated
RejectedDenied
WithdrawnIncomplete
Preappr. DeniedPreappr. Rejected
All Purchase All All All All All
Rank Lender Type # %43 GOLD STAR MORTGAGE FINANCIAL (7,38-3564305) P 1 0.1843 STATE FARM BANK, FSB (9,0002590037) P 1 0.1843 MB FINANCIAL BANK, NATIONAL AS (9,0000656733) P 1 0.1843 AMERISAVE MORTGAGE CORPORATION (7,26-0021318) P 1 0.18
Number of Lenders = 70 Total 549 100.00
S = Subprime, M = Manufactured Home, P = Prime (based on an analysis of lender activity)Data used in this analysis are taken from the 2017 National HMDA-LAR published by the Federal Financial Institutions Examination Council.
Applications with invalid actions were ignored when calculating percentages.
This report may not be copied, sold or distributed without the express written permission of CLC Compliance Technologies,Inc.Copyright 2004 - 2014 CLC Compliance Technologies,Inc.(1-800-499-HMDA) Page 3 of 3
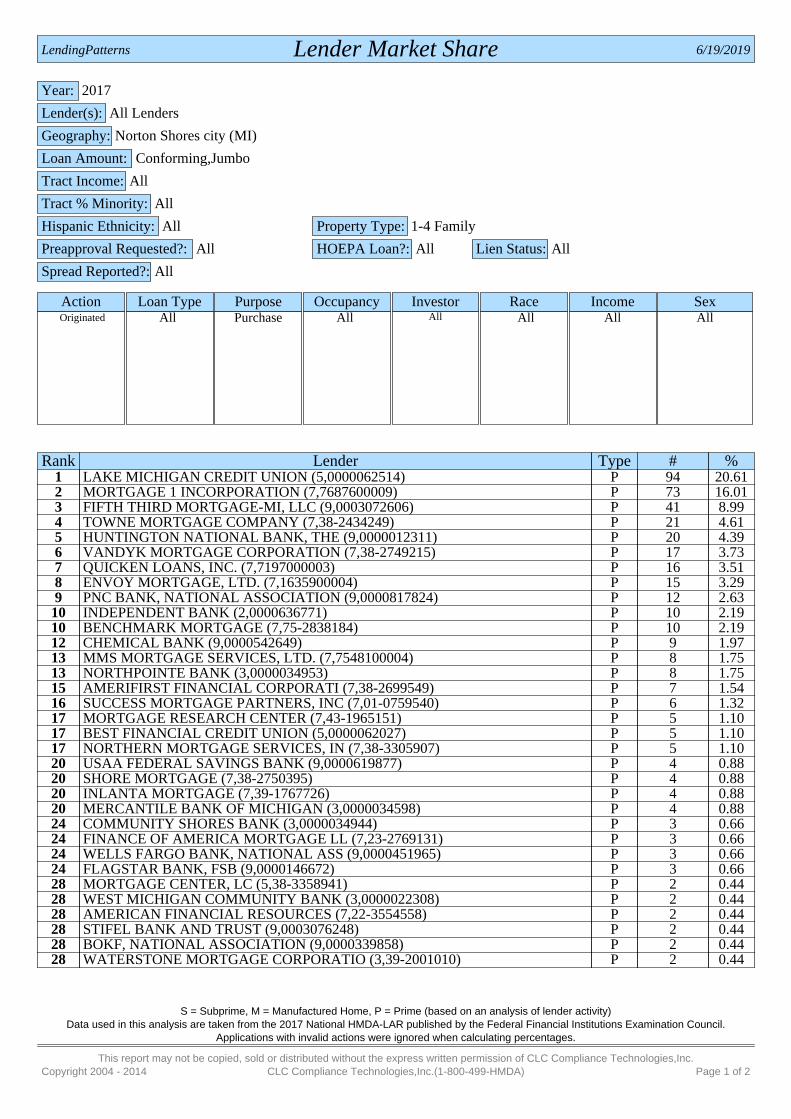
Lender Market ShareLendingPatterns 6/19/2019
Year: 2017
Lender(s): All Lenders
Geography: Norton Shores city (MI)
Loan Amount: Conforming,Jumbo
Tract Income: All
Tract % Minority: All
Hispanic Ethnicity: All Property Type: 1-4 Family
Preapproval Requested?: All HOEPA Loan?: All Lien Status: All
Spread Reported?: All
Action Loan Type Purpose Occupancy Investor Race Income Sex Originated All Purchase All All All All All
Rank Lender Type # %1 LAKE MICHIGAN CREDIT UNION (5,0000062514) P 94 20.612 MORTGAGE 1 INCORPORATION (7,7687600009) P 73 16.013 FIFTH THIRD MORTGAGE-MI, LLC (9,0003072606) P 41 8.994 TOWNE MORTGAGE COMPANY (7,38-2434249) P 21 4.615 HUNTINGTON NATIONAL BANK, THE (9,0000012311) P 20 4.396 VANDYK MORTGAGE CORPORATION (7,38-2749215) P 17 3.737 QUICKEN LOANS, INC. (7,7197000003) P 16 3.518 ENVOY MORTGAGE, LTD. (7,1635900004) P 15 3.299 PNC BANK, NATIONAL ASSOCIATION (9,0000817824) P 12 2.6310 INDEPENDENT BANK (2,0000636771) P 10 2.1910 BENCHMARK MORTGAGE (7,75-2838184) P 10 2.1912 CHEMICAL BANK (9,0000542649) P 9 1.9713 MMS MORTGAGE SERVICES, LTD. (7,7548100004) P 8 1.7513 NORTHPOINTE BANK (3,0000034953) P 8 1.7515 AMERIFIRST FINANCIAL CORPORATI (7,38-2699549) P 7 1.5416 SUCCESS MORTGAGE PARTNERS, INC (7,01-0759540) P 6 1.3217 MORTGAGE RESEARCH CENTER (7,43-1965151) P 5 1.1017 BEST FINANCIAL CREDIT UNION (5,0000062027) P 5 1.1017 NORTHERN MORTGAGE SERVICES, IN (7,38-3305907) P 5 1.1020 USAA FEDERAL SAVINGS BANK (9,0000619877) P 4 0.8820 SHORE MORTGAGE (7,38-2750395) P 4 0.8820 INLANTA MORTGAGE (7,39-1767726) P 4 0.8820 MERCANTILE BANK OF MICHIGAN (3,0000034598) P 4 0.8824 COMMUNITY SHORES BANK (3,0000034944) P 3 0.6624 FINANCE OF AMERICA MORTGAGE LL (7,23-2769131) P 3 0.6624 WELLS FARGO BANK, NATIONAL ASS (9,0000451965) P 3 0.6624 FLAGSTAR BANK, FSB (9,0000146672) P 3 0.6628 MORTGAGE CENTER, LC (5,38-3358941) P 2 0.4428 WEST MICHIGAN COMMUNITY BANK (3,0000022308) P 2 0.4428 AMERICAN FINANCIAL RESOURCES (7,22-3554558) P 2 0.4428 STIFEL BANK AND TRUST (9,0003076248) P 2 0.4428 BOKF, NATIONAL ASSOCIATION (9,0000339858) P 2 0.4428 WATERSTONE MORTGAGE CORPORATIO (3,39-2001010) P 2 0.44
S = Subprime, M = Manufactured Home, P = Prime (based on an analysis of lender activity)Data used in this analysis are taken from the 2017 National HMDA-LAR published by the Federal Financial Institutions Examination Council.
Applications with invalid actions were ignored when calculating percentages.
This report may not be copied, sold or distributed without the express written permission of CLC Compliance Technologies,Inc.Copyright 2004 - 2014 CLC Compliance Technologies,Inc.(1-800-499-HMDA) Page 1 of 2
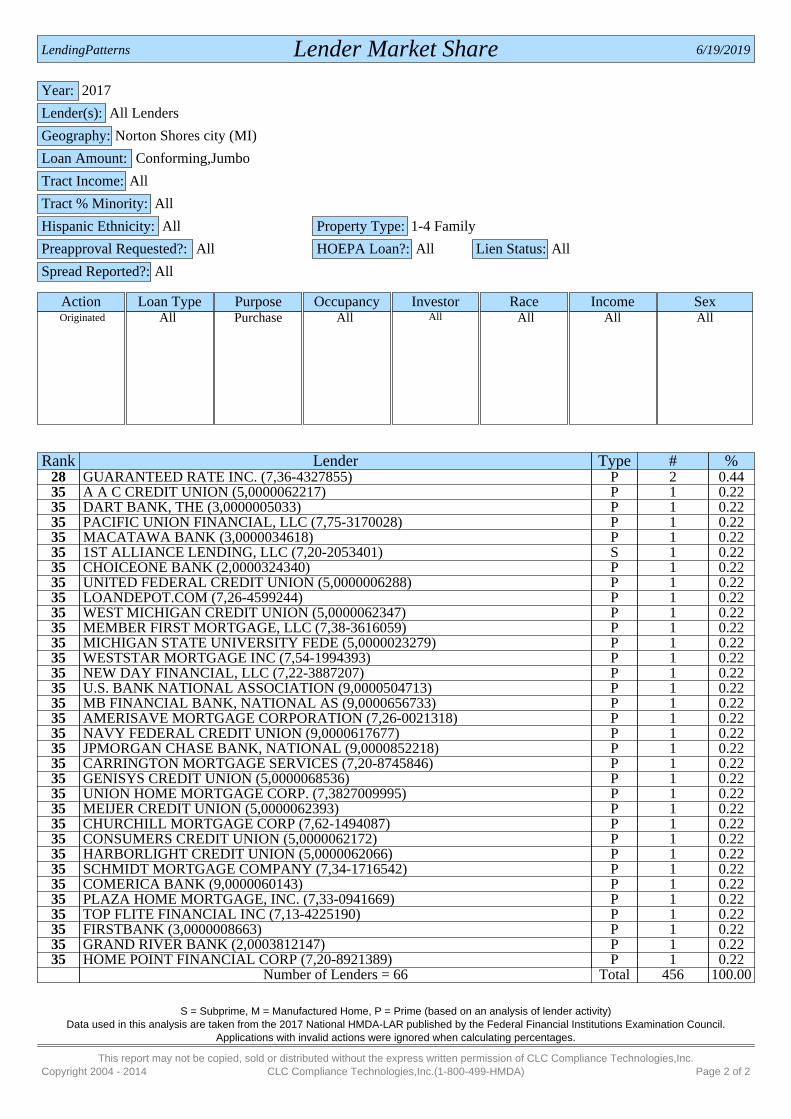
Lender Market ShareLendingPatterns 6/19/2019
Year: 2017
Lender(s): All Lenders
Geography: Norton Shores city (MI)
Loan Amount: Conforming,Jumbo
Tract Income: All
Tract % Minority: All
Hispanic Ethnicity: All Property Type: 1-4 Family
Preapproval Requested?: All HOEPA Loan?: All Lien Status: All
Spread Reported?: All
Action Loan Type Purpose Occupancy Investor Race Income Sex Originated All Purchase All All All All All
Rank Lender Type # %28 GUARANTEED RATE INC. (7,36-4327855) P 2 0.4435 A A C CREDIT UNION (5,0000062217) P 1 0.2235 DART BANK, THE (3,0000005033) P 1 0.2235 PACIFIC UNION FINANCIAL, LLC (7,75-3170028) P 1 0.2235 MACATAWA BANK (3,0000034618) P 1 0.2235 1ST ALLIANCE LENDING, LLC (7,20-2053401) S 1 0.2235 CHOICEONE BANK (2,0000324340) P 1 0.2235 UNITED FEDERAL CREDIT UNION (5,0000006288) P 1 0.2235 LOANDEPOT.COM (7,26-4599244) P 1 0.2235 WEST MICHIGAN CREDIT UNION (5,0000062347) P 1 0.2235 MEMBER FIRST MORTGAGE, LLC (7,38-3616059) P 1 0.2235 MICHIGAN STATE UNIVERSITY FEDE (5,0000023279) P 1 0.2235 WESTSTAR MORTGAGE INC (7,54-1994393) P 1 0.2235 NEW DAY FINANCIAL, LLC (7,22-3887207) P 1 0.2235 U.S. BANK NATIONAL ASSOCIATION (9,0000504713) P 1 0.2235 MB FINANCIAL BANK, NATIONAL AS (9,0000656733) P 1 0.2235 AMERISAVE MORTGAGE CORPORATION (7,26-0021318) P 1 0.2235 NAVY FEDERAL CREDIT UNION (9,0000617677) P 1 0.2235 JPMORGAN CHASE BANK, NATIONAL (9,0000852218) P 1 0.2235 CARRINGTON MORTGAGE SERVICES (7,20-8745846) P 1 0.2235 GENISYS CREDIT UNION (5,0000068536) P 1 0.2235 UNION HOME MORTGAGE CORP. (7,3827009995) P 1 0.2235 MEIJER CREDIT UNION (5,0000062393) P 1 0.2235 CHURCHILL MORTGAGE CORP (7,62-1494087) P 1 0.2235 CONSUMERS CREDIT UNION (5,0000062172) P 1 0.2235 HARBORLIGHT CREDIT UNION (5,0000062066) P 1 0.2235 SCHMIDT MORTGAGE COMPANY (7,34-1716542) P 1 0.2235 COMERICA BANK (9,0000060143) P 1 0.2235 PLAZA HOME MORTGAGE, INC. (7,33-0941669) P 1 0.2235 TOP FLITE FINANCIAL INC (7,13-4225190) P 1 0.2235 FIRSTBANK (3,0000008663) P 1 0.2235 GRAND RIVER BANK (2,0003812147) P 1 0.2235 HOME POINT FINANCIAL CORP (7,20-8921389) P 1 0.22
Number of Lenders = 66 Total 456 100.00
S = Subprime, M = Manufactured Home, P = Prime (based on an analysis of lender activity)Data used in this analysis are taken from the 2017 National HMDA-LAR published by the Federal Financial Institutions Examination Council.
Applications with invalid actions were ignored when calculating percentages.
This report may not be copied, sold or distributed without the express written permission of CLC Compliance Technologies,Inc.Copyright 2004 - 2014 CLC Compliance Technologies,Inc.(1-800-499-HMDA) Page 2 of 2
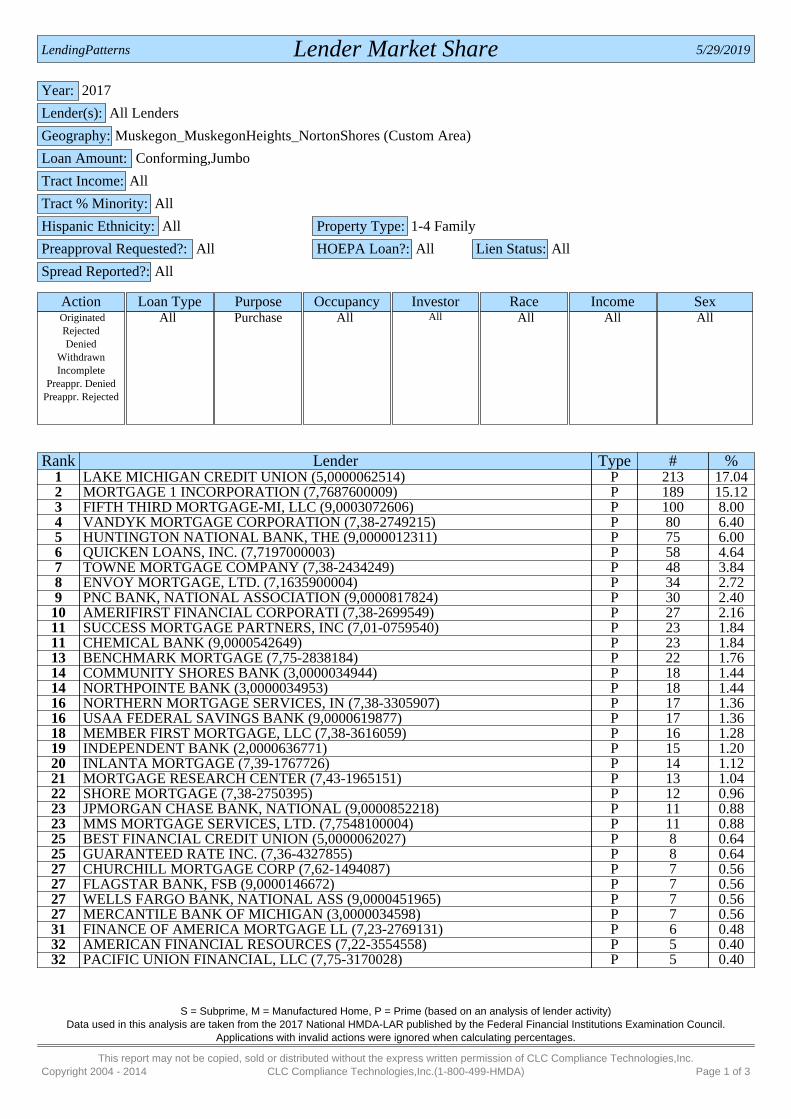
Lender Market ShareLendingPatterns 5/29/2019
Year: 2017
Lender(s): All Lenders
Geography: Muskegon_MuskegonHeights_NortonShores (Custom Area)
Loan Amount: Conforming,Jumbo
Tract Income: All
Tract % Minority: All
Hispanic Ethnicity: All Property Type: 1-4 Family
Preapproval Requested?: All HOEPA Loan?: All Lien Status: All
Spread Reported?: All
Action Loan Type Purpose Occupancy Investor Race Income Sex Originated
RejectedDenied
WithdrawnIncomplete
Preappr. DeniedPreappr. Rejected
All Purchase All All All All All
Rank Lender Type # %1 LAKE MICHIGAN CREDIT UNION (5,0000062514) P 213 17.042 MORTGAGE 1 INCORPORATION (7,7687600009) P 189 15.123 FIFTH THIRD MORTGAGE-MI, LLC (9,0003072606) P 100 8.004 VANDYK MORTGAGE CORPORATION (7,38-2749215) P 80 6.405 HUNTINGTON NATIONAL BANK, THE (9,0000012311) P 75 6.006 QUICKEN LOANS, INC. (7,7197000003) P 58 4.647 TOWNE MORTGAGE COMPANY (7,38-2434249) P 48 3.848 ENVOY MORTGAGE, LTD. (7,1635900004) P 34 2.729 PNC BANK, NATIONAL ASSOCIATION (9,0000817824) P 30 2.4010 AMERIFIRST FINANCIAL CORPORATI (7,38-2699549) P 27 2.1611 SUCCESS MORTGAGE PARTNERS, INC (7,01-0759540) P 23 1.8411 CHEMICAL BANK (9,0000542649) P 23 1.8413 BENCHMARK MORTGAGE (7,75-2838184) P 22 1.7614 COMMUNITY SHORES BANK (3,0000034944) P 18 1.4414 NORTHPOINTE BANK (3,0000034953) P 18 1.4416 NORTHERN MORTGAGE SERVICES, IN (7,38-3305907) P 17 1.3616 USAA FEDERAL SAVINGS BANK (9,0000619877) P 17 1.3618 MEMBER FIRST MORTGAGE, LLC (7,38-3616059) P 16 1.2819 INDEPENDENT BANK (2,0000636771) P 15 1.2020 INLANTA MORTGAGE (7,39-1767726) P 14 1.1221 MORTGAGE RESEARCH CENTER (7,43-1965151) P 13 1.0422 SHORE MORTGAGE (7,38-2750395) P 12 0.9623 JPMORGAN CHASE BANK, NATIONAL (9,0000852218) P 11 0.8823 MMS MORTGAGE SERVICES, LTD. (7,7548100004) P 11 0.8825 BEST FINANCIAL CREDIT UNION (5,0000062027) P 8 0.6425 GUARANTEED RATE INC. (7,36-4327855) P 8 0.6427 CHURCHILL MORTGAGE CORP (7,62-1494087) P 7 0.5627 FLAGSTAR BANK, FSB (9,0000146672) P 7 0.5627 WELLS FARGO BANK, NATIONAL ASS (9,0000451965) P 7 0.5627 MERCANTILE BANK OF MICHIGAN (3,0000034598) P 7 0.5631 FINANCE OF AMERICA MORTGAGE LL (7,23-2769131) P 6 0.4832 AMERICAN FINANCIAL RESOURCES (7,22-3554558) P 5 0.4032 PACIFIC UNION FINANCIAL, LLC (7,75-3170028) P 5 0.40
S = Subprime, M = Manufactured Home, P = Prime (based on an analysis of lender activity)Data used in this analysis are taken from the 2017 National HMDA-LAR published by the Federal Financial Institutions Examination Council.
Applications with invalid actions were ignored when calculating percentages.
This report may not be copied, sold or distributed without the express written permission of CLC Compliance Technologies,Inc.Copyright 2004 - 2014 CLC Compliance Technologies,Inc.(1-800-499-HMDA) Page 1 of 3
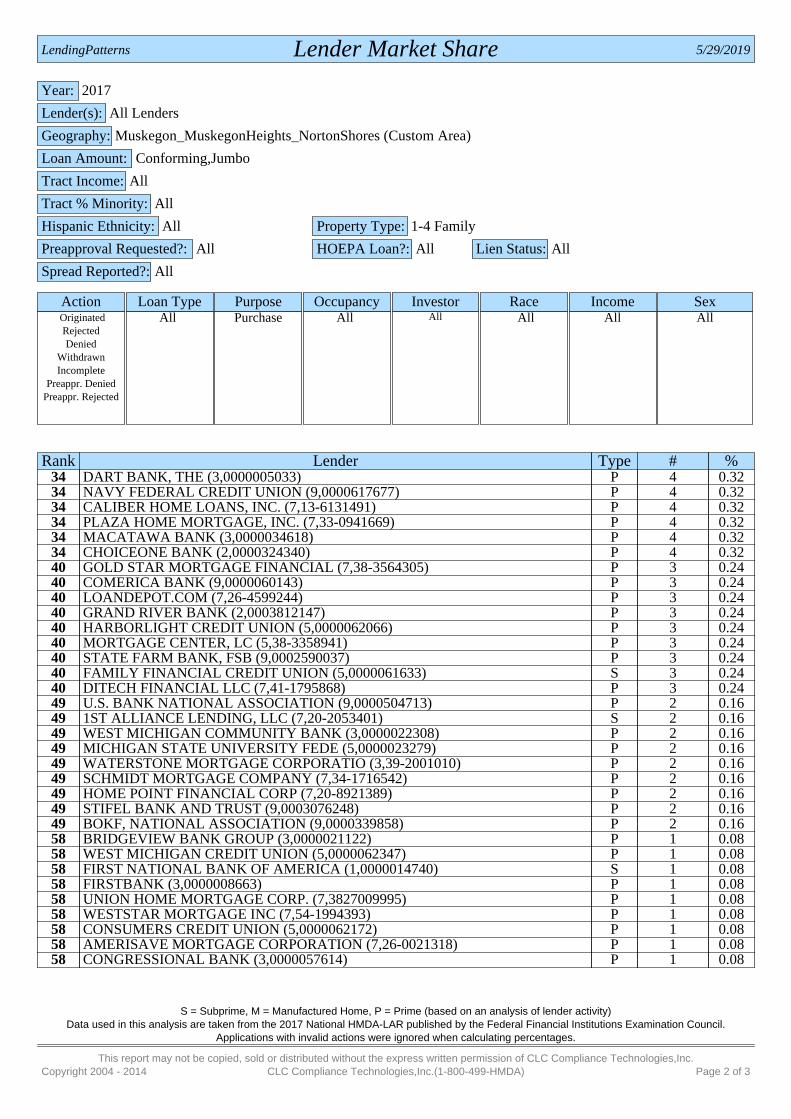
Lender Market ShareLendingPatterns 5/29/2019
Year: 2017
Lender(s): All Lenders
Geography: Muskegon_MuskegonHeights_NortonShores (Custom Area)
Loan Amount: Conforming,Jumbo
Tract Income: All
Tract % Minority: All
Hispanic Ethnicity: All Property Type: 1-4 Family
Preapproval Requested?: All HOEPA Loan?: All Lien Status: All
Spread Reported?: All
Action Loan Type Purpose Occupancy Investor Race Income Sex Originated
RejectedDenied
WithdrawnIncomplete
Preappr. DeniedPreappr. Rejected
All Purchase All All All All All
Rank Lender Type # %34 DART BANK, THE (3,0000005033) P 4 0.3234 NAVY FEDERAL CREDIT UNION (9,0000617677) P 4 0.3234 CALIBER HOME LOANS, INC. (7,13-6131491) P 4 0.3234 PLAZA HOME MORTGAGE, INC. (7,33-0941669) P 4 0.3234 MACATAWA BANK (3,0000034618) P 4 0.3234 CHOICEONE BANK (2,0000324340) P 4 0.3240 GOLD STAR MORTGAGE FINANCIAL (7,38-3564305) P 3 0.2440 COMERICA BANK (9,0000060143) P 3 0.2440 LOANDEPOT.COM (7,26-4599244) P 3 0.2440 GRAND RIVER BANK (2,0003812147) P 3 0.2440 HARBORLIGHT CREDIT UNION (5,0000062066) P 3 0.2440 MORTGAGE CENTER, LC (5,38-3358941) P 3 0.2440 STATE FARM BANK, FSB (9,0002590037) P 3 0.2440 FAMILY FINANCIAL CREDIT UNION (5,0000061633) S 3 0.2440 DITECH FINANCIAL LLC (7,41-1795868) P 3 0.2449 U.S. BANK NATIONAL ASSOCIATION (9,0000504713) P 2 0.1649 1ST ALLIANCE LENDING, LLC (7,20-2053401) S 2 0.1649 WEST MICHIGAN COMMUNITY BANK (3,0000022308) P 2 0.1649 MICHIGAN STATE UNIVERSITY FEDE (5,0000023279) P 2 0.1649 WATERSTONE MORTGAGE CORPORATIO (3,39-2001010) P 2 0.1649 SCHMIDT MORTGAGE COMPANY (7,34-1716542) P 2 0.1649 HOME POINT FINANCIAL CORP (7,20-8921389) P 2 0.1649 STIFEL BANK AND TRUST (9,0003076248) P 2 0.1649 BOKF, NATIONAL ASSOCIATION (9,0000339858) P 2 0.1658 BRIDGEVIEW BANK GROUP (3,0000021122) P 1 0.0858 WEST MICHIGAN CREDIT UNION (5,0000062347) P 1 0.0858 FIRST NATIONAL BANK OF AMERICA (1,0000014740) S 1 0.0858 FIRSTBANK (3,0000008663) P 1 0.0858 UNION HOME MORTGAGE CORP. (7,3827009995) P 1 0.0858 WESTSTAR MORTGAGE INC (7,54-1994393) P 1 0.0858 CONSUMERS CREDIT UNION (5,0000062172) P 1 0.0858 AMERISAVE MORTGAGE CORPORATION (7,26-0021318) P 1 0.0858 CONGRESSIONAL BANK (3,0000057614) P 1 0.08
S = Subprime, M = Manufactured Home, P = Prime (based on an analysis of lender activity)Data used in this analysis are taken from the 2017 National HMDA-LAR published by the Federal Financial Institutions Examination Council.
Applications with invalid actions were ignored when calculating percentages.
This report may not be copied, sold or distributed without the express written permission of CLC Compliance Technologies,Inc.Copyright 2004 - 2014 CLC Compliance Technologies,Inc.(1-800-499-HMDA) Page 2 of 3
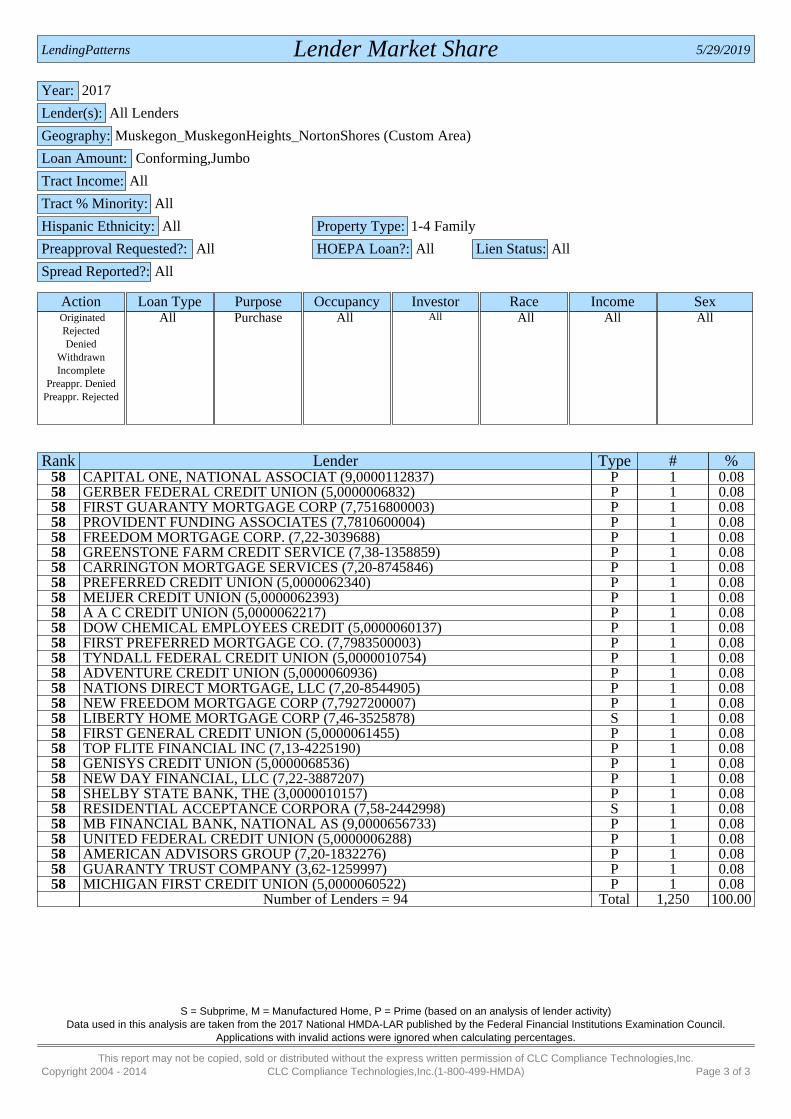
Lender Market ShareLendingPatterns 5/29/2019
Year: 2017
Lender(s): All Lenders
Geography: Muskegon_MuskegonHeights_NortonShores (Custom Area)
Loan Amount: Conforming,Jumbo
Tract Income: All
Tract % Minority: All
Hispanic Ethnicity: All Property Type: 1-4 Family
Preapproval Requested?: All HOEPA Loan?: All Lien Status: All
Spread Reported?: All
Action Loan Type Purpose Occupancy Investor Race Income Sex Originated
RejectedDenied
WithdrawnIncomplete
Preappr. DeniedPreappr. Rejected
All Purchase All All All All All
Rank Lender Type # %58 CAPITAL ONE, NATIONAL ASSOCIAT (9,0000112837) P 1 0.0858 GERBER FEDERAL CREDIT UNION (5,0000006832) P 1 0.0858 FIRST GUARANTY MORTGAGE CORP (7,7516800003) P 1 0.0858 PROVIDENT FUNDING ASSOCIATES (7,7810600004) P 1 0.0858 FREEDOM MORTGAGE CORP. (7,22-3039688) P 1 0.0858 GREENSTONE FARM CREDIT SERVICE (7,38-1358859) P 1 0.0858 CARRINGTON MORTGAGE SERVICES (7,20-8745846) P 1 0.0858 PREFERRED CREDIT UNION (5,0000062340) P 1 0.0858 MEIJER CREDIT UNION (5,0000062393) P 1 0.0858 A A C CREDIT UNION (5,0000062217) P 1 0.0858 DOW CHEMICAL EMPLOYEES CREDIT (5,0000060137) P 1 0.0858 FIRST PREFERRED MORTGAGE CO. (7,7983500003) P 1 0.0858 TYNDALL FEDERAL CREDIT UNION (5,0000010754) P 1 0.0858 ADVENTURE CREDIT UNION (5,0000060936) P 1 0.0858 NATIONS DIRECT MORTGAGE, LLC (7,20-8544905) P 1 0.0858 NEW FREEDOM MORTGAGE CORP (7,7927200007) P 1 0.0858 LIBERTY HOME MORTGAGE CORP (7,46-3525878) S 1 0.0858 FIRST GENERAL CREDIT UNION (5,0000061455) P 1 0.0858 TOP FLITE FINANCIAL INC (7,13-4225190) P 1 0.0858 GENISYS CREDIT UNION (5,0000068536) P 1 0.0858 NEW DAY FINANCIAL, LLC (7,22-3887207) P 1 0.0858 SHELBY STATE BANK, THE (3,0000010157) P 1 0.0858 RESIDENTIAL ACCEPTANCE CORPORA (7,58-2442998) S 1 0.0858 MB FINANCIAL BANK, NATIONAL AS (9,0000656733) P 1 0.0858 UNITED FEDERAL CREDIT UNION (5,0000006288) P 1 0.0858 AMERICAN ADVISORS GROUP (7,20-1832276) P 1 0.0858 GUARANTY TRUST COMPANY (3,62-1259997) P 1 0.0858 MICHIGAN FIRST CREDIT UNION (5,0000060522) P 1 0.08
Number of Lenders = 94 Total 1,250 100.00
S = Subprime, M = Manufactured Home, P = Prime (based on an analysis of lender activity)Data used in this analysis are taken from the 2017 National HMDA-LAR published by the Federal Financial Institutions Examination Council.
Applications with invalid actions were ignored when calculating percentages.
This report may not be copied, sold or distributed without the express written permission of CLC Compliance Technologies,Inc.Copyright 2004 - 2014 CLC Compliance Technologies,Inc.(1-800-499-HMDA) Page 3 of 3

Lender Market ShareLendingPatterns 6/19/2019
Year: 2017
Lender(s): All Lenders
Geography: Muskegon_MuskegonHeights_NortonShores (Custom Area)
Loan Amount: Conforming,Jumbo
Tract Income: All
Tract % Minority: All
Hispanic Ethnicity: All Property Type: 1-4 Family
Preapproval Requested?: All HOEPA Loan?: All Lien Status: All
Spread Reported?: All
Action Loan Type Purpose Occupancy Investor Race Income Sex Originated All Purchase All All All All All
Rank Lender Type # %1 LAKE MICHIGAN CREDIT UNION (5,0000062514) P 186 18.812 MORTGAGE 1 INCORPORATION (7,7687600009) P 164 16.583 FIFTH THIRD MORTGAGE-MI, LLC (9,0003072606) P 77 7.794 HUNTINGTON NATIONAL BANK, THE (9,0000012311) P 57 5.765 VANDYK MORTGAGE CORPORATION (7,38-2749215) P 54 5.466 TOWNE MORTGAGE COMPANY (7,38-2434249) P 45 4.557 QUICKEN LOANS, INC. (7,7197000003) P 42 4.258 ENVOY MORTGAGE, LTD. (7,1635900004) P 29 2.939 PNC BANK, NATIONAL ASSOCIATION (9,0000817824) P 24 2.4310 AMERIFIRST FINANCIAL CORPORATI (7,38-2699549) P 23 2.3311 SUCCESS MORTGAGE PARTNERS, INC (7,01-0759540) P 19 1.9212 CHEMICAL BANK (9,0000542649) P 18 1.8212 BENCHMARK MORTGAGE (7,75-2838184) P 18 1.8214 COMMUNITY SHORES BANK (3,0000034944) P 14 1.4215 NORTHPOINTE BANK (3,0000034953) P 13 1.3116 INDEPENDENT BANK (2,0000636771) P 12 1.2117 MMS MORTGAGE SERVICES, LTD. (7,7548100004) P 11 1.1117 MORTGAGE RESEARCH CENTER (7,43-1965151) P 11 1.1117 NORTHERN MORTGAGE SERVICES, IN (7,38-3305907) P 11 1.1120 SHORE MORTGAGE (7,38-2750395) P 10 1.0120 USAA FEDERAL SAVINGS BANK (9,0000619877) P 10 1.0122 JPMORGAN CHASE BANK, NATIONAL (9,0000852218) P 9 0.9123 BEST FINANCIAL CREDIT UNION (5,0000062027) P 8 0.8124 INLANTA MORTGAGE (7,39-1767726) P 6 0.6124 WELLS FARGO BANK, NATIONAL ASS (9,0000451965) P 6 0.6124 MERCANTILE BANK OF MICHIGAN (3,0000034598) P 6 0.6127 FINANCE OF AMERICA MORTGAGE LL (7,23-2769131) P 5 0.5127 AMERICAN FINANCIAL RESOURCES (7,22-3554558) P 5 0.5127 FLAGSTAR BANK, FSB (9,0000146672) P 5 0.5130 CHURCHILL MORTGAGE CORP (7,62-1494087) P 4 0.4030 MACATAWA BANK (3,0000034618) P 4 0.4030 MEMBER FIRST MORTGAGE, LLC (7,38-3616059) P 4 0.4030 GUARANTEED RATE INC. (7,36-4327855) P 4 0.40
S = Subprime, M = Manufactured Home, P = Prime (based on an analysis of lender activity)Data used in this analysis are taken from the 2017 National HMDA-LAR published by the Federal Financial Institutions Examination Council.
Applications with invalid actions were ignored when calculating percentages.
This report may not be copied, sold or distributed without the express written permission of CLC Compliance Technologies,Inc.Copyright 2004 - 2014 CLC Compliance Technologies,Inc.(1-800-499-HMDA) Page 1 of 3
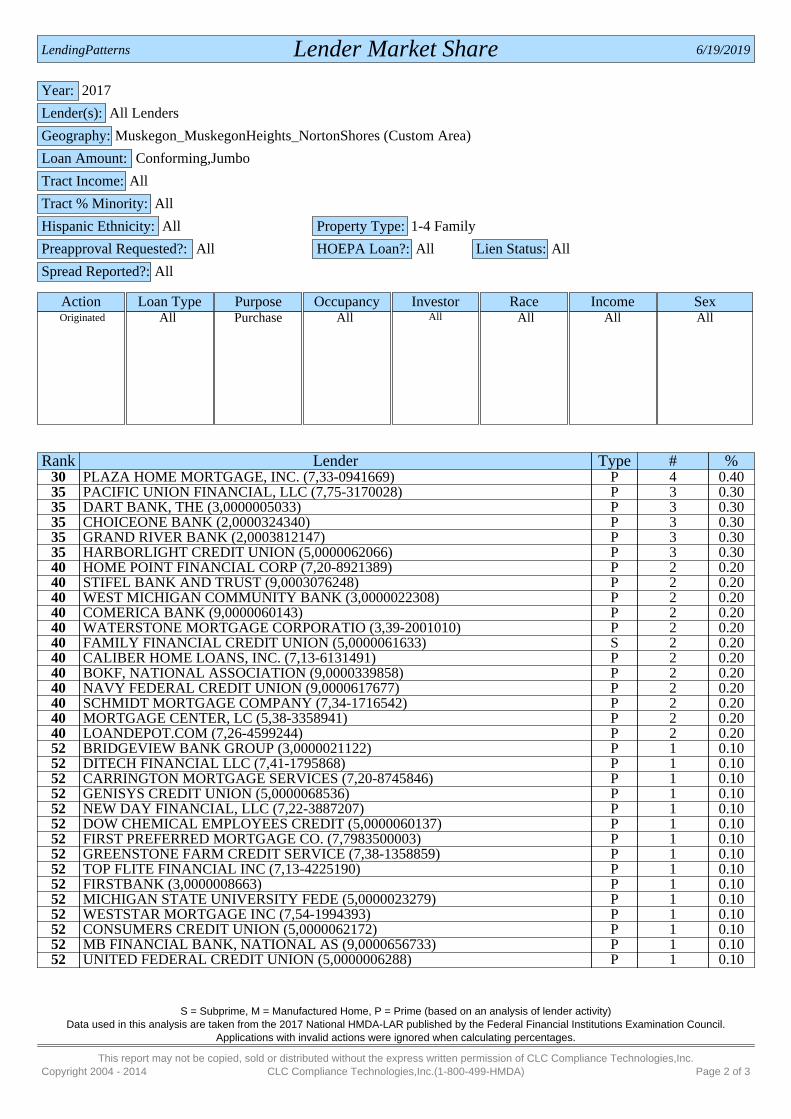
Lender Market ShareLendingPatterns 6/19/2019
Year: 2017
Lender(s): All Lenders
Geography: Muskegon_MuskegonHeights_NortonShores (Custom Area)
Loan Amount: Conforming,Jumbo
Tract Income: All
Tract % Minority: All
Hispanic Ethnicity: All Property Type: 1-4 Family
Preapproval Requested?: All HOEPA Loan?: All Lien Status: All
Spread Reported?: All
Action Loan Type Purpose Occupancy Investor Race Income Sex Originated All Purchase All All All All All
Rank Lender Type # %30 PLAZA HOME MORTGAGE, INC. (7,33-0941669) P 4 0.4035 PACIFIC UNION FINANCIAL, LLC (7,75-3170028) P 3 0.3035 DART BANK, THE (3,0000005033) P 3 0.3035 CHOICEONE BANK (2,0000324340) P 3 0.3035 GRAND RIVER BANK (2,0003812147) P 3 0.3035 HARBORLIGHT CREDIT UNION (5,0000062066) P 3 0.3040 HOME POINT FINANCIAL CORP (7,20-8921389) P 2 0.2040 STIFEL BANK AND TRUST (9,0003076248) P 2 0.2040 WEST MICHIGAN COMMUNITY BANK (3,0000022308) P 2 0.2040 COMERICA BANK (9,0000060143) P 2 0.2040 WATERSTONE MORTGAGE CORPORATIO (3,39-2001010) P 2 0.2040 FAMILY FINANCIAL CREDIT UNION (5,0000061633) S 2 0.2040 CALIBER HOME LOANS, INC. (7,13-6131491) P 2 0.2040 BOKF, NATIONAL ASSOCIATION (9,0000339858) P 2 0.2040 NAVY FEDERAL CREDIT UNION (9,0000617677) P 2 0.2040 SCHMIDT MORTGAGE COMPANY (7,34-1716542) P 2 0.2040 MORTGAGE CENTER, LC (5,38-3358941) P 2 0.2040 LOANDEPOT.COM (7,26-4599244) P 2 0.2052 BRIDGEVIEW BANK GROUP (3,0000021122) P 1 0.1052 DITECH FINANCIAL LLC (7,41-1795868) P 1 0.1052 CARRINGTON MORTGAGE SERVICES (7,20-8745846) P 1 0.1052 GENISYS CREDIT UNION (5,0000068536) P 1 0.1052 NEW DAY FINANCIAL, LLC (7,22-3887207) P 1 0.1052 DOW CHEMICAL EMPLOYEES CREDIT (5,0000060137) P 1 0.1052 FIRST PREFERRED MORTGAGE CO. (7,7983500003) P 1 0.1052 GREENSTONE FARM CREDIT SERVICE (7,38-1358859) P 1 0.1052 TOP FLITE FINANCIAL INC (7,13-4225190) P 1 0.1052 FIRSTBANK (3,0000008663) P 1 0.1052 MICHIGAN STATE UNIVERSITY FEDE (5,0000023279) P 1 0.1052 WESTSTAR MORTGAGE INC (7,54-1994393) P 1 0.1052 CONSUMERS CREDIT UNION (5,0000062172) P 1 0.1052 MB FINANCIAL BANK, NATIONAL AS (9,0000656733) P 1 0.1052 UNITED FEDERAL CREDIT UNION (5,0000006288) P 1 0.10
S = Subprime, M = Manufactured Home, P = Prime (based on an analysis of lender activity)Data used in this analysis are taken from the 2017 National HMDA-LAR published by the Federal Financial Institutions Examination Council.
Applications with invalid actions were ignored when calculating percentages.
This report may not be copied, sold or distributed without the express written permission of CLC Compliance Technologies,Inc.Copyright 2004 - 2014 CLC Compliance Technologies,Inc.(1-800-499-HMDA) Page 2 of 3
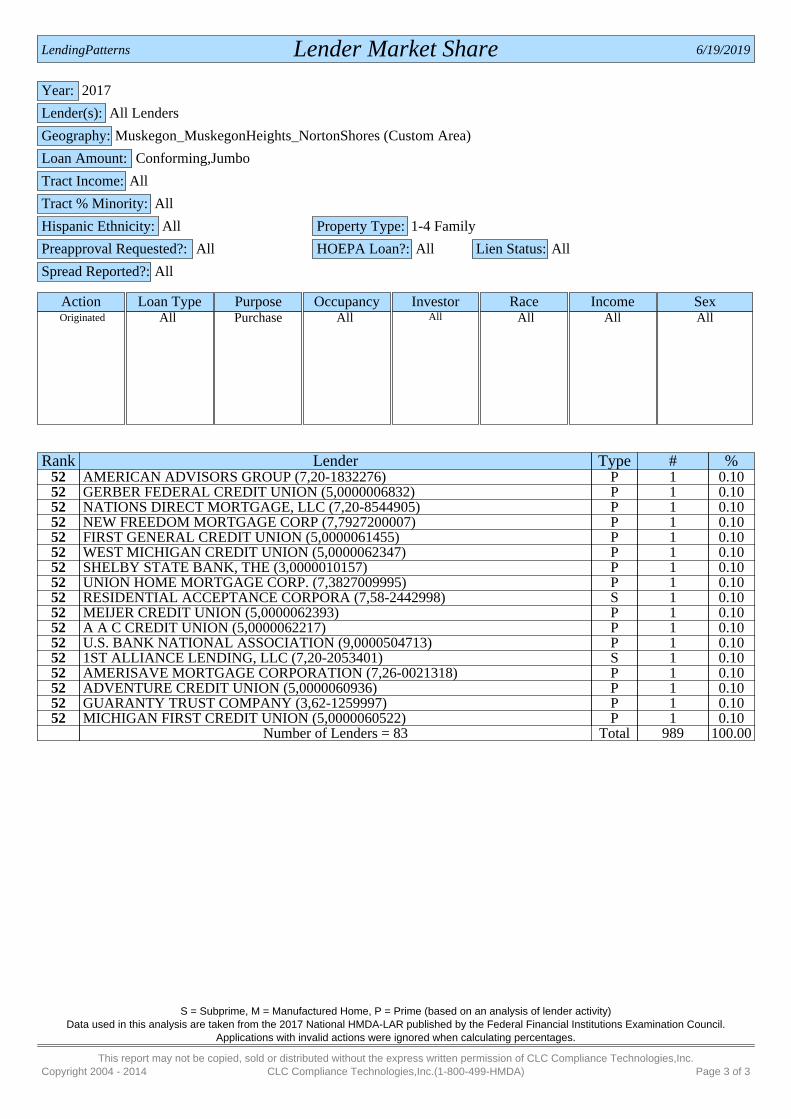
Lender Market ShareLendingPatterns 6/19/2019
Year: 2017
Lender(s): All Lenders
Geography: Muskegon_MuskegonHeights_NortonShores (Custom Area)
Loan Amount: Conforming,Jumbo
Tract Income: All
Tract % Minority: All
Hispanic Ethnicity: All Property Type: 1-4 Family
Preapproval Requested?: All HOEPA Loan?: All Lien Status: All
Spread Reported?: All
Action Loan Type Purpose Occupancy Investor Race Income Sex Originated All Purchase All All All All All
Rank Lender Type # %52 AMERICAN ADVISORS GROUP (7,20-1832276) P 1 0.1052 GERBER FEDERAL CREDIT UNION (5,0000006832) P 1 0.1052 NATIONS DIRECT MORTGAGE, LLC (7,20-8544905) P 1 0.1052 NEW FREEDOM MORTGAGE CORP (7,7927200007) P 1 0.1052 FIRST GENERAL CREDIT UNION (5,0000061455) P 1 0.1052 WEST MICHIGAN CREDIT UNION (5,0000062347) P 1 0.1052 SHELBY STATE BANK, THE (3,0000010157) P 1 0.1052 UNION HOME MORTGAGE CORP. (7,3827009995) P 1 0.1052 RESIDENTIAL ACCEPTANCE CORPORA (7,58-2442998) S 1 0.1052 MEIJER CREDIT UNION (5,0000062393) P 1 0.1052 A A C CREDIT UNION (5,0000062217) P 1 0.1052 U.S. BANK NATIONAL ASSOCIATION (9,0000504713) P 1 0.1052 1ST ALLIANCE LENDING, LLC (7,20-2053401) S 1 0.1052 AMERISAVE MORTGAGE CORPORATION (7,26-0021318) P 1 0.1052 ADVENTURE CREDIT UNION (5,0000060936) P 1 0.1052 GUARANTY TRUST COMPANY (3,62-1259997) P 1 0.1052 MICHIGAN FIRST CREDIT UNION (5,0000060522) P 1 0.10
Number of Lenders = 83 Total 989 100.00
S = Subprime, M = Manufactured Home, P = Prime (based on an analysis of lender activity)Data used in this analysis are taken from the 2017 National HMDA-LAR published by the Federal Financial Institutions Examination Council.
Applications with invalid actions were ignored when calculating percentages.
This report may not be copied, sold or distributed without the express written permission of CLC Compliance Technologies,Inc.Copyright 2004 - 2014 CLC Compliance Technologies,Inc.(1-800-499-HMDA) Page 3 of 3
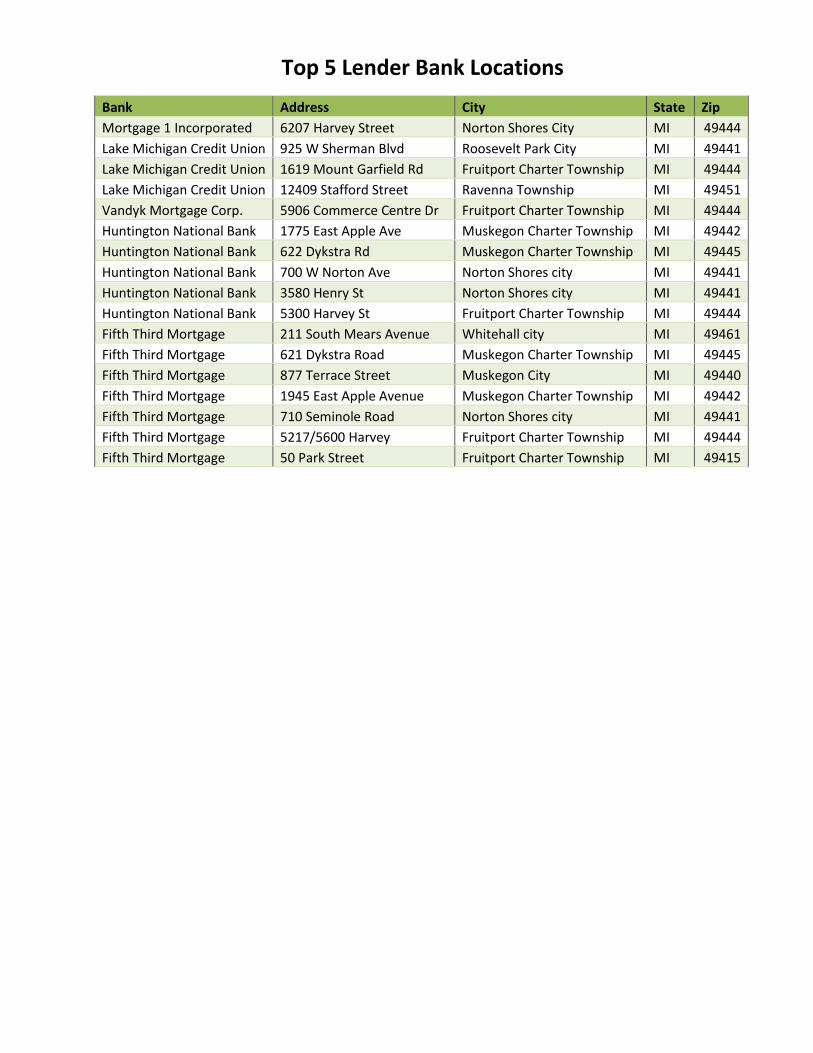
Bank Address City State Zip Mortgage 1 Incorporated 6207 Harvey Street Norton Shores City MI 49444 Lake Michigan Credit Union 925 W Sherman Blvd Roosevelt Park City MI 49441 Lake Michigan Credit Union 1619 Mount Garfield Rd Fruitport Charter Township MI 49444 Lake Michigan Credit Union 12409 Stafford Street Ravenna Township MI 49451 Vandyk Mortgage Corp. 5906 Commerce Centre Dr Fruitport Charter Township MI 49444 Huntington National Bank 1775 East Apple Ave Muskegon Charter Township MI 49442 Huntington National Bank 622 Dykstra Rd Muskegon Charter Township MI 49445 Huntington National Bank 700 W Norton Ave Norton Shores city MI 49441 Huntington National Bank 3580 Henry St Norton Shores city MI 49441 Huntington National Bank 5300 Harvey St Fruitport Charter Township MI 49444 Fifth Third Mortgage 211 South Mears Avenue Whitehall city MI 49461 Fifth Third Mortgage 621 Dykstra Road Muskegon Charter Township MI 49445 Fifth Third Mortgage 877 Terrace Street Muskegon City MI 49440 Fifth Third Mortgage 1945 East Apple Avenue Muskegon Charter Township MI 49442 Fifth Third Mortgage 710 Seminole Road Norton Shores city MI 49441 Fifth Third Mortgage 5217/5600 Harvey Fruitport Charter Township MI 49444 Fifth Third Mortgage 50 Park Street Fruitport Charter Township MI 49415
Top 5 Lender Bank Locations
HMDA Data Analysis for the Cities of Muskegon, Muskegon Heights, and Norton Shores July 2019
Appendix D
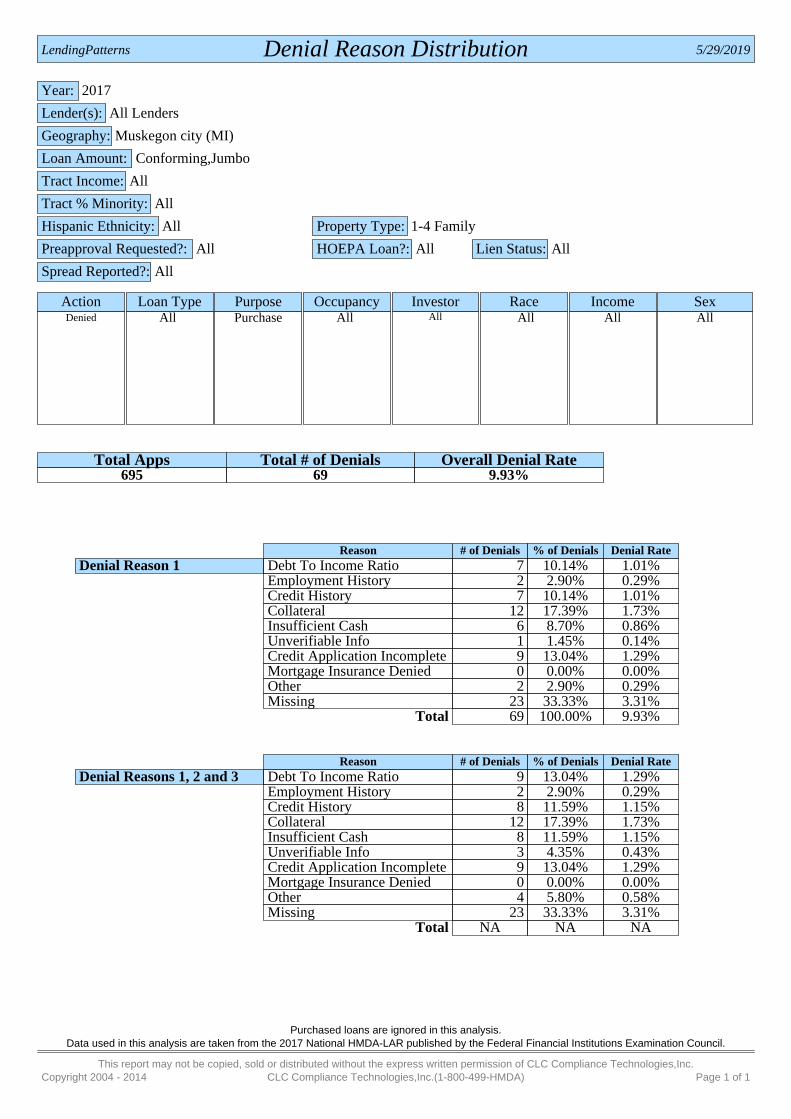
Denial Reason DistributionLendingPatterns 5/29/2019
Year: 2017
Lender(s): All Lenders
Geography: Muskegon city (MI)
Loan Amount: Conforming,Jumbo
Tract Income: All
Tract % Minority: All
Hispanic Ethnicity: All Property Type: 1-4 Family
Preapproval Requested?: All HOEPA Loan?: All Lien Status: All
Spread Reported?: All
Action Loan Type Purpose Occupancy Investor Race Income SexDenied All Purchase All All All All All
Total Apps Total # of Denials Overall Denial Rate695 69 9.93%
Reason # of Denials % of Denials Denial RateDenial Reason 1 Debt To Income Ratio 7 10.14% 1.01%
Employment History 2 2.90% 0.29%Credit History 7 10.14% 1.01%Collateral 12 17.39% 1.73%Insufficient Cash 6 8.70% 0.86%Unverifiable Info 1 1.45% 0.14%Credit Application Incomplete 9 13.04% 1.29%Mortgage Insurance Denied 0 0.00% 0.00%Other 2 2.90% 0.29%Missing 23 33.33% 3.31%
Total 69 100.00% 9.93%
Reason # of Denials % of Denials Denial RateDenial Reasons 1, 2 and 3 Debt To Income Ratio 9 13.04% 1.29%
Employment History 2 2.90% 0.29%Credit History 8 11.59% 1.15%Collateral 12 17.39% 1.73%Insufficient Cash 8 11.59% 1.15%Unverifiable Info 3 4.35% 0.43%Credit Application Incomplete 9 13.04% 1.29%Mortgage Insurance Denied 0 0.00% 0.00%Other 4 5.80% 0.58%Missing 23 33.33% 3.31%
Total NA NA NA
Purchased loans are ignored in this analysis.Data used in this analysis are taken from the 2017 National HMDA-LAR published by the Federal Financial Institutions Examination Council.
This report may not be copied, sold or distributed without the express written permission of CLC Compliance Technologies,Inc.Copyright 2004 - 2014 CLC Compliance Technologies,Inc.(1-800-499-HMDA) Page 1 of 1
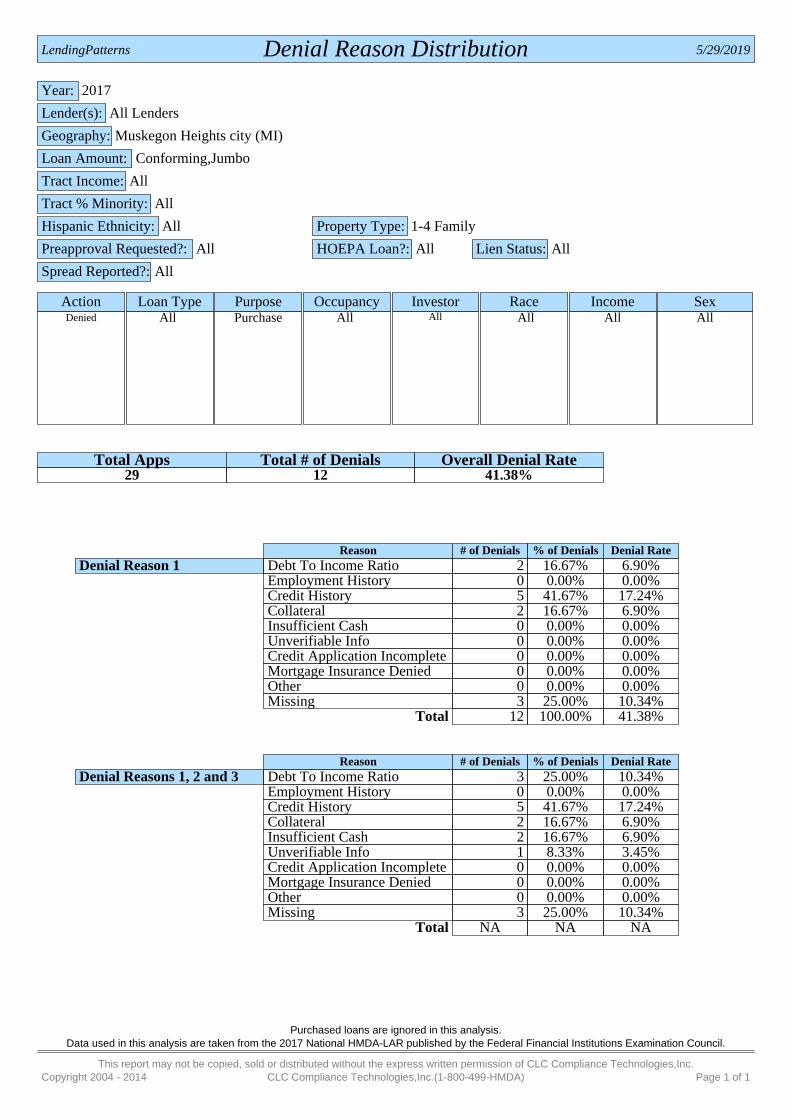
Denial Reason DistributionLendingPatterns 5/29/2019
Year: 2017
Lender(s): All Lenders
Geography: Muskegon Heights city (MI)
Loan Amount: Conforming,Jumbo
Tract Income: All
Tract % Minority: All
Hispanic Ethnicity: All Property Type: 1-4 Family
Preapproval Requested?: All HOEPA Loan?: All Lien Status: All
Spread Reported?: All
Action Loan Type Purpose Occupancy Investor Race Income SexDenied All Purchase All All All All All
Total Apps Total # of Denials Overall Denial Rate29 12 41.38%
Reason # of Denials % of Denials Denial RateDenial Reason 1 Debt To Income Ratio 2 16.67% 6.90%
Employment History 0 0.00% 0.00%Credit History 5 41.67% 17.24%Collateral 2 16.67% 6.90%Insufficient Cash 0 0.00% 0.00%Unverifiable Info 0 0.00% 0.00%Credit Application Incomplete 0 0.00% 0.00%Mortgage Insurance Denied 0 0.00% 0.00%Other 0 0.00% 0.00%Missing 3 25.00% 10.34%
Total 12 100.00% 41.38%
Reason # of Denials % of Denials Denial RateDenial Reasons 1, 2 and 3 Debt To Income Ratio 3 25.00% 10.34%
Employment History 0 0.00% 0.00%Credit History 5 41.67% 17.24%Collateral 2 16.67% 6.90%Insufficient Cash 2 16.67% 6.90%Unverifiable Info 1 8.33% 3.45%Credit Application Incomplete 0 0.00% 0.00%Mortgage Insurance Denied 0 0.00% 0.00%Other 0 0.00% 0.00%Missing 3 25.00% 10.34%
Total NA NA NA
Purchased loans are ignored in this analysis.Data used in this analysis are taken from the 2017 National HMDA-LAR published by the Federal Financial Institutions Examination Council.
This report may not be copied, sold or distributed without the express written permission of CLC Compliance Technologies,Inc.Copyright 2004 - 2014 CLC Compliance Technologies,Inc.(1-800-499-HMDA) Page 1 of 1

Denial Reason DistributionLendingPatterns 5/29/2019
Year: 2017
Lender(s): All Lenders
Geography: Norton Shores city (MI)
Loan Amount: Conforming,Jumbo
Tract Income: All
Tract % Minority: All
Hispanic Ethnicity: All Property Type: 1-4 Family
Preapproval Requested?: All HOEPA Loan?: All Lien Status: All
Spread Reported?: All
Action Loan Type Purpose Occupancy Investor Race Income SexDenied All Purchase All All All All All
Total Apps Total # of Denials Overall Denial Rate549 35 6.38%
Reason # of Denials % of Denials Denial RateDenial Reason 1 Debt To Income Ratio 7 20.00% 1.28%
Employment History 2 5.71% 0.36%Credit History 7 20.00% 1.28%Collateral 7 20.00% 1.28%Insufficient Cash 2 5.71% 0.36%Unverifiable Info 0 0.00% 0.00%Credit Application Incomplete 1 2.86% 0.18%Mortgage Insurance Denied 0 0.00% 0.00%Other 2 5.71% 0.36%Missing 7 20.00% 1.28%
Total 35 100.00% 6.38%
Reason # of Denials % of Denials Denial RateDenial Reasons 1, 2 and 3 Debt To Income Ratio 7 20.00% 1.28%
Employment History 3 8.57% 0.55%Credit History 8 22.86% 1.46%Collateral 9 25.71% 1.64%Insufficient Cash 5 14.29% 0.91%Unverifiable Info 1 2.86% 0.18%Credit Application Incomplete 1 2.86% 0.18%Mortgage Insurance Denied 0 0.00% 0.00%Other 3 8.57% 0.55%Missing 7 20.00% 1.28%
Total NA NA NA
Purchased loans are ignored in this analysis.Data used in this analysis are taken from the 2017 National HMDA-LAR published by the Federal Financial Institutions Examination Council.
This report may not be copied, sold or distributed without the express written permission of CLC Compliance Technologies,Inc.Copyright 2004 - 2014 CLC Compliance Technologies,Inc.(1-800-499-HMDA) Page 1 of 1
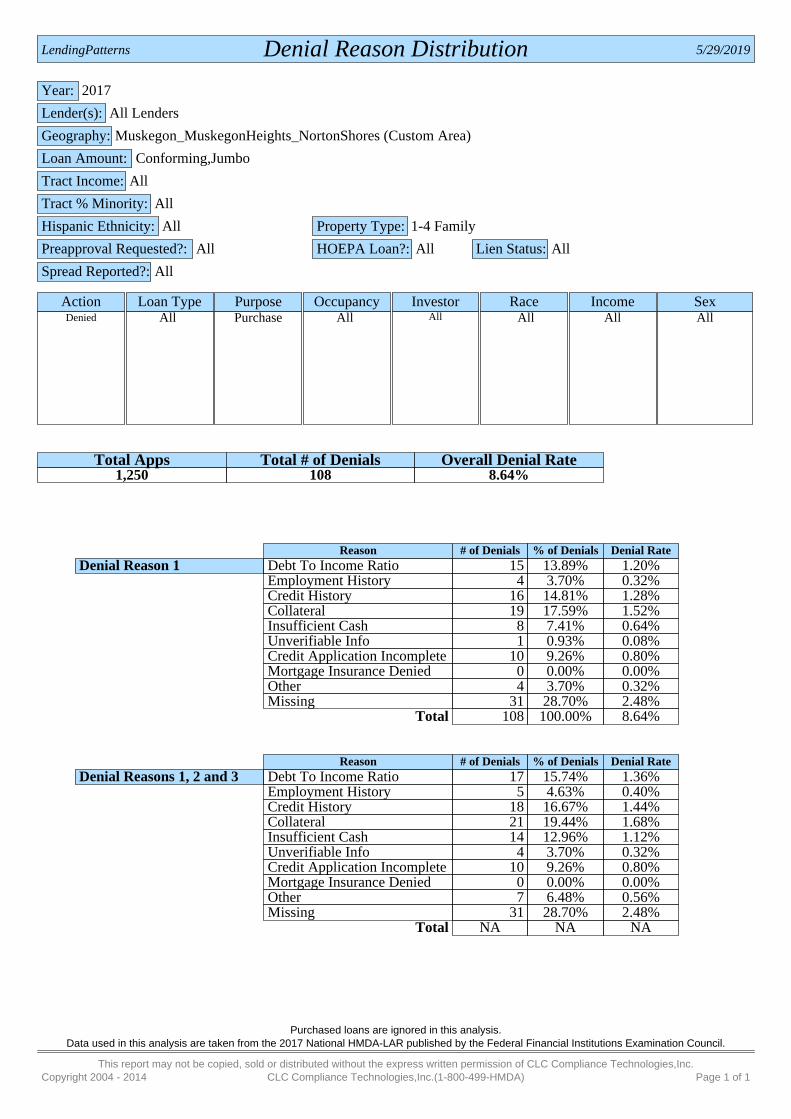
Denial Reason DistributionLendingPatterns 5/29/2019
Year: 2017
Lender(s): All Lenders
Geography: Muskegon_MuskegonHeights_NortonShores (Custom Area)
Loan Amount: Conforming,Jumbo
Tract Income: All
Tract % Minority: All
Hispanic Ethnicity: All Property Type: 1-4 Family
Preapproval Requested?: All HOEPA Loan?: All Lien Status: All
Spread Reported?: All
Action Loan Type Purpose Occupancy Investor Race Income SexDenied All Purchase All All All All All
Total Apps Total # of Denials Overall Denial Rate1,250 108 8.64%
Reason # of Denials % of Denials Denial RateDenial Reason 1 Debt To Income Ratio 15 13.89% 1.20%
Employment History 4 3.70% 0.32%Credit History 16 14.81% 1.28%Collateral 19 17.59% 1.52%Insufficient Cash 8 7.41% 0.64%Unverifiable Info 1 0.93% 0.08%Credit Application Incomplete 10 9.26% 0.80%Mortgage Insurance Denied 0 0.00% 0.00%Other 4 3.70% 0.32%Missing 31 28.70% 2.48%
Total 108 100.00% 8.64%
Reason # of Denials % of Denials Denial RateDenial Reasons 1, 2 and 3 Debt To Income Ratio 17 15.74% 1.36%
Employment History 5 4.63% 0.40%Credit History 18 16.67% 1.44%Collateral 21 19.44% 1.68%Insufficient Cash 14 12.96% 1.12%Unverifiable Info 4 3.70% 0.32%Credit Application Incomplete 10 9.26% 0.80%Mortgage Insurance Denied 0 0.00% 0.00%Other 7 6.48% 0.56%Missing 31 28.70% 2.48%
Total NA NA NA
Purchased loans are ignored in this analysis.Data used in this analysis are taken from the 2017 National HMDA-LAR published by the Federal Financial Institutions Examination Council.
This report may not be copied, sold or distributed without the express written permission of CLC Compliance Technologies,Inc.Copyright 2004 - 2014 CLC Compliance Technologies,Inc.(1-800-499-HMDA) Page 1 of 1
HMDA Data Analysis for the Cities of Muskegon, Muskegon Heights, and Norton Shores July 2019
Appendix E

FFIEC Redlining Risk Factor R2 (Approval & Denial) AnalysisLendingPatterns 5/31/2019
Year: 2017
Lender(s): All Lenders
Geography: Muskegon city (MI)
Loan Amount: Conforming,Jumbo
Hispanic Ethnicity: All Property Type: 1-4 Family Preapproval Requested?: All
HOEPA Loan?: All Lien Status: All Spread Reported?: All
Action Loan Type Purpose Occupancy Investor Race Income SexAll All Purchase All All All All All
Tract Majority Approval Difference** StatisticallyRace* # Tracts Apps Approvals Rate (vs White) z-statistic p-value Significant?***
White 7 516 416 80.62% -- -- -- --Black 3 25 16 64.00% -16.62 -2.0234 0.0430 YesHispanic 0 0 0 NA NA NA NA NAAsian 0 0 0 NA NA NA NA NANative American 0 0 0 NA NA NA NA NAHawaiian 0 0 0 NA NA NA NA NAOther 0 0 0 NA NA NA NA NAMultiRace 0 0 0 NA NA NA NA NANo Majority 4 154 99 64.29% -- -- -- --
Total 14 695 531 76.40% -- -- -- --Majority Minority Tracts 7 179 115 64.25% -16.37 -4.4457 0.0000 YesMajority Black/Hisp. Tracts 4 78 52 66.67% -13.95 -2.8096 0.0050 Yes
Yellow shading identifies a row where the approval rate is lower than the approval rate in majority White tracts, and the difference is statistically significant.Data are from the 2017 HMDA-LAR published by the FFIEC.
Applications without a census tract are excluded from the report.*Majority Race Tracts are those where one race comprises >50% of the population. Majority Black/Hisp. tracts are those where >50% of population is either Black or Hispanic.
**Difference between the approval rate in majority White tracts and the approval rate in tracts that are not majority White (e.g. Majority Black, Majority Hispanic, Majority Minority etc.)***Confidence level is 95%.
This report may not be copied, sold or distributed without the express written permission of CLC Compliance Technologies,Inc.Copyright 2004 - 2015 CLC Compliance Technologies,Inc.(1-800-499-HMDA) Page 1 of 2

FFIEC Redlining Risk Factor R2 (Approval & Denial) AnalysisLendingPatterns 5/31/2019
Year: 2017
Lender(s): All Lenders
Geography: Muskegon city (MI)
Loan Amount: Conforming,Jumbo
Hispanic Ethnicity: All Property Type: 1-4 Family Preapproval Requested?: All
HOEPA Loan?: All Lien Status: All Spread Reported?: All
Action Loan Type Purpose Occupancy Investor Race Income SexAll All Purchase All All All All All
Tract Majority Denial Difference** StatisticallyRace* # Tracts Apps Denials Rate (vs White) z-statistic p-value Significant?***
White 7 516 41 7.95% -- -- -- --Black 3 25 3 12.00% 4.05 0.7243 0.4689 NoHispanic 0 0 0 NA NA NA NA NAAsian 0 0 0 NA NA NA NA NANative American 0 0 0 NA NA NA NA NAHawaiian 0 0 0 NA NA NA NA NAOther 0 0 0 NA NA NA NA NAMultiRace 0 0 0 NA NA NA NA NANo Majority 4 154 25 16.23% -- -- -- --
Total 14 695 69 9.93% -- -- -- --Majority Minority Tracts 7 179 28 15.64% 7.70 2.9671 0.0030 YesMajority Black/Hisp. Tracts 4 78 9 11.54% 3.59 1.0651 0.2868 No
Yellow shading identifies a row where the denial rate is higher than the denial rate in majority White tracts, and the difference is statistically significant.Data are from the 2017 HMDA-LAR published by the FFIEC.
Applications without a census tract are excluded from the report.*Majority Race Tracts are those where one race comprises >50% of the population. Majority Black/Hisp. tracts are those where >50% of population is either Black or Hispanic.
**Difference between the denial rate in majority White tracts and the denial rate in tracts that are not majority White (e.g. Majority Black, Majority Hispanic, Majority Minority etc.)***Confidence level is 95%.
This report may not be copied, sold or distributed without the express written permission of CLC Compliance Technologies,Inc.Copyright 2004 - 2015 CLC Compliance Technologies,Inc.(1-800-499-HMDA) Page 2 of 2

FFIEC Redlining Risk Factor R2 (Approval & Denial) AnalysisLendingPatterns 5/31/2019
Year: 2017
Lender(s): All Lenders
Geography: Muskegon Heights city (MI)
Loan Amount: Conforming,Jumbo
Hispanic Ethnicity: All Property Type: 1-4 Family Preapproval Requested?: All
HOEPA Loan?: All Lien Status: All Spread Reported?: All
Action Loan Type Purpose Occupancy Investor Race Income SexAll All Purchase All All All All All
Tract Majority Approval Difference** StatisticallyRace* # Tracts Apps Approvals Rate (vs White) z-statistic p-value Significant?***
White 0 0 0 NA -- -- -- --Black 4 29 13 NA NA NA NA NAHispanic 0 0 0 NA NA NA NA NAAsian 0 0 0 NA NA NA NA NANative American 0 0 0 NA NA NA NA NAHawaiian 0 0 0 NA NA NA NA NAOther 0 0 0 NA NA NA NA NAMultiRace 0 0 0 NA NA NA NA NANo Majority 0 0 0 NA -- -- -- --
Total 4 29 13 44.83% -- -- -- --Majority Minority Tracts 4 29 13 NA NA NA NA NAMajority Black/Hisp. Tracts 4 29 13 NA NA NA NA NA
Yellow shading identifies a row where the approval rate is lower than the approval rate in majority White tracts, and the difference is statistically significant.Data are from the 2017 HMDA-LAR published by the FFIEC.
Applications without a census tract are excluded from the report.*Majority Race Tracts are those where one race comprises >50% of the population. Majority Black/Hisp. tracts are those where >50% of population is either Black or Hispanic.
**Difference between the approval rate in majority White tracts and the approval rate in tracts that are not majority White (e.g. Majority Black, Majority Hispanic, Majority Minority etc.)***Confidence level is 95%.
This report may not be copied, sold or distributed without the express written permission of CLC Compliance Technologies,Inc.Copyright 2004 - 2015 CLC Compliance Technologies,Inc.(1-800-499-HMDA) Page 1 of 2
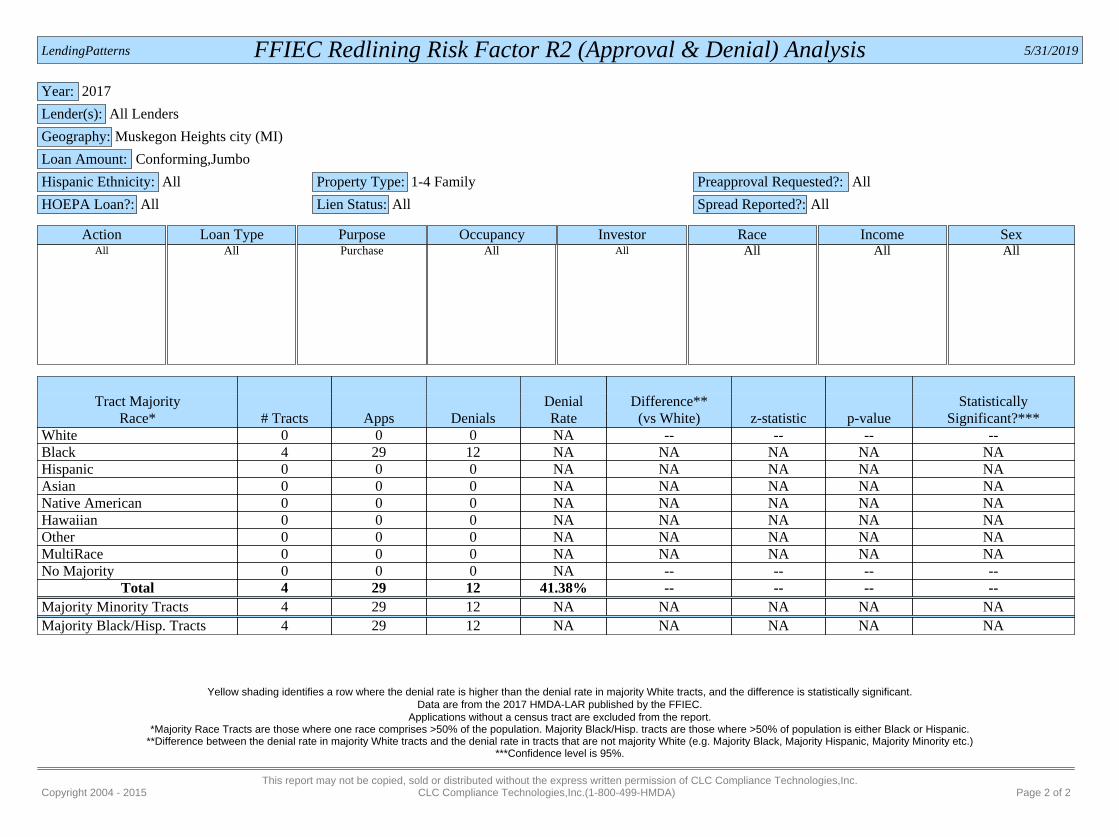
FFIEC Redlining Risk Factor R2 (Approval & Denial) AnalysisLendingPatterns 5/31/2019
Year: 2017
Lender(s): All Lenders
Geography: Muskegon Heights city (MI)
Loan Amount: Conforming,Jumbo
Hispanic Ethnicity: All Property Type: 1-4 Family Preapproval Requested?: All
HOEPA Loan?: All Lien Status: All Spread Reported?: All
Action Loan Type Purpose Occupancy Investor Race Income SexAll All Purchase All All All All All
Tract Majority Denial Difference** StatisticallyRace* # Tracts Apps Denials Rate (vs White) z-statistic p-value Significant?***
White 0 0 0 NA -- -- -- --Black 4 29 12 NA NA NA NA NAHispanic 0 0 0 NA NA NA NA NAAsian 0 0 0 NA NA NA NA NANative American 0 0 0 NA NA NA NA NAHawaiian 0 0 0 NA NA NA NA NAOther 0 0 0 NA NA NA NA NAMultiRace 0 0 0 NA NA NA NA NANo Majority 0 0 0 NA -- -- -- --
Total 4 29 12 41.38% -- -- -- --Majority Minority Tracts 4 29 12 NA NA NA NA NAMajority Black/Hisp. Tracts 4 29 12 NA NA NA NA NA
Yellow shading identifies a row where the denial rate is higher than the denial rate in majority White tracts, and the difference is statistically significant.Data are from the 2017 HMDA-LAR published by the FFIEC.
Applications without a census tract are excluded from the report.*Majority Race Tracts are those where one race comprises >50% of the population. Majority Black/Hisp. tracts are those where >50% of population is either Black or Hispanic.
**Difference between the denial rate in majority White tracts and the denial rate in tracts that are not majority White (e.g. Majority Black, Majority Hispanic, Majority Minority etc.)***Confidence level is 95%.
This report may not be copied, sold or distributed without the express written permission of CLC Compliance Technologies,Inc.Copyright 2004 - 2015 CLC Compliance Technologies,Inc.(1-800-499-HMDA) Page 2 of 2

FFIEC Redlining Risk Factor R2 (Approval & Denial) AnalysisLendingPatterns 5/31/2019
Year: 2017
Lender(s): All Lenders
Geography: Norton Shores city (MI)
Loan Amount: Conforming,Jumbo
Hispanic Ethnicity: All Property Type: 1-4 Family Preapproval Requested?: All
HOEPA Loan?: All Lien Status: All Spread Reported?: All
Action Loan Type Purpose Occupancy Investor Race Income SexAll All Purchase All All All All All
Tract Majority Approval Difference** StatisticallyRace* # Tracts Apps Approvals Rate (vs White) z-statistic p-value Significant?***
White 5 533 448 84.05% -- -- -- --Black 1 16 8 50.00% -34.05 -3.5780 0.0003 YesHispanic 0 0 0 NA NA NA NA NAAsian 0 0 0 NA NA NA NA NANative American 0 0 0 NA NA NA NA NAHawaiian 0 0 0 NA NA NA NA NAOther 0 0 0 NA NA NA NA NAMultiRace 0 0 0 NA NA NA NA NANo Majority 0 0 0 NA -- -- -- --
Total 6 549 456 83.06% -- -- -- --Majority Minority Tracts 1 16 8 50.00% -34.05 -3.5780 0.0003 YesMajority Black/Hisp. Tracts 1 16 8 50.00% -34.05 -3.5780 0.0003 Yes
Yellow shading identifies a row where the approval rate is lower than the approval rate in majority White tracts, and the difference is statistically significant.Data are from the 2017 HMDA-LAR published by the FFIEC.
Applications without a census tract are excluded from the report.*Majority Race Tracts are those where one race comprises >50% of the population. Majority Black/Hisp. tracts are those where >50% of population is either Black or Hispanic.
**Difference between the approval rate in majority White tracts and the approval rate in tracts that are not majority White (e.g. Majority Black, Majority Hispanic, Majority Minority etc.)***Confidence level is 95%.
This report may not be copied, sold or distributed without the express written permission of CLC Compliance Technologies,Inc.Copyright 2004 - 2015 CLC Compliance Technologies,Inc.(1-800-499-HMDA) Page 1 of 2
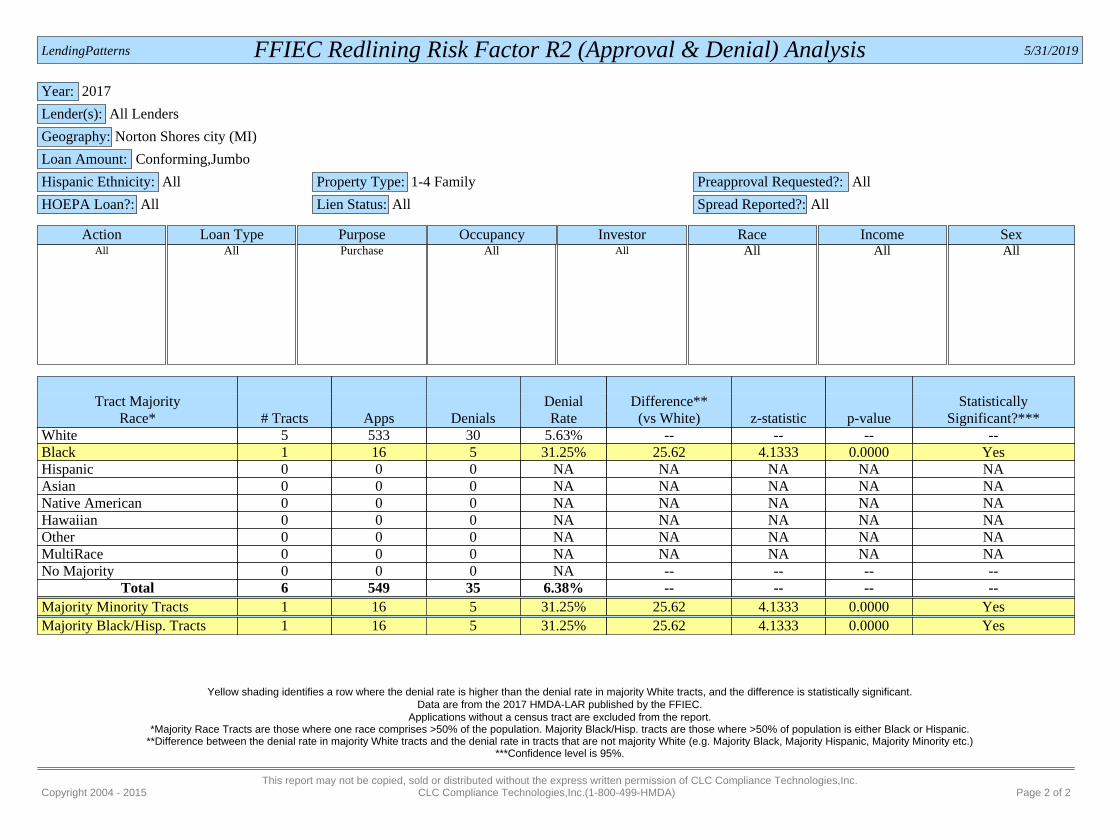
FFIEC Redlining Risk Factor R2 (Approval & Denial) AnalysisLendingPatterns 5/31/2019
Year: 2017
Lender(s): All Lenders
Geography: Norton Shores city (MI)
Loan Amount: Conforming,Jumbo
Hispanic Ethnicity: All Property Type: 1-4 Family Preapproval Requested?: All
HOEPA Loan?: All Lien Status: All Spread Reported?: All
Action Loan Type Purpose Occupancy Investor Race Income SexAll All Purchase All All All All All
Tract Majority Denial Difference** StatisticallyRace* # Tracts Apps Denials Rate (vs White) z-statistic p-value Significant?***
White 5 533 30 5.63% -- -- -- --Black 1 16 5 31.25% 25.62 4.1333 0.0000 YesHispanic 0 0 0 NA NA NA NA NAAsian 0 0 0 NA NA NA NA NANative American 0 0 0 NA NA NA NA NAHawaiian 0 0 0 NA NA NA NA NAOther 0 0 0 NA NA NA NA NAMultiRace 0 0 0 NA NA NA NA NANo Majority 0 0 0 NA -- -- -- --
Total 6 549 35 6.38% -- -- -- --Majority Minority Tracts 1 16 5 31.25% 25.62 4.1333 0.0000 YesMajority Black/Hisp. Tracts 1 16 5 31.25% 25.62 4.1333 0.0000 Yes
Yellow shading identifies a row where the denial rate is higher than the denial rate in majority White tracts, and the difference is statistically significant.Data are from the 2017 HMDA-LAR published by the FFIEC.
Applications without a census tract are excluded from the report.*Majority Race Tracts are those where one race comprises >50% of the population. Majority Black/Hisp. tracts are those where >50% of population is either Black or Hispanic.
**Difference between the denial rate in majority White tracts and the denial rate in tracts that are not majority White (e.g. Majority Black, Majority Hispanic, Majority Minority etc.)***Confidence level is 95%.
This report may not be copied, sold or distributed without the express written permission of CLC Compliance Technologies,Inc.Copyright 2004 - 2015 CLC Compliance Technologies,Inc.(1-800-499-HMDA) Page 2 of 2
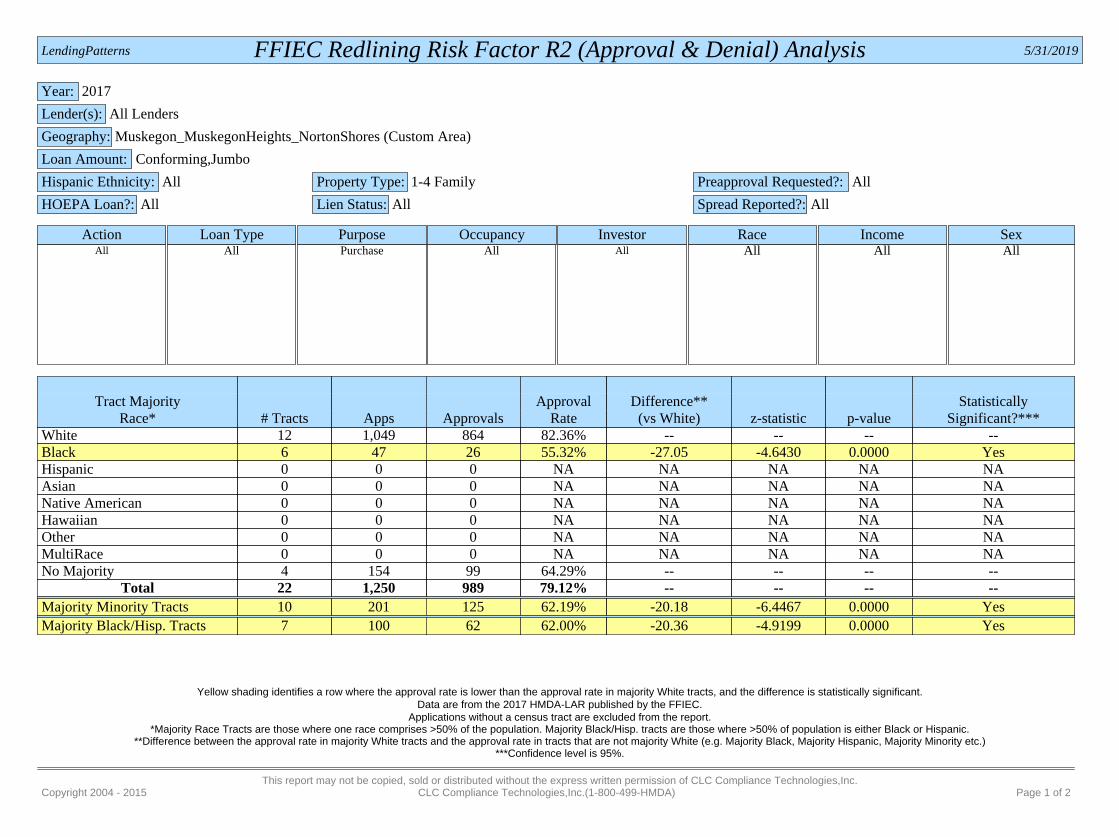
FFIEC Redlining Risk Factor R2 (Approval & Denial) AnalysisLendingPatterns 5/31/2019
Year: 2017
Lender(s): All Lenders
Geography: Muskegon_MuskegonHeights_NortonShores (Custom Area)
Loan Amount: Conforming,Jumbo
Hispanic Ethnicity: All Property Type: 1-4 Family Preapproval Requested?: All
HOEPA Loan?: All Lien Status: All Spread Reported?: All
Action Loan Type Purpose Occupancy Investor Race Income SexAll All Purchase All All All All All
Tract Majority Approval Difference** StatisticallyRace* # Tracts Apps Approvals Rate (vs White) z-statistic p-value Significant?***
White 12 1,049 864 82.36% -- -- -- --Black 6 47 26 55.32% -27.05 -4.6430 0.0000 YesHispanic 0 0 0 NA NA NA NA NAAsian 0 0 0 NA NA NA NA NANative American 0 0 0 NA NA NA NA NAHawaiian 0 0 0 NA NA NA NA NAOther 0 0 0 NA NA NA NA NAMultiRace 0 0 0 NA NA NA NA NANo Majority 4 154 99 64.29% -- -- -- --
Total 22 1,250 989 79.12% -- -- -- --Majority Minority Tracts 10 201 125 62.19% -20.18 -6.4467 0.0000 YesMajority Black/Hisp. Tracts 7 100 62 62.00% -20.36 -4.9199 0.0000 Yes
Yellow shading identifies a row where the approval rate is lower than the approval rate in majority White tracts, and the difference is statistically significant.Data are from the 2017 HMDA-LAR published by the FFIEC.
Applications without a census tract are excluded from the report.*Majority Race Tracts are those where one race comprises >50% of the population. Majority Black/Hisp. tracts are those where >50% of population is either Black or Hispanic.
**Difference between the approval rate in majority White tracts and the approval rate in tracts that are not majority White (e.g. Majority Black, Majority Hispanic, Majority Minority etc.)***Confidence level is 95%.
This report may not be copied, sold or distributed without the express written permission of CLC Compliance Technologies,Inc.Copyright 2004 - 2015 CLC Compliance Technologies,Inc.(1-800-499-HMDA) Page 1 of 2
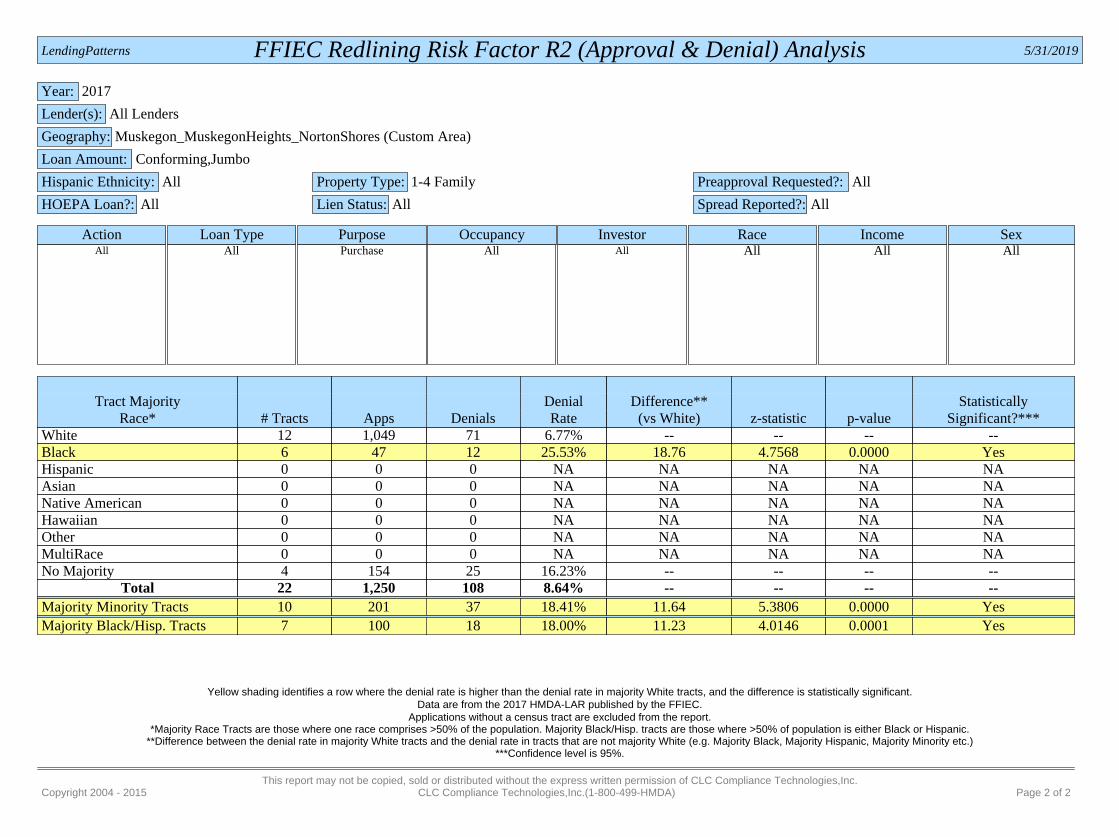
FFIEC Redlining Risk Factor R2 (Approval & Denial) AnalysisLendingPatterns 5/31/2019
Year: 2017
Lender(s): All Lenders
Geography: Muskegon_MuskegonHeights_NortonShores (Custom Area)
Loan Amount: Conforming,Jumbo
Hispanic Ethnicity: All Property Type: 1-4 Family Preapproval Requested?: All
HOEPA Loan?: All Lien Status: All Spread Reported?: All
Action Loan Type Purpose Occupancy Investor Race Income SexAll All Purchase All All All All All
Tract Majority Denial Difference** StatisticallyRace* # Tracts Apps Denials Rate (vs White) z-statistic p-value Significant?***
White 12 1,049 71 6.77% -- -- -- --Black 6 47 12 25.53% 18.76 4.7568 0.0000 YesHispanic 0 0 0 NA NA NA NA NAAsian 0 0 0 NA NA NA NA NANative American 0 0 0 NA NA NA NA NAHawaiian 0 0 0 NA NA NA NA NAOther 0 0 0 NA NA NA NA NAMultiRace 0 0 0 NA NA NA NA NANo Majority 4 154 25 16.23% -- -- -- --
Total 22 1,250 108 8.64% -- -- -- --Majority Minority Tracts 10 201 37 18.41% 11.64 5.3806 0.0000 YesMajority Black/Hisp. Tracts 7 100 18 18.00% 11.23 4.0146 0.0001 Yes
Yellow shading identifies a row where the denial rate is higher than the denial rate in majority White tracts, and the difference is statistically significant.Data are from the 2017 HMDA-LAR published by the FFIEC.
Applications without a census tract are excluded from the report.*Majority Race Tracts are those where one race comprises >50% of the population. Majority Black/Hisp. tracts are those where >50% of population is either Black or Hispanic.
**Difference between the denial rate in majority White tracts and the denial rate in tracts that are not majority White (e.g. Majority Black, Majority Hispanic, Majority Minority etc.)***Confidence level is 95%.
This report may not be copied, sold or distributed without the express written permission of CLC Compliance Technologies,Inc.Copyright 2004 - 2015 CLC Compliance Technologies,Inc.(1-800-499-HMDA) Page 2 of 2
HMDA Data Analysis for the Cities of Muskegon, Muskegon Heights, and Norton Shores July 2019
Appendix F
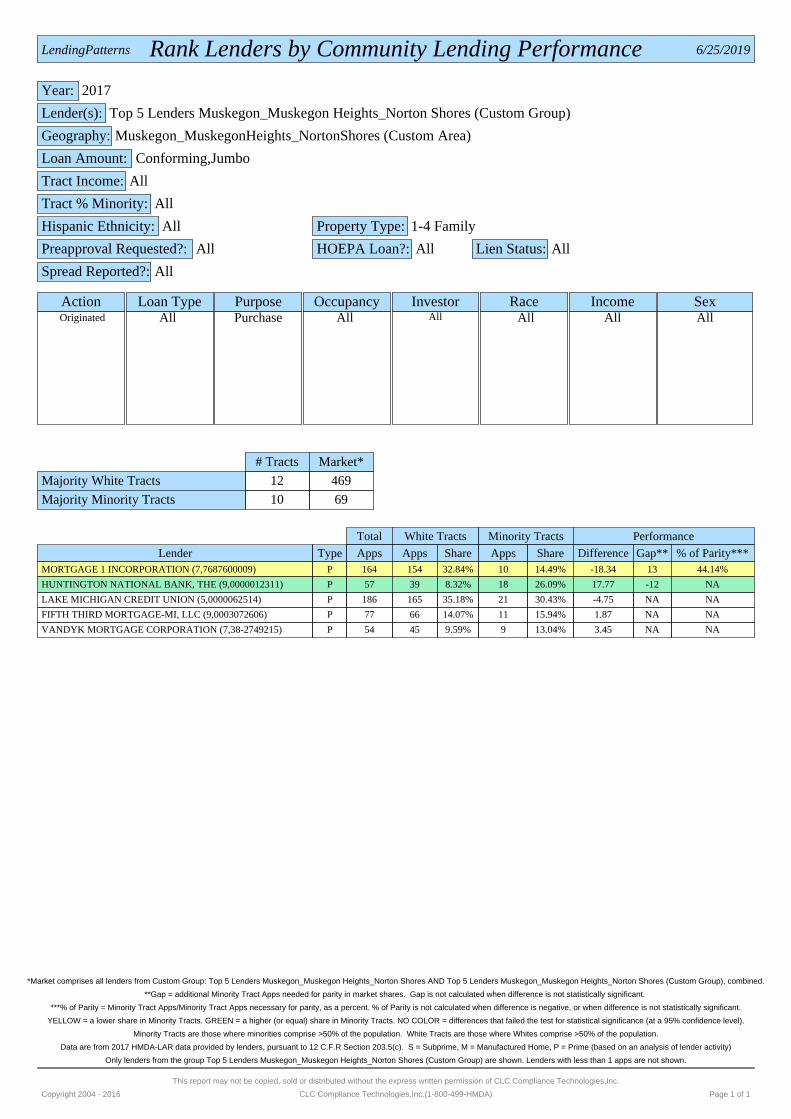
Rank Lenders by Community Lending PerformanceLendingPatterns 6/25/2019
Year: 2017
Lender(s): Top 5 Lenders Muskegon_Muskegon Heights_Norton Shores (Custom Group)
Geography: Muskegon_MuskegonHeights_NortonShores (Custom Area)
Loan Amount: Conforming,Jumbo
Tract Income: All
Tract % Minority: All
Hispanic Ethnicity: All Property Type: 1-4 Family
Preapproval Requested?: All HOEPA Loan?: All Lien Status: All
Spread Reported?: All
Action Loan Type Purpose Occupancy Investor Race Income Sex Originated All Purchase All All All All All
# Tracts Market*
Majority White Tracts 12 469
Majority Minority Tracts 10 69
Total White Tracts Minority Tracts Performance
Lender Type Apps Apps Share Apps Share Difference Gap** % of Parity***MORTGAGE 1 INCORPORATION (7,7687600009) P 164 154 32.84% 10 14.49% -18.34 13 44.14%
HUNTINGTON NATIONAL BANK, THE (9,0000012311) P 57 39 8.32% 18 26.09% 17.77 -12 NA
LAKE MICHIGAN CREDIT UNION (5,0000062514) P 186 165 35.18% 21 30.43% -4.75 NA NA
FIFTH THIRD MORTGAGE-MI, LLC (9,0003072606) P 77 66 14.07% 11 15.94% 1.87 NA NA
VANDYK MORTGAGE CORPORATION (7,38-2749215) P 54 45 9.59% 9 13.04% 3.45 NA NA
*Market comprises all lenders from Custom Group: Top 5 Lenders Muskegon_Muskegon Heights_Norton Shores AND Top 5 Lenders Muskegon_Muskegon Heights_Norton Shores (Custom Group), combined.
**Gap = additional Minority Tract Apps needed for parity in market shares. Gap is not calculated when difference is not statistically significant.
***% of Parity = Minority Tract Apps/Minority Tract Apps necessary for parity, as a percent. % of Parity is not calculated when difference is negative, or when difference is not statistically significant.
YELLOW = a lower share in Minority Tracts. GREEN = a higher (or equal) share in Minority Tracts. NO COLOR = differences that failed the test for statistical significance (at a 95% confidence level).
Minority Tracts are those where minorities comprise >50% of the population. White Tracts are those where Whites comprise >50% of the population.
Data are from 2017 HMDA-LAR data provided by lenders, pursuant to 12 C.F.R Section 203.5(c). S = Subprime, M = Manufactured Home, P = Prime (based on an analysis of lender activity)
Only lenders from the group Top 5 Lenders Muskegon_Muskegon Heights_Norton Shores (Custom Group) are shown. Lenders with less than 1 apps are not shown.
This report may not be copied, sold or distributed without the express written permission of CLC Compliance Technologies,Inc.
Copyright 2004 - 2016 CLC Compliance Technologies,Inc.(1-800-499-HMDA) Page 1 of 1