2015 holdings, inc. trading activity and market share - 2015 total options contract volume by...
TRANSCRIPT

CBOE Market Statistics
2015
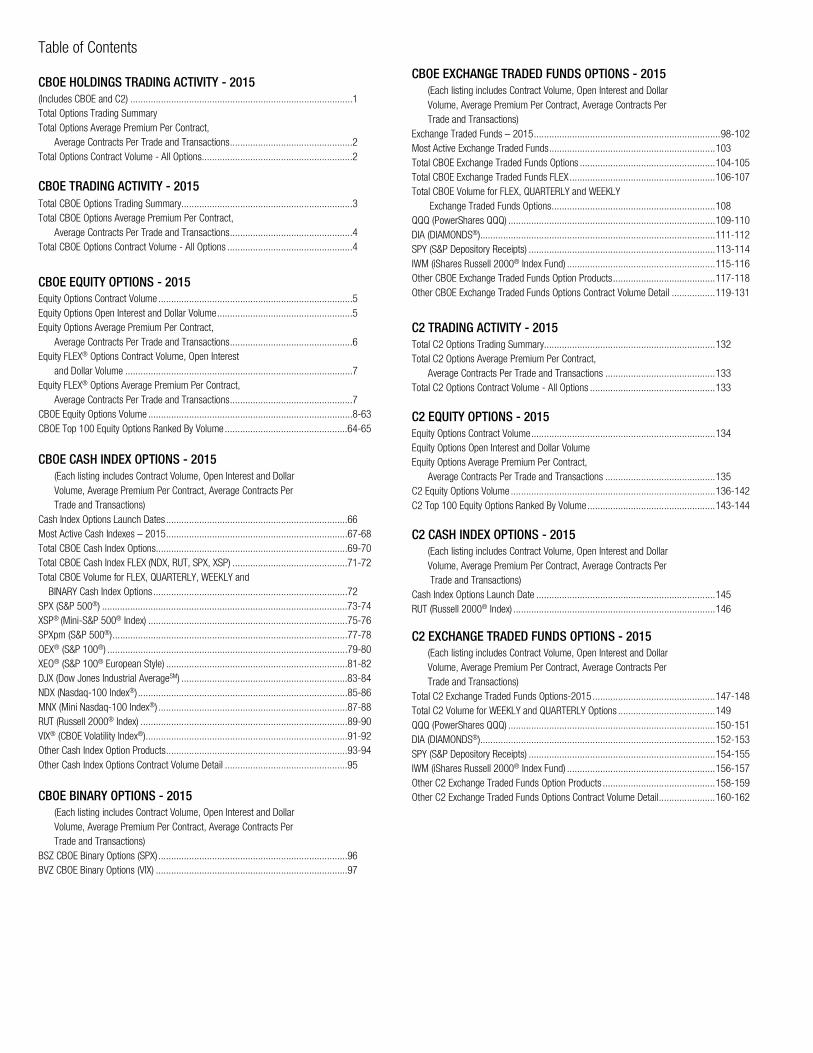
Table of Contents
CBOE HOLDINGS TRADING ACTIVITY - 2015 (Includes CBOE and C2) .......................................................................................1 Total Options Trading Summary Total Options Average Premium Per Contract,
Average Contracts Per Trade and Transactions ................................................2 Total Options Contract Volume - All Options ...........................................................2
CBOE TRADING ACTIVITY - 2015 Total CBOE Options Trading Summary ...................................................................3 Total CBOE Options Average Premium Per Contract,
Average Contracts Per Trade and Transactions ................................................4 Total CBOE Options Contract Volume - All Options .................................................4
CBOE EQUITY OPTIONS - 2015 Equity Options Contract Volume ............................................................................5 Equity Options Open Interest and Dollar Volume .....................................................5 Equity Options Average Premium Per Contract,
Average Contracts Per Trade and Transactions ................................................6 Equity FLEX® Options Contract Volume, Open Interest
and Dollar Volume .........................................................................................7 Equity FLEX® Options Average Premium Per Contract,
Average Contracts Per Trade and Transactions ................................................7 CBOE Equity Options Volume ................................................................................8-63 CBOE Top 100 Equity Options Ranked By Volume ................................................64-65
CBOE CASH INDEX OPTIONS - 2015 (Each listing includes Contract Volume, Open Interest and Dollar Volume, Average Premium Per Contract, Average Contracts Per Trade and Transactions)
Cash Index Options Launch Dates .......................................................................66 Most Active Cash Indexes – 2015 .......................................................................67-68 Total CBOE Cash Index Options ...........................................................................69-70 Total CBOE Cash Index FLEX (NDX, RUT, SPX, XSP) .............................................71-72 Total CBOE Volume for FLEX, QUARTERLY, WEEKLY and BINARY Cash Index Options ............................................................................72 SPX (S&P 500®) ................................................................................................73-74 XSP® (Mini-S&P 500® Index) ..............................................................................75-76 SPXpm (S&P 500®) ............................................................................................77-78 OEX® (S&P 100®) ..............................................................................................79-80 XEO® (S&P 100® European Style) .......................................................................81-82 DJX (Dow Jones Industrial AverageSM) .................................................................83-84 NDX (Nasdaq-100 Index®) ..................................................................................85-86 MNX (Mini Nasdaq-100 Index®) ..........................................................................87-88 RUT (Russell 2000® Index) .................................................................................89-90 VIX® (CBOE Volatility Index®) ...............................................................................91-92 Other Cash Index Option Products .......................................................................93-94 Other Cash Index Options Contract Volume Detail ................................................95
CBOE BINARY OPTIONS - 2015 (Each listing includes Contract Volume, Open Interest and Dollar Volume, Average Premium Per Contract, Average Contracts Per Trade and Transactions)
BSZ CBOE Binary Options (SPX) ..........................................................................96 BVZ CBOE Binary Options (VIX) ...........................................................................97
CBOE EXCHANGE TRADED FUNDS OPTIONS - 2015 (Each listing includes Contract Volume, Open Interest and Dollar Volume, Average Premium Per Contract, Average Contracts Per Trade and Transactions)
Exchange Traded Funds – 2015 ......................................................................... 98-102 Most Active Exchange Traded Funds ................................................................. 103 Total CBOE Exchange Traded Funds Options ..................................................... 104-105 Total CBOE Exchange Traded Funds FLEX ......................................................... 106-107 Total CBOE Volume for FLEX, QUARTERLY and WEEKLY Exchange Traded Funds Options ................................................................ 108 QQQ (PowerShares QQQ) ................................................................................. 109-110 DIA (DIAMONDS®)............................................................................................ 111-112 SPY (S&P Depository Receipts) ......................................................................... 113-114 IWM (iShares Russell 2000® Index Fund) .......................................................... 115-116 Other CBOE Exchange Traded Funds Option Products ........................................ 117-118 Other CBOE Exchange Traded Funds Options Contract Volume Detail ................. 119-131
C2 TRADING ACTIVITY - 2015 Total C2 Options Trading Summary ................................................................... 132 Total C2 Options Average Premium Per Contract,
Average Contracts Per Trade and Transactions ........................................... 133 Total C2 Options Contract Volume - All Options ................................................. 133
C2 EQUITY OPTIONS - 2015 Equity Options Contract Volume ........................................................................ 134 Equity Options Open Interest and Dollar Volume Equity Options Average Premium Per Contract,
Average Contracts Per Trade and Transactions ........................................... 135 C2 Equity Options Volume ................................................................................ 136-142 C2 Top 100 Equity Options Ranked By Volume .................................................. 143-144
C2 CASH INDEX OPTIONS - 2015 (Each listing includes Contract Volume, Open Interest and Dollar Volume, Average Premium Per Contract, Average Contracts Per Trade and Transactions)
Cash Index Options Launch Date ...................................................................... 145 RUT (Russell 2000® Index) ............................................................................... 146
C2 EXCHANGE TRADED FUNDS OPTIONS - 2015 (Each listing includes Contract Volume, Open Interest and Dollar Volume, Average Premium Per Contract, Average Contracts Per Trade and Transactions)
Total C2 Exchange Traded Funds Options-2015 ................................................ 147-148 Total C2 Volume for WEEKLY and QUARTERLY Options ...................................... 149 QQQ (PowerShares QQQ) ................................................................................. 150-151 DIA (DIAMONDS®)............................................................................................ 152-153 SPY (S&P Depository Receipts) ......................................................................... 154-155 IWM (iShares Russell 2000® Index Fund) .......................................................... 156-157 Other C2 Exchange Traded Funds Option Products ............................................ 158-159 Other C2 Exchange Traded Funds Options Contract Volume Detail ...................... 160-162
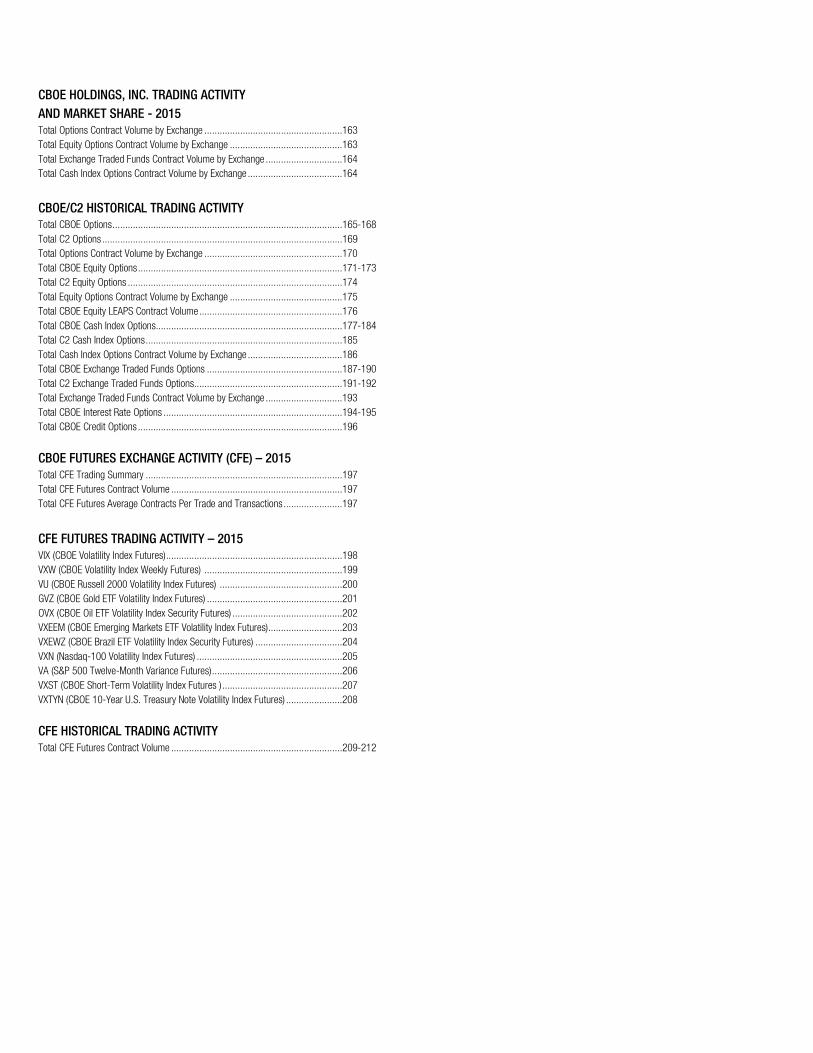
CBOE HOLDINGS, INC. TRADING ACTIVITY AND MARKET SHARE - 2015 Total Options Contract Volume by Exchange ......................................................163 Total Equity Options Contract Volume by Exchange ............................................163 Total Exchange Traded Funds Contract Volume by Exchange ..............................164 Total Cash Index Options Contract Volume by Exchange .....................................164
CBOE/C2 HISTORICAL TRADING ACTIVITY Total CBOE Options ..........................................................................................165-168 Total C2 Options ..............................................................................................169 Total Options Contract Volume by Exchange ......................................................170 Total CBOE Equity Options ................................................................................171-173 Total C2 Equity Options ....................................................................................174 Total Equity Options Contract Volume by Exchange ............................................175 Total CBOE Equity LEAPS Contract Volume ........................................................176 Total CBOE Cash Index Options .........................................................................177-184 Total C2 Cash Index Options .............................................................................185 Total Cash Index Options Contract Volume by Exchange .....................................186 Total CBOE Exchange Traded Funds Options .....................................................187-190 Total C2 Exchange Traded Funds Options ..........................................................191-192 Total Exchange Traded Funds Contract Volume by Exchange ..............................193 Total CBOE Interest Rate Options ......................................................................194-195 Total CBOE Credit Options ................................................................................196
CBOE FUTURES EXCHANGE ACTIVITY (CFE) – 2015 Total CFE Trading Summary .............................................................................197 Total CFE Futures Contract Volume ...................................................................197 Total CFE Futures Average Contracts Per Trade and Transactions .......................197
CFE FUTURES TRADING ACTIVITY – 2015 VIX (CBOE Volatility Index Futures) .....................................................................198 VXW (CBOE Volatility Index Weekly Futures) ......................................................199 VU (CBOE Russell 2000 Volatility Index Futures) ................................................200 GVZ (CBOE Gold ETF Volatility Index Futures) .....................................................201 OVX (CBOE Oil ETF Volatility Index Security Futures) ...........................................202 VXEEM (CBOE Emerging Markets ETF Volatility Index Futures) .............................203 VXEWZ (CBOE Brazil ETF Volatility Index Security Futures) ..................................204 VXN (Nasdaq-100 Volatility Index Futures) .........................................................205 VA (S&P 500 Twelve-Month Variance Futures) ...................................................206 VXST (CBOE Short-Term Volatility Index Futures ) ...............................................207 VXTYN (CBOE 10-Year U.S. Treasury Note Volatility Index Futures) ......................208
CFE HISTORICAL TRADING ACTIVITY Total CFE Futures Contract Volume ...................................................................209-212

CBOE HOLDINGS, INC. TRADING ACTIVITY - 2015(Includes CBOE and C2 combined)
Total CBOE HOLDINGS Options Trading Summary
Call Put TotalNo. of Contracts 556,570,874 565,687,699 1,122,258,573Average Daily Volume 2,208,615 2,244,792 4,453,407Dollar Volume $288,947,822,729 $314,974,894,465 $603,922,717,194Open Interest 153,673,603 139,782,075 293,455,678Transactions 33,749,909 28,925,248 62,675,157
Trading Average Daily Total Dollar Month Days Call Put Total Total Call Put Total Volume
Jan 20 50,198,425 52,467,660 102,666,085 5,133,304 118,894,861 113,549,063 232,443,924 $60,386,721,638Feb 19 43,120,401 42,220,499 85,340,900 4,491,626 124,514,632 121,983,571 246,498,203 $39,536,191,977Mar 22 44,751,413 46,497,252 91,248,665 4,147,667 126,879,160 124,921,877 251,801,037 $44,581,215,992Apr 21 45,118,813 42,921,673 88,040,486 4,192,404 141,797,433 134,895,913 276,693,346 $36,916,182,202May 20 41,904,507 39,883,002 81,787,509 4,089,375 143,611,513 135,610,664 279,222,177 $32,440,800,577Jun 22 47,934,455 46,604,543 94,538,998 4,297,227 143,989,678 133,095,912 277,085,590 $43,228,383,067Jul 22 50,362,225 51,095,449 101,457,674 4,611,712 155,364,982 143,280,937 298,645,919 $43,558,140,039Aug 21 55,490,166 63,344,522 118,834,688 5,658,795 161,708,995 152,317,134 314,026,129 $79,161,208,609Sep 21 45,927,688 52,792,132 98,719,820 4,700,944 158,879,054 150,244,439 309,123,493 $76,303,161,401Oct 22 49,024,348 45,817,917 94,842,265 4,311,012 164,587,484 155,109,178 319,696,662 $50,656,299,583Nov 20 39,462,077 39,823,935 79,286,012 3,964,301 157,785,714 145,364,576 303,150,290 $43,796,538,059Dec 22 43,276,356 42,219,115 85,495,471 3,886,158 153,673,603 139,782,075 293,455,678 $53,357,874,050Total 252 556,570,874 565,687,699 1,122,258,573 4,453,407 -- -- $603,922,717,194
Contract Volume Open Interest
Page 1

Total CBOE HOLDINGS Options Average Premium Per Contract, Average Contracts Per Trade and Transactions
TradingMonth Days Call Put Total Call Put Total Call Put Total
Jan 20 $592 $585 $588 15 18 17 3,338,529 2,848,487 6,187,016Feb 19 $491 $435 $463 14 18 15 3,149,319 2,401,160 5,550,479Mar 22 $498 $480 $489 15 18 16 3,056,746 2,615,546 5,672,292Apr 21 $436 $401 $419 15 17 16 3,091,061 2,521,625 5,612,686May 20 $398 $395 $397 16 19 17 2,575,869 2,102,611 4,678,480Jun 22 $477 $437 $457 17 20 18 2,801,326 2,360,634 5,161,960Jul 22 $409 $449 $429 17 21 19 2,888,947 2,447,044 5,335,991Aug 21 $489 $822 $666 19 22 21 2,895,526 2,872,066 5,767,592Sep 21 $685 $849 $773 18 21 19 2,578,032 2,510,319 5,088,351Oct 22 $549 $518 $534 18 21 19 2,763,788 2,221,784 4,985,572Nov 20 $597 $509 $552 17 21 19 2,282,949 1,921,965 4,204,914Dec 22 $622 $627 $624 19 20 19 2,327,817 2,102,007 4,429,824Total 252 $519 $557 $538 16 20 18 33,749,909 28,925,248 62,675,157
Total CBOE HOLDINGS Options Contract Volume - All Options
MonthTrading
DaysTotal
VolumeEquity
VolumeCash Index
VolumeETF
VolumeJan 20 102,666,085 39,335,452 31,418,398 31,912,235Feb 19 85,340,900 35,592,722 26,169,169 23,579,009Mar 22 91,248,665 35,362,146 27,754,923 28,131,596Apr 21 88,040,486 35,894,680 26,908,218 25,237,588May 20 81,787,509 29,912,625 28,409,088 23,465,796Jun 22 94,538,998 30,577,299 35,732,894 28,228,805Jul 22 101,457,674 33,708,044 38,567,490 29,182,140Aug 21 118,834,688 33,486,927 51,943,533 33,404,228Sep 21 98,719,820 27,292,239 42,342,335 29,085,246Oct 22 94,842,265 33,138,939 37,467,746 24,235,580Nov 20 79,286,012 31,049,016 29,000,970 19,236,026Dec 22 85,495,471 27,634,530 32,563,513 25,297,428Total 252 1,122,258,573 392,984,619 408,278,277 320,995,677
Average Premium Per Contract Average Contracts Per Trade Transactions
Page 2

CBOE TRADING ACTIVITY - 2015
Total CBOE Options Trading Summary
Call Put TotalNo. of Contracts 522,176,114 520,855,516 1,043,031,630Average Daily Volume 2,072,127 2,066,887 4,139,014Dollar Volume $283,667,392,066 $309,124,848,471 $592,792,240,537Open Interest 153,673,603 139,782,075 293,455,678Transactions 31,151,297 26,239,815 57,391,112
Trading Average Daily Total Dollar Month Days Call Put Total Total Call Put Total Volume
Jan 20 47,085,971 48,430,109 95,516,080 4,775,804 118,894,861 113,549,063 232,443,924 $59,446,031,809Feb 19 40,739,304 38,953,284 79,692,588 4,194,347 124,514,632 121,983,571 246,498,203 $38,866,359,432Mar 22 42,030,921 42,414,366 84,445,287 3,838,422 126,879,160 124,921,877 251,801,037 $43,868,665,538Apr 21 41,794,886 39,272,837 81,067,723 3,860,368 141,797,433 134,895,913 276,693,346 $36,055,278,142May 20 38,861,184 36,451,690 75,312,874 3,765,644 143,611,513 135,610,664 279,222,177 $31,761,599,445Jun 22 45,054,063 42,602,058 87,656,121 3,984,369 143,989,678 133,095,912 277,085,590 $42,499,682,339Jul 22 47,057,107 46,832,658 93,889,765 4,267,717 155,364,982 143,280,937 298,645,919 $42,609,225,655Aug 21 52,114,663 58,954,055 111,068,718 5,288,987 161,708,995 152,317,134 314,026,129 $77,757,538,915Sep 21 43,435,592 49,116,445 92,552,037 4,407,240 158,879,054 150,244,439 309,123,493 $75,079,064,843Oct 22 46,301,133 42,508,781 88,809,914 4,036,814 164,587,484 155,109,178 319,696,662 $49,622,496,531Nov 20 37,358,261 36,863,317 74,221,578 3,711,079 157,785,714 145,364,576 303,150,290 $42,954,664,676Dec 22 40,343,029 38,455,916 78,798,945 3,581,770 153,673,603 139,782,075 293,455,678 $52,271,633,212Total 252 522,176,114 520,855,516 1,043,031,630 4,139,014 -- -- -- $592,792,240,537
Contract Volume Open Interest
Page 3
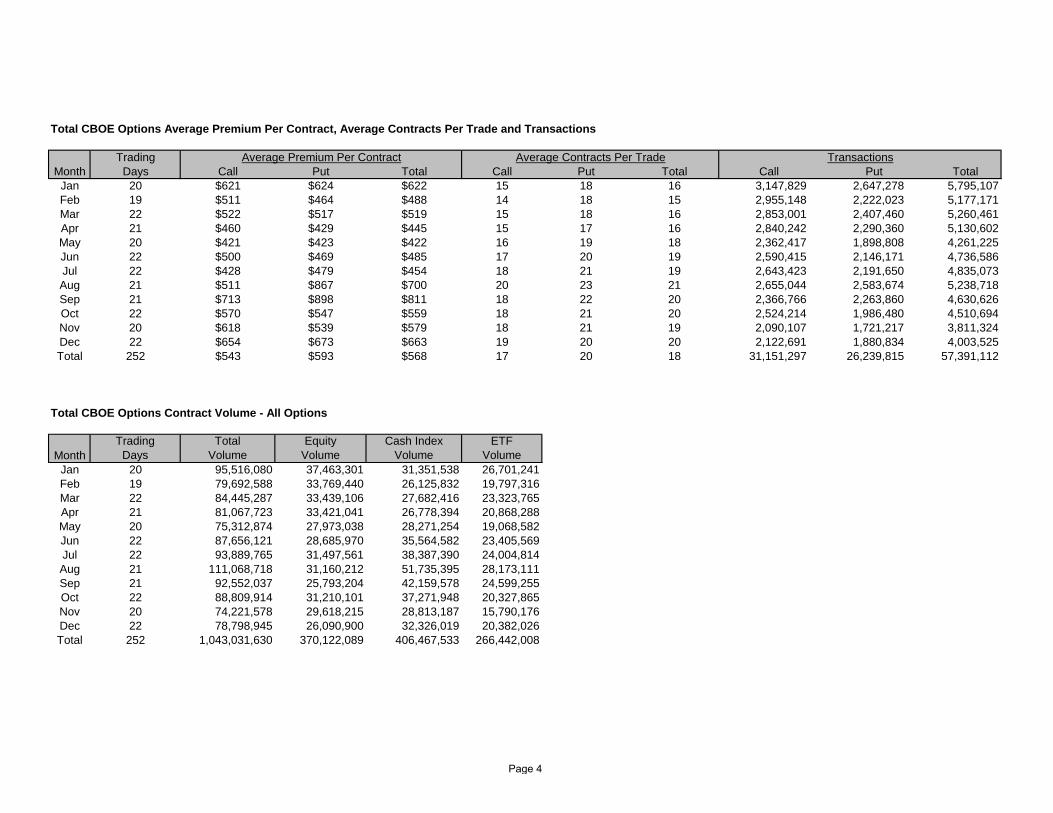
Total CBOE Options Average Premium Per Contract, Average Contracts Per Trade and Transactions
TradingMonth Days Call Put Total Call Put Total Call Put Total
Jan 20 $621 $624 $622 15 18 16 3,147,829 2,647,278 5,795,107Feb 19 $511 $464 $488 14 18 15 2,955,148 2,222,023 5,177,171Mar 22 $522 $517 $519 15 18 16 2,853,001 2,407,460 5,260,461Apr 21 $460 $429 $445 15 17 16 2,840,242 2,290,360 5,130,602May 20 $421 $423 $422 16 19 18 2,362,417 1,898,808 4,261,225Jun 22 $500 $469 $485 17 20 19 2,590,415 2,146,171 4,736,586Jul 22 $428 $479 $454 18 21 19 2,643,423 2,191,650 4,835,073Aug 21 $511 $867 $700 20 23 21 2,655,044 2,583,674 5,238,718Sep 21 $713 $898 $811 18 22 20 2,366,766 2,263,860 4,630,626Oct 22 $570 $547 $559 18 21 20 2,524,214 1,986,480 4,510,694Nov 20 $618 $539 $579 18 21 19 2,090,107 1,721,217 3,811,324Dec 22 $654 $673 $663 19 20 20 2,122,691 1,880,834 4,003,525Total 252 $543 $593 $568 17 20 18 31,151,297 26,239,815 57,391,112
Total CBOE Options Contract Volume - All Options
MonthTrading
DaysTotal
VolumeEquity
VolumeCash Index
VolumeETF
VolumeJan 20 95,516,080 37,463,301 31,351,538 26,701,241Feb 19 79,692,588 33,769,440 26,125,832 19,797,316Mar 22 84,445,287 33,439,106 27,682,416 23,323,765Apr 21 81,067,723 33,421,041 26,778,394 20,868,288May 20 75,312,874 27,973,038 28,271,254 19,068,582Jun 22 87,656,121 28,685,970 35,564,582 23,405,569Jul 22 93,889,765 31,497,561 38,387,390 24,004,814Aug 21 111,068,718 31,160,212 51,735,395 28,173,111Sep 21 92,552,037 25,793,204 42,159,578 24,599,255Oct 22 88,809,914 31,210,101 37,271,948 20,327,865Nov 20 74,221,578 29,618,215 28,813,187 15,790,176Dec 22 78,798,945 26,090,900 32,326,019 20,382,026Total 252 1,043,031,630 370,122,089 406,467,533 266,442,008
Average Premium Per Contract Average Contracts Per Trade Transactions
Page 4

CBOE EQUITY OPTIONS - 2015
CBOE Equity Options Contract Volume
Trading Average DailyMonth Days Call Put Total Volume
Jan 20 22,396,467 15,066,834 37,463,301 1,873,165Feb 19 20,948,438 12,821,002 33,769,440 1,777,339Mar 22 20,332,498 13,106,608 33,439,106 1,519,959Apr 21 20,465,392 12,955,649 33,421,041 1,591,478May 20 17,207,670 10,765,368 27,973,038 1,398,652Jun 22 17,693,954 10,992,016 28,685,970 1,303,908Jul 22 18,945,353 12,552,208 31,497,561 1,431,707Aug 21 17,507,403 13,652,809 31,160,212 1,483,820Sep 21 14,585,386 11,207,818 25,793,204 1,228,248Oct 22 18,600,521 12,609,580 31,210,101 1,418,641Nov 20 17,148,314 12,469,901 29,618,215 1,480,911Dec 22 15,442,089 10,648,811 26,090,900 1,185,950Total 252 221,273,485 148,848,604 370,122,089 1,468,738
CBOE Equity Options Open Interest and Dollar Volume
Month Call Put Total Call Put TotalJan 85,686,225 66,065,558 151,751,783 $5,093,611,449 $3,312,200,111 $8,405,811,560Feb 89,714,717 70,534,050 160,248,767 $4,765,627,795 $2,235,662,157 $7,001,289,952Mar 92,020,060 72,562,796 164,582,856 $3,698,321,540 $2,334,385,024 $6,032,706,564Apr 100,914,732 79,154,816 180,069,548 $4,056,066,919 $2,250,018,749 $6,306,085,668May 101,992,193 80,085,632 182,077,825 $2,934,012,717 $1,673,548,135 $4,607,560,852Jun 102,227,474 79,623,273 181,850,747 $3,064,103,392 $1,758,384,447 $4,822,487,839Jul 110,427,125 85,807,626 196,234,751 $3,952,259,786 $2,345,149,130 $6,297,408,916Aug 110,199,751 86,379,435 196,579,186 $3,309,804,958 $3,346,666,849 $6,656,471,807Sep 109,417,492 86,139,938 195,557,430 $2,502,597,845 $2,757,057,744 $5,259,655,589Oct 113,366,002 90,112,182 203,478,184 $3,700,959,039 $2,825,345,477 $6,526,304,516Nov 107,579,231 85,020,060 192,599,291 $3,034,911,072 $3,911,048,556 $6,945,959,628Dec 107,475,964 84,486,892 191,962,856 $2,751,588,018 $2,219,573,795 $4,971,161,813Total -- -- -- $42,863,864,530 $30,969,040,174 $73,832,904,704
During 2015, 370 million equity contracts were traded on the CBOE, representing options on 37.0 billion shares of underlying stock.
Open interest represents the number of outstanding options contracts at any point in time. It is the total number of options which have been purchased but not liquidated in the secondary market, exercised or expired. At year-end 2015, open interest in equity options on CBOE was 191,962,856 contracts.
Open Interest Dollar Volume
Contract Volume
Page 5

CBOE Equity Options Average Premium Per Contract, Average Contracts Per Trade and Transactions
Month Call Put Total Call Put Total Call Put TotalJan $227 $220 $224 11 11 11 2,083,841 1,418,337 3,502,178Feb $227 $174 $207 10 10 10 2,120,476 1,307,960 3,428,436Mar $182 $178 $180 11 10 10 1,899,571 1,288,935 3,188,506Apr $198 $174 $189 10 10 10 1,982,102 1,321,011 3,303,113May $171 $155 $165 11 11 11 1,536,606 987,343 2,523,949Jun $173 $160 $168 12 11 12 1,525,238 967,359 2,492,597Jul $209 $187 $200 12 12 12 1,595,396 1,016,516 2,611,912Aug $189 $245 $214 12 12 12 1,456,882 1,108,189 2,565,071Sep $172 $246 $204 12 12 12 1,260,347 969,916 2,230,263Oct $199 $224 $209 12 13 12 1,535,244 981,775 2,517,019Nov $177 $314 $235 13 15 14 1,283,129 834,251 2,117,380Dec $178 $208 $191 13 13 13 1,218,506 847,774 2,066,280Total $194 $208 $199 11 11 11 19,497,338 13,049,366 32,546,704
Average Premium Per Contract Average Contracts Per Trade Transactions
Page 6
Trading Average Daily Dollar VolumeMonth Days Call Put Total Volume Call Put Total Total
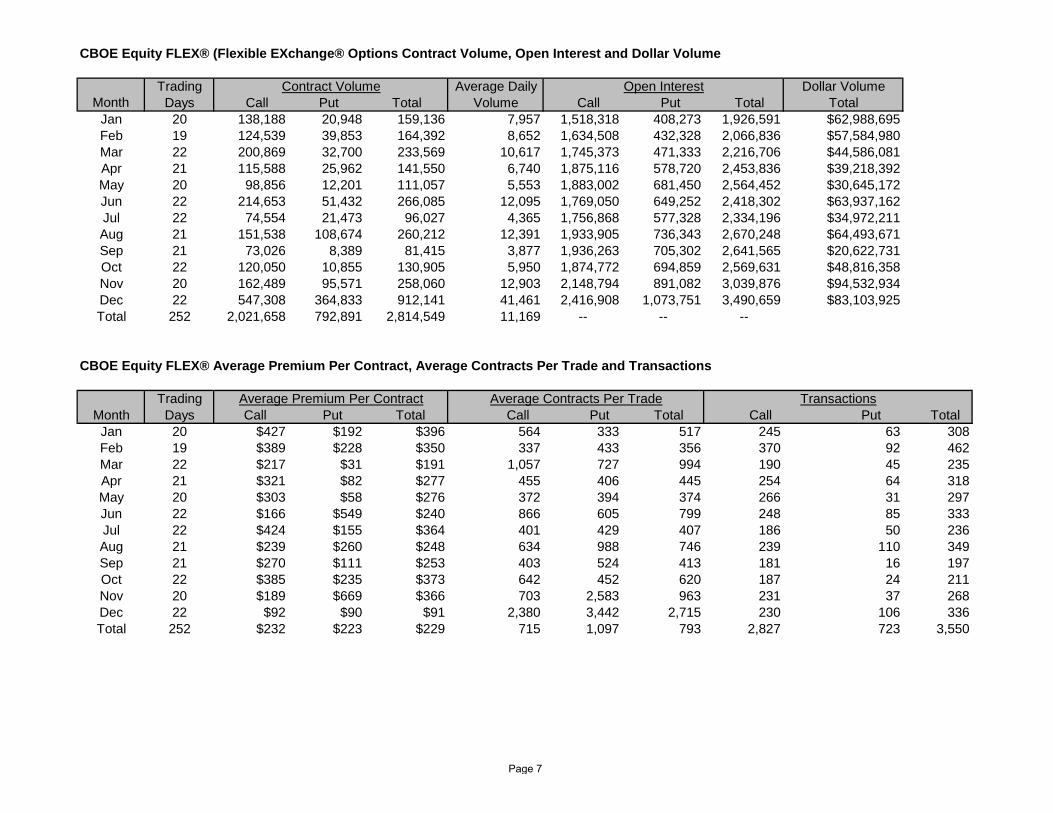
Jan 20 138,188 20,948 159,136 7,957 1,518,318 408,273 1,926,591 $62,988,695Feb 19 124,539 39,853 164,392 8,652 1,634,508 432,328 2,066,836 $57,584,980Mar 22 200,869 32,700 233,569 10,617 1,745,373 471,333 2,216,706 $44,586,081Apr 21 115,588 25,962 141,550 6,740 1,875,116 578,720 2,453,836 $39,218,392May 20 98,856 12,201 111,057 5,553 1,883,002 681,450 2,564,452 $30,645,172Jun 22 214,653 51,432 266,085 12,095 1,769,050 649,252 2,418,302 $63,937,162Jul 22 74,554 21,473 96,027 4,365 1,756,868 577,328 2,334,196 $34,972,211Aug 21 151,538 108,674 260,212 12,391 1,933,905 736,343 2,670,248 $64,493,671Sep 21 73,026 8,389 81,415 3,877 1,936,263 705,302 2,641,565 $20,622,731Oct 22 120,050 10,855 130,905 5,950 1,874,772 694,859 2,569,631 $48,816,358Nov 20 162,489 95,571 258,060 12,903 2,148,794 891,082 3,039,876 $94,532,934Dec 22 547,308 364,833 912,141 41,461 2,416,908 1,073,751 3,490,659 $83,103,925Total 252 2,021,658 792,891 2,814,549 11,169 -- -- --
TradingMonth Days Call Put Total Call Put Total Call Put Total
Jan 20 $427 $192 $396 564 333 517 245 63 308Feb 19 $389 $228 $350 337 433 356 370 92 462Mar 22 $217 $31 $191 1,057 727 994 190 45 235Apr 21 $321 $82 $277 455 406 445 254 64 318May 20 $303 $58 $276 372 394 374 266 31 297Jun 22 $166 $549 $240 866 605 799 248 85 333Jul 22 $424 $155 $364 401 429 407 186 50 236Aug 21 $239 $260 $248 634 988 746 239 110 349Sep 21 $270 $111 $253 403 524 413 181 16 197Oct 22 $385 $235 $373 642 452 620 187 24 211Nov 20 $189 $669 $366 703 2,583 963 231 37 268Dec 22 $92 $90 $91 2,380 3,442 2,715 230 106 336Total 252 $232 $223 $229 715 1,097 793 2,827 723 3,550
Average Premium Per Contract Average Contracts Per Trade Transactions
CBOE Equity FLEX® (Flexible EXchange® Options Contract Volume, Open Interest and Dollar Volume
Contract Volume Open Interest
CBOE Equity FLEX® Average Premium Per Contract, Average Contracts Per Trade and Transactions
Page 7

Standard Symbol Stock Total Call Put Total Call Put
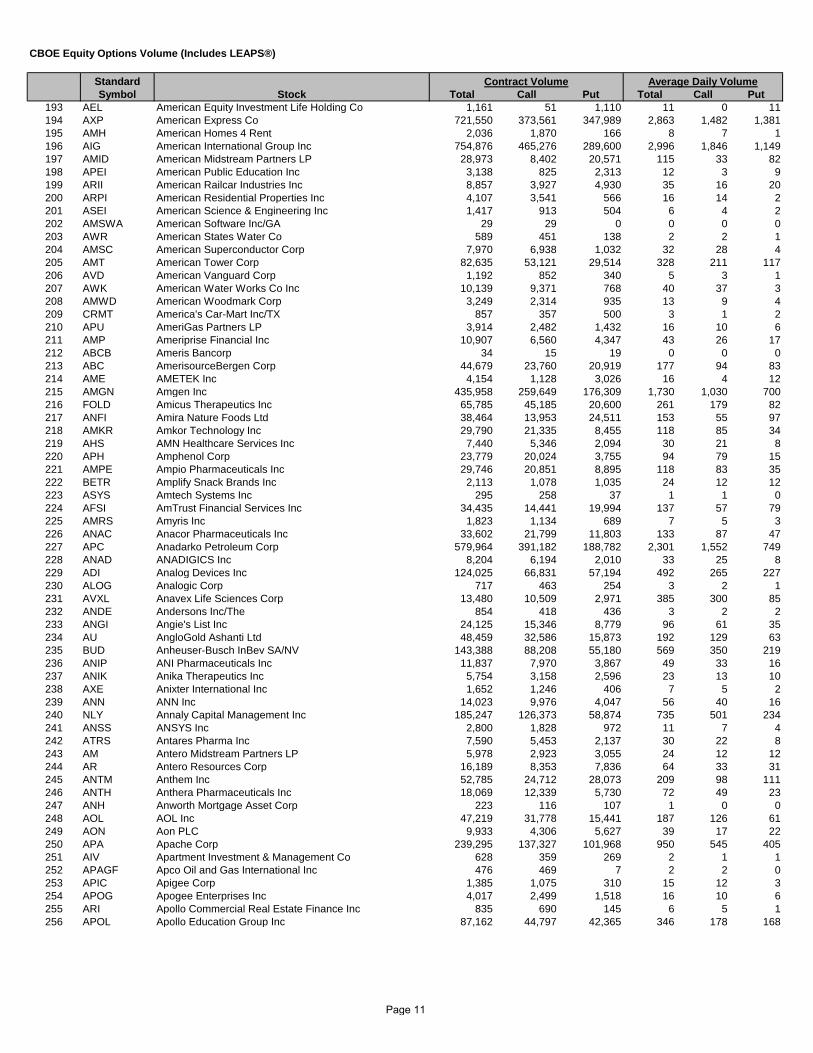
1 FLWS 1-800-Flowers.com Inc 1,097 972 125 8 7 12 VNET 21Vianet Group Inc 70,355 36,963 33,392 279 147 1333 XXII 22nd Century Group Inc 1,749 1,310 439 7 5 24 TWOU 2U Inc 6,984 2,353 4,631 53 18 355 DDD 3D Systems Corp 464,278 287,662 176,616 1,842 1,142 7016 MMM 3M Co 304,201 122,642 181,559 1,207 487 7207 WBAI 500.com Ltd 82,855 35,283 47,572 329 140 1898 JOBS 51job Inc 2,453 1,030 1,423 10 4 69 WUBA 58.com Inc 45,406 25,057 20,349 180 99 81
10 CAFD 8Point3 Energy Partners LP 3,113 2,034 1,079 25 16 911 EGHT 8x8 Inc 3,108 2,577 531 12 10 212 AHC A H Belo Corp 39 15 24 0 0 013 SHLM A Schulman Inc 861 412 449 3 2 214 CAS A. M. Castle & Co 5,241 1,528 3,713 21 6 1515 ATEN A10 Networks Inc 5,540 4,117 1,423 22 16 616 AAC AAC Holdings Inc 2,405 1,754 651 24 18 717 AAON AAON Inc 33 1 32 0 0 018 AIR AAR Corp 3,439 1,544 1,895 14 6 819 AAN Aaron's Inc 10,093 3,883 6,210 40 15 2520 ABAX Abaxis Inc 1,071 265 806 4 1 321 ABB ABB Ltd 20,427 14,493 5,934 81 58 2422 ABT Abbott Laboratories 254,570 179,733 74,837 1,010 713 29723 ABBV AbbVie Inc 721,303 418,484 302,819 2,862 1,661 1,20224 ABY Abengoa Yield plc 9,716 1,363 8,353 39 5 3325 ABEO Abeona Therapeutics Inc 1,367 1,239 128 5 5 126 PTBI Abeona Therapeutics Inc 241 163 78 2 1 127 ANF Abercrombie & Fitch Co 366,664 169,490 197,174 1,455 673 78228 ABMD ABIOMED Inc 18,251 10,491 7,760 72 42 3129 AXAS Abraxas Petroleum Corp 2,670 2,186 484 11 9 230 ACTG Acacia Research Corp 10,620 3,389 7,231 42 13 2931 ACHC Acadia Healthcare Co Inc 5,835 2,248 3,587 23 9 1432 ACAD ACADIA Pharmaceuticals Inc 135,678 85,045 50,633 538 337 20133 AXDX Accelerate Diagnostics Inc 10,948 4,374 6,574 43 17 2634 XLRN Acceleron Pharma Inc 3,811 2,206 1,605 15 9 635 ACN Accenture PLC 102,755 49,946 52,809 408 198 21036 ACCO ACCO Brands Corp 175 151 24 1 1 037 ARAY Accuray Inc 20,293 17,702 2,591 81 70 1038 ACW Accuride Corp 986 711 275 4 3 139 ACRX AcelRx Pharmaceuticals Inc 9,638 7,647 1,991 38 30 840 ACET Aceto Corp 1,469 999 470 6 4 241 ACHN Achillion Pharmaceuticals Inc 223,855 138,506 85,349 888 550 33942 ACIW ACI Worldwide Inc 5,704 2,324 3,380 23 9 1343 ACOR Acorda Therapeutics Inc 4,998 2,685 2,313 20 11 944 ACFN Acorn Energy Inc 1 0 1 0 0 045 ATNM Actinium Pharmaceuticals Inc 14,473 11,849 2,624 57 47 1046 ACPW Active Power Inc 26 26 0 0 0 047 ATVI Activision Blizzard Inc 345,401 269,480 75,921 1,371 1,069 30148 ACTA Actua Corp 294 191 103 3 2 149 ATU Actuant Corp 4,148 1,553 2,595 16 6 1050 AYI Acuity Brands Inc 9,689 4,089 5,600 38 16 2251 ACUR Acura Pharmaceuticals Inc 580 530 50 2 2 052 ACXM Acxiom Corp 10,140 9,985 155 40 40 153 ADMP Adamis Pharmaceuticals Corp 1,563 1,460 103 6 6 054 PEO Adams Natural Resources Fund Inc 779 437 342 3 2 155 ADK AdCare Health Systems Inc 5,592 5,360 232 22 21 156 AGRO Adecoagro SA 1,375 1,289 86 5 5 057 ADEP Adept Technology Inc 1,679 1,254 425 7 5 258 ADPT Adeptus Health Inc 15,157 9,327 5,830 114 70 4459 ADBE Adobe Systems Inc 241,771 142,214 99,557 959 564 39560 ADT ADT Corp/The 72,090 54,133 17,957 286 215 7161 ADTN ADTRAN Inc 19,687 9,124 10,563 78 36 4262 AAP Advance Auto Parts Inc 48,811 22,634 26,177 194 90 10463 ADES Advanced Emissions Solutions Inc 3,991 2,713 1,278 16 11 564 AEIS Advanced Energy Industries Inc 1,933 1,646 287 8 7 1
CBOE Equity Options Volume (Includes LEAPS®)
Contract Volume Average Daily Volume
Page 8

Standard Symbol Stock Total Call Put Total Call Put
CBOE Equity Options Volume (Includes LEAPS®)
Contract Volume Average Daily Volume
65 AMD Advanced Micro Devices Inc 860,245 384,405 475,840 3,414 1,525 1,88866 ASX Advanced Semiconductor Engineering Inc 663 548 115 3 2 067 AAV Advantage Oil & Gas Ltd 1,851 948 903 7 4 468 ADXS Advaxis Inc 38,298 21,409 16,889 152 85 6769 ADVS Advent Software Inc 13,205 9,832 3,373 52 39 1370 AAVL Adverum Biotechnologies Inc 11,916 8,745 3,171 90 66 2471 ABCO Advisory Board Co/The 2,634 1,534 1,100 10 6 472 ACM AECOM 39,590 7,041 32,549 157 28 12973 ANW Aegean Marine Petroleum Network Inc 2,141 1,516 625 8 6 274 AEGR Aegerion Pharmaceuticals Inc 29,894 22,582 7,312 119 90 2975 AEGN Aegion Corp 116 106 10 0 0 076 AEG Aegon NV 1,560 1,057 503 6 4 277 AER AerCap Holdings NV 49,443 36,857 12,586 196 146 5078 AERI Aerie Pharmaceuticals Inc 32,078 21,546 10,532 131 88 4379 HIVE Aerohive Networks Inc 1,282 949 333 5 4 180 AJRD Aerojet Rocketdyne Holdings Inc 2,399 2,022 377 10 8 181 GY Aerojet Rocketdyne Holdings Inc 546 462 84 2 2 082 ARO Aeropostale Inc 125,740 110,036 15,704 499 437 6283 AVAV Aerovironment Inc 6,368 4,967 1,401 25 20 684 AES AES Corp/VA 25,016 7,114 17,902 99 28 7185 AET Aetna Inc 291,234 180,573 110,661 1,156 717 43986 AMG Affiliated Managers Group Inc 3,278 1,456 1,822 13 6 787 AFFX Affymetrix Inc 8,668 6,926 1,742 34 27 788 AFL Aflac Inc 86,929 62,914 24,015 345 250 9589 MITT AG Mortgage Investment Trust Inc 468 230 238 2 1 190 AGCO AGCO Corp 19,051 10,406 8,645 76 41 3491 AGEN Agenus Inc 31,769 23,793 7,976 126 94 3292 A Agilent Technologies Inc 100,256 76,842 23,414 398 305 9393 AGYS Agilysys Inc 44 31 13 0 0 094 AGIO Agios Pharmaceuticals Inc 34,376 16,896 17,480 136 67 6995 GAS AGL Resources Inc 3,987 1,695 2,292 16 7 996 AEM Agnico Eagle Mines Ltd 156,224 111,566 44,658 620 443 17797 ADC Agree Realty Corp 443 378 65 2 2 098 AGU Agrium Inc 38,983 19,962 19,021 155 79 7599 AL Air Lease Corp 5,918 4,568 1,350 23 18 5100 AIRM Air Methods Corp 10,085 3,139 6,946 40 12 28101 APD Air Products & Chemicals Inc 84,368 48,957 35,411 335 194 141102 ATSG Air Transport Services Group Inc 943 793 150 7 6 1103 AYR Aircastle Ltd 1,898 1,421 477 8 6 2104 ARG Airgas Inc 21,715 18,400 3,315 86 73 13105 AMCN AirMedia Group Inc 47,303 30,276 17,027 188 120 68106 AIXG AIXTRON SE 284 137 147 1 1 1107 AKS AK Steel Holding Corp 290,339 184,964 105,375 1,152 734 418108 AKAM Akamai Technologies Inc 152,112 92,031 60,081 604 365 238109 AKBA Akebia Therapeutics Inc 9,804 6,583 3,221 86 58 28110 AKRX Akorn Inc 55,750 38,977 16,773 221 155 67111 AGI Alamos Gold Inc 11,350 10,234 1,116 45 41 4112 ALRM Alarm.com Holdings Inc 1,959 1,276 683 17 11 6113 ALK Alaska Air Group Inc 66,642 41,141 25,501 264 163 101114 ALSK Alaska Communications Systems Group Inc 2,087 1,598 489 8 6 2115 AIN Albany International Corp 223 150 73 1 1 0116 AMRI Albany Molecular Research Inc 4,539 3,635 904 18 14 4117 ALB Albemarle Corp 11,807 7,844 3,963 47 31 16118 ALU Alcatel-Lucent SA 258,921 218,535 40,386 1,027 867 160119 AA Alcoa Inc 1,835,571 1,135,171 700,400 7,284 4,505 2,779120 ADHD Alcobra Ltd 9,735 6,516 3,219 39 26 13121 ALDR Alder Biopharmaceuticals Inc 2,919 1,990 929 26 17 8122 ALR Alere Inc 3,454 2,324 1,130 14 9 4123 ALEX Alexander & Baldwin Inc 132 74 58 1 0 0124 ARE Alexandria Real Estate Equities Inc 885 683 202 4 3 1125 AXU Alexco Resource Corp 5 0 5 0 0 0126 ALXN Alexion Pharmaceuticals Inc 80,488 42,542 37,946 319 169 151127 ALXA Alexza Pharmaceuticals Inc 986 885 101 4 4 0128 BABA Alibaba Group Holding Ltd 5,550,767 3,348,932 2,201,835 22,027 13,289 8,737
Page 9

Standard Symbol Stock Total Call Put Total Call Put
CBOE Equity Options Volume (Includes LEAPS®)
Contract Volume Average Daily Volume
129 ALGN Align Technology Inc 19,734 9,026 10,708 78 36 42130 ALIM Alimera Sciences Inc 5,778 4,802 976 23 19 4131 ALKS Alkermes PLC 27,678 17,750 9,928 110 70 39132 ATI Allegheny Technologies Inc 24,667 15,788 8,879 98 63 35133 ALGT Allegiant Travel Co 4,671 1,920 2,751 19 8 11134 ALLE Allegion PLC 9,329 1,483 7,846 37 6 31135 ACT Allergan plc 147,633 91,714 55,919 586 364 222136 AGN Allergan plc 357,391 189,034 168,357 1,418 750 668137 ADS Alliance Data Systems Corp 6,822 3,869 2,953 27 15 12138 AFOP Alliance Fiber Optic Products Inc 5,809 4,501 1,308 23 18 5139 ARLP Alliance Resource Partners LP 15,300 9,977 5,323 61 40 21140 AB AllianceBernstein Holding LP 9,795 8,580 1,215 39 34 5141 AWH Allied World Assurance Co Holdings AG 1,917 1,413 504 8 6 2142 ALQA Alliqua BioMedical Inc 1,813 1,227 586 7 5 2143 ALSN Allison Transmission Holdings Inc 2,435 1,576 859 10 6 3144 ALLT Allot Communications Ltd 798 536 262 3 2 1145 MDRX Allscripts Healthcare Solutions Inc 49,220 28,575 20,645 195 113 82146 ALL Allstate Corp/The 58,602 29,734 28,868 233 118 115147 ALLY Ally Financial Inc 95,856 65,791 30,065 380 261 119148 AAU Almaden Minerals Ltd 88 36 52 0 0 0149 AFAM Almost Family Inc 1,479 1,070 409 6 4 2150 ALNY Alnylam Pharmaceuticals Inc 21,687 12,869 8,818 86 51 35151 ALJ Alon USA Energy Inc 2,140 1,190 950 8 5 4152 ALDW Alon USA Partners LP 6,362 4,387 1,975 25 17 8153 AOSL Alpha & Omega Semiconductor Ltd 109 99 10 0 0 0154 ANR Alpha Natural Resources Inc 42,488 24,037 18,451 169 95 73155 APT Alpha Pro Tech Ltd 1,368 998 370 5 4 1156 GOOG Alphabet Inc 1,130,307 612,138 518,169 4,485 2,429 2,056157 GOOGL Alphabet Inc 1,487,278 873,508 613,770 5,902 3,466 2,436158 ATEC Alphatec Holdings Inc 57 57 0 0 0 0159 ALTR Altera Corp 476,438 224,431 252,007 1,891 891 1,000160 ASPS Altisource Portfolio Solutions SA 40,520 19,813 20,707 161 79 82161 RESI Altisource Residential Corp 14,586 6,069 8,517 58 24 34162 AIMC Altra Industrial Motion Corp 18 17 1 0 0 0163 MO Altria Group Inc 360,040 230,463 129,577 1,429 915 514164 ACH Aluminum Corp of China Ltd 3,428 2,286 1,142 14 9 5165 AMAG AMAG Pharmaceuticals Inc 6,692 4,562 2,130 27 18 8166 AMRN Amarin Corp PLC 58,868 51,301 7,567 234 204 30167 AYA Amaya Inc 3,107 1,896 1,211 89 54 35168 AMZN Amazon.com Inc 3,728,373 1,952,357 1,776,016 14,795 7,747 7,048169 AMBC Ambac Financial Group Inc 38,915 32,198 6,717 154 128 27170 AMBA Ambarella Inc 659,223 360,081 299,142 2,616 1,429 1,187171 EPAX Ambassadors Group Inc 52 34 18 0 0 0172 AMBR Amber Road Inc 258 166 92 1 1 0173 ABEV Ambev SA 6,925 5,482 1,443 27 22 6174 AMC AMC Entertainment Holdings Inc 7,579 5,168 2,411 30 21 10175 AMCX AMC Networks Inc 8,443 3,858 4,585 34 15 18176 DOX Amdocs Ltd 1,727 1,332 395 7 5 2177 AMFW Amec Foster Wheeler PLC 313 214 99 2 2 1178 AMED Amedisys Inc 8,652 4,696 3,956 34 19 16179 AEE Ameren Corp 2,631 1,863 768 10 7 3180 AMRC Ameresco Inc 281 129 152 1 1 1181 ATAX America First Multifamily Investors LP 160 25 135 2 0 2182 AMX America Movil SAB de CV 46,483 26,223 20,260 184 104 80183 AAL American Airlines Group Inc 2,783,535 1,849,884 933,651 11,046 7,341 3,705184 APP American Apparel LLC 346 278 68 1 1 0185 AXL American Axle & Manufacturing Holdings Inc 38,960 28,164 10,796 155 112 43186 ACC American Campus Communities Inc 322 254 68 1 1 0187 AGNC American Capital Agency Corp 74,386 48,637 25,749 295 193 102188 ACAS American Capital Ltd 143,172 94,415 48,757 568 375 193189 MTGE American Capital Mortgage Investment Corp 1,160 302 858 5 1 3190 AMZG American Eagle Energy Corp 190 190 0 1 1 0191 AEO American Eagle Outfitters Inc 247,232 164,016 83,216 981 651 330192 AEP American Electric Power Co Inc 74,188 65,183 9,005 294 259 36
Page 10
Standard Symbol Stock Total Call Put Total Call Put
CBOE Equity Options Volume (Includes LEAPS®)
Contract Volume Average Daily Volume
193 AEL American Equity Investment Life Holding Co 1,161 51 1,110 11 0 11194 AXP American Express Co 721,550 373,561 347,989 2,863 1,482 1,381195 AMH American Homes 4 Rent 2,036 1,870 166 8 7 1196 AIG American International Group Inc 754,876 465,276 289,600 2,996 1,846 1,149197 AMID American Midstream Partners LP 28,973 8,402 20,571 115 33 82198 APEI American Public Education Inc 3,138 825 2,313 12 3 9199 ARII American Railcar Industries Inc 8,857 3,927 4,930 35 16 20200 ARPI American Residential Properties Inc 4,107 3,541 566 16 14 2201 ASEI American Science & Engineering Inc 1,417 913 504 6 4 2202 AMSWA American Software Inc/GA 29 29 0 0 0 0203 AWR American States Water Co 589 451 138 2 2 1204 AMSC American Superconductor Corp 7,970 6,938 1,032 32 28 4205 AMT American Tower Corp 82,635 53,121 29,514 328 211 117206 AVD American Vanguard Corp 1,192 852 340 5 3 1207 AWK American Water Works Co Inc 10,139 9,371 768 40 37 3208 AMWD American Woodmark Corp 3,249 2,314 935 13 9 4209 CRMT America's Car-Mart Inc/TX 857 357 500 3 1 2210 APU AmeriGas Partners LP 3,914 2,482 1,432 16 10 6211 AMP Ameriprise Financial Inc 10,907 6,560 4,347 43 26 17212 ABCB Ameris Bancorp 34 15 19 0 0 0213 ABC AmerisourceBergen Corp 44,679 23,760 20,919 177 94 83214 AME AMETEK Inc 4,154 1,128 3,026 16 4 12215 AMGN Amgen Inc 435,958 259,649 176,309 1,730 1,030 700216 FOLD Amicus Therapeutics Inc 65,785 45,185 20,600 261 179 82217 ANFI Amira Nature Foods Ltd 38,464 13,953 24,511 153 55 97218 AMKR Amkor Technology Inc 29,790 21,335 8,455 118 85 34219 AHS AMN Healthcare Services Inc 7,440 5,346 2,094 30 21 8220 APH Amphenol Corp 23,779 20,024 3,755 94 79 15221 AMPE Ampio Pharmaceuticals Inc 29,746 20,851 8,895 118 83 35222 BETR Amplify Snack Brands Inc 2,113 1,078 1,035 24 12 12223 ASYS Amtech Systems Inc 295 258 37 1 1 0224 AFSI AmTrust Financial Services Inc 34,435 14,441 19,994 137 57 79225 AMRS Amyris Inc 1,823 1,134 689 7 5 3226 ANAC Anacor Pharmaceuticals Inc 33,602 21,799 11,803 133 87 47227 APC Anadarko Petroleum Corp 579,964 391,182 188,782 2,301 1,552 749228 ANAD ANADIGICS Inc 8,204 6,194 2,010 33 25 8229 ADI Analog Devices Inc 124,025 66,831 57,194 492 265 227230 ALOG Analogic Corp 717 463 254 3 2 1231 AVXL Anavex Life Sciences Corp 13,480 10,509 2,971 385 300 85232 ANDE Andersons Inc/The 854 418 436 3 2 2233 ANGI Angie's List Inc 24,125 15,346 8,779 96 61 35234 AU AngloGold Ashanti Ltd 48,459 32,586 15,873 192 129 63235 BUD Anheuser-Busch InBev SA/NV 143,388 88,208 55,180 569 350 219236 ANIP ANI Pharmaceuticals Inc 11,837 7,970 3,867 49 33 16237 ANIK Anika Therapeutics Inc 5,754 3,158 2,596 23 13 10238 AXE Anixter International Inc 1,652 1,246 406 7 5 2239 ANN ANN Inc 14,023 9,976 4,047 56 40 16240 NLY Annaly Capital Management Inc 185,247 126,373 58,874 735 501 234241 ANSS ANSYS Inc 2,800 1,828 972 11 7 4242 ATRS Antares Pharma Inc 7,590 5,453 2,137 30 22 8243 AM Antero Midstream Partners LP 5,978 2,923 3,055 24 12 12244 AR Antero Resources Corp 16,189 8,353 7,836 64 33 31245 ANTM Anthem Inc 52,785 24,712 28,073 209 98 111246 ANTH Anthera Pharmaceuticals Inc 18,069 12,339 5,730 72 49 23247 ANH Anworth Mortgage Asset Corp 223 116 107 1 0 0248 AOL AOL Inc 47,219 31,778 15,441 187 126 61249 AON Aon PLC 9,933 4,306 5,627 39 17 22250 APA Apache Corp 239,295 137,327 101,968 950 545 405251 AIV Apartment Investment & Management Co 628 359 269 2 1 1252 APAGF Apco Oil and Gas International Inc 476 469 7 2 2 0253 APIC Apigee Corp 1,385 1,075 310 15 12 3254 APOG Apogee Enterprises Inc 4,017 2,499 1,518 16 10 6255 ARI Apollo Commercial Real Estate Finance Inc 835 690 145 6 5 1256 APOL Apollo Education Group Inc 87,162 44,797 42,365 346 178 168
Page 11

Standard Symbol Stock Total Call Put Total Call Put
CBOE Equity Options Volume (Includes LEAPS®)
Contract Volume Average Daily Volume
257 APO Apollo Global Management LLC 52,126 27,513 24,613 207 109 98258 AINV Apollo Investment Corp 4,253 1,986 2,267 17 8 9259 AMTG Apollo Residential Mortgage Inc 757 383 374 3 2 1260 AAPL Apple Inc 48,589,665 29,596,093 18,993,572 192,816 117,445 75,371261 APDN Applied DNA Sciences Inc 4,224 2,885 1,339 84 58 27262 AMAT Applied Materials Inc 855,424 601,645 253,779 3,395 2,387 1,007263 AMCC Applied Micro Circuits Corp 22,179 4,751 17,428 88 19 69264 AAOI Applied Optoelectronics Inc 3,223 1,368 1,855 24 10 14265 AREX Approach Resources Inc 9,023 5,666 3,357 36 22 13266 APRI Apricus Biosciences Inc 2,493 1,115 1,378 10 4 5267 ATR AptarGroup Inc 588 422 166 2 2 1268 WTR Aqua America Inc 1,634 1,066 568 6 4 2269 ARMK Aramark 7,799 6,073 1,726 31 24 7270 PETX Aratana Therapeutics Inc 856 577 279 3 2 1271 ABR Arbor Realty Trust Inc 560 481 79 2 2 0272 ABUS Arbutus Biopharma Corp 781 553 228 3 2 1273 TKMR Arbutus Biopharma Corp 23,514 18,496 5,018 93 73 20274 ARC ARC Document Solutions Inc 5,270 5,115 155 21 20 1275 ARCB ArcBest Corp 1,454 623 831 6 2 3276 MT ArcelorMittal 136,803 63,973 72,830 543 254 289277 ACGL Arch Capital Group Ltd 3,506 3,269 237 14 13 1278 ACI Arch Coal Inc 223,267 112,413 110,854 886 446 440279 ADM Archer-Daniels-Midland Co 101,541 51,182 50,359 403 203 200280 AROC Archrock Inc 79 74 5 0 0 0281 EXH Archrock Inc 11,692 5,400 6,292 46 21 25282 APLP Archrock Partners LP 401 130 271 2 1 1283 EXLP Archrock Partners LP 2,271 893 1,378 9 4 5284 ARCO Arcos Dorados Holdings Inc 8,026 4,994 3,032 32 20 12285 ASC Ardmore Shipping Corp 4,197 4,098 99 17 16 0286 ARNA Arena Pharmaceuticals Inc 91,776 72,044 19,732 364 286 78287 ARCC Ares Capital Corp 20,234 8,941 11,293 80 35 45288 ACRE Ares Commercial Real Estate Corp 56 56 0 0 0 0289 ARES Ares Management LP 528 174 354 2 1 1290 ARIA ARIAD Pharmaceuticals Inc 161,498 120,605 40,893 641 479 162291 ANET Arista Networks Inc 72,197 35,159 37,038 286 140 147292 AI Arlington Asset Investment Corp 7,646 2,499 5,147 30 10 20293 ARMH ARM Holdings PLC 104,780 48,300 56,480 416 192 224294 AHH Armada Hoffler Properties Inc 218 90 128 1 0 1295 ARR ARMOUR Residential REIT Inc 8,838 4,608 4,230 35 18 17296 AWI Armstrong World Industries Inc 2,417 1,500 917 10 6 4297 ARTX Arotech Corp 1,086 110 976 9 1 8298 ARQL ArQule Inc 1,010 957 53 4 4 0299 ARRY Array BioPharma Inc 70,084 45,042 25,042 278 179 99300 ARRS ARRIS International PLC 21,102 9,503 11,599 84 38 46301 ARW Arrow Electronics Inc 11,044 1,037 10,007 44 4 40302 ARWR Arrowhead Pharmaceuticals Inc 76,482 55,847 20,635 304 222 82303 ARTNA Artesian Resources Corp 266 125 141 1 0 1304 AJG Arthur J Gallagher & Co 1,624 1,268 356 6 5 1305 APAM Artisan Partners Asset Management Inc 436 374 62 2 1 0306 ARUN Aruba Networks Inc 52,631 39,578 13,053 209 157 52307 ASA ASA Gold and Precious Metals Ltd 576 410 166 2 2 1308 AKG Asanko Gold Inc 932 582 350 4 2 1309 ABG Asbury Automotive Group Inc 5,849 2,550 3,299 23 10 13310 ASNA Ascena Retail Group Inc 165,335 74,559 90,776 656 296 360311 ASTI Ascent Solar Technologies Inc 620 420 200 2 2 1312 AHP Ashford Hospitality Prime Inc 1,759 1,542 217 20 17 2313 AHT Ashford Hospitality Trust Inc 1,040 550 490 4 2 2314 ASH Ashland Inc 23,854 16,438 7,416 95 65 29315 ASMI ASM International NV 267 113 154 1 0 1316 ASMIY ASM International NV 12 6 6 0 0 0317 ASML ASML Holding NV 50,193 9,305 40,888 199 37 162318 AHL Aspen Insurance Holdings Ltd 51 51 0 0 0 0319 AZPN Aspen Technology Inc 6,451 5,481 970 26 22 4320 ASB Associated Banc-Corp 1,150 622 528 5 2 2
Page 12

Standard Symbol Stock Total Call Put Total Call Put
CBOE Equity Options Volume (Includes LEAPS®)
Contract Volume Average Daily Volume
321 AEC Associated Estates Realty Corp 3,525 1,303 2,222 14 5 9322 AIZ Assurant Inc 3,144 1,516 1,628 12 6 6323 AGO Assured Guaranty Ltd 160,177 36,227 123,950 636 144 492324 ASFI Asta Funding Inc 758 653 105 7 6 1325 ASTE Astec Industries Inc 449 268 181 2 1 1326 AF Astoria Financial Corp 554 485 69 2 2 0327 AZN AstraZeneca PLC 76,286 55,774 20,512 303 221 81328 ASTC Astrotech Corp 283 278 5 1 1 0329 T AT&T Inc 3,554,443 2,129,763 1,424,680 14,105 8,451 5,653330 ATHN athenahealth Inc 50,612 22,944 27,668 201 91 110331 ATHX Athersys Inc 55,171 34,973 20,198 219 139 80332 AT Atlantic Power Corp 2,914 2,002 912 12 8 4333 ATNI Atlantic Tele-Network Inc 57 39 18 0 0 0334 ATLC Atlanticus Holdings Corp 109 96 13 0 0 0335 AAWW Atlas Air Worldwide Holdings Inc 3,372 1,668 1,704 13 7 7336 ATLS Atlas Energy Group LLC 5,300 3,221 2,079 47 29 19337 ARP Atlas Resource Partners LP 33,914 18,336 15,578 135 73 62338 TEAM Atlassian Corp PLC 223 217 6 25 24 1339 ATML Atmel Corp 157,812 136,113 21,699 626 540 86340 ATO Atmos Energy Corp 372 234 138 1 1 1341 ATW Atwood Oceanics Inc 29,907 16,091 13,816 119 64 55342 AUO AU Optronics Corp 3,518 2,339 1,179 14 9 5343 ADNC Audience Inc 554 474 80 2 2 0344 AUDC AudioCodes Ltd 375 318 57 1 1 0345 AUQ AuRico Gold Inc 46,097 44,680 1,417 183 177 6346 ABTL Autobytel Inc 2,957 2,282 675 12 9 3347 ADSK Autodesk Inc 175,454 82,902 92,552 696 329 367348 ATHM Autohome Inc 23,157 13,856 9,301 92 55 37349 ALV Autoliv Inc 2,270 1,465 805 9 6 3350 ADP Automatic Data Processing Inc 31,664 22,254 9,410 126 88 37351 AN AutoNation Inc 27,276 21,193 6,083 108 84 24352 AZO AutoZone Inc 45,149 21,604 23,545 179 86 93353 AUXL Auxilium Pharmaceuticals Inc 2,754 2,299 455 11 9 2354 AVHI AV Homes Inc 2,435 1,350 1,085 10 5 4355 AVL Avalon Advanced Materials Inc 33 32 1 0 0 0356 AVB AvalonBay Communities Inc 11,736 8,480 3,256 47 34 13357 AVNR Avanir Pharmaceuticals Inc 2,600 1,230 1,370 10 5 5358 AVEO AVEO Pharmaceuticals Inc 10,771 9,543 1,228 43 38 5359 AVY Avery Dennison Corp 1,963 1,539 424 8 6 2360 AVG AVG Technologies NV 9,576 5,008 4,568 38 20 18361 AVH Avianca Holdings SA 6,779 5,504 1,275 27 22 5362 BOTA Aviragen Therapeutics Inc 610 542 68 2 2 0363 CAR Avis Budget Group Inc 105,495 69,748 35,747 419 277 142364 AVA Avista Corp 1,031 348 683 4 1 3365 AVIV Aviv REIT Inc 22 12 10 0 0 0366 AVT Avnet Inc 15,462 7,627 7,835 61 30 31367 AVP Avon Products Inc 295,110 120,095 175,015 1,171 477 695368 AVX AVX Corp 242 40 202 1 0 1369 AWRE Aware Inc 371 334 37 1 1 0370 AXTA Axalta Coating Systems Ltd 37,054 21,570 15,484 147 86 61371 ACLS Axcelis Technologies Inc 2,109 1,954 155 8 8 1372 AXLL Axiall Corp 39,465 28,975 10,490 157 115 42373 AXS Axis Capital Holdings Ltd 6,895 4,150 2,745 27 16 11374 AXGN AxoGen Inc 4 4 0 0 0 0375 AXON Axovant Sciences Ltd 9,363 5,580 3,783 70 42 28376 AXTI AXT Inc 352 221 131 1 1 1377 AZUR Azure Midstream Partners LP 6,126 994 5,132 54 9 45378 AZZ AZZ Inc 787 477 310 3 2 1379 BGS B&G Foods Inc 8,024 6,322 1,702 32 25 7380 BEAV B/E Aerospace Inc 67,037 59,608 7,429 266 237 29381 BMI Badger Meter Inc 1,718 1,143 575 7 5 2382 BIDU Baidu Inc 1,537,952 855,756 682,196 6,103 3,396 2,707383 BHI Baker Hughes Inc 131,432 62,392 69,040 522 248 274384 BCPC Balchem Corp 91 71 20 0 0 0
Page 13
Standard Symbol Stock Total Call Put Total Call Put
CBOE Equity Options Volume (Includes LEAPS®)
Contract Volume Average Daily Volume
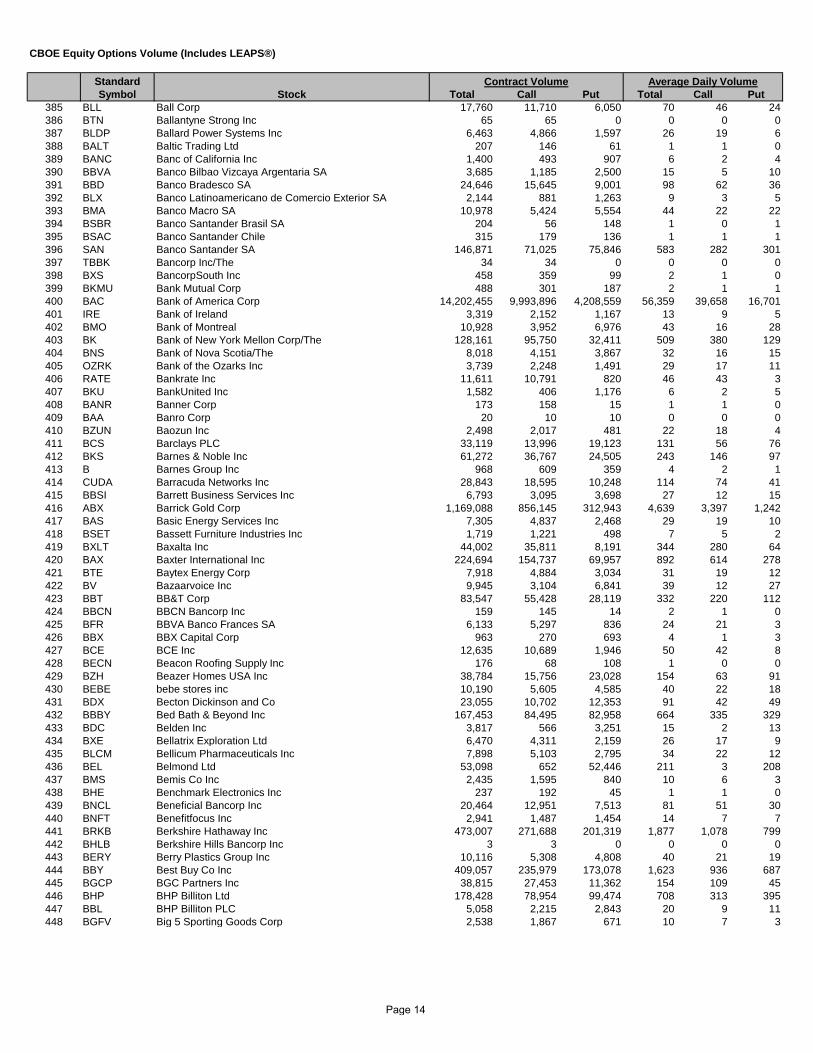
385 BLL Ball Corp 17,760 11,710 6,050 70 46 24386 BTN Ballantyne Strong Inc 65 65 0 0 0 0387 BLDP Ballard Power Systems Inc 6,463 4,866 1,597 26 19 6388 BALT Baltic Trading Ltd 207 146 61 1 1 0389 BANC Banc of California Inc 1,400 493 907 6 2 4390 BBVA Banco Bilbao Vizcaya Argentaria SA 3,685 1,185 2,500 15 5 10391 BBD Banco Bradesco SA 24,646 15,645 9,001 98 62 36392 BLX Banco Latinoamericano de Comercio Exterior SA 2,144 881 1,263 9 3 5393 BMA Banco Macro SA 10,978 5,424 5,554 44 22 22394 BSBR Banco Santander Brasil SA 204 56 148 1 0 1395 BSAC Banco Santander Chile 315 179 136 1 1 1396 SAN Banco Santander SA 146,871 71,025 75,846 583 282 301397 TBBK Bancorp Inc/The 34 34 0 0 0 0398 BXS BancorpSouth Inc 458 359 99 2 1 0399 BKMU Bank Mutual Corp 488 301 187 2 1 1400 BAC Bank of America Corp 14,202,455 9,993,896 4,208,559 56,359 39,658 16,701401 IRE Bank of Ireland 3,319 2,152 1,167 13 9 5402 BMO Bank of Montreal 10,928 3,952 6,976 43 16 28403 BK Bank of New York Mellon Corp/The 128,161 95,750 32,411 509 380 129404 BNS Bank of Nova Scotia/The 8,018 4,151 3,867 32 16 15405 OZRK Bank of the Ozarks Inc 3,739 2,248 1,491 29 17 11406 RATE Bankrate Inc 11,611 10,791 820 46 43 3407 BKU BankUnited Inc 1,582 406 1,176 6 2 5408 BANR Banner Corp 173 158 15 1 1 0409 BAA Banro Corp 20 10 10 0 0 0410 BZUN Baozun Inc 2,498 2,017 481 22 18 4411 BCS Barclays PLC 33,119 13,996 19,123 131 56 76412 BKS Barnes & Noble Inc 61,272 36,767 24,505 243 146 97413 B Barnes Group Inc 968 609 359 4 2 1414 CUDA Barracuda Networks Inc 28,843 18,595 10,248 114 74 41415 BBSI Barrett Business Services Inc 6,793 3,095 3,698 27 12 15416 ABX Barrick Gold Corp 1,169,088 856,145 312,943 4,639 3,397 1,242417 BAS Basic Energy Services Inc 7,305 4,837 2,468 29 19 10418 BSET Bassett Furniture Industries Inc 1,719 1,221 498 7 5 2419 BXLT Baxalta Inc 44,002 35,811 8,191 344 280 64420 BAX Baxter International Inc 224,694 154,737 69,957 892 614 278421 BTE Baytex Energy Corp 7,918 4,884 3,034 31 19 12422 BV Bazaarvoice Inc 9,945 3,104 6,841 39 12 27423 BBT BB&T Corp 83,547 55,428 28,119 332 220 112424 BBCN BBCN Bancorp Inc 159 145 14 2 1 0425 BFR BBVA Banco Frances SA 6,133 5,297 836 24 21 3426 BBX BBX Capital Corp 963 270 693 4 1 3427 BCE BCE Inc 12,635 10,689 1,946 50 42 8428 BECN Beacon Roofing Supply Inc 176 68 108 1 0 0429 BZH Beazer Homes USA Inc 38,784 15,756 23,028 154 63 91430 BEBE bebe stores inc 10,190 5,605 4,585 40 22 18431 BDX Becton Dickinson and Co 23,055 10,702 12,353 91 42 49432 BBBY Bed Bath & Beyond Inc 167,453 84,495 82,958 664 335 329433 BDC Belden Inc 3,817 566 3,251 15 2 13434 BXE Bellatrix Exploration Ltd 6,470 4,311 2,159 26 17 9435 BLCM Bellicum Pharmaceuticals Inc 7,898 5,103 2,795 34 22 12436 BEL Belmond Ltd 53,098 652 52,446 211 3 208437 BMS Bemis Co Inc 2,435 1,595 840 10 6 3438 BHE Benchmark Electronics Inc 237 192 45 1 1 0439 BNCL Beneficial Bancorp Inc 20,464 12,951 7,513 81 51 30440 BNFT Benefitfocus Inc 2,941 1,487 1,454 14 7 7441 BRKB Berkshire Hathaway Inc 473,007 271,688 201,319 1,877 1,078 799442 BHLB Berkshire Hills Bancorp Inc 3 3 0 0 0 0443 BERY Berry Plastics Group Inc 10,116 5,308 4,808 40 21 19444 BBY Best Buy Co Inc 409,057 235,979 173,078 1,623 936 687445 BGCP BGC Partners Inc 38,815 27,453 11,362 154 109 45446 BHP BHP Billiton Ltd 178,428 78,954 99,474 708 313 395447 BBL BHP Billiton PLC 5,058 2,215 2,843 20 9 11448 BGFV Big 5 Sporting Goods Corp 2,538 1,867 671 10 7 3
Page 14

Standard Symbol Stock Total Call Put Total Call Put
CBOE Equity Options Volume (Includes LEAPS®)
Contract Volume Average Daily Volume
449 BIG Big Lots Inc 25,280 11,070 14,210 100 44 56450 BBG Bill Barrett Corp 27,330 12,767 14,563 108 51 58451 BCRX BioCryst Pharmaceuticals Inc 27,425 20,643 6,782 109 82 27452 BIOD Biodel Inc 255 201 54 1 1 0453 BDSI BioDelivery Sciences International Inc 56,040 34,438 21,602 222 137 86454 BIIB Biogen Inc 403,667 211,324 192,343 1,602 839 763455 BMRN BioMarin Pharmaceutical Inc 90,683 51,312 39,371 360 204 156456 BMR BioMed Realty Trust Inc 3,685 2,660 1,025 15 11 4457 BIO Bio-Rad Laboratories Inc 1,597 844 753 6 3 3458 BRLI Bio-Reference Laboratories Inc 9,650 5,114 4,536 38 20 18459 BIOS BioScrip Inc 3,985 2,034 1,951 16 8 8460 BEAT BioTelemetry Inc 5,620 3,768 1,852 22 15 7461 BTX BioTime Inc 8,547 7,566 981 34 30 4462 BITA Bitauto Holdings Ltd 68,137 39,108 29,029 270 155 115463 BJRI BJ's Restaurants Inc 8,714 5,790 2,924 35 23 12464 BBOX Black Box Corp 136 73 63 1 0 0465 BDE Black Diamond Inc 458 411 47 5 5 1466 BSM Black Stone Minerals LP 1,649 1,140 509 11 7 3467 BLKB Blackbaud Inc 374 182 192 1 1 1468 BBRY BlackBerry Ltd 1,457,375 986,209 471,166 5,783 3,914 1,870469 HAWK Blackhawk Network Holdings Inc 8,213 5,570 2,643 33 22 10470 BKCC BlackRock Capital Investment Corp 1,354 1,166 188 5 5 1471 BLK BlackRock Inc 35,598 13,787 21,811 141 55 87472 BTT BlackRock Municipal 2030 Target Term Trust 108 48 60 0 0 0473 BX Blackstone Group LP/The 735,901 373,418 362,483 2,920 1,482 1,438474 BXMT Blackstone Mortgage Trust Inc 15,433 10,486 4,947 61 42 20475 BLMN Bloomin' Brands Inc 14,680 6,835 7,845 58 27 31476 BLT Blount International Inc 307 244 63 1 1 0477 BCOR Blucora Inc 6,426 2,833 3,593 26 11 14478 BUFF Blue Buffalo Pet Products Inc 8,600 6,683 1,917 82 64 18479 BHBK Blue Hills Bancorp Inc 15 15 0 0 0 0480 NILE Blue Nile Inc 8,963 4,150 4,813 36 16 19481 BLUE Bluebird Bio Inc 75,157 44,403 30,754 298 176 122482 BKEP Blueknight Energy Partners LP 172 73 99 1 1 1483 BTH Blyth Inc 1,381 404 977 5 2 4484 STCK BMC Stock Holdings Inc 49 41 8 0 0 0485 BNCN BNC Bancorp 344 317 27 1 1 0486 BWP Boardwalk Pipeline Partners LP 27,641 18,805 8,836 110 75 35487 BOBE Bob Evans Farms Inc/DE 14,097 6,376 7,721 56 25 31488 BA Boeing Co/The 947,914 450,137 497,777 3,762 1,786 1,975489 BOFI BofI Holding Inc 34,625 11,810 22,815 137 47 91490 WIFI Boingo Wireless Inc 9,944 8,636 1,308 39 34 5491 BCC Boise Cascade Co 4,044 3,006 1,038 16 12 4492 BOJA Bojangles' Inc 9,371 6,142 3,229 60 39 21493 BOKF BOK Financial Corp 3,034 458 2,576 12 2 10494 BONA Bona Film Group Ltd 19,937 14,913 5,024 79 59 20495 BCEI Bonanza Creek Energy Inc 29,640 22,374 7,266 118 89 29496 BONT Bon-Ton Stores Inc/The 3,047 1,222 1,825 12 5 7497 BOOT Boot Barn Holdings Inc 744 566 178 7 5 2498 BAH Booz Allen Hamilton Holding Corp 966 587 379 4 2 2499 BWA BorgWarner Inc 17,667 9,664 8,003 70 38 32500 SAM Boston Beer Co Inc/The 14,821 7,741 7,080 59 31 28501 BPFH Boston Private Financial Holdings Inc 49 5 44 0 0 0502 BXP Boston Properties Inc 9,536 3,983 5,553 38 16 22503 BSX Boston Scientific Corp 165,192 114,494 50,698 656 454 201504 EPAY Bottomline Technologies de Inc 286 168 118 1 1 0505 BDBD Boulder Brands Inc 12,407 8,949 3,458 49 36 14506 BOX Box Inc 58,513 38,090 20,423 252 164 88507 BYD Boyd Gaming Corp 38,437 32,628 5,809 153 129 23508 BP BP PLC 738,125 457,831 280,294 2,929 1,817 1,112509 BPT BP Prudhoe Bay Royalty Trust 28,011 11,278 16,733 111 45 66510 BPZ BPZ Resources Inc 1 1 0 0 0 0511 BRC Brady Corp 399 226 173 2 1 1512 BDN Brandywine Realty Trust 789 578 211 3 2 1
Page 15

Standard Symbol Stock Total Call Put Total Call Put
CBOE Equity Options Volume (Includes LEAPS®)
Contract Volume Average Daily Volume
513 BAK Braskem SA 2,313 2,052 261 9 8 1514 BBRG Bravo Brio Restaurant Group Inc 79 64 15 0 0 0515 BBEP Breitburn Energy Partners LP 64,576 40,034 24,542 256 159 97516 BRFS BRF SA 8,066 7,696 370 32 31 1517 BPI Bridgepoint Education Inc 4,176 837 3,339 17 3 13518 BGG Briggs & Stratton Corp 3,999 1,998 2,001 16 8 8519 BFAM Bright Horizons Family Solutions Inc 635 552 83 3 2 0520 BCOV Brightcove Inc 21,723 1,755 19,968 86 7 79521 EAT Brinker International Inc 28,062 9,256 18,806 111 37 75522 BCO Brink's Co/The 2,081 1,069 1,012 8 4 4523 BMY Bristol-Myers Squibb Co 693,589 492,146 201,443 2,752 1,953 799524 BRS Bristow Group Inc 2,973 811 2,162 12 3 9525 BTI British American Tobacco PLC 3,226 2,508 718 13 10 3526 BRCM Broadcom Corp 288,059 195,080 92,979 1,143 774 369527 AVGO Broadcom Ltd 378,020 203,272 174,748 1,500 807 693528 BR Broadridge Financial Solutions Inc 2,213 1,561 652 9 6 3529 BSFT BroadSoft Inc 2,714 1,717 997 11 7 4530 BWEN Broadwind Energy Inc 124 78 46 0 0 0531 BRCD Brocade Communications Systems Inc 54,634 40,350 14,284 217 160 57532 BKD Brookdale Senior Living Inc 55,907 34,712 21,195 222 138 84533 BAM Brookfield Asset Management Inc 2,528 1,148 1,380 10 5 5534 BIP Brookfield Infrastructure Partners LP 4,506 2,149 2,357 18 9 9535 BPY Brookfield Property Partners LP 332 65 267 3 1 3536 BRKL Brookline Bancorp Inc 1,428 1,423 5 6 6 0537 BRKS Brooks Automation Inc 374 330 44 1 1 0538 BRO Brown & Brown Inc 283 261 22 1 1 0539 BFB Brown-Forman Corporation - CL B 5,735 3,179 2,556 23 13 10540 BRKR Bruker Corp 17,949 14,663 3,286 71 58 13541 BC Brunswick Corp/DE 16,430 14,850 1,580 65 59 6542 BSQR BSQUARE Corp 3,860 3,212 648 15 13 3543 BPL Buckeye Partners LP 9,421 6,749 2,672 37 27 11544 BKE Buckle Inc/The 10,901 1,686 9,215 43 7 37545 BWLD Buffalo Wild Wings Inc 85,400 39,605 45,795 339 157 182546 BBW Build-A-Bear Workshop Inc 6,271 3,401 2,870 25 13 11547 BLDR Builders FirstSource Inc 13,306 4,332 8,974 53 17 36548 BG Bunge Ltd 61,694 29,362 32,332 245 117 128549 BURL Burlington Stores Inc 48,654 30,367 18,287 193 121 73550 BWC BWX Technologies Inc 1,310 1,079 231 5 4 1551 BWXT BWX Technologies Inc 530 115 415 2 0 2552 CJES C&J Energy Services Ltd 23,577 8,152 15,425 94 32 61553 CA CA Inc 84,417 70,989 13,428 335 282 53554 CAB Cabela's Inc 19,120 12,236 6,884 76 49 27555 CVC Cablevision Systems Corp 109,125 82,173 26,952 433 326 107556 CCMP Cabot Microelectronics Corp 226 100 126 1 0 1557 COG Cabot Oil & Gas Corp 72,845 49,382 23,463 289 196 93558 CACI CACI International Inc 932 529 403 4 2 2559 CDNS Cadence Design Systems Inc 8,204 7,478 726 33 30 3560 CDZI Cadiz Inc 3,514 1,540 1,974 14 6 8561 CACQ Caesars Acquisition Co 1,432 446 986 6 2 4562 CZR Caesars Entertainment Corp 157,655 63,804 93,851 626 253 372563 CSTE Caesarstone Sdot-Yam Ltd 21,787 14,964 6,823 86 59 27564 PRSS CafePress Inc 28 28 0 0 0 0565 CAI CAI International Inc 90 58 32 0 0 0566 CAP CAI International Inc 261 196 65 1 1 0567 CLBS Caladrius Biosciences Inc 714 498 216 3 2 1568 NBS Caladrius Biosciences Inc 2,088 1,530 558 8 6 2569 CLMS Calamos Asset Management Inc 666 482 184 3 2 1570 CAMP CalAmp Corp 11,782 6,746 5,036 47 27 20571 CAA CalAtlantic Group Inc 7,391 6,308 1,083 29 25 4572 SPF CalAtlantic Group Inc 7,882 3,751 4,131 31 15 16573 BWS Caleres Inc 646 297 349 3 1 1574 CAL Caleres Inc 428 270 158 2 1 1575 CCC Calgon Carbon Corp 1,052 294 758 4 1 3576 CRC California Resources Corp 82,617 40,653 41,964 328 161 167
Page 16

Standard Symbol Stock Total Call Put Total Call Put
CBOE Equity Options Volume (Includes LEAPS®)
Contract Volume Average Daily Volume
577 CWT California Water Service Group 190 60 130 1 0 1578 CALA Calithera Biosciences Inc 7,873 6,100 1,773 55 43 12579 CALX Calix Inc 4,199 3,454 745 17 14 3580 ELY Callaway Golf Co 7,111 3,230 3,881 28 13 15581 CALD Callidus Software Inc 5,338 3,229 2,109 21 13 8582 CPE Callon Petroleum Co 20,131 14,171 5,960 80 56 24583 CALM Cal-Maine Foods Inc 40,696 26,593 14,103 161 106 56584 CPN Calpine Corp 37,705 23,140 14,565 150 92 58585 CLMT Calumet Specialty Products Partners LP 12,913 7,226 5,687 51 29 23586 CPT Camden Property Trust 1,694 1,523 171 7 6 1587 CCJ Cameco Corp 113,645 80,622 33,023 451 320 131588 CAM Cameron International Corp 70,472 43,486 26,986 280 173 107589 CPB Campbell Soup Co 42,530 28,825 13,705 169 114 54590 CCG Campus Crest Communities Inc 2,968 2,627 341 12 10 1591 CAMT Camtek Ltd/Israel 1,697 152 1,545 7 1 6592 CM Canadian Imperial Bank of Commerce/Canada 4,327 1,282 3,045 17 5 12593 CNI Canadian National Railway Co 13,998 7,309 6,689 56 29 27594 CNQ Canadian Natural Resources Ltd 62,691 33,617 29,074 249 133 115595 CP Canadian Pacific Railway Ltd 40,297 19,487 20,810 160 77 83596 CSIQ Canadian Solar Inc 172,985 95,879 77,106 686 380 306597 CAJ Canon Inc 1,751 1,262 489 7 5 2598 CMN Cantel Medical Corp 429 395 34 2 2 0599 CPLA Capella Education Co 1,966 1,210 756 8 5 3600 CBF Capital Bank Financial Corp 301 201 100 1 1 0601 COF Capital One Financial Corp 141,308 75,946 65,362 561 301 259602 CPLP Capital Product Partners LP 4,352 3,606 746 17 14 3603 CSU Capital Senior Living Corp 10,699 792 9,907 42 3 39604 CFFN Capitol Federal Financial Inc 50 48 2 0 0 0605 CMO Capstead Mortgage Corp 779 214 565 3 1 2606 CARA Cara Therapeutics Inc 4,261 2,365 1,896 22 12 10607 CRR CARBO Ceramics Inc 35,542 17,791 17,751 141 71 70608 CARB Carbonite Inc 2,366 1,722 644 9 7 3609 CRDC Cardica Inc 146 140 6 1 1 0610 CFNL Cardinal Financial Corp 250 250 0 3 3 0611 CAH Cardinal Health Inc 49,212 25,867 23,345 195 103 93612 CRME Cardiome Pharma Corp 3,119 1,941 1,178 12 8 5613 CSII Cardiovascular Systems Inc 4,514 2,577 1,937 18 10 8614 CATM Cardtronics Inc 1,528 700 828 6 3 3615 CRCM Care.com Inc 459 334 125 4 3 1616 CECO Career Education Corp 13,072 9,999 3,073 52 40 12617 CFN CareFusion Corp 457 17 440 2 0 2618 CG Carlyle Group LP/The 21,323 8,565 12,758 85 34 51619 KMX CarMax Inc 102,705 56,411 46,294 408 224 184620 CKEC Carmike Cinemas Inc 4,162 1,231 2,931 17 5 12621 CCL Carnival Corp 75,412 44,783 30,629 299 178 122622 CRS Carpenter Technology Corp 2,241 1,336 905 9 5 4623 CSV Carriage Services Inc 912 488 424 4 2 2624 CRZO Carrizo Oil & Gas Inc 36,791 13,793 22,998 146 55 91625 TAST Carrols Restaurant Group Inc 579 449 130 5 4 1626 CRI Carter's Inc 7,992 4,469 3,523 32 18 14627 CWST Casella Waste Systems Inc 443 337 106 4 3 1628 CSH Cash America International Inc 4,802 2,691 2,111 19 11 8629 CSLT Castlight Health Inc 20,057 13,198 6,859 80 52 27630 CTLT Catalent Inc 1,585 942 643 6 4 3631 CBIO Catalyst Biosciences Inc 147 80 67 1 0 0632 TRGT Catalyst Biosciences Inc 291 251 40 1 1 0633 CPRX Catalyst Pharmaceuticals Inc 3,587 3,212 375 14 13 1634 CTRX Catamaran Corp 44,767 24,457 20,310 178 97 81635 CTT CatchMark Timber Trust Inc 65 40 25 1 0 0636 CAT Caterpillar Inc 1,390,040 611,967 778,073 5,516 2,428 3,088637 CATY Cathay General Bancorp 60 57 3 1 1 0638 CAVM Cavium Inc 58,694 32,484 26,210 233 129 104639 CBL CBL & Associates Properties Inc 4,684 3,151 1,533 19 13 6640 CBOE CBOE Holdings Inc 87,210 42,106 45,104 346 167 179
Page 17
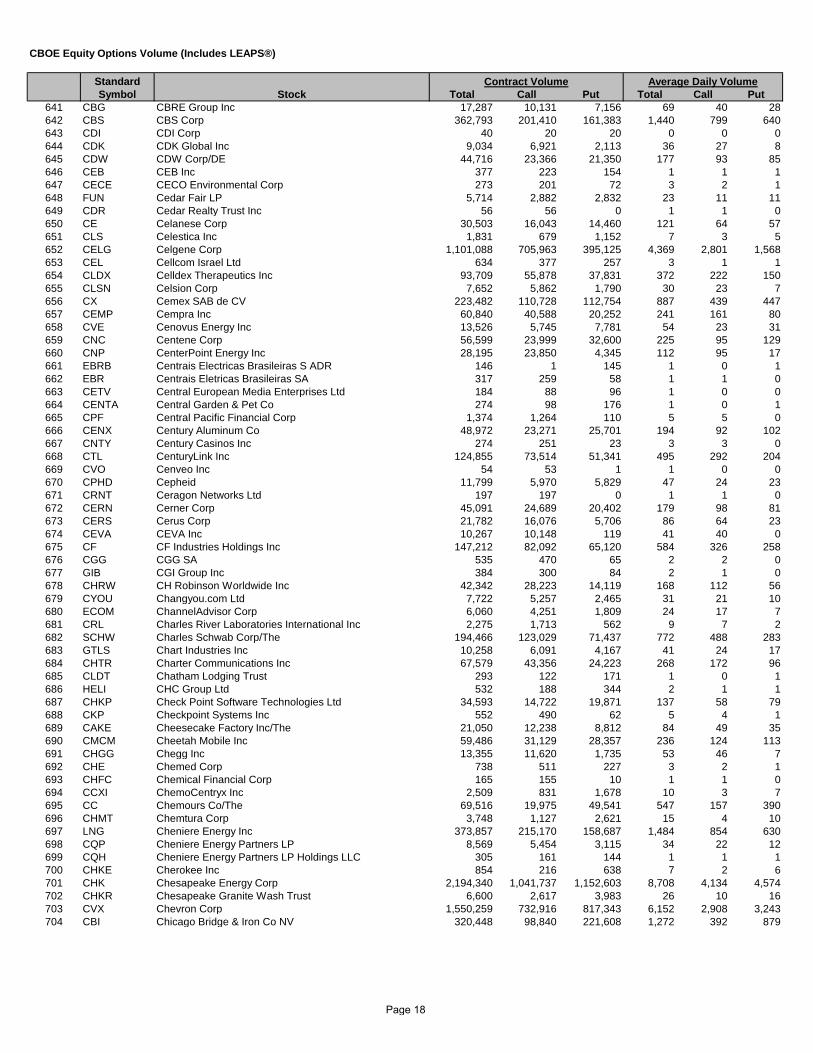
Standard Symbol Stock Total Call Put Total Call Put
CBOE Equity Options Volume (Includes LEAPS®)
Contract Volume Average Daily Volume
641 CBG CBRE Group Inc 17,287 10,131 7,156 69 40 28642 CBS CBS Corp 362,793 201,410 161,383 1,440 799 640643 CDI CDI Corp 40 20 20 0 0 0644 CDK CDK Global Inc 9,034 6,921 2,113 36 27 8645 CDW CDW Corp/DE 44,716 23,366 21,350 177 93 85646 CEB CEB Inc 377 223 154 1 1 1647 CECE CECO Environmental Corp 273 201 72 3 2 1648 FUN Cedar Fair LP 5,714 2,882 2,832 23 11 11649 CDR Cedar Realty Trust Inc 56 56 0 1 1 0650 CE Celanese Corp 30,503 16,043 14,460 121 64 57651 CLS Celestica Inc 1,831 679 1,152 7 3 5652 CELG Celgene Corp 1,101,088 705,963 395,125 4,369 2,801 1,568653 CEL Cellcom Israel Ltd 634 377 257 3 1 1654 CLDX Celldex Therapeutics Inc 93,709 55,878 37,831 372 222 150655 CLSN Celsion Corp 7,652 5,862 1,790 30 23 7656 CX Cemex SAB de CV 223,482 110,728 112,754 887 439 447657 CEMP Cempra Inc 60,840 40,588 20,252 241 161 80658 CVE Cenovus Energy Inc 13,526 5,745 7,781 54 23 31659 CNC Centene Corp 56,599 23,999 32,600 225 95 129660 CNP CenterPoint Energy Inc 28,195 23,850 4,345 112 95 17661 EBRB Centrais Electricas Brasileiras S ADR 146 1 145 1 0 1662 EBR Centrais Eletricas Brasileiras SA 317 259 58 1 1 0663 CETV Central European Media Enterprises Ltd 184 88 96 1 0 0664 CENTA Central Garden & Pet Co 274 98 176 1 0 1665 CPF Central Pacific Financial Corp 1,374 1,264 110 5 5 0666 CENX Century Aluminum Co 48,972 23,271 25,701 194 92 102667 CNTY Century Casinos Inc 274 251 23 3 3 0668 CTL CenturyLink Inc 124,855 73,514 51,341 495 292 204669 CVO Cenveo Inc 54 53 1 1 0 0670 CPHD Cepheid 11,799 5,970 5,829 47 24 23671 CRNT Ceragon Networks Ltd 197 197 0 1 1 0672 CERN Cerner Corp 45,091 24,689 20,402 179 98 81673 CERS Cerus Corp 21,782 16,076 5,706 86 64 23674 CEVA CEVA Inc 10,267 10,148 119 41 40 0675 CF CF Industries Holdings Inc 147,212 82,092 65,120 584 326 258676 CGG CGG SA 535 470 65 2 2 0677 GIB CGI Group Inc 384 300 84 2 1 0678 CHRW CH Robinson Worldwide Inc 42,342 28,223 14,119 168 112 56679 CYOU Changyou.com Ltd 7,722 5,257 2,465 31 21 10680 ECOM ChannelAdvisor Corp 6,060 4,251 1,809 24 17 7681 CRL Charles River Laboratories International Inc 2,275 1,713 562 9 7 2682 SCHW Charles Schwab Corp/The 194,466 123,029 71,437 772 488 283683 GTLS Chart Industries Inc 10,258 6,091 4,167 41 24 17684 CHTR Charter Communications Inc 67,579 43,356 24,223 268 172 96685 CLDT Chatham Lodging Trust 293 122 171 1 0 1686 HELI CHC Group Ltd 532 188 344 2 1 1687 CHKP Check Point Software Technologies Ltd 34,593 14,722 19,871 137 58 79688 CKP Checkpoint Systems Inc 552 490 62 5 4 1689 CAKE Cheesecake Factory Inc/The 21,050 12,238 8,812 84 49 35690 CMCM Cheetah Mobile Inc 59,486 31,129 28,357 236 124 113691 CHGG Chegg Inc 13,355 11,620 1,735 53 46 7692 CHE Chemed Corp 738 511 227 3 2 1693 CHFC Chemical Financial Corp 165 155 10 1 1 0694 CCXI ChemoCentryx Inc 2,509 831 1,678 10 3 7695 CC Chemours Co/The 69,516 19,975 49,541 547 157 390696 CHMT Chemtura Corp 3,748 1,127 2,621 15 4 10697 LNG Cheniere Energy Inc 373,857 215,170 158,687 1,484 854 630698 CQP Cheniere Energy Partners LP 8,569 5,454 3,115 34 22 12699 CQH Cheniere Energy Partners LP Holdings LLC 305 161 144 1 1 1700 CHKE Cherokee Inc 854 216 638 7 2 6701 CHK Chesapeake Energy Corp 2,194,340 1,041,737 1,152,603 8,708 4,134 4,574702 CHKR Chesapeake Granite Wash Trust 6,600 2,617 3,983 26 10 16703 CVX Chevron Corp 1,550,259 732,916 817,343 6,152 2,908 3,243704 CBI Chicago Bridge & Iron Co NV 320,448 98,840 221,608 1,272 392 879
Page 18

Standard Symbol Stock Total Call Put Total Call Put
CBOE Equity Options Volume (Includes LEAPS®)
Contract Volume Average Daily Volume
705 CHS Chico's FAS Inc 29,640 12,891 16,749 118 51 66706 PLCE Children's Place Inc/The 22,683 15,668 7,015 90 62 28707 CIM Chimera Investment Corp 11,051 5,826 5,225 44 23 21708 CMRX Chimerix Inc 20,981 14,194 6,787 83 56 27709 CAAS China Automotive Systems Inc 1,023 565 458 4 2 2710 CBAK China BAK Battery Inc 346 283 63 1 1 0711 STV China Digital TV Holding Co Ltd 3,611 1,973 1,638 14 8 7712 DL China Distance Education Holdings Ltd 694 254 440 6 2 4713 JRJC China Finance Online Co Ltd 11,722 8,287 3,435 47 33 14714 CGA China Green Agriculture Inc 3,215 1,601 1,614 13 6 6715 CHLN China Housing & Land Development Inc 284 284 0 1 1 0716 CNIT China Information Technology Inc 248 223 25 1 1 0717 LFC China Life Insurance Co Ltd 48,785 23,811 24,974 194 94 99718 HTHT China Lodging Group Ltd 165 67 98 1 0 0719 MY China Ming Yang Wind Power Group Ltd 1,468 1,172 296 6 5 1720 CMGE China Mobile Games & Entertainment Group Ltd 53,789 28,372 25,417 376 198 178721 CHL China Mobile Ltd 39,593 24,609 14,984 157 98 59722 NPD China Nepstar Chain Drugstore Ltd 1,020 1,001 19 4 4 0723 BORN China New Borun Corp 128 128 0 1 1 0724 SNP China Petroleum & Chemical Corp 8,801 5,191 3,610 35 21 14725 CREG China Recycling Energy Corp 4 0 4 0 0 0726 ZNH China Southern Airlines Co Ltd 9,241 6,097 3,144 51 34 17727 CSUN China Sunergy Co Ltd 310 310 0 1 1 0728 CHU China Unicom Hong Kong Ltd 3,451 2,639 812 14 10 3729 CXDC China XD Plastics Co Ltd 2,703 1,718 985 11 7 4730 CYD China Yuchai International Ltd 960 675 285 4 3 1731 ZX China Zenix Auto International Ltd 371 371 0 1 1 0732 CCIH ChinaCache International Holdings Ltd 3,432 2,298 1,134 14 9 5733 IMOS ChipMOS TECHNOLOGIES Bermuda Ltd 13,621 11,565 2,056 54 46 8734 CMG Chipotle Mexican Grill Inc 540,810 247,863 292,947 2,146 984 1,162735 CQB Chiquita Brands International Inc 35 10 25 0 0 0736 CHH Choice Hotels International Inc 1,113 887 226 4 4 1737 CBK Christopher & Banks Corp 1,408 1,207 201 6 5 1738 ACE Chubb Ltd 29,074 17,105 11,969 115 68 47739 CB Chubb Ltd 14,488 4,433 10,055 57 18 40740 CHT Chunghwa Telecom Co Ltd 238 99 139 1 0 1741 CHD Church & Dwight Co Inc 1,393 1,215 178 6 5 1742 CHDN Churchill Downs Inc 963 498 465 4 2 2743 CHUY Chuy's Holdings Inc 5,824 4,181 1,643 23 17 7744 CBD Cia Brasileira de Distribuicao 517 416 101 2 2 0745 BVN Cia de Minas Buenaventura SAA 9,788 4,757 5,031 39 19 20746 SBS Cia de Saneamento Basico do Estado de Sao Paulo 2,017 598 1,419 8 2 6747 CIG Cia Energetica de Minas Gerais 10,416 4,224 6,192 41 17 25748 ELP Cia Paranaense de Energia 581 168 413 2 1 2749 SID Cia Siderurgica Nacional SA 6,604 3,030 3,574 26 12 14750 CBR Ciber Inc 72 36 36 1 0 0751 CIEN Ciena Corp 245,993 171,641 74,352 976 681 295752 CI Cigna Corp 117,123 84,274 32,849 465 334 130753 XEC Cimarex Energy Co 42,608 24,462 18,146 169 97 72754 CIMT Cimatron Ltd 460 455 5 2 2 0755 CMPR Cimpress NV 10,267 4,016 6,251 41 16 25756 CBB Cincinnati Bell Inc 5,485 5,388 97 22 21 0757 CINF Cincinnati Financial Corp 1,087 762 325 4 3 1758 CNK Cinemark Holdings Inc 1,582 335 1,247 6 1 5759 CTAS Cintas Corp 211,660 207,092 4,568 840 822 18760 CIR CIRCOR International Inc 241 167 74 1 1 0761 CRUS Cirrus Logic Inc 140,598 77,527 63,071 558 308 250762 CSCO Cisco Systems Inc 2,413,519 1,653,760 759,759 9,577 6,563 3,015763 CIT CIT Group Inc 28,422 17,980 10,442 113 71 41764 CTRN Citi Trends Inc 398 226 172 2 1 1765 C Citigroup Inc 3,702,051 2,293,579 1,408,472 14,691 9,102 5,589766 CFG Citizens Financial Group Inc 19,297 8,549 10,748 77 34 43767 CIA Citizens Inc/TX 1,826 655 1,171 14 5 9768 CTXS Citrix Systems Inc 70,004 37,510 32,494 278 149 129
Page 19
Standard Symbol Stock Total Call Put Total Call Put
CBOE Equity Options Volume (Includes LEAPS®)
Contract Volume Average Daily Volume
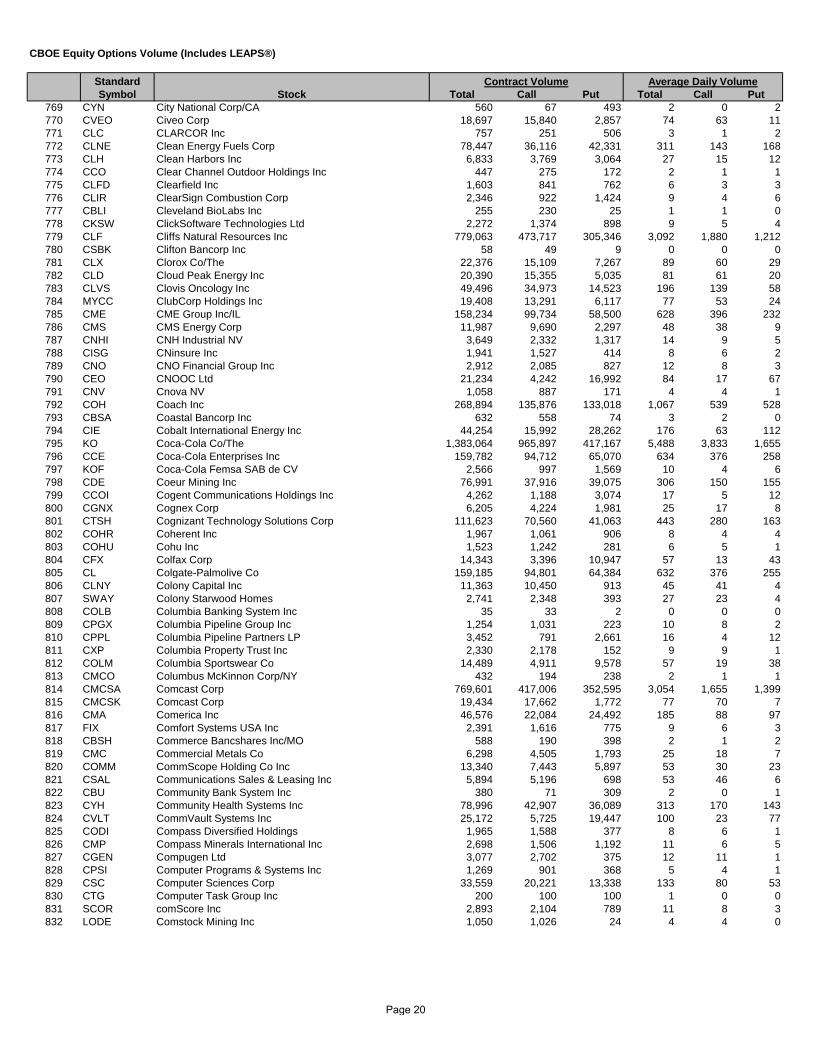
769 CYN City National Corp/CA 560 67 493 2 0 2770 CVEO Civeo Corp 18,697 15,840 2,857 74 63 11771 CLC CLARCOR Inc 757 251 506 3 1 2772 CLNE Clean Energy Fuels Corp 78,447 36,116 42,331 311 143 168773 CLH Clean Harbors Inc 6,833 3,769 3,064 27 15 12774 CCO Clear Channel Outdoor Holdings Inc 447 275 172 2 1 1775 CLFD Clearfield Inc 1,603 841 762 6 3 3776 CLIR ClearSign Combustion Corp 2,346 922 1,424 9 4 6777 CBLI Cleveland BioLabs Inc 255 230 25 1 1 0778 CKSW ClickSoftware Technologies Ltd 2,272 1,374 898 9 5 4779 CLF Cliffs Natural Resources Inc 779,063 473,717 305,346 3,092 1,880 1,212780 CSBK Clifton Bancorp Inc 58 49 9 0 0 0781 CLX Clorox Co/The 22,376 15,109 7,267 89 60 29782 CLD Cloud Peak Energy Inc 20,390 15,355 5,035 81 61 20783 CLVS Clovis Oncology Inc 49,496 34,973 14,523 196 139 58784 MYCC ClubCorp Holdings Inc 19,408 13,291 6,117 77 53 24785 CME CME Group Inc/IL 158,234 99,734 58,500 628 396 232786 CMS CMS Energy Corp 11,987 9,690 2,297 48 38 9787 CNHI CNH Industrial NV 3,649 2,332 1,317 14 9 5788 CISG CNinsure Inc 1,941 1,527 414 8 6 2789 CNO CNO Financial Group Inc 2,912 2,085 827 12 8 3790 CEO CNOOC Ltd 21,234 4,242 16,992 84 17 67791 CNV Cnova NV 1,058 887 171 4 4 1792 COH Coach Inc 268,894 135,876 133,018 1,067 539 528793 CBSA Coastal Bancorp Inc 632 558 74 3 2 0794 CIE Cobalt International Energy Inc 44,254 15,992 28,262 176 63 112795 KO Coca-Cola Co/The 1,383,064 965,897 417,167 5,488 3,833 1,655796 CCE Coca-Cola Enterprises Inc 159,782 94,712 65,070 634 376 258797 KOF Coca-Cola Femsa SAB de CV 2,566 997 1,569 10 4 6798 CDE Coeur Mining Inc 76,991 37,916 39,075 306 150 155799 CCOI Cogent Communications Holdings Inc 4,262 1,188 3,074 17 5 12800 CGNX Cognex Corp 6,205 4,224 1,981 25 17 8801 CTSH Cognizant Technology Solutions Corp 111,623 70,560 41,063 443 280 163802 COHR Coherent Inc 1,967 1,061 906 8 4 4803 COHU Cohu Inc 1,523 1,242 281 6 5 1804 CFX Colfax Corp 14,343 3,396 10,947 57 13 43805 CL Colgate-Palmolive Co 159,185 94,801 64,384 632 376 255806 CLNY Colony Capital Inc 11,363 10,450 913 45 41 4807 SWAY Colony Starwood Homes 2,741 2,348 393 27 23 4808 COLB Columbia Banking System Inc 35 33 2 0 0 0809 CPGX Columbia Pipeline Group Inc 1,254 1,031 223 10 8 2810 CPPL Columbia Pipeline Partners LP 3,452 791 2,661 16 4 12811 CXP Columbia Property Trust Inc 2,330 2,178 152 9 9 1812 COLM Columbia Sportswear Co 14,489 4,911 9,578 57 19 38813 CMCO Columbus McKinnon Corp/NY 432 194 238 2 1 1814 CMCSA Comcast Corp 769,601 417,006 352,595 3,054 1,655 1,399815 CMCSK Comcast Corp 19,434 17,662 1,772 77 70 7816 CMA Comerica Inc 46,576 22,084 24,492 185 88 97817 FIX Comfort Systems USA Inc 2,391 1,616 775 9 6 3818 CBSH Commerce Bancshares Inc/MO 588 190 398 2 1 2819 CMC Commercial Metals Co 6,298 4,505 1,793 25 18 7820 COMM CommScope Holding Co Inc 13,340 7,443 5,897 53 30 23821 CSAL Communications Sales & Leasing Inc 5,894 5,196 698 53 46 6822 CBU Community Bank System Inc 380 71 309 2 0 1823 CYH Community Health Systems Inc 78,996 42,907 36,089 313 170 143824 CVLT CommVault Systems Inc 25,172 5,725 19,447 100 23 77825 CODI Compass Diversified Holdings 1,965 1,588 377 8 6 1826 CMP Compass Minerals International Inc 2,698 1,506 1,192 11 6 5827 CGEN Compugen Ltd 3,077 2,702 375 12 11 1828 CPSI Computer Programs & Systems Inc 1,269 901 368 5 4 1829 CSC Computer Sciences Corp 33,559 20,221 13,338 133 80 53830 CTG Computer Task Group Inc 200 100 100 1 0 0831 SCOR comScore Inc 2,893 2,104 789 11 8 3832 LODE Comstock Mining Inc 1,050 1,026 24 4 4 0
Page 20
Standard Symbol Stock Total Call Put Total Call Put
CBOE Equity Options Volume (Includes LEAPS®)
Contract Volume Average Daily Volume
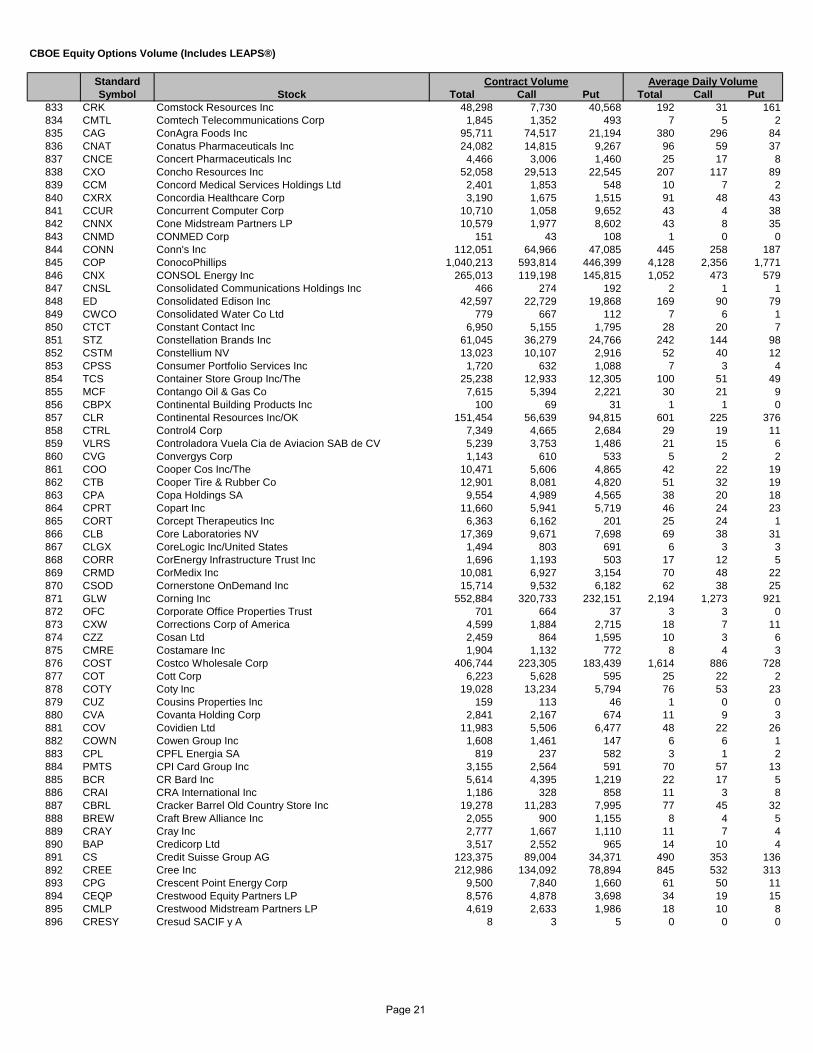
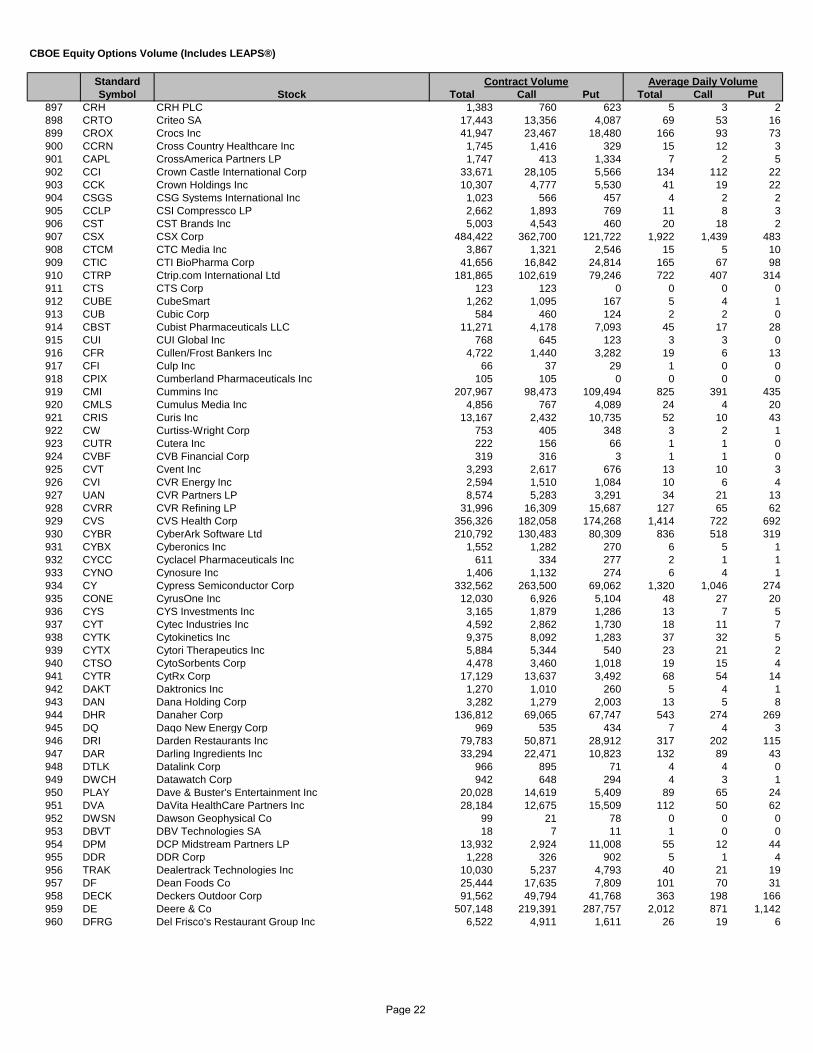
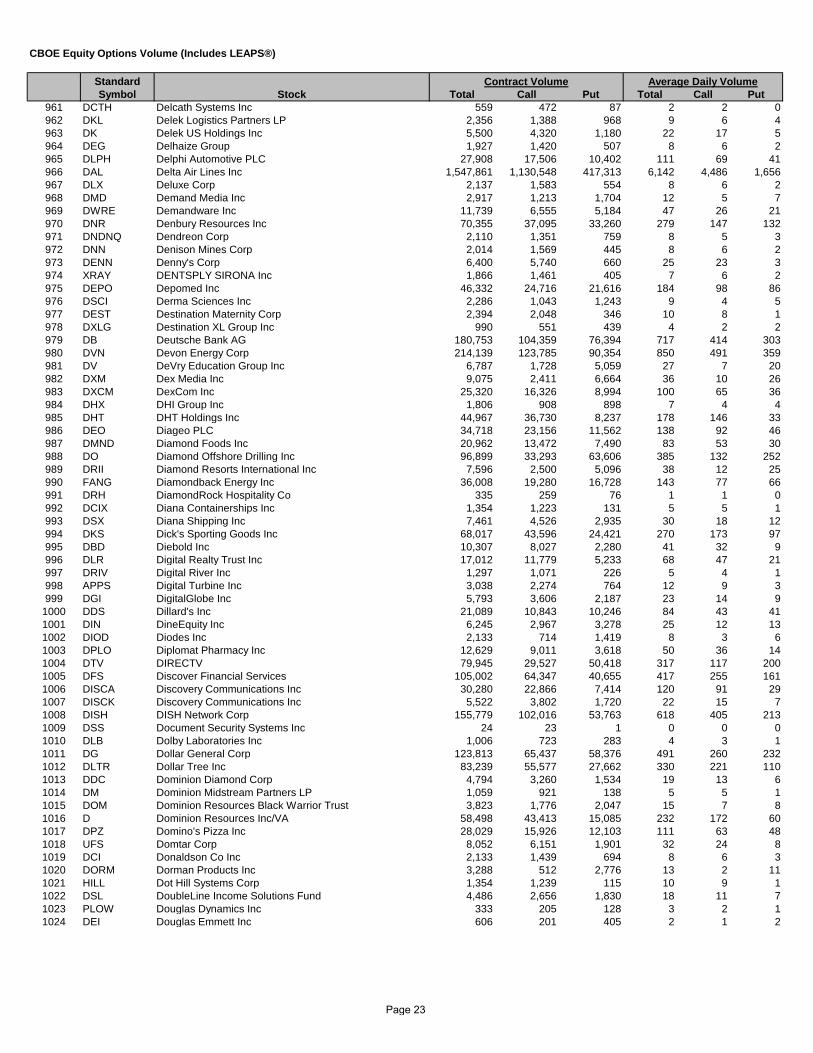
833 CRK Comstock Resources Inc 48,298 7,730 40,568 192 31 161834 CMTL Comtech Telecommunications Corp 1,845 1,352 493 7 5 2835 CAG ConAgra Foods Inc 95,711 74,517 21,194 380 296 84836 CNAT Conatus Pharmaceuticals Inc 24,082 14,815 9,267 96 59 37837 CNCE Concert Pharmaceuticals Inc 4,466 3,006 1,460 25 17 8838 CXO Concho Resources Inc 52,058 29,513 22,545 207 117 89839 CCM Concord Medical Services Holdings Ltd 2,401 1,853 548 10 7 2840 CXRX Concordia Healthcare Corp 3,190 1,675 1,515 91 48 43841 CCUR Concurrent Computer Corp 10,710 1,058 9,652 43 4 38842 CNNX Cone Midstream Partners LP 10,579 1,977 8,602 43 8 35843 CNMD CONMED Corp 151 43 108 1 0 0844 CONN Conn's Inc 112,051 64,966 47,085 445 258 187845 COP ConocoPhillips 1,040,213 593,814 446,399 4,128 2,356 1,771846 CNX CONSOL Energy Inc 265,013 119,198 145,815 1,052 473 579847 CNSL Consolidated Communications Holdings Inc 466 274 192 2 1 1848 ED Consolidated Edison Inc 42,597 22,729 19,868 169 90 79849 CWCO Consolidated Water Co Ltd 779 667 112 7 6 1850 CTCT Constant Contact Inc 6,950 5,155 1,795 28 20 7851 STZ Constellation Brands Inc 61,045 36,279 24,766 242 144 98852 CSTM Constellium NV 13,023 10,107 2,916 52 40 12853 CPSS Consumer Portfolio Services Inc 1,720 632 1,088 7 3 4854 TCS Container Store Group Inc/The 25,238 12,933 12,305 100 51 49855 MCF Contango Oil & Gas Co 7,615 5,394 2,221 30 21 9856 CBPX Continental Building Products Inc 100 69 31 1 1 0857 CLR Continental Resources Inc/OK 151,454 56,639 94,815 601 225 376858 CTRL Control4 Corp 7,349 4,665 2,684 29 19 11859 VLRS Controladora Vuela Cia de Aviacion SAB de CV 5,239 3,753 1,486 21 15 6860 CVG Convergys Corp 1,143 610 533 5 2 2861 COO Cooper Cos Inc/The 10,471 5,606 4,865 42 22 19862 CTB Cooper Tire & Rubber Co 12,901 8,081 4,820 51 32 19863 CPA Copa Holdings SA 9,554 4,989 4,565 38 20 18864 CPRT Copart Inc 11,660 5,941 5,719 46 24 23865 CORT Corcept Therapeutics Inc 6,363 6,162 201 25 24 1866 CLB Core Laboratories NV 17,369 9,671 7,698 69 38 31867 CLGX CoreLogic Inc/United States 1,494 803 691 6 3 3868 CORR CorEnergy Infrastructure Trust Inc 1,696 1,193 503 17 12 5869 CRMD CorMedix Inc 10,081 6,927 3,154 70 48 22870 CSOD Cornerstone OnDemand Inc 15,714 9,532 6,182 62 38 25871 GLW Corning Inc 552,884 320,733 232,151 2,194 1,273 921872 OFC Corporate Office Properties Trust 701 664 37 3 3 0873 CXW Corrections Corp of America 4,599 1,884 2,715 18 7 11874 CZZ Cosan Ltd 2,459 864 1,595 10 3 6875 CMRE Costamare Inc 1,904 1,132 772 8 4 3876 COST Costco Wholesale Corp 406,744 223,305 183,439 1,614 886 728877 COT Cott Corp 6,223 5,628 595 25 22 2878 COTY Coty Inc 19,028 13,234 5,794 76 53 23879 CUZ Cousins Properties Inc 159 113 46 1 0 0880 CVA Covanta Holding Corp 2,841 2,167 674 11 9 3881 COV Covidien Ltd 11,983 5,506 6,477 48 22 26882 COWN Cowen Group Inc 1,608 1,461 147 6 6 1883 CPL CPFL Energia SA 819 237 582 3 1 2884 PMTS CPI Card Group Inc 3,155 2,564 591 70 57 13885 BCR CR Bard Inc 5,614 4,395 1,219 22 17 5886 CRAI CRA International Inc 1,186 328 858 11 3 8887 CBRL Cracker Barrel Old Country Store Inc 19,278 11,283 7,995 77 45 32888 BREW Craft Brew Alliance Inc 2,055 900 1,155 8 4 5889 CRAY Cray Inc 2,777 1,667 1,110 11 7 4890 BAP Credicorp Ltd 3,517 2,552 965 14 10 4891 CS Credit Suisse Group AG 123,375 89,004 34,371 490 353 136892 CREE Cree Inc 212,986 134,092 78,894 845 532 313893 CPG Crescent Point Energy Corp 9,500 7,840 1,660 61 50 11894 CEQP Crestwood Equity Partners LP 8,576 4,878 3,698 34 19 15895 CMLP Crestwood Midstream Partners LP 4,619 2,633 1,986 18 10 8896 CRESY Cresud SACIF y A 8 3 5 0 0 0
Page 21
Standard Symbol Stock Total Call Put Total Call Put
CBOE Equity Options Volume (Includes LEAPS®)
Contract Volume Average Daily Volume
897 CRH CRH PLC 1,383 760 623 5 3 2898 CRTO Criteo SA 17,443 13,356 4,087 69 53 16899 CROX Crocs Inc 41,947 23,467 18,480 166 93 73900 CCRN Cross Country Healthcare Inc 1,745 1,416 329 15 12 3901 CAPL CrossAmerica Partners LP 1,747 413 1,334 7 2 5902 CCI Crown Castle International Corp 33,671 28,105 5,566 134 112 22903 CCK Crown Holdings Inc 10,307 4,777 5,530 41 19 22904 CSGS CSG Systems International Inc 1,023 566 457 4 2 2905 CCLP CSI Compressco LP 2,662 1,893 769 11 8 3906 CST CST Brands Inc 5,003 4,543 460 20 18 2907 CSX CSX Corp 484,422 362,700 121,722 1,922 1,439 483908 CTCM CTC Media Inc 3,867 1,321 2,546 15 5 10909 CTIC CTI BioPharma Corp 41,656 16,842 24,814 165 67 98910 CTRP Ctrip.com International Ltd 181,865 102,619 79,246 722 407 314911 CTS CTS Corp 123 123 0 0 0 0912 CUBE CubeSmart 1,262 1,095 167 5 4 1913 CUB Cubic Corp 584 460 124 2 2 0914 CBST Cubist Pharmaceuticals LLC 11,271 4,178 7,093 45 17 28915 CUI CUI Global Inc 768 645 123 3 3 0916 CFR Cullen/Frost Bankers Inc 4,722 1,440 3,282 19 6 13917 CFI Culp Inc 66 37 29 1 0 0918 CPIX Cumberland Pharmaceuticals Inc 105 105 0 0 0 0919 CMI Cummins Inc 207,967 98,473 109,494 825 391 435920 CMLS Cumulus Media Inc 4,856 767 4,089 24 4 20921 CRIS Curis Inc 13,167 2,432 10,735 52 10 43922 CW Curtiss-Wright Corp 753 405 348 3 2 1923 CUTR Cutera Inc 222 156 66 1 1 0924 CVBF CVB Financial Corp 319 316 3 1 1 0925 CVT Cvent Inc 3,293 2,617 676 13 10 3926 CVI CVR Energy Inc 2,594 1,510 1,084 10 6 4927 UAN CVR Partners LP 8,574 5,283 3,291 34 21 13928 CVRR CVR Refining LP 31,996 16,309 15,687 127 65 62929 CVS CVS Health Corp 356,326 182,058 174,268 1,414 722 692930 CYBR CyberArk Software Ltd 210,792 130,483 80,309 836 518 319931 CYBX Cyberonics Inc 1,552 1,282 270 6 5 1932 CYCC Cyclacel Pharmaceuticals Inc 611 334 277 2 1 1933 CYNO Cynosure Inc 1,406 1,132 274 6 4 1934 CY Cypress Semiconductor Corp 332,562 263,500 69,062 1,320 1,046 274935 CONE CyrusOne Inc 12,030 6,926 5,104 48 27 20936 CYS CYS Investments Inc 3,165 1,879 1,286 13 7 5937 CYT Cytec Industries Inc 4,592 2,862 1,730 18 11 7938 CYTK Cytokinetics Inc 9,375 8,092 1,283 37 32 5939 CYTX Cytori Therapeutics Inc 5,884 5,344 540 23 21 2940 CTSO CytoSorbents Corp 4,478 3,460 1,018 19 15 4941 CYTR CytRx Corp 17,129 13,637 3,492 68 54 14942 DAKT Daktronics Inc 1,270 1,010 260 5 4 1943 DAN Dana Holding Corp 3,282 1,279 2,003 13 5 8944 DHR Danaher Corp 136,812 69,065 67,747 543 274 269945 DQ Daqo New Energy Corp 969 535 434 7 4 3946 DRI Darden Restaurants Inc 79,783 50,871 28,912 317 202 115947 DAR Darling Ingredients Inc 33,294 22,471 10,823 132 89 43948 DTLK Datalink Corp 966 895 71 4 4 0949 DWCH Datawatch Corp 942 648 294 4 3 1950 PLAY Dave & Buster's Entertainment Inc 20,028 14,619 5,409 89 65 24951 DVA DaVita HealthCare Partners Inc 28,184 12,675 15,509 112 50 62952 DWSN Dawson Geophysical Co 99 21 78 0 0 0953 DBVT DBV Technologies SA 18 7 11 1 0 0954 DPM DCP Midstream Partners LP 13,932 2,924 11,008 55 12 44955 DDR DDR Corp 1,228 326 902 5 1 4956 TRAK Dealertrack Technologies Inc 10,030 5,237 4,793 40 21 19957 DF Dean Foods Co 25,444 17,635 7,809 101 70 31958 DECK Deckers Outdoor Corp 91,562 49,794 41,768 363 198 166959 DE Deere & Co 507,148 219,391 287,757 2,012 871 1,142960 DFRG Del Frisco's Restaurant Group Inc 6,522 4,911 1,611 26 19 6
Page 22
Standard Symbol Stock Total Call Put Total Call Put
CBOE Equity Options Volume (Includes LEAPS®)
Contract Volume Average Daily Volume
961 DCTH Delcath Systems Inc 559 472 87 2 2 0962 DKL Delek Logistics Partners LP 2,356 1,388 968 9 6 4963 DK Delek US Holdings Inc 5,500 4,320 1,180 22 17 5964 DEG Delhaize Group 1,927 1,420 507 8 6 2965 DLPH Delphi Automotive PLC 27,908 17,506 10,402 111 69 41966 DAL Delta Air Lines Inc 1,547,861 1,130,548 417,313 6,142 4,486 1,656967 DLX Deluxe Corp 2,137 1,583 554 8 6 2968 DMD Demand Media Inc 2,917 1,213 1,704 12 5 7969 DWRE Demandware Inc 11,739 6,555 5,184 47 26 21970 DNR Denbury Resources Inc 70,355 37,095 33,260 279 147 132971 DNDNQ Dendreon Corp 2,110 1,351 759 8 5 3972 DNN Denison Mines Corp 2,014 1,569 445 8 6 2973 DENN Denny's Corp 6,400 5,740 660 25 23 3974 XRAY DENTSPLY SIRONA Inc 1,866 1,461 405 7 6 2975 DEPO Depomed Inc 46,332 24,716 21,616 184 98 86976 DSCI Derma Sciences Inc 2,286 1,043 1,243 9 4 5977 DEST Destination Maternity Corp 2,394 2,048 346 10 8 1978 DXLG Destination XL Group Inc 990 551 439 4 2 2979 DB Deutsche Bank AG 180,753 104,359 76,394 717 414 303980 DVN Devon Energy Corp 214,139 123,785 90,354 850 491 359981 DV DeVry Education Group Inc 6,787 1,728 5,059 27 7 20982 DXM Dex Media Inc 9,075 2,411 6,664 36 10 26983 DXCM DexCom Inc 25,320 16,326 8,994 100 65 36984 DHX DHI Group Inc 1,806 908 898 7 4 4985 DHT DHT Holdings Inc 44,967 36,730 8,237 178 146 33986 DEO Diageo PLC 34,718 23,156 11,562 138 92 46987 DMND Diamond Foods Inc 20,962 13,472 7,490 83 53 30988 DO Diamond Offshore Drilling Inc 96,899 33,293 63,606 385 132 252989 DRII Diamond Resorts International Inc 7,596 2,500 5,096 38 12 25990 FANG Diamondback Energy Inc 36,008 19,280 16,728 143 77 66991 DRH DiamondRock Hospitality Co 335 259 76 1 1 0992 DCIX Diana Containerships Inc 1,354 1,223 131 5 5 1993 DSX Diana Shipping Inc 7,461 4,526 2,935 30 18 12994 DKS Dick's Sporting Goods Inc 68,017 43,596 24,421 270 173 97995 DBD Diebold Inc 10,307 8,027 2,280 41 32 9996 DLR Digital Realty Trust Inc 17,012 11,779 5,233 68 47 21997 DRIV Digital River Inc 1,297 1,071 226 5 4 1998 APPS Digital Turbine Inc 3,038 2,274 764 12 9 3999 DGI DigitalGlobe Inc 5,793 3,606 2,187 23 14 9
1000 DDS Dillard's Inc 21,089 10,843 10,246 84 43 411001 DIN DineEquity Inc 6,245 2,967 3,278 25 12 131002 DIOD Diodes Inc 2,133 714 1,419 8 3 61003 DPLO Diplomat Pharmacy Inc 12,629 9,011 3,618 50 36 141004 DTV DIRECTV 79,945 29,527 50,418 317 117 2001005 DFS Discover Financial Services 105,002 64,347 40,655 417 255 1611006 DISCA Discovery Communications Inc 30,280 22,866 7,414 120 91 291007 DISCK Discovery Communications Inc 5,522 3,802 1,720 22 15 71008 DISH DISH Network Corp 155,779 102,016 53,763 618 405 2131009 DSS Document Security Systems Inc 24 23 1 0 0 01010 DLB Dolby Laboratories Inc 1,006 723 283 4 3 11011 DG Dollar General Corp 123,813 65,437 58,376 491 260 2321012 DLTR Dollar Tree Inc 83,239 55,577 27,662 330 221 1101013 DDC Dominion Diamond Corp 4,794 3,260 1,534 19 13 61014 DM Dominion Midstream Partners LP 1,059 921 138 5 5 11015 DOM Dominion Resources Black Warrior Trust 3,823 1,776 2,047 15 7 81016 D Dominion Resources Inc/VA 58,498 43,413 15,085 232 172 601017 DPZ Domino's Pizza Inc 28,029 15,926 12,103 111 63 481018 UFS Domtar Corp 8,052 6,151 1,901 32 24 81019 DCI Donaldson Co Inc 2,133 1,439 694 8 6 31020 DORM Dorman Products Inc 3,288 512 2,776 13 2 111021 HILL Dot Hill Systems Corp 1,354 1,239 115 10 9 11022 DSL DoubleLine Income Solutions Fund 4,486 2,656 1,830 18 11 71023 PLOW Douglas Dynamics Inc 333 205 128 3 2 11024 DEI Douglas Emmett Inc 606 201 405 2 1 2
Page 23

Standard Symbol Stock Total Call Put Total Call Put
CBOE Equity Options Volume (Includes LEAPS®)
Contract Volume Average Daily Volume
1025 DOV Dover Corp 15,736 6,723 9,013 62 27 361026 DOW Dow Chemical Co/The 1,144,432 712,988 431,444 4,541 2,829 1,7121027 DHI DR Horton Inc 198,491 121,804 76,687 788 483 3041028 DPS Dr Pepper Snapple Group Inc 15,908 13,456 2,452 63 53 101029 RDY Dr Reddy's Laboratories Ltd 749 378 371 3 2 11030 DRWI DragonWave Inc 284 283 1 1 1 01031 DRD DRDGOLD Ltd 336 200 136 1 1 11032 DWA DreamWorks Animation SKG Inc 39,148 17,790 21,358 155 71 851033 DRC Dresser-Rand Group Inc 19,442 7,489 11,953 77 30 471034 DW Drew Industries Inc 544 156 388 2 1 21035 DRQ Dril-Quip Inc 2,810 729 2,081 11 3 81036 DRYS DryShips Inc 70,446 58,499 11,947 280 232 471037 DST DST Systems Inc 2,189 1,760 429 9 7 21038 DSW DSW Inc 37,849 28,195 9,654 150 112 381039 DTE DTE Energy Co 10,522 4,406 6,116 42 17 241040 DTSI DTS Inc/CA 1,362 729 633 5 3 31041 DCO Ducommun Inc 603 136 467 2 1 21042 DUK Duke Energy Corp 73,624 51,910 21,714 292 206 861043 DRE Duke Realty Corp 818 517 301 3 2 11044 DNB Dun & Bradstreet Corp/The 4,317 1,323 2,994 17 5 121045 DNKN Dunkin' Brands Group Inc 62,796 44,547 18,249 249 177 721046 DFT DuPont Fabros Technology Inc 1,849 1,221 628 7 5 21047 DXPE DXP Enterprises Inc 1,565 1,093 472 6 4 21048 DYAX Dyax Corp 32,277 16,509 15,768 128 66 631049 DY Dycom Industries Inc 14,983 7,879 7,104 59 31 281050 DLNG Dynagas LNG Partners LP 1,476 1,023 453 6 4 21051 BOOM Dynamic Materials Corp 96 39 57 0 0 01052 DVAX Dynavax Technologies Corp 8,586 5,867 2,719 34 23 111053 DYN Dynegy Inc 15,992 10,732 5,260 63 43 211054 DX Dynex Capital Inc 498 345 153 2 1 11055 ETFC E*TRADE Financial Corp 181,444 136,702 44,742 720 542 1781056 EOPN E2open Inc 1,666 1,119 547 7 4 21057 EGBN Eagle Bancorp Inc 362 311 51 1 1 01058 EGLE Eagle Bulk Shipping Inc 79 0 79 0 0 01059 EXP Eagle Materials Inc 12,273 7,097 5,176 49 28 211060 EGRX Eagle Pharmaceuticals Inc/DE 8,856 4,727 4,129 56 30 261061 EROC Eagle Rock Energy Partners LP 6,793 3,566 3,227 27 14 131062 ELNK EarthLink Holdings Corp 18,459 18,091 368 73 72 11063 RNF East Dubuque Nitrogen Partners LP 6,950 5,231 1,719 28 21 71064 EWBC East West Bancorp Inc 572 243 329 2 1 11065 EMN Eastman Chemical Co 65,099 43,282 21,817 258 172 871066 KODK Eastman Kodak Co 2,915 1,378 1,537 12 5 61067 ETN Eaton Corp PLC 111,300 74,429 36,871 442 295 1461068 EV Eaton Vance Corp 790 647 143 3 3 11069 EBAY eBay Inc 924,160 639,622 284,538 3,667 2,538 1,1291070 EBIX Ebix Inc 31,719 15,850 15,869 126 63 631071 ECT ECA Marcellus Trust I 6,763 3,527 3,236 27 14 131072 ELON Echelon Corp 126 124 2 1 0 01073 ECHO Echo Global Logistics Inc 5,685 2,912 2,773 23 12 111074 SATS EchoStar Corp 248 197 51 1 1 01075 ECR Eclipse Resources Corp 10,078 2,982 7,096 40 12 281076 ECL Ecolab Inc 27,710 15,630 12,080 110 62 481077 DANG E-Commerce China Dangdang Inc 52,789 39,158 13,631 209 155 541078 EC Ecopetrol SA 2,018 686 1,332 8 3 51079 EDAP EDAP TMS SA 11,831 8,595 3,236 47 34 131080 EPC Edgewell Personal Care Co 8,210 6,667 1,543 33 26 61081 EIX Edison International 28,579 21,930 6,649 113 87 261082 EDR Education Realty Trust Inc 1,034 572 462 4 2 21083 EW Edwards Lifesciences Corp 40,850 25,285 15,565 162 100 621084 EGAN eGain Corp 73 44 29 0 0 01085 EHTH eHealth Inc 2,456 1,186 1,270 10 5 51086 EJ E-House China Holdings Ltd 30,238 21,401 8,837 120 85 351087 DD EI du Pont de Nemours & Co 705,520 481,959 223,561 2,800 1,913 8871088 CLDN Eiger BioPharmaceuticals Inc 81,023 43,511 37,512 349 188 162
Page 24
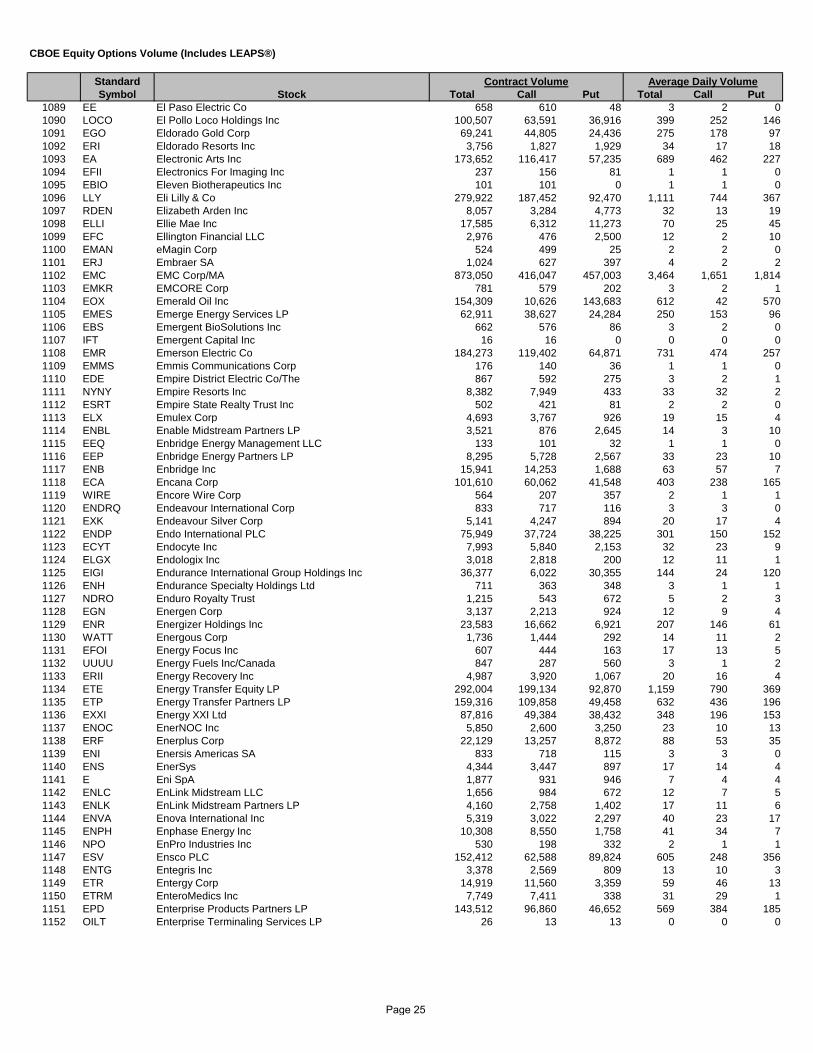
Standard Symbol Stock Total Call Put Total Call Put
CBOE Equity Options Volume (Includes LEAPS®)
Contract Volume Average Daily Volume
1089 EE El Paso Electric Co 658 610 48 3 2 01090 LOCO El Pollo Loco Holdings Inc 100,507 63,591 36,916 399 252 1461091 EGO Eldorado Gold Corp 69,241 44,805 24,436 275 178 971092 ERI Eldorado Resorts Inc 3,756 1,827 1,929 34 17 181093 EA Electronic Arts Inc 173,652 116,417 57,235 689 462 2271094 EFII Electronics For Imaging Inc 237 156 81 1 1 01095 EBIO Eleven Biotherapeutics Inc 101 101 0 1 1 01096 LLY Eli Lilly & Co 279,922 187,452 92,470 1,111 744 3671097 RDEN Elizabeth Arden Inc 8,057 3,284 4,773 32 13 191098 ELLI Ellie Mae Inc 17,585 6,312 11,273 70 25 451099 EFC Ellington Financial LLC 2,976 476 2,500 12 2 101100 EMAN eMagin Corp 524 499 25 2 2 01101 ERJ Embraer SA 1,024 627 397 4 2 21102 EMC EMC Corp/MA 873,050 416,047 457,003 3,464 1,651 1,8141103 EMKR EMCORE Corp 781 579 202 3 2 11104 EOX Emerald Oil Inc 154,309 10,626 143,683 612 42 5701105 EMES Emerge Energy Services LP 62,911 38,627 24,284 250 153 961106 EBS Emergent BioSolutions Inc 662 576 86 3 2 01107 IFT Emergent Capital Inc 16 16 0 0 0 01108 EMR Emerson Electric Co 184,273 119,402 64,871 731 474 2571109 EMMS Emmis Communications Corp 176 140 36 1 1 01110 EDE Empire District Electric Co/The 867 592 275 3 2 11111 NYNY Empire Resorts Inc 8,382 7,949 433 33 32 21112 ESRT Empire State Realty Trust Inc 502 421 81 2 2 01113 ELX Emulex Corp 4,693 3,767 926 19 15 41114 ENBL Enable Midstream Partners LP 3,521 876 2,645 14 3 101115 EEQ Enbridge Energy Management LLC 133 101 32 1 1 01116 EEP Enbridge Energy Partners LP 8,295 5,728 2,567 33 23 101117 ENB Enbridge Inc 15,941 14,253 1,688 63 57 71118 ECA Encana Corp 101,610 60,062 41,548 403 238 1651119 WIRE Encore Wire Corp 564 207 357 2 1 11120 ENDRQ Endeavour International Corp 833 717 116 3 3 01121 EXK Endeavour Silver Corp 5,141 4,247 894 20 17 41122 ENDP Endo International PLC 75,949 37,724 38,225 301 150 1521123 ECYT Endocyte Inc 7,993 5,840 2,153 32 23 91124 ELGX Endologix Inc 3,018 2,818 200 12 11 11125 EIGI Endurance International Group Holdings Inc 36,377 6,022 30,355 144 24 1201126 ENH Endurance Specialty Holdings Ltd 711 363 348 3 1 11127 NDRO Enduro Royalty Trust 1,215 543 672 5 2 31128 EGN Energen Corp 3,137 2,213 924 12 9 41129 ENR Energizer Holdings Inc 23,583 16,662 6,921 207 146 611130 WATT Energous Corp 1,736 1,444 292 14 11 21131 EFOI Energy Focus Inc 607 444 163 17 13 51132 UUUU Energy Fuels Inc/Canada 847 287 560 3 1 21133 ERII Energy Recovery Inc 4,987 3,920 1,067 20 16 41134 ETE Energy Transfer Equity LP 292,004 199,134 92,870 1,159 790 3691135 ETP Energy Transfer Partners LP 159,316 109,858 49,458 632 436 1961136 EXXI Energy XXI Ltd 87,816 49,384 38,432 348 196 1531137 ENOC EnerNOC Inc 5,850 2,600 3,250 23 10 131138 ERF Enerplus Corp 22,129 13,257 8,872 88 53 351139 ENI Enersis Americas SA 833 718 115 3 3 01140 ENS EnerSys 4,344 3,447 897 17 14 41141 E Eni SpA 1,877 931 946 7 4 41142 ENLC EnLink Midstream LLC 1,656 984 672 12 7 51143 ENLK EnLink Midstream Partners LP 4,160 2,758 1,402 17 11 61144 ENVA Enova International Inc 5,319 3,022 2,297 40 23 171145 ENPH Enphase Energy Inc 10,308 8,550 1,758 41 34 71146 NPO EnPro Industries Inc 530 198 332 2 1 11147 ESV Ensco PLC 152,412 62,588 89,824 605 248 3561148 ENTG Entegris Inc 3,378 2,569 809 13 10 31149 ETR Entergy Corp 14,919 11,560 3,359 59 46 131150 ETRM EnteroMedics Inc 7,749 7,411 338 31 29 11151 EPD Enterprise Products Partners LP 143,512 96,860 46,652 569 384 1851152 OILT Enterprise Terminaling Services LP 26 13 13 0 0 0
Page 25

Standard Symbol Stock Total Call Put Total Call Put
CBOE Equity Options Volume (Includes LEAPS®)
Contract Volume Average Daily Volume
1153 EVC Entravision Communications Corp 1,255 1,211 44 5 5 01154 EGI Entree Gold Inc 84 58 26 0 0 01155 ENTR Entropic Communications Inc 129 129 0 1 1 01156 ENV Envestnet Inc 2 2 0 0 0 01157 EVHC Envision Healthcare Holdings Inc 8,129 6,561 1,568 32 26 61158 ENVI Envivio Inc 962 892 70 4 4 01159 ENZ Enzo Biochem Inc 1,804 1,379 425 7 5 21160 ENZN Enzon Pharmaceuticals Inc 2,815 2,732 83 11 11 01161 EOG EOG Resources Inc 568,076 327,941 240,135 2,254 1,301 9531162 EPE EP Energy Corp 14,094 9,781 4,313 56 39 171163 EPAM EPAM Systems Inc 5,960 2,954 3,006 24 12 121164 EPIQ Epiq Systems Inc 952 376 576 4 1 21165 EPRS EPIRUS Biopharmaceuticals Inc 16 0 16 0 0 01166 EPZM Epizyme Inc 1,101 698 403 6 4 21167 EPR EPR Properties 745 583 162 3 2 11168 EQT EQT Corp 15,806 10,080 5,726 63 40 231169 EQGP EQT GP Holdings LP 666 335 331 4 2 21170 EQM EQT Midstream Partners LP 10,463 7,536 2,927 42 30 121171 EQIX Equinix Inc 27,048 18,534 8,514 107 74 341172 EQC Equity Commonwealth 566 377 189 2 1 11173 EQY Equity One Inc 82 59 23 0 0 01174 EQR Equity Residential 11,772 7,506 4,266 47 30 171175 ERA Era Group Inc 979 51 928 9 0 91176 ERN Erin Energy Corp 2,125 1,937 188 16 15 11177 EROS Eros International PLC 29,801 11,496 18,305 596 230 3661178 ESCR Escalera Resources Co 10 4 6 0 0 01179 ESCRQ Escalera Resources Co 1 0 1 0 0 01180 ESE ESCO Technologies Inc 239 26 213 1 0 11181 ESPR Esperion Therapeutics Inc 42,423 25,734 16,689 233 141 921182 ESNT Essent Group Ltd 443 347 96 4 3 11183 ESS Essex Property Trust Inc 2,212 1,431 781 9 6 31184 EL Estee Lauder Cos Inc/The 43,808 19,860 23,948 174 79 951185 ETH Ethan Allen Interiors Inc 1,837 1,092 745 7 4 31186 ETSY Etsy Inc 55,897 27,219 28,678 319 156 1641187 ESEA Euroseas Ltd 44 0 44 0 0 01188 EVEP EV Energy Partners LP 28,481 19,390 9,091 113 77 361189 EVER EverBank Financial Corp 2,326 572 1,754 9 2 71190 EVR Evercore Partners Inc 3,219 2,519 700 13 10 31191 RE Everest Re Group Ltd 2,790 1,533 1,257 11 6 51192 EVRI Everi Holdings Inc 183 149 34 1 1 01193 GCA Everi Holdings Inc 239 117 122 1 0 01194 ES Eversource Energy 11,102 10,810 292 44 43 11195 NU Eversource Energy 2,652 2,448 204 11 10 11196 EVTC EVERTEC Inc 634 307 327 3 1 11197 EVLV EVINE Live Inc 696 676 20 3 3 01198 EPM Evolution Petroleum Corp 400 338 62 2 1 01199 SSP EW Scripps Co/The 277 219 58 2 2 01200 EXA Exa Corp 327 195 132 1 1 11201 EXAS Exact Sciences Corp 64,365 44,039 20,326 255 175 811202 EXAM ExamWorks Group Inc 5,363 4,064 1,299 21 16 51203 EXAR Exar Corp 1,559 1,486 73 6 6 01204 EXL Excel Trust Inc 247 136 111 1 1 01205 XCO EXCO Resources Inc 38,292 19,207 19,085 152 76 761206 XLS Exelis Inc 1,821 1,226 595 7 5 21207 EXEL Exelixis Inc 127,218 79,598 47,620 505 316 1891208 EXC Exelon Corp 202,186 131,722 70,464 802 523 2801209 XRA Exeter Resource Corp 16 2 14 0 0 01210 EXLS ExlService Holdings Inc 230 217 13 1 1 01211 XONE ExOne Co/The 23,252 11,321 11,931 92 45 471212 EXPE Expedia Inc 250,915 130,201 120,714 996 517 4791213 EXPD Expeditors International of Washington Inc 22,851 14,893 7,958 91 59 321214 EXPR Express Inc 53,800 44,020 9,780 213 175 391215 ESRX Express Scripts Holding Co 439,277 258,432 180,845 1,743 1,026 7181216 STAY Extended Stay America Inc 4,796 644 4,152 19 3 16
Page 26

Standard Symbol Stock Total Call Put Total Call Put
CBOE Equity Options Volume (Includes LEAPS®)
Contract Volume Average Daily Volume
1217 EXR Extra Space Storage Inc 5,082 2,974 2,108 20 12 81218 EXTR Extreme Networks Inc 10,369 7,227 3,142 41 29 121219 XOM Exxon Mobil Corp 2,817,875 1,529,070 1,288,805 11,182 6,068 5,1141220 EZCH EZchip Semiconductor Ltd 24,393 4,769 19,624 97 19 781221 EZPW EZCORP Inc 8,984 3,575 5,409 36 14 21
1222 FCEA F&C Open Ended Investment Company ICVC - European Equity Fund 1,857 532 1,325 7 2 5
1223 FFIV F5 Networks Inc 165,017 74,295 90,722 655 295 3601224 FN Fabrinet 407 246 161 2 1 11225 FB Facebook Inc 14,458,115 9,446,336 5,011,779 57,373 37,485 19,8881226 FDS FactSet Research Systems Inc 9,330 2,241 7,089 37 9 281227 FICO Fair Isaac Corp 1,386 808 578 6 3 21228 FCS Fairchild Semiconductor International Inc 29,660 14,983 14,677 118 59 581229 FMSA Fairmount Santrol Holdings Inc 41,047 18,553 22,494 163 74 891230 FRP FairPoint Communications Inc 1,825 1,775 50 16 15 01231 FWM Fairway Group Holdings Corp 22,138 11,578 10,560 88 46 421232 FDO Family Dollar Stores Inc 8,344 1,229 7,115 33 5 281233 FARO FARO Technologies Inc 2,936 1,238 1,698 12 5 71234 FAST Fastenal Co 59,016 30,327 28,689 234 120 1141235 FBRC FBR & Co 1,470 1,073 397 6 4 21236 FCB FCB Financial Holdings Inc 4 4 0 0 0 01237 AGM Federal Agricultural Mortgage Corp 256 98 158 1 0 11238 FRT Federal Realty Investment Trust 390 285 105 2 1 01239 FSS Federal Signal Corp 452 350 102 2 1 01240 FDML Federal-Mogul Holdings Corp 716 274 442 3 1 21241 FII Federated Investors Inc 2,983 2,530 453 12 10 21242 FDX FedEx Corp 332,228 169,659 162,569 1,318 673 6451243 FEIC FEI Co 992 726 266 4 3 11244 FCH FelCor Lodging Trust Inc 816 684 132 3 3 11245 FHCO Female Health Co/The 183 130 53 1 1 01246 RACE Ferrari NV 7,576 2,771 4,805 172 63 1091247 FGP Ferrellgas Partners LP 6,941 2,685 4,256 28 11 171248 FOE Ferro Corp 2,534 686 1,848 10 3 71249 GSM Ferroglobe PLC 5,038 4,619 419 20 18 21250 FCAU Fiat Chrysler Automobiles NV 127,324 103,078 24,246 505 409 961251 FBR Fibria Celulose SA 1,297 1,108 189 5 4 11252 FCSC Fibrocell Science Inc 2,874 2,182 692 11 9 31253 FIS Fidelity National Information Services Inc 8,313 6,177 2,136 33 25 81254 LION Fidelity Southern Corp 56 41 15 1 0 01255 FDUS Fidus Investment Corp 568 357 211 2 1 11256 FRGI Fiesta Restaurant Group Inc 8,895 5,239 3,656 35 21 151257 FSC Fifth Street Finance Corp 5,762 3,752 2,010 23 15 81258 FITB Fifth Third Bancorp 82,513 61,354 21,159 327 243 841259 FNGN Financial Engines Inc 3,185 1,581 1,604 13 6 61260 FNSR Finisar Corp 63,756 53,980 9,776 253 214 391261 FINL Finish Line Inc/The 26,624 14,796 11,828 106 59 471262 FEYE FireEye Inc 1,034,059 698,961 335,098 4,103 2,774 1,3301263 FAF First American Financial Corp 637 390 247 3 2 11264 FBP First BanCorp/Puerto Rico 232 83 149 2 1 11265 FCFS First Cash Financial Services Inc 1,276 602 674 5 2 31266 FCF First Commonwealth Financial Corp 241 241 0 2 2 01267 FCBC First Community Bancshares Inc/VA 100 48 52 0 0 01268 FDC First Data Corp 5,489 2,582 2,907 114 54 611269 FDEF First Defiance Financial Corp 97 63 34 0 0 01270 FFBC First Financial Bancorp 40 40 0 0 0 01271 FFIN First Financial Bankshares Inc 83 32 51 1 0 11272 FFNW First Financial Northwest Inc 31 21 10 0 0 01273 FHN First Horizon National Corp 2,285 597 1,688 9 2 71274 FR First Industrial Realty Trust Inc 299 274 25 3 3 01275 AG First Majestic Silver Corp 28,988 20,533 8,455 115 81 341276 FMD First Marblehead Corp/The 96 94 2 0 0 01277 FMBI First Midwest Bancorp Inc/IL 347 157 190 1 1 11278 FNFG First Niagara Financial Group Inc 4,808 4,019 789 19 16 31279 FPO First Potomac Realty Trust 32 32 0 0 0 01280 FSLR First Solar Inc 344,145 208,990 135,155 1,366 829 536
Page 27

Standard Symbol Stock Total Call Put Total Call Put
CBOE Equity Options Volume (Includes LEAPS®)
Contract Volume Average Daily Volume
1281 FE FirstEnergy Corp 59,160 39,207 19,953 235 156 791282 SVVC Firsthand Technology Value Fund Inc 3,562 1,882 1,680 14 7 71283 FMER FirstMerit Corp 674 523 151 3 2 11284 FISV Fiserv Inc 10,967 4,835 6,132 44 19 241285 FIT Fitbit Inc 376,528 226,455 150,073 2,874 1,729 1,1461286 FIVE Five Below Inc 75,177 54,720 20,457 298 217 811287 OAKS Five Oaks Investment Corp 1,601 1,490 111 20 18 11288 FPRX Five Prime Therapeutics Inc 6,916 2,306 4,610 61 20 401289 FVE Five Star Quality Care Inc 2,273 269 2,004 9 1 81290 FIVN Five9 Inc 1,848 551 1,297 18 5 121291 FBC Flagstar Bancorp Inc 439 217 222 2 1 11292 FLML Flamel Technologies SA 13,871 9,452 4,419 55 38 181293 FLT FleetCor Technologies Inc 15,608 7,985 7,623 62 32 301294 FLTX Fleetmatics Group PLC 3,520 2,263 1,257 14 9 51295 FLEX Flextronics International Ltd 67,502 53,068 14,434 268 211 571296 FLIR FLIR Systems Inc 2,309 1,688 621 9 7 21297 FTK Flotek Industries Inc 77,498 29,265 48,233 308 116 1911298 FLO Flowers Foods Inc 4,487 2,550 1,937 18 10 81299 FLS Flowserve Corp 9,974 5,331 4,643 40 21 181300 FLDM Fluidigm Corp 2,550 822 1,728 10 3 71301 FLR Fluor Corp 54,619 29,075 25,544 217 115 1011302 FLY Fly Leasing Ltd 5,094 4,358 736 20 17 31303 FMC FMC Corp 10,311 6,423 3,888 41 25 151304 FTI FMC Technologies Inc 19,653 8,280 11,373 78 33 451305 FNB FNB Corp/PA 2 1 1 0 0 01306 FNF FNF Group 28,555 16,157 12,398 113 64 491307 FNFV FNFV Group 443 298 145 5 3 11308 FMX Fomento Economico Mexicano SAB de CV 1,536 1,058 478 6 4 21309 FL Foot Locker Inc 117,420 72,785 44,635 466 289 1771310 F Ford Motor Co 2,516,074 1,619,150 896,924 9,984 6,425 3,5591311 FELP Foresight Energy LP 14,184 3,460 10,724 56 14 431312 FOR Forestar Group Inc 1,293 993 300 5 4 11313 VRNG FORM Holdings Corp 12,498 12,082 416 50 48 21314 FORM FormFactor Inc 3,260 1,796 1,464 13 7 61315 FORR Forrester Research Inc 92 62 30 0 0 01316 FTNT Fortinet Inc 106,961 76,963 29,998 424 305 1191317 CNDO Fortress Biotech Inc 2,720 2,499 221 11 10 11318 FBIO Fortress Biotech Inc 248 246 2 1 1 01319 FIG Fortress Investment Group LLC 71,169 61,462 9,707 282 244 391320 FTAI Fortress Transportation & Infrastructure Investors LLC 1,874 1,022 852 13 7 61321 FSM Fortuna Silver Mines Inc 1,511 1,004 507 6 4 21322 FBHS Fortune Brands Home & Security Inc 3,902 2,173 1,729 15 9 71323 FET Forum Energy Technologies Inc 3,989 509 3,480 16 2 141324 FOSL Fossil Group Inc 127,286 51,711 75,575 505 205 3001325 FMI Foundation Medicine Inc 66,783 13,376 53,407 265 53 2121326 FRAN Francesca's Holdings Corp 5,796 3,142 2,654 23 12 111327 FNV Franco-Nevada Corp 21,627 12,099 9,528 86 48 381328 BEN Franklin Resources Inc 79,968 22,082 57,886 317 88 2301329 FSP Franklin Street Properties Corp 1 0 1 0 0 01330 FI Frank's International NV 466 190 276 2 1 11331 FRED Fred's Inc 321 121 200 1 0 11332 FCX Freeport-McMoRan Inc 2,457,738 1,392,982 1,064,756 9,753 5,528 4,2251333 FSL Freescale Semiconductor Ltd 30,400 10,327 20,073 121 41 801334 RAIL FreightCar America Inc 3,873 1,674 2,199 15 7 91335 FMS Fresenius Medical Care AG & Co KGaA 317 236 81 1 1 01336 FDP Fresh Del Monte Produce Inc 126 92 34 1 0 01337 TFM Fresh Market Inc/The 22,592 6,919 15,673 90 27 621338 FRPT Freshpet Inc 14,652 6,685 7,967 60 27 331339 FTR Frontier Communications Corp 212,266 108,406 103,860 842 430 4121340 FRO Frontline Ltd/Bermuda 71,815 63,385 8,430 285 252 331341 FSIC FS Investment Corp 1,695 170 1,525 7 1 61342 FTD FTD Cos Inc 187 154 33 1 1 01343 FCN FTI Consulting Inc 703 218 485 3 1 21344 FSYS Fuel Systems Solutions Inc 3,445 1,073 2,372 14 4 9
Page 28
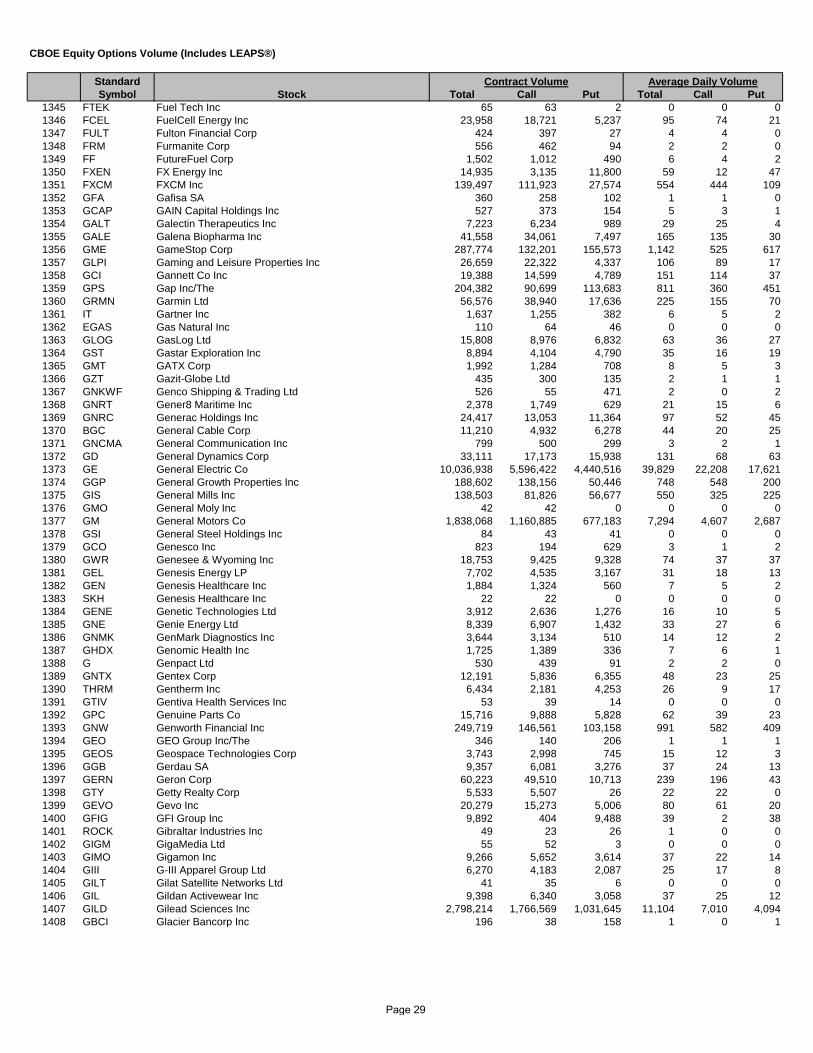
Standard Symbol Stock Total Call Put Total Call Put
CBOE Equity Options Volume (Includes LEAPS®)
Contract Volume Average Daily Volume
1345 FTEK Fuel Tech Inc 65 63 2 0 0 01346 FCEL FuelCell Energy Inc 23,958 18,721 5,237 95 74 211347 FULT Fulton Financial Corp 424 397 27 4 4 01348 FRM Furmanite Corp 556 462 94 2 2 01349 FF FutureFuel Corp 1,502 1,012 490 6 4 21350 FXEN FX Energy Inc 14,935 3,135 11,800 59 12 471351 FXCM FXCM Inc 139,497 111,923 27,574 554 444 1091352 GFA Gafisa SA 360 258 102 1 1 01353 GCAP GAIN Capital Holdings Inc 527 373 154 5 3 11354 GALT Galectin Therapeutics Inc 7,223 6,234 989 29 25 41355 GALE Galena Biopharma Inc 41,558 34,061 7,497 165 135 301356 GME GameStop Corp 287,774 132,201 155,573 1,142 525 6171357 GLPI Gaming and Leisure Properties Inc 26,659 22,322 4,337 106 89 171358 GCI Gannett Co Inc 19,388 14,599 4,789 151 114 371359 GPS Gap Inc/The 204,382 90,699 113,683 811 360 4511360 GRMN Garmin Ltd 56,576 38,940 17,636 225 155 701361 IT Gartner Inc 1,637 1,255 382 6 5 21362 EGAS Gas Natural Inc 110 64 46 0 0 01363 GLOG GasLog Ltd 15,808 8,976 6,832 63 36 271364 GST Gastar Exploration Inc 8,894 4,104 4,790 35 16 191365 GMT GATX Corp 1,992 1,284 708 8 5 31366 GZT Gazit-Globe Ltd 435 300 135 2 1 11367 GNKWF Genco Shipping & Trading Ltd 526 55 471 2 0 21368 GNRT Gener8 Maritime Inc 2,378 1,749 629 21 15 61369 GNRC Generac Holdings Inc 24,417 13,053 11,364 97 52 451370 BGC General Cable Corp 11,210 4,932 6,278 44 20 251371 GNCMA General Communication Inc 799 500 299 3 2 11372 GD General Dynamics Corp 33,111 17,173 15,938 131 68 631373 GE General Electric Co 10,036,938 5,596,422 4,440,516 39,829 22,208 17,6211374 GGP General Growth Properties Inc 188,602 138,156 50,446 748 548 2001375 GIS General Mills Inc 138,503 81,826 56,677 550 325 2251376 GMO General Moly Inc 42 42 0 0 0 01377 GM General Motors Co 1,838,068 1,160,885 677,183 7,294 4,607 2,6871378 GSI General Steel Holdings Inc 84 43 41 0 0 01379 GCO Genesco Inc 823 194 629 3 1 21380 GWR Genesee & Wyoming Inc 18,753 9,425 9,328 74 37 371381 GEL Genesis Energy LP 7,702 4,535 3,167 31 18 131382 GEN Genesis Healthcare Inc 1,884 1,324 560 7 5 21383 SKH Genesis Healthcare Inc 22 22 0 0 0 01384 GENE Genetic Technologies Ltd 3,912 2,636 1,276 16 10 51385 GNE Genie Energy Ltd 8,339 6,907 1,432 33 27 61386 GNMK GenMark Diagnostics Inc 3,644 3,134 510 14 12 21387 GHDX Genomic Health Inc 1,725 1,389 336 7 6 11388 G Genpact Ltd 530 439 91 2 2 01389 GNTX Gentex Corp 12,191 5,836 6,355 48 23 251390 THRM Gentherm Inc 6,434 2,181 4,253 26 9 171391 GTIV Gentiva Health Services Inc 53 39 14 0 0 01392 GPC Genuine Parts Co 15,716 9,888 5,828 62 39 231393 GNW Genworth Financial Inc 249,719 146,561 103,158 991 582 4091394 GEO GEO Group Inc/The 346 140 206 1 1 11395 GEOS Geospace Technologies Corp 3,743 2,998 745 15 12 31396 GGB Gerdau SA 9,357 6,081 3,276 37 24 131397 GERN Geron Corp 60,223 49,510 10,713 239 196 431398 GTY Getty Realty Corp 5,533 5,507 26 22 22 01399 GEVO Gevo Inc 20,279 15,273 5,006 80 61 201400 GFIG GFI Group Inc 9,892 404 9,488 39 2 381401 ROCK Gibraltar Industries Inc 49 23 26 1 0 01402 GIGM GigaMedia Ltd 55 52 3 0 0 01403 GIMO Gigamon Inc 9,266 5,652 3,614 37 22 141404 GIII G-III Apparel Group Ltd 6,270 4,183 2,087 25 17 81405 GILT Gilat Satellite Networks Ltd 41 35 6 0 0 01406 GIL Gildan Activewear Inc 9,398 6,340 3,058 37 25 121407 GILD Gilead Sciences Inc 2,798,214 1,766,569 1,031,645 11,104 7,010 4,0941408 GBCI Glacier Bancorp Inc 196 38 158 1 0 1
Page 29

Standard Symbol Stock Total Call Put Total Call Put
CBOE Equity Options Volume (Includes LEAPS®)
Contract Volume Average Daily Volume
1409 GLAD Gladstone Capital Corp 905 367 538 4 1 21410 GOOD Gladstone Commercial Corp 1,535 796 739 6 3 31411 GAIN Gladstone Investment Corp 330 144 186 1 1 11412 GSK GlaxoSmithKline PLC 136,404 91,545 44,859 541 363 1781413 BRSS Global Brass & Copper Holdings Inc 231 192 39 2 2 01414 ENT Global Eagle Entertainment Inc 11,607 9,063 2,544 46 36 101415 GBLI Global Indemnity PLC 224 211 13 3 2 01416 GLP Global Partners LP/MA 2,805 1,544 1,261 11 6 51417 GPN Global Payments Inc 11,176 9,425 1,751 44 37 71418 GLPW Global Power Equipment Group Inc 1,182 507 675 5 2 31419 GSL Global Ship Lease Inc 875 852 23 3 3 01420 GSB GlobalSCAPE Inc 54 54 0 1 1 01421 GSAT Globalstar Inc 65,347 53,416 11,931 259 212 471422 GMED Globus Medical Inc 1,791 686 1,105 7 3 41423 GLUU Glu Mobile Inc 42,757 35,556 7,201 170 141 291424 GNC GNC Holdings Inc 87,052 55,982 31,070 345 222 1231425 GDDY GoDaddy Inc 35,566 11,186 24,380 192 60 1321426 GOGO Gogo Inc 107,360 72,922 34,438 426 289 1371427 GOL Gol Linhas Aereas Inteligentes SA 9,117 8,424 693 36 33 31428 GLNG Golar LNG Ltd 163,768 105,259 58,509 650 418 2321429 GMLP Golar LNG Partners LP 6,800 3,746 3,054 27 15 121430 GFI Gold Fields Ltd 23,521 17,845 5,676 93 71 231431 GORO Gold Resource Corp 3,129 1,899 1,230 12 8 51432 GG Goldcorp Inc 410,984 278,712 132,272 1,631 1,106 5251433 AUMN Golden Minerals Co 12 12 0 0 0 01434 GOGL Golden Ocean Group Ltd 11,895 1,209 10,686 47 5 421435 VLCCF Golden Ocean Group Ltd 12,314 1,055 11,259 49 4 451436 GSS Golden Star Resources Ltd 491 466 25 2 2 01437 GV Goldfield Corp/The 550 350 200 7 4 31438 GS Goldman Sachs Group Inc/The 790,529 441,948 348,581 3,137 1,754 1,3831439 GBDC Golub Capital BDC Inc 170 170 0 2 2 01440 GDP Goodrich Petroleum Corp 111,844 52,613 59,231 444 209 2351441 GT Goodyear Tire & Rubber Co/The 181,230 109,986 71,244 719 436 2831442 GPRO GoPro Inc 2,350,909 1,396,833 954,076 9,329 5,543 3,7861443 GMAN Gordmans Stores Inc 1,188 548 640 5 2 31444 GRC Gorman-Rupp Co/The 375 251 124 1 1 01445 GOV Government Properties Income Trust 4,534 2,171 2,363 18 9 91446 GTI GrafTech International Ltd 9,359 6,453 2,906 37 26 121447 GHM Graham Corp 15 14 1 0 0 01448 CSG Gramercy Property Trust 2,168 1,528 640 9 6 31449 GPT Gramercy Property Trust 2,858 1,710 1,148 11 7 51450 GTE Gran Tierra Energy Inc 6,238 6,009 229 25 24 11451 LOPE Grand Canyon Education Inc 3,641 1,136 2,505 14 5 101452 GVA Granite Construction Inc 1,314 423 891 5 2 41453 GPK Graphic Packaging Holding Co 34,686 20,472 14,214 138 81 561454 GTN Gray Television Inc 9,912 6,727 3,185 39 27 131455 GLDD Great Lakes Dredge & Dock Corp 1,525 1,282 243 6 5 11456 GPL Great Panther Silver Ltd 444 444 0 2 2 01457 GXP Great Plains Energy Inc 396 216 180 2 1 11458 GB Greatbatch Inc 204 159 45 1 1 01459 GRBK Green Brick Partners Inc 3,823 1,378 2,445 18 7 121460 GDOT Green Dot Corp 9,111 5,356 3,755 36 21 151461 GPRE Green Plains Inc 58,849 47,048 11,801 234 187 471462 GBX Greenbrier Cos Inc/The 42,766 18,585 24,181 170 74 961463 GHL Greenhill & Co Inc 325 139 186 1 1 11464 GLRE Greenlight Capital Re Ltd 744 419 325 9 5 41465 GEF Greif Inc 3,404 655 2,749 14 3 111466 GFF Griffon Corp 324 323 1 1 1 01467 GRFS Grifols SA 2,211 2,028 183 9 8 11468 GPI Group 1 Automotive Inc 1,551 1,005 546 6 4 21469 GRPN Groupon Inc 407,688 300,873 106,815 1,618 1,194 4241470 GRUB GrubHub Inc 86,677 59,906 26,771 344 238 1061471 ASR Grupo Aeroportuario del Sureste SAB de CV 1,518 878 640 6 3 31472 GGAL Grupo Financiero Galicia SA 20,632 14,063 6,569 82 56 26
Page 30

Standard Symbol Stock Total Call Put Total Call Put
CBOE Equity Options Volume (Includes LEAPS®)
Contract Volume Average Daily Volume
1473 BSMX 953 659 294 4 3 11474 TV 9,054 7,857 1,197 36 31 51475 GSVC 9,898 8,940 958 39 35 41476 GTATQ 5,898 829 5,069 23 3 201477 GTT 1,202 965 237 6 5 11478 GTXI 1,092 831 261 4 3 11479 GES 58,916 35,722 23,194 234 142 921480 GUID 363 337 26 4 3 01481 GWRE 3,318 1,733 1,585 13 7 61482 GIFI 494 199 295 2 1 11483 GURE 5,178 3,148 2,030 21 12 81484 GLF 4,153 1,474 2,679 16 6 111485 GPOR 21,566 8,490 13,076 86 34 521486 GWPH 43,821 22,967 20,854 174 91 831487 HEES 8,893 6,897 1,996 35 27 81488 HRB 162,650 99,337 63,313 645 394 2511489 HABT 11,654 5,386 6,268 74 34 401490 HCKT 636 505 131 7 6 21491 HAE 86 58 28 0 0 01492 HAIN 36,190 21,972 14,218 144 87 561493 HK 52,184 26,811 25,373 207 106 1011494 HAL 1,325,913 754,593 571,320 5,262 2,994 2,2671495 HALO 84,727 50,185 34,542 336 199 1371496 HYH 8,224 4,353 3,871 33 17 151497 HBHC 1,888 345 1,543 7 1 61498 HBI 61,888 42,012 19,876 246 167 791499 HGR 1,209 74 1,135 8 1 81500 HAFC 371 124 247 1 0 11501 HASI 4,735 3,567 1,168 19 14 51502 HNSN 350 324 26 1 1 01503 HQCL 1,520 1,328 192 6 5 11504 HSOL 84 84 0 0 0 01505 HOG 142,065 68,501 73,564 564 272 2921506 HAR 36,053 14,154 21,899 143 56 871507 HLIT 1,423 285 1,138 6 1 51508 HMY 8,618 7,522 1,096 34 30 41509 TINY 759 749 10 6 6 01510 HRS 9,982 8,414 1,568 40 33 61511 HSC 368 187 181 3 2 21512 HHS 737 243 494 3 1 21513 HIG 157,176 63,286 93,890 624 251 3731514 HBIO 319 245 74 1 1 01515 HNR 668 431 237 3 2 11516 HAS 43,481 26,549 16,932 173 105 671517 HTS 5,040 1,854 3,186 20 7 131518 HA 40,632 25,816 14,816 161 102 591519 FUL 405 232 173 2 1 11520 HCA 250,929 82,401 168,528 996 327 6691521 HCI 6,653 2,560 4,093 26 10 161522 HCP 63,768 48,365 15,403 253 192 611523 HDS 8,048 5,847 2,201 32 23 91524 HDB 8,213 3,813 4,400 33 15 171525 HW 16,198 13,125 3,073 64 52 121526 HNT 5,201 4,655 546 21 18 21527 HR 336 289 47 1 1 01528 HTA 1,770 1,033 737 7 4 31529 HQY 10,356 8,138 2,218 41 32 91530 HLS 952 791 161 4 3 11531 HSTM 8 8 0 0 0 01532 HWAY 2,609 966 1,643 10 4 71533 HTLD 420 80 340 4 1 31534 HPY 2,321 674 1,647 9 3 71535 HTWR 9,123 2,920 6,203 36 12 251536 HL
Grupo Financiero Santander Mexico SAB de CV Grupo Televisa SABGSV Capital CorpGT Advanced Technologies IncGTT Communications IncGTx IncGuess? IncGuidance Software IncGuidewire Software IncGulf Island Fabrication IncGulf Resources IncGulfmark Offshore IncGulfport Energy CorpGW Pharmaceuticals PLCH&E Equipment Services IncH&R Block IncHabit Restaurants Inc/TheHackett Group Inc/TheHaemonetics CorpHain Celestial Group Inc/TheHalcon Resources CorpHalliburton CoHalozyme Therapeutics IncHalyard Health IncHancock Holding CoHanesbrands IncHanger IncHanmi Financial CorpHannon Armstrong Sustainable Infrastructure Capital Inc Hansen Medical IncHanwha Q CELLS Co LtdHanwha Q CELLS Co LtdHarley-Davidson IncHarman International Industries IncHarmonic IncHarmony Gold Mining Co LtdHarris & Harris Group IncHarris CorpHarsco CorpHarte-Hanks IncHartford Financial Services Group Inc/TheHarvard Bioscience IncHarvest Natural Resources IncHasbro IncHatteras Financial CorpHawaiian Holdings IncHB Fuller CoHCA Holdings IncHCI Group IncHCP IncHD Supply Holdings IncHDFC Bank LtdHeadwaters IncHealth Net Inc/OldHealthcare Realty Trust IncHealthcare Trust of America IncHealthEquity IncHealthSouth CorpHealthStream IncHealthways IncHeartland Express IncHeartland Payment Systems IncHeartWare International IncHecla Mining Co 119,690 98,232 21,458 475 390 85
Page 31
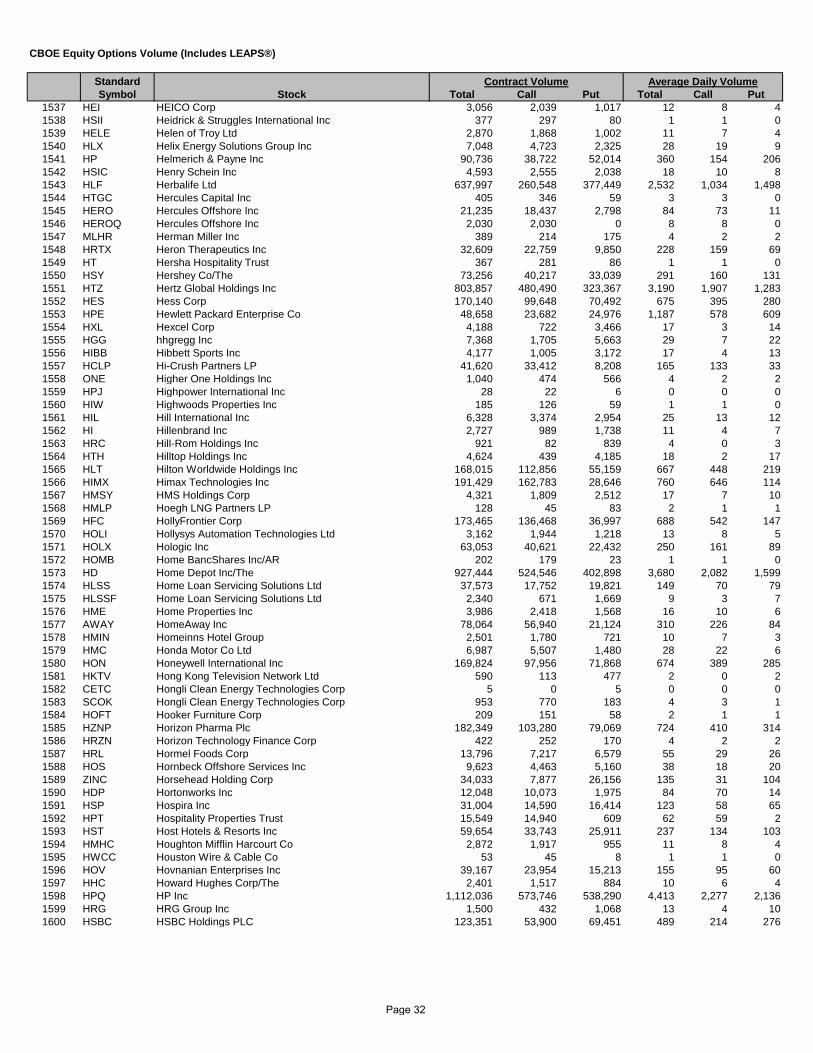
Standard Symbol Stock Total Call Put Total Call Put
CBOE Equity Options Volume (Includes LEAPS®)
Contract Volume Average Daily Volume
1537 HEI HEICO Corp 3,056 2,039 1,017 12 8 41538 HSII Heidrick & Struggles International Inc 377 297 80 1 1 01539 HELE Helen of Troy Ltd 2,870 1,868 1,002 11 7 41540 HLX Helix Energy Solutions Group Inc 7,048 4,723 2,325 28 19 91541 HP Helmerich & Payne Inc 90,736 38,722 52,014 360 154 2061542 HSIC Henry Schein Inc 4,593 2,555 2,038 18 10 81543 HLF Herbalife Ltd 637,997 260,548 377,449 2,532 1,034 1,4981544 HTGC Hercules Capital Inc 405 346 59 3 3 01545 HERO Hercules Offshore Inc 21,235 18,437 2,798 84 73 111546 HEROQ Hercules Offshore Inc 2,030 2,030 0 8 8 01547 MLHR Herman Miller Inc 389 214 175 4 2 21548 HRTX Heron Therapeutics Inc 32,609 22,759 9,850 228 159 691549 HT Hersha Hospitality Trust 367 281 86 1 1 01550 HSY Hershey Co/The 73,256 40,217 33,039 291 160 1311551 HTZ Hertz Global Holdings Inc 803,857 480,490 323,367 3,190 1,907 1,2831552 HES Hess Corp 170,140 99,648 70,492 675 395 2801553 HPE Hewlett Packard Enterprise Co 48,658 23,682 24,976 1,187 578 6091554 HXL Hexcel Corp 4,188 722 3,466 17 3 141555 HGG hhgregg Inc 7,368 1,705 5,663 29 7 221556 HIBB Hibbett Sports Inc 4,177 1,005 3,172 17 4 131557 HCLP Hi-Crush Partners LP 41,620 33,412 8,208 165 133 331558 ONE Higher One Holdings Inc 1,040 474 566 4 2 21559 HPJ Highpower International Inc 28 22 6 0 0 01560 HIW Highwoods Properties Inc 185 126 59 1 1 01561 HIL Hill International Inc 6,328 3,374 2,954 25 13 121562 HI Hillenbrand Inc 2,727 989 1,738 11 4 71563 HRC Hill-Rom Holdings Inc 921 82 839 4 0 31564 HTH Hilltop Holdings Inc 4,624 439 4,185 18 2 171565 HLT Hilton Worldwide Holdings Inc 168,015 112,856 55,159 667 448 2191566 HIMX Himax Technologies Inc 191,429 162,783 28,646 760 646 1141567 HMSY HMS Holdings Corp 4,321 1,809 2,512 17 7 101568 HMLP Hoegh LNG Partners LP 128 45 83 2 1 11569 HFC HollyFrontier Corp 173,465 136,468 36,997 688 542 1471570 HOLI Hollysys Automation Technologies Ltd 3,162 1,944 1,218 13 8 51571 HOLX Hologic Inc 63,053 40,621 22,432 250 161 891572 HOMB Home BancShares Inc/AR 202 179 23 1 1 01573 HD Home Depot Inc/The 927,444 524,546 402,898 3,680 2,082 1,5991574 HLSS Home Loan Servicing Solutions Ltd 37,573 17,752 19,821 149 70 791575 HLSSF Home Loan Servicing Solutions Ltd 2,340 671 1,669 9 3 71576 HME Home Properties Inc 3,986 2,418 1,568 16 10 61577 AWAY HomeAway Inc 78,064 56,940 21,124 310 226 841578 HMIN Homeinns Hotel Group 2,501 1,780 721 10 7 31579 HMC Honda Motor Co Ltd 6,987 5,507 1,480 28 22 61580 HON Honeywell International Inc 169,824 97,956 71,868 674 389 2851581 HKTV Hong Kong Television Network Ltd 590 113 477 2 0 21582 CETC Hongli Clean Energy Technologies Corp 5 0 5 0 0 01583 SCOK Hongli Clean Energy Technologies Corp 953 770 183 4 3 11584 HOFT Hooker Furniture Corp 209 151 58 2 1 11585 HZNP Horizon Pharma Plc 182,349 103,280 79,069 724 410 3141586 HRZN Horizon Technology Finance Corp 422 252 170 4 2 21587 HRL Hormel Foods Corp 13,796 7,217 6,579 55 29 261588 HOS Hornbeck Offshore Services Inc 9,623 4,463 5,160 38 18 201589 ZINC Horsehead Holding Corp 34,033 7,877 26,156 135 31 1041590 HDP Hortonworks Inc 12,048 10,073 1,975 84 70 141591 HSP Hospira Inc 31,004 14,590 16,414 123 58 651592 HPT Hospitality Properties Trust 15,549 14,940 609 62 59 21593 HST Host Hotels & Resorts Inc 59,654 33,743 25,911 237 134 1031594 HMHC Houghton Mifflin Harcourt Co 2,872 1,917 955 11 8 41595 HWCC Houston Wire & Cable Co 53 45 8 1 1 01596 HOV Hovnanian Enterprises Inc 39,167 23,954 15,213 155 95 601597 HHC Howard Hughes Corp/The 2,401 1,517 884 10 6 41598 HPQ HP Inc 1,112,036 573,746 538,290 4,413 2,277 2,1361599 HRG HRG Group Inc 1,500 432 1,068 13 4 101600 HSBC HSBC Holdings PLC 123,351 53,900 69,451 489 214 276
Page 32
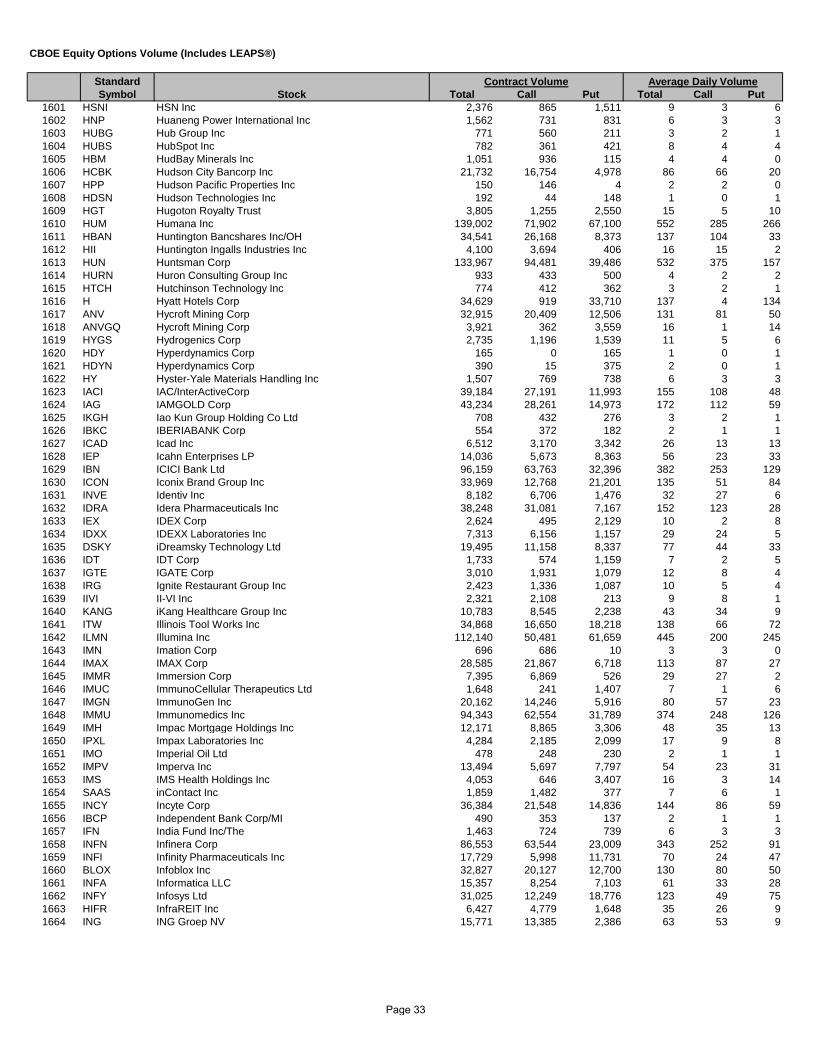
Standard Symbol Stock Total Call Put Total Call Put
CBOE Equity Options Volume (Includes LEAPS®)
Contract Volume Average Daily Volume
1601 HSNI HSN Inc 2,376 865 1,511 9 3 61602 HNP Huaneng Power International Inc 1,562 731 831 6 3 31603 HUBG Hub Group Inc 771 560 211 3 2 11604 HUBS HubSpot Inc 782 361 421 8 4 41605 HBM HudBay Minerals Inc 1,051 936 115 4 4 01606 HCBK Hudson City Bancorp Inc 21,732 16,754 4,978 86 66 201607 HPP Hudson Pacific Properties Inc 150 146 4 2 2 01608 HDSN Hudson Technologies Inc 192 44 148 1 0 11609 HGT Hugoton Royalty Trust 3,805 1,255 2,550 15 5 101610 HUM Humana Inc 139,002 71,902 67,100 552 285 2661611 HBAN Huntington Bancshares Inc/OH 34,541 26,168 8,373 137 104 331612 HII Huntington Ingalls Industries Inc 4,100 3,694 406 16 15 21613 HUN Huntsman Corp 133,967 94,481 39,486 532 375 1571614 HURN Huron Consulting Group Inc 933 433 500 4 2 21615 HTCH Hutchinson Technology Inc 774 412 362 3 2 11616 H Hyatt Hotels Corp 34,629 919 33,710 137 4 1341617 ANV Hycroft Mining Corp 32,915 20,409 12,506 131 81 501618 ANVGQ Hycroft Mining Corp 3,921 362 3,559 16 1 141619 HYGS Hydrogenics Corp 2,735 1,196 1,539 11 5 61620 HDY Hyperdynamics Corp 165 0 165 1 0 11621 HDYN Hyperdynamics Corp 390 15 375 2 0 11622 HY Hyster-Yale Materials Handling Inc 1,507 769 738 6 3 31623 IACI IAC/InterActiveCorp 39,184 27,191 11,993 155 108 481624 IAG IAMGOLD Corp 43,234 28,261 14,973 172 112 591625 IKGH Iao Kun Group Holding Co Ltd 708 432 276 3 2 11626 IBKC IBERIABANK Corp 554 372 182 2 1 11627 ICAD Icad Inc 6,512 3,170 3,342 26 13 131628 IEP Icahn Enterprises LP 14,036 5,673 8,363 56 23 331629 IBN ICICI Bank Ltd 96,159 63,763 32,396 382 253 1291630 ICON Iconix Brand Group Inc 33,969 12,768 21,201 135 51 841631 INVE Identiv Inc 8,182 6,706 1,476 32 27 61632 IDRA Idera Pharmaceuticals Inc 38,248 31,081 7,167 152 123 281633 IEX IDEX Corp 2,624 495 2,129 10 2 81634 IDXX IDEXX Laboratories Inc 7,313 6,156 1,157 29 24 51635 DSKY iDreamsky Technology Ltd 19,495 11,158 8,337 77 44 331636 IDT IDT Corp 1,733 574 1,159 7 2 51637 IGTE IGATE Corp 3,010 1,931 1,079 12 8 41638 IRG Ignite Restaurant Group Inc 2,423 1,336 1,087 10 5 41639 IIVI II-VI Inc 2,321 2,108 213 9 8 11640 KANG iKang Healthcare Group Inc 10,783 8,545 2,238 43 34 91641 ITW Illinois Tool Works Inc 34,868 16,650 18,218 138 66 721642 ILMN Illumina Inc 112,140 50,481 61,659 445 200 2451643 IMN Imation Corp 696 686 10 3 3 01644 IMAX IMAX Corp 28,585 21,867 6,718 113 87 271645 IMMR Immersion Corp 7,395 6,869 526 29 27 21646 IMUC ImmunoCellular Therapeutics Ltd 1,648 241 1,407 7 1 61647 IMGN ImmunoGen Inc 20,162 14,246 5,916 80 57 231648 IMMU Immunomedics Inc 94,343 62,554 31,789 374 248 1261649 IMH Impac Mortgage Holdings Inc 12,171 8,865 3,306 48 35 131650 IPXL Impax Laboratories Inc 4,284 2,185 2,099 17 9 81651 IMO Imperial Oil Ltd 478 248 230 2 1 11652 IMPV Imperva Inc 13,494 5,697 7,797 54 23 311653 IMS IMS Health Holdings Inc 4,053 646 3,407 16 3 141654 SAAS inContact Inc 1,859 1,482 377 7 6 11655 INCY Incyte Corp 36,384 21,548 14,836 144 86 591656 IBCP Independent Bank Corp/MI 490 353 137 2 1 11657 IFN India Fund Inc/The 1,463 724 739 6 3 31658 INFN Infinera Corp 86,553 63,544 23,009 343 252 911659 INFI Infinity Pharmaceuticals Inc 17,729 5,998 11,731 70 24 471660 BLOX Infoblox Inc 32,827 20,127 12,700 130 80 501661 INFA Informatica LLC 15,357 8,254 7,103 61 33 281662 INFY Infosys Ltd 31,025 12,249 18,776 123 49 751663 HIFR InfraREIT Inc 6,427 4,779 1,648 35 26 91664 ING ING Groep NV 15,771 13,385 2,386 63 53 9
Page 33

Standard Symbol Stock Total Call Put Total Call Put
CBOE Equity Options Volume (Includes LEAPS®)
Contract Volume Average Daily Volume
1665 IR Ingersoll-Rand PLC 24,374 19,082 5,292 97 76 211666 IMKTA Ingles Markets Inc 7,973 6,278 1,695 32 25 71667 IM Ingram Micro Inc 1,784 1,225 559 7 5 21668 INGR Ingredion Inc 3,017 2,637 380 12 10 21669 INWK InnerWorkings Inc 112 50 62 0 0 01670 INOD Innodata Inc 132 50 82 1 0 01671 THRX Innoviva Inc 29,054 9,060 19,994 115 36 791672 INOV Inovalon Holdings Inc 4,519 3,944 575 21 18 31673 INO Inovio Pharmaceuticals Inc 22,535 17,493 5,042 89 69 201674 IPHI Inphi Corp 5,229 3,865 1,364 21 15 51675 NSIT Insight Enterprises Inc 416 347 69 2 1 01676 ISIG Insignia Systems Inc 3,411 35 3,376 14 0 131677 INSM Insmed Inc 18,645 6,926 11,719 74 27 471678 NSP Insperity Inc 1,458 1,181 277 6 5 11679 IBP Installed Building Products Inc 1,667 1,290 377 7 5 11680 IIIN Insteel Industries Inc 10 0 10 0 0 01681 PODD Insulet Corp 6,446 5,568 878 26 22 31682 INSY Insys Therapeutics Inc 40,760 11,038 29,722 285 77 2081683 IART Integra LifeSciences Holdings Corp 546 261 285 2 1 11684 IDTI Integrated Device Technology Inc 177,118 80,253 96,865 703 318 3841685 ISSI Integrated Silicon Solution Inc 18,769 16,936 1,833 74 67 71686 TEG Integrys Energy Group Inc 151 113 38 1 0 01687 INTC Intel Corp 4,421,849 2,169,896 2,251,953 17,547 8,611 8,9361688 IQNT Inteliquent Inc 3,414 2,331 1,083 14 9 41689 IPCI Intellipharmaceutics International Inc/CA 1,597 896 701 6 4 31690 I Intelsat SA 7,143 1,803 5,340 28 7 211691 IBKR Interactive Brokers Group Inc 18,737 12,242 6,495 74 49 261692 ININ Interactive Intelligence Group Inc 1,996 471 1,525 8 2 61693 ICPT Intercept Pharmaceuticals Inc 47,146 29,429 17,717 187 117 701694 ICLD InterCloud Systems Inc 1,103 773 330 8 5 21695 ICE Intercontinental Exchange Inc 14,283 7,986 6,297 57 32 251696 IDCC InterDigital Inc/PA 40,102 31,453 8,649 159 125 341697 TILE Interface Inc 24 21 3 0 0 01698 INAP Internap Corp 1,500 1,344 156 12 11 11699 IBOC International Bancshares Corp 328 194 134 4 2 21700 IBM International Business Machines Corp 1,353,162 718,669 634,493 5,370 2,852 2,5181701 IFF International Flavors & Fragrances Inc 3,880 2,070 1,810 15 8 71702 IGT International Game Technology PLC 37,556 31,056 6,500 206 171 361703 IP International Paper Co 157,287 107,877 49,410 624 428 1961704 IRF International Rectifier Corp 54 40 14 0 0 01705 ISCA International Speedway Corp 252 146 106 1 1 01706 THM International Tower Hill Mines Ltd 90 85 5 0 0 01707 IOC InterOil Corp 56,119 33,413 22,706 223 133 901708 IPG Interpublic Group of Cos Inc/The 13,637 8,733 4,904 54 35 191709 INTX Intersections Inc 3,625 518 3,107 14 2 121710 ISIL Intersil Corp 23,234 15,678 7,556 92 62 301711 IILG Interval Leisure Group Inc 425 358 67 2 1 01712 INXN InterXion Holding NV 5,127 3,507 1,620 20 14 61713 IVAC Intevac Inc 25 5 20 0 0 01714 INTL INTL. FCStone Inc 4,076 3,405 671 16 14 31715 IL Intralinks Holdings Inc 1,887 1,188 699 7 5 31716 SNOW Intrawest Resorts Holdings Inc 678 633 45 3 3 01717 IPI Intrepid Potash Inc 5,625 3,617 2,008 22 14 81718 XON Intrexon Corp 121,405 85,856 35,549 482 341 1411719 INTU Intuit Inc 31,265 15,860 15,405 124 63 611720 ISRG Intuitive Surgical Inc 71,356 35,707 35,649 283 142 1411721 IVC Invacare Corp 289 233 56 3 2 11722 INVN InvenSense Inc 243,153 98,844 144,309 965 392 5731723 SNAK Inventure Foods Inc 5,198 897 4,301 21 4 171724 IVZ Invesco Ltd 59,470 51,435 8,035 236 204 321725 IVR Invesco Mortgage Capital Inc 38,458 26,591 11,867 153 106 471726 ITG Investment Technology Group Inc 2,880 1,365 1,515 11 5 61727 ISBC Investors Bancorp Inc 2,600 2,518 82 10 10 01728 IRET Investors Real Estate Trust 1,719 803 916 7 3 4
Page 34
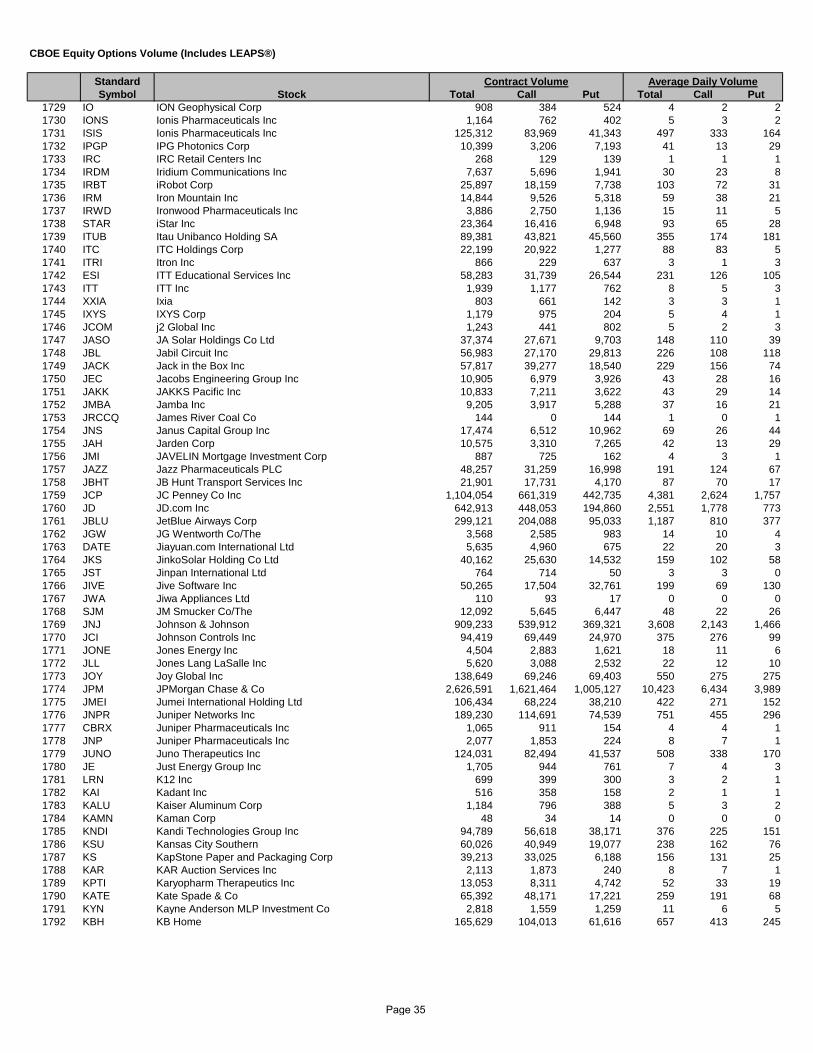
Standard Symbol Stock Total Call Put Total Call Put
CBOE Equity Options Volume (Includes LEAPS®)
Contract Volume Average Daily Volume
1729 IO ION Geophysical Corp 908 384 524 4 2 21730 IONS Ionis Pharmaceuticals Inc 1,164 762 402 5 3 21731 ISIS Ionis Pharmaceuticals Inc 125,312 83,969 41,343 497 333 1641732 IPGP IPG Photonics Corp 10,399 3,206 7,193 41 13 291733 IRC IRC Retail Centers Inc 268 129 139 1 1 11734 IRDM Iridium Communications Inc 7,637 5,696 1,941 30 23 81735 IRBT iRobot Corp 25,897 18,159 7,738 103 72 311736 IRM Iron Mountain Inc 14,844 9,526 5,318 59 38 211737 IRWD Ironwood Pharmaceuticals Inc 3,886 2,750 1,136 15 11 51738 STAR iStar Inc 23,364 16,416 6,948 93 65 281739 ITUB Itau Unibanco Holding SA 89,381 43,821 45,560 355 174 1811740 ITC ITC Holdings Corp 22,199 20,922 1,277 88 83 51741 ITRI Itron Inc 866 229 637 3 1 31742 ESI ITT Educational Services Inc 58,283 31,739 26,544 231 126 1051743 ITT ITT Inc 1,939 1,177 762 8 5 31744 XXIA Ixia 803 661 142 3 3 11745 IXYS IXYS Corp 1,179 975 204 5 4 11746 JCOM j2 Global Inc 1,243 441 802 5 2 31747 JASO JA Solar Holdings Co Ltd 37,374 27,671 9,703 148 110 391748 JBL Jabil Circuit Inc 56,983 27,170 29,813 226 108 1181749 JACK Jack in the Box Inc 57,817 39,277 18,540 229 156 741750 JEC Jacobs Engineering Group Inc 10,905 6,979 3,926 43 28 161751 JAKK JAKKS Pacific Inc 10,833 7,211 3,622 43 29 141752 JMBA Jamba Inc 9,205 3,917 5,288 37 16 211753 JRCCQ James River Coal Co 144 0 144 1 0 11754 JNS Janus Capital Group Inc 17,474 6,512 10,962 69 26 441755 JAH Jarden Corp 10,575 3,310 7,265 42 13 291756 JMI JAVELIN Mortgage Investment Corp 887 725 162 4 3 11757 JAZZ Jazz Pharmaceuticals PLC 48,257 31,259 16,998 191 124 671758 JBHT JB Hunt Transport Services Inc 21,901 17,731 4,170 87 70 171759 JCP JC Penney Co Inc 1,104,054 661,319 442,735 4,381 2,624 1,7571760 JD JD.com Inc 642,913 448,053 194,860 2,551 1,778 7731761 JBLU JetBlue Airways Corp 299,121 204,088 95,033 1,187 810 3771762 JGW JG Wentworth Co/The 3,568 2,585 983 14 10 41763 DATE Jiayuan.com International Ltd 5,635 4,960 675 22 20 31764 JKS JinkoSolar Holding Co Ltd 40,162 25,630 14,532 159 102 581765 JST Jinpan International Ltd 764 714 50 3 3 01766 JIVE Jive Software Inc 50,265 17,504 32,761 199 69 1301767 JWA Jiwa Appliances Ltd 110 93 17 0 0 01768 SJM JM Smucker Co/The 12,092 5,645 6,447 48 22 261769 JNJ Johnson & Johnson 909,233 539,912 369,321 3,608 2,143 1,4661770 JCI Johnson Controls Inc 94,419 69,449 24,970 375 276 991771 JONE Jones Energy Inc 4,504 2,883 1,621 18 11 61772 JLL Jones Lang LaSalle Inc 5,620 3,088 2,532 22 12 101773 JOY Joy Global Inc 138,649 69,246 69,403 550 275 2751774 JPM JPMorgan Chase & Co 2,626,591 1,621,464 1,005,127 10,423 6,434 3,9891775 JMEI Jumei International Holding Ltd 106,434 68,224 38,210 422 271 1521776 JNPR Juniper Networks Inc 189,230 114,691 74,539 751 455 2961777 CBRX Juniper Pharmaceuticals Inc 1,065 911 154 4 4 11778 JNP Juniper Pharmaceuticals Inc 2,077 1,853 224 8 7 11779 JUNO Juno Therapeutics Inc 124,031 82,494 41,537 508 338 1701780 JE Just Energy Group Inc 1,705 944 761 7 4 31781 LRN K12 Inc 699 399 300 3 2 11782 KAI Kadant Inc 516 358 158 2 1 11783 KALU Kaiser Aluminum Corp 1,184 796 388 5 3 21784 KAMN Kaman Corp 48 34 14 0 0 01785 KNDI Kandi Technologies Group Inc 94,789 56,618 38,171 376 225 1511786 KSU Kansas City Southern 60,026 40,949 19,077 238 162 761787 KS KapStone Paper and Packaging Corp 39,213 33,025 6,188 156 131 251788 KAR KAR Auction Services Inc 2,113 1,873 240 8 7 11789 KPTI Karyopharm Therapeutics Inc 13,053 8,311 4,742 52 33 191790 KATE Kate Spade & Co 65,392 48,171 17,221 259 191 681791 KYN Kayne Anderson MLP Investment Co 2,818 1,559 1,259 11 6 51792 KBH KB Home 165,629 104,013 61,616 657 413 245
Page 35

Standard Symbol Stock Total Call Put Total Call Put
CBOE Equity Options Volume (Includes LEAPS®)
Contract Volume Average Daily Volume
1793 KBR KBR Inc 11,476 5,799 5,677 46 23 231794 KCAP KCAP Financial Inc 10,231 596 9,635 41 2 381795 KCG KCG Holdings Inc 56,019 43,649 12,370 222 173 491796 KRNY Kearny Financial Corp/MD 14,085 6,702 7,383 98 47 521797 K Kellogg Co 51,619 39,372 12,247 205 156 491798 KELYA Kelly Services Inc 306 273 33 3 2 01799 KEM Kemet Corp 1,707 1,035 672 7 4 31800 KMT Kennametal Inc 14,653 660 13,993 58 3 561801 KW Kennedy-Wilson Holdings Inc 535 454 81 4 4 11802 KERX Keryx Biopharmaceuticals Inc 120,260 64,342 55,918 477 255 2221803 GMCR Keurig Green Mountain Inc 634,213 355,937 278,276 2,517 1,412 1,1041804 KEG Key Energy Services Inc 1,587 1,194 393 6 5 21805 KTCC Key Tronic Corp 65 65 0 1 1 01806 KEY KeyCorp 63,957 40,920 23,037 254 162 911807 KEYW KEYW Holding Corp/The 8,091 5,743 2,348 32 23 91808 KFRC Kforce Inc 149 131 18 1 1 01809 KE Kimball Electronics Inc 48 47 1 1 1 01810 KMB Kimberly-Clark Corp 53,606 29,708 23,898 213 118 951811 KIM Kimco Realty Corp 4,255 3,520 735 17 14 31812 KMI Kinder Morgan Inc/DE 950,981 560,462 390,519 3,774 2,224 1,5501813 KIN Kindred Biosciences Inc 1,096 875 221 4 3 11814 KND Kindred Healthcare Inc 11,440 6,454 4,986 45 26 201815 KING King Digital Entertainment Plc 132,019 93,210 38,809 524 370 1541816 KGC Kinross Gold Corp 127,068 108,472 18,596 504 430 741817 KEX Kirby Corp 6,722 5,440 1,282 27 22 51818 KIRK Kirkland's Inc 1,120 525 595 4 2 21819 KITE Kite Pharma Inc 85,644 48,910 36,734 340 194 1461820 KRG Kite Realty Group Trust 273 193 80 1 1 01821 KKR KKR & Co LP 100,170 72,443 27,727 398 287 1101822 KLAC KLA-Tencor Corp 61,418 41,621 19,797 244 165 791823 KLXI KLX Inc 8,863 2,541 6,322 36 10 261824 KNX Knight Transportation Inc 1,309 668 641 5 3 31825 KNL Knoll Inc 250 148 102 1 1 01826 KNOP KNOT Offshore Partners LP 6,020 4,465 1,555 24 18 61827 KN Knowles Corp 59,662 29,761 29,901 237 118 1191828 KSS Kohl's Corp 140,769 71,721 69,048 559 285 2741829 KONA Kona Grill Inc 4,523 3,183 1,340 18 13 51830 KZ KongZhong Corp 2,543 1,980 563 10 8 21831 PHG Koninklijke Philips NV 8,411 4,867 3,544 33 19 141832 KOPN Kopin Corp 1,120 1,100 20 4 4 01833 KOP Koppers Holdings Inc 1,055 874 181 4 3 11834 KEP Korea Electric Power Corp 2,901 2,769 132 12 11 11835 KFY Korn/Ferry International 916 608 308 4 2 11836 KOS Kosmos Energy Ltd 34,642 9,393 25,249 137 37 1001837 KRFT Kraft Foods Group Inc 151,959 88,641 63,318 603 352 2511838 KHC Kraft Heinz Co/The 45,566 29,656 15,910 380 247 1331839 KRA Kraton Performance Polymers Inc 2,282 907 1,375 9 4 51840 KTOS Kratos Defense & Security Solutions Inc 4,073 3,193 880 16 13 31841 KKD Krispy Kreme Doughnuts Inc 26,770 14,770 12,000 106 59 481842 KR Kroger Co/The 285,578 178,598 106,980 1,133 709 4251843 KRO Kronos Worldwide Inc 838 701 137 3 3 11844 KT KT Corp 724 430 294 3 2 11845 KLIC Kulicke & Soffa Industries Inc 9,979 9,078 901 40 36 41846 KVHI KVH Industries Inc 1 0 1 0 0 01847 KYTH Kythera Biopharmaceuticals Inc 19,612 12,782 6,830 78 51 271848 LB L Brands Inc 72,293 34,761 37,532 287 138 1491849 LLL L-3 Communications Holdings Inc 9,398 4,887 4,511 37 19 181850 LJPC La Jolla Pharmaceutical Co 14,027 10,918 3,109 56 43 121851 LQ La Quinta Holdings Inc 7,944 2,698 5,246 32 11 211852 LH Laboratory Corp of America Holdings 21,493 14,342 7,151 85 57 281853 LADR Ladder Capital Corp 354 170 184 1 1 11854 LBAI Lakeland Bancorp Inc 28 28 0 0 0 01855 LRCX Lam Research Corp 133,071 54,617 78,454 528 217 3111856 LAMR Lamar Advertising Co 9,101 7,736 1,365 36 31 5
Page 36

Standard Symbol Stock Total Call Put Total Call Put
CBOE Equity Options Volume (Includes LEAPS®)
Contract Volume Average Daily Volume
1857 LNDC Landec Corp 249 209 40 1 1 01858 LE Lands' End Inc 26,582 10,980 15,602 105 44 621859 LSTR Landstar System Inc 2,628 941 1,687 10 4 71860 LCI Lannett Co Inc 45,912 24,578 21,334 182 98 851861 LPI Laredo Petroleum Inc 50,620 35,953 14,667 201 143 581862 LVS Las Vegas Sands Corp 953,208 538,789 414,419 3,783 2,138 1,6451863 LHO LaSalle Hotel Properties 2,605 1,841 764 10 7 31864 LFL Latam Airlines Group SA 3,954 470 3,484 16 2 141865 LSCC Lattice Semiconductor Corp 4,136 4,068 68 16 16 01866 LAYN Layne Christensen Co 2,517 1,307 1,210 10 5 51867 LAZ Lazard Ltd 18,443 11,133 7,310 73 44 291868 LZB La-Z-Boy Inc 838 242 596 3 1 21869 FSTR LB Foster Co 2,101 1,197 904 8 5 41870 LF LeapFrog Enterprises Inc 7,520 6,389 1,131 30 25 41871 LEA Lear Corp 19,042 16,304 2,738 76 65 111872 LEE Lee Enterprises Inc 41 38 3 0 0 01873 LGCY Legacy Reserves LP 10,557 4,736 5,821 42 19 231874 LTXB LegacyTexas Financial Group Inc 810 668 142 3 3 11875 LM Legg Mason Inc 7,888 6,951 937 31 28 41876 LEG Leggett & Platt Inc 4,384 2,853 1,531 17 11 61877 LDOS Leidos Holdings Inc 2,289 1,524 765 9 6 31878 LEJU Leju Holdings Ltd 2,598 1,690 908 12 8 41879 LC LendingClub Corp 176,373 101,309 75,064 700 402 2981880 TREE LendingTree Inc 2,925 2,742 183 117 110 71881 LEN Lennar Corp 169,557 112,243 57,314 673 445 2271882 LII Lennox International Inc 2,743 2,084 659 11 8 31883 LUK Leucadia National Corp 28,247 12,969 15,278 112 51 611884 LVLT Level 3 Communications Inc 55,424 37,403 18,021 220 148 721885 LXRX Lexicon Pharmaceuticals Inc 12,102 6,467 5,635 106 57 491886 LXP Lexington Realty Trust 2,153 484 1,669 9 2 71887 LXK Lexmark International Inc 26,111 11,755 14,356 104 47 571888 LPL LG Display Co Ltd 2,918 1,836 1,082 12 7 41889 LGIH LGI Homes Inc 5,437 3,223 2,214 47 28 191890 LBY Libbey Inc 650 520 130 3 2 11891 LBMH Liberator Medical Holdings Inc 690 629 61 3 2 01892 LBRDA Liberty Broadband Corp 3,871 2,777 1,094 15 11 41893 LBTYA Liberty Global PLC 34,379 27,900 6,479 136 111 261894 LBTYK Liberty Global PLC 4,919 2,328 2,591 20 9 101895 QVCA Liberty Interactive Corp QVC Group 17,490 4,238 13,252 69 17 531896 LMCA Liberty Media Group 1,856 1,537 319 7 6 11897 LPT Liberty Property Trust 372 284 88 1 1 01898 LTRPA Liberty TripAdvisor Holdings Inc 1,979 1,459 520 8 6 21899 LVNTA Liberty Ventures 7,584 5,405 2,179 30 21 91900 LTM Life Time Fitness Inc 6,999 3,811 3,188 28 15 131901 LOCK LifeLock Inc 177,485 44,517 132,968 704 177 5281902 LPNT LifePoint Health Inc 904 478 426 4 2 21903 LCUT Lifetime Brands Inc 204 201 3 1 1 01904 LGND Ligand Pharmaceuticals Inc 4,448 3,464 984 18 14 41905 LTBR Lightbridge Corp 168 101 67 1 0 01906 LITB LightInTheBox Holding Co Ltd 6,716 5,466 1,250 27 22 51907 LLNW Limelight Networks Inc 6,435 4,795 1,640 26 19 71908 LINC Lincoln Educational Services Corp 593 136 457 2 1 21909 LECO Lincoln Electric Holdings Inc 2,634 1,136 1,498 10 5 61910 LNC Lincoln National Corp 21,674 16,956 4,718 86 67 191911 LNN Lindsay Corp 1,064 353 711 4 1 31912 LLTC Linear Technology Corp 109,307 58,775 50,532 434 233 2011913 LNKD LinkedIn Corp 1,012,915 550,734 462,181 4,020 2,185 1,8341914 LINE Linn Energy LLC 300,789 134,649 166,140 1,194 534 6591915 LNCO LinnCo LLC 53,362 35,667 17,695 212 142 701916 LBIO Lion Biotechnologies Inc 4,625 4,119 506 47 42 51917 LIOX Lionbridge Technologies Inc 2,201 749 1,452 9 3 61918 LGF Lions Gate Entertainment Corp 77,214 49,363 27,851 306 196 1111919 LPCN Lipocine Inc 1,465 859 606 21 12 91920 LQDT Liquidity Services Inc 2,000 1,533 467 8 6 2
Page 37

Standard Symbol Stock Total Call Put Total Call Put
CBOE Equity Options Volume (Includes LEAPS®)
Contract Volume Average Daily Volume
1921 LAD Lithia Motors Inc 11,535 9,142 2,393 46 36 91922 LFUS Littelfuse Inc 880 581 299 3 2 11923 LIVN LivaNova PLC 148 33 115 1 0 01924 LYV Live Nation Entertainment Inc 17,285 7,054 10,231 69 28 411925 LIVE Live Ventures Inc 489 383 106 4 3 11926 LPSN LivePerson Inc 3,539 3,109 430 14 12 21927 LKQ LKQ Corp 2,706 768 1,938 11 3 81928 LYG Lloyds Banking Group PLC 11,392 6,756 4,636 45 27 181929 LMIA LMI Aerospace Inc 20 3 17 0 0 01930 LMT Lockheed Martin Corp 77,330 41,838 35,492 307 166 1411931 L Loews Corp 2,484 1,361 1,123 10 5 41932 LOGI Logitech International SA 5,592 1,205 4,387 22 5 171933 LOGM LogMeIn Inc 7,689 5,041 2,648 31 20 111934 LOJN LoJack Corp 125 104 21 1 1 01935 LORL Loral Space & Communications Inc 1,100 652 448 4 3 21936 LO Lorillard LLC 40,303 26,763 13,540 160 106 541937 LPX Louisiana-Pacific Corp 37,215 26,927 10,288 148 107 411938 LOW Lowe's Cos Inc 312,095 193,404 118,691 1,238 767 4711939 LPTN Lpath Inc 2,411 2,126 285 10 8 11940 LPLA LPL Financial Holdings Inc 2,920 1,486 1,434 12 6 61941 LRAD LRAD Corp 90 40 50 0 0 01942 LRE LRR Energy LP 6,149 2,880 3,269 24 11 131943 LXU LSB Industries Inc 2,677 1,501 1,176 11 6 51944 LYTS LSI Industries Inc 60 35 25 0 0 01945 LUB Luby's Inc 10 10 0 0 0 01946 LULU lululemon athletica Inc 510,422 290,413 220,009 2,025 1,152 8731947 LL Lumber Liquidators Holdings Inc 425,115 200,150 224,965 1,687 794 8931948 LMNS Lumenis Ltd 1,828 1,649 179 7 7 11949 LITE Lumentum Holdings Inc 2,518 2,167 351 28 24 41950 LMOS Lumos Networks Corp 6,670 2,823 3,847 26 11 151951 LXFT Luxoft Holding Inc 168 79 89 7 3 41952 LUX Luxottica Group SpA 1,251 429 822 5 2 31953 LDL Lydall Inc 150 80 70 1 1 11954 LYB LyondellBasell Industries NV 124,105 68,519 55,586 492 272 2211955 MTB M&T Bank Corp 9,147 4,810 4,337 36 19 171956 MHO M/I Homes Inc 473 319 154 2 1 11957 MCBC Macatawa Bank Corp 59 59 0 1 1 01958 MAC Macerich Co/The 83,048 60,020 23,028 330 238 911959 CLI Mack-Cali Realty Corp 1,198 848 350 5 3 11960 MIC Macquarie Infrastructure Corp 13,102 8,853 4,249 52 35 171961 M Macy's Inc 667,351 365,450 301,901 2,648 1,450 1,1981962 MSG Madison Square Garden Co/The 8,216 5,725 2,491 130 91 401963 MVG MAG Silver Corp 2,771 499 2,272 11 2 91964 MGLN Magellan Health Inc 130 68 62 1 0 01965 MMP Magellan Midstream Partners LP 36,559 19,873 16,686 145 79 661966 MGIC Magic Software Enterprises Ltd 275 67 208 1 0 11967 CALL magicJack VocalTec Ltd 11,918 6,793 5,125 47 27 201968 MGA Magna International Inc 18,333 12,711 5,622 73 50 221969 MX Magnachip Semiconductor Corp 27,627 16,873 10,754 110 67 431970 MHR Magnum Hunter Resources Corp 34,594 28,414 6,180 137 113 251971 MHRC Magnum Hunter Resources Corp 850 702 148 3 3 11972 MHRCQ Magnum Hunter Resources Corp 40 0 40 0 0 01973 MHLD Maiden Holdings Ltd 7,825 7,250 575 31 29 21974 MAIN Main Street Capital Corp 4,937 2,321 2,616 20 9 101975 MMYT MakeMyTrip Ltd 4,417 3,747 670 18 15 31976 MBUU Malibu Boats Inc 2,458 336 2,122 10 1 81977 MNK Mallinckrodt PLC 75,211 32,353 42,858 298 128 1701978 MANU Manchester United Plc 1,280 378 902 5 2 41979 MANH Manhattan Associates Inc 10,337 4,128 6,209 41 16 251980 MNTX Manitex International Inc 1,078 996 82 4 4 01981 MTW Manitowoc Co Inc/The 89,003 58,517 30,486 353 232 1211982 MN Manning & Napier Inc 529 395 134 2 2 11983 MNKD MannKind Corp 1,996,729 1,355,220 641,509 7,924 5,378 2,5461984 MAN ManpowerGroup Inc 16,202 13,826 2,376 64 55 9
Page 38

Standard Symbol Stock Total Call Put Total Call Put
CBOE Equity Options Volume (Includes LEAPS®)
Contract Volume Average Daily Volume
1985 MANT ManTech International Corp/VA 257 214 43 1 1 01986 MFC Manulife Financial Corp 11,896 9,618 2,278 47 38 91987 MRO Marathon Oil Corp 304,362 199,841 104,521 1,208 793 4151988 MARA Marathon Patent Group Inc 2,795 1,698 1,097 16 10 61989 MPC Marathon Petroleum Corp 127,088 71,216 55,872 504 283 2221990 MCHX Marchex Inc 120 114 6 1 1 01991 MMI Marcus & Millichap Inc 473 393 80 6 5 11992 MCS Marcus Corp/The 52 12 40 0 0 01993 MRIN Marin Software Inc 5,337 2,842 2,495 21 11 101994 MPX Marine Products Corp 66 66 0 1 1 01995 HZO MarineMax Inc 839 417 422 3 2 21996 MKL Markel Corp 3,228 1,249 1,979 15 6 91997 MKTX MarketAxess Holdings Inc 645 296 349 3 1 11998 MKTO Marketo Inc 7,340 4,216 3,124 29 17 121999 MRKT Markit Ltd 2,200 676 1,524 9 3 62000 MWE MarkWest Energy Partners LP 75,393 58,116 17,277 299 231 692001 MAR Marriott International Inc/MD 58,200 34,708 23,492 231 138 932002 VAC Marriott Vacations Worldwide Corp 1,908 1,285 623 8 5 22003 MMC Marsh & McLennan Cos Inc 6,802 4,232 2,570 27 17 102004 MRTN Marten Transport Ltd 146 95 51 1 0 02005 MSO Martha Stewart Living Omnimedia Inc 2,401 1,988 413 10 8 22006 MLM Martin Marietta Materials Inc 24,044 15,695 8,349 95 62 332007 MMLP Martin Midstream Partners LP 2,805 1,100 1,705 11 4 72008 MRVL Marvell Technology Group Ltd 415,977 361,667 54,310 1,651 1,435 2162009 MAS Masco Corp 64,787 47,715 17,072 257 189 682010 MASI Masimo Corp 1,852 1,257 595 7 5 22011 MSTX Mast Therapeutics Inc 2,496 2,496 0 10 10 02012 MTZ MasTec Inc 28,874 21,489 7,385 115 85 292013 MA MasterCard Inc 456,979 262,049 194,930 1,813 1,040 7742014 MTDR Matador Resources Co 16,351 10,540 5,811 65 42 232015 MTCH Match Group Inc 1,423 535 888 68 25 422016 MTRN Materion Corp 743 589 154 3 2 12017 MTRX Matrix Service Co 1,000 660 340 4 3 12018 MATX Matson Inc 1,449 1,163 286 6 5 12019 MAT Mattel Inc 156,222 85,633 70,589 620 340 2802020 MATR Mattersight Corp 4,682 4,072 610 19 16 22021 MATW Matthews International Corp 360 360 0 1 1 02022 MFRM Mattress Firm Holding Corp 12,533 7,313 5,220 50 29 212023 MTSN Mattson Technology Inc 2,722 2,525 197 11 10 12024 MXIM Maxim Integrated Products Inc 122,273 89,074 33,199 485 353 1322025 MXL MaxLinear Inc 19,054 5,554 13,500 76 22 542026 MXWL Maxwell Technologies Inc 18,821 6,522 12,299 75 26 492027 MBFI MB Financial Inc 735 659 76 3 3 02028 MBI MBIA Inc 193,442 44,401 149,041 768 176 5912029 MNI McClatchy Co/The 270 229 41 1 1 02030 MKC McCormick & Co Inc/MD 5,995 3,800 2,195 24 15 92031 MDR McDermott International Inc 46,966 31,593 15,373 186 125 612032 MCD McDonald's Corp 1,465,782 912,870 552,912 5,817 3,623 2,1942033 MUX McEwen Mining Inc 5,721 4,656 1,065 23 18 42034 MCGC MCG Capital Corp 1,851 1,811 40 7 7 02035 MCK McKesson Corp 47,721 22,184 25,537 189 88 1012036 MDC MDC Holdings Inc 28,253 24,565 3,688 112 97 152037 MDCA MDC Partners Inc 145 56 89 1 1 12038 MDU MDU Resources Group Inc 282 177 105 2 1 12039 MJN Mead Johnson Nutrition Co 59,101 41,746 17,355 235 166 692040 MTL Mechel PJSC 7,392 2,757 4,635 29 11 182041 TAXI Medallion Financial Corp 13,285 4,184 9,101 53 17 362042 MDAS MedAssets Inc 3,529 1,562 1,967 14 6 82043 MDGN Medgenics Inc 1,925 1,703 222 8 7 12044 MEG Media General Inc 34,885 28,699 6,186 138 114 252045 MPW Medical Properties Trust Inc 13,810 9,143 4,667 55 36 192046 MDCO Medicines Co/The 37,767 24,283 13,484 150 96 542047 MDSO Medidata Solutions Inc 5,121 3,285 1,836 20 13 72048 MED Medifast Inc 1,159 316 843 5 1 3
Page 39
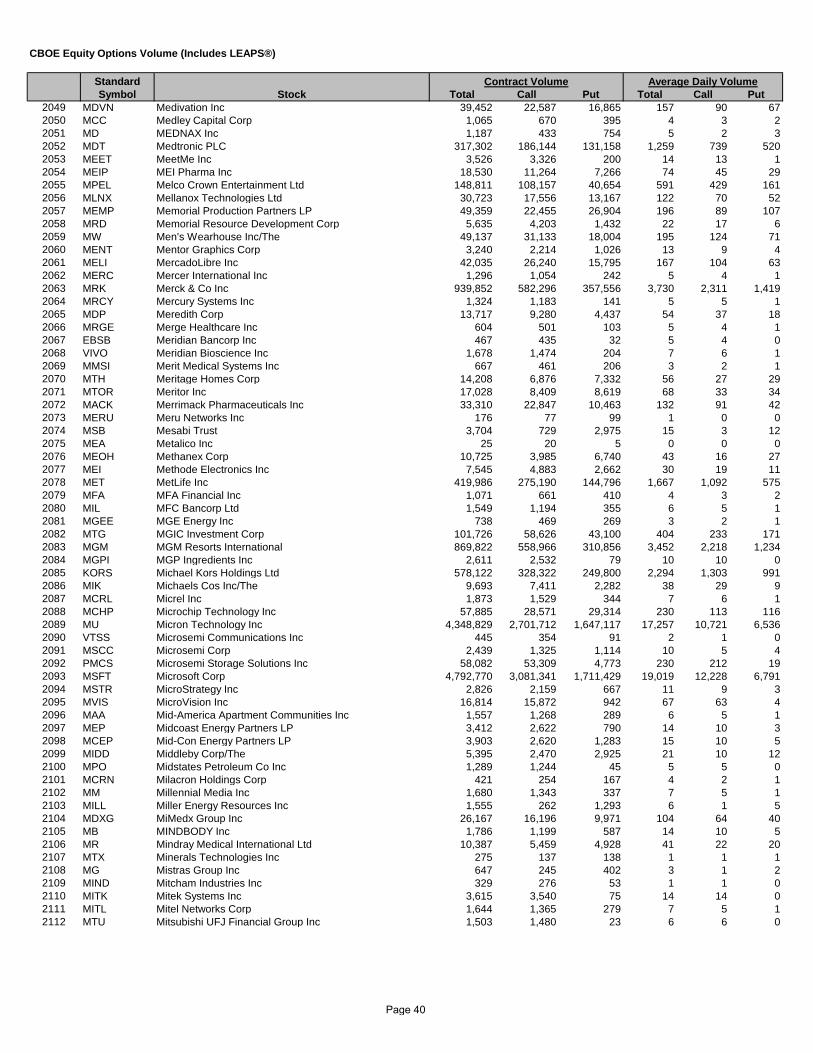
Standard Symbol Stock Total Call Put Total Call Put
CBOE Equity Options Volume (Includes LEAPS®)
Contract Volume Average Daily Volume
2049 MDVN Medivation Inc 39,452 22,587 16,865 157 90 672050 MCC Medley Capital Corp 1,065 670 395 4 3 22051 MD MEDNAX Inc 1,187 433 754 5 2 32052 MDT Medtronic PLC 317,302 186,144 131,158 1,259 739 5202053 MEET MeetMe Inc 3,526 3,326 200 14 13 12054 MEIP MEI Pharma Inc 18,530 11,264 7,266 74 45 292055 MPEL Melco Crown Entertainment Ltd 148,811 108,157 40,654 591 429 1612056 MLNX Mellanox Technologies Ltd 30,723 17,556 13,167 122 70 522057 MEMP Memorial Production Partners LP 49,359 22,455 26,904 196 89 1072058 MRD Memorial Resource Development Corp 5,635 4,203 1,432 22 17 62059 MW Men's Wearhouse Inc/The 49,137 31,133 18,004 195 124 712060 MENT Mentor Graphics Corp 3,240 2,214 1,026 13 9 42061 MELI MercadoLibre Inc 42,035 26,240 15,795 167 104 632062 MERC Mercer International Inc 1,296 1,054 242 5 4 12063 MRK Merck & Co Inc 939,852 582,296 357,556 3,730 2,311 1,4192064 MRCY Mercury Systems Inc 1,324 1,183 141 5 5 12065 MDP Meredith Corp 13,717 9,280 4,437 54 37 182066 MRGE Merge Healthcare Inc 604 501 103 5 4 12067 EBSB Meridian Bancorp Inc 467 435 32 5 4 02068 VIVO Meridian Bioscience Inc 1,678 1,474 204 7 6 12069 MMSI Merit Medical Systems Inc 667 461 206 3 2 12070 MTH Meritage Homes Corp 14,208 6,876 7,332 56 27 292071 MTOR Meritor Inc 17,028 8,409 8,619 68 33 342072 MACK Merrimack Pharmaceuticals Inc 33,310 22,847 10,463 132 91 422073 MERU Meru Networks Inc 176 77 99 1 0 02074 MSB Mesabi Trust 3,704 729 2,975 15 3 122075 MEA Metalico Inc 25 20 5 0 0 02076 MEOH Methanex Corp 10,725 3,985 6,740 43 16 272077 MEI Methode Electronics Inc 7,545 4,883 2,662 30 19 112078 MET MetLife Inc 419,986 275,190 144,796 1,667 1,092 5752079 MFA MFA Financial Inc 1,071 661 410 4 3 22080 MIL MFC Bancorp Ltd 1,549 1,194 355 6 5 12081 MGEE MGE Energy Inc 738 469 269 3 2 12082 MTG MGIC Investment Corp 101,726 58,626 43,100 404 233 1712083 MGM MGM Resorts International 869,822 558,966 310,856 3,452 2,218 1,2342084 MGPI MGP Ingredients Inc 2,611 2,532 79 10 10 02085 KORS Michael Kors Holdings Ltd 578,122 328,322 249,800 2,294 1,303 9912086 MIK Michaels Cos Inc/The 9,693 7,411 2,282 38 29 92087 MCRL Micrel Inc 1,873 1,529 344 7 6 12088 MCHP Microchip Technology Inc 57,885 28,571 29,314 230 113 1162089 MU Micron Technology Inc 4,348,829 2,701,712 1,647,117 17,257 10,721 6,5362090 VTSS Microsemi Communications Inc 445 354 91 2 1 02091 MSCC Microsemi Corp 2,439 1,325 1,114 10 5 42092 PMCS Microsemi Storage Solutions Inc 58,082 53,309 4,773 230 212 192093 MSFT Microsoft Corp 4,792,770 3,081,341 1,711,429 19,019 12,228 6,7912094 MSTR MicroStrategy Inc 2,826 2,159 667 11 9 32095 MVIS MicroVision Inc 16,814 15,872 942 67 63 42096 MAA Mid-America Apartment Communities Inc 1,557 1,268 289 6 5 12097 MEP Midcoast Energy Partners LP 3,412 2,622 790 14 10 32098 MCEP Mid-Con Energy Partners LP 3,903 2,620 1,283 15 10 52099 MIDD Middleby Corp/The 5,395 2,470 2,925 21 10 122100 MPO Midstates Petroleum Co Inc 1,289 1,244 45 5 5 02101 MCRN Milacron Holdings Corp 421 254 167 4 2 12102 MM Millennial Media Inc 1,680 1,343 337 7 5 12103 MILL Miller Energy Resources Inc 1,555 262 1,293 6 1 52104 MDXG MiMedx Group Inc 26,167 16,196 9,971 104 64 402105 MB MINDBODY Inc 1,786 1,199 587 14 10 52106 MR Mindray Medical International Ltd 10,387 5,459 4,928 41 22 202107 MTX Minerals Technologies Inc 275 137 138 1 1 12108 MG Mistras Group Inc 647 245 402 3 1 22109 MIND Mitcham Industries Inc 329 276 53 1 1 02110 MITK Mitek Systems Inc 3,615 3,540 75 14 14 02111 MITL Mitel Networks Corp 1,644 1,365 279 7 5 12112 MTU Mitsubishi UFJ Financial Group Inc 1,503 1,480 23 6 6 0
Page 40
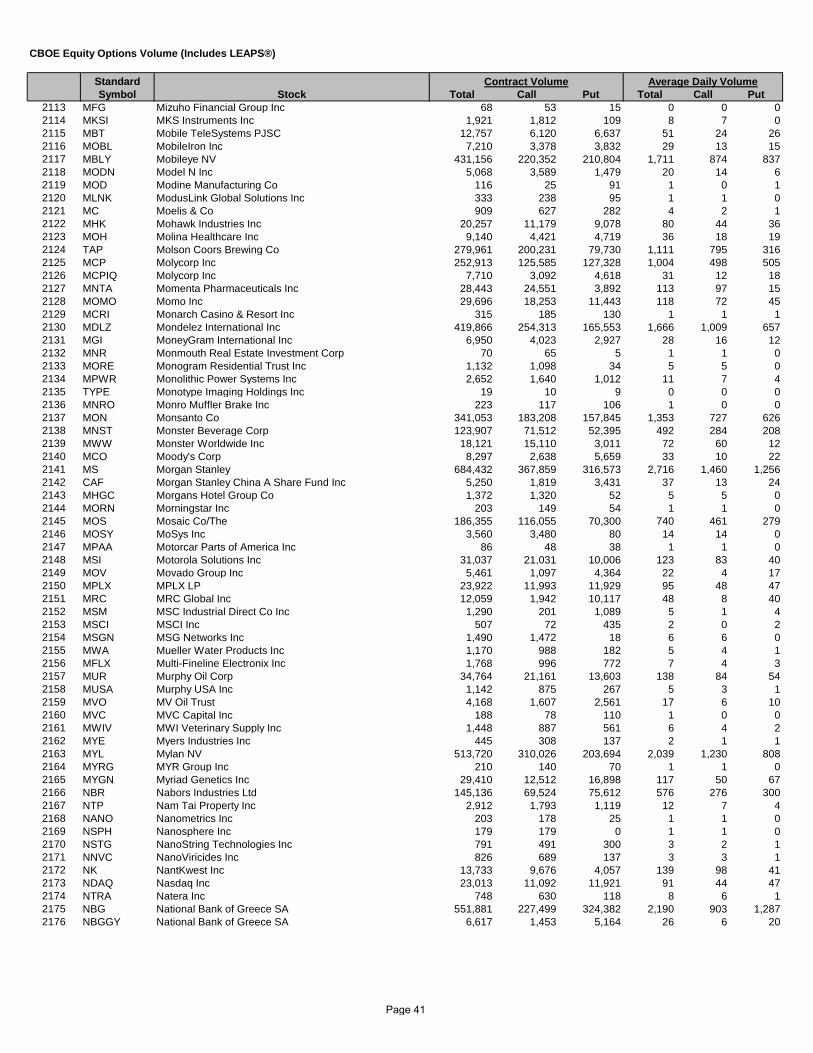
Standard Symbol Stock Total Call Put Total Call Put
CBOE Equity Options Volume (Includes LEAPS®)
Contract Volume Average Daily Volume
2113 MFG Mizuho Financial Group Inc 68 53 15 0 0 02114 MKSI MKS Instruments Inc 1,921 1,812 109 8 7 02115 MBT Mobile TeleSystems PJSC 12,757 6,120 6,637 51 24 262116 MOBL MobileIron Inc 7,210 3,378 3,832 29 13 152117 MBLY Mobileye NV 431,156 220,352 210,804 1,711 874 8372118 MODN Model N Inc 5,068 3,589 1,479 20 14 62119 MOD Modine Manufacturing Co 116 25 91 1 0 12120 MLNK ModusLink Global Solutions Inc 333 238 95 1 1 02121 MC Moelis & Co 909 627 282 4 2 12122 MHK Mohawk Industries Inc 20,257 11,179 9,078 80 44 362123 MOH Molina Healthcare Inc 9,140 4,421 4,719 36 18 192124 TAP Molson Coors Brewing Co 279,961 200,231 79,730 1,111 795 3162125 MCP Molycorp Inc 252,913 125,585 127,328 1,004 498 5052126 MCPIQ Molycorp Inc 7,710 3,092 4,618 31 12 182127 MNTA Momenta Pharmaceuticals Inc 28,443 24,551 3,892 113 97 152128 MOMO Momo Inc 29,696 18,253 11,443 118 72 452129 MCRI Monarch Casino & Resort Inc 315 185 130 1 1 12130 MDLZ Mondelez International Inc 419,866 254,313 165,553 1,666 1,009 6572131 MGI MoneyGram International Inc 6,950 4,023 2,927 28 16 122132 MNR Monmouth Real Estate Investment Corp 70 65 5 1 1 02133 MORE Monogram Residential Trust Inc 1,132 1,098 34 5 5 02134 MPWR Monolithic Power Systems Inc 2,652 1,640 1,012 11 7 42135 TYPE Monotype Imaging Holdings Inc 19 10 9 0 0 02136 MNRO Monro Muffler Brake Inc 223 117 106 1 0 02137 MON Monsanto Co 341,053 183,208 157,845 1,353 727 6262138 MNST Monster Beverage Corp 123,907 71,512 52,395 492 284 2082139 MWW Monster Worldwide Inc 18,121 15,110 3,011 72 60 122140 MCO Moody's Corp 8,297 2,638 5,659 33 10 222141 MS Morgan Stanley 684,432 367,859 316,573 2,716 1,460 1,2562142 CAF Morgan Stanley China A Share Fund Inc 5,250 1,819 3,431 37 13 242143 MHGC Morgans Hotel Group Co 1,372 1,320 52 5 5 02144 MORN Morningstar Inc 203 149 54 1 1 02145 MOS Mosaic Co/The 186,355 116,055 70,300 740 461 2792146 MOSY MoSys Inc 3,560 3,480 80 14 14 02147 MPAA Motorcar Parts of America Inc 86 48 38 1 1 02148 MSI Motorola Solutions Inc 31,037 21,031 10,006 123 83 402149 MOV Movado Group Inc 5,461 1,097 4,364 22 4 172150 MPLX MPLX LP 23,922 11,993 11,929 95 48 472151 MRC MRC Global Inc 12,059 1,942 10,117 48 8 402152 MSM MSC Industrial Direct Co Inc 1,290 201 1,089 5 1 42153 MSCI MSCI Inc 507 72 435 2 0 22154 MSGN MSG Networks Inc 1,490 1,472 18 6 6 02155 MWA Mueller Water Products Inc 1,170 988 182 5 4 12156 MFLX Multi-Fineline Electronix Inc 1,768 996 772 7 4 32157 MUR Murphy Oil Corp 34,764 21,161 13,603 138 84 542158 MUSA Murphy USA Inc 1,142 875 267 5 3 12159 MVO MV Oil Trust 4,168 1,607 2,561 17 6 102160 MVC MVC Capital Inc 188 78 110 1 0 02161 MWIV MWI Veterinary Supply Inc 1,448 887 561 6 4 22162 MYE Myers Industries Inc 445 308 137 2 1 12163 MYL Mylan NV 513,720 310,026 203,694 2,039 1,230 8082164 MYRG MYR Group Inc 210 140 70 1 1 02165 MYGN Myriad Genetics Inc 29,410 12,512 16,898 117 50 672166 NBR Nabors Industries Ltd 145,136 69,524 75,612 576 276 3002167 NTP Nam Tai Property Inc 2,912 1,793 1,119 12 7 42168 NANO Nanometrics Inc 203 178 25 1 1 02169 NSPH Nanosphere Inc 179 179 0 1 1 02170 NSTG NanoString Technologies Inc 791 491 300 3 2 12171 NNVC NanoViricides Inc 826 689 137 3 3 12172 NK NantKwest Inc 13,733 9,676 4,057 139 98 412173 NDAQ Nasdaq Inc 23,013 11,092 11,921 91 44 472174 NTRA Natera Inc 748 630 118 8 6 12175 NBG National Bank of Greece SA 551,881 227,499 324,382 2,190 903 1,2872176 NBGGY National Bank of Greece SA 6,617 1,453 5,164 26 6 20
Page 41
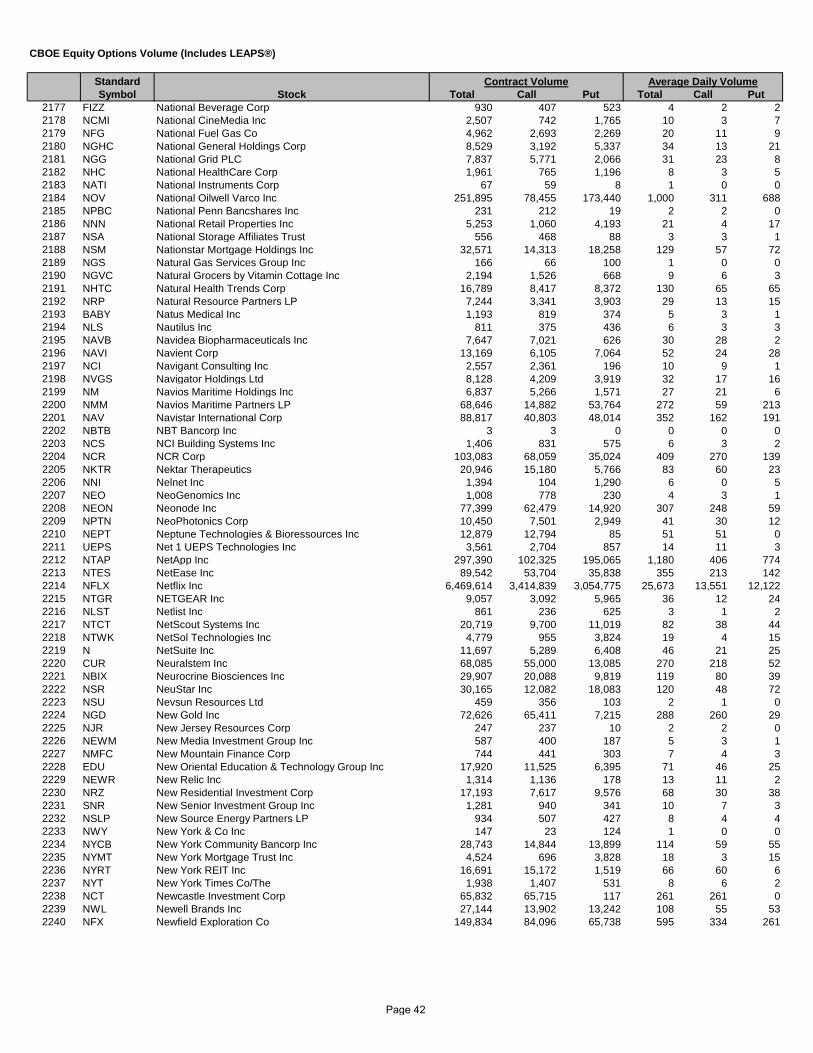
Standard Symbol Stock Total Call Put Total Call Put
CBOE Equity Options Volume (Includes LEAPS®)
Contract Volume Average Daily Volume
2177 FIZZ National Beverage Corp 930 407 523 4 2 22178 NCMI National CineMedia Inc 2,507 742 1,765 10 3 72179 NFG National Fuel Gas Co 4,962 2,693 2,269 20 11 92180 NGHC National General Holdings Corp 8,529 3,192 5,337 34 13 212181 NGG National Grid PLC 7,837 5,771 2,066 31 23 82182 NHC National HealthCare Corp 1,961 765 1,196 8 3 52183 NATI National Instruments Corp 67 59 8 1 0 02184 NOV National Oilwell Varco Inc 251,895 78,455 173,440 1,000 311 6882185 NPBC National Penn Bancshares Inc 231 212 19 2 2 02186 NNN National Retail Properties Inc 5,253 1,060 4,193 21 4 172187 NSA National Storage Affiliates Trust 556 468 88 3 3 12188 NSM Nationstar Mortgage Holdings Inc 32,571 14,313 18,258 129 57 722189 NGS Natural Gas Services Group Inc 166 66 100 1 0 02190 NGVC Natural Grocers by Vitamin Cottage Inc 2,194 1,526 668 9 6 32191 NHTC Natural Health Trends Corp 16,789 8,417 8,372 130 65 652192 NRP Natural Resource Partners LP 7,244 3,341 3,903 29 13 152193 BABY Natus Medical Inc 1,193 819 374 5 3 12194 NLS Nautilus Inc 811 375 436 6 3 32195 NAVB Navidea Biopharmaceuticals Inc 7,647 7,021 626 30 28 22196 NAVI Navient Corp 13,169 6,105 7,064 52 24 282197 NCI Navigant Consulting Inc 2,557 2,361 196 10 9 12198 NVGS Navigator Holdings Ltd 8,128 4,209 3,919 32 17 162199 NM Navios Maritime Holdings Inc 6,837 5,266 1,571 27 21 62200 NMM Navios Maritime Partners LP 68,646 14,882 53,764 272 59 2132201 NAV Navistar International Corp 88,817 40,803 48,014 352 162 1912202 NBTB NBT Bancorp Inc 3 3 0 0 0 02203 NCS NCI Building Systems Inc 1,406 831 575 6 3 22204 NCR NCR Corp 103,083 68,059 35,024 409 270 1392205 NKTR Nektar Therapeutics 20,946 15,180 5,766 83 60 232206 NNI Nelnet Inc 1,394 104 1,290 6 0 52207 NEO NeoGenomics Inc 1,008 778 230 4 3 12208 NEON Neonode Inc 77,399 62,479 14,920 307 248 592209 NPTN NeoPhotonics Corp 10,450 7,501 2,949 41 30 122210 NEPT Neptune Technologies & Bioressources Inc 12,879 12,794 85 51 51 02211 UEPS Net 1 UEPS Technologies Inc 3,561 2,704 857 14 11 32212 NTAP NetApp Inc 297,390 102,325 195,065 1,180 406 7742213 NTES NetEase Inc 89,542 53,704 35,838 355 213 1422214 NFLX Netflix Inc 6,469,614 3,414,839 3,054,775 25,673 13,551 12,1222215 NTGR NETGEAR Inc 9,057 3,092 5,965 36 12 242216 NLST Netlist Inc 861 236 625 3 1 22217 NTCT NetScout Systems Inc 20,719 9,700 11,019 82 38 442218 NTWK NetSol Technologies Inc 4,779 955 3,824 19 4 152219 N NetSuite Inc 11,697 5,289 6,408 46 21 252220 CUR Neuralstem Inc 68,085 55,000 13,085 270 218 522221 NBIX Neurocrine Biosciences Inc 29,907 20,088 9,819 119 80 392222 NSR NeuStar Inc 30,165 12,082 18,083 120 48 722223 NSU Nevsun Resources Ltd 459 356 103 2 1 02224 NGD New Gold Inc 72,626 65,411 7,215 288 260 292225 NJR New Jersey Resources Corp 247 237 10 2 2 02226 NEWM New Media Investment Group Inc 587 400 187 5 3 12227 NMFC New Mountain Finance Corp 744 441 303 7 4 32228 EDU New Oriental Education & Technology Group Inc 17,920 11,525 6,395 71 46 252229 NEWR New Relic Inc 1,314 1,136 178 13 11 22230 NRZ New Residential Investment Corp 17,193 7,617 9,576 68 30 382231 SNR New Senior Investment Group Inc 1,281 940 341 10 7 32232 NSLP New Source Energy Partners LP 934 507 427 8 4 42233 NWY New York & Co Inc 147 23 124 1 0 02234 NYCB New York Community Bancorp Inc 28,743 14,844 13,899 114 59 552235 NYMT New York Mortgage Trust Inc 4,524 696 3,828 18 3 152236 NYRT New York REIT Inc 16,691 15,172 1,519 66 60 62237 NYT New York Times Co/The 1,938 1,407 531 8 6 22238 NCT Newcastle Investment Corp 65,832 65,715 117 261 261 02239 NWL Newell Brands Inc 27,144 13,902 13,242 108 55 532240 NFX Newfield Exploration Co 149,834 84,096 65,738 595 334 261
Page 42
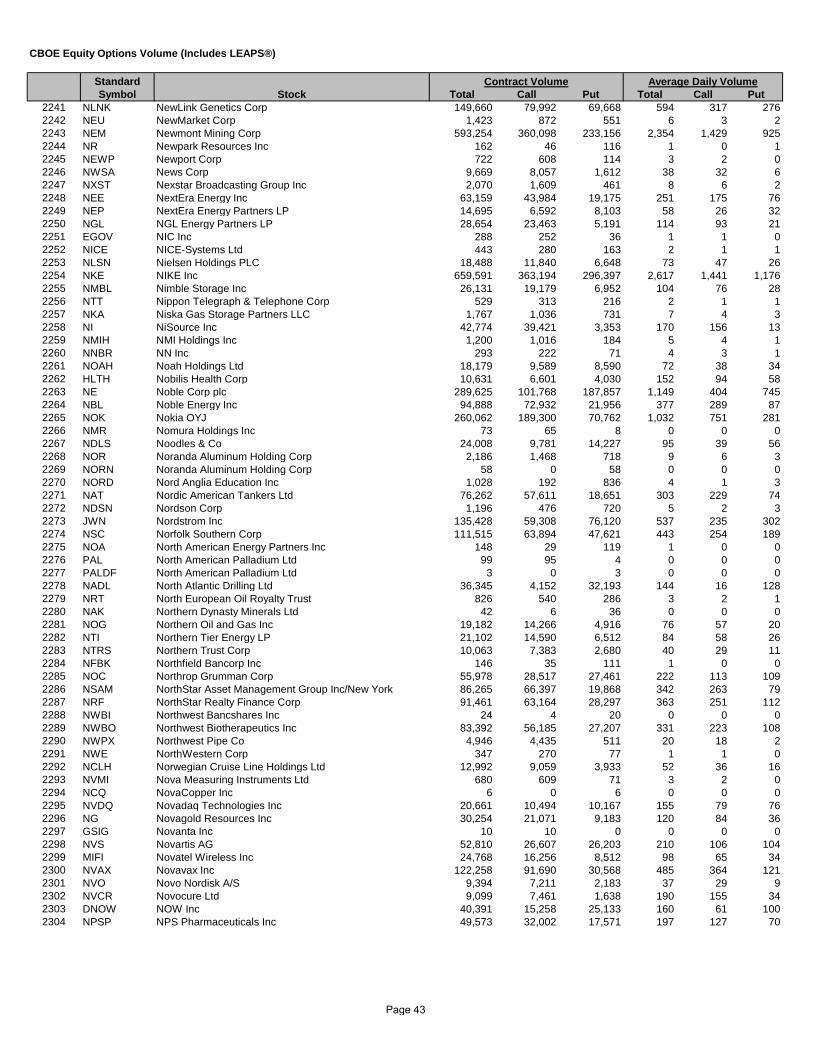
Standard Symbol Stock Total Call Put Total Call Put
CBOE Equity Options Volume (Includes LEAPS®)
Contract Volume Average Daily Volume
2241 NLNK NewLink Genetics Corp 149,660 79,992 69,668 594 317 2762242 NEU NewMarket Corp 1,423 872 551 6 3 22243 NEM Newmont Mining Corp 593,254 360,098 233,156 2,354 1,429 9252244 NR Newpark Resources Inc 162 46 116 1 0 12245 NEWP Newport Corp 722 608 114 3 2 02246 NWSA News Corp 9,669 8,057 1,612 38 32 62247 NXST Nexstar Broadcasting Group Inc 2,070 1,609 461 8 6 22248 NEE NextEra Energy Inc 63,159 43,984 19,175 251 175 762249 NEP NextEra Energy Partners LP 14,695 6,592 8,103 58 26 322250 NGL NGL Energy Partners LP 28,654 23,463 5,191 114 93 212251 EGOV NIC Inc 288 252 36 1 1 02252 NICE NICE-Systems Ltd 443 280 163 2 1 12253 NLSN Nielsen Holdings PLC 18,488 11,840 6,648 73 47 262254 NKE NIKE Inc 659,591 363,194 296,397 2,617 1,441 1,1762255 NMBL Nimble Storage Inc 26,131 19,179 6,952 104 76 282256 NTT Nippon Telegraph & Telephone Corp 529 313 216 2 1 12257 NKA Niska Gas Storage Partners LLC 1,767 1,036 731 7 4 32258 NI NiSource Inc 42,774 39,421 3,353 170 156 132259 NMIH NMI Holdings Inc 1,200 1,016 184 5 4 12260 NNBR NN Inc 293 222 71 4 3 12261 NOAH Noah Holdings Ltd 18,179 9,589 8,590 72 38 342262 HLTH Nobilis Health Corp 10,631 6,601 4,030 152 94 582263 NE Noble Corp plc 289,625 101,768 187,857 1,149 404 7452264 NBL Noble Energy Inc 94,888 72,932 21,956 377 289 872265 NOK Nokia OYJ 260,062 189,300 70,762 1,032 751 2812266 NMR Nomura Holdings Inc 73 65 8 0 0 02267 NDLS Noodles & Co 24,008 9,781 14,227 95 39 562268 NOR Noranda Aluminum Holding Corp 2,186 1,468 718 9 6 32269 NORN Noranda Aluminum Holding Corp 58 0 58 0 0 02270 NORD Nord Anglia Education Inc 1,028 192 836 4 1 32271 NAT Nordic American Tankers Ltd 76,262 57,611 18,651 303 229 742272 NDSN Nordson Corp 1,196 476 720 5 2 32273 JWN Nordstrom Inc 135,428 59,308 76,120 537 235 3022274 NSC Norfolk Southern Corp 111,515 63,894 47,621 443 254 1892275 NOA North American Energy Partners Inc 148 29 119 1 0 02276 PAL North American Palladium Ltd 99 95 4 0 0 02277 PALDF North American Palladium Ltd 3 0 3 0 0 02278 NADL North Atlantic Drilling Ltd 36,345 4,152 32,193 144 16 1282279 NRT North European Oil Royalty Trust 826 540 286 3 2 12280 NAK Northern Dynasty Minerals Ltd 42 6 36 0 0 02281 NOG Northern Oil and Gas Inc 19,182 14,266 4,916 76 57 202282 NTI Northern Tier Energy LP 21,102 14,590 6,512 84 58 262283 NTRS Northern Trust Corp 10,063 7,383 2,680 40 29 112284 NFBK Northfield Bancorp Inc 146 35 111 1 0 02285 NOC Northrop Grumman Corp 55,978 28,517 27,461 222 113 1092286 NSAM NorthStar Asset Management Group Inc/New York 86,265 66,397 19,868 342 263 792287 NRF NorthStar Realty Finance Corp 91,461 63,164 28,297 363 251 1122288 NWBI Northwest Bancshares Inc 24 4 20 0 0 02289 NWBO Northwest Biotherapeutics Inc 83,392 56,185 27,207 331 223 1082290 NWPX Northwest Pipe Co 4,946 4,435 511 20 18 22291 NWE NorthWestern Corp 347 270 77 1 1 02292 NCLH Norwegian Cruise Line Holdings Ltd 12,992 9,059 3,933 52 36 162293 NVMI Nova Measuring Instruments Ltd 680 609 71 3 2 02294 NCQ NovaCopper Inc 6 0 6 0 0 02295 NVDQ Novadaq Technologies Inc 20,661 10,494 10,167 155 79 762296 NG Novagold Resources Inc 30,254 21,071 9,183 120 84 362297 GSIG Novanta Inc 10 10 0 0 0 02298 NVS Novartis AG 52,810 26,607 26,203 210 106 1042299 MIFI Novatel Wireless Inc 24,768 16,256 8,512 98 65 342300 NVAX Novavax Inc 122,258 91,690 30,568 485 364 1212301 NVO Novo Nordisk A/S 9,394 7,211 2,183 37 29 92302 NVCR Novocure Ltd 9,099 7,461 1,638 190 155 342303 DNOW NOW Inc 40,391 15,258 25,133 160 61 1002304 NPSP NPS Pharmaceuticals Inc 49,573 32,002 17,571 197 127 70
Page 43

Standard Symbol Stock Total Call Put Total Call Put
CBOE Equity Options Volume (Includes LEAPS®)
Contract Volume Average Daily Volume
2305 NQ NQ Mobile Inc 145,150 101,808 43,342 576 404 1722306 NRG NRG Energy Inc 121,051 92,737 28,314 480 368 1122307 NYLDA NRG Yield Inc 456 218 238 2 1 12308 NYLD NRG Yield Inc 19,514 2,757 16,757 136 19 1172309 NTLS NTELOS Holdings Corp 9,381 6,610 2,771 37 26 112310 DCM NTT DOCOMO Inc 751 435 316 3 2 12311 NUS Nu Skin Enterprises Inc 80,411 26,397 54,014 319 105 2142312 NUAN Nuance Communications Inc 79,406 62,245 17,161 315 247 682313 NUE Nucor Corp 101,778 72,458 29,320 404 288 1162314 NMRX Numerex Corp 142 107 35 1 1 02315 NS NuStar Energy LP 7,100 4,647 2,453 28 18 102316 NSH NuStar GP Holdings LLC 1,021 776 245 4 3 12317 NTRI Nutrisystem Inc 14,774 10,273 4,501 59 41 182318 NUVA NuVasive Inc 13,758 9,023 4,735 55 36 192319 NES Nuverra Environmental Solutions Inc 5,597 3,158 2,439 22 13 102320 NVDA NVIDIA Corp 504,858 276,559 228,299 2,003 1,097 9062321 NXPI NXP Semiconductors NV 330,132 174,392 155,740 1,310 692 6182322 NXTM NxStage Medical Inc 8,143 6,476 1,667 32 26 72323 NYMX Nymox Pharmaceutical Corp 3,829 2,611 1,218 15 10 52324 OAK Oaktree Capital Group LLC 4,482 2,490 1,992 18 10 82325 OAS Oasis Petroleum Inc 159,190 93,561 65,629 632 371 2602326 OCAT Ocata Therapeutics Inc 33,762 23,613 10,149 168 117 502327 OXY Occidental Petroleum Corp 328,370 203,626 124,744 1,303 808 4952328 ORIG Ocean Rig UDW Inc 28,352 8,246 20,106 113 33 802329 OII Oceaneering International Inc 4,797 3,538 1,259 19 14 52330 OZM Och-Ziff Capital Management Group LLC 10,064 7,496 2,568 40 30 102331 OCIP OCI Partners LP 1,663 266 1,397 7 1 62332 OCLR Oclaro Inc 1,720 1,584 136 7 6 12333 OCN Ocwen Financial Corp 270,817 117,790 153,027 1,075 467 6072334 OMEX Odyssey Marine Exploration Inc 2,159 2,021 138 9 8 12335 ODP Office Depot Inc 807,345 704,043 103,302 3,204 2,794 4102336 OFG OFG Bancorp 11,084 5,291 5,793 44 21 232337 OGE OGE Energy Corp 664 382 282 3 2 12338 OHAI OHA Investment Corp 3 3 0 0 0 02339 OHRP Ohr Pharmaceutical Inc 33,024 20,908 12,116 131 83 482340 OIS Oil States International Inc 8,432 1,152 7,280 33 5 292341 ODFL Old Dominion Freight Line Inc 3,957 1,754 2,203 16 7 92342 ONB Old National Bancorp/IN 283 153 130 1 1 12343 ORI Old Republic International Corp 2,276 1,899 377 9 8 12344 OLN Olin Corp 42,267 27,252 15,015 168 108 602345 OLLI Ollie's Bargain Outlet Holdings Inc 663 609 54 7 7 12346 ZEUS Olympic Steel Inc 620 430 190 2 2 12347 OHI Omega Healthcare Investors Inc 16,356 9,994 6,362 65 40 252348 OME Omega Protein Corp 1,955 1,222 733 8 5 32349 OMER Omeros Corp 19,454 13,631 5,823 77 54 232350 OCR Omnicare Inc 26,328 19,519 6,809 104 77 272351 OMC Omnicom Group Inc 13,889 9,516 4,373 55 38 172352 OVTI OmniVision Technologies Inc 77,042 41,738 35,304 306 166 1402353 OMN OMNOVA Solutions Inc 2,031 1,144 887 8 5 42354 ASGN On Assignment Inc 17,826 12,397 5,429 71 49 222355 ONDK On Deck Capital Inc 11,559 5,179 6,380 47 21 262356 ON ON Semiconductor Corp 15,232 11,526 3,706 60 46 152357 ONNN ON Semiconductor Corp 9,492 7,754 1,738 38 31 72358 OGXI OncoGenex Pharmaceuticals Inc 3,683 3,213 470 15 13 22359 ONCY Oncolytics Biotech Inc 6,596 6,345 251 26 25 12360 ONTX Onconova Therapeutics Inc 459 173 286 2 1 12361 ONTY Oncothyreon Inc 28,659 25,249 3,410 114 100 142362 OGS ONE Gas Inc 1,634 1,575 59 6 6 02363 OLP One Liberty Properties Inc 25 12 13 0 0 02364 OB OneBeacon Insurance Group Ltd 40 29 11 1 0 02365 LEAF OneMain Holdings Inc 8,177 6,012 2,165 32 24 92366 OMF OneMain Holdings Inc 115 100 15 0 0 02367 OKE ONEOK Inc 38,388 29,141 9,247 152 116 372368 OKS ONEOK Partners LP 23,026 16,161 6,865 91 64 27
Page 44

Standard Symbol Stock Total Call Put Total Call Put
CBOE Equity Options Volume (Includes LEAPS®)
Contract Volume Average Daily Volume
2369 OOMA Ooma Inc 483 270 213 7 4 32370 OTEX Open Text Corp 10,515 3,572 6,943 42 14 282371 OPHT Ophthotech Corp 12,216 7,219 4,997 48 29 202372 OPK OPKO Health Inc 283,237 169,250 113,987 1,124 672 4522373 OPWR OPOWER Inc 5,427 2,387 3,040 22 9 122374 ORCL Oracle Corp 1,233,872 649,473 584,399 4,896 2,577 2,3192375 ORMP Oramed Pharmaceuticals Inc 3,595 3,149 446 14 12 22376 ORAN Orange SA 6,295 3,549 2,746 25 14 112377 OSUR OraSure Technologies Inc 5,114 4,321 793 20 17 32378 ORBC ORBCOMM Inc 1,639 1,615 24 21 21 02379 ATK Orbital ATK Inc 1,552 999 553 6 4 22380 OA Orbital ATK Inc 9,495 6,995 2,500 38 28 102381 ORB Orbital Sciences Corp 780 656 124 3 3 02382 OWW Orbitz Worldwide Inc 83,277 69,662 13,615 330 276 542383 ORBK Orbotech Ltd 526 337 189 4 3 12384 ORLY O'Reilly Automotive Inc 18,011 10,084 7,927 71 40 312385 OREX Orexigen Therapeutics Inc 96,440 44,061 52,379 383 175 2082386 ONVO Organovo Holdings Inc 52,691 30,358 22,333 209 120 892387 ONP Orient Paper Inc 159 129 30 1 1 02388 SEED Origin Agritech Ltd 1,023 1,023 0 4 4 02389 OESX Orion Energy Systems Inc 2,520 332 2,188 10 1 92390 ORN Orion Marine Group Inc 89 47 42 0 0 02391 ORIT Oritani Financial Corp 172 84 88 1 0 02392 ORA Ormat Technologies Inc 3,825 1,998 1,827 15 8 72393 OFIX Orthofix International NV 107 48 59 0 0 02394 OSK Oshkosh Corp 10,826 8,937 1,889 43 35 72395 OSIS OSI Systems Inc 3,000 1,789 1,211 12 7 52396 OSIR Osiris Therapeutics Inc 5,276 1,934 3,342 21 8 132397 OTIC Otonomy Inc 635 258 377 4 2 22398 OTTR Otter Tail Corp 71 30 41 1 0 12399 OUTR Outerwall Inc 58,329 32,725 25,604 231 130 1022400 OUT Outfront Media Inc 20,757 12,550 8,207 82 50 332401 OVAS OvaScience Inc 26,824 13,010 13,814 119 58 612402 OSTK Overstock.com Inc 4,439 2,814 1,625 18 11 62403 OC Owens Corning 53,141 39,903 13,238 211 158 532404 OI Owens-Illinois Inc 18,826 9,791 9,035 75 39 362405 OXM Oxford Industries Inc 1,886 1,162 724 7 5 32406 OXGN OXiGENE Inc 1,945 1,945 0 8 8 02407 PCAR PACCAR Inc 26,637 11,964 14,673 106 47 582408 PACB Pacific Biosciences of California Inc 14,477 9,193 5,284 57 36 212409 ROYT Pacific Coast Oil Trust 14,725 2,203 12,522 58 9 502410 PACD Pacific Drilling SA 2,031 1,908 123 8 8 02411 PEIX Pacific Ethanol Inc 33,635 19,623 14,012 133 78 562412 PPBI Pacific Premier Bancorp Inc 243 219 24 3 3 02413 PSUN Pacific Sunwear of California Inc 369 308 61 1 1 02414 PCRX Pacira Pharmaceuticals Inc/DE 30,187 19,017 11,170 120 75 442415 PKG Packaging Corp of America 15,220 10,288 4,932 60 41 202416 PACW PacWest Bancorp 2,852 2,639 213 11 10 12417 PTIE Pain Therapeutics Inc 1,138 1,138 0 5 5 02418 PLL Pall Corp 12,271 7,772 4,499 49 31 182419 PANW Palo Alto Networks Inc 386,951 199,875 187,076 1,536 793 7422420 PAAS Pan American Silver Corp 47,208 34,533 12,675 187 137 502421 P Pandora Media Inc 616,382 407,947 208,435 2,446 1,619 8272422 PNRA Panera Bread Co 65,910 29,607 36,303 262 117 1442423 PHX Panhandle Oil and Gas Inc 3,086 1,876 1,210 12 7 52424 PTRY Pantry Inc/The 378 189 189 2 1 12425 PZZA Papa John's International Inc 14,962 6,285 8,677 59 25 342426 FRSH Papa Murphy's Holdings Inc 7,027 4,999 2,028 28 20 82427 PARR Par Pacific Holdings Inc 524 421 103 5 4 12428 PGN Paragon Offshore PLC 7,479 4,724 2,755 30 19 112429 PZG Paramount Gold Nevada Corp 1,667 900 767 7 4 32430 PGRE Paramount Group Inc 808 341 467 3 1 22431 PRTK Paratek Pharmaceuticals Inc 12 10 2 0 0 02432 PRXL PAREXEL International Corp 3,884 1,699 2,185 15 7 9
Page 45
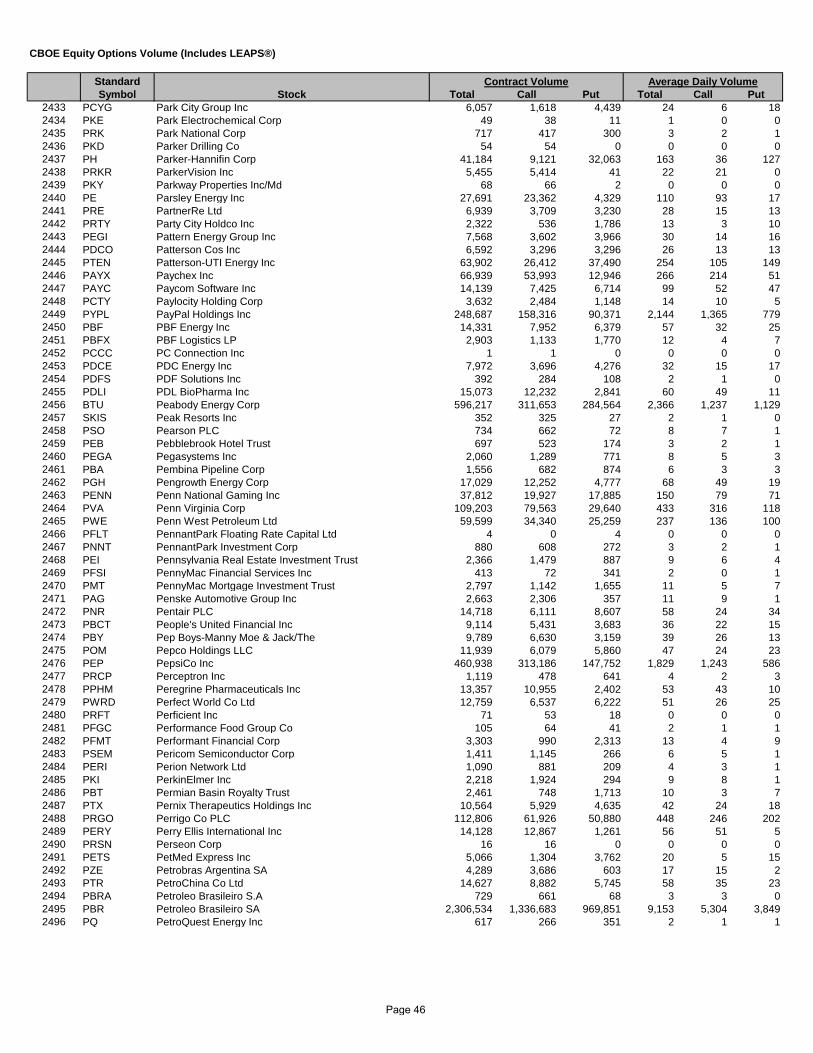
Standard Symbol Stock Total Call Put Total Call Put
CBOE Equity Options Volume (Includes LEAPS®)
Contract Volume Average Daily Volume
2433 PCYG Park City Group Inc 6,057 1,618 4,439 24 6 182434 PKE Park Electrochemical Corp 49 38 11 1 0 02435 PRK Park National Corp 717 417 300 3 2 12436 PKD Parker Drilling Co 54 54 0 0 0 02437 PH Parker-Hannifin Corp 41,184 9,121 32,063 163 36 1272438 PRKR ParkerVision Inc 5,455 5,414 41 22 21 02439 PKY Parkway Properties Inc/Md 68 66 2 0 0 02440 PE Parsley Energy Inc 27,691 23,362 4,329 110 93 172441 PRE PartnerRe Ltd 6,939 3,709 3,230 28 15 132442 PRTY Party City Holdco Inc 2,322 536 1,786 13 3 102443 PEGI Pattern Energy Group Inc 7,568 3,602 3,966 30 14 162444 PDCO Patterson Cos Inc 6,592 3,296 3,296 26 13 132445 PTEN Patterson-UTI Energy Inc 63,902 26,412 37,490 254 105 1492446 PAYX Paychex Inc 66,939 53,993 12,946 266 214 512447 PAYC Paycom Software Inc 14,139 7,425 6,714 99 52 472448 PCTY Paylocity Holding Corp 3,632 2,484 1,148 14 10 52449 PYPL PayPal Holdings Inc 248,687 158,316 90,371 2,144 1,365 7792450 PBF PBF Energy Inc 14,331 7,952 6,379 57 32 252451 PBFX PBF Logistics LP 2,903 1,133 1,770 12 4 72452 PCCC PC Connection Inc 1 1 0 0 0 02453 PDCE PDC Energy Inc 7,972 3,696 4,276 32 15 172454 PDFS PDF Solutions Inc 392 284 108 2 1 02455 PDLI PDL BioPharma Inc 15,073 12,232 2,841 60 49 112456 BTU Peabody Energy Corp 596,217 311,653 284,564 2,366 1,237 1,1292457 SKIS Peak Resorts Inc 352 325 27 2 1 02458 PSO Pearson PLC 734 662 72 8 7 12459 PEB Pebblebrook Hotel Trust 697 523 174 3 2 12460 PEGA Pegasystems Inc 2,060 1,289 771 8 5 32461 PBA Pembina Pipeline Corp 1,556 682 874 6 3 32462 PGH Pengrowth Energy Corp 17,029 12,252 4,777 68 49 192463 PENN Penn National Gaming Inc 37,812 19,927 17,885 150 79 712464 PVA Penn Virginia Corp 109,203 79,563 29,640 433 316 1182465 PWE Penn West Petroleum Ltd 59,599 34,340 25,259 237 136 1002466 PFLT PennantPark Floating Rate Capital Ltd 4 0 4 0 0 02467 PNNT PennantPark Investment Corp 880 608 272 3 2 12468 PEI Pennsylvania Real Estate Investment Trust 2,366 1,479 887 9 6 42469 PFSI PennyMac Financial Services Inc 413 72 341 2 0 12470 PMT PennyMac Mortgage Investment Trust 2,797 1,142 1,655 11 5 72471 PAG Penske Automotive Group Inc 2,663 2,306 357 11 9 12472 PNR Pentair PLC 14,718 6,111 8,607 58 24 342473 PBCT People's United Financial Inc 9,114 5,431 3,683 36 22 152474 PBY Pep Boys-Manny Moe & Jack/The 9,789 6,630 3,159 39 26 132475 POM Pepco Holdings LLC 11,939 6,079 5,860 47 24 232476 PEP PepsiCo Inc 460,938 313,186 147,752 1,829 1,243 5862477 PRCP Perceptron Inc 1,119 478 641 4 2 32478 PPHM Peregrine Pharmaceuticals Inc 13,357 10,955 2,402 53 43 102479 PWRD Perfect World Co Ltd 12,759 6,537 6,222 51 26 252480 PRFT Perficient Inc 71 53 18 0 0 02481 PFGC Performance Food Group Co 105 64 41 2 1 12482 PFMT Performant Financial Corp 3,303 990 2,313 13 4 92483 PSEM Pericom Semiconductor Corp 1,411 1,145 266 6 5 12484 PERI Perion Network Ltd 1,090 881 209 4 3 12485 PKI PerkinElmer Inc 2,218 1,924 294 9 8 12486 PBT Permian Basin Royalty Trust 2,461 748 1,713 10 3 72487 PTX Pernix Therapeutics Holdings Inc 10,564 5,929 4,635 42 24 182488 PRGO Perrigo Co PLC 112,806 61,926 50,880 448 246 2022489 PERY Perry Ellis International Inc 14,128 12,867 1,261 56 51 52490 PRSN Perseon Corp 16 16 0 0 0 02491 PETS PetMed Express Inc 5,066 1,304 3,762 20 5 152492 PZE Petrobras Argentina SA 4,289 3,686 603 17 15 22493 PTR PetroChina Co Ltd 14,627 8,882 5,745 58 35 232494 PBRA Petroleo Brasileiro S.A 729 661 68 3 3 02495 PBR Petroleo Brasileiro SA 2,306,534 1,336,683 969,851 9,153 5,304 3,8492496 PQ PetroQuest Energy Inc 617 266 351 2 1 1
Page 46

Standard Symbol Stock Total Call Put Total Call Put
CBOE Equity Options Volume (Includes LEAPS®)
Contract Volume Average Daily Volume
2497 PETM PetSmart Inc 10,735 6,391 4,344 43 25 172498 PFE Pfizer Inc 2,257,274 1,520,458 736,816 8,957 6,034 2,9242499 PFSW PFSweb Inc 1,644 1,469 175 7 6 12500 PCG PG&E Corp 10,088 8,137 1,951 40 32 82501 PGTI PGT Inc 948 735 213 4 3 12502 GLT PH Glatfelter Co 414 390 24 5 4 02503 PCYC Pharmacyclics Inc 49,933 35,936 13,997 198 143 562504 PIP PharmAthene Inc 693 692 1 3 3 02505 PMC PharMerica Corp 698 550 148 3 2 12506 PT Pharol SGPS SA 325 60 265 1 0 12507 PTGCY Pharol SGPS SA 11 0 11 0 0 02508 PHH PHH Corp 12,906 7,712 5,194 51 31 212509 PM Philip Morris International Inc 334,960 185,526 149,434 1,329 736 5932510 PSX Phillips 66 199,253 130,252 69,001 791 517 2742511 PSXP Phillips 66 Partners LP 4,860 4,046 814 19 16 32512 FENG Phoenix New Media Ltd 1,093 781 312 4 3 12513 PHMD PhotoMedex Inc 488 408 80 2 2 02514 PLAB Photronics Inc 4,268 3,810 458 17 15 22515 DOC Physicians Realty Trust 1,446 963 483 6 4 22516 PICO PICO Holdings Inc 883 767 116 4 3 02517 PNY Piedmont Natural Gas Co Inc 495 257 238 2 1 12518 PDM Piedmont Office Realty Trust Inc 202 90 112 1 0 02519 PIR Pier 1 Imports Inc 43,663 15,621 28,042 173 62 1112520 PPC Pilgrim's Pride Corp 60,750 38,016 22,734 241 151 902521 PNK Pinnacle Entertainment Inc 176,993 159,319 17,674 702 632 702522 PNFP Pinnacle Financial Partners Inc 215 185 30 1 1 02523 PF Pinnacle Foods Inc 13,288 12,471 817 53 49 32524 PES Pioneer Energy Services Corp 3,029 2,320 709 12 9 32525 PXD Pioneer Natural Resources Co 168,375 100,226 68,149 668 398 2702526 PJC Piper Jaffray Cos 118 106 12 0 0 02527 PBI Pitney Bowes Inc 19,400 8,608 10,792 77 34 432528 PXLW Pixelworks Inc 4,601 4,007 594 18 16 22529 PJT PJT Partners Inc 563 259 304 13 6 72530 PAA Plains All American Pipeline LP 93,335 47,051 46,284 370 187 1842531 PAGP Plains GP Holdings LP 34,027 7,293 26,734 135 29 1062532 PLNR Planar Systems Inc 2,924 1,668 1,256 25 15 112533 PLNT Planet Fitness Inc 8,052 6,292 1,760 85 66 192534 PLT Plantronics Inc 1,833 1,395 438 7 6 22535 PAH Platform Specialty Products Corp 27,495 18,771 8,724 109 74 352536 PLXS Plexus Corp 2,724 1,756 968 11 7 42537 PLUG Plug Power Inc 142,590 112,877 29,713 566 448 1182538 PCL Plum Creek Timber Co Inc 27,636 20,809 6,827 110 83 272539 PSTI Pluristem Therapeutics Inc 7,848 5,556 2,292 31 22 92540 PGEM Ply Gem Holdings Inc 479 279 200 2 1 12541 PNC PNC Financial Services Group Inc/The 56,894 34,101 22,793 226 135 902542 PNM PNM Resources Inc 416 188 228 2 1 12543 PCOM Points International Ltd 2,529 1,981 548 10 8 22544 PII Polaris Industries Inc 50,984 18,926 32,058 202 75 1272545 PLCM Polycom Inc 4,020 1,639 2,381 16 7 92546 POL PolyOne Corp 1,896 985 911 8 4 42547 PPO Polypore International Inc 5,325 2,372 2,953 21 9 122548 POOL Pool Corp 2,827 770 2,057 11 3 82549 PLKI Popeyes Louisiana Kitchen Inc 8,150 5,190 2,960 32 21 122550 BPOP Popular Inc 18,450 12,995 5,455 73 52 222551 POR Portland General Electric Co 292 155 137 1 1 12552 PTLA Portola Pharmaceuticals Inc 13,588 5,954 7,634 54 24 302553 PKX POSCO 23,793 6,700 17,093 94 27 682554 POST Post Holdings Inc 79,255 60,720 18,535 315 241 742555 PPS Post Properties Inc 113 75 38 0 0 02556 POT Potash Corp of Saskatchewan Inc 366,610 243,073 123,537 1,455 965 4902557 PBPB Potbelly Corp 5,936 4,097 1,839 24 16 72558 POWI Power Integrations Inc 1,770 882 888 7 4 42559 POWR PowerSecure International Inc 5,590 4,984 606 22 20 22560 POZN POZEN Inc 14,366 9,565 4,801 57 38 19
Page 47

Standard Symbol Stock Total Call Put Total Call Put
CBOE Equity Options Volume (Includes LEAPS®)
Contract Volume Average Daily Volume
2561 PPG PPG Industries Inc 37,383 22,132 15,251 148 88 612562 PPL PPL Corp 91,718 83,273 8,445 364 330 342563 PRAA PRA Group Inc 10,731 3,020 7,711 43 12 312564 PRAH PRA Health Sciences Inc 1,899 1,111 788 8 4 32565 PRAN Prana Biotechnology Ltd 3,557 3,494 63 14 14 02566 PX Praxair Inc 23,708 15,683 8,025 94 62 322567 PCP Precision Castparts Corp 52,841 29,136 23,705 210 116 942568 PDS Precision Drilling Corp 18,803 9,053 9,750 75 36 392569 PINC Premier Inc 1,080 732 348 4 3 12570 PGI Premiere Global Services Inc 451 413 38 6 5 02571 PVG Pretium Resources Inc 14,869 11,516 3,353 59 46 132572 PRGX PRGX Global Inc 26 25 1 0 0 02573 PCLN Priceline Group Inc/The 1,093,126 579,206 513,920 4,338 2,298 2,0392574 PSMT PriceSmart Inc 4,067 2,090 1,977 16 8 82575 PRI Primerica Inc 431 118 313 2 0 12576 PPP Primero Mining Corp 7,657 7,359 298 30 29 12577 PRMW Primo Water Corp 287 244 43 4 3 12578 PRIM Primoris Services Corp 162 99 63 1 0 02579 PFG Principal Financial Group Inc 5,582 3,966 1,616 22 16 62580 PVTB PrivateBancorp Inc 259 133 126 1 1 12581 PRA ProAssurance Corp 204 80 124 1 0 02582 PKT Procera Networks Inc 1,289 1,022 267 5 4 12583 PG Procter & Gamble Co/The 903,716 493,428 410,288 3,586 1,958 1,6282584 PFIE Profire Energy Inc 12 2 10 0 0 02585 PGNX Progenics Pharmaceuticals Inc 7,730 5,595 2,135 31 22 82586 PRGS Progress Software Corp 256 203 53 2 2 02587 PGR Progressive Corp/The 29,417 19,923 9,494 117 79 382588 BIN Progressive Waste Solutions Ltd 4,546 4,464 82 45 45 12589 PLD Prologis Inc 16,030 13,148 2,882 64 52 112590 PFPT Proofpoint Inc 11,378 6,035 5,343 45 24 212591 PRO PROS Holdings Inc 361 168 193 1 1 12592 RNA Prosensa Holding NV 38,480 6,138 32,342 153 24 1282593 PSEC Prospect Capital Corp 48,074 21,812 26,262 191 87 1042594 PLX Protalix BioTherapeutics Inc 1,268 845 423 5 3 22595 PL Protective Life Corp 482 129 353 2 1 12596 PRTA Prothena Corp PLC 54,400 18,108 36,292 216 72 1442597 PRLB Proto Labs Inc 18,337 5,594 12,743 73 22 512598 PRSC Providence Service Corp/The 133 59 74 1 0 02599 PFS Provident Financial Services Inc 1 1 0 0 0 02600 PRU Prudential Financial Inc 205,220 153,584 51,636 814 609 2052601 PUK Prudential PLC 442 392 50 2 2 02602 PSB PS Business Parks Inc 32 20 12 0 0 02603 PSDV pSivida Corp 3,301 2,666 635 13 11 32604 PTC PTC Inc 7,460 6,826 634 30 27 32605 PTCT PTC Therapeutics Inc 112,490 56,464 56,026 446 224 2222606 PEG Public Service Enterprise Group Inc 20,238 18,100 2,138 80 72 82607 PSA Public Storage 15,564 8,968 6,596 62 36 262608 PHM PulteGroup Inc 114,264 68,639 45,625 453 272 1812609 PBYI Puma Biotechnology Inc 38,760 19,924 18,836 154 79 752610 PCYO Pure Cycle Corp 21 1 20 0 0 02611 PSTG Pure Storage Inc 11,553 8,130 3,423 231 163 682612 PVH PVH Corp 43,889 29,127 14,762 174 116 592613 QTWO Q2 Holdings Inc 2,409 1,279 1,130 11 6 52614 QADA QAD Inc 117 24 93 2 0 12615 QEPM QEP Midstream Partners LP 228 48 180 1 0 12616 QEP QEP Resources Inc 37,267 25,854 11,413 148 103 452617 QGEN QIAGEN NV 4,538 3,482 1,056 18 14 42618 QIHU Qihoo 360 Technology Co Ltd 308,765 202,868 105,897 1,225 805 4202619 QIWI QIWI plc 12,779 7,276 5,503 51 29 222620 QLIK Qlik Technologies Inc 133,802 118,981 14,821 531 472 592621 QLGC QLogic Corp 10,672 8,722 1,950 42 35 82622 QLTI QLT Inc 1,107 571 536 4 2 22623 QRVO Qorvo Inc 109,839 78,109 31,730 438 311 1262624 QTS QTS Realty Trust Inc 929 513 416 4 2 2
Page 48

Standard Symbol Stock Total Call Put Total Call Put
CBOE Equity Options Volume (Includes LEAPS®)
Contract Volume Average Daily Volume
2625 QUAD Quad/Graphics Inc 491 443 48 2 2 02626 QCOM QUALCOMM Inc 1,818,792 1,075,527 743,265 7,217 4,268 2,9492627 QLTY Quality Distribution Inc 3,548 2,386 1,162 14 9 52628 QSII Quality Systems Inc 4,247 3,218 1,029 17 13 42629 QLYS Qualys Inc 25,207 15,243 9,964 100 60 402630 NX Quanex Building Products Corp 844 627 217 3 2 12631 PWR Quanta Services Inc 36,479 22,790 13,689 145 90 542632 QTM Quantum Corp 4,410 3,872 538 18 15 22633 QTWW Quantum Fuel Systems Technologies Worldwide Inc 2,443 1,786 657 10 7 32634 DGX Quest Diagnostics Inc 25,366 19,138 6,228 101 76 252635 STR Questar Corp 1,337 951 386 5 4 22636 QUIK QuickLogic Corp 4,910 2,710 2,200 19 11 92637 QDEL Quidel Corp 1,661 159 1,502 7 1 62638 ZQK Quiksilver Inc 25,395 19,209 6,186 101 76 252639 QNST QuinStreet Inc 357 55 302 1 0 12640 Q Quintiles Transnational Holdings Inc 8,330 5,078 3,252 33 20 132641 QUNR Qunar Cayman Islands Ltd 63,862 39,923 23,939 253 158 952642 COUP Quotient Technology Inc 18,874 13,853 5,021 75 55 202643 QUOT Quotient Technology Inc 979 915 64 4 4 02644 RAX Rackspace Hosting Inc 95,199 54,623 40,576 378 217 1612645 RDN Radian Group Inc 40,779 28,536 12,243 162 113 492646 ROIAK Radio One Inc 827 66 761 3 0 32647 RDUS Radius Health Inc 19,711 14,602 5,109 181 134 472648 RDNT RadNet Inc 2,961 2,175 786 12 9 32649 RDWR Radware Ltd 8,352 5,911 2,441 33 23 102650 RAS RAIT Financial Trust 6,146 3,147 2,999 24 12 122651 RALY Rally Software Development Corp 3,538 2,497 1,041 14 10 42652 RL Ralph Lauren Corp 84,214 36,793 47,421 334 146 1882653 RMBS Rambus Inc 124,908 109,025 15,883 496 433 632654 RPT Ramco-Gershenson Properties Trust 179 102 77 1 0 02655 GOLD Randgold Resources Ltd 54,563 29,114 25,449 217 116 1012656 RRC Range Resources Corp 173,085 129,924 43,161 687 516 1712657 RPTP Raptor Pharmaceutical Corp 111,239 53,864 57,375 441 214 2282658 REE Rare Element Resources Ltd 37 36 1 0 0 02659 RAVN Raven Industries Inc 504 375 129 2 1 12660 RJF Raymond James Financial Inc 6,253 3,219 3,034 25 13 122661 RYAM Rayonier Advanced Materials Inc 14,724 8,555 6,169 58 34 242662 RYN Rayonier Inc 2,738 1,653 1,085 11 7 42663 RTN Raytheon Co 81,267 59,758 21,509 322 237 852664 ROLL RBC Bearings Inc 54 22 32 0 0 02665 RICK RCI Hospitality Holdings Inc 1,230 816 414 5 3 22666 RCAP RCS Capital Corp 16,010 6,697 9,313 64 27 372667 RMAX RE/MAX Holdings Inc 2,579 255 2,324 10 1 92668 RLOC ReachLocal Inc 371 364 7 1 1 02669 RDI Reading International Inc 1,301 875 426 11 8 42670 RGSE Real Goods Solar Inc 9,771 9,634 137 39 38 12671 RELY Real Industry Inc 5,133 2,312 2,821 33 15 182672 RLD RealD Inc 9,967 7,889 2,078 40 31 82673 RNWK RealNetworks Inc 1,198 1,019 179 5 4 12674 RLGY Realogy Holdings Corp 18,139 11,193 6,946 72 44 282675 RP RealPage Inc 825 509 316 3 2 12676 O Realty Income Corp 27,759 11,143 16,616 110 44 662677 RCPT Receptos Inc 45,659 33,644 12,015 181 134 482678 RHT Red Hat Inc 74,672 46,049 28,623 296 183 1142679 RRGB Red Robin Gourmet Burgers Inc 16,274 10,382 5,892 65 41 232680 REDF Rediff.Com India Ltd 198 155 43 1 1 02681 RWT Redwood Trust Inc 629 298 331 2 1 12682 REED Reed's Inc 1,645 1,104 541 7 4 22683 RBC Regal Beloit Corp 863 619 244 3 2 12684 RGC Regal Entertainment Group 8,561 5,240 3,321 34 21 132685 REG Regency Centers Corp 129 111 18 1 0 02686 RGP Regency Energy Partners LP 2,480 1,806 674 10 7 32687 REGN Regeneron Pharmaceuticals Inc 130,659 64,752 65,907 518 257 2622688 RM Regional Management Corp 5,994 2,672 3,322 24 11 13
Page 49

Standard Symbol Stock Total Call Put Total Call Put
CBOE Equity Options Volume (Includes LEAPS®)
Contract Volume Average Daily Volume
2689 RF Regions Financial Corp 185,330 142,637 42,693 735 566 1692690 RGS Regis Corp 306 69 237 1 0 12691 RGLS Regulus Therapeutics Inc 44,000 11,674 32,326 175 46 1282692 RGA Reinsurance Group of America Inc 384 278 106 2 1 02693 RS Reliance Steel & Aluminum Co 6,634 2,848 3,786 26 11 152694 RLYP Relypsa Inc 41,150 29,930 11,220 361 263 982695 REMY Remy Holdings LLC 259 62 197 3 1 22696 RNR RenaissanceRe Holdings Ltd 335 223 112 1 1 02697 RNST Renasant Corp 30 26 4 0 0 02698 SOL ReneSola Ltd 1,936 1,372 564 8 5 22699 REGI Renewable Energy Group Inc 4,314 2,539 1,775 17 10 72700 RENN Renren Inc 11,207 9,402 1,805 44 37 72701 RCII Rent-A-Center Inc/TX 25,444 7,992 17,452 101 32 692702 RTK Rentech Inc 852 727 125 3 3 02703 RENT Rentrak Corp 5,124 3,766 1,358 20 15 52704 RGEN Repligen Corp 7,526 4,738 2,788 30 19 112705 RPRX Repros Therapeutics Inc 26,149 21,939 4,210 104 87 172706 TLM Repsol Oil & Gas Canada Inc 46,417 11,498 34,919 184 46 1392707 RJET Republic Airways Holdings Inc 16,185 11,767 4,418 64 47 182708 RBCAA Republic Bancorp Inc/KY 6 0 6 0 0 02709 RSG Republic Services Inc 9,668 8,886 782 38 35 32710 REFR Research Frontiers Inc 2,447 1,601 846 10 6 32711 RMD ResMed Inc 12,357 8,884 3,473 49 35 142712 REN Resolute Energy Corp 1,388 1,214 174 6 5 12713 RFP Resolute Forest Products Inc 4,487 4,134 353 18 16 12714 RSO Resource Capital Corp 6,162 2,859 3,303 24 11 132715 RECN Resources Connection Inc 234 87 147 1 0 12716 QSR Restaurant Brands International Inc 29,944 11,238 18,706 119 45 742717 RH Restoration Hardware Holdings Inc 139,827 86,917 52,910 555 345 2102718 ROIC Retail Opportunity Investments Corp 1,304 919 385 5 4 22719 RPAI Retail Properties of America Inc 50 4 46 0 0 02720 SALE RetailMeNot Inc 18,789 10,947 7,842 75 43 312721 RTRX Retrophin Inc 35,375 21,068 14,307 140 84 572722 RVNC Revance Therapeutics Inc 5,820 4,223 1,597 23 17 62723 REV Revlon Inc 159 145 14 1 1 02724 RVLT Revolution Lighting Technologies Inc 190 190 0 1 1 02725 REXX Rex Energy Corp 32,787 19,856 12,931 130 79 512726 REXR Rexford Industrial Realty Inc 300 163 137 1 1 12727 RXN Rexnord Corp 386 113 273 2 0 12728 RAI Reynolds American Inc 189,591 120,852 68,739 752 480 2732729 RNO Rhino Resource Partners LP 1,279 774 505 5 3 22730 RICE Rice Energy Inc 13,658 5,635 8,023 54 22 322731 RMP Rice Midstream Partners LP 1,363 565 798 5 2 32732 RELL Richardson Electronics Ltd/United States 210 210 0 3 3 02733 RIC Richmont Mines Inc 1,414 1,019 395 6 4 22734 RIGL Rigel Pharmaceuticals Inc 8,000 6,885 1,115 32 27 42735 NAME Rightside Group Ltd 600 395 205 2 2 12736 REI Ring Energy Inc 296 227 69 3 2 12737 RNG RingCentral Inc 12,667 7,085 5,582 50 28 222738 RIOM Rio Alto Mining Ltd 132 102 30 1 0 02739 RIO Rio Tinto PLC 125,040 48,419 76,621 496 192 3042740 RBA Ritchie Bros Auctioneers Inc 535 431 104 2 2 02741 RAD Rite Aid Corp 1,017,395 764,787 252,608 4,037 3,035 1,0022742 RVBD Riverbed Technology Inc 13,434 8,490 4,944 53 34 202743 RLI RLI Corp 559 398 161 2 2 12744 RLJ RLJ Lodging Trust 217 123 94 1 0 02745 RRTS Roadrunner Transportation Systems Inc 2,211 1,933 278 9 8 12746 RHI Robert Half International Inc 5,938 3,453 2,485 24 14 102747 RCPI Rock Creek Pharmaceuticals Inc 1,604 1,391 213 6 6 12748 FUEL Rocket Fuel Inc 28,206 17,298 10,908 112 69 432749 ROK Rockwell Automation Inc 35,001 14,298 20,703 139 57 822750 COL Rockwell Collins Inc 5,487 4,620 867 22 18 32751 RMTI Rockwell Medical Inc 48,357 30,491 17,866 192 121 712752 ROC Rockwood Holdings Inc 15 6 9 0 0 0
Page 50
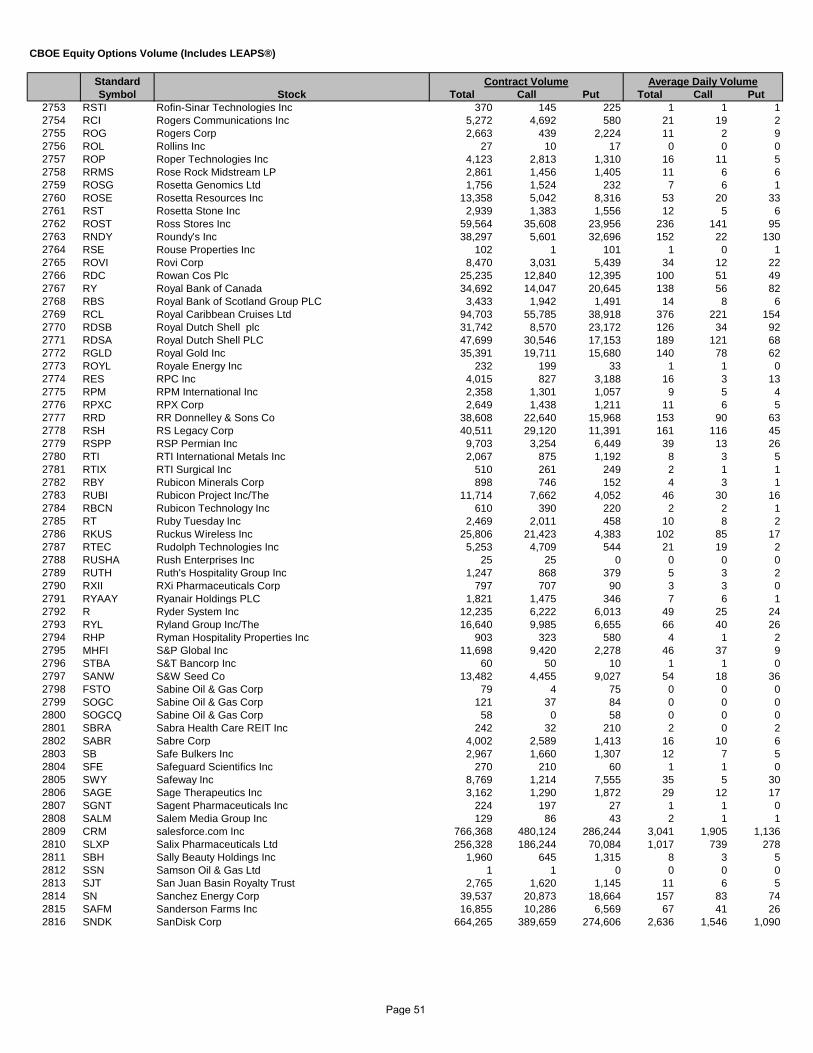
Standard Symbol Stock Total Call Put Total Call Put
CBOE Equity Options Volume (Includes LEAPS®)
Contract Volume Average Daily Volume
2753 RSTI Rofin-Sinar Technologies Inc 370 145 225 1 1 12754 RCI Rogers Communications Inc 5,272 4,692 580 21 19 22755 ROG Rogers Corp 2,663 439 2,224 11 2 92756 ROL Rollins Inc 27 10 17 0 0 02757 ROP Roper Technologies Inc 4,123 2,813 1,310 16 11 52758 RRMS Rose Rock Midstream LP 2,861 1,456 1,405 11 6 62759 ROSG Rosetta Genomics Ltd 1,756 1,524 232 7 6 12760 ROSE Rosetta Resources Inc 13,358 5,042 8,316 53 20 332761 RST Rosetta Stone Inc 2,939 1,383 1,556 12 5 62762 ROST Ross Stores Inc 59,564 35,608 23,956 236 141 952763 RNDY Roundy's Inc 38,297 5,601 32,696 152 22 1302764 RSE Rouse Properties Inc 102 1 101 1 0 12765 ROVI Rovi Corp 8,470 3,031 5,439 34 12 222766 RDC Rowan Cos Plc 25,235 12,840 12,395 100 51 492767 RY Royal Bank of Canada 34,692 14,047 20,645 138 56 822768 RBS Royal Bank of Scotland Group PLC 3,433 1,942 1,491 14 8 62769 RCL Royal Caribbean Cruises Ltd 94,703 55,785 38,918 376 221 1542770 RDSB Royal Dutch Shell plc 31,742 8,570 23,172 126 34 922771 RDSA Royal Dutch Shell PLC 47,699 30,546 17,153 189 121 682772 RGLD Royal Gold Inc 35,391 19,711 15,680 140 78 622773 ROYL Royale Energy Inc 232 199 33 1 1 02774 RES RPC Inc 4,015 827 3,188 16 3 132775 RPM RPM International Inc 2,358 1,301 1,057 9 5 42776 RPXC RPX Corp 2,649 1,438 1,211 11 6 52777 RRD RR Donnelley & Sons Co 38,608 22,640 15,968 153 90 632778 RSH RS Legacy Corp 40,511 29,120 11,391 161 116 452779 RSPP RSP Permian Inc 9,703 3,254 6,449 39 13 262780 RTI RTI International Metals Inc 2,067 875 1,192 8 3 52781 RTIX RTI Surgical Inc 510 261 249 2 1 12782 RBY Rubicon Minerals Corp 898 746 152 4 3 12783 RUBI Rubicon Project Inc/The 11,714 7,662 4,052 46 30 162784 RBCN Rubicon Technology Inc 610 390 220 2 2 12785 RT Ruby Tuesday Inc 2,469 2,011 458 10 8 22786 RKUS Ruckus Wireless Inc 25,806 21,423 4,383 102 85 172787 RTEC Rudolph Technologies Inc 5,253 4,709 544 21 19 22788 RUSHA Rush Enterprises Inc 25 25 0 0 0 02789 RUTH Ruth's Hospitality Group Inc 1,247 868 379 5 3 22790 RXII RXi Pharmaceuticals Corp 797 707 90 3 3 02791 RYAAY Ryanair Holdings PLC 1,821 1,475 346 7 6 12792 R Ryder System Inc 12,235 6,222 6,013 49 25 242793 RYL Ryland Group Inc/The 16,640 9,985 6,655 66 40 262794 RHP Ryman Hospitality Properties Inc 903 323 580 4 1 22795 MHFI S&P Global Inc 11,698 9,420 2,278 46 37 92796 STBA S&T Bancorp Inc 60 50 10 1 1 02797 SANW S&W Seed Co 13,482 4,455 9,027 54 18 362798 FSTO Sabine Oil & Gas Corp 79 4 75 0 0 02799 SOGC Sabine Oil & Gas Corp 121 37 84 0 0 02800 SOGCQ Sabine Oil & Gas Corp 58 0 58 0 0 02801 SBRA Sabra Health Care REIT Inc 242 32 210 2 0 22802 SABR Sabre Corp 4,002 2,589 1,413 16 10 62803 SB Safe Bulkers Inc 2,967 1,660 1,307 12 7 52804 SFE Safeguard Scientifics Inc 270 210 60 1 1 02805 SWY Safeway Inc 8,769 1,214 7,555 35 5 302806 SAGE Sage Therapeutics Inc 3,162 1,290 1,872 29 12 172807 SGNT Sagent Pharmaceuticals Inc 224 197 27 1 1 02808 SALM Salem Media Group Inc 129 86 43 2 1 12809 CRM salesforce.com Inc 766,368 480,124 286,244 3,041 1,905 1,1362810 SLXP Salix Pharmaceuticals Ltd 256,328 186,244 70,084 1,017 739 2782811 SBH Sally Beauty Holdings Inc 1,960 645 1,315 8 3 52812 SSN Samson Oil & Gas Ltd 1 1 0 0 0 02813 SJT San Juan Basin Royalty Trust 2,765 1,620 1,145 11 6 52814 SN Sanchez Energy Corp 39,537 20,873 18,664 157 83 742815 SAFM Sanderson Farms Inc 16,855 10,286 6,569 67 41 262816 SNDK SanDisk Corp 664,265 389,659 274,606 2,636 1,546 1,090
Page 51

Standard Symbol Stock Total Call Put Total Call Put
CBOE Equity Options Volume (Includes LEAPS®)
Contract Volume Average Daily Volume
2817 SD SandRidge Energy Inc 182,525 125,170 57,355 724 497 2282818 SDT SandRidge Mississippian Trust I 3,910 1,588 2,322 16 6 92819 SDR SandRidge Mississippian Trust II 4,531 1,291 3,240 18 5 132820 PER SandRidge Permian Trust 19,297 5,268 14,029 77 21 562821 SAND Sandstorm Gold Ltd 18,591 16,300 2,291 74 65 92822 SGMO Sangamo BioSciences Inc 64,999 24,076 40,923 258 96 1622823 SANM Sanmina Corp 6,727 4,619 2,108 27 18 82824 SNY Sanofi 35,531 27,737 7,794 141 110 312825 SC Santander Consumer USA Holdings Inc 22,201 13,424 8,777 88 53 352826 SAP SAP SE 20,443 13,061 7,382 81 52 292827 SAPE Sapient Corp 356 228 128 1 1 12828 SRPT Sarepta Therapeutics Inc 137,497 105,557 31,940 546 419 1272829 SSL Sasol Ltd 2,754 1,802 952 11 7 42830 SBAC SBA Communications Corp 10,251 7,331 2,920 41 29 122831 SCG SCANA Corp 4,706 4,237 469 19 17 22832 SCSC ScanSource Inc 462 161 301 2 1 12833 SLB Schlumberger Ltd 1,133,409 524,855 608,554 4,498 2,083 2,4152834 SCHN Schnitzer Steel Industries Inc 8,469 4,924 3,545 34 20 142835 SCHL Scholastic Corp 5,148 2,503 2,645 20 10 102836 SWM Schweitzer-Mauduit International Inc 327 142 185 1 1 12837 SCLN SciClone Pharmaceuticals Inc 758 713 45 3 3 02838 SAIC Science Applications International Corp 1,771 1,368 403 7 5 22839 SGMS Scientific Games Corp 207,570 178,067 29,503 824 707 1172840 SQI SciQuest Inc 2,202 1,754 448 9 7 22841 SALT Scorpio Bulkers Inc 194 194 0 2 2 02842 STNG Scorpio Tankers Inc 23,009 21,112 1,897 91 84 82843 SMG Scotts Miracle-Gro Co/The 3,934 3,029 905 16 12 42844 SNI Scripps Networks Interactive Inc 5,708 4,329 1,379 23 17 52845 SA Seabridge Gold Inc 25,389 18,207 7,182 101 72 292846 SEAC Seachange International Inc 769 211 558 3 1 22847 CKH SEACOR Holdings Inc 2,901 447 2,454 12 2 102848 SDRL Seadrill Ltd 595,738 246,618 349,120 2,364 979 1,3852849 SDLP Seadrill Partners LLC 7,635 3,395 4,240 30 13 172850 STX Seagate Technology PLC 348,302 168,220 180,082 1,382 668 7152851 SEE Sealed Air Corp 34,389 25,590 8,799 136 102 352852 SHLD Sears Holdings Corp 128,937 64,975 63,962 512 258 2542853 SHOS Sears Hometown and Outlet Stores Inc 3,167 1,073 2,094 13 4 82854 SSW Seaspan Corp 14,163 2,085 12,078 56 8 482855 SGEN Seattle Genetics Inc 22,844 13,175 9,669 91 52 382856 SEAS SeaWorld Entertainment Inc 80,907 39,779 41,128 321 158 1632857 EYES Second Sight Medical Products Inc 12,006 9,235 2,771 68 52 162858 SEIC SEI Investments Co 941 737 204 4 3 12859 SCSS Select Comfort Corp 18,898 12,556 6,342 75 50 252860 SIR Select Income REIT 456 284 172 2 1 12861 SEM Select Medical Holdings Corp 2,902 1,887 1,015 12 7 42862 SIGI Selective Insurance Group Inc 1,427 1,274 153 6 5 12863 SEMG SemGroup Corp 3,647 3,437 210 14 14 12864 SRE Sempra Energy 11,421 8,029 3,392 45 32 132865 SMTC Semtech Corp 9,739 9,138 601 39 36 22866 SNH Senior Housing Properties Trust 4,762 1,482 3,280 19 6 132867 SNMX Senomyx Inc 6,194 4,129 2,065 25 16 82868 ST Sensata Technologies Holding NV 12,459 9,484 2,975 49 38 122869 SXT Sensient Technologies Corp 177 110 67 1 0 02870 SQNM Sequenom Inc 23,073 13,093 9,980 92 52 402871 SQBG Sequential Brands Group Inc 321 321 0 54 54 02872 SCI Service Corp International/US 4,720 3,817 903 19 15 42873 SERV ServiceMaster Global Holdings Inc 3,513 2,570 943 14 10 42874 NOW ServiceNow Inc 85,146 31,285 53,861 338 124 2142875 SREV ServiceSource International Inc 4,269 3,273 996 17 13 42876 SSE Seventy Seven Energy Inc 3,857 2,568 1,289 15 10 52877 SFXE SFX Entertainment Inc 15,140 7,081 8,059 60 28 322878 SHAK Shake Shack Inc 40,201 19,609 20,592 414 202 2122879 GAME Shanda Games Ltd 1,364 594 770 5 2 32880 SMED Sharps Compliance Corp 2,246 1,935 311 9 8 1
Page 52
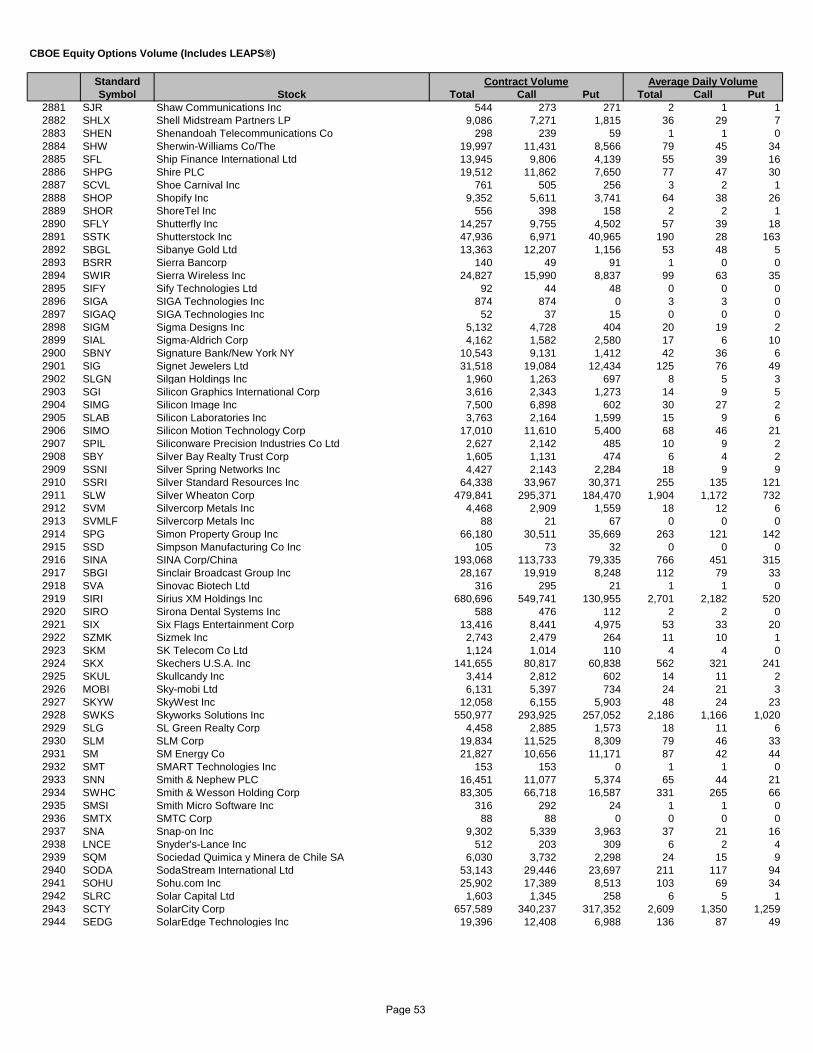
Standard Symbol Stock Total Call Put Total Call Put
CBOE Equity Options Volume (Includes LEAPS®)
Contract Volume Average Daily Volume
2881 SJR Shaw Communications Inc 544 273 271 2 1 12882 SHLX Shell Midstream Partners LP 9,086 7,271 1,815 36 29 72883 SHEN Shenandoah Telecommunications Co 298 239 59 1 1 02884 SHW Sherwin-Williams Co/The 19,997 11,431 8,566 79 45 342885 SFL Ship Finance International Ltd 13,945 9,806 4,139 55 39 162886 SHPG Shire PLC 19,512 11,862 7,650 77 47 302887 SCVL Shoe Carnival Inc 761 505 256 3 2 12888 SHOP Shopify Inc 9,352 5,611 3,741 64 38 262889 SHOR ShoreTel Inc 556 398 158 2 2 12890 SFLY Shutterfly Inc 14,257 9,755 4,502 57 39 182891 SSTK Shutterstock Inc 47,936 6,971 40,965 190 28 1632892 SBGL Sibanye Gold Ltd 13,363 12,207 1,156 53 48 52893 BSRR Sierra Bancorp 140 49 91 1 0 02894 SWIR Sierra Wireless Inc 24,827 15,990 8,837 99 63 352895 SIFY Sify Technologies Ltd 92 44 48 0 0 02896 SIGA SIGA Technologies Inc 874 874 0 3 3 02897 SIGAQ SIGA Technologies Inc 52 37 15 0 0 02898 SIGM Sigma Designs Inc 5,132 4,728 404 20 19 22899 SIAL Sigma-Aldrich Corp 4,162 1,582 2,580 17 6 102900 SBNY Signature Bank/New York NY 10,543 9,131 1,412 42 36 62901 SIG Signet Jewelers Ltd 31,518 19,084 12,434 125 76 492902 SLGN Silgan Holdings Inc 1,960 1,263 697 8 5 32903 SGI Silicon Graphics International Corp 3,616 2,343 1,273 14 9 52904 SIMG Silicon Image Inc 7,500 6,898 602 30 27 22905 SLAB Silicon Laboratories Inc 3,763 2,164 1,599 15 9 62906 SIMO Silicon Motion Technology Corp 17,010 11,610 5,400 68 46 212907 SPIL Siliconware Precision Industries Co Ltd 2,627 2,142 485 10 9 22908 SBY Silver Bay Realty Trust Corp 1,605 1,131 474 6 4 22909 SSNI Silver Spring Networks Inc 4,427 2,143 2,284 18 9 92910 SSRI Silver Standard Resources Inc 64,338 33,967 30,371 255 135 1212911 SLW Silver Wheaton Corp 479,841 295,371 184,470 1,904 1,172 7322912 SVM Silvercorp Metals Inc 4,468 2,909 1,559 18 12 62913 SVMLF Silvercorp Metals Inc 88 21 67 0 0 02914 SPG Simon Property Group Inc 66,180 30,511 35,669 263 121 1422915 SSD Simpson Manufacturing Co Inc 105 73 32 0 0 02916 SINA SINA Corp/China 193,068 113,733 79,335 766 451 3152917 SBGI Sinclair Broadcast Group Inc 28,167 19,919 8,248 112 79 332918 SVA Sinovac Biotech Ltd 316 295 21 1 1 02919 SIRI Sirius XM Holdings Inc 680,696 549,741 130,955 2,701 2,182 5202920 SIRO Sirona Dental Systems Inc 588 476 112 2 2 02921 SIX Six Flags Entertainment Corp 13,416 8,441 4,975 53 33 202922 SZMK Sizmek Inc 2,743 2,479 264 11 10 12923 SKM SK Telecom Co Ltd 1,124 1,014 110 4 4 02924 SKX Skechers U.S.A. Inc 141,655 80,817 60,838 562 321 2412925 SKUL Skullcandy Inc 3,414 2,812 602 14 11 22926 MOBI Sky-mobi Ltd 6,131 5,397 734 24 21 32927 SKYW SkyWest Inc 12,058 6,155 5,903 48 24 232928 SWKS Skyworks Solutions Inc 550,977 293,925 257,052 2,186 1,166 1,0202929 SLG SL Green Realty Corp 4,458 2,885 1,573 18 11 62930 SLM SLM Corp 19,834 11,525 8,309 79 46 332931 SM SM Energy Co 21,827 10,656 11,171 87 42 442932 SMT SMART Technologies Inc 153 153 0 1 1 02933 SNN Smith & Nephew PLC 16,451 11,077 5,374 65 44 212934 SWHC Smith & Wesson Holding Corp 83,305 66,718 16,587 331 265 662935 SMSI Smith Micro Software Inc 316 292 24 1 1 02936 SMTX SMTC Corp 88 88 0 0 0 02937 SNA Snap-on Inc 9,302 5,339 3,963 37 21 162938 LNCE Snyder's-Lance Inc 512 203 309 6 2 42939 SQM Sociedad Quimica y Minera de Chile SA 6,030 3,732 2,298 24 15 92940 SODA SodaStream International Ltd 53,143 29,446 23,697 211 117 942941 SOHU Sohu.com Inc 25,902 17,389 8,513 103 69 342942 SLRC Solar Capital Ltd 1,603 1,345 258 6 5 12943 SCTY SolarCity Corp 657,589 340,237 317,352 2,609 1,350 1,2592944 SEDG SolarEdge Technologies Inc 19,396 12,408 6,988 136 87 49
Page 53

Standard Symbol Stock Total Call Put Total Call Put
CBOE Equity Options Volume (Includes LEAPS®)
Contract Volume Average Daily Volume
2945 SWI SolarWinds Inc 24,921 15,368 9,553 99 61 382946 SLH Solera Holdings Inc 55,543 45,016 10,527 220 179 422947 SAH Sonic Automotive Inc 475 197 278 2 1 12948 SONC Sonic Corp 28,613 21,039 7,574 114 83 302949 SON Sonoco Products Co 1,145 843 302 5 3 12950 SONS Sonus Networks Inc 34,395 20,043 14,352 136 80 572951 SNE Sony Corp 53,486 40,116 13,370 212 159 532952 SORL SORL Auto Parts Inc 347 303 44 1 1 02953 SRNE Sorrento Therapeutics Inc 12,178 9,575 2,603 78 61 172954 BID Sotheby's 36,094 11,980 24,114 143 48 962955 SFUN SouFun Holdings Ltd 190,364 139,514 50,850 755 554 2022956 SXE Southcross Energy Partners LP 7,554 1,023 6,531 30 4 262957 SO Southern Co/The 210,242 121,749 88,493 834 483 3512958 SCCO Southern Copper Corp 41,193 15,337 25,856 163 61 1032959 LUV Southwest Airlines Co 414,167 292,967 121,200 1,644 1,163 4812960 OKSB Southwest Bancorp Inc 32 20 12 0 0 02961 SWN Southwestern Energy Co 261,616 139,954 121,662 1,038 555 4832962 SSS Sovran Self Storage Inc 610 491 119 2 2 02963 SP SP Plus Corp 58 8 50 1 0 12964 CODE Spansion Inc 736 507 229 3 2 12965 LOV Spark Networks Inc 285 275 10 3 3 02966 ONCE Spark Therapeutics Inc 17,906 7,131 10,775 114 45 692967 SPAR Spartan Motors Inc 100 51 49 0 0 02968 SPA Sparton Corp 220 146 74 2 1 12969 SE Spectra Energy Corp 122,194 69,225 52,969 485 275 2102970 SEP Spectra Energy Partners LP 3,498 1,736 1,762 14 7 72971 SPNC Spectranetics Corp/The 14,200 10,652 3,548 56 42 142972 SPB Spectrum Brands Holdings Inc 2,925 831 2,094 12 3 82973 SPPI Spectrum Pharmaceuticals Inc 22,620 19,048 3,572 90 76 142974 ANY Sphere 3D Corp 12,374 10,422 1,952 63 53 102975 LG Spire Inc 1,129 1,008 121 4 4 02976 SPR Spirit AeroSystems Holdings Inc 14,577 7,431 7,146 58 29 282977 SAVE Spirit Airlines Inc 48,548 28,591 19,957 193 113 792978 SRC Spirit Realty Capital Inc 2,368 814 1,554 9 3 62979 SPLK Splunk Inc 209,774 96,994 112,780 832 385 4482980 SPWH Sportsman's Warehouse Holdings Inc 6,171 3,506 2,665 24 14 112981 S Sprint Corp 396,879 226,231 170,648 1,575 898 6772982 SFM Sprouts Farmers Market Inc 38,443 23,535 14,908 153 93 592983 SPSC SPS Commerce Inc 1,002 409 593 4 2 22984 SPW SPX Corp 7,325 3,083 4,242 29 12 172985 SPXC SPX Corp 455 336 119 2 1 02986 SQ Square Inc 5,799 3,574 2,225 252 155 972987 JOE St Joe Co/The 34,429 32,074 2,355 137 127 92988 STJ St Jude Medical Inc 37,326 24,848 12,478 148 99 502989 STAA STAAR Surgical Co 5,177 3,562 1,615 21 14 62990 STAG STAG Industrial Inc 2,461 1,169 1,292 10 5 52991 SSI Stage Stores Inc 974 514 460 9 5 42992 STMP Stamps.com Inc 7,220 4,375 2,845 29 17 112993 SMP Standard Motor Products Inc 49 19 30 0 0 02994 SWK Stanley Black & Decker Inc 29,456 14,798 14,658 117 59 582995 SPLS Staples Inc 800,775 494,982 305,793 3,178 1,964 1,2132996 SBLK Star Bulk Carriers Corp 8,170 2,502 5,668 32 10 222997 SGU Star Gas Partners LP 818 514 304 3 2 12998 SBUX Starbucks Corp 1,172,030 753,327 418,703 4,651 2,989 1,6622999 SRT StarTek Inc 421 406 15 2 2 03000 HOT Starwood Hotels & Resorts Worldwide Inc 210,152 143,259 66,893 834 568 2653001 STWD Starwood Property Trust Inc 3,664 2,058 1,606 15 8 63002 STRZA Starz 23,207 5,632 17,575 92 22 703003 STFC State Auto Financial Corp 28 16 12 0 0 03004 STT State Street Corp 30,164 17,932 12,232 120 71 493005 STO Statoil ASA 9,579 5,750 3,829 38 23 153006 GASS StealthGas Inc 369 341 28 1 1 03007 STLD Steel Dynamics Inc 46,372 32,977 13,395 184 131 533008 SCS Steelcase Inc 4,625 3,679 946 18 15 43009 SMRT Stein Mart Inc 1,232 995 237 5 4 1
Page 54

Standard Symbol Stock Total Call Put Total Call Put
CBOE Equity Options Volume (Includes LEAPS®)
Contract Volume Average Daily Volume
3010 STNR Steiner Leisure Ltd 2,026 1,278 748 8 5 33011 SCM Stellus Capital Investment Corp 20 10 10 0 0 03012 STXS Stereotaxis Inc 997 822 175 4 3 13013 SRCL Stericycle Inc 4,437 2,324 2,113 18 9 83014 STE STERIS PLC 5,909 2,200 3,709 23 9 153015 STL Sterling Bancorp/DE 444 398 46 5 4 03016 STRL Sterling Construction Co Inc 125 88 37 1 1 03017 SHOO Steven Madden Ltd 1,060 285 775 4 1 33018 STC Stewart Information Services Corp 342 224 118 1 1 03019 SF Stifel Financial Corp 2,475 1,804 671 10 7 33020 SWC Stillwater Mining Co 31,678 20,825 10,853 126 83 433021 STM STMicroelectronics NV 5,695 4,516 1,179 23 18 53022 SGY Stone Energy Corp 9,637 6,400 3,237 38 25 133023 STON StoneMor Partners LP 6,037 1,694 4,343 24 7 173024 SRI Stoneridge Inc 588 178 410 2 1 23025 STOR STORE Capital Corp 2,206 828 1,378 9 3 53026 STRI STR Holdings Inc 121 80 41 0 0 03027 STRP Straight Path Communications Inc 35,206 19,683 15,523 265 148 1173028 SSYS Stratasys Ltd 116,373 63,030 53,343 462 250 2123029 BEE Strategic Hotels & Resorts Inc 17,965 15,493 2,472 71 61 103030 STRA Strayer Education Inc 5,718 2,055 3,663 23 8 153031 SYK Stryker Corp 44,797 17,653 27,144 178 70 1083032 STB Student Transportation Inc 726 503 223 3 2 13033 RGR Sturm Ruger & Co Inc 19,336 11,073 8,263 77 44 333034 SPH Suburban Propane Partners LP 3,489 2,314 1,175 14 9 53035 SCMP Sucampo Pharmaceuticals Inc 1,800 1,135 665 26 16 103036 SMFG Sumitomo Mitsui Financial Group Inc 1,969 1,513 456 8 6 23037 INN Summit Hotel Properties Inc 246 168 78 1 1 03038 SUM Summit Materials Inc 1,992 1,183 809 11 6 43039 SMLP Summit Midstream Partners LP 4,779 1,317 3,462 19 5 143040 SNBC Sun Bancorp Inc/NJ 989 620 369 4 2 13041 SLF Sun Life Financial Inc 545 474 71 2 2 03042 SXC SunCoke Energy Inc 20,320 15,757 4,563 81 63 183043 SXCP SunCoke Energy Partners LP 16,969 9,014 7,955 67 36 323044 SU Suncor Energy Inc 170,806 88,654 82,152 678 352 3263045 SUNE SunEdison Inc 1,865,114 1,336,943 528,171 7,401 5,305 2,0963046 SEMI SunEdison Semiconductor Ltd 615 562 53 5 5 03047 SNSS Sunesis Pharmaceuticals Inc 46,351 43,275 3,076 184 172 123048 GOMO Sungy Mobile Ltd 546 261 285 4 2 23049 SXL Sunoco Logistics Partners LP 18,621 13,227 5,394 74 52 213050 SUN Sunoco LP 12,369 7,870 4,499 49 31 183051 STKL SunOpta Inc 5,909 1,682 4,227 23 7 173052 SPWR SunPower Corp 142,169 83,728 58,441 564 332 2323053 RUN Sunrun Inc 2,989 1,572 1,417 43 22 203054 SSH Sunshine Heart Inc 2,921 2,646 275 12 11 13055 SHO Sunstone Hotel Investors Inc 1,299 383 916 12 4 93056 STPFQ Suntech Power Holdings Co Ltd 60 0 60 0 0 03057 STI SunTrust Banks Inc 82,422 59,001 23,421 327 234 933058 SLTD Sunworks Inc 2,523 2,481 42 23 23 03059 SMCI Super Micro Computer Inc 11,900 7,831 4,069 47 31 163060 SCON Superconductor Technologies Inc 2,218 1,241 977 9 5 43061 SPN Superior Energy Services Inc 8,875 3,912 4,963 35 16 203062 SUPN Supernus Pharmaceuticals Inc 10,214 8,071 2,143 41 32 93063 SVU SUPERVALU Inc 38,006 27,255 10,751 151 108 433064 SPRT Support.com Inc 663 418 245 3 2 13065 SGRY Surgery Partners Inc 651 419 232 12 7 43066 SCAI Surgical Care Affiliates Inc 247 199 48 2 1 03067 SRDX SurModics Inc 102 40 62 0 0 03068 SUSQ Susquehanna Bancshares Inc 26 19 7 0 0 03069 SIVB SVB Financial Group 3,839 1,806 2,033 15 7 83070 SFY Swift Energy Co/Texas 7,495 1,770 5,725 30 7 233071 SWFT Swift Transportation Co 42,287 32,176 10,111 168 128 403072 SWSH Swisher Hygiene Inc 47 46 1 0 0 03073 SYKE Sykes Enterprises Inc 1,360 919 441 5 4 2
Page 55

Standard Symbol Stock Total Call Put Total Call Put
CBOE Equity Options Volume (Includes LEAPS®)
Contract Volume Average Daily Volume
3074 SYMC Symantec Corp 45,153 27,534 17,619 179 109 703075 SYA Symetra Financial Corp 211 97 114 2 1 13076 SYNC Synacor Inc 237 196 41 1 1 03077 GEVA Synageva BioPharma Corp 20,001 1,962 18,039 79 8 723078 SYNA Synaptics Inc 74,312 44,398 29,914 295 176 1193079 SNCR Synchronoss Technologies Inc 6,999 5,328 1,671 28 21 73080 SYF Synchrony Financial 212,542 93,275 119,267 843 370 4733081 SURG Synergetics USA Inc 1,617 1,514 103 6 6 03082 SGYP Synergy Pharmaceuticals Inc 102,265 77,045 25,220 406 306 1003083 SYRG Synergy Resources Corp 13,032 10,350 2,682 52 41 113084 ELOS Syneron Medical Ltd 1,434 1,345 89 6 5 03085 SYT Syngenta AG 21,731 14,779 6,952 86 59 283086 SNX SYNNEX Corp 3,079 1,540 1,539 12 6 63087 SNPS Synopsys Inc 2,843 1,943 900 11 8 43088 SNV Synovus Financial Corp 5,301 4,163 1,138 21 17 53089 SNTA Synta Pharmaceuticals Corp 12,870 10,889 1,981 51 43 83090 SYNT Syntel Inc 2,133 720 1,413 8 3 63091 SYMX Synthesis Energy Systems Inc 15 15 0 0 0 03092 SYY Sysco Corp 144,883 94,065 50,818 575 373 2023093 TROW T Rowe Price Group Inc 17,485 8,086 9,399 69 32 373094 DATA Tableau Software Inc 115,598 69,533 46,065 459 276 1833095 TAHO Tahoe Resources Inc 12,624 9,964 2,660 50 40 113096 TSM Taiwan Semiconductor Manufacturing Co Ltd 161,998 49,671 112,327 643 197 4463097 TTWO Take-Two Interactive Software Inc 45,275 29,088 16,187 180 115 643098 XRS TAL Education Group 1,427 701 726 6 3 33099 TAL TAL International Group Inc 7,306 4,007 3,299 29 16 133100 TLN Talen Energy Corp 1,639 1,158 481 11 8 33101 TEGP Tallgrass Energy GP LP 5,308 2,197 3,111 34 14 203102 TEP Tallgrass Energy Partners LP 2,634 2,059 575 10 8 23103 TLMR Talmer Bancorp Inc 112 112 0 1 1 03104 TNDM Tandem Diabetes Care Inc 819 197 622 3 1 23105 SKT Tanger Factory Outlet Centers Inc 327 174 153 1 1 13106 TNGO Tangoe Inc 11,934 424 11,510 47 2 463107 TRX Tanzanian Royalty Exploration Corp 1,682 1,478 204 7 6 13108 TAOM Taomee Holdings Ltd 4,182 3,313 869 17 13 33109 APL Targa Pipeline Partners LP 2,289 1,175 1,114 9 5 43110 TRGP Targa Resources Corp 18,225 14,311 3,914 72 57 163111 NGLS Targa Resources Partners LP 45,800 29,060 16,740 182 115 663112 TGT Target Corp 630,411 343,894 286,517 2,502 1,365 1,1373113 TGB Taseko Mines Ltd 1,271 1,170 101 5 5 03114 TASR TASER International Inc 176,618 115,921 60,697 701 460 2413115 TTM Tata Motors Ltd 21,463 12,067 9,396 85 48 373116 TCO Taubman Centers Inc 1,487 738 749 6 3 33117 TMHC Taylor Morrison Home Corp 785 584 201 3 2 13118 TCP TC PipeLines LP 3,315 2,103 1,212 13 8 53119 TCB TCF Financial Corp 380 265 115 2 1 03120 TCPC TCP Capital Corp 861 522 339 3 2 13121 AMTD TD Ameritrade Holding Corp 33,849 21,394 12,455 134 85 493122 TEL TE Connectivity Ltd 12,903 8,711 4,192 51 35 173123 TMH Team Health Holdings Inc 11,505 4,891 6,614 46 19 263124 TEAR TearLab Corp 326 268 58 1 1 03125 TECD Tech Data Corp 7,576 2,718 4,858 30 11 193126 TCK Teck Resources Ltd 343,396 70,915 272,481 1,363 281 1,0813127 TE TECO Energy Inc 11,205 8,664 2,541 44 34 103128 TECU Tecumseh Products Co 62 62 0 0 0 03129 TK Teekay Corp 6,006 4,053 1,953 24 16 83130 TGP Teekay LNG Partners LP 16,922 3,526 13,396 67 14 533131 TOO Teekay Offshore Partners LP 6,119 1,460 4,659 24 6 183132 TNK Teekay Tankers Ltd 25,699 21,670 4,029 102 86 163133 TGNA TEGNA Inc 4,915 3,797 1,118 20 15 43134 TRC Tejon Ranch Co 236 158 78 1 1 03135 TEO Telecom Argentina SA 3,055 1,174 1,881 12 5 73136 TI Telecom Italia SpA/Milano 1,860 1,121 739 7 4 33137 TSYS TeleCommunication Systems Inc 1,278 1,233 45 5 5 03138 ERIC Telefonaktiebolaget LM Ericsson 20,627 14,009 6,618 82 56 26
Page 56

Standard Symbol Stock Total Call Put Total Call Put
CBOE Equity Options Volume (Includes LEAPS®)
Contract Volume Average Daily Volume
3139 VIV Telefonica Brasil SA 7,980 5,751 2,229 32 23 93140 TEF Telefonica SA 11,652 3,249 8,403 46 13 333141 TNAV Telenav Inc 59 46 13 1 0 03142 TDS Telephone & Data Systems Inc 3,283 3,113 170 13 12 13143 TTEC TeleTech Holdings Inc 373 290 83 1 1 03144 IG Teligent Inc 2,405 1,984 421 18 15 33145 TLGT Teligent Inc 228 198 30 1 1 03146 TU TELUS Corp 999 788 211 4 3 13147 TPX Tempur Sealy International Inc 21,629 11,244 10,385 86 45 413148 TS Tenaris SA 14,313 3,482 10,831 57 14 433149 THC Tenet Healthcare Corp 119,402 65,720 53,682 474 261 2133150 TEN Tenneco Inc 4,344 3,088 1,256 17 12 53151 TDC Teradata Corp 45,480 20,335 25,145 180 81 1003152 TER Teradyne Inc 45,016 35,336 9,680 179 140 383153 TEX Terex Corp 45,608 25,729 19,879 181 102 793154 TX Ternium SA 1,806 687 1,119 7 3 43155 GLBL TerraForm Global Inc 6,518 3,761 2,757 66 38 283156 TERP TerraForm Power Inc 68,866 27,815 41,051 273 110 1633157 SZYM TerraVia Holdings Inc 64,180 11,952 52,228 255 47 2073158 TRNO Terreno Realty Corp 32 18 14 0 0 03159 TSRO TESARO Inc 10,187 5,005 5,182 40 20 213160 TESO Tesco Corp 1,340 711 629 5 3 23161 TSLA Tesla Motors Inc 4,183,147 2,177,776 2,005,371 16,600 8,642 7,9583162 TSO Tesoro Corp 445,000 148,913 296,087 1,766 591 1,1753163 TLLP Tesoro Logistics LP 5,317 2,803 2,514 21 11 103164 TSRA Tessera Technologies Inc 8,946 7,214 1,732 36 29 73165 TTEK Tetra Tech Inc 326 195 131 1 1 13166 TTI TETRA Technologies Inc 2,861 692 2,169 11 3 93167 TTPH Tetraphase Pharmaceuticals Inc 29,110 19,236 9,874 116 76 393168 TEVA Teva Pharmaceutical Industries Ltd 650,147 414,376 235,771 2,580 1,644 9363169 TCBI Texas Capital Bancshares Inc 5,854 2,710 3,144 23 11 123170 TXN Texas Instruments Inc 431,590 158,784 272,806 1,713 630 1,0833171 TXRH Texas Roadhouse Inc 8,022 4,212 3,810 32 17 153172 TXT Textron Inc 48,124 30,252 17,872 191 120 713173 TXTR Textura Corp 8,469 7,353 1,116 34 29 43174 TFSL TFS Financial Corp 1,847 1,337 510 7 5 23175 TGTX TG Therapeutics Inc 13,931 11,124 2,807 55 44 113176 NCTY The9 Ltd 538 275 263 2 1 13177 TXMD TherapeuticsMD Inc 51,969 49,051 2,918 206 195 123178 TMO Thermo Fisher Scientific Inc 42,453 26,369 16,084 168 105 643179 THR Thermon Group Holdings Inc 12 11 1 0 0 03180 TPRE Third Point Reinsurance Ltd 779 312 467 3 1 23181 TCRD THL Credit Inc 412 314 98 2 1 03182 TC Thompson Creek Metals Co Inc 12,621 9,951 2,670 50 39 113183 TRI Thomson Reuters Corp 1,249 969 280 5 4 13184 THO Thor Industries Inc 5,424 4,474 950 22 18 43185 THOR Thoratec Corp 14,054 10,618 3,436 56 42 143186 THLD Threshold Pharmaceuticals Inc 13,360 12,191 1,169 53 48 53187 TICC TICC Capital Corp 1,603 934 669 6 4 33188 TDW Tidewater Inc 32,750 16,399 16,351 130 65 653189 TIER Tier REIT Inc 346 278 68 4 3 13190 TIF Tiffany & Co 145,156 74,311 70,845 576 295 2813191 TTS Tile Shop Holdings Inc 10,867 8,004 2,863 43 32 113192 TLYS Tilly's Inc 1,264 718 546 5 3 23193 TSU Tim Participacoes SA 1,139 255 884 9 2 73194 TIME Time Inc 9,164 6,625 2,539 36 26 103195 TWC Time Warner Cable Inc 254,635 112,687 141,948 1,010 447 5633196 TWX Time Warner Inc 215,119 137,630 77,489 854 546 3073197 TKR Timken Co/The 6,422 1,692 4,730 25 7 193198 TWI Titan International Inc 2,970 1,571 1,399 12 6 63199 TITN Titan Machinery Inc 3,074 930 2,144 12 4 93200 TIVO TiVo Inc 28,760 19,834 8,926 114 79 353201 TJX TJX Cos Inc/The 91,964 58,187 33,777 365 231 1343202 TMUS T-Mobile US Inc 279,311 184,413 94,898 1,108 732 3773203 TOL Toll Brothers Inc 59,680 38,348 21,332 237 152 85
Page 57
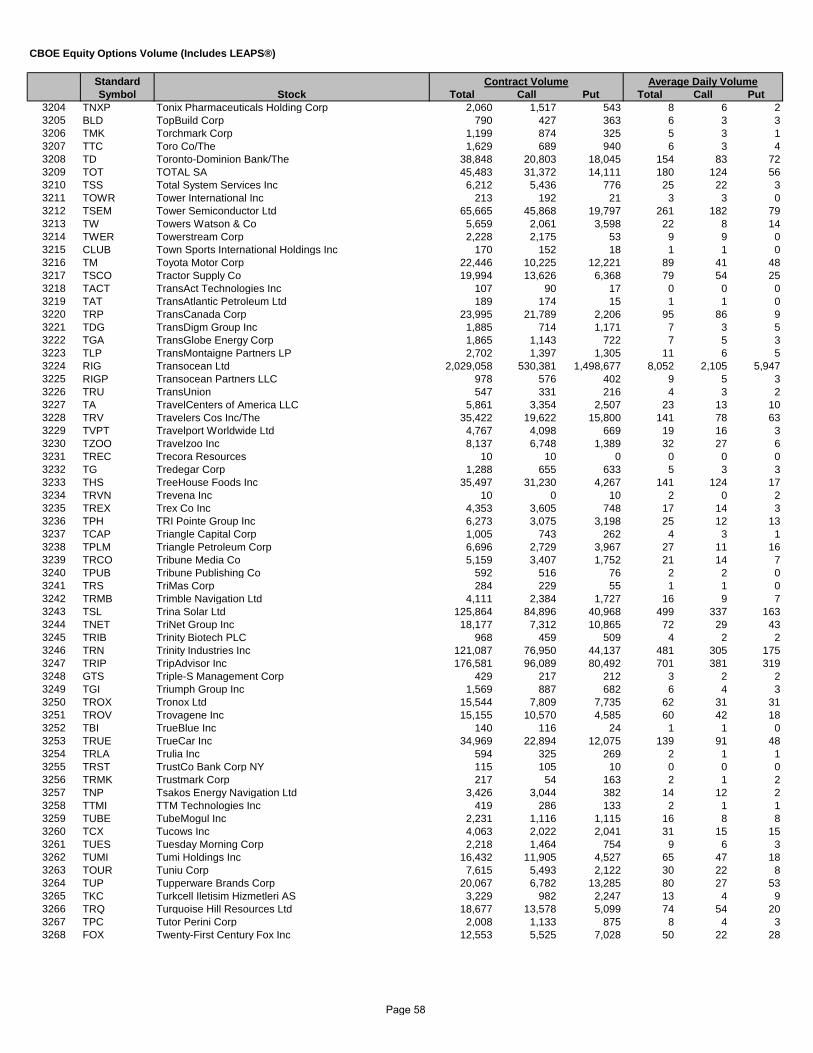
Standard Symbol Stock Total Call Put Total Call Put
CBOE Equity Options Volume (Includes LEAPS®)
Contract Volume Average Daily Volume
3204 TNXP Tonix Pharmaceuticals Holding Corp 2,060 1,517 543 8 6 23205 BLD TopBuild Corp 790 427 363 6 3 33206 TMK Torchmark Corp 1,199 874 325 5 3 13207 TTC Toro Co/The 1,629 689 940 6 3 43208 TD Toronto-Dominion Bank/The 38,848 20,803 18,045 154 83 723209 TOT TOTAL SA 45,483 31,372 14,111 180 124 563210 TSS Total System Services Inc 6,212 5,436 776 25 22 33211 TOWR Tower International Inc 213 192 21 3 3 03212 TSEM Tower Semiconductor Ltd 65,665 45,868 19,797 261 182 793213 TW Towers Watson & Co 5,659 2,061 3,598 22 8 143214 TWER Towerstream Corp 2,228 2,175 53 9 9 03215 CLUB Town Sports International Holdings Inc 170 152 18 1 1 03216 TM Toyota Motor Corp 22,446 10,225 12,221 89 41 483217 TSCO Tractor Supply Co 19,994 13,626 6,368 79 54 253218 TACT TransAct Technologies Inc 107 90 17 0 0 03219 TAT TransAtlantic Petroleum Ltd 189 174 15 1 1 03220 TRP TransCanada Corp 23,995 21,789 2,206 95 86 93221 TDG TransDigm Group Inc 1,885 714 1,171 7 3 53222 TGA TransGlobe Energy Corp 1,865 1,143 722 7 5 33223 TLP TransMontaigne Partners LP 2,702 1,397 1,305 11 6 53224 RIG Transocean Ltd 2,029,058 530,381 1,498,677 8,052 2,105 5,9473225 RIGP Transocean Partners LLC 978 576 402 9 5 33226 TRU TransUnion 547 331 216 4 3 23227 TA TravelCenters of America LLC 5,861 3,354 2,507 23 13 103228 TRV Travelers Cos Inc/The 35,422 19,622 15,800 141 78 633229 TVPT Travelport Worldwide Ltd 4,767 4,098 669 19 16 33230 TZOO Travelzoo Inc 8,137 6,748 1,389 32 27 63231 TREC Trecora Resources 10 10 0 0 0 03232 TG Tredegar Corp 1,288 655 633 5 3 33233 THS TreeHouse Foods Inc 35,497 31,230 4,267 141 124 173234 TRVN Trevena Inc 10 0 10 2 0 23235 TREX Trex Co Inc 4,353 3,605 748 17 14 33236 TPH TRI Pointe Group Inc 6,273 3,075 3,198 25 12 133237 TCAP Triangle Capital Corp 1,005 743 262 4 3 13238 TPLM Triangle Petroleum Corp 6,696 2,729 3,967 27 11 163239 TRCO Tribune Media Co 5,159 3,407 1,752 21 14 73240 TPUB Tribune Publishing Co 592 516 76 2 2 03241 TRS TriMas Corp 284 229 55 1 1 03242 TRMB Trimble Navigation Ltd 4,111 2,384 1,727 16 9 73243 TSL Trina Solar Ltd 125,864 84,896 40,968 499 337 1633244 TNET TriNet Group Inc 18,177 7,312 10,865 72 29 433245 TRIB Trinity Biotech PLC 968 459 509 4 2 23246 TRN Trinity Industries Inc 121,087 76,950 44,137 481 305 1753247 TRIP TripAdvisor Inc 176,581 96,089 80,492 701 381 3193248 GTS Triple-S Management Corp 429 217 212 3 2 23249 TGI Triumph Group Inc 1,569 887 682 6 4 33250 TROX Tronox Ltd 15,544 7,809 7,735 62 31 313251 TROV Trovagene Inc 15,155 10,570 4,585 60 42 183252 TBI TrueBlue Inc 140 116 24 1 1 03253 TRUE TrueCar Inc 34,969 22,894 12,075 139 91 483254 TRLA Trulia Inc 594 325 269 2 1 13255 TRST TrustCo Bank Corp NY 115 105 10 0 0 03256 TRMK Trustmark Corp 217 54 163 2 1 23257 TNP Tsakos Energy Navigation Ltd 3,426 3,044 382 14 12 23258 TTMI TTM Technologies Inc 419 286 133 2 1 13259 TUBE TubeMogul Inc 2,231 1,116 1,115 16 8 83260 TCX Tucows Inc 4,063 2,022 2,041 31 15 153261 TUES Tuesday Morning Corp 2,218 1,464 754 9 6 33262 TUMI Tumi Holdings Inc 16,432 11,905 4,527 65 47 183263 TOUR Tuniu Corp 7,615 5,493 2,122 30 22 83264 TUP Tupperware Brands Corp 20,067 6,782 13,285 80 27 533265 TKC Turkcell Iletisim Hizmetleri AS 3,229 982 2,247 13 4 93266 TRQ Turquoise Hill Resources Ltd 18,677 13,578 5,099 74 54 203267 TPC Tutor Perini Corp 2,008 1,133 875 8 4 33268 FOX Twenty-First Century Fox Inc 12,553 5,525 7,028 50 22 28
Page 58
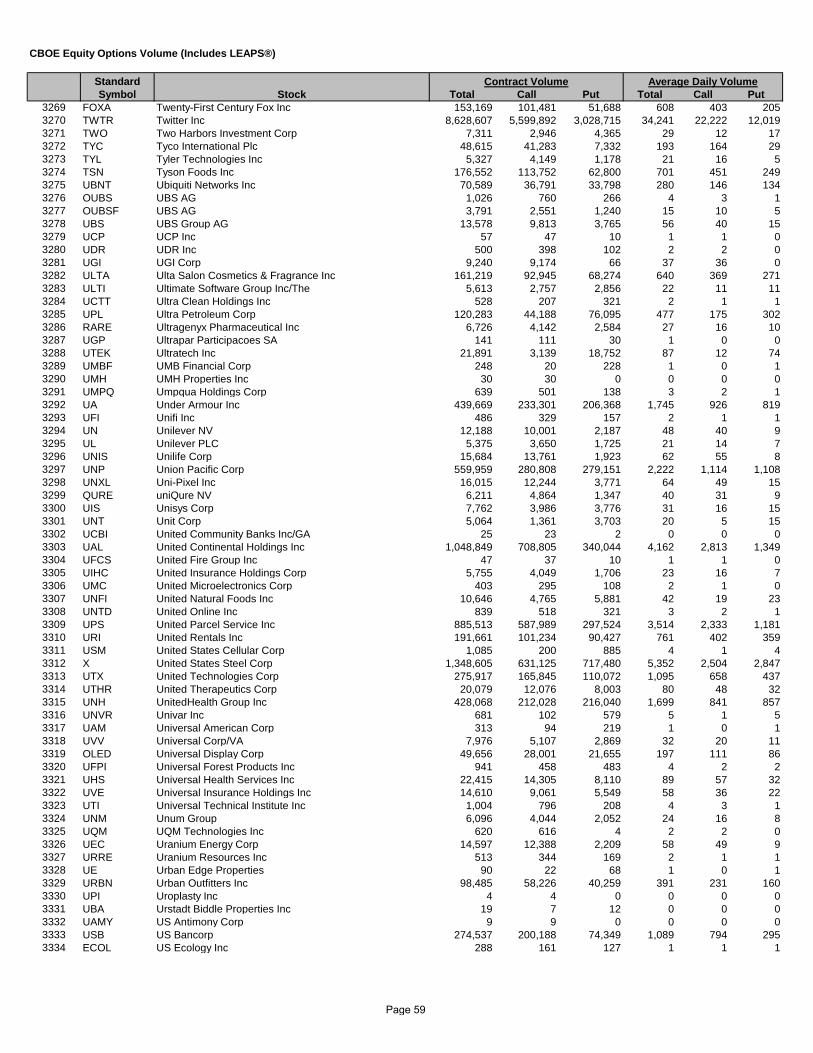
Standard Symbol Stock Total Call Put Total Call Put
CBOE Equity Options Volume (Includes LEAPS®)
Contract Volume Average Daily Volume
3269 FOXA Twenty-First Century Fox Inc 153,169 101,481 51,688 608 403 2053270 TWTR Twitter Inc 8,628,607 5,599,892 3,028,715 34,241 22,222 12,0193271 TWO Two Harbors Investment Corp 7,311 2,946 4,365 29 12 173272 TYC Tyco International Plc 48,615 41,283 7,332 193 164 293273 TYL Tyler Technologies Inc 5,327 4,149 1,178 21 16 53274 TSN Tyson Foods Inc 176,552 113,752 62,800 701 451 2493275 UBNT Ubiquiti Networks Inc 70,589 36,791 33,798 280 146 1343276 OUBS UBS AG 1,026 760 266 4 3 13277 OUBSF UBS AG 3,791 2,551 1,240 15 10 53278 UBS UBS Group AG 13,578 9,813 3,765 56 40 153279 UCP UCP Inc 57 47 10 1 1 03280 UDR UDR Inc 500 398 102 2 2 03281 UGI UGI Corp 9,240 9,174 66 37 36 03282 ULTA Ulta Salon Cosmetics & Fragrance Inc 161,219 92,945 68,274 640 369 2713283 ULTI Ultimate Software Group Inc/The 5,613 2,757 2,856 22 11 113284 UCTT Ultra Clean Holdings Inc 528 207 321 2 1 13285 UPL Ultra Petroleum Corp 120,283 44,188 76,095 477 175 3023286 RARE Ultragenyx Pharmaceutical Inc 6,726 4,142 2,584 27 16 103287 UGP Ultrapar Participacoes SA 141 111 30 1 0 03288 UTEK Ultratech Inc 21,891 3,139 18,752 87 12 743289 UMBF UMB Financial Corp 248 20 228 1 0 13290 UMH UMH Properties Inc 30 30 0 0 0 03291 UMPQ Umpqua Holdings Corp 639 501 138 3 2 13292 UA Under Armour Inc 439,669 233,301 206,368 1,745 926 8193293 UFI Unifi Inc 486 329 157 2 1 13294 UN Unilever NV 12,188 10,001 2,187 48 40 93295 UL Unilever PLC 5,375 3,650 1,725 21 14 73296 UNIS Unilife Corp 15,684 13,761 1,923 62 55 83297 UNP Union Pacific Corp 559,959 280,808 279,151 2,222 1,114 1,1083298 UNXL Uni-Pixel Inc 16,015 12,244 3,771 64 49 153299 QURE uniQure NV 6,211 4,864 1,347 40 31 93300 UIS Unisys Corp 7,762 3,986 3,776 31 16 153301 UNT Unit Corp 5,064 1,361 3,703 20 5 153302 UCBI United Community Banks Inc/GA 25 23 2 0 0 03303 UAL United Continental Holdings Inc 1,048,849 708,805 340,044 4,162 2,813 1,3493304 UFCS United Fire Group Inc 47 37 10 1 1 03305 UIHC United Insurance Holdings Corp 5,755 4,049 1,706 23 16 73306 UMC United Microelectronics Corp 403 295 108 2 1 03307 UNFI United Natural Foods Inc 10,646 4,765 5,881 42 19 233308 UNTD United Online Inc 839 518 321 3 2 13309 UPS United Parcel Service Inc 885,513 587,989 297,524 3,514 2,333 1,1813310 URI United Rentals Inc 191,661 101,234 90,427 761 402 3593311 USM United States Cellular Corp 1,085 200 885 4 1 43312 X United States Steel Corp 1,348,605 631,125 717,480 5,352 2,504 2,8473313 UTX United Technologies Corp 275,917 165,845 110,072 1,095 658 4373314 UTHR United Therapeutics Corp 20,079 12,076 8,003 80 48 323315 UNH UnitedHealth Group Inc 428,068 212,028 216,040 1,699 841 8573316 UNVR Univar Inc 681 102 579 5 1 53317 UAM Universal American Corp 313 94 219 1 0 13318 UVV Universal Corp/VA 7,976 5,107 2,869 32 20 113319 OLED Universal Display Corp 49,656 28,001 21,655 197 111 863320 UFPI Universal Forest Products Inc 941 458 483 4 2 23321 UHS Universal Health Services Inc 22,415 14,305 8,110 89 57 323322 UVE Universal Insurance Holdings Inc 14,610 9,061 5,549 58 36 223323 UTI Universal Technical Institute Inc 1,004 796 208 4 3 13324 UNM Unum Group 6,096 4,044 2,052 24 16 83325 UQM UQM Technologies Inc 620 616 4 2 2 03326 UEC Uranium Energy Corp 14,597 12,388 2,209 58 49 93327 URRE Uranium Resources Inc 513 344 169 2 1 13328 UE Urban Edge Properties 90 22 68 1 0 13329 URBN Urban Outfitters Inc 98,485 58,226 40,259 391 231 1603330 UPI Uroplasty Inc 4 4 0 0 0 03331 UBA Urstadt Biddle Properties Inc 19 7 12 0 0 03332 UAMY US Antimony Corp 9 9 0 0 0 03333 USB US Bancorp 274,537 200,188 74,349 1,089 794 2953334 ECOL US Ecology Inc 288 161 127 1 1 1
Page 59
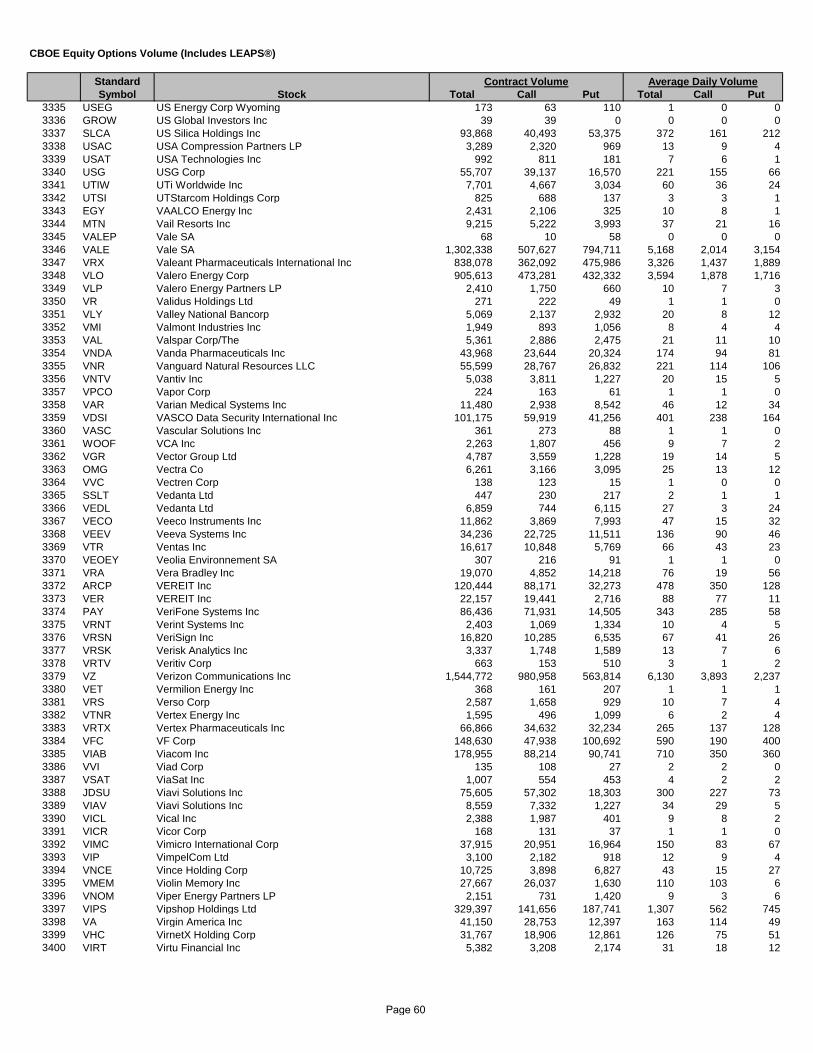
Standard Symbol Stock Total Call Put Total Call Put
CBOE Equity Options Volume (Includes LEAPS®)
Contract Volume Average Daily Volume
3335 USEG US Energy Corp Wyoming 173 63 110 1 0 03336 GROW US Global Investors Inc 39 39 0 0 0 03337 SLCA US Silica Holdings Inc 93,868 40,493 53,375 372 161 2123338 USAC USA Compression Partners LP 3,289 2,320 969 13 9 43339 USAT USA Technologies Inc 992 811 181 7 6 13340 USG USG Corp 55,707 39,137 16,570 221 155 663341 UTIW UTi Worldwide Inc 7,701 4,667 3,034 60 36 243342 UTSI UTStarcom Holdings Corp 825 688 137 3 3 13343 EGY VAALCO Energy Inc 2,431 2,106 325 10 8 13344 MTN Vail Resorts Inc 9,215 5,222 3,993 37 21 163345 VALEP Vale SA 68 10 58 0 0 03346 VALE Vale SA 1,302,338 507,627 794,711 5,168 2,014 3,1543347 VRX Valeant Pharmaceuticals International Inc 838,078 362,092 475,986 3,326 1,437 1,8893348 VLO Valero Energy Corp 905,613 473,281 432,332 3,594 1,878 1,7163349 VLP Valero Energy Partners LP 2,410 1,750 660 10 7 33350 VR Validus Holdings Ltd 271 222 49 1 1 03351 VLY Valley National Bancorp 5,069 2,137 2,932 20 8 123352 VMI Valmont Industries Inc 1,949 893 1,056 8 4 43353 VAL Valspar Corp/The 5,361 2,886 2,475 21 11 103354 VNDA Vanda Pharmaceuticals Inc 43,968 23,644 20,324 174 94 813355 VNR Vanguard Natural Resources LLC 55,599 28,767 26,832 221 114 1063356 VNTV Vantiv Inc 5,038 3,811 1,227 20 15 53357 VPCO Vapor Corp 224 163 61 1 1 03358 VAR Varian Medical Systems Inc 11,480 2,938 8,542 46 12 343359 VDSI VASCO Data Security International Inc 101,175 59,919 41,256 401 238 1643360 VASC Vascular Solutions Inc 361 273 88 1 1 03361 WOOF VCA Inc 2,263 1,807 456 9 7 23362 VGR Vector Group Ltd 4,787 3,559 1,228 19 14 53363 OMG Vectra Co 6,261 3,166 3,095 25 13 123364 VVC Vectren Corp 138 123 15 1 0 03365 SSLT Vedanta Ltd 447 230 217 2 1 13366 VEDL Vedanta Ltd 6,859 744 6,115 27 3 243367 VECO Veeco Instruments Inc 11,862 3,869 7,993 47 15 323368 VEEV Veeva Systems Inc 34,236 22,725 11,511 136 90 463369 VTR Ventas Inc 16,617 10,848 5,769 66 43 233370 VEOEY Veolia Environnement SA 307 216 91 1 1 03371 VRA Vera Bradley Inc 19,070 4,852 14,218 76 19 563372 ARCP VEREIT Inc 120,444 88,171 32,273 478 350 1283373 VER VEREIT Inc 22,157 19,441 2,716 88 77 113374 PAY VeriFone Systems Inc 86,436 71,931 14,505 343 285 583375 VRNT Verint Systems Inc 2,403 1,069 1,334 10 4 53376 VRSN VeriSign Inc 16,820 10,285 6,535 67 41 263377 VRSK Verisk Analytics Inc 3,337 1,748 1,589 13 7 63378 VRTV Veritiv Corp 663 153 510 3 1 23379 VZ Verizon Communications Inc 1,544,772 980,958 563,814 6,130 3,893 2,2373380 VET Vermilion Energy Inc 368 161 207 1 1 13381 VRS Verso Corp 2,587 1,658 929 10 7 43382 VTNR Vertex Energy Inc 1,595 496 1,099 6 2 43383 VRTX Vertex Pharmaceuticals Inc 66,866 34,632 32,234 265 137 1283384 VFC VF Corp 148,630 47,938 100,692 590 190 4003385 VIAB Viacom Inc 178,955 88,214 90,741 710 350 3603386 VVI Viad Corp 135 108 27 2 2 03387 VSAT ViaSat Inc 1,007 554 453 4 2 23388 JDSU Viavi Solutions Inc 75,605 57,302 18,303 300 227 733389 VIAV Viavi Solutions Inc 8,559 7,332 1,227 34 29 53390 VICL Vical Inc 2,388 1,987 401 9 8 23391 VICR Vicor Corp 168 131 37 1 1 03392 VIMC Vimicro International Corp 37,915 20,951 16,964 150 83 673393 VIP VimpelCom Ltd 3,100 2,182 918 12 9 43394 VNCE Vince Holding Corp 10,725 3,898 6,827 43 15 273395 VMEM Violin Memory Inc 27,667 26,037 1,630 110 103 63396 VNOM Viper Energy Partners LP 2,151 731 1,420 9 3 63397 VIPS Vipshop Holdings Ltd 329,397 141,656 187,741 1,307 562 7453398 VA Virgin America Inc 41,150 28,753 12,397 163 114 493399 VHC VirnetX Holding Corp 31,767 18,906 12,861 126 75 513400 VIRT Virtu Financial Inc 5,382 3,208 2,174 31 18 12
Page 60

Standard Symbol Stock Total Call Put Total Call Put
CBOE Equity Options Volume (Includes LEAPS®)
Contract Volume Average Daily Volume
3401 V Visa Inc 917,166 548,534 368,632 3,640 2,177 1,4633402 VSH Vishay Intertechnology Inc 3,721 3,299 422 15 13 23403 VPG Vishay Precision Group Inc 154 52 102 1 0 03404 VGZ Vista Gold Corp 12 12 0 0 0 03405 VSTO Vista Outdoor Inc 440 360 80 2 2 03406 VC Visteon Corp 24,986 12,275 12,711 99 49 503407 VTL Vital Therapies Inc 44,400 22,811 21,589 389 200 1893408 VSI Vitamin Shoppe Inc 8,124 4,575 3,549 32 18 143409 VSLR Vivint Solar Inc 23,277 12,111 11,166 92 48 443410 VVUS VIVUS Inc 41,345 28,667 12,678 164 114 503411 VMW VMware Inc 208,918 125,675 83,243 829 499 3303412 VOC Voc Energy Trust 16,146 7,552 8,594 64 30 343413 VCRA Vocera Communications Inc 1,198 781 417 5 3 23414 VOD Vodafone Group PLC 163,347 109,637 53,710 648 435 2133415 VOLC Volcano Corp 570 270 300 2 1 13416 VG Vonage Holdings Corp 3,087 2,788 299 12 11 13417 VNO Vornado Realty Trust 6,738 3,963 2,775 27 16 113418 VJET voxeljet AG 10,612 5,129 5,483 42 20 223419 VOXX VOXX International Corp 2,220 1,936 284 9 8 13420 VOYA Voya Financial Inc 34,477 32,658 1,819 137 130 73421 VTTI VTTI Energy Partners LP 276 170 106 2 1 13422 VMC Vulcan Materials Co 32,173 21,330 10,843 128 85 433423 VUZI Vuzix Corp 6,270 5,747 523 28 26 23424 VWR VWR Corp 914 174 740 4 1 33425 WTI W&T Offshore Inc 10,344 6,289 4,055 41 25 163426 WNC Wabash National Corp 5,636 4,643 993 22 18 43427 WBC WABCO Holdings Inc 2,787 1,973 814 11 8 33428 WAB Wabtec Corp/DE 10,077 4,122 5,955 40 16 243429 WDR Waddell & Reed Financial Inc 6,103 3,068 3,035 24 12 123430 WAGE WageWorks Inc 2,257 1,894 363 9 8 13431 WBA Walgreens Boots Alliance Inc 640,880 333,373 307,507 2,543 1,323 1,2203432 WD Walker & Dunlop Inc 830 606 224 6 5 23433 WMT Wal-Mart Stores Inc 1,477,142 881,970 595,172 5,862 3,500 2,3623434 DIS Walt Disney Co/The 2,288,422 1,361,610 926,812 9,081 5,403 3,6783435 WLT Walter Energy Inc 70,664 23,885 46,779 280 95 1863436 WLTG Walter Energy Inc 1,677 29 1,648 7 0 73437 WLTGQ Walter Energy Inc 111,113 331 110,782 441 1 4403438 WAC Walter Investment Management Corp 15,467 3,999 11,468 61 16 463439 WRES Warren Resources Inc 1,154 1,124 30 5 4 03440 WAFD Washington Federal Inc 202 143 59 1 1 03441 WRE Washington Real Estate Investment Trust 483 272 211 2 1 13442 WCN Waste Connections Inc 1,911 1,637 274 8 6 13443 WM Waste Management Inc 45,816 33,730 12,086 182 134 483444 WAT Waters Corp 8,311 5,449 2,862 33 22 113445 WSBF Waterstone Financial Inc 3,306 2,501 805 13 10 33446 WSO Watsco Inc 936 719 217 4 3 13447 WTS Watts Water Technologies Inc 899 773 126 4 3 13448 WPP Wausau Paper Corp 1,662 467 1,195 7 2 53449 WAVX Wave Systems Corp 1,230 1,230 0 5 5 03450 W Wayfair Inc 52,293 28,492 23,801 260 142 1183451 WFT Weatherford International PLC 388,618 112,569 276,049 1,542 447 1,0953452 WEB Web.com Group Inc 93 70 23 0 0 03453 WWWW Web.com Group Inc 4,889 2,281 2,608 19 9 103454 WBMD WebMD Health Corp 16,389 10,238 6,151 65 41 243455 WBS Webster Financial Corp 2,994 1,650 1,344 12 7 53456 WEC WEC Energy Group Inc 3,722 2,602 1,120 15 10 43457 WB Weibo Corp 64,497 44,225 20,272 256 175 803458 WTW Weight Watchers International Inc 244,922 109,269 135,653 972 434 5383459 WRI Weingarten Realty Investors 218 195 23 1 1 03460 WCG WellCare Health Plans Inc 6,618 1,863 4,755 26 7 193461 WFC Wells Fargo & Co 1,402,665 848,408 554,257 5,566 3,367 2,1993462 HCN Welltower Inc 21,849 14,777 7,072 87 59 283463 WEN Wendy's Co/The 60,302 43,172 17,130 239 171 683464 WERN Werner Enterprises Inc 416 220 196 2 1 13465 WAIR Wesco Aircraft Holdings Inc 436 312 124 2 1 03466 WCC WESCO International Inc 5,490 2,764 2,726 22 11 11
Page 61
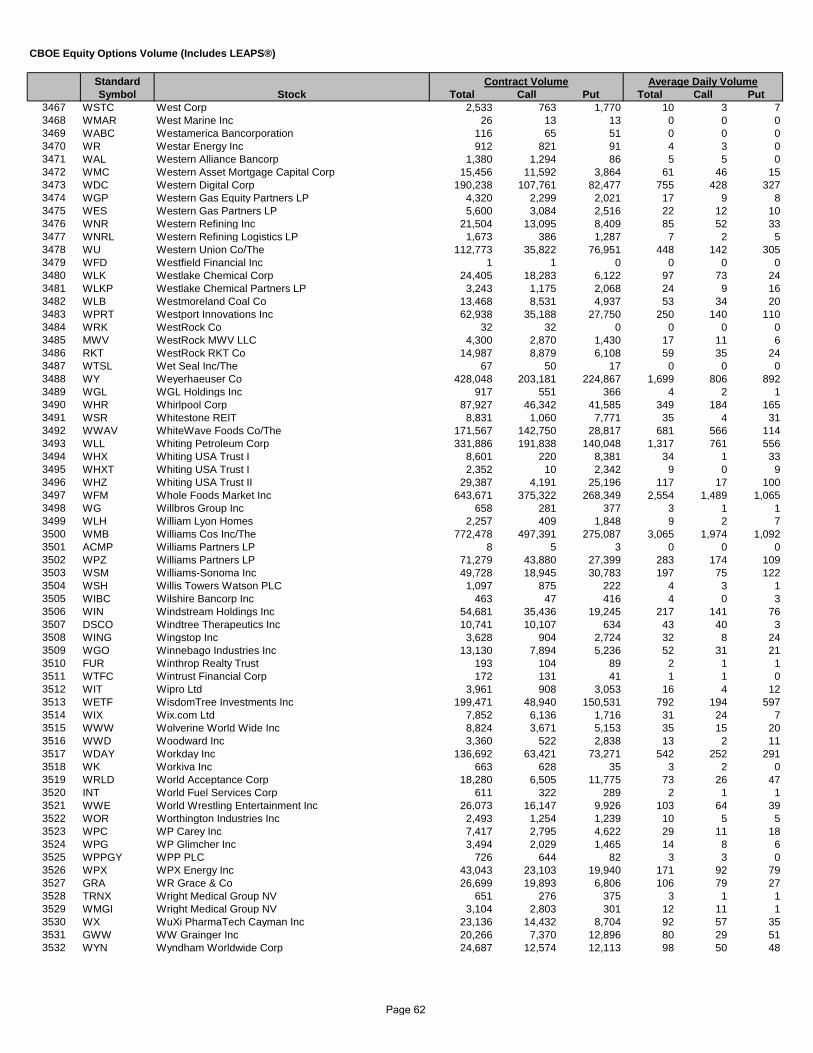
Standard Symbol Stock Total Call Put Total Call Put
CBOE Equity Options Volume (Includes LEAPS®)
Contract Volume Average Daily Volume
3467 WSTC West Corp 2,533 763 1,770 10 3 73468 WMAR West Marine Inc 26 13 13 0 0 03469 WABC Westamerica Bancorporation 116 65 51 0 0 03470 WR Westar Energy Inc 912 821 91 4 3 03471 WAL Western Alliance Bancorp 1,380 1,294 86 5 5 03472 WMC Western Asset Mortgage Capital Corp 15,456 11,592 3,864 61 46 153473 WDC Western Digital Corp 190,238 107,761 82,477 755 428 3273474 WGP Western Gas Equity Partners LP 4,320 2,299 2,021 17 9 83475 WES Western Gas Partners LP 5,600 3,084 2,516 22 12 103476 WNR Western Refining Inc 21,504 13,095 8,409 85 52 333477 WNRL Western Refining Logistics LP 1,673 386 1,287 7 2 53478 WU Western Union Co/The 112,773 35,822 76,951 448 142 3053479 WFD Westfield Financial Inc 1 1 0 0 0 03480 WLK Westlake Chemical Corp 24,405 18,283 6,122 97 73 243481 WLKP Westlake Chemical Partners LP 3,243 1,175 2,068 24 9 163482 WLB Westmoreland Coal Co 13,468 8,531 4,937 53 34 203483 WPRT Westport Innovations Inc 62,938 35,188 27,750 250 140 1103484 WRK WestRock Co 32 32 0 0 0 03485 MWV WestRock MWV LLC 4,300 2,870 1,430 17 11 63486 RKT WestRock RKT Co 14,987 8,879 6,108 59 35 243487 WTSL Wet Seal Inc/The 67 50 17 0 0 03488 WY Weyerhaeuser Co 428,048 203,181 224,867 1,699 806 8923489 WGL WGL Holdings Inc 917 551 366 4 2 13490 WHR Whirlpool Corp 87,927 46,342 41,585 349 184 1653491 WSR Whitestone REIT 8,831 1,060 7,771 35 4 313492 WWAV WhiteWave Foods Co/The 171,567 142,750 28,817 681 566 1143493 WLL Whiting Petroleum Corp 331,886 191,838 140,048 1,317 761 5563494 WHX Whiting USA Trust I 8,601 220 8,381 34 1 333495 WHXT Whiting USA Trust I 2,352 10 2,342 9 0 93496 WHZ Whiting USA Trust II 29,387 4,191 25,196 117 17 1003497 WFM Whole Foods Market Inc 643,671 375,322 268,349 2,554 1,489 1,0653498 WG Willbros Group Inc 658 281 377 3 1 13499 WLH William Lyon Homes 2,257 409 1,848 9 2 73500 WMB Williams Cos Inc/The 772,478 497,391 275,087 3,065 1,974 1,0923501 ACMP Williams Partners LP 8 5 3 0 0 03502 WPZ Williams Partners LP 71,279 43,880 27,399 283 174 1093503 WSM Williams-Sonoma Inc 49,728 18,945 30,783 197 75 1223504 WSH Willis Towers Watson PLC 1,097 875 222 4 3 13505 WIBC Wilshire Bancorp Inc 463 47 416 4 0 33506 WIN Windstream Holdings Inc 54,681 35,436 19,245 217 141 763507 DSCO Windtree Therapeutics Inc 10,741 10,107 634 43 40 33508 WING Wingstop Inc 3,628 904 2,724 32 8 243509 WGO Winnebago Industries Inc 13,130 7,894 5,236 52 31 213510 FUR Winthrop Realty Trust 193 104 89 2 1 13511 WTFC Wintrust Financial Corp 172 131 41 1 1 03512 WIT Wipro Ltd 3,961 908 3,053 16 4 123513 WETF WisdomTree Investments Inc 199,471 48,940 150,531 792 194 5973514 WIX Wix.com Ltd 7,852 6,136 1,716 31 24 73515 WWW Wolverine World Wide Inc 8,824 3,671 5,153 35 15 203516 WWD Woodward Inc 3,360 522 2,838 13 2 113517 WDAY Workday Inc 136,692 63,421 73,271 542 252 2913518 WK Workiva Inc 663 628 35 3 2 03519 WRLD World Acceptance Corp 18,280 6,505 11,775 73 26 473520 INT World Fuel Services Corp 611 322 289 2 1 13521 WWE World Wrestling Entertainment Inc 26,073 16,147 9,926 103 64 393522 WOR Worthington Industries Inc 2,493 1,254 1,239 10 5 53523 WPC WP Carey Inc 7,417 2,795 4,622 29 11 183524 WPG WP Glimcher Inc 3,494 2,029 1,465 14 8 63525 WPPGY WPP PLC 726 644 82 3 3 03526 WPX WPX Energy Inc 43,043 23,103 19,940 171 92 793527 GRA WR Grace & Co 26,699 19,893 6,806 106 79 273528 TRNX Wright Medical Group NV 651 276 375 3 1 13529 WMGI Wright Medical Group NV 3,104 2,803 301 12 11 13530 WX WuXi PharmaTech Cayman Inc 23,136 14,432 8,704 92 57 353531 GWW WW Grainger Inc 20,266 7,370 12,896 80 29 513532 WYN Wyndham Worldwide Corp 24,687 12,574 12,113 98 50 48
Page 62
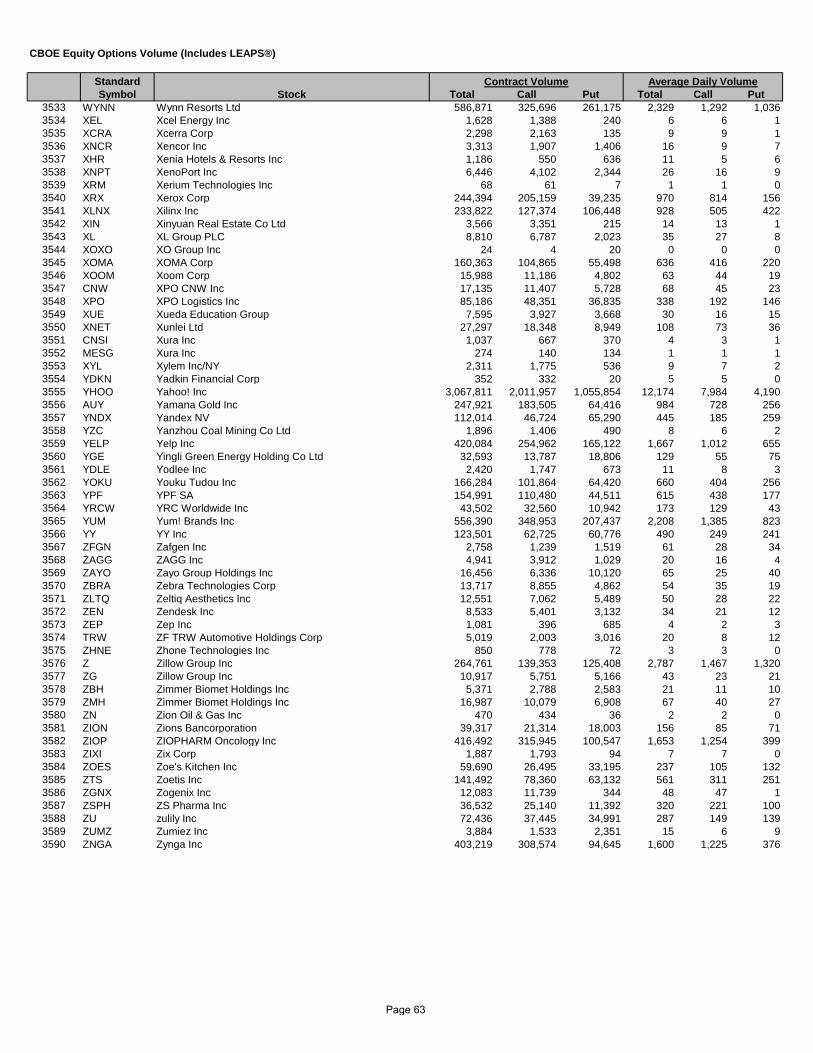
Standard Symbol Stock Total Call Put Total Call Put
CBOE Equity Options Volume (Includes LEAPS®)
Contract Volume Average Daily Volume
3533 WYNN Wynn Resorts Ltd 586,871 325,696 261,175 2,329 1,292 1,0363534 XEL Xcel Energy Inc 1,628 1,388 240 6 6 13535 XCRA Xcerra Corp 2,298 2,163 135 9 9 13536 XNCR Xencor Inc 3,313 1,907 1,406 16 9 73537 XHR Xenia Hotels & Resorts Inc 1,186 550 636 11 5 63538 XNPT XenoPort Inc 6,446 4,102 2,344 26 16 93539 XRM Xerium Technologies Inc 68 61 7 1 1 03540 XRX Xerox Corp 244,394 205,159 39,235 970 814 1563541 XLNX Xilinx Inc 233,822 127,374 106,448 928 505 4223542 XIN Xinyuan Real Estate Co Ltd 3,566 3,351 215 14 13 13543 XL XL Group PLC 8,810 6,787 2,023 35 27 83544 XOXO XO Group Inc 24 4 20 0 0 03545 XOMA XOMA Corp 160,363 104,865 55,498 636 416 2203546 XOOM Xoom Corp 15,988 11,186 4,802 63 44 193547 CNW XPO CNW Inc 17,135 11,407 5,728 68 45 233548 XPO XPO Logistics Inc 85,186 48,351 36,835 338 192 1463549 XUE Xueda Education Group 7,595 3,927 3,668 30 16 153550 XNET Xunlei Ltd 27,297 18,348 8,949 108 73 363551 CNSI Xura Inc 1,037 667 370 4 3 13552 MESG Xura Inc 274 140 134 1 1 13553 XYL Xylem Inc/NY 2,311 1,775 536 9 7 23554 YDKN Yadkin Financial Corp 352 332 20 5 5 03555 YHOO Yahoo! Inc 3,067,811 2,011,957 1,055,854 12,174 7,984 4,1903556 AUY Yamana Gold Inc 247,921 183,505 64,416 984 728 2563557 YNDX Yandex NV 112,014 46,724 65,290 445 185 2593558 YZC Yanzhou Coal Mining Co Ltd 1,896 1,406 490 8 6 23559 YELP Yelp Inc 420,084 254,962 165,122 1,667 1,012 6553560 YGE Yingli Green Energy Holding Co Ltd 32,593 13,787 18,806 129 55 753561 YDLE Yodlee Inc 2,420 1,747 673 11 8 33562 YOKU Youku Tudou Inc 166,284 101,864 64,420 660 404 2563563 YPF YPF SA 154,991 110,480 44,511 615 438 1773564 YRCW YRC Worldwide Inc 43,502 32,560 10,942 173 129 433565 YUM Yum! Brands Inc 556,390 348,953 207,437 2,208 1,385 8233566 YY YY Inc 123,501 62,725 60,776 490 249 2413567 ZFGN Zafgen Inc 2,758 1,239 1,519 61 28 343568 ZAGG ZAGG Inc 4,941 3,912 1,029 20 16 43569 ZAYO Zayo Group Holdings Inc 16,456 6,336 10,120 65 25 403570 ZBRA Zebra Technologies Corp 13,717 8,855 4,862 54 35 193571 ZLTQ Zeltiq Aesthetics Inc 12,551 7,062 5,489 50 28 223572 ZEN Zendesk Inc 8,533 5,401 3,132 34 21 123573 ZEP Zep Inc 1,081 396 685 4 2 33574 TRW ZF TRW Automotive Holdings Corp 5,019 2,003 3,016 20 8 123575 ZHNE Zhone Technologies Inc 850 778 72 3 3 03576 Z Zillow Group Inc 264,761 139,353 125,408 2,787 1,467 1,3203577 ZG Zillow Group Inc 10,917 5,751 5,166 43 23 213578 ZBH Zimmer Biomet Holdings Inc 5,371 2,788 2,583 21 11 103579 ZMH Zimmer Biomet Holdings Inc 16,987 10,079 6,908 67 40 273580 ZN Zion Oil & Gas Inc 470 434 36 2 2 03581 ZION Zions Bancorporation 39,317 21,314 18,003 156 85 713582 ZIOP ZIOPHARM Oncology Inc 416,492 315,945 100,547 1,653 1,254 3993583 ZIXI Zix Corp 1,887 1,793 94 7 7 03584 ZOES Zoe's Kitchen Inc 59,690 26,495 33,195 237 105 1323585 ZTS Zoetis Inc 141,492 78,360 63,132 561 311 2513586 ZGNX Zogenix Inc 12,083 11,739 344 48 47 13587 ZSPH ZS Pharma Inc 36,532 25,140 11,392 320 221 1003588 ZU zulily Inc 72,436 37,445 34,991 287 149 1393589 ZUMZ Zumiez Inc 3,884 1,533 2,351 15 6 93590 ZNGA Zynga Inc 403,219 308,574 94,645 1,600 1,225 376
Page 63
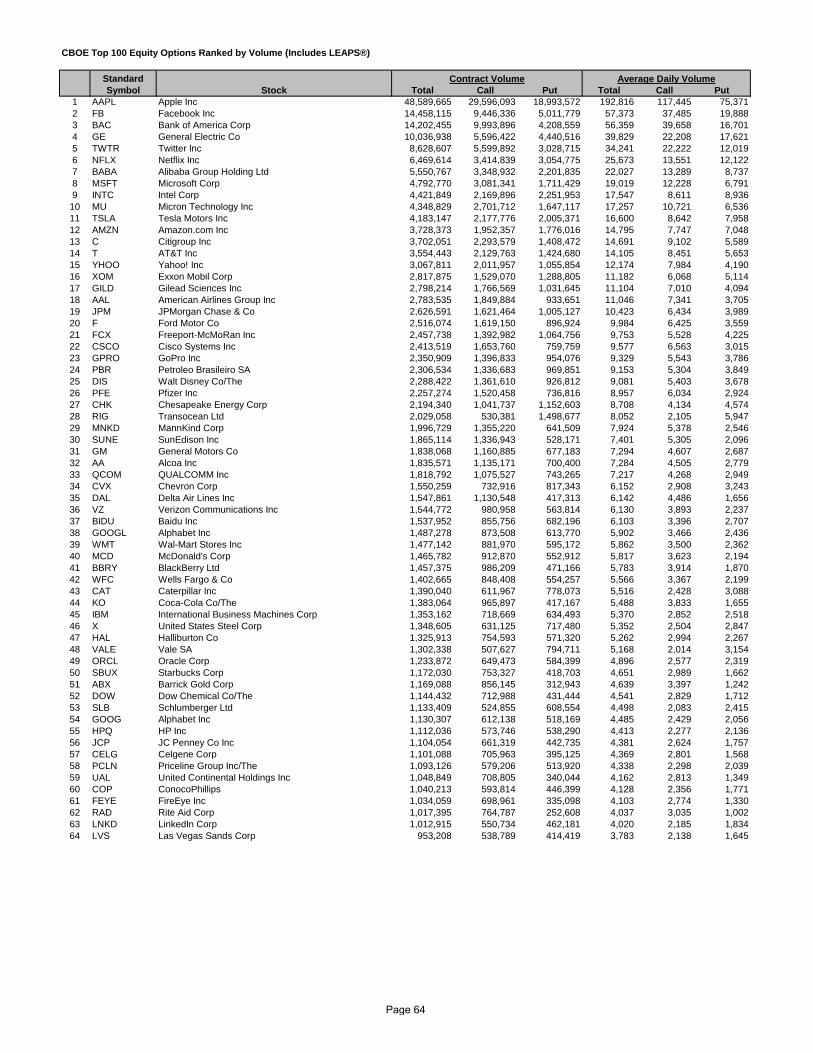
CBOE Top 100 Equity Options Ranked by Volume (Includes LEAPS®)
Standard Symbol Stock Total Call Put Total Call Put
1 AAPL Apple Inc 48,589,665 29,596,093 18,993,572 192,816 117,445 75,3712 FB Facebook Inc 14,458,115 9,446,336 5,011,779 57,373 37,485 19,8883 BAC Bank of America Corp 14,202,455 9,993,896 4,208,559 56,359 39,658 16,7014 GE General Electric Co 10,036,938 5,596,422 4,440,516 39,829 22,208 17,6215 TWTR Twitter Inc 8,628,607 5,599,892 3,028,715 34,241 22,222 12,0196 NFLX Netflix Inc 6,469,614 3,414,839 3,054,775 25,673 13,551 12,1227 BABA Alibaba Group Holding Ltd 5,550,767 3,348,932 2,201,835 22,027 13,289 8,7378 MSFT Microsoft Corp 4,792,770 3,081,341 1,711,429 19,019 12,228 6,7919 INTC Intel Corp 4,421,849 2,169,896 2,251,953 17,547 8,611 8,936
10 MU Micron Technology Inc 4,348,829 2,701,712 1,647,117 17,257 10,721 6,53611 TSLA Tesla Motors Inc 4,183,147 2,177,776 2,005,371 16,600 8,642 7,95812 AMZN Amazon.com Inc 3,728,373 1,952,357 1,776,016 14,795 7,747 7,04813 C Citigroup Inc 3,702,051 2,293,579 1,408,472 14,691 9,102 5,58914 T AT&T Inc 3,554,443 2,129,763 1,424,680 14,105 8,451 5,65315 YHOO Yahoo! Inc 3,067,811 2,011,957 1,055,854 12,174 7,984 4,19016 XOM Exxon Mobil Corp 2,817,875 1,529,070 1,288,805 11,182 6,068 5,11417 GILD Gilead Sciences Inc 2,798,214 1,766,569 1,031,645 11,104 7,010 4,09418 AAL American Airlines Group Inc 2,783,535 1,849,884 933,651 11,046 7,341 3,70519 JPM JPMorgan Chase & Co 2,626,591 1,621,464 1,005,127 10,423 6,434 3,98920 F Ford Motor Co 2,516,074 1,619,150 896,924 9,984 6,425 3,55921 FCX Freeport-McMoRan Inc 2,457,738 1,392,982 1,064,756 9,753 5,528 4,22522 CSCO Cisco Systems Inc 2,413,519 1,653,760 759,759 9,577 6,563 3,01523 GPRO GoPro Inc 2,350,909 1,396,833 954,076 9,329 5,543 3,78624 PBR Petroleo Brasileiro SA 2,306,534 1,336,683 969,851 9,153 5,304 3,84925 DIS Walt Disney Co/The 2,288,422 1,361,610 926,812 9,081 5,403 3,67826 PFE Pfizer Inc 2,257,274 1,520,458 736,816 8,957 6,034 2,92427 CHK Chesapeake Energy Corp 2,194,340 1,041,737 1,152,603 8,708 4,134 4,57428 RIG Transocean Ltd 2,029,058 530,381 1,498,677 8,052 2,105 5,94729 MNKD MannKind Corp 1,996,729 1,355,220 641,509 7,924 5,378 2,54630 SUNE SunEdison Inc 1,865,114 1,336,943 528,171 7,401 5,305 2,09631 GM General Motors Co 1,838,068 1,160,885 677,183 7,294 4,607 2,68732 AA Alcoa Inc 1,835,571 1,135,171 700,400 7,284 4,505 2,77933 QCOM QUALCOMM Inc 1,818,792 1,075,527 743,265 7,217 4,268 2,94934 CVX Chevron Corp 1,550,259 732,916 817,343 6,152 2,908 3,24335 DAL Delta Air Lines Inc 1,547,861 1,130,548 417,313 6,142 4,486 1,65636 VZ Verizon Communications Inc 1,544,772 980,958 563,814 6,130 3,893 2,23737 BIDU Baidu Inc 1,537,952 855,756 682,196 6,103 3,396 2,70738 GOOGL Alphabet Inc 1,487,278 873,508 613,770 5,902 3,466 2,43639 WMT Wal-Mart Stores Inc 1,477,142 881,970 595,172 5,862 3,500 2,36240 MCD McDonald's Corp 1,465,782 912,870 552,912 5,817 3,623 2,19441 BBRY BlackBerry Ltd 1,457,375 986,209 471,166 5,783 3,914 1,87042 WFC Wells Fargo & Co 1,402,665 848,408 554,257 5,566 3,367 2,19943 CAT Caterpillar Inc 1,390,040 611,967 778,073 5,516 2,428 3,08844 KO Coca-Cola Co/The 1,383,064 965,897 417,167 5,488 3,833 1,65545 IBM International Business Machines Corp 1,353,162 718,669 634,493 5,370 2,852 2,51846 X United States Steel Corp 1,348,605 631,125 717,480 5,352 2,504 2,84747 HAL Halliburton Co 1,325,913 754,593 571,320 5,262 2,994 2,26748 VALE Vale SA 1,302,338 507,627 794,711 5,168 2,014 3,15449 ORCL Oracle Corp 1,233,872 649,473 584,399 4,896 2,577 2,31950 SBUX Starbucks Corp 1,172,030 753,327 418,703 4,651 2,989 1,66251 ABX Barrick Gold Corp 1,169,088 856,145 312,943 4,639 3,397 1,24252 DOW Dow Chemical Co/The 1,144,432 712,988 431,444 4,541 2,829 1,71253 SLB Schlumberger Ltd 1,133,409 524,855 608,554 4,498 2,083 2,41554 GOOG Alphabet Inc 1,130,307 612,138 518,169 4,485 2,429 2,05655 HPQ HP Inc 1,112,036 573,746 538,290 4,413 2,277 2,13656 JCP JC Penney Co Inc 1,104,054 661,319 442,735 4,381 2,624 1,75757 CELG Celgene Corp 1,101,088 705,963 395,125 4,369 2,801 1,56858 PCLN Priceline Group Inc/The 1,093,126 579,206 513,920 4,338 2,298 2,03959 UAL United Continental Holdings Inc 1,048,849 708,805 340,044 4,162 2,813 1,34960 COP ConocoPhillips 1,040,213 593,814 446,399 4,128 2,356 1,77161 FEYE FireEye Inc 1,034,059 698,961 335,098 4,103 2,774 1,33062 RAD Rite Aid Corp 1,017,395 764,787 252,608 4,037 3,035 1,00263 LNKD LinkedIn Corp 1,012,915 550,734 462,181 4,020 2,185 1,83464 LVS Las Vegas Sands Corp 953,208 538,789 414,419 3,783 2,138 1,645
Contract Volume Average Daily Volume
Page 64
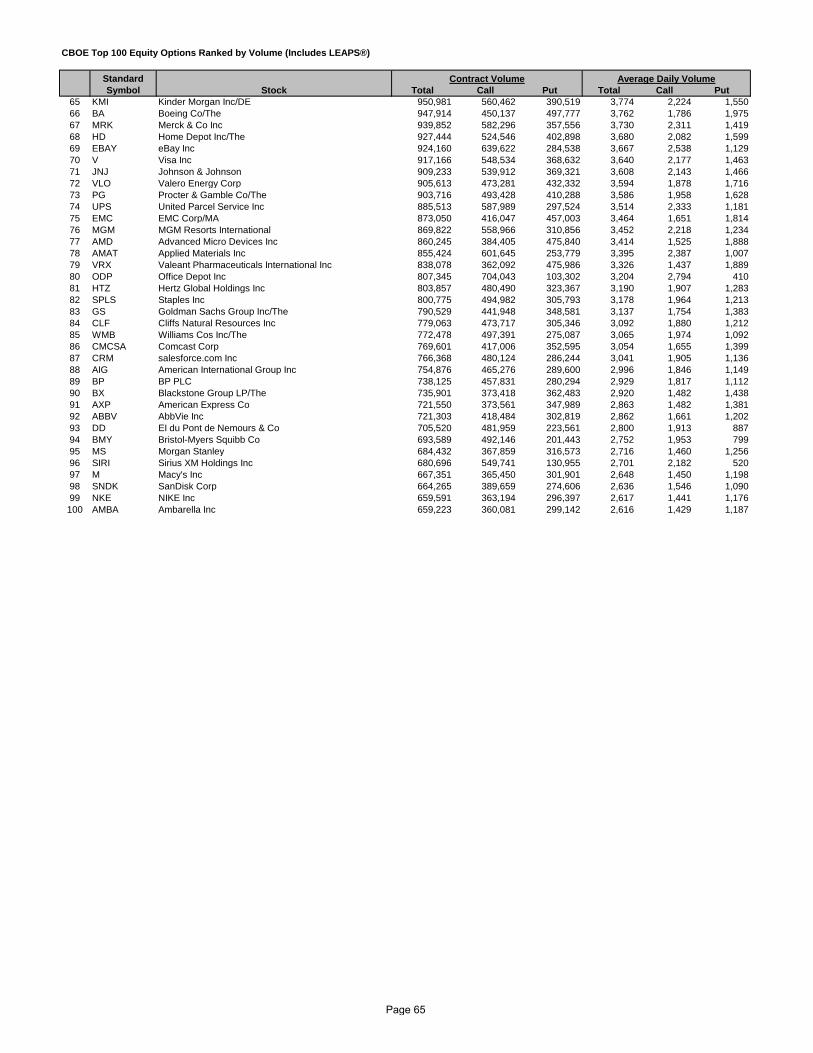
CBOE Top 100 Equity Options Ranked by Volume (Includes LEAPS®)
Standard Symbol Stock Total Call Put Total Call Put
Contract Volume Average Daily Volume
65 KMI Kinder Morgan Inc/DE 950,981 560,462 390,519 3,774 2,224 1,55066 BA Boeing Co/The 947,914 450,137 497,777 3,762 1,786 1,97567 MRK Merck & Co Inc 939,852 582,296 357,556 3,730 2,311 1,41968 HD Home Depot Inc/The 927,444 524,546 402,898 3,680 2,082 1,59969 EBAY eBay Inc 924,160 639,622 284,538 3,667 2,538 1,12970 V Visa Inc 917,166 548,534 368,632 3,640 2,177 1,46371 JNJ Johnson & Johnson 909,233 539,912 369,321 3,608 2,143 1,46672 VLO Valero Energy Corp 905,613 473,281 432,332 3,594 1,878 1,71673 PG Procter & Gamble Co/The 903,716 493,428 410,288 3,586 1,958 1,62874 UPS United Parcel Service Inc 885,513 587,989 297,524 3,514 2,333 1,18175 EMC EMC Corp/MA 873,050 416,047 457,003 3,464 1,651 1,81476 MGM MGM Resorts International 869,822 558,966 310,856 3,452 2,218 1,23477 AMD Advanced Micro Devices Inc 860,245 384,405 475,840 3,414 1,525 1,88878 AMAT Applied Materials Inc 855,424 601,645 253,779 3,395 2,387 1,00779 VRX Valeant Pharmaceuticals International Inc 838,078 362,092 475,986 3,326 1,437 1,88980 ODP Office Depot Inc 807,345 704,043 103,302 3,204 2,794 41081 HTZ Hertz Global Holdings Inc 803,857 480,490 323,367 3,190 1,907 1,28382 SPLS Staples Inc 800,775 494,982 305,793 3,178 1,964 1,21383 GS Goldman Sachs Group Inc/The 790,529 441,948 348,581 3,137 1,754 1,38384 CLF Cliffs Natural Resources Inc 779,063 473,717 305,346 3,092 1,880 1,21285 WMB Williams Cos Inc/The 772,478 497,391 275,087 3,065 1,974 1,09286 CMCSA Comcast Corp 769,601 417,006 352,595 3,054 1,655 1,39987 CRM salesforce.com Inc 766,368 480,124 286,244 3,041 1,905 1,13688 AIG American International Group Inc 754,876 465,276 289,600 2,996 1,846 1,14989 BP BP PLC 738,125 457,831 280,294 2,929 1,817 1,11290 BX Blackstone Group LP/The 735,901 373,418 362,483 2,920 1,482 1,43891 AXP American Express Co 721,550 373,561 347,989 2,863 1,482 1,38192 ABBV AbbVie Inc 721,303 418,484 302,819 2,862 1,661 1,20293 DD EI du Pont de Nemours & Co 705,520 481,959 223,561 2,800 1,913 88794 BMY Bristol-Myers Squibb Co 693,589 492,146 201,443 2,752 1,953 79995 MS Morgan Stanley 684,432 367,859 316,573 2,716 1,460 1,25696 SIRI Sirius XM Holdings Inc 680,696 549,741 130,955 2,701 2,182 52097 M Macy's Inc 667,351 365,450 301,901 2,648 1,450 1,19898 SNDK SanDisk Corp 664,265 389,659 274,606 2,636 1,546 1,09099 NKE NIKE Inc 659,591 363,194 296,397 2,617 1,441 1,176100 AMBA Ambarella Inc 659,223 360,081 299,142 2,616 1,429 1,187
Page 65
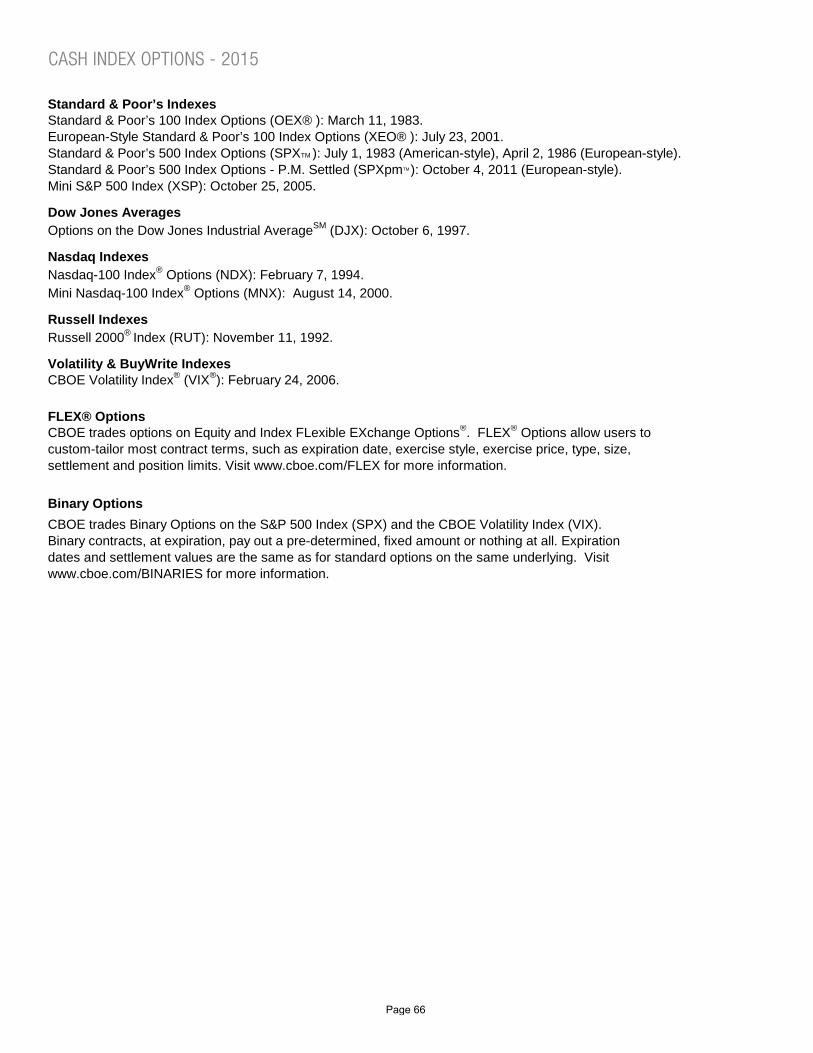
CASH INDEX OPTIONS - 2015
Standard & Poor’s IndexesStandard & Poor’s 100 Index Options (OEX® ): March 11, 1983.European-Style Standard & Poor’s 100 Index Options (XEO® ): July 23, 2001.Standard & Poor’s 500 Index Options (SPXTM ): July 1, 1983 (American-style), April 2, 1986 (European-style).Standard & Poor’s 500 Index Options - P.M. Settled (SPXpmTM ): October 4, 2011 (European-style).Mini S&P 500 Index (XSP): October 25, 2005.
Dow Jones AveragesOptions on the Dow Jones Industrial AverageSM (DJX): October 6, 1997.
Nasdaq IndexesNasdaq-100 Index® Options (NDX): February 7, 1994.Mini Nasdaq-100 Index® Options (MNX): August 14, 2000.
Russell IndexesRussell 2000® Index (RUT): November 11, 1992.
Volatility & BuyWrite IndexesCBOE Volatility Index® (VIX®): February 24, 2006.
FLEX® OptionsCBOE trades options on Equity and Index FLexible EXchange Options®. FLEX® Options allow users to custom-tailor most contract terms, such as expiration date, exercise style, exercise price, type, size, settlement and position limits. Visit www.cboe.com/FLEX for more information.
Binary OptionsCBOE trades Binary Options on the S&P 500 Index (SPX) and the CBOE Volatility Index (VIX). Binary contracts, at expiration, pay out a pre-determined, fixed amount or nothing at all. Expirationdates and settlement values are the same as for standard options on the same underlying. Visit www.cboe.com/BINARIES for more information.
Page 66

Most Active Cash Indexes—2015 The following is a description of the index options most actively traded during 2015. Please refer to www.cboe.com for a complete description of each product. Standard & Poor’s 500 Index Options - SPXTM The Standard & Poor’s 500 Index is a capitalization-weighted index of 500 stocks from a broad range of industries. SPX options are available in the four near-term months followed by up to three additional months from the March quarterly cycle (March, June, September and December). SPX options are European-style exercise (they generally may be exercised only on the last business day before the expiration date). The exercise-settlement value, SET, is calculated using the first (opening) reported sales price in the primary market of each component stock on the last business day before the expiration date. Exercise will result in delivery of cash on the business day following expiration. SPX, which was originally introduced an American-style option, was reintroduced as a European-style option on April 2, 1986. SPX FLEX and LEAPS and Long-Dated options (SPL) are also traded. Standard & Poor’s 500 Index Options - P.M. Settled SPXpmTM The Standard & Poor’s 500 Index is a capitalization-weighted index of 500 stocks from a broad range of industries. The component stocks are weighed according to the total market value of their outstanding shares. The impact of a component’s price change is proportional to the issue’s total market value, which is the share price times the number of shares outstanding. These are summed for all 500 stocks and divided by a predetermined base value. The base value for the S&P 500 Index is adjusted to reflect changes in capitalization resulting from mergers, acquisitions, stock rights, substitutions, etc. SPXpm options are European-style and generally may be exercised only on the last business day before expiration. The exercise-settlement value, SPXpm, is the official closing price of the S&P 500 Index as reported by Standard & Poor’s on the last business day before the expiration date. Exercise will result in delivery of cash on the business day following expiration. Trading in SPXpm options will ordinarily cease on the business day (usually a Friday) preceding the expiration date. Standard & Poor’s 100 Index Options - OEX® & XEO® The Standard & Poor’s 100 Index is a capitalization-weighted index of 100 stocks from a broad range of industries. OEX and XEO options are available in the four near-term months plus 1 month from the March cycle. OEX options are American-style exercise (they may be exercised on any business day before the expiration date). XEO options are European-style exercise (they generally may be exercised only on the last business day before the expiration date). The exercise-settlement value, OEX, is calculated using the last (closing) reported sales price in the primary market of each component stock on the last business day before the expiration date or on the day the exercise notice is properly submitted if exercised before expiration. Exercise will result in delivery of cash on the business day following expiration. OEX & XEO FLEX and LEAPS are also traded. Options on the CBOE Volatility Index® – VIX® The CBOE Volatility Index - more commonly referred to as the “VIX” Index - is an up-to-the-minute market estimate of expected volatility that is calculated by using real-time S&P 500® Index (SPX) option bid/ask quotes. The VIX Index uses nearby and second nearby options with at least 8 days left to expiration and then weights them to yield a constant, 30-day measure of the expected volatility of the S&P 500 Index. VIX options are European-style and are available in three near-term months plus three months on the February quarterly cycle (February, May, August and November). Exercise will result in delivery of cash on the business day following expiration. The exercise-settlement value, VRO, is a Special Opening Quotation (SOQ) of the VIX Index calculated from the sequence of opening prices of the SPX options used to calculate VIX at settlement. VIX LEAPS are also traded.

Options on the Dow Jones Industrial AverageSM - DJX The Dow Jones Industrial Average (DJIA) is a price-weighted index of 30 of the largest, most liquid NYSE & Nasdaq-listed stocks. Options are based on 1/100th of the DJIA level. Options are European-style and are available in three near-term months plus three months on the March quarterly cycle (March, June, September and December). Exercise will result in delivery of cash on the business day following expiration. The exercise-settlement value, DJS, is calculated using the first (opening) reported sales price in the primary market of each component stock on the last business day (usually a Friday) before the expiration date. DJX FLEX and LEAPS (based on 1/100th of the DJIA level) are also traded. Nasdaq-100 Index® Options - NDX The Nasdaq-100 Index is a capitalization-weighted index composed of 100 of the largest non-financial securities listed on the Nasdaq Stock MarketSM. Options are European-style and are available in up to three near-term months plus up to three additional months from the March quarterly cycle (March, June, September and December). Exercise will result in delivery of cash on the business day following expiration. NDX exercise-settlement value, NDS, is calculated using the first (opening) reported sales price in the primary market of each component stock on the last business day (usually a Friday) before the expiration date. NDX FLEX are also traded. CBOE Mini Nasdaq-100 Index® Options - MNX The CBOE Mini-NDX Index is based on 1/10th the value of the Nasdaq-100 Index® (NDX). MNX options are available in up to three near-term months plus up to three additional months from the March quarterly cycle (March, June, September and December) and are European-style options (they generally may be exercised only on the last business day before the expiration date). Trading will ordinarily cease on the business day (usually a Thursday) preceding the day on which the exercise-settlement value is calculated. The exercise-settlement value for MNX options, XMS, is computed by dividing the NDX settlement value, NDS, by a factor of 10. Russell 2000® Index Options – RUT The Russell 2000 Index is a capitalization-weighted index of domestic equities traded on the NYSE, AMEX and NASDAQ. The index represents the bottom 2,000 companies from a universe of the 3,000 largest stocks in the U.S. It is considered a benchmark of the U.S. small-capitalization market. Shares are adjusted for cross-ownership. The index composition is adjusted once per year (June) to reflect changes in rankings and shares outstanding. The component stocks are weighted according to the total market value of their outstanding shares. The impact of a component’s price change is proportional to the issue’s total market value, which is the share price times the number of shares outstanding. These are summed for all 2,000 stocks and divided by a predetermined base value. The base value is adjusted to reflect changes in capitalization resulting from mergers, acquisitions, stock rights, substitutions, etc. Standard RUT options are available in the three near-term months followed by three additional months from the March quarterly cycle (March, June, September and December). Options are European-style exercise. The exercise-settlement value, RLS, is calculated using the first (opening) reported sales price in the primary market of each component stock on the last business day (usually a Friday) before the expiration date. If a stock in the index does not open on the day on which the exercise-settlement value is calculated, the last reported sales price in the primary market will be used in calculating the exercise-settlement value. The exercise-settlement amount is equal to the difference between the exercise-settlement value and the exercise price of the option, multiplied by $100. Exercise will result in delivery of cash on the business day following expiration. RUT FLEX and LEAPS (based on 1/10th of the RUT level) are also traded.

CASH INDEX OPTIONS - 2015
Total CBOE Cash Index Options Contract Volume
Trading Average DailyMonth Days Call Put Total Volume
Jan 20 13,464,499 17,887,039 31,351,538 1,567,577Feb 19 11,326,214 14,799,618 26,125,832 1,375,044Mar 22 12,111,065 15,571,351 27,682,416 1,258,292Apr 21 12,180,173 14,598,221 26,778,394 1,275,162May 20 14,074,056 14,197,198 28,271,254 1,413,563Jun 22 17,919,039 17,645,543 35,564,582 1,616,572Jul 22 18,741,821 19,645,569 38,387,390 1,744,881Aug 21 24,355,993 27,379,402 51,735,395 2,463,590Sep 21 19,130,796 23,028,782 42,159,578 2,007,599Oct 22 18,623,484 18,648,464 37,271,948 1,694,179Nov 20 13,670,574 15,142,613 28,813,187 1,440,659Dec 22 15,244,627 17,081,392 32,326,019 1,469,365Total 252 190,842,341 215,625,192 406,467,533 1,612,966
CBOE Cash Index Options Open Interest and Dollar Volume
Month Call Put Total Call Put TotalJan 6,921,324 10,785,628 17,706,952 $22,473,389,139 $24,224,135,612 $46,697,524,751Feb 7,564,733 11,358,014 18,922,747 $14,891,400,617 $14,373,792,829 $29,265,193,446Mar 7,390,737 10,118,554 17,509,291 $17,195,127,837 $17,661,060,999 $34,856,188,836Apr 8,831,137 11,042,032 19,873,169 $14,144,740,078 $13,190,042,212 $27,334,782,290May 9,529,539 11,084,567 20,614,106 $12,629,920,407 $12,356,447,838 $24,986,368,245Jun 9,734,376 10,630,662 20,365,038 $18,459,945,734 $16,320,538,152 $34,780,483,886Jul 9,978,060 11,610,471 21,588,531 $15,166,409,908 $17,738,943,936 $32,905,353,844Aug 11,202,515 13,463,273 24,665,788 $21,830,933,970 $44,020,114,475 $65,851,048,445Sep 10,162,410 13,280,236 23,442,646 $26,967,000,686 $38,010,268,296 $64,977,268,982Oct 10,723,560 12,843,202 23,566,762 $21,456,246,618 $18,734,891,129 $40,191,137,747Nov 9,646,103 11,697,756 21,343,859 $19,237,085,268 $14,649,306,286 $33,886,391,554Dec 7,154,957 9,349,235 16,504,192 $22,166,706,273 $21,644,935,009 $43,811,641,282Total -- -- -- $226,618,906,535 $252,924,476,773 $479,543,383,308
Contract Volume
Open Interest in Contracts Dollar Volume
Page 69

Total CBOE Cash Index Options Average Premium Per Contract, Average Contracts Per Trade and Transactions
Month Call Put Total Call Put Total Call Put TotalJan $1,669 $1,354 $1,489 34 33 34 392,060 534,571 926,631Feb $1,315 $971 $1,120 33 35 34 346,322 425,138 771,460Mar $1,420 $1,134 $1,259 28 27 28 433,682 567,209 1,000,891Apr $1,161 $904 $1,021 31 30 30 390,721 490,381 881,102May $897 $870 $884 35 30 32 403,332 468,661 871,993Jun $1,030 $925 $978 33 28 31 543,060 621,119 1,164,179Jul $809 $903 $857 32 28 30 591,239 691,048 1,282,287Aug $896 $1,608 $1,273 36 31 33 671,318 879,341 1,550,659Sep $1,410 $1,651 $1,541 33 33 33 586,351 703,499 1,289,850Oct $1,152 $1,005 $1,078 34 33 33 554,382 569,591 1,123,973Nov $1,407 $967 $1,176 30 28 29 458,974 531,682 990,656Dec $1,454 $1,267 $1,355 30 27 28 515,556 644,516 1,160,072Total $1,187 $1,173 $1,180 32 30 31 5,886,997 7,126,756 13,013,753
Average Premium Per Contract Average Contracts Per Trade Transactions
Page 70

Total CBOE Cash Index FLEX® (NDX, RUT, SPX and XSP) Contract Volume
Trading Average DailyMonth Days Call Put Total Volume
Jan 20 43,546 63,754 107,300 5,365Feb 19 36,467 58,834 95,301 5,016Mar 22 43,246 74,640 117,886 5,358Apr 21 53,584 57,272 110,856 5,279May 20 42,632 76,113 118,745 5,937Jun 22 72,381 62,579 134,960 6,135Jul 22 64,991 42,643 107,634 4,892Aug 21 36,951 59,719 96,670 4,603Sep 21 42,582 181,534 224,116 10,672Oct 22 53,996 37,686 91,682 4,167Nov 20 47,819 52,156 99,975 4,999Dec 22 34,830 40,447 75,277 3,422Total 252 573,025 807,377 1,380,402 5,478
Total CBOE Cash Index FLEX® (NDX, RUT, SPX and XSP) Open Interest and Dollar Volume
Month Call Put Total Call Put TotalJan 162,092 137,218 299,310 $87,043,172 $152,653,373 $239,696,545Feb 169,555 153,577 323,132 $98,146,998 $97,636,227 $195,783,225Mar 177,863 170,718 348,581 $155,500,565 $184,429,735 $339,930,300Apr 172,055 158,512 330,567 $86,280,028 $63,482,030 $149,762,058May 170,067 159,717 329,784 $86,432,454 $128,767,894 $215,200,348Jun 192,325 149,431 341,756 $125,456,891 $169,725,367 $295,182,258Jul 173,714 148,356 322,070 $131,774,162 $126,396,069 $258,170,231Aug 150,598 159,932 310,530 $58,235,490 $121,068,114 $179,303,604Sep 147,682 190,182 337,864 $53,440,210 $319,859,939 $373,300,149Oct 159,084 130,864 289,948 $116,800,093 $62,945,731 $179,745,824Nov 170,705 136,909 307,614 $768,354,310 $115,028,308 $883,382,618Dec 151,486 108,402 259,888 $74,528,099 $83,330,125 $157,858,224Total -- -- -- $1,841,992,472 $1,625,322,912 $3,467,315,384
Contract Volume
Open Interest in Contracts Dollar Volume
Page 71
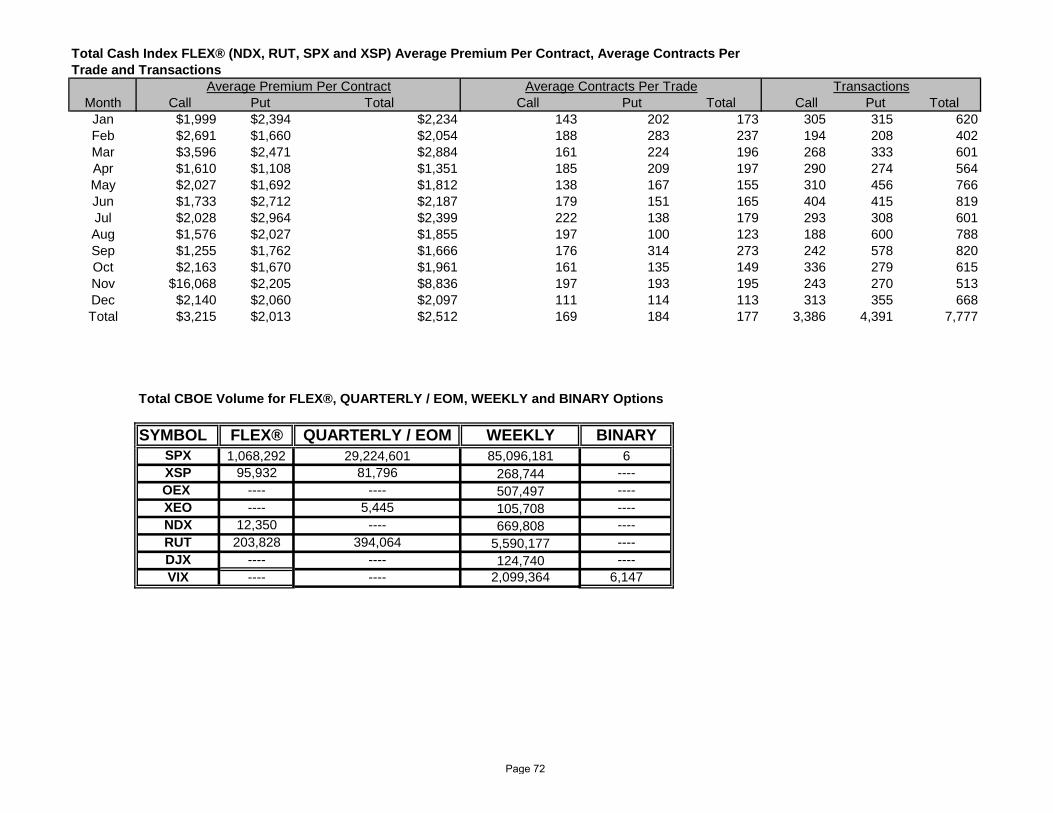
Total Cash Index FLEX® (NDX, RUT, SPX and XSP) Average Premium Per Contract, Average Contracts Per Trade and Transactions
Month Call Put Total Call Put Total Call Put TotalJan $1,999 $2,394 $2,234 143 202 173 305 315 620Feb $2,691 $1,660 $2,054 188 283 237 194 208 402Mar $3,596 $2,471 $2,884 161 224 196 268 333 601Apr $1,610 $1,108 $1,351 185 209 197 290 274 564May $2,027 $1,692 $1,812 138 167 155 310 456 766Jun $1,733 $2,712 $2,187 179 151 165 404 415 819Jul $2,028 $2,964 $2,399 222 138 179 293 308 601Aug $1,576 $2,027 $1,855 197 100 123 188 600 788Sep $1,255 $1,762 $1,666 176 314 273 242 578 820Oct $2,163 $1,670 $1,961 161 135 149 336 279 615Nov $16,068 $2,205 $8,836 197 193 195 243 270 513Dec $2,140 $2,060 $2,097 111 114 113 313 355 668Total $3,215 $2,013 $2,512 169 184 177 3,386 4,391 7,777
Total CBOE Volume for FLEX®, QUARTERLY / EOM, WEEKLY and BINARY Options
SYMBOL FLEX® QUARTERLY / EOM WEEKLY BINARYSPX 1,068,292 29,224,601 85,096,181 6XSP 95,932 81,796 268,744 ----OEX ---- ---- 507,497 ----XEO ---- 5,445 105,708 ----NDX 12,350 ---- 669,808 ----RUT 203,828 394,064 5,590,177 ----DJX ---- ---- 124,740 ----VIX ---- ---- 2,099,364 6,147
TransactionsAverage Premium Per Contract Average Contracts Per Trade
Page 72
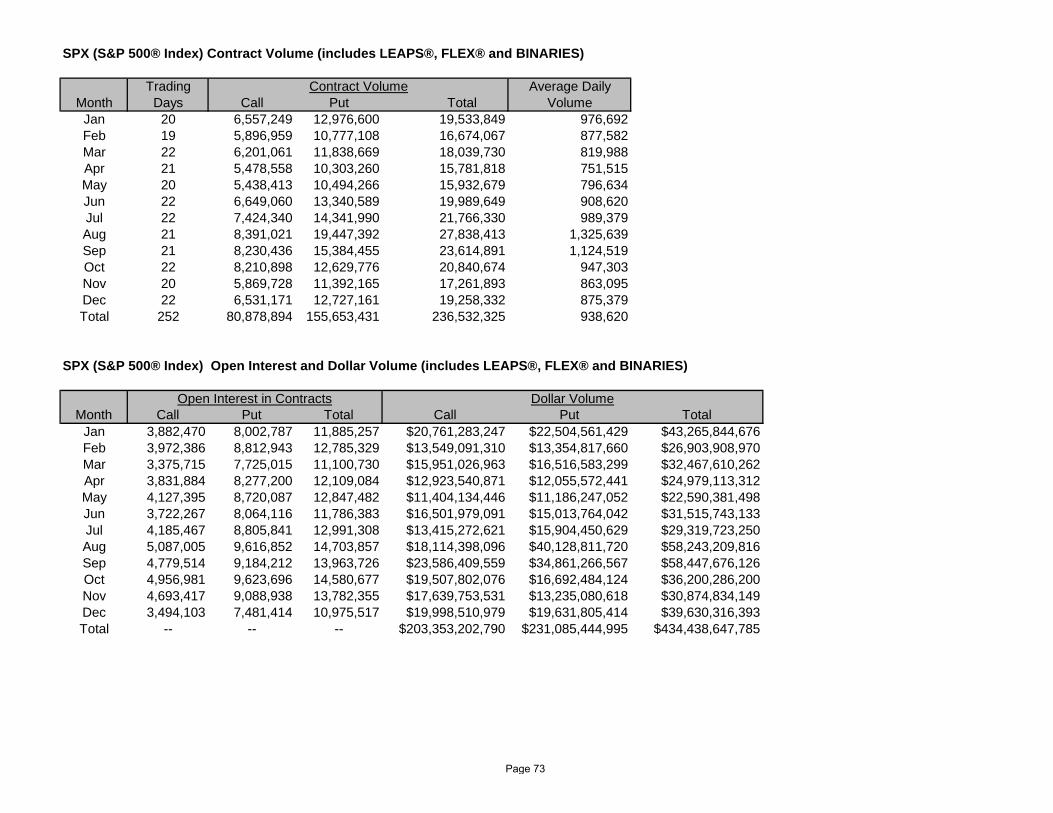
SPX (S&P 500® Index) Contract Volume (includes LEAPS®, FLEX® and BINARIES)
Trading Average DailyMonth Days Call Put Total Volume
Jan 20 6,557,249 12,976,600 19,533,849 976,692Feb 19 5,896,959 10,777,108 16,674,067 877,582Mar 22 6,201,061 11,838,669 18,039,730 819,988Apr 21 5,478,558 10,303,260 15,781,818 751,515May 20 5,438,413 10,494,266 15,932,679 796,634Jun 22 6,649,060 13,340,589 19,989,649 908,620Jul 22 7,424,340 14,341,990 21,766,330 989,379Aug 21 8,391,021 19,447,392 27,838,413 1,325,639Sep 21 8,230,436 15,384,455 23,614,891 1,124,519Oct 22 8,210,898 12,629,776 20,840,674 947,303Nov 20 5,869,728 11,392,165 17,261,893 863,095Dec 22 6,531,171 12,727,161 19,258,332 875,379Total 252 80,878,894 155,653,431 236,532,325 938,620
SPX (S&P 500® Index) Open Interest and Dollar Volume (includes LEAPS®, FLEX® and BINARIES)
Month Call Put Total Call Put TotalJan 3,882,470 8,002,787 11,885,257 $20,761,283,247 $22,504,561,429 $43,265,844,676Feb 3,972,386 8,812,943 12,785,329 $13,549,091,310 $13,354,817,660 $26,903,908,970Mar 3,375,715 7,725,015 11,100,730 $15,951,026,963 $16,516,583,299 $32,467,610,262Apr 3,831,884 8,277,200 12,109,084 $12,923,540,871 $12,055,572,441 $24,979,113,312May 4,127,395 8,720,087 12,847,482 $11,404,134,446 $11,186,247,052 $22,590,381,498Jun 3,722,267 8,064,116 11,786,383 $16,501,979,091 $15,013,764,042 $31,515,743,133Jul 4,185,467 8,805,841 12,991,308 $13,415,272,621 $15,904,450,629 $29,319,723,250Aug 5,087,005 9,616,852 14,703,857 $18,114,398,096 $40,128,811,720 $58,243,209,816Sep 4,779,514 9,184,212 13,963,726 $23,586,409,559 $34,861,266,567 $58,447,676,126Oct 4,956,981 9,623,696 14,580,677 $19,507,802,076 $16,692,484,124 $36,200,286,200Nov 4,693,417 9,088,938 13,782,355 $17,639,753,531 $13,235,080,618 $30,874,834,149Dec 3,494,103 7,481,414 10,975,517 $19,998,510,979 $19,631,805,414 $39,630,316,393Total -- -- -- $203,353,202,790 $231,085,444,995 $434,438,647,785
Contract Volume
Open Interest in Contracts Dollar Volume
Page 73

SPX (S&P 500® Index) Average Premium Per Contract, Average Contracts Per Trade and Transactions (includes LEAPS®, FLEX® and BINARIES)
Month Call Put Total Call Put Total Call Put TotalJan $3,166 $1,734 $2,215 30 36 34 219,696 357,741 577,437Feb $2,298 $1,239 $1,614 30 40 36 193,515 272,105 465,620Mar $2,572 $1,395 $1,800 24 30 28 255,113 398,807 653,920Apr $2,359 $1,170 $1,583 24 32 29 225,182 324,303 549,485May $2,097 $1,066 $1,418 23 34 29 236,097 312,048 548,145Jun $2,482 $1,125 $1,577 21 31 27 317,517 430,905 748,422Jul $1,807 $1,109 $1,347 21 30 26 354,436 470,469 824,905Aug $2,159 $2,063 $2,092 22 32 28 386,028 607,430 993,458Sep $2,866 $2,266 $2,475 23 31 28 358,557 496,347 854,904Oct $2,376 $1,322 $1,737 23 33 28 361,019 386,224 747,243Nov $3,005 $1,162 $1,789 21 33 27 281,033 349,626 630,659Dec $3,062 $1,543 $2,058 21 30 26 310,431 430,053 740,484Total $2,514 $1,485 $1,837 23 32 28 3,498,624 4,836,058 8,334,682
TransactionsAverage Premium Per Contract Average Contracts Per Trade
Page 74
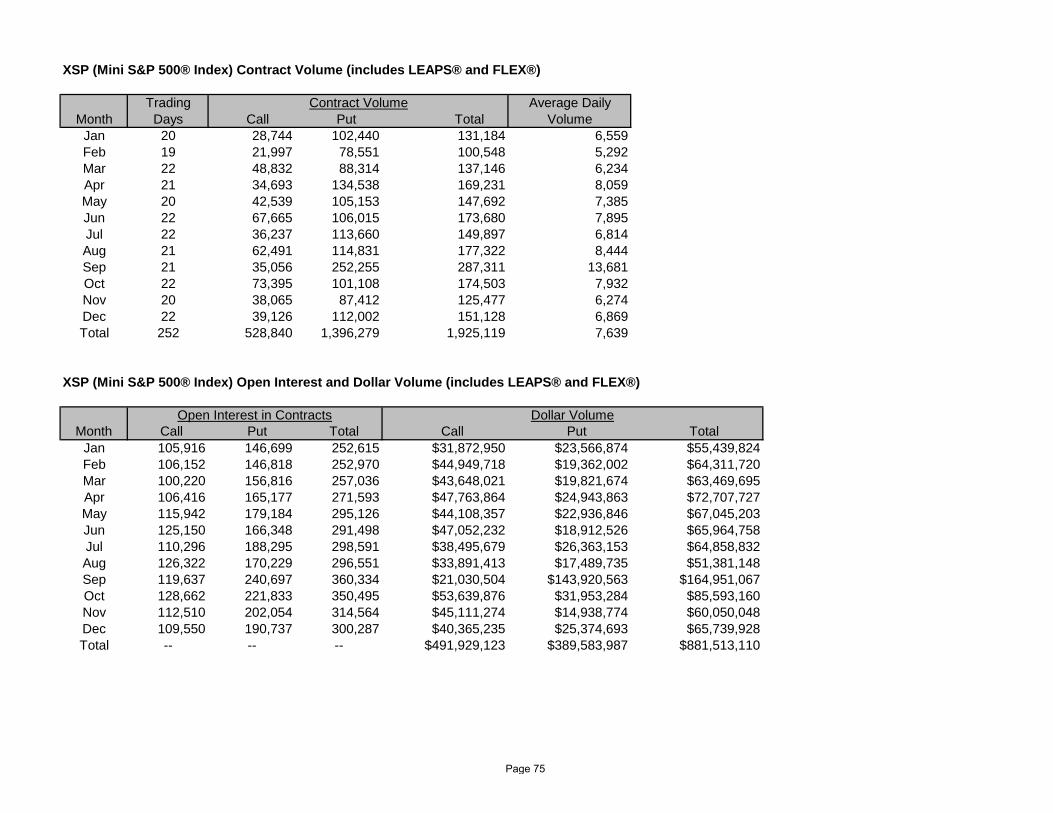
XSP (Mini S&P 500® Index) Contract Volume (includes LEAPS® and FLEX®)
Trading Average DailyMonth Days Call Put Total Volume
Jan 20 28,744 102,440 131,184 6,559Feb 19 21,997 78,551 100,548 5,292Mar 22 48,832 88,314 137,146 6,234Apr 21 34,693 134,538 169,231 8,059May 20 42,539 105,153 147,692 7,385Jun 22 67,665 106,015 173,680 7,895Jul 22 36,237 113,660 149,897 6,814Aug 21 62,491 114,831 177,322 8,444Sep 21 35,056 252,255 287,311 13,681Oct 22 73,395 101,108 174,503 7,932Nov 20 38,065 87,412 125,477 6,274Dec 22 39,126 112,002 151,128 6,869Total 252 528,840 1,396,279 1,925,119 7,639
XSP (Mini S&P 500® Index) Open Interest and Dollar Volume (includes LEAPS® and FLEX®)
Month Call Put Total Call Put TotalJan 105,916 146,699 252,615 $31,872,950 $23,566,874 $55,439,824Feb 106,152 146,818 252,970 $44,949,718 $19,362,002 $64,311,720Mar 100,220 156,816 257,036 $43,648,021 $19,821,674 $63,469,695Apr 106,416 165,177 271,593 $47,763,864 $24,943,863 $72,707,727May 115,942 179,184 295,126 $44,108,357 $22,936,846 $67,045,203Jun 125,150 166,348 291,498 $47,052,232 $18,912,526 $65,964,758Jul 110,296 188,295 298,591 $38,495,679 $26,363,153 $64,858,832Aug 126,322 170,229 296,551 $33,891,413 $17,489,735 $51,381,148Sep 119,637 240,697 360,334 $21,030,504 $143,920,563 $164,951,067Oct 128,662 221,833 350,495 $53,639,876 $31,953,284 $85,593,160Nov 112,510 202,054 314,564 $45,111,274 $14,938,774 $60,050,048Dec 109,550 190,737 300,287 $40,365,235 $25,374,693 $65,739,928Total -- -- -- $491,929,123 $389,583,987 $881,513,110
Contract Volume
Open Interest in Contracts Dollar Volume
Page 75

XSP (Mini S&P 500® Index) Average Premium Per Contract, Average Contracts Per Trade and Transactions (includes LEAPS® and FLEX®)
Month Call Put Total Call Put Total Call Put TotalJan $1,109 $230 $423 58 120 97 497 855 1,352Feb $2,043 $246 $640 31 72 56 709 1,084 1,793Mar $894 $224 $463 36 55 46 1,346 1,611 2,957Apr $1,377 $185 $430 52 99 83 672 1,357 2,029May $1,037 $218 $454 45 62 56 951 1,704 2,655Jun $695 $178 $380 49 46 47 1,376 2,321 3,697Jul $1,062 $232 $433 36 70 57 1,003 1,627 2,630Aug $542 $152 $290 71 71 71 877 1,608 2,485Sep $600 $571 $574 36 126 97 978 1,999 2,977Oct $731 $316 $490 56 47 50 1,307 2,163 3,470Nov $1,185 $171 $479 40 49 46 946 1,779 2,725Dec $1,032 $227 $435 38 66 56 1,019 1,702 2,721Total $930 $279 $458 45 70 61 11,681 19,810 31,491
Average Premium Per Contract Average Contracts Per Trade Transactions
Page 76

SPXpm (S&P 500® Index) Contract Volume
Trading Average DailyMonth Days Call Put Total Volume
Jan 20 39,044 71,837 110,881 5,544Feb 19 42,204 70,853 113,057 5,950Mar 22 63,223 85,068 148,291 6,741Apr 21 49,655 64,695 114,350 5,445May 20 38,960 61,983 100,943 5,047Jun 22 62,328 96,158 158,486 7,204Jul 22 71,200 101,477 172,677 7,849Aug 21 79,499 196,085 275,584 13,123Sep 21 61,334 168,360 229,694 10,938Oct 22 75,026 91,632 166,658 7,575Nov 20 54,702 129,483 184,185 9,209Dec 22 99,268 185,840 285,108 12,959Total 252 736,443 1,323,471 2,059,914 8,174
SPXpm (S&P 500® Index) Open Interest and Dollar Volume
Month Call Put Total Call Put TotalJan 14,505 84,850 99,355 $75,216,072 $71,270,990 $146,487,062Feb 14,205 86,044 100,249 $40,759,884 $42,289,856 $83,049,740Mar 17,724 88,597 106,321 $69,701,636 $64,832,017 $134,533,653Apr 18,682 89,088 107,770 $44,153,554 $41,029,708 $85,183,262May 17,519 87,056 104,575 $21,493,404 $27,392,872 $48,886,276Jun 19,036 97,583 116,619 $52,809,439 $60,373,127 $113,182,566Jul 28,881 105,257 134,138 $41,170,767 $78,594,107 $119,764,874Aug 28,019 112,431 140,450 $56,154,615 $192,608,946 $248,763,561Sep 22,847 181,789 204,636 $60,818,824 $117,366,282 $178,185,106Oct 25,816 179,519 205,335 $86,665,045 $49,437,998 $136,103,043Nov 29,695 167,319 197,014 $99,661,440 $93,644,864 $193,306,304Dec 37,946 143,075 181,021 $133,400,173 $145,808,474 $279,208,647Total -- -- -- $782,004,853 $984,649,241 $1,766,654,094
Contract Volume
Open Interest in Contracts Dollar Volume
Page 77

SPXpm (S&P 500® Index) Average Premium Per Contract, Average Contracts Per Trade and Transactions
Month Call Put Total Call Put Total Call Put TotalJan $1,926 $992 $1,321 9 10 9 4,544 7,264 11,808Feb $966 $597 $735 12 15 14 3,472 4,680 8,152Mar $1,102 $762 $907 12 14 13 5,213 6,138 11,351Apr $889 $634 $745 13 12 12 3,786 5,378 9,164May $552 $442 $484 12 14 13 3,318 4,544 7,862Jun $847 $628 $714 14 15 15 4,526 6,308 10,834Jul $578 $775 $694 12 14 13 6,009 7,205 13,214Aug $706 $982 $903 12 15 14 6,458 13,263 19,721Sep $992 $697 $776 13 21 18 4,848 8,052 12,900Oct $1,155 $540 $817 16 18 17 4,570 5,201 9,771Nov $1,822 $723 $1,050 13 20 17 4,376 6,573 10,949Dec $1,344 $785 $979 16 19 18 6,079 9,848 15,927Total $1,062 $744 $858 13 16 15 57,199 84,454 141,653
TransactionsAverage Premium Per Contract Average Contracts Per Trade
Page 78

OEX® (S&P 100®) Contract Volume (includes LEAPS®)
Trading Average DailyMonth Days Call Put Total Volume
Jan 20 59,895 56,486 116,381 5,819Feb 19 31,060 45,143 76,203 4,011Mar 22 49,554 56,167 105,721 4,806Apr 21 35,912 53,620 89,532 4,263May 20 37,897 51,842 89,739 4,487Jun 22 42,557 54,465 97,022 4,410Jul 22 46,784 52,324 99,108 4,505Aug 21 64,444 73,707 138,151 6,579Sep 21 60,939 71,763 132,702 6,319Oct 22 51,792 73,494 125,286 5,695Nov 20 29,409 42,159 71,568 3,578Dec 22 52,655 72,590 125,245 5,693Total 252 562,898 703,760 1,266,658 5,026
OEX® (S&P 100®) Open Interest and Dollar Volume (includes LEAPS®)
Month Call Put Total Call Put TotalJan 19,254 28,473 47,727 $45,984,049 $31,195,413 $77,179,462Feb 11,638 25,227 36,865 $28,589,978 $15,293,027 $43,883,005Mar 11,124 24,822 35,946 $31,724,522 $26,577,815 $58,302,337Apr 10,850 27,551 38,401 $17,669,991 $17,570,970 $35,240,961May 11,526 26,927 38,453 $17,739,817 $19,390,068 $37,129,885Jun 10,891 23,986 34,877 $24,956,528 $18,033,865 $42,990,393Jul 11,678 28,522 40,200 $25,225,194 $17,036,818 $42,262,012Aug 15,693 24,469 40,162 $57,016,706 $57,782,177 $114,798,883Sep 16,274 28,936 45,210 $42,081,235 $41,715,510 $83,796,745Oct 12,899 32,037 44,936 $58,587,013 $22,043,550 $80,630,563Nov 10,018 25,282 35,300 $29,605,023 $15,515,132 $45,120,155Dec 10,244 24,683 34,927 $42,138,290 $29,187,983 $71,326,273Total -- -- -- $421,318,346 $311,342,328 $732,660,674
Contract Volume
Open Interest in Contracts Dollar Volume
Page 79
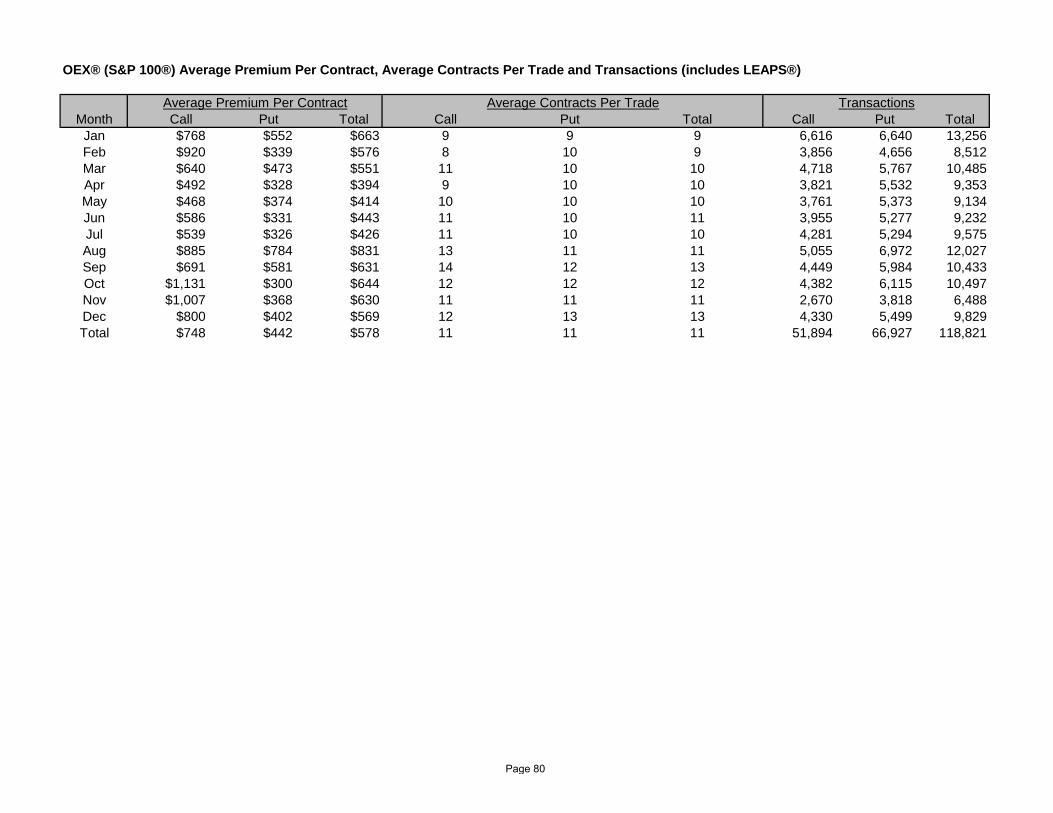
OEX® (S&P 100®) Average Premium Per Contract, Average Contracts Per Trade and Transactions (includes LEAPS®)
Month Call Put Total Call Put Total Call Put TotalJan $768 $552 $663 9 9 9 6,616 6,640 13,256Feb $920 $339 $576 8 10 9 3,856 4,656 8,512Mar $640 $473 $551 11 10 10 4,718 5,767 10,485Apr $492 $328 $394 9 10 10 3,821 5,532 9,353May $468 $374 $414 10 10 10 3,761 5,373 9,134Jun $586 $331 $443 11 10 11 3,955 5,277 9,232Jul $539 $326 $426 11 10 10 4,281 5,294 9,575Aug $885 $784 $831 13 11 11 5,055 6,972 12,027Sep $691 $581 $631 14 12 13 4,449 5,984 10,433Oct $1,131 $300 $644 12 12 12 4,382 6,115 10,497Nov $1,007 $368 $630 11 11 11 2,670 3,818 6,488Dec $800 $402 $569 12 13 13 4,330 5,499 9,829Total $748 $442 $578 11 11 11 51,894 66,927 118,821
Average Contracts Per Trade TransactionsAverage Premium Per Contract
Page 80
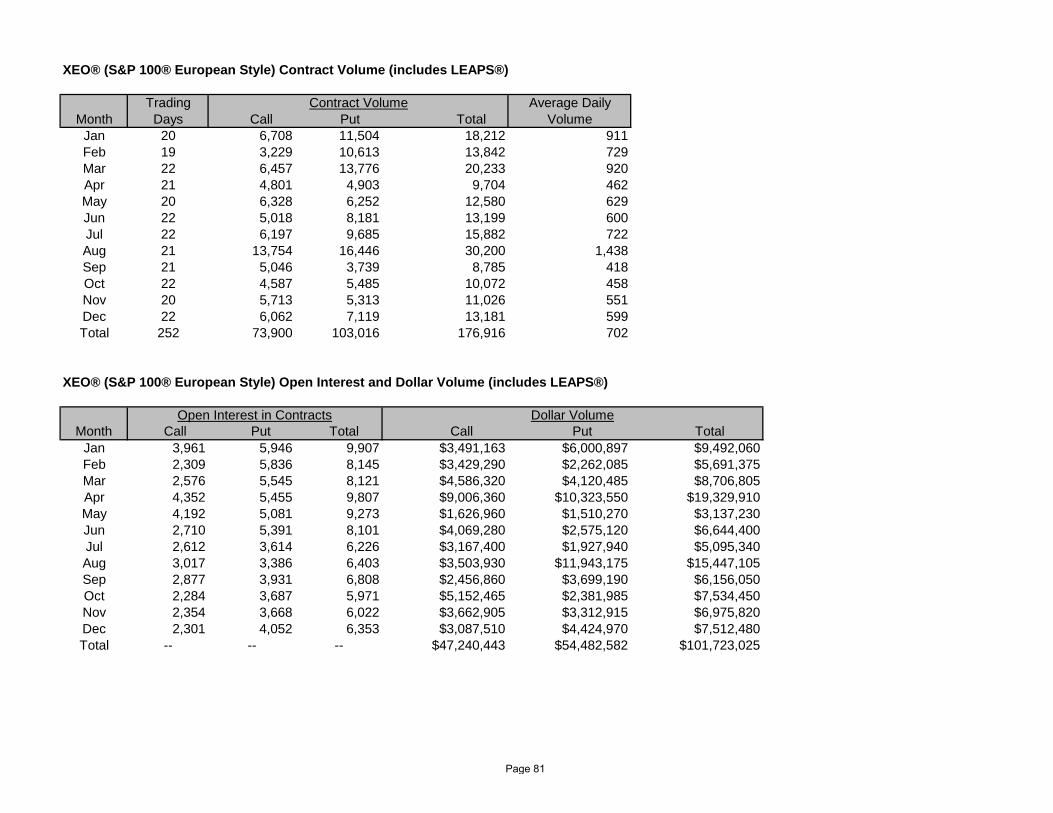
XEO® (S&P 100® European Style) Contract Volume (includes LEAPS®)
Trading Average DailyMonth Days Call Put Total Volume
Jan 20 6,708 11,504 18,212 911Feb 19 3,229 10,613 13,842 729Mar 22 6,457 13,776 20,233 920Apr 21 4,801 4,903 9,704 462May 20 6,328 6,252 12,580 629Jun 22 5,018 8,181 13,199 600Jul 22 6,197 9,685 15,882 722Aug 21 13,754 16,446 30,200 1,438Sep 21 5,046 3,739 8,785 418Oct 22 4,587 5,485 10,072 458Nov 20 5,713 5,313 11,026 551Dec 22 6,062 7,119 13,181 599Total 252 73,900 103,016 176,916 702
XEO® (S&P 100® European Style) Open Interest and Dollar Volume (includes LEAPS®)
Month Call Put Total Call Put TotalJan 3,961 5,946 9,907 $3,491,163 $6,000,897 $9,492,060Feb 2,309 5,836 8,145 $3,429,290 $2,262,085 $5,691,375Mar 2,576 5,545 8,121 $4,586,320 $4,120,485 $8,706,805Apr 4,352 5,455 9,807 $9,006,360 $10,323,550 $19,329,910May 4,192 5,081 9,273 $1,626,960 $1,510,270 $3,137,230Jun 2,710 5,391 8,101 $4,069,280 $2,575,120 $6,644,400Jul 2,612 3,614 6,226 $3,167,400 $1,927,940 $5,095,340Aug 3,017 3,386 6,403 $3,503,930 $11,943,175 $15,447,105Sep 2,877 3,931 6,808 $2,456,860 $3,699,190 $6,156,050Oct 2,284 3,687 5,971 $5,152,465 $2,381,985 $7,534,450Nov 2,354 3,668 6,022 $3,662,905 $3,312,915 $6,975,820Dec 2,301 4,052 6,353 $3,087,510 $4,424,970 $7,512,480Total -- -- -- $47,240,443 $54,482,582 $101,723,025
Contract Volume
Open Interest in Contracts Dollar Volume
Page 81

XEO® (S&P 100® European Style) Average Premium Per Contract, Average Contracts Per Trade and Transactions (includes LEAPS®)
Month Call Put Total Call Put Total Call Put TotalJan $520 $522 $521 20 17 18 330 672 1,002Feb $1,062 $213 $411 8 16 13 409 652 1,061Mar $710 $299 $430 16 25 21 399 543 942Apr $1,876 $2,106 $1,992 11 10 11 440 484 924May $257 $242 $249 21 12 16 297 509 806Jun $811 $315 $503 14 13 13 356 640 996Jul $511 $199 $321 16 22 19 377 447 824Aug $255 $726 $511 31 21 25 444 769 1,213Sep $487 $989 $701 11 8 10 469 451 920Oct $1,123 $434 $748 10 8 9 440 692 1,132Nov $641 $624 $633 14 9 11 404 613 1,017Dec $509 $622 $570 14 10 11 446 705 1,151Total $639 $529 $575 15 14 15 4,811 7,177 11,988
Average Premium Per Contract Average Contracts Per Trade Transactions
Page 82

DJX (Dow Jones Industrial Average®) Contract Volume (includes LEAPS®)
Trading Average DailyMonth Days Call Put Total Volume
Jan 20 45,102 29,334 74,436 3,722Feb 19 49,496 136,154 185,650 9,771Mar 22 65,079 54,865 119,944 5,452Apr 21 31,523 33,102 64,625 3,077May 20 41,693 44,841 86,534 4,327Jun 22 61,685 48,768 110,453 5,021Jul 22 52,535 47,293 99,828 4,538Aug 21 77,655 65,698 143,353 6,826Sep 21 36,333 39,417 75,750 3,607Oct 22 46,996 58,607 105,603 4,800Nov 20 42,244 34,530 76,774 3,839Dec 22 56,955 44,953 101,908 4,632Total 252 607,296 637,562 1,244,858 4,940
DJX (Dow Jones Industrial Average®) Open Interest and Dollar Volume (includes LEAPS®)
Month Call Put Total Call Put TotalJan 84,717 55,350 140,067 $18,166,123 $8,976,373 $27,142,496Feb 110,744 89,799 200,543 $27,801,370 $35,968,115 $63,769,485Mar 98,949 63,654 162,603 $20,655,814 $21,431,031 $42,086,845Apr 103,538 69,284 172,822 $7,240,256 $9,844,323 $17,084,579May 120,291 90,536 210,827 $18,757,081 $18,541,577 $37,298,658Jun 103,608 72,678 176,286 $21,177,798 $18,105,963 $39,283,761Jul 113,996 82,010 196,006 $12,155,482 $12,796,568 $24,952,050Aug 147,256 103,409 250,665 $36,097,830 $25,709,668 $61,807,498Sep 108,873 79,554 188,427 $8,999,093 $13,241,229 $22,240,322Oct 112,484 84,765 197,249 $11,640,134 $13,106,566 $24,746,700Nov 119,536 85,677 205,213 $14,486,243 $9,629,238 $24,115,481Dec 75,092 44,641 119,733 $20,761,726 $17,996,982 $38,758,708Total -- -- -- $217,938,950 $205,347,633 $423,286,583
Contract Volume
Open Interest in Contracts Dollar Volume
Page 83
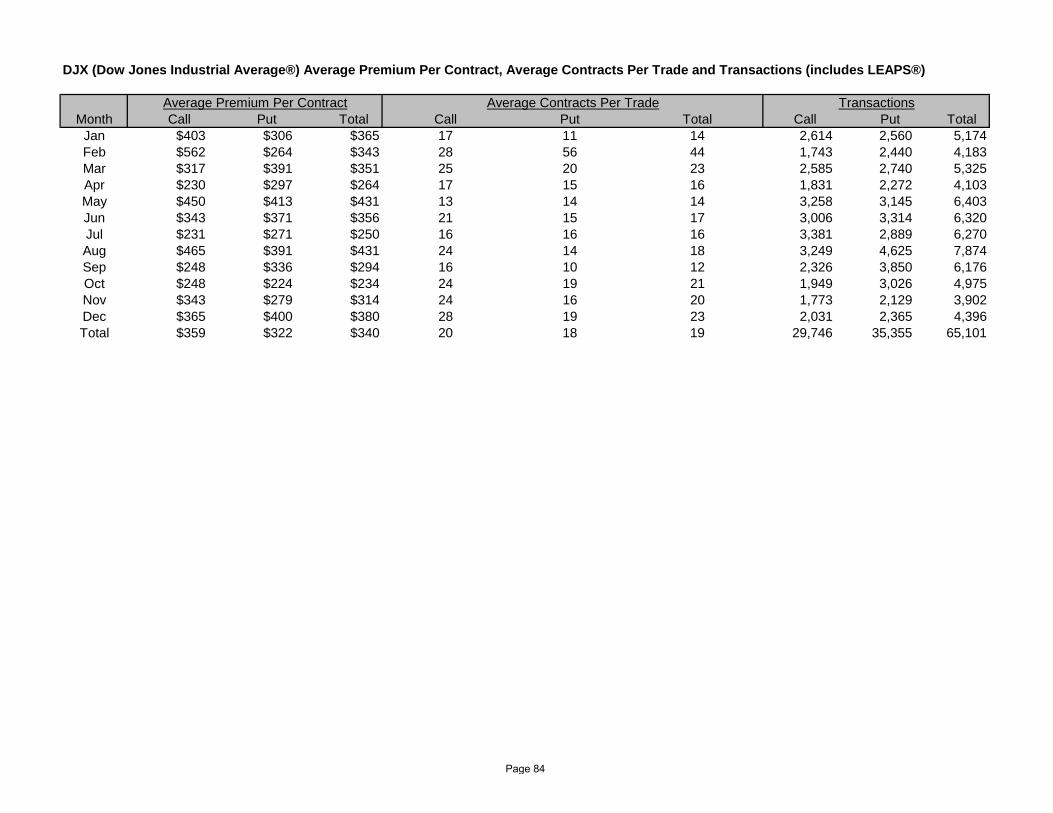
DJX (Dow Jones Industrial Average®) Average Premium Per Contract, Average Contracts Per Trade and Transactions (includes LEAPS®)
Month Call Put Total Call Put Total Call Put TotalJan $403 $306 $365 17 11 14 2,614 2,560 5,174Feb $562 $264 $343 28 56 44 1,743 2,440 4,183Mar $317 $391 $351 25 20 23 2,585 2,740 5,325Apr $230 $297 $264 17 15 16 1,831 2,272 4,103May $450 $413 $431 13 14 14 3,258 3,145 6,403Jun $343 $371 $356 21 15 17 3,006 3,314 6,320Jul $231 $271 $250 16 16 16 3,381 2,889 6,270Aug $465 $391 $431 24 14 18 3,249 4,625 7,874Sep $248 $336 $294 16 10 12 2,326 3,850 6,176Oct $248 $224 $234 24 19 21 1,949 3,026 4,975Nov $343 $279 $314 24 16 20 1,773 2,129 3,902Dec $365 $400 $380 28 19 23 2,031 2,365 4,396Total $359 $322 $340 20 18 19 29,746 35,355 65,101
Average Premium Per Contract Average Contracts Per Trade Transactions
Page 84
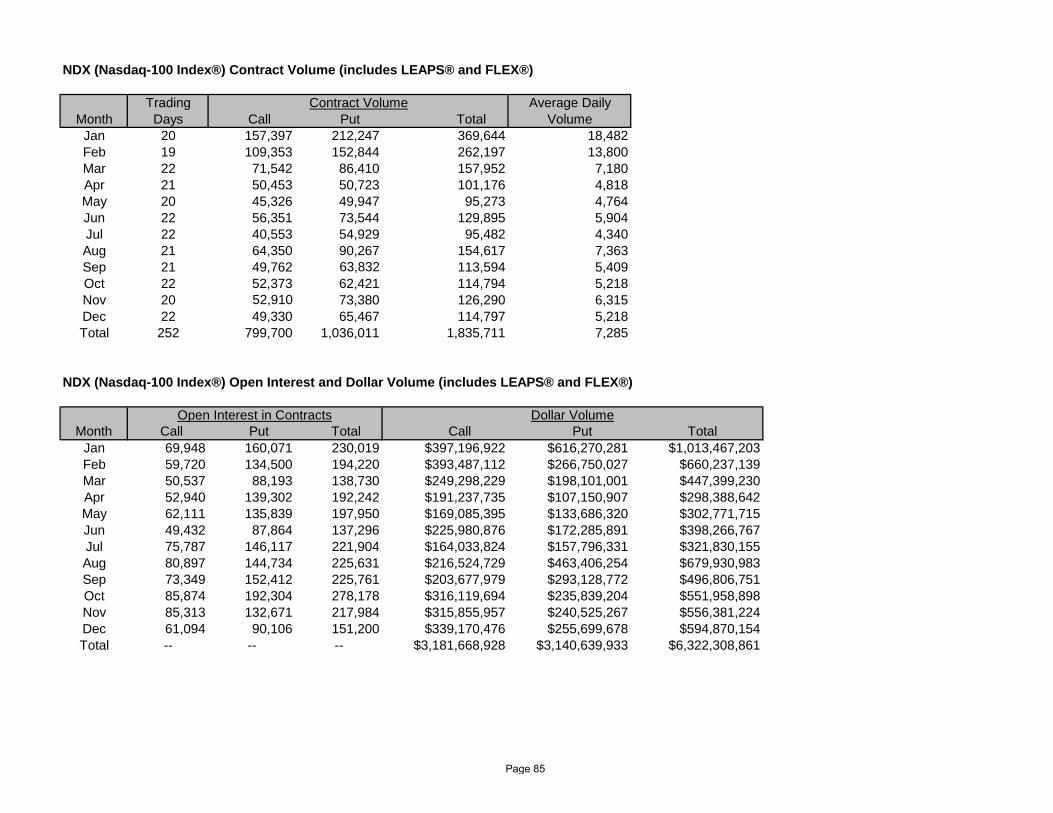
NDX (Nasdaq-100 Index®) Contract Volume (includes LEAPS® and FLEX®)
Trading Average DailyMonth Days Call Put Total Volume
Jan 20 157,397 212,247 369,644 18,482Feb 19 109,353 152,844 262,197 13,800Mar 22 71,542 86,410 157,952 7,180Apr 21 50,453 50,723 101,176 4,818May 20 45,326 49,947 95,273 4,764Jun 22 56,351 73,544 129,895 5,904Jul 22 40,553 54,929 95,482 4,340Aug 21 64,350 90,267 154,617 7,363Sep 21 49,762 63,832 113,594 5,409Oct 22 52,373 62,421 114,794 5,218Nov 20 52,910 73,380 126,290 6,315Dec 22 49,330 65,467 114,797 5,218Total 252 799,700 1,036,011 1,835,711 7,285
NDX (Nasdaq-100 Index®) Open Interest and Dollar Volume (includes LEAPS® and FLEX®)
Month Call Put Total Call Put TotalJan 69,948 160,071 230,019 $397,196,922 $616,270,281 $1,013,467,203Feb 59,720 134,500 194,220 $393,487,112 $266,750,027 $660,237,139Mar 50,537 88,193 138,730 $249,298,229 $198,101,001 $447,399,230Apr 52,940 139,302 192,242 $191,237,735 $107,150,907 $298,388,642May 62,111 135,839 197,950 $169,085,395 $133,686,320 $302,771,715Jun 49,432 87,864 137,296 $225,980,876 $172,285,891 $398,266,767Jul 75,787 146,117 221,904 $164,033,824 $157,796,331 $321,830,155Aug 80,897 144,734 225,631 $216,524,729 $463,406,254 $679,930,983Sep 73,349 152,412 225,761 $203,677,979 $293,128,772 $496,806,751Oct 85,874 192,304 278,178 $316,119,694 $235,839,204 $551,958,898Nov 85,313 132,671 217,984 $315,855,957 $240,525,267 $556,381,224Dec 61,094 90,106 151,200 $339,170,476 $255,699,678 $594,870,154Total -- -- -- $3,181,668,928 $3,140,639,933 $6,322,308,861
Open Interest in Contracts Dollar Volume
Contract Volume
Page 85

NDX (Nasdaq-100 Index®) Average Premium Per Contract, Average Contracts Per Trade and Transactions (includes LEAPS® and FLEX®)
Month Call Put Total Call Put Total Call Put TotalJan $2,524 $2,904 $2,742 8 7 7 20,957 31,028 51,985Feb $3,598 $1,745 $2,518 6 6 6 19,608 26,694 46,302Mar $3,485 $2,293 $2,833 6 5 5 12,961 16,516 29,477Apr $3,790 $2,112 $2,949 4 4 4 12,647 11,984 24,631May $3,730 $2,677 $3,178 6 5 5 7,970 9,979 17,949Jun $4,010 $2,343 $3,066 4 4 4 14,202 16,868 31,070Jul $4,045 $2,873 $3,371 5 5 5 8,929 12,137 21,066Aug $3,365 $5,134 $4,398 5 5 5 14,110 18,261 32,371Sep $4,093 $4,592 $4,374 5 5 5 10,636 11,830 22,466Oct $6,036 $3,778 $4,808 5 5 5 11,067 11,670 22,737Nov $5,970 $3,278 $4,406 4 5 5 13,421 14,450 27,871Dec $6,876 $3,906 $5,182 5 5 5 10,600 13,635 24,235Total $3,979 $3,031 $3,444 5 5 5 157,108 195,052 352,160
Average Premium Per Contract Average Contracts Per Trade Transactions
Page 86
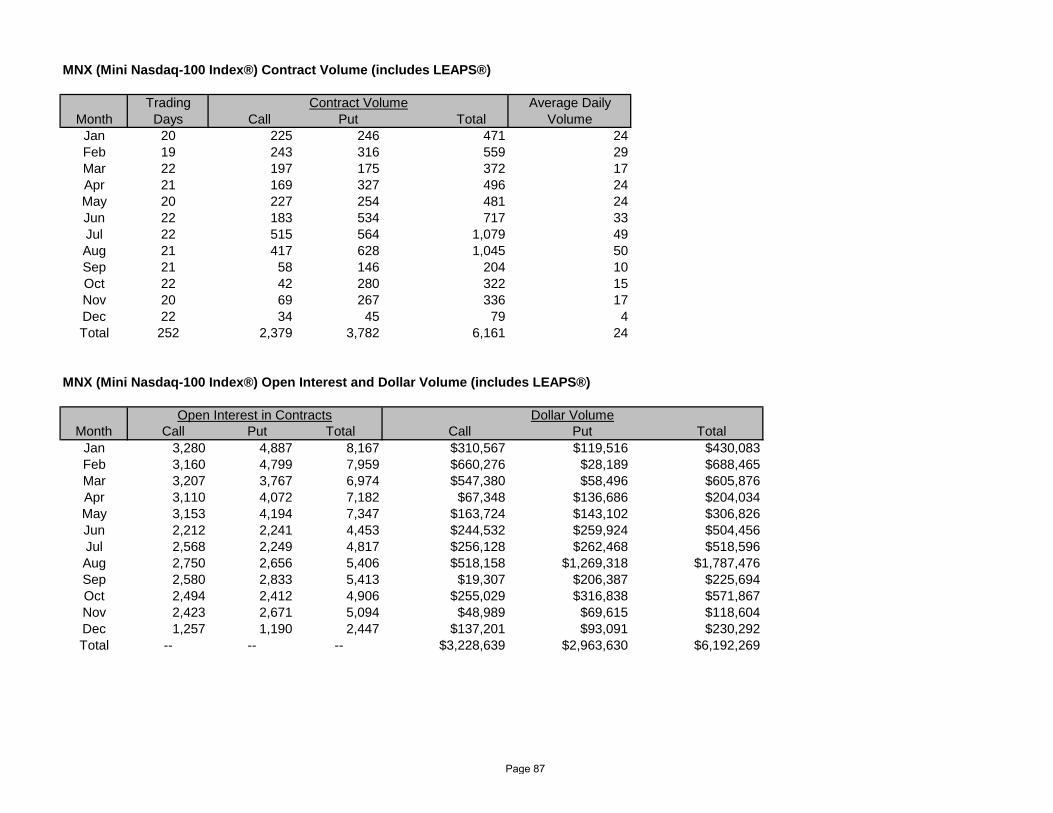
MNX (Mini Nasdaq-100 Index®) Contract Volume (includes LEAPS®)
Trading Average DailyMonth Days Call Put Total Volume
Jan 20 225 246 471 24Feb 19 243 316 559 29Mar 22 197 175 372 17Apr 21 169 327 496 24May 20 227 254 481 24Jun 22 183 534 717 33Jul 22 515 564 1,079 49Aug 21 417 628 1,045 50Sep 21 58 146 204 10Oct 22 42 280 322 15Nov 20 69 267 336 17Dec 22 34 45 79 4Total 252 2,379 3,782 6,161 24
MNX (Mini Nasdaq-100 Index®) Open Interest and Dollar Volume (includes LEAPS®)
Month Call Put Total Call Put TotalJan 3,280 4,887 8,167 $310,567 $119,516 $430,083Feb 3,160 4,799 7,959 $660,276 $28,189 $688,465Mar 3,207 3,767 6,974 $547,380 $58,496 $605,876Apr 3,110 4,072 7,182 $67,348 $136,686 $204,034May 3,153 4,194 7,347 $163,724 $143,102 $306,826Jun 2,212 2,241 4,453 $244,532 $259,924 $504,456Jul 2,568 2,249 4,817 $256,128 $262,468 $518,596Aug 2,750 2,656 5,406 $518,158 $1,269,318 $1,787,476Sep 2,580 2,833 5,413 $19,307 $206,387 $225,694Oct 2,494 2,412 4,906 $255,029 $316,838 $571,867Nov 2,423 2,671 5,094 $48,989 $69,615 $118,604Dec 1,257 1,190 2,447 $137,201 $93,091 $230,292Total -- -- -- $3,228,639 $2,963,630 $6,192,269
Contract Volume
Open Interest in Contracts Dollar Volume
Page 87
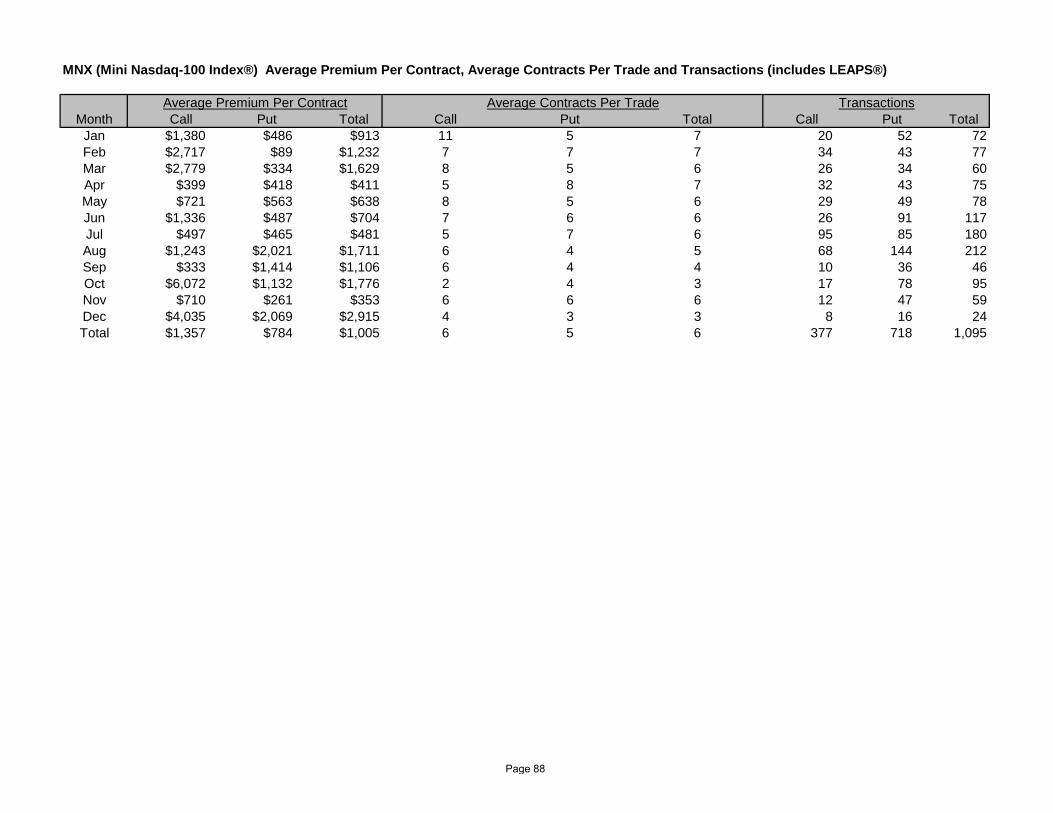
MNX (Mini Nasdaq-100 Index®) Average Premium Per Contract, Average Contracts Per Trade and Transactions (includes LEAPS®)
Month Call Put Total Call Put Total Call Put TotalJan $1,380 $486 $913 11 5 7 20 52 72Feb $2,717 $89 $1,232 7 7 7 34 43 77Mar $2,779 $334 $1,629 8 5 6 26 34 60Apr $399 $418 $411 5 8 7 32 43 75May $721 $563 $638 8 5 6 29 49 78Jun $1,336 $487 $704 7 6 6 26 91 117Jul $497 $465 $481 5 7 6 95 85 180Aug $1,243 $2,021 $1,711 6 4 5 68 144 212Sep $333 $1,414 $1,106 6 4 4 10 36 46Oct $6,072 $1,132 $1,776 2 4 3 17 78 95Nov $710 $261 $353 6 6 6 12 47 59Dec $4,035 $2,069 $2,915 4 3 3 8 16 24Total $1,357 $784 $1,005 6 5 6 377 718 1,095
TransactionsAverage Premium Per Contract Average Contracts Per Trade
Page 88

RUT (Russell 2000 Index®) Contract Volume (includes LEAPS® and FLEX®)
Trading Average DailyMonth Days Call Put Total Volume
Jan 20 293,618 592,973 886,591 44,330Feb 19 290,813 529,246 820,059 43,161Mar 22 378,148 649,701 1,027,849 46,720Apr 21 444,916 851,230 1,296,146 61,721May 20 694,012 828,296 1,522,308 76,115Jun 22 781,153 943,383 1,724,536 78,388Jul 22 604,249 1,213,923 1,818,172 82,644Aug 21 700,651 1,479,799 2,180,450 103,831Sep 21 602,496 1,062,656 1,665,152 79,293Oct 22 487,576 876,198 1,363,774 61,990Nov 20 428,912 797,284 1,226,196 61,310Dec 22 470,730 952,677 1,423,407 64,700Total 252 6,177,274 10,777,366 16,954,640 67,280
RUT (Russell 2000 Index®) Open Interest and Dollar Volume (includes LEAPS® and FLEX®)
Month Call Put Total Call Put TotalJan 189,379 513,851 703,230 $271,770,603 $589,178,670 $860,949,273Feb 201,321 545,067 746,388 $276,419,894 $350,841,701 $627,261,595Mar 188,167 409,753 597,920 $348,644,157 $506,774,390 $855,418,547Apr 208,987 486,206 695,193 $423,283,141 $660,857,983 $1,084,141,124May 250,169 489,464 739,633 $366,509,598 $723,764,953 $1,090,274,551Jun 293,432 512,471 805,903 $744,815,829 $741,880,397 $1,486,696,226Jul 241,294 531,287 772,581 $471,233,675 $1,136,369,882 $1,607,603,557Aug 247,727 479,458 727,185 $485,652,687 $2,464,597,663 $2,950,250,350Sep 236,366 434,407 670,773 $716,461,765 $1,726,981,052 $2,443,442,817Oct 204,625 430,364 634,989 $525,251,198 $1,060,706,294 $1,585,957,492Nov 193,155 409,432 602,587 $452,005,000 $775,029,011 $1,227,034,011Dec 161,629 354,754 516,383 $636,244,947 $1,212,499,339 $1,848,744,286Total -- -- -- $5,718,292,494 $11,949,481,335 $17,667,773,829
Contract Volume
Open Interest in Contracts Dollar Volume
Page 89
RUT (Russell 2000 Index®) Average Premium Per Contract, Average Contracts Per Trade and Transactions (includes LEAPS® and FLEX®)
Month Call Put Total Call Put Total Call Put TotalJan $926 $994 $971 6 7 6 52,030 89,068 141,098Feb $951 $663 $765 5 6 6 54,667 81,493 136,160Mar $922 $780 $832 5 6 6 71,131 105,352 176,483Apr $951 $776 $836 6 8 7 70,298 111,069 181,367May $528 $874 $716 11 8 9 63,393 103,423 166,816Jun $953 $786 $862 8 8 8 93,786 120,446 214,232Jul $780 $936 $884 6 8 7 95,078 149,897 244,975Aug $693 $1,665 $1,353 7 9 8 102,871 163,195 266,066Sep $1,189 $1,625 $1,467 7 9 8 88,158 122,514 210,672Oct $1,077 $1,211 $1,163 6 8 7 82,755 115,250 198,005Nov $1,054 $972 $1,001 5 6 6 81,913 125,842 207,755Dec $1,352 $1,273 $1,299 5 7 6 86,913 141,106 228,019Total $926 $1,109 $1,042 7 8 7 942,993 1,428,655 2,371,648
Average Premium Per Contract Average Contracts Per Trade Transactions
Page 90
VIX (CBOE Volatility Index®) Contract Volume
Trading Average DailyMonth Days Call Put Total Volume
Jan 20 6,272,597 3,831,109 10,103,706 505,185Feb 19 4,877,474 2,997,935 7,875,409 414,495Mar 22 5,222,968 2,697,369 7,920,337 360,015Apr 21 6,047,439 3,101,397 9,148,836 435,659May 20 7,723,112 2,553,718 10,276,830 513,842Jun 22 10,192,917 2,973,793 13,166,710 598,487Jul 22 10,459,145 3,709,706 14,168,851 644,039Aug 21 14,901,529 5,894,549 20,796,078 990,289Sep 21 10,049,335 5,982,155 16,031,490 763,404Oct 22 9,620,563 4,749,225 14,369,788 653,172Nov 20 7,148,816 2,580,607 9,729,423 486,471Dec 22 7,939,294 2,913,538 10,852,832 493,311Total 252 100,455,189 43,985,101 144,440,290 573,176
VIX (CBOE Volatility Index®) Open Interest and Dollar Volume
Month Call Put Total Call Put TotalJan 2,546,655 1,781,658 4,328,313 $867,110,621 $372,430,469 $1,239,541,090Feb 3,082,022 1,506,619 4,588,641 $525,636,474 $285,996,347 $811,632,821Mar 3,539,787 1,551,990 5,091,777 $474,813,899 $302,615,516 $777,429,415Apr 4,489,598 1,778,441 6,268,039 $480,656,134 $262,557,311 $743,213,445May 4,817,237 1,346,198 6,163,435 $586,188,970 $222,680,083 $808,869,053Jun 5,405,577 1,597,979 7,003,556 $836,839,029 $274,311,102 $1,111,150,131Jul 5,205,388 1,717,266 6,922,654 $995,381,238 $403,321,820 $1,398,703,058Aug 5,463,758 2,805,644 8,269,402 $2,827,127,591 $656,495,819 $3,483,623,410Sep 4,800,047 2,971,461 7,771,508 $2,325,045,500 $808,727,744 $3,133,773,244Oct 5,191,160 2,072,343 7,263,503 $890,795,310 $626,362,908 $1,517,158,218Nov 4,397,681 1,580,034 5,977,715 $636,893,371 $261,549,752 $898,443,123Dec 3,201,739 1,014,579 4,216,318 $952,882,086 $322,044,385 $1,274,926,471Total -- -- -- $12,399,370,223 $4,799,093,256 $17,198,463,479
Contract Volume
Open Interest in Contracts Dollar Volume
Page 91
VIX (CBOE Volatility Index®) Average Premium Per Contract, Average Contracts Per Trade and Transactions
Month Call Put Total Call Put Total Call Put TotalJan $138 $97 $123 74 99 82 84,408 38,556 122,964Feb $108 $95 $103 72 96 79 67,990 31,199 99,189Mar $91 $112 $98 65 91 72 79,857 29,612 109,469Apr $79 $85 $81 84 111 92 71,819 27,897 99,716May $76 $87 $79 92 92 92 84,133 27,809 111,942Jun $82 $92 $84 98 85 95 104,287 34,939 139,226Jul $95 $109 $99 89 91 89 117,643 40,990 158,633Aug $190 $111 $168 98 93 97 152,148 63,074 215,222Sep $231 $135 $195 87 114 95 115,919 52,434 168,353Oct $93 $132 $106 111 121 114 86,874 39,169 126,043Nov $89 $101 $92 99 96 98 72,422 26,801 99,223Dec $120 $111 $117 85 74 81 93,697 39,587 133,284Total $123 $109 $119 89 97 91 1,131,197 452,067 1,583,264
Average Premium Per Contract Average Contracts Per Trade Transactions
Page 92

Other Cash Index Options Products Contract Volume
Trading Average DailyMonth Days Call Put Total Volume
Jan 20 3,920 2,263 6,183 309Feb 19 3,386 855 4,241 223Mar 22 4,004 837 4,841 220Apr 21 2,054 426 2,480 118May 20 5,549 646 6,195 310Jun 22 122 113 235 11Jul 22 66 18 84 4Aug 21 182 0 182 9Sep 21 1 4 5 0Oct 22 236 238 474 22Nov 20 6 13 19 1Dec 22 2 0 2 0Total 252 19,528 5,413 24,941 99
Other Cash Index Options Products Open Interest and Dollar Volume
Month Call Put Total Call Put TotalJan 1,239 1,056 2,295 $986,822 $564,700 $1,551,522Feb 1,076 362 1,438 $575,311 $183,820 $759,131Mar 2,731 402 3,133 $480,896 $145,275 $626,171Apr 780 256 1,036 $120,824 $54,470 $175,294May 4 1 5 $112,655 $154,695 $267,350Jun 61 5 66 $21,100 $36,195 $57,295Jul 93 13 106 $17,900 $24,220 $42,120Aug 71 5 76 $48,215 $0 $48,215Sep 46 4 50 $60 $15,000 $15,060Oct 281 242 523 $338,778 $258,378 $597,156Nov 1 10 11 $1,535 $11,100 $12,635Dec 2 4 6 $7,650 $0 $7,650Total -- -- -- $2,711,746 $1,447,853 $4,159,599
Open Interest in Contracts Dollar Volume
Includes GVZ, MXEA, MXEF, OVX, RUI, RVX, VXEEM, VXEWZ, and VXST
Contract Volume
Page 93

Other Cash Index Options Products Average Premium Per Contract, Average Contracts Per Trade and Transactions
Month Call Put Total Call Put Total Call Put TotalJan $252 $250 $251 11 17 13 348 135 483Feb $170 $215 $179 11 9 10 319 92 411Mar $120 $174 $129 12 9 11 333 89 422Apr $59 $128 $71 11 7 10 193 62 255May $20 $239 $43 44 8 31 125 78 203Jun $173 $320 $244 5 11 7 23 10 33Jul $271 $1,346 $501 9 2 6 7 8 15Aug $265 $0 $265 18 0 18 10 0 10Sep $60 $3,750 $3,012 1 2 2 1 2 3Oct $1,436 $1,086 $1,260 118 79 95 2 3 5Nov $256 $854 $665 2 3 2 4 4 8Dec $3,825 $0 $3,825 1 0 1 2 0 2Total $139 $267 $167 14 11 13 1,367 483 1,850
TransactionsAverage Premium Per Contract Average Contracts Per Trade
Page 94
OTHER CASH INDEX OPTIONS CONTRACT VOLUME DETAIL
Month GVZ OVX RVX VXEEM VXEWZ VXSTJan 125 4,509 150 10 20 1,369Feb 22 3,786 26 10 397Mar 10 3,389 75 1,367Apr 1,902 5 572May 1,235 40 4,920Jun 71 159Jul 76Aug 182Sep 1OctNov 9DecTotal 157 14,821 635 10 30 8,784
RUSSELL 1000 INDEXMonth RUI Month MXEA MXEF
Jan JanFeb FebMar MarApr Apr 1May MayJun Jun 5Jul Jul 4 4Aug AugSep Sep 4Oct Oct 2 472Nov Nov 10Dec 2 DecTotal 2 Total 20 482
MSCI
CBOE
Page 95

CBOE BINARY OPTIONS - 2015
BSZ CBOE Binary Options (SPX) Contract Volume
Trading Average DailyMonth Days Call Put Total Volume
Jan 20 0 6 6 0Feb 19Mar 22Apr 21May 20Jun 22Jul 22Aug 21Sep 21Oct 22Nov 20Dec 22Total 252 0 6 6 0
BSZ CBOE Binary Options (SPX) Open Interest and Dollar Volume
Month Call Put Total Call Put TotalJan 0 0 0 $0 $90 $90FebMarAprMayJunJulAugSepOctNovDecTotal -- -- -- $0 $90 $90
BSZ CBOE Binary Options (SPX) Average Premium Per Contract, Average Contracts Per Trade and Transactions
Month Call Put Total Call Put Total Call Put TotalJan $0 $15 $15 0 6 6 1 1FebMarAprMayJunJulAugSepOctNovDecTotal $0 $15 $15 0 6 6 0 1 1
Transactions
Contract Volume
Open Interest in Contracts Dollar Volume
Average Premium Per Contract Average Contracts Per Trade
Page 96

BVZ CBOE Binary Options (VIX) Contract Volume
Trading Average DailyMonth Days Call Put Total Volume
Jan 20 151 121 272 14Feb 19 25 4,900 4,925 259Mar 22 37 0 37 2Apr 21 45 115 160 8May 20 418 13 431 22Jun 22 10 110 120 5Jul 22 25 0 25 1Aug 21 30 16 46 2Sep 21 0 18 18 1Oct 22 11 1 12 1Nov 20 1 0 1 0Dec 22 0 100 100 5Total 252 753 5,394 6,147 24
BVZ CBOE Binary Options (VIX) Open Interest and Dollar Volume
Month Call Put Total Call Put TotalJan 54 100 154 $6,758 $3,368 $10,126Feb 9 0 9 $878 $118,700 $119,578Mar 0 0 0 $810 $0 $810Apr 5 115 120 $2,030 $9,235 $11,265May 60 110 170 $12,577 $775 $13,352Jun 0 0 0 $900 $9,800 $10,700Jul 0 0 0 $875 $0 $875Aug 0 0 0 $865 $780 $1,645Sep 0 0 0 $0 $720 $720Oct 1 1 2 $641 $28 $669Nov 0 0 0 $65 $0 $65Dec 0 100 100 $0 $3,300 $3,300Total -- -- -- $26,399 $146,706 $173,105
BVZ CBOE Binary Options (VIX) Average Premium Per Contract, Average Contracts Per Trade and Transactions
Month Call Put Total Call Put Total Call Put TotalJan $45 $28 $37 6 24 9 27 5 32Feb $35 $24 $24 3 327 197 10 15 25Mar $22 $0 $22 7 0 7 5 0 5Apr $45 $80 $70 15 38 27 3 3 6May $30 $0 $31 52 0 39 8 3 11Jun $90 $89 $89 10 55 40 1 2 3Jul $35 $0 $35 25 0 25 1 0 1Aug $29 $49 $36 8 3 5 4 6 10Sep $0 $40 $40 0 5 5 0 4 4Oct $58 $28 $56 6 1 4 2 1 3Nov $65 $0 $65 1 0 1 1 0 1Dec $0 $33 $33 0 100 100 0 1 1Total $35 $27 $28 12 135 60 62 40 102
Average Premium Per Contract Average Contracts Per Trade Transactions
Contract Volume
Open Interest in Contracts Dollar Volume
Page 97
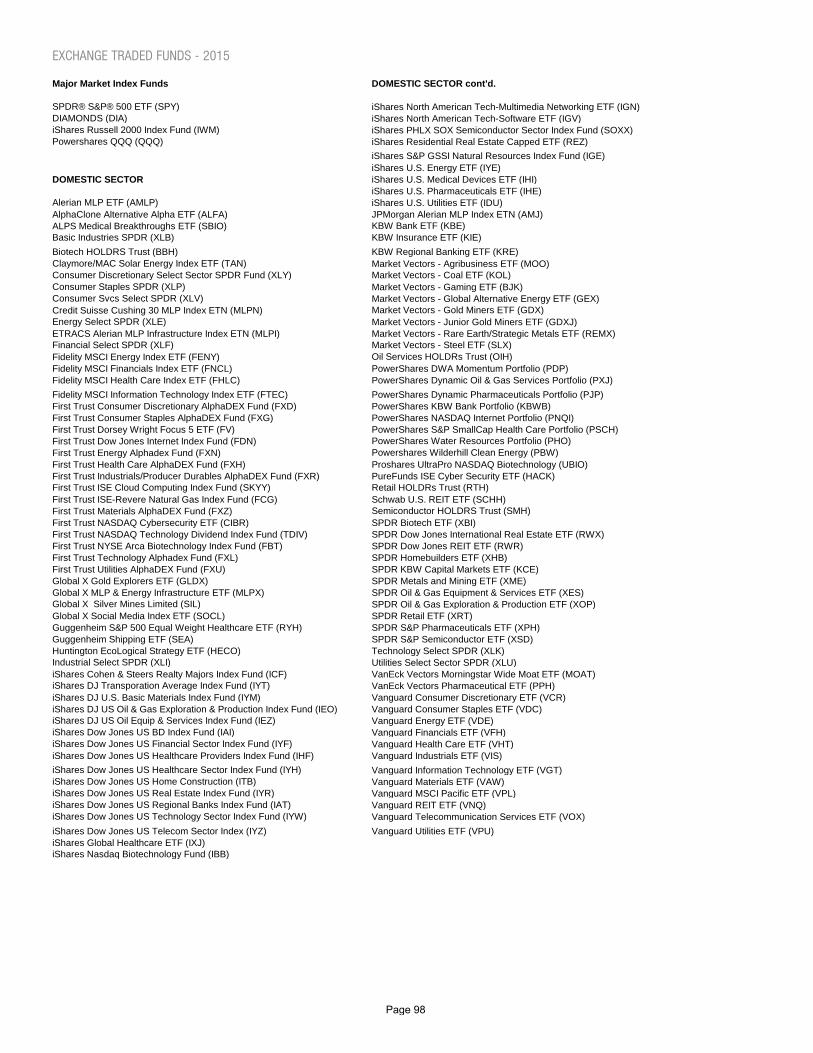
EXCHANGE TRADED FUNDS - 2015
Major Market Index Funds DOMESTIC SECTOR cont'd.
SPDR® S&P® 500 ETF (SPY) iShares North American Tech-Multimedia Networking ETF (IGN)DIAMONDS (DIA) iShares North American Tech-Software ETF (IGV)iShares Russell 2000 Index Fund (IWM) iShares PHLX SOX Semiconductor Sector Index Fund (SOXX)Powershares QQQ (QQQ) iShares Residential Real Estate Capped ETF (REZ)
iShares S&P GSSI Natural Resources Index Fund (IGE)iShares U.S. Energy ETF (IYE)
DOMESTIC SECTOR iShares U.S. Medical Devices ETF (IHI)iShares U.S. Pharmaceuticals ETF (IHE)
Alerian MLP ETF (AMLP) iShares U.S. Utilities ETF (IDU)AlphaClone Alternative Alpha ETF (ALFA) JPMorgan Alerian MLP Index ETN (AMJ)ALPS Medical Breakthroughs ETF (SBIO) KBW Bank ETF (KBE)Basic Industries SPDR (XLB) KBW Insurance ETF (KIE)
Biotech HOLDRS Trust (BBH) KBW Regional Banking ETF (KRE)Claymore/MAC Solar Energy Index ETF (TAN) Market Vectors - Agribusiness ETF (MOO)Consumer Discretionary Select Sector SPDR Fund (XLY) Market Vectors - Coal ETF (KOL)Consumer Staples SPDR (XLP) Market Vectors - Gaming ETF (BJK)Consumer Svcs Select SPDR (XLV) Market Vectors - Global Alternative Energy ETF (GEX)Credit Suisse Cushing 30 MLP Index ETN (MLPN) Market Vectors - Gold Miners ETF (GDX)Energy Select SPDR (XLE) Market Vectors - Junior Gold Miners ETF (GDXJ)ETRACS Alerian MLP Infrastructure Index ETN (MLPI) Market Vectors - Rare Earth/Strategic Metals ETF (REMX)Financial Select SPDR (XLF) Market Vectors - Steel ETF (SLX)Fidelity MSCI Energy Index ETF (FENY) Oil Services HOLDRs Trust (OIH)Fidelity MSCI Financials Index ETF (FNCL) PowerShares DWA Momentum Portfolio (PDP)Fidelity MSCI Health Care Index ETF (FHLC) PowerShares Dynamic Oil & Gas Services Portfolio (PXJ)
Fidelity MSCI Information Technology Index ETF (FTEC) PowerShares Dynamic Pharmaceuticals Portfolio (PJP)First Trust Consumer Discretionary AlphaDEX Fund (FXD) PowerShares KBW Bank Portfolio (KBWB)First Trust Consumer Staples AlphaDEX Fund (FXG) PowerShares NASDAQ Internet Portfolio (PNQI)First Trust Dorsey Wright Focus 5 ETF (FV) PowerShares S&P SmallCap Health Care Portfolio (PSCH)First Trust Dow Jones Internet Index Fund (FDN) PowerShares Water Resources Portfolio (PHO)First Trust Energy Alphadex Fund (FXN) Powershares Wilderhill Clean Energy (PBW)First Trust Health Care AlphaDEX Fund (FXH) Proshares UltraPro NASDAQ Biotechnology (UBIO)First Trust Industrials/Producer Durables AlphaDEX Fund (FXR) PureFunds ISE Cyber Security ETF (HACK)First Trust ISE Cloud Computing Index Fund (SKYY) Retail HOLDRs Trust (RTH)First Trust ISE-Revere Natural Gas Index Fund (FCG) Schwab U.S. REIT ETF (SCHH)First Trust Materials AlphaDEX Fund (FXZ) Semiconductor HOLDRS Trust (SMH)First Trust NASDAQ Cybersecurity ETF (CIBR) SPDR Biotech ETF (XBI)First Trust NASDAQ Technology Dividend Index Fund (TDIV) SPDR Dow Jones International Real Estate ETF (RWX)First Trust NYSE Arca Biotechnology Index Fund (FBT) SPDR Dow Jones REIT ETF (RWR)First Trust Technology Alphadex Fund (FXL) SPDR Homebuilders ETF (XHB)First Trust Utilities AlphaDEX Fund (FXU) SPDR KBW Capital Markets ETF (KCE)Global X Gold Explorers ETF (GLDX) SPDR Metals and Mining ETF (XME)Global X MLP & Energy Infrastructure ETF (MLPX) SPDR Oil & Gas Equipment & Services ETF (XES)Global X Silver Mines Limited (SIL) SPDR Oil & Gas Exploration & Production ETF (XOP)Global X Social Media Index ETF (SOCL) SPDR Retail ETF (XRT)Guggenheim S&P 500 Equal Weight Healthcare ETF (RYH) SPDR S&P Pharmaceuticals ETF (XPH)Guggenheim Shipping ETF (SEA) SPDR S&P Semiconductor ETF (XSD)Huntington EcoLogical Strategy ETF (HECO) Technology Select SPDR (XLK)Industrial Select SPDR (XLI) Utilities Select Sector SPDR (XLU)iShares Cohen & Steers Realty Majors Index Fund (ICF) VanEck Vectors Morningstar Wide Moat ETF (MOAT)iShares DJ Transporation Average Index Fund (IYT) VanEck Vectors Pharmaceutical ETF (PPH)iShares DJ U.S. Basic Materials Index Fund (IYM) Vanguard Consumer Discretionary ETF (VCR)iShares DJ US Oil & Gas Exploration & Production Index Fund (IEO) Vanguard Consumer Staples ETF (VDC)iShares DJ US Oil Equip & Services Index Fund (IEZ) Vanguard Energy ETF (VDE)iShares Dow Jones US BD Index Fund (IAI) Vanguard Financials ETF (VFH)iShares Dow Jones US Financial Sector Index Fund (IYF) Vanguard Health Care ETF (VHT)iShares Dow Jones US Healthcare Providers Index Fund (IHF) Vanguard Industrials ETF (VIS)
iShares Dow Jones US Healthcare Sector Index Fund (IYH) Vanguard Information Technology ETF (VGT)iShares Dow Jones US Home Construction (ITB) Vanguard Materials ETF (VAW)iShares Dow Jones US Real Estate Index Fund (IYR) Vanguard MSCI Pacific ETF (VPL)iShares Dow Jones US Regional Banks Index Fund (IAT) Vanguard REIT ETF (VNQ)iShares Dow Jones US Technology Sector Index Fund (IYW) Vanguard Telecommunication Services ETF (VOX)
iShares Dow Jones US Telecom Sector Index (IYZ) Vanguard Utilities ETF (VPU)iShares Global Healthcare ETF (IXJ)iShares Nasdaq Biotechnology Fund (IBB)
Page 98

EXCHANGE TRADED FUNDS - 2015 cont'd.
DOMESTIC BROAD-BASED DOMESTIC BROAD-BASED cont'd.
Barron's 400 ETF (BFOR) Schwab U.S. Mid-Cap ETF (SCHM)Direxion NASDAQ-100 Equal Weighted Index Shares (QQQE) Schwab U.S. Small-Cap ETF (SCHA)First Trust Large Cap Core AlphaDEX Fund (FEX) SPDR Dividend ETF (SDY)First Trust Large-Cap Growth AlphaDEX Fund (FTC) Vanguard Dividend Appreciation ETF (VIG)First Trust NASDAQ-100 Equal Weighted Index Fund (QQEW) Vanguard Extended Market ETF (VXF)First Trust NASDAQ-100 Technology Index Fund (QTEC) Vanguard Growth ETF (VUG)Global X SuperDividend ETF (SDIV) Vanguard High Dividend Yield ETF (VYM)Goldman Sachs ActiveBeta U.S. Large Cap Equity ETF (GSLC) Vanguard Large-Cap ETF (VV)Guggenheim S&P 500 Equal Weight ETF (RSP) Vanguard Mega-Cap ETF (MGC)Guggenheim S&P 500 Pure Value ETF (RPV) Vanguard Mega-Cap 300 Growth ETF (MGK)Guggenheim Spin-Off ETF (CSD) Vanguard Mega-Cap 300 Value ETF (MGV)iShares S&P 500 Value ETF (IVE) Vanguard Mid-Cap ETF (VO)iPATH S&P 500 VIX Mid-Term Futures ETN (VXZ) Vanguard Mid-Cap Growth ETF (VOT)iPATH S&P 500 VIX Short-Term Futures ETN (VXX) Vanguard Mid-Cap Value ETF (VOE)iShares Core S&P Total US Stock Market ETF (ITOT) Vanguard Russell 2000 (VTWO)iShares DJ Select Dividend Index Fund (DVY) Vanguard S&P 500 ETF (VOO)iShares High Dividend Equity Fund (HDV) Vanguard Small-Cap ETF (VB)iShares MSCI USA Minimum Volatility ETF (USMV) Vanguard Small-Cap Growth ETF (VBK)iShares Russell 1000 ETF (IWB) Vanguard Small-Cap Value ETF (VBR)iShares Russell 1000 Growth ETF (IWF) Vanguard Total Stock Market ETF (VTI)iShares Russell 1000 Value ETF (IWD) Vanguard Value ETF (VTV)iShares Russell 3000 Index Fund (IWV) VelocityShares VIX Short-Term ETN (VIIX)iShares Russell Microcap Index Fund (IWC) WisdomTree Dividend Ex-Financials Fund (DTN)iShares Russell Mid-Cap Growth Index Fund (IWP) WisdomTree LargeCap Dividend Fund (DLN)iShares Russell Mid-Cap Index Fund (IWR) WisdomTree US Dividend Growth Fund (DGRW)iShares Russell Mid-Cap Value ETF (IWS)iShares S&P 500 Growth Index Fund (IVW)iShares S&P 500 Index Fund (IVV) FOREIGN iShares S&P Mid-Cap 400 Growth ETF (IJK)iShares S&P Mid-Cap 400 Index Fund (IJH) Claymore/BNY BRIC ETF (EEB)iShares S&P Mid-Cap 400 Value ETF (IJJ) Claymore/Alpha Shares China All-Cap ETF (YAO)iShares S&P Small-Cap 600/Barra Value Index Fund (IJS) Claymore/AlphaShares China Small-Cap Index ETF (HAO)iShares S&P Small-Cap 600 Growth ETF (IJT) CSOP FTSE China A50 ETF/United States (AFTY)iShares S&P Small-Cap 600 Index Fund (IJR) db X-trackers Harvest CSI 300 China A-Shares Fund (ASHR)iShares Trust - Russell 2000 Growth Index Fund (IWO) db X-trackers MSCI EAFE Hedged Equity Fund (DBEF)iShares Trust - Russell 2000 Value Index Fund (IWN) db X-trackers MSCI Japan Hedged Equity Fund (DBJP)iShares Trust - S&P 100 (OEF) Deutsche X-trackers Harvest CSI 500 China A-Shares ETF (ASHS)O'Shares FTSE US Quality Dividend ETF (OUSA) Deutsche X-trackers MSCI Europe Hedged Equity ETF (DBEU)Oppenheimer Mid Cap Revenue ETF (RWK) DJ EURO STOXX 50 Fund (FEZ)PowerShares Buyback Achievers Portfolio (PKW) EGShares Emerging Markets Consumer ETF (ECON)PowerShares DWA Developed Markets Momentum Portfolio (PIZ) First Trust China AlphaDEX Fund (FCA)PowerShares DWA Small-Cap Momentum Portfolio (DWAS) First Trust Emerging Markets AlphaDEX Fund (FEM)PowerShares FTSE RAFI US 1000 Portfolio (PRF) First Trust Europe AlphaDEX Fund (FEP)PowerShares S&P 500 High Beta Port ETF (SPHB) Global X China Consumer ETF (CHIQ)PowerShares S&P 500 Low Volatility Portfolio (SPLV) Global X China Financials ETF (CHIX)ProShares S&P 500 Aristocrats ETF (NOBL) Global X FTSE Argentina 20 ETF (ARGT)ProShares VIX Mid-Term Futures ETF (VIXM) Global X FTSE Colombia 20 ETF (GXG)ProShares VIX Short-Term Futures ETF (VIXY) Global X FTSE Greece 20 ETF (GREK)RevenueShares Large Cap ETF (RWL) Global X Guru Index ETF (GURU)RevenueShares Small Cap Fund (RWJ) Global X NASDAQ China Technology ETF (QQQC)S&P 400 MidCap SPDRs (MDY) Guggenheim China Real Estate ETF (TAO)Schwab U.S. Broad Market ETF (SCHB) iPath MSCI India Index ETN (INP)Schwab U.S. Dividend Equity ETF (SCHD) iShares Core MSCI EAFE ETF (IEFA)Schwab U.S. Large-Cap ETF (SCHX) iShares Core MSCI Emerging Markets ETF (IEMG)Schwab U.S. Large-Cap Growth ETF (SCHG) iShares Core MSCI Total International Stock ETF (IXUS)
Schwab U.S. Large-Cap Value ETF (SCHV) iShares Currency Hedged MSCI EAFE ETF (HEFA)
Page 99
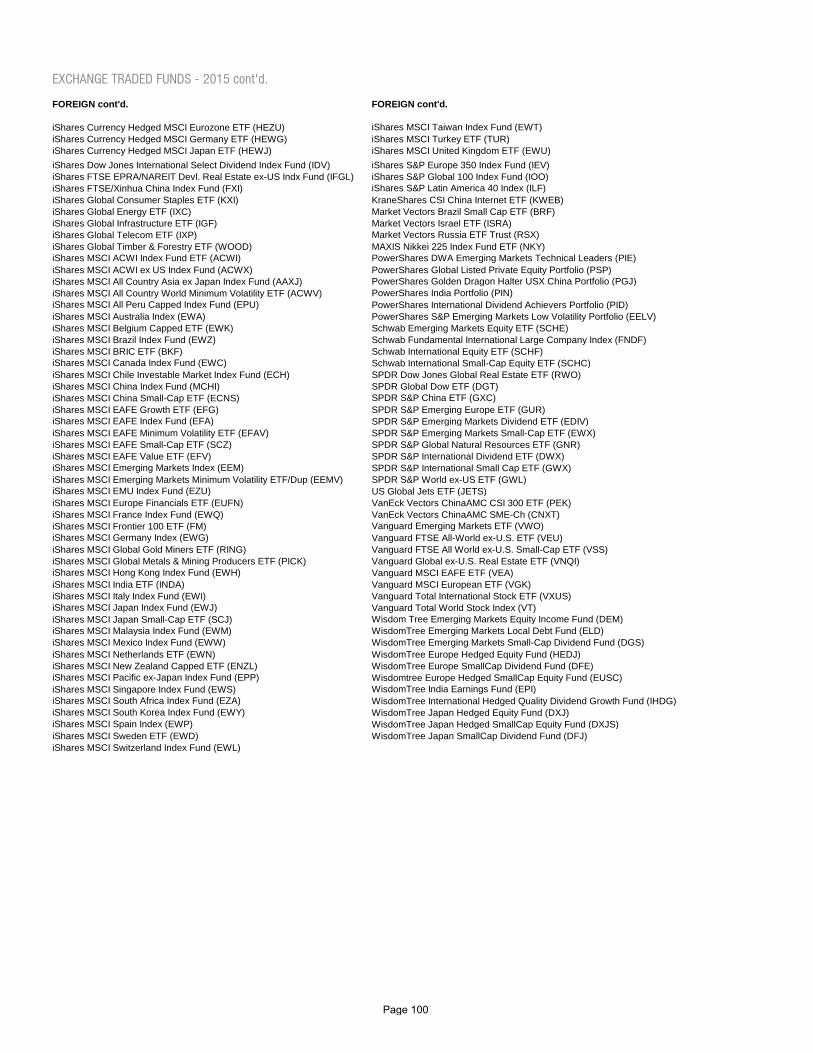
EXCHANGE TRADED FUNDS - 2015 cont'd.
FOREIGN cont'd. FOREIGN cont'd.
iShares Currency Hedged MSCI Eurozone ETF (HEZU) iShares MSCI Taiwan Index Fund (EWT)iShares Currency Hedged MSCI Germany ETF (HEWG) iShares MSCI Turkey ETF (TUR)iShares Currency Hedged MSCI Japan ETF (HEWJ) iShares MSCI United Kingdom ETF (EWU)
iShares Dow Jones International Select Dividend Index Fund (IDV) iShares S&P Europe 350 Index Fund (IEV)iShares FTSE EPRA/NAREIT Devl. Real Estate ex-US Indx Fund (IFGL) iShares S&P Global 100 Index Fund (IOO)iShares FTSE/Xinhua China Index Fund (FXI) iShares S&P Latin America 40 Index (ILF)iShares Global Consumer Staples ETF (KXI) KraneShares CSI China Internet ETF (KWEB)iShares Global Energy ETF (IXC) Market Vectors Brazil Small Cap ETF (BRF)iShares Global Infrastructure ETF (IGF) Market Vectors Israel ETF (ISRA)iShares Global Telecom ETF (IXP) Market Vectors Russia ETF Trust (RSX)iShares Global Timber & Forestry ETF (WOOD) MAXIS Nikkei 225 Index Fund ETF (NKY)iShares MSCI ACWI Index Fund ETF (ACWI) PowerShares DWA Emerging Markets Technical Leaders (PIE)iShares MSCI ACWI ex US Index Fund (ACWX) PowerShares Global Listed Private Equity Portfolio (PSP)iShares MSCI All Country Asia ex Japan Index Fund (AAXJ) PowerShares Golden Dragon Halter USX China Portfolio (PGJ)iShares MSCI All Country World Minimum Volatility ETF (ACWV) PowerShares India Portfolio (PIN)iShares MSCI All Peru Capped Index Fund (EPU) PowerShares International Dividend Achievers Portfolio (PID)iShares MSCI Australia Index (EWA) PowerShares S&P Emerging Markets Low Volatility Portfolio (EELV)iShares MSCI Belgium Capped ETF (EWK) Schwab Emerging Markets Equity ETF (SCHE)iShares MSCI Brazil Index Fund (EWZ) Schwab Fundamental International Large Company Index (FNDF)iShares MSCI BRIC ETF (BKF) Schwab International Equity ETF (SCHF)iShares MSCI Canada Index Fund (EWC) Schwab International Small-Cap Equity ETF (SCHC)iShares MSCI Chile Investable Market Index Fund (ECH) SPDR Dow Jones Global Real Estate ETF (RWO)iShares MSCI China Index Fund (MCHI) SPDR Global Dow ETF (DGT)iShares MSCI China Small-Cap ETF (ECNS) SPDR S&P China ETF (GXC)iShares MSCI EAFE Growth ETF (EFG) SPDR S&P Emerging Europe ETF (GUR)iShares MSCI EAFE Index Fund (EFA) SPDR S&P Emerging Markets Dividend ETF (EDIV)iShares MSCI EAFE Minimum Volatility ETF (EFAV) SPDR S&P Emerging Markets Small-Cap ETF (EWX)iShares MSCI EAFE Small-Cap ETF (SCZ) SPDR S&P Global Natural Resources ETF (GNR)iShares MSCI EAFE Value ETF (EFV) SPDR S&P International Dividend ETF (DWX)iShares MSCI Emerging Markets Index (EEM) SPDR S&P International Small Cap ETF (GWX)iShares MSCI Emerging Markets Minimum Volatility ETF/Dup (EEMV) SPDR S&P World ex-US ETF (GWL)iShares MSCI EMU Index Fund (EZU) US Global Jets ETF (JETS)iShares MSCI Europe Financials ETF (EUFN) VanEck Vectors ChinaAMC CSI 300 ETF (PEK)iShares MSCI France Index Fund (EWQ) VanEck Vectors ChinaAMC SME-Ch (CNXT)iShares MSCI Frontier 100 ETF (FM) Vanguard Emerging Markets ETF (VWO)iShares MSCI Germany Index (EWG) Vanguard FTSE All-World ex-U.S. ETF (VEU)iShares MSCI Global Gold Miners ETF (RING) Vanguard FTSE All World ex-U.S. Small-Cap ETF (VSS)iShares MSCI Global Metals & Mining Producers ETF (PICK) Vanguard Global ex-U.S. Real Estate ETF (VNQI)iShares MSCI Hong Kong Index Fund (EWH) Vanguard MSCI EAFE ETF (VEA)iShares MSCI India ETF (INDA) Vanguard MSCI European ETF (VGK)iShares MSCI Italy Index Fund (EWI) Vanguard Total International Stock ETF (VXUS)iShares MSCI Japan Index Fund (EWJ) Vanguard Total World Stock Index (VT)iShares MSCI Japan Small-Cap ETF (SCJ) Wisdom Tree Emerging Markets Equity Income Fund (DEM)iShares MSCI Malaysia Index Fund (EWM) WisdomTree Emerging Markets Local Debt Fund (ELD)iShares MSCI Mexico Index Fund (EWW) WisdomTree Emerging Markets Small-Cap Dividend Fund (DGS)iShares MSCI Netherlands ETF (EWN) WisdomTree Europe Hedged Equity Fund (HEDJ)iShares MSCI New Zealand Capped ETF (ENZL) WisdomTree Europe SmallCap Dividend Fund (DFE)iShares MSCI Pacific ex-Japan Index Fund (EPP) Wisdomtree Europe Hedged SmallCap Equity Fund (EUSC)iShares MSCI Singapore Index Fund (EWS) WisdomTree India Earnings Fund (EPI)iShares MSCI South Africa Index Fund (EZA) WisdomTree International Hedged Quality Dividend Growth Fund (IHDG)iShares MSCI South Korea Index Fund (EWY) WisdomTree Japan Hedged Equity Fund (DXJ)iShares MSCI Spain Index (EWP) WisdomTree Japan Hedged SmallCap Equity Fund (DXJS)iShares MSCI Sweden ETF (EWD) WisdomTree Japan SmallCap Dividend Fund (DFJ)iShares MSCI Switzerland Index Fund (EWL)
Page 100

EXCHANGE TRADED FUNDS - 2015 cont'd.
LEVERAGED & INVERSE LEVERAGED & INVERSE cont'd.
Direxion Daily 10-Year Treasury Bear 3X (TYO) Short 20+ Year Treasury ProShares (TBF)Direxion Daily 10-Year Treasury Bull 3X (TYD) Short Dow30 ProShares (DOG)Direxion Daily 30-Year Treasury Bear 3X (TMV) Short QQQ ProShares (PSQ)Direxion Daily 30-Year Treasury Bull 3X (TMF) Short Russell2000 ProShares (RWM)Direxion Daily Brazil Bull 3X Shares (BRZU) Short S&P500 ProShares (SH)Direxion Daily CSI 300 China A Share Bear 1X Shares (CHAD) The Active Bear (HDGE)Direxion Daily CSI 300 China A Share Bull 2X Shares (CHAU) Ultra 20+ Year Treasury ProShares (UBT)Direxion Daily Gold Miners Bear 2x Shares (DUST) Ultra Basic Materials ProShares (UYM)Direxion Daily Gold Miners Bull 2x Shares (NUGT) Ultra Dow30 ProShares (DDM)Direxion Daily Healthcare Bull 3x Shares (CURE) Ultra DJ-UBS Crude Oil ProShares (UCO)Direxion Daily India Bull 3X Shares (INDL) Ultra Financials ProShares (UYG)Direxion Daily Japan 3x Bull Shares (JPNL) Ultra FTSE China 25 ProShares (XPP)Direxion Daily Junior Gold Miners Index Bear 3X Shares (JDST) Ultra Gold ProShares (UGL)Direxion Daily Junior Gold Miners Index Bull 3x Shares (JNUG) Ultra MSCI Emerging Markets ProShares (EET)Direxion Daily Latin America Bull 3X Shares (LBJ) Ultra Oil & Gas ProShares (DIG)Direxion Daily Natural Gas Related Bull 3X Shares (GASL) Ultra QQQ ProShares (QLD)Direxion Daily Real Estate Bear 3x Shares (DRV) Ultra Real Estate ProShares (URE)Direxion Daily Real Estate Bull 3x Shares (DRN) Ultra Russell2000 ProShares (UWM)Direxion Daily Retail Bull 3X Shares (RETL) Ultra S&P500 ProShares (SSO)Direxion Daily Russia Bull 3X Shares (RUSL) Ultra Semiconductor (USD)Direxion Daily Russia Bear 3X Shares (RUSS) Ultra Silver ProShares (AGQ)Direxion Daily S&P 500 Bear 3X Share (SPXS) Ultra SmallCap600 ProShares (SAA)Direxion Daily S&P 500 Bull 3X Share (SPXL) Ultra Technology ProShares (ROM)Direxion Daily S&P Biotech Bear 3X Shares (LABD) UltraPro QQQ ProShares (TQQQ)Direxion Daily S&P Biotech Bull 3X Shares (LABU) UltraPro S&P 500 ProShares (UPRO)Direxion Daily S&P Oil & Gas Exp. & Prod. Bear 3X Shares (DRIP) UltraPro Short QQQ ProShares (SQQQ)Direxion Daily S&P Oil & Gas Exp. & Prod. Bull 3X Shares (GUSH) UltraPro Short S&P 500 ProShares (SPXU)Direxionshares Daily Developed Markets Bull 3X Shares (DZK) UltraShort Basic Materials ProShares (SMN)Direxionshares Developed Markets Bear 3X Shares (DPK) UltraShort Dow30 ProShares (DXD)Direxionshares Emerging Markets Bear 3X Shares (EDZ) UltraShort Euro ProShares (EUO)Direxionshares Emerging Markets Bull 3X Shares (EDC) UltraShort Financials ProShares (SKF)Direxionshares Energy Bear 3X Shares (ERY) UltraShort FTSE/Xinhua China 25 ProShares (FXP)Direxionshares Energy Bull 3X Shares (ERX) UltraShort Gold ProShares (GLL)Direxionshares Financial Bear 3X Shares (FAZ) UltraShort Lehman 20+Year Treasury ProShares (TBT)Direxionshares Financial Bull 3X Shares (FAS) UltraShort Lehman 7-10 Treasury ProShares (PST)Direxionshares Mid Cap Bear 3X Shares (MIDZ) UltraShort MidCap400 ProShares (MZZ)Direxionshares Mid Cap Bull 3X Shares (MIDU) UltraShort MSCI Brazil ProShares (BZQ)Direxionshares Small Cap Bear 3X Shares (TZA) UltraShort MSCI EAFE ProShares (EFU)Direxionshares Small Cap Bull 3X Shares (TNA) UltraShort MSCI Emerging Markets ProShares (EEV)Direxionshares Technology Bear 3X Shares (TECS) UltraShort MSCI Europe ProShares (EPV)Direxionshares Technology Bull 3X Shares (TECL) UltraShort Oil & Gas ProShares (DUG)ProShares Short MSCI Emerging Markets (EUM) UltraShort QQQ ProShares (QID)ProShares Short VIX Short-Term Futures (SVXY) UltraShort Real Estate ProShares (SRS)ProShares Ultra 7-10 Year Treasury (UST) UltraShort Russell2000 ProShares (TWM)ProShares Ultra DJ-UBS Natural Gas ETF (BOIL) UltraShort S&P500 ProShares (SDS)ProShares Ultra MSCI Japan (EZJ) UltraShort Semiconductors ProShares (SSG)ProShares Ultra Nasdaq Biotechnology (BIB) UltraShort Silver ProShares (ZSL)ProShares UltraPro Short 20+ Year Treasury (TTT) UltraShort Technology ProShares (REW)ProShares UltraPro Short Dow30 (SDOW) UltraShort Yen ProShares (YCS)ProShares UltraPro Short NASDAQ Biotechnology (ZBIO) United States Short Oil Fund LP (DNO)ProShares UltraShort Australian Dollar ETF (CROC)ProShares UltraShort MSCI Japan (EWV)ProShares UltraShort Nasdaq Biotechnology (BIS)ProShares Ultra VIX Short-Term Futures (UVXY)ProShares UltraShort DJ-UBS Natural Gas ETF (KOLD)
Page 101
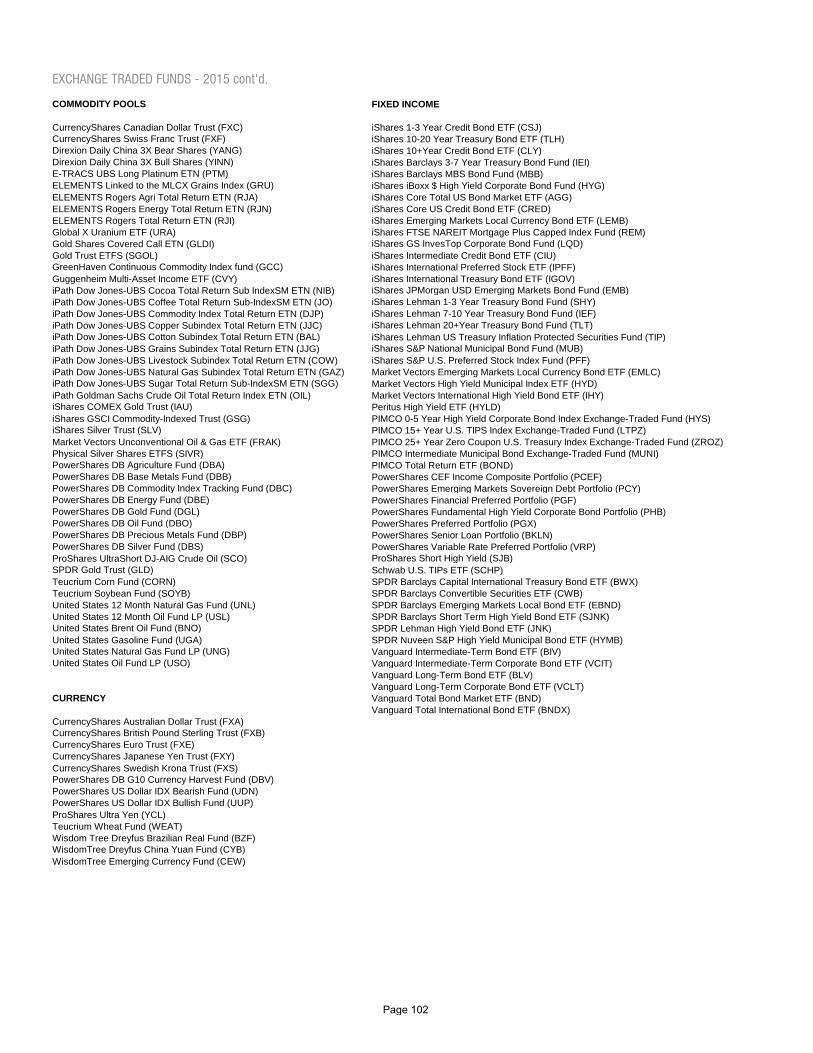
EXCHANGE TRADED FUNDS - 2015 cont'd.
COMMODITY POOLS FIXED INCOME
CurrencyShares Canadian Dollar Trust (FXC) iShares 1-3 Year Credit Bond ETF (CSJ)CurrencyShares Swiss Franc Trust (FXF) iShares 10-20 Year Treasury Bond ETF (TLH)Direxion Daily China 3X Bear Shares (YANG) iShares 10+Year Credit Bond ETF (CLY)Direxion Daily China 3X Bull Shares (YINN) iShares Barclays 3-7 Year Treasury Bond Fund (IEI)E-TRACS UBS Long Platinum ETN (PTM) iShares Barclays MBS Bond Fund (MBB)ELEMENTS Linked to the MLCX Grains Index (GRU) iShares iBoxx $ High Yield Corporate Bond Fund (HYG)ELEMENTS Rogers Agri Total Return ETN (RJA) iShares Core Total US Bond Market ETF (AGG)ELEMENTS Rogers Energy Total Return ETN (RJN) iShares Core US Credit Bond ETF (CRED)ELEMENTS Rogers Total Return ETN (RJI) iShares Emerging Markets Local Currency Bond ETF (LEMB)Global X Uranium ETF (URA) iShares FTSE NAREIT Mortgage Plus Capped Index Fund (REM)Gold Shares Covered Call ETN (GLDI) iShares GS InvesTop Corporate Bond Fund (LQD)Gold Trust ETFS (SGOL) iShares Intermediate Credit Bond ETF (CIU)GreenHaven Continuous Commodity Index fund (GCC) iShares International Preferred Stock ETF (IPFF)Guggenheim Multi-Asset Income ETF (CVY) iShares International Treasury Bond ETF (IGOV)iPath Dow Jones-UBS Cocoa Total Return Sub IndexSM ETN (NIB) iShares JPMorgan USD Emerging Markets Bond Fund (EMB)iPath Dow Jones-UBS Coffee Total Return Sub-IndexSM ETN (JO) iShares Lehman 1-3 Year Treasury Bond Fund (SHY)iPath Dow Jones-UBS Commodity Index Total Return ETN (DJP) iShares Lehman 7-10 Year Treasury Bond Fund (IEF)iPath Dow Jones-UBS Copper Subindex Total Return ETN (JJC) iShares Lehman 20+Year Treasury Bond Fund (TLT)iPath Dow Jones-UBS Cotton Subindex Total Return ETN (BAL) iShares Lehman US Treasury Inflation Protected Securities Fund (TIP)iPath Dow Jones-UBS Grains Subindex Total Return ETN (JJG) iShares S&P National Municipal Bond Fund (MUB)iPath Dow Jones-UBS Livestock Subindex Total Return ETN (COW) iShares S&P U.S. Preferred Stock Index Fund (PFF)iPath Dow Jones-UBS Natural Gas Subindex Total Return ETN (GAZ) Market Vectors Emerging Markets Local Currency Bond ETF (EMLC)iPath Dow Jones-UBS Sugar Total Return Sub-IndexSM ETN (SGG) Market Vectors High Yield Municipal Index ETF (HYD)iPath Goldman Sachs Crude Oil Total Return Index ETN (OIL) Market Vectors International High Yield Bond ETF (IHY)iShares COMEX Gold Trust (IAU) Peritus High Yield ETF (HYLD)iShares GSCI Commodity-Indexed Trust (GSG) PIMCO 0-5 Year High Yield Corporate Bond Index Exchange-Traded Fund (HYS)iShares Silver Trust (SLV) PIMCO 15+ Year U.S. TIPS Index Exchange-Traded Fund (LTPZ)Market Vectors Unconventional Oil & Gas ETF (FRAK) PIMCO 25+ Year Zero Coupon U.S. Treasury Index Exchange-Traded Fund (ZROZ)Physical Silver Shares ETFS (SIVR) PIMCO Intermediate Municipal Bond Exchange-Traded Fund (MUNI)PowerShares DB Agriculture Fund (DBA) PIMCO Total Return ETF (BOND)PowerShares DB Base Metals Fund (DBB) PowerShares CEF Income Composite Portfolio (PCEF)PowerShares DB Commodity Index Tracking Fund (DBC) PowerShares Emerging Markets Sovereign Debt Portfolio (PCY)PowerShares DB Energy Fund (DBE) PowerShares Financial Preferred Portfolio (PGF)PowerShares DB Gold Fund (DGL) PowerShares Fundamental High Yield Corporate Bond Portfolio (PHB)PowerShares DB Oil Fund (DBO) PowerShares Preferred Portfolio (PGX)PowerShares DB Precious Metals Fund (DBP) PowerShares Senior Loan Portfolio (BKLN)PowerShares DB Silver Fund (DBS) PowerShares Variable Rate Preferred Portfolio (VRP)ProShares UltraShort DJ-AIG Crude Oil (SCO) ProShares Short High Yield (SJB)SPDR Gold Trust (GLD) Schwab U.S. TIPs ETF (SCHP)Teucrium Corn Fund (CORN) SPDR Barclays Capital International Treasury Bond ETF (BWX)Teucrium Soybean Fund (SOYB) SPDR Barclays Convertible Securities ETF (CWB)United States 12 Month Natural Gas Fund (UNL) SPDR Barclays Emerging Markets Local Bond ETF (EBND)United States 12 Month Oil Fund LP (USL) SPDR Barclays Short Term High Yield Bond ETF (SJNK)United States Brent Oil Fund (BNO) SPDR Lehman High Yield Bond ETF (JNK)United States Gasoline Fund (UGA) SPDR Nuveen S&P High Yield Municipal Bond ETF (HYMB)United States Natural Gas Fund LP (UNG) Vanguard Intermediate-Term Bond ETF (BIV)United States Oil Fund LP (USO) Vanguard Intermediate-Term Corporate Bond ETF (VCIT)
Vanguard Long-Term Bond ETF (BLV)Vanguard Long-Term Corporate Bond ETF (VCLT)
CURRENCY Vanguard Total Bond Market ETF (BND)Vanguard Total International Bond ETF (BNDX)
CurrencyShares Australian Dollar Trust (FXA)CurrencyShares British Pound Sterling Trust (FXB)CurrencyShares Euro Trust (FXE)CurrencyShares Japanese Yen Trust (FXY)CurrencyShares Swedish Krona Trust (FXS)PowerShares DB G10 Currency Harvest Fund (DBV)PowerShares US Dollar IDX Bearish Fund (UDN)PowerShares US Dollar IDX Bullish Fund (UUP)ProShares Ultra Yen (YCL)Teucrium Wheat Fund (WEAT)Wisdom Tree Dreyfus Brazilian Real Fund (BZF)WisdomTree Dreyfus China Yuan Fund (CYB)WisdomTree Emerging Currency Fund (CEW)
Page 102

MOST ACTIVE EXCHANGE TRADED FUNDS - 2015
SPDR® S&P® 500 ETF (Ticker: SPY)
The SPDR S&P 500 ETF represents ownership in the SPDR Trust Series 1, a unit investment trust established to accumulate and hold a portfolio of the equity securities that comprise the Standard & Poor's 500 Composite Stock Price Index. SPDRs seek investment results that, before expenses, generally correspond to the price and yield performance of the Standard & Poor's 500 Composite Stock Price Index. The S&P 500® Index is composed of 500 selected stocks, all of which are listed on the NYSE, AMEX or NASDAQ, and spans over 24 separate industry groups.
iShares Russell 2000 Index Fund (Ticker: IWM)
The iShares Russell 2000 Index Fund seeks investment results that correspond generally to the price and yield performance, before fees and expenses, of the small capitalization sector of the U.S. equity market as represented by the Russell 2000 Index. The index represents the approximately 2,000 smallest companies in the Russell 3000 Index.
DIAMONDS (Ticker: DIA)
DIAMONDS represent ownership in the DIAMONDS, Trust Series 1, a unit investment trust established to accumulate and hold a portfolio of the equity securities that comprise the Dow Jones Industrial Average. DIAMONDS seek investment results that, before expenses, generally correspond to the price and yield performance of the DJIA. The Dow Jones Industrial Average is the oldest continuous barometer of the U.S. stock market, and the most widely quoted indicator of U.S. stock market activity. The 30 stocks now comprising the DJIA are all leaders in their respective industries, and their stocks are widely held by individuals and institutional investors.
PowerShares QQQ™ (Ticker: QQQ)
PowerShares QQQ™, formerly known as "QQQ" or the "NASDAQ- 100 Index Tracking Stock®", is based on the Nasdaq-100 Index®. The Index includes 100 of the largest domestic and international non-financial companies listed on the Nasdaq Stock Market based on market capitalization. The portfolio is rebalanced quarterly and reconstituted annually.
Page 103
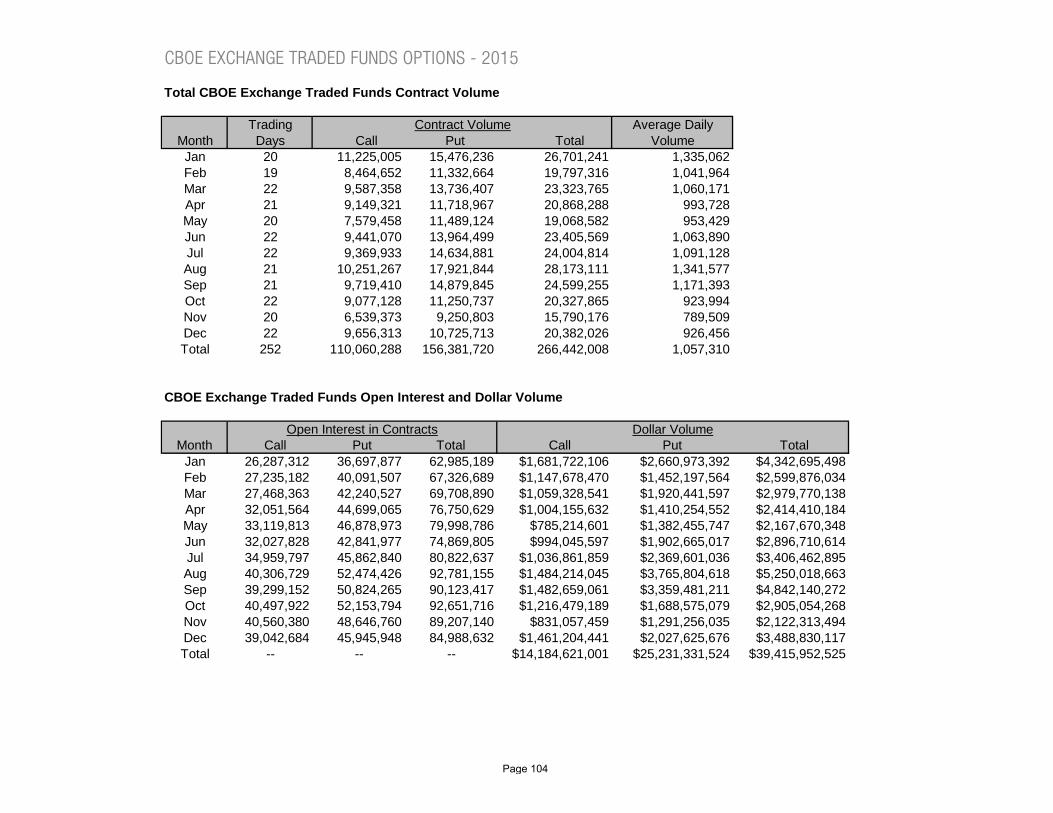
CBOE EXCHANGE TRADED FUNDS OPTIONS - 2015
Total CBOE Exchange Traded Funds Contract Volume
Trading Average DailyMonth Days Call Put Total Volume
Jan 20 11,225,005 15,476,236 26,701,241 1,335,062Feb 19 8,464,652 11,332,664 19,797,316 1,041,964Mar 22 9,587,358 13,736,407 23,323,765 1,060,171Apr 21 9,149,321 11,718,967 20,868,288 993,728May 20 7,579,458 11,489,124 19,068,582 953,429Jun 22 9,441,070 13,964,499 23,405,569 1,063,890Jul 22 9,369,933 14,634,881 24,004,814 1,091,128Aug 21 10,251,267 17,921,844 28,173,111 1,341,577Sep 21 9,719,410 14,879,845 24,599,255 1,171,393Oct 22 9,077,128 11,250,737 20,327,865 923,994Nov 20 6,539,373 9,250,803 15,790,176 789,509Dec 22 9,656,313 10,725,713 20,382,026 926,456Total 252 110,060,288 156,381,720 266,442,008 1,057,310
CBOE Exchange Traded Funds Open Interest and Dollar Volume
Month Call Put Total Call Put TotalJan 26,287,312 36,697,877 62,985,189 $1,681,722,106 $2,660,973,392 $4,342,695,498Feb 27,235,182 40,091,507 67,326,689 $1,147,678,470 $1,452,197,564 $2,599,876,034Mar 27,468,363 42,240,527 69,708,890 $1,059,328,541 $1,920,441,597 $2,979,770,138Apr 32,051,564 44,699,065 76,750,629 $1,004,155,632 $1,410,254,552 $2,414,410,184May 33,119,813 46,878,973 79,998,786 $785,214,601 $1,382,455,747 $2,167,670,348Jun 32,027,828 42,841,977 74,869,805 $994,045,597 $1,902,665,017 $2,896,710,614Jul 34,959,797 45,862,840 80,822,637 $1,036,861,859 $2,369,601,036 $3,406,462,895Aug 40,306,729 52,474,426 92,781,155 $1,484,214,045 $3,765,804,618 $5,250,018,663Sep 39,299,152 50,824,265 90,123,417 $1,482,659,061 $3,359,481,211 $4,842,140,272Oct 40,497,922 52,153,794 92,651,716 $1,216,479,189 $1,688,575,079 $2,905,054,268Nov 40,560,380 48,646,760 89,207,140 $831,057,459 $1,291,256,035 $2,122,313,494Dec 39,042,684 45,945,948 84,988,632 $1,461,204,441 $2,027,625,676 $3,488,830,117Total -- -- -- $14,184,621,001 $25,231,331,524 $39,415,952,525
Contract Volume
Open Interest in Contracts Dollar Volume
Page 104

Total CBOE Exchange Traded Funds Average Premium Per Contract, Average Contracts Per Trade and Transactions
Month Call Put Total Call Put Total Call Put TotalJan $150 $172 $163 17 22 20 671,928 694,370 1,366,298Feb $136 $128 $131 17 23 20 488,350 488,925 977,275Mar $110 $140 $128 18 25 22 519,748 551,316 1,071,064Apr $110 $120 $116 20 24 22 467,419 478,968 946,387May $104 $120 $114 18 26 22 422,479 442,804 865,283Jun $105 $136 $124 18 25 22 522,117 557,693 1,079,810Jul $111 $162 $142 21 30 26 456,788 484,086 940,874Aug $145 $210 $186 19 30 25 526,844 596,144 1,122,988Sep $153 $226 $197 19 25 22 520,068 590,445 1,110,513Oct $134 $150 $143 21 26 23 434,588 435,114 869,702Nov $127 $140 $134 19 26 22 348,004 355,284 703,288Dec $151 $189 $171 25 28 26 388,629 388,544 777,173Total $129 $161 $148 19 26 23 5,766,962 6,063,693 11,830,655
Average Premium Per Contract Average Contracts Per Trade Transactions
Page 105

Total CBOE Exchange Traded Funds FLEX® Contract Volume *
Trading Average DailyMonth Days Call Put Total Volume
Jan 20 4,763 12,129 16,892 845Feb 19 8,423 66,868 75,291 3,963Mar 22 14,409 76,331 90,740 4,125Apr 21 15,445 107,556 123,001 5,857May 20 10,589 12,690 23,279 1,164Jun 22 9,871 23,267 33,138 1,506Jul 22 12,000 25,082 37,082 1,686Aug 21 7,088 14,843 21,931 1,044Sep 21 5,313 21,377 26,690 1,271Oct 22 10,763 10,385 21,148 961Nov 20 48,987 9,723 58,710 2,936Dec 22 7,972 10,729 18,701 850Total 252 155,623 390,980 546,603 2,169
Total CBOE Exchange Traded Funds FLEX® Open Interest and Dollar Volume
Month Call Put Total Call Put TotalJan 71,582 992,807 1,064,389 $684,998 $494,893 $1,179,891Feb 116,436 1,687,890 1,804,326 $1,037,345 $6,956,449 $7,993,794Mar 334,514 1,765,518 2,100,032 $1,919,192 $11,385,725 $13,304,917Apr 535,928 2,021,066 2,556,994 $1,105,749 $25,311,486 $26,417,235May 682,384 2,106,488 2,788,872 $1,517,020 $2,964,480 $4,481,500Jun 854,520 1,914,599 2,769,119 $906,472 $5,975,343 $6,881,815Jul 926,921 1,991,780 2,918,701 $1,933,282 $5,258,079 $7,191,361Aug 739,280 1,981,406 2,720,686 $803,202 $2,623,485 $3,426,687Sep 745,914 1,992,972 2,738,886 $327,955 $2,022,596 $2,350,551Oct 788,823 2,000,604 2,789,427 $1,451,208 $572,844 $2,024,052Nov 1,391,251 2,153,715 3,544,966 $9,790,035 $4,403,152 $14,193,187Dec 1,483,573 2,170,696 3,654,269 $410,421 $762,935 $1,173,356Total -- -- -- $21,886,879 $68,731,467 $90,618,346
Open Interest in Contracts Dollar Volume
Contract Volume
Page 106
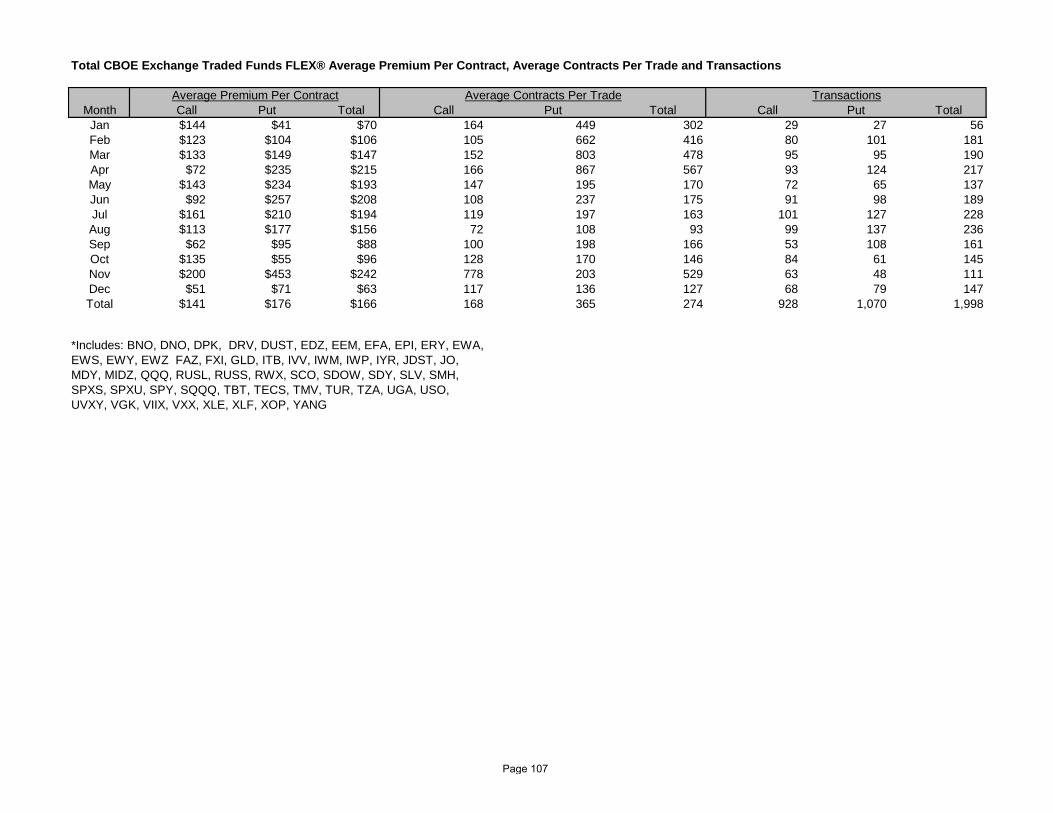
Total CBOE Exchange Traded Funds FLEX® Average Premium Per Contract, Average Contracts Per Trade and Transactions
Month Call Put Total Call Put Total Call Put TotalJan $144 $41 $70 164 449 302 29 27 56Feb $123 $104 $106 105 662 416 80 101 181Mar $133 $149 $147 152 803 478 95 95 190Apr $72 $235 $215 166 867 567 93 124 217May $143 $234 $193 147 195 170 72 65 137Jun $92 $257 $208 108 237 175 91 98 189Jul $161 $210 $194 119 197 163 101 127 228Aug $113 $177 $156 72 108 93 99 137 236Sep $62 $95 $88 100 198 166 53 108 161Oct $135 $55 $96 128 170 146 84 61 145Nov $200 $453 $242 778 203 529 63 48 111Dec $51 $71 $63 117 136 127 68 79 147Total $141 $176 $166 168 365 274 928 1,070 1,998
*Includes: BNO, DNO, DPK, DRV, DUST, EDZ, EEM, EFA, EPI, ERY, EWA,EWS, EWY, EWZ FAZ, FXI, GLD, ITB, IVV, IWM, IWP, IYR, JDST, JO,MDY, MIDZ, QQQ, RUSL, RUSS, RWX, SCO, SDOW, SDY, SLV, SMH,SPXS, SPXU, SPY, SQQQ, TBT, TECS, TMV, TUR, TZA, UGA, USO,UVXY, VGK, VIIX, VXX, XLE, XLF, XOP, YANG
Average Premium Per Contract Average Contracts Per Trade Transactions
Page 107
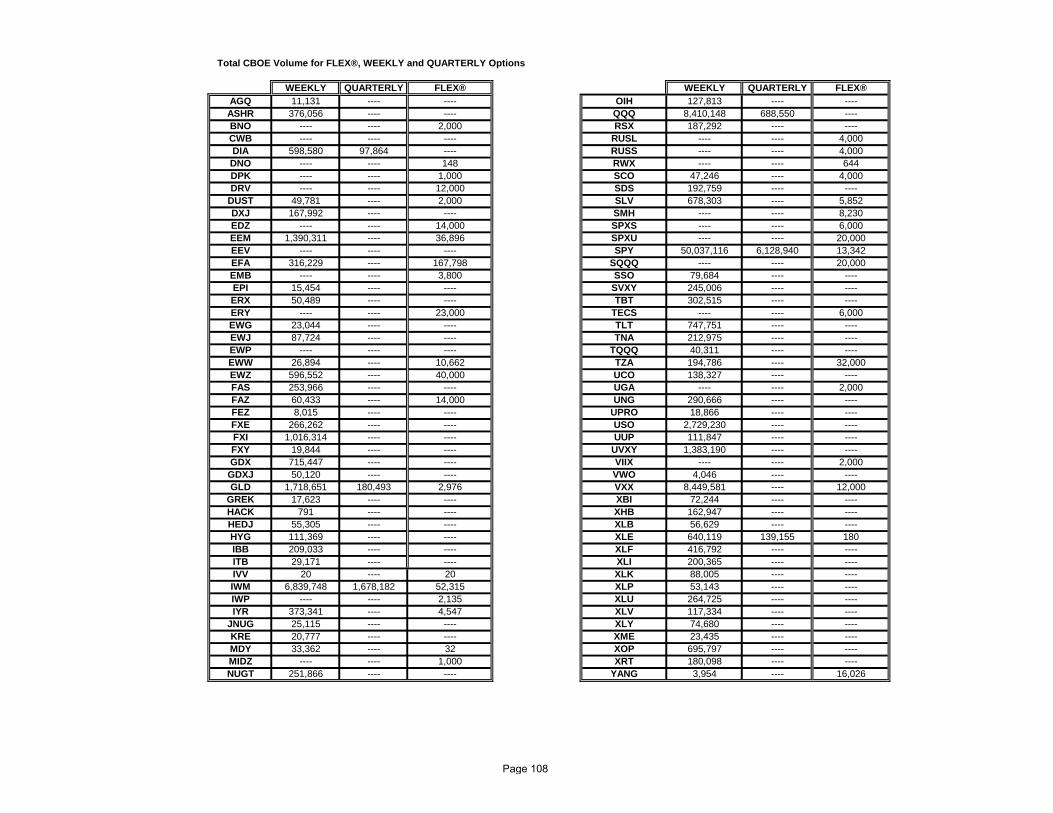
WEEKLY QUARTERLY FLEX® WEEKLY QUARTERLY FLEX®AGQ 11,131 ---- ---- OIH 127,813 ---- ----ASHR 376,056 ---- ---- QQQ 8,410,148 688,550 ----BNO ---- ---- 2,000 RSX 187,292 ---- ----CWB ---- ---- ---- RUSL ---- ---- 4,000DIA 598,580 97,864 ---- RUSS ---- ---- 4,000DNO ---- ---- 148 RWX ---- ---- 644DPK ---- ---- 1,000 SCO 47,246 ---- 4,000DRV ---- ---- 12,000 SDS 192,759 ---- ----
DUST 49,781 ---- 2,000 SLV 678,303 ---- 5,852DXJ 167,992 ---- ---- SMH ---- ---- 8,230EDZ ---- ---- 14,000 SPXS ---- ---- 6,000EEM 1,390,311 ---- 36,896 SPXU ---- ---- 20,000EEV ---- ---- ---- SPY 50,037,116 6,128,940 13,342EFA 316,229 ---- 167,798 SQQQ ---- ---- 20,000EMB ---- ---- 3,800 SSO 79,684 ---- ----EPI 15,454 ---- ---- SVXY 245,006 ---- ----ERX 50,489 ---- ---- TBT 302,515 ---- ----ERY ---- ---- 23,000 TECS ---- ---- 6,000EWG 23,044 ---- ---- TLT 747,751 ---- ----EWJ 87,724 ---- ---- TNA 212,975 ---- ----EWP ---- ---- ---- TQQQ 40,311 ---- ----EWW 26,894 ---- 10,662 TZA 194,786 ---- 32,000EWZ 596,552 ---- 40,000 UCO 138,327 ---- ----FAS 253,966 ---- ---- UGA ---- ---- 2,000FAZ 60,433 ---- 14,000 UNG 290,666 ---- ----FEZ 8,015 ---- ---- UPRO 18,866 ---- ----FXE 266,262 ---- ---- USO 2,729,230 ---- ----FXI 1,016,314 ---- ---- UUP 111,847 ---- ----FXY 19,844 ---- ---- UVXY 1,383,190 ---- ----GDX 715,447 ---- ---- VIIX ---- ---- 2,000
GDXJ 50,120 ---- ---- VWO 4,046 ---- ----GLD 1,718,651 180,493 2,976 VXX 8,449,581 ---- 12,000
GREK 17,623 ---- ---- XBI 72,244 ---- ----HACK 791 ---- ---- XHB 162,947 ---- ----HEDJ 55,305 ---- ---- XLB 56,629 ---- ----HYG 111,369 ---- ---- XLE 640,119 139,155 180IBB 209,033 ---- ---- XLF 416,792 ---- ----ITB 29,171 ---- ---- XLI 200,365 ---- ----IVV 20 ---- 20 XLK 88,005 ---- ----IWM 6,839,748 1,678,182 52,315 XLP 53,143 ---- ----IWP ---- ---- 2,135 XLU 264,725 ---- ----IYR 373,341 ---- 4,547 XLV 117,334 ---- ----
JNUG 25,115 ---- ---- XLY 74,680 ---- ----KRE 20,777 ---- ---- XME 23,435 ---- ----MDY 33,362 ---- 32 XOP 695,797 ---- ----MIDZ ---- ---- 1,000 XRT 180,098 ---- ----NUGT 251,866 ---- ---- YANG 3,954 ---- 16,026
Total CBOE Volume for FLEX®, WEEKLY and QUARTERLY Options
Page 108

QQQ (PowerShares QQQ) Contract Volume (includes LEAPS®)
Trading Average DailyMonth Days Call Put Total Volume
Jan 20 1,057,207 1,255,612 2,312,819 115,641Feb 19 641,363 827,233 1,468,596 77,295Mar 22 916,122 920,623 1,836,745 83,488Apr 21 803,689 808,217 1,611,906 76,757May 20 636,398 837,577 1,473,975 73,699Jun 22 829,472 1,036,096 1,865,568 84,799Jul 22 644,165 963,352 1,607,517 73,069Aug 21 879,212 1,279,103 2,158,315 102,777Sep 21 674,449 1,280,161 1,954,610 93,077Oct 22 533,990 940,429 1,474,419 67,019Nov 20 508,813 542,807 1,051,620 52,581Dec 22 513,694 741,785 1,255,479 57,067Total 252 8,638,574 11,432,995 20,071,569 79,649
QQQ (PowerShares QQQ) Open Interest and Dollar Volume (includes LEAPS®)
Month Call Put Total Call Put TotalJan 1,255,574 1,365,260 2,620,834 $125,056,793 $124,571,345 $249,628,138Feb 1,156,325 1,786,236 2,942,561 $79,097,824 $72,137,452 $151,235,276Mar 1,251,689 1,706,948 2,958,637 $82,111,307 $89,430,696 $171,542,003Apr 1,448,526 1,790,810 3,239,336 $79,964,134 $62,207,004 $142,171,138May 1,249,320 1,805,952 3,055,272 $51,896,473 $64,607,008 $116,503,481Jun 1,158,688 1,623,558 2,782,246 $75,203,201 $86,720,960 $161,924,161Jul 1,445,759 2,370,215 3,815,974 $67,275,202 $81,867,616 $149,142,818Aug 1,573,832 2,441,392 4,015,224 $97,359,530 $186,203,729 $283,563,259Sep 1,405,042 2,440,739 3,845,781 $100,119,536 $157,354,186 $257,473,722Oct 1,584,993 2,896,072 4,481,065 $74,514,253 $97,533,382 $172,047,635Nov 1,568,081 2,288,132 3,856,213 $58,389,937 $58,894,088 $117,284,025Dec 1,220,866 2,051,036 3,271,902 $67,163,393 $94,333,415 $161,496,808Total -- -- -- $958,151,583 $1,175,860,881 $2,134,012,464
Dollar VolumeOpen Interest in Contracts
Contract Volume
Page 109
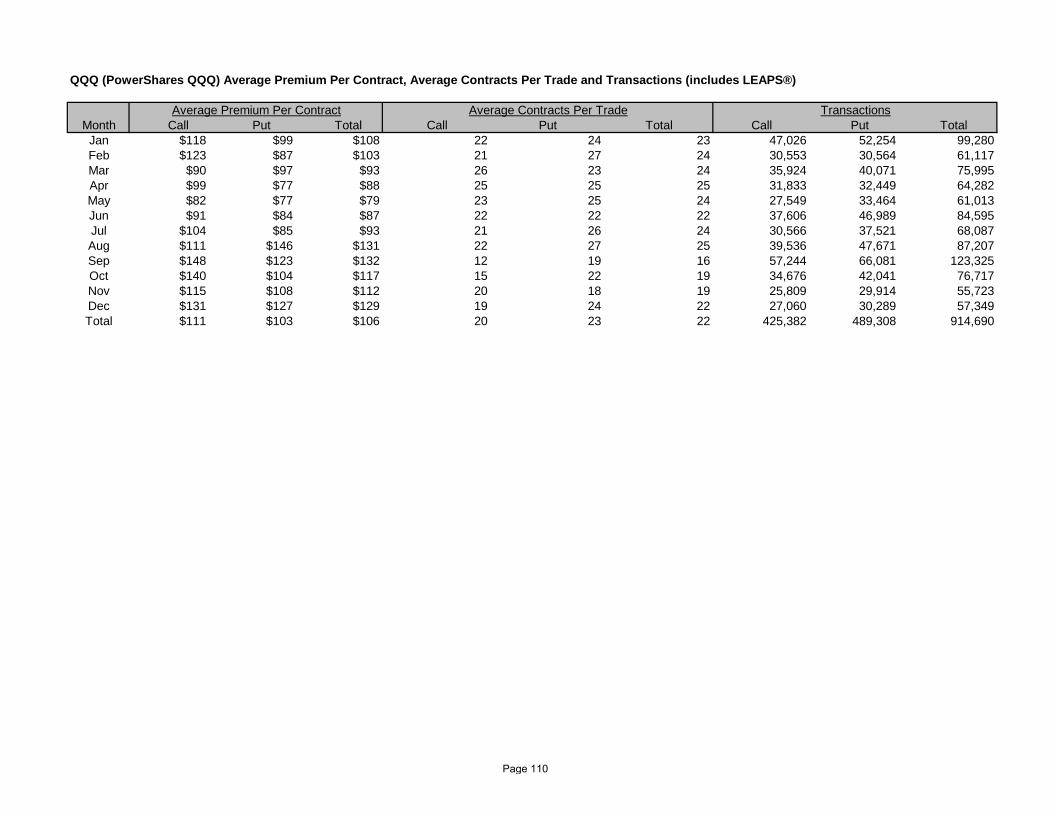
QQQ (PowerShares QQQ) Average Premium Per Contract, Average Contracts Per Trade and Transactions (includes LEAPS®)
Month Call Put Total Call Put Total Call Put TotalJan $118 $99 $108 22 24 23 47,026 52,254 99,280Feb $123 $87 $103 21 27 24 30,553 30,564 61,117Mar $90 $97 $93 26 23 24 35,924 40,071 75,995Apr $99 $77 $88 25 25 25 31,833 32,449 64,282May $82 $77 $79 23 25 24 27,549 33,464 61,013Jun $91 $84 $87 22 22 22 37,606 46,989 84,595Jul $104 $85 $93 21 26 24 30,566 37,521 68,087Aug $111 $146 $131 22 27 25 39,536 47,671 87,207Sep $148 $123 $132 12 19 16 57,244 66,081 123,325Oct $140 $104 $117 15 22 19 34,676 42,041 76,717Nov $115 $108 $112 20 18 19 25,809 29,914 55,723Dec $131 $127 $129 19 24 22 27,060 30,289 57,349Total $111 $103 $106 20 23 22 425,382 489,308 914,690
Average Premium Per Contract Average Contracts Per Trade Transactions
Page 110
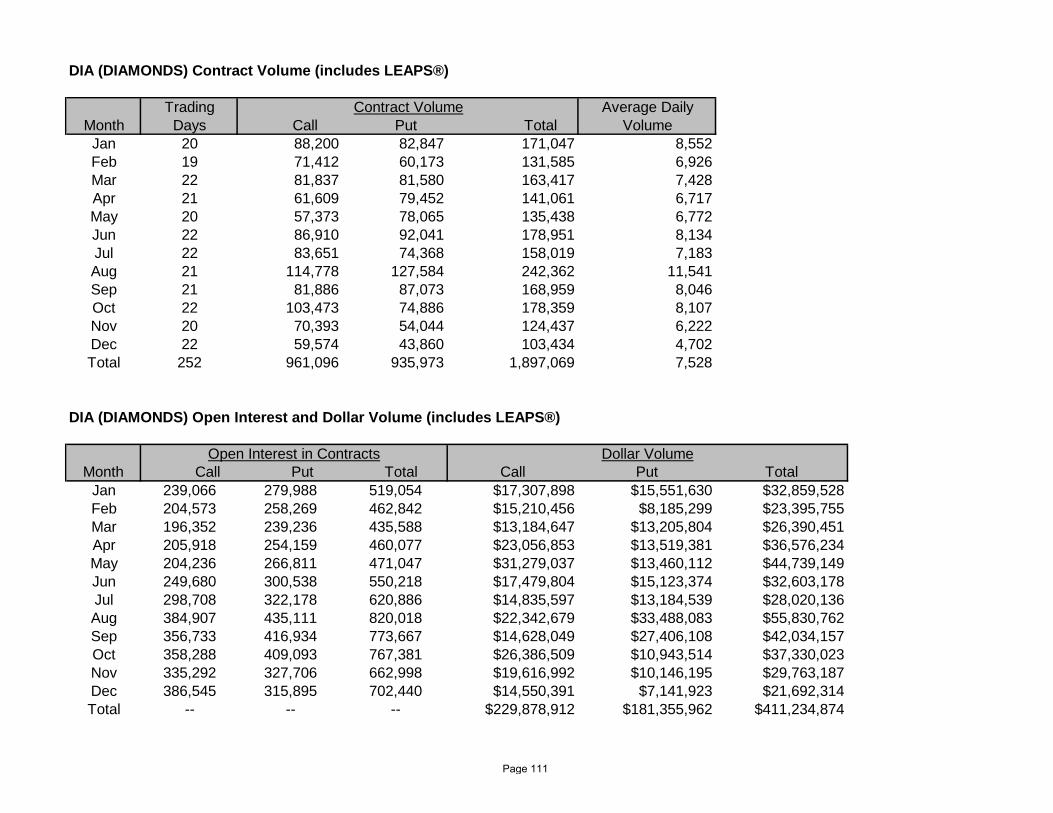
DIA (DIAMONDS) Contract Volume (includes LEAPS®)
Trading Average DailyMonth Days Call Put Total Volume
Jan 20 88,200 82,847 171,047 8,552Feb 19 71,412 60,173 131,585 6,926Mar 22 81,837 81,580 163,417 7,428Apr 21 61,609 79,452 141,061 6,717May 20 57,373 78,065 135,438 6,772Jun 22 86,910 92,041 178,951 8,134Jul 22 83,651 74,368 158,019 7,183Aug 21 114,778 127,584 242,362 11,541Sep 21 81,886 87,073 168,959 8,046Oct 22 103,473 74,886 178,359 8,107Nov 20 70,393 54,044 124,437 6,222Dec 22 59,574 43,860 103,434 4,702Total 252 961,096 935,973 1,897,069 7,528
DIA (DIAMONDS) Open Interest and Dollar Volume (includes LEAPS®)
Month Call Put Total Call Put TotalJan 239,066 279,988 519,054 $17,307,898 $15,551,630 $32,859,528Feb 204,573 258,269 462,842 $15,210,456 $8,185,299 $23,395,755Mar 196,352 239,236 435,588 $13,184,647 $13,205,804 $26,390,451Apr 205,918 254,159 460,077 $23,056,853 $13,519,381 $36,576,234May 204,236 266,811 471,047 $31,279,037 $13,460,112 $44,739,149Jun 249,680 300,538 550,218 $17,479,804 $15,123,374 $32,603,178Jul 298,708 322,178 620,886 $14,835,597 $13,184,539 $28,020,136Aug 384,907 435,111 820,018 $22,342,679 $33,488,083 $55,830,762Sep 356,733 416,934 773,667 $14,628,049 $27,406,108 $42,034,157Oct 358,288 409,093 767,381 $26,386,509 $10,943,514 $37,330,023Nov 335,292 327,706 662,998 $19,616,992 $10,146,195 $29,763,187Dec 386,545 315,895 702,440 $14,550,391 $7,141,923 $21,692,314Total -- -- -- $229,878,912 $181,355,962 $411,234,874
Contract Volume
Dollar VolumeOpen Interest in Contracts
Page 111

DIA (DIAMONDS) Average Premium Per Contract, Average Contracts Per Trade and Transactions (includes LEAPS®)
Month Call Put Total Call Put Total Call Put TotalJan $196 $188 $192 11 10 10 8,138 8,247 16,385Feb $213 $136 $178 10 8 9 6,917 7,342 14,259Mar $161 $162 $161 10 8 9 7,872 9,731 17,603Apr $374 $170 $259 10 9 10 5,922 8,803 14,725May $545 $172 $330 10 9 9 5,573 8,885 14,458Jun $201 $164 $182 8 8 8 11,574 11,998 23,572Jul $177 $177 $177 9 8 9 9,662 8,761 18,423Aug $195 $262 $230 10 10 10 11,592 12,257 23,849Sep $179 $315 $249 9 8 8 9,217 11,089 20,306Oct $255 $146 $209 10 10 10 10,433 7,582 18,015Nov $279 $188 $239 9 8 9 7,426 7,066 14,492Dec $244 $163 $210 8 6 7 7,197 7,113 14,310Total $239 $194 $217 9 9 9 101,523 108,874 210,397
TransactionsAverage Premium Per Contract Average Contracts Per Trade
Page 112
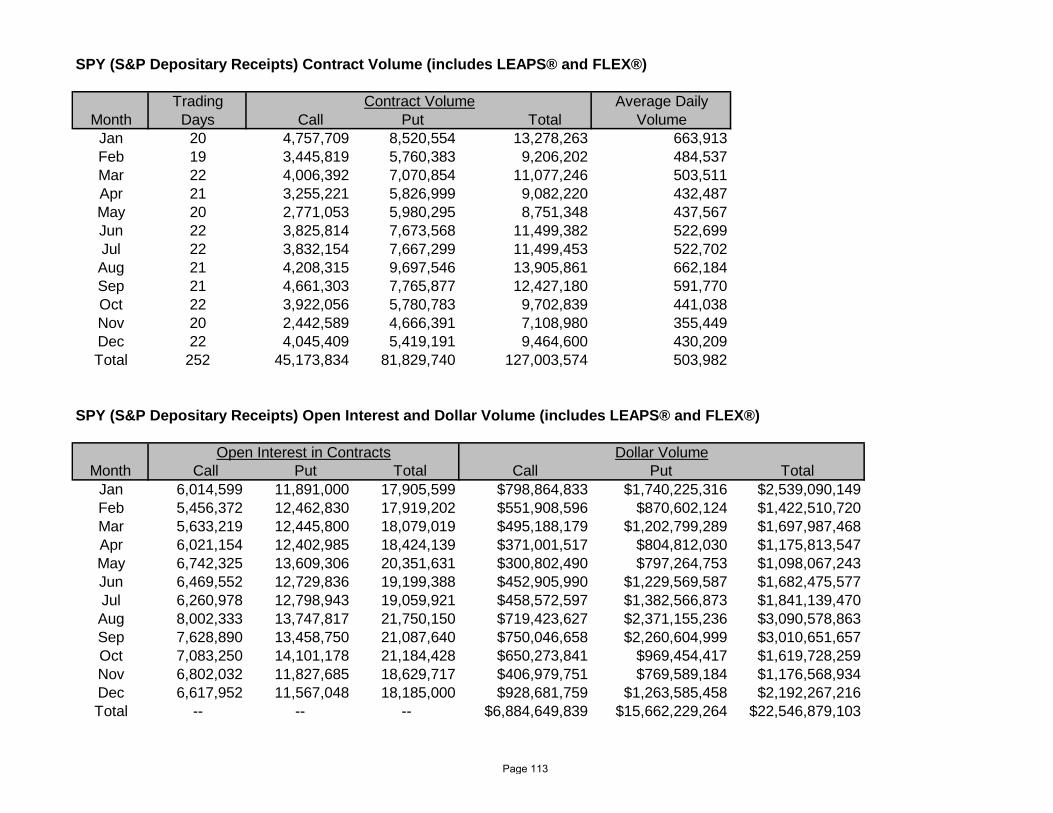
SPY (S&P Depositary Receipts) Contract Volume (includes LEAPS® and FLEX®)
Trading Average DailyMonth Days Call Put Total Volume
Jan 20 4,757,709 8,520,554 13,278,263 663,913Feb 19 3,445,819 5,760,383 9,206,202 484,537Mar 22 4,006,392 7,070,854 11,077,246 503,511Apr 21 3,255,221 5,826,999 9,082,220 432,487May 20 2,771,053 5,980,295 8,751,348 437,567Jun 22 3,825,814 7,673,568 11,499,382 522,699Jul 22 3,832,154 7,667,299 11,499,453 522,702Aug 21 4,208,315 9,697,546 13,905,861 662,184Sep 21 4,661,303 7,765,877 12,427,180 591,770Oct 22 3,922,056 5,780,783 9,702,839 441,038Nov 20 2,442,589 4,666,391 7,108,980 355,449Dec 22 4,045,409 5,419,191 9,464,600 430,209Total 252 45,173,834 81,829,740 127,003,574 503,982
SPY (S&P Depositary Receipts) Open Interest and Dollar Volume (includes LEAPS® and FLEX®)
Month Call Put Total Call Put TotalJan 6,014,599 11,891,000 17,905,599 $798,864,833 $1,740,225,316 $2,539,090,149Feb 5,456,372 12,462,830 17,919,202 $551,908,596 $870,602,124 $1,422,510,720Mar 5,633,219 12,445,800 18,079,019 $495,188,179 $1,202,799,289 $1,697,987,468Apr 6,021,154 12,402,985 18,424,139 $371,001,517 $804,812,030 $1,175,813,547May 6,742,325 13,609,306 20,351,631 $300,802,490 $797,264,753 $1,098,067,243Jun 6,469,552 12,729,836 19,199,388 $452,905,990 $1,229,569,587 $1,682,475,577Jul 6,260,978 12,798,943 19,059,921 $458,572,597 $1,382,566,873 $1,841,139,470Aug 8,002,333 13,747,817 21,750,150 $719,423,627 $2,371,155,236 $3,090,578,863Sep 7,628,890 13,458,750 21,087,640 $750,046,658 $2,260,604,999 $3,010,651,657Oct 7,083,250 14,101,178 21,184,428 $650,273,841 $969,454,417 $1,619,728,259Nov 6,802,032 11,827,685 18,629,717 $406,979,751 $769,589,184 $1,176,568,934Dec 6,617,952 11,567,048 18,185,000 $928,681,759 $1,263,585,458 $2,192,267,216Total -- -- -- $6,884,649,839 $15,662,229,264 $22,546,879,103
Dollar VolumeOpen Interest in Contracts
Contract Volume
Page 113

SPY (S&P Depositary Receipts) Average Premium Per Contract, Average Contracts Per Trade and Transactions (includes LEAPS® and FLEX®)
Month Call Put Total Call Put Total Call Put TotalJan $168 $204 $191 19 26 23 248,833 324,045 572,878Feb $160 $151 $155 21 29 25 160,503 200,689 361,192Mar $124 $170 $153 25 33 30 159,726 211,956 371,682Apr $114 $138 $129 26 34 31 125,122 172,168 297,290May $109 $133 $125 26 39 34 104,707 154,719 259,426Jun $118 $160 $146 22 32 28 175,972 242,040 418,012Jul $120 $180 $160 29 42 36 132,134 184,086 316,220Aug $171 $245 $222 22 35 30 188,379 273,849 462,228Sep $161 $291 $242 28 31 30 167,076 250,855 417,931Oct $166 $168 $167 26 30 29 149,077 190,235 339,312Nov $167 $165 $166 21 32 27 118,851 144,935 263,786Dec $230 $233 $232 35 36 35 117,100 151,644 268,744Total $152 $191 $178 24 33 29 1,847,480 2,501,221 4,348,701
TransactionsAverage Premium Per Contract Average Contracts Per Trade
Page 114
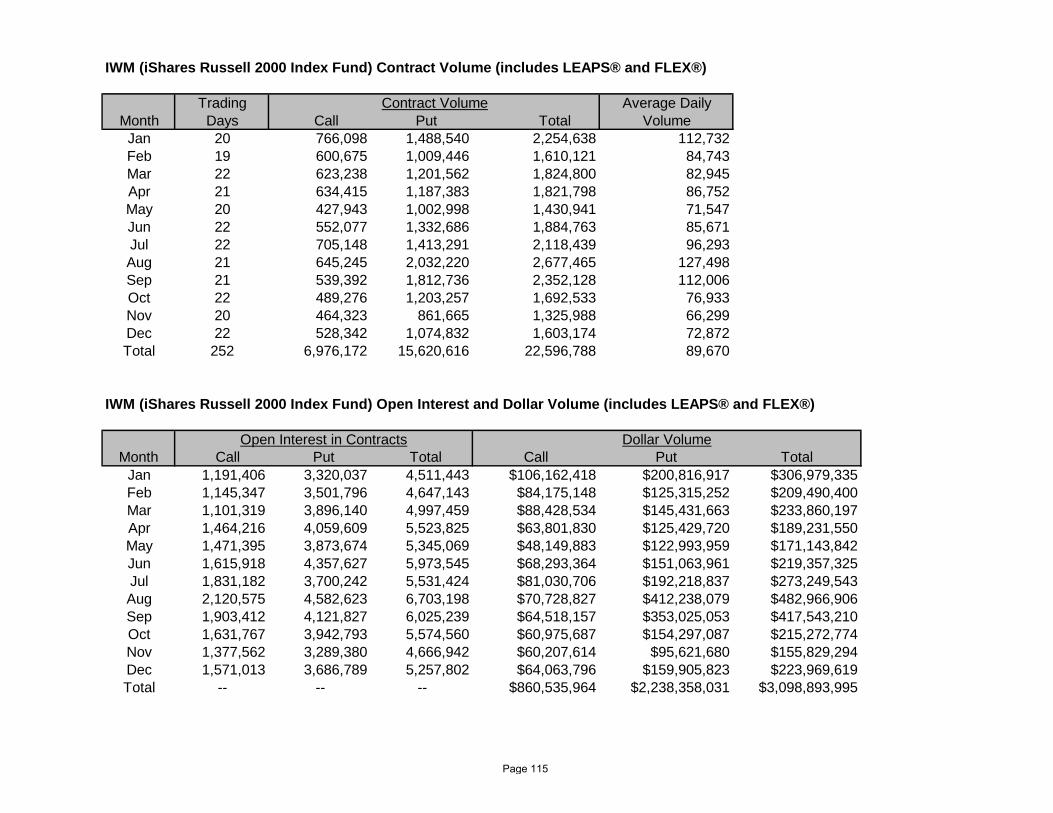
IWM (iShares Russell 2000 Index Fund) Contract Volume (includes LEAPS® and FLEX®)
Trading Average DailyMonth Days Call Put Total Volume
Jan 20 766,098 1,488,540 2,254,638 112,732Feb 19 600,675 1,009,446 1,610,121 84,743Mar 22 623,238 1,201,562 1,824,800 82,945Apr 21 634,415 1,187,383 1,821,798 86,752May 20 427,943 1,002,998 1,430,941 71,547Jun 22 552,077 1,332,686 1,884,763 85,671Jul 22 705,148 1,413,291 2,118,439 96,293Aug 21 645,245 2,032,220 2,677,465 127,498Sep 21 539,392 1,812,736 2,352,128 112,006Oct 22 489,276 1,203,257 1,692,533 76,933Nov 20 464,323 861,665 1,325,988 66,299Dec 22 528,342 1,074,832 1,603,174 72,872Total 252 6,976,172 15,620,616 22,596,788 89,670
IWM (iShares Russell 2000 Index Fund) Open Interest and Dollar Volume (includes LEAPS® and FLEX®)
Month Call Put Total Call Put TotalJan 1,191,406 3,320,037 4,511,443 $106,162,418 $200,816,917 $306,979,335Feb 1,145,347 3,501,796 4,647,143 $84,175,148 $125,315,252 $209,490,400Mar 1,101,319 3,896,140 4,997,459 $88,428,534 $145,431,663 $233,860,197Apr 1,464,216 4,059,609 5,523,825 $63,801,830 $125,429,720 $189,231,550May 1,471,395 3,873,674 5,345,069 $48,149,883 $122,993,959 $171,143,842Jun 1,615,918 4,357,627 5,973,545 $68,293,364 $151,063,961 $219,357,325Jul 1,831,182 3,700,242 5,531,424 $81,030,706 $192,218,837 $273,249,543Aug 2,120,575 4,582,623 6,703,198 $70,728,827 $412,238,079 $482,966,906Sep 1,903,412 4,121,827 6,025,239 $64,518,157 $353,025,053 $417,543,210Oct 1,631,767 3,942,793 5,574,560 $60,975,687 $154,297,087 $215,272,774Nov 1,377,562 3,289,380 4,666,942 $60,207,614 $95,621,680 $155,829,294Dec 1,571,013 3,686,789 5,257,802 $64,063,796 $159,905,823 $223,969,619Total -- -- -- $860,535,964 $2,238,358,031 $3,098,893,995
Open Interest in Contracts
Contract Volume
Dollar Volume
Page 115

IWM (iShares Russell 2000 Index Fund) Average Premium Per Contract, Average Contracts Per Trade and Transactions (includes LEAPS® and FLEX®)
Month Call Put Total Call Put Total Call Put TotalJan $139 $135 $136 17 28 23 45,509 53,281 98,790Feb $140 $124 $130 20 27 24 29,496 36,758 66,254Mar $142 $121 $128 19 29 24 33,039 41,696 74,735Apr $101 $106 $104 22 28 26 28,361 42,907 71,268May $113 $123 $120 18 33 27 23,510 30,411 53,921Jun $124 $113 $116 19 34 27 29,442 39,539 68,981Jul $115 $136 $129 25 41 34 28,130 34,363 62,493Aug $110 $203 $180 22 44 35 28,857 46,696 75,553Sep $120 $195 $178 11 29 21 48,526 62,895 111,421Oct $125 $128 $127 18 32 26 27,170 37,070 64,240Nov $130 $111 $118 17 26 22 27,386 32,773 60,159Dec $121 $149 $140 23 40 32 23,279 26,908 50,187Total $123 $143 $137 19 32 26 372,705 485,297 858,002
Average Premium Per Contract Average Contracts Per Trade Transactions
Page 116

Other CBOE Exchange Traded Funds Contract Volume
Trading Average DailyMonth Days Call Put Total Volume
Jan 20 4,555,791 4,128,683 8,684,474 434,224Feb 19 3,705,383 3,675,429 7,380,812 388,464Mar 22 3,959,769 4,461,788 8,421,557 382,798Apr 21 4,394,387 3,816,916 8,211,303 391,014May 20 3,686,691 3,590,189 7,276,880 363,844Jun 22 4,146,797 3,830,108 7,976,905 362,587Jul 22 4,104,815 4,516,571 8,621,386 391,881Aug 21 4,403,717 4,785,391 9,189,108 437,577Sep 21 3,762,380 3,933,998 7,696,378 366,494Oct 22 4,028,333 3,251,382 7,279,715 330,896Nov 20 3,053,255 3,125,896 6,179,151 308,958Dec 22 4,509,294 3,446,045 7,955,339 361,606Total 252 48,310,612 46,562,396 94,873,008 376,480
Other CBOE Exchange Traded Funds Open Interest and Dollar Volume
Month Call Put Total Call Put TotalJan 17,586,667 19,841,592 37,428,259 $634,330,164 $579,808,184 $1,214,138,348Feb 19,272,565 22,082,376 41,354,941 $417,286,446 $375,957,437 $793,243,883Mar 19,285,784 23,952,403 43,238,187 $380,415,874 $469,574,145 $849,990,019Apr 22,911,750 26,191,502 49,103,252 $466,331,298 $404,286,417 $870,617,715May 23,452,537 27,323,230 50,775,767 $353,086,718 $384,129,915 $737,216,633Jun 22,533,990 23,830,418 46,364,408 $380,163,238 $420,187,136 $800,350,373Jul 25,123,170 26,671,262 51,794,432 $415,147,757 $699,763,171 $1,114,910,928Aug 28,225,082 31,267,483 59,492,565 $574,359,382 $762,719,491 $1,337,078,873Sep 28,005,075 30,386,015 58,391,090 $553,346,661 $561,090,865 $1,114,437,526Oct 29,839,624 30,804,658 60,644,282 $404,328,899 $456,346,679 $860,675,578Nov 30,477,413 30,913,857 61,391,270 $285,863,165 $357,004,889 $642,868,054Dec 29,246,308 28,325,180 57,571,488 $386,745,102 $502,659,058 $889,404,160Total -- -- -- $5,251,404,703 $5,973,527,386 $11,224,932,089
Contract Volume
Open Interest in Contracts Dollar Volume
Page 117
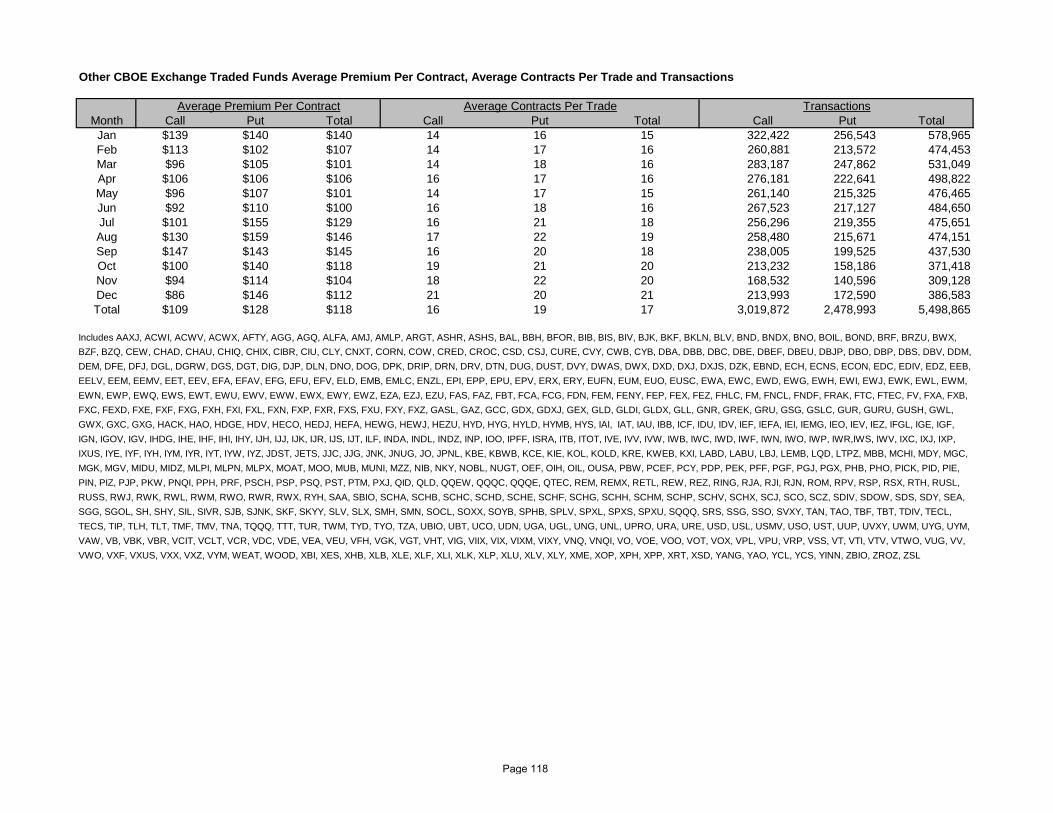
Other CBOE Exchange Traded Funds Average Premium Per Contract, Average Contracts Per Trade and Transactions
Month Call Put Total Call Put Total Call Put TotalJan $139 $140 $140 14 16 15 322,422 256,543 578,965Feb $113 $102 $107 14 17 16 260,881 213,572 474,453Mar $96 $105 $101 14 18 16 283,187 247,862 531,049Apr $106 $106 $106 16 17 16 276,181 222,641 498,822May $96 $107 $101 14 17 15 261,140 215,325 476,465Jun $92 $110 $100 16 18 16 267,523 217,127 484,650Jul $101 $155 $129 16 21 18 256,296 219,355 475,651Aug $130 $159 $146 17 22 19 258,480 215,671 474,151Sep $147 $143 $145 16 20 18 238,005 199,525 437,530Oct $100 $140 $118 19 21 20 213,232 158,186 371,418Nov $94 $114 $104 18 22 20 168,532 140,596 309,128Dec $86 $146 $112 21 20 21 213,993 172,590 386,583Total $109 $128 $118 16 19 17 3,019,872 2,478,993 5,498,865
Average Premium Per Contract Average Contracts Per Trade Transactions
Includes AAXJ, ACWI, ACWV, ACWX, AFTY, AGG, AGQ, ALFA, AMJ, AMLP, ARGT, ASHR, ASHS, BAL, BBH, BFOR, BIB, BIS, BIV, BJK, BKF, BKLN, BLV, BND, BNDX, BNO, BOIL, BOND, BRF, BRZU, BWX,
BZF, BZQ, CEW, CHAD, CHAU, CHIQ, CHIX, CIBR, CIU, CLY, CNXT, CORN, COW, CRED, CROC, CSD, CSJ, CURE, CVY, CWB, CYB, DBA, DBB, DBC, DBE, DBEF, DBEU, DBJP, DBO, DBP, DBS, DBV, DDM,
DEM, DFE, DFJ, DGL, DGRW, DGS, DGT, DIG, DJP, DLN, DNO, DOG, DPK, DRIP, DRN, DRV, DTN, DUG, DUST, DVY, DWAS, DWX, DXD, DXJ, DXJS, DZK, EBND, ECH, ECNS, ECON, EDC, EDIV, EDZ, EEB,
EELV, EEM, EEMV, EET, EEV, EFA, EFAV, EFG, EFU, EFV, ELD, EMB, EMLC, ENZL, EPI, EPP, EPU, EPV, ERX, ERY, EUFN, EUM, EUO, EUSC, EWA, EWC, EWD, EWG, EWH, EWI, EWJ, EWK, EWL, EWM,
EWN, EWP, EWQ, EWS, EWT, EWU, EWV, EWW, EWX, EWY, EWZ, EZA, EZJ, EZU, FAS, FAZ, FBT, FCA, FCG, FDN, FEM, FENY, FEP, FEX, FEZ, FHLC, FM, FNCL, FNDF, FRAK, FTC, FTEC, FV, FXA, FXB,
FXC, FEXD, FXE, FXF, FXG, FXH, FXI, FXL, FXN, FXP, FXR, FXS, FXU, FXY, FXZ, GASL, GAZ, GCC, GDX, GDXJ, GEX, GLD, GLDI, GLDX, GLL, GNR, GREK, GRU, GSG, GSLC, GUR, GURU, GUSH, GWL,
GWX, GXC, GXG, HACK, HAO, HDGE, HDV, HECO, HEDJ, HEFA, HEWG, HEWJ, HEZU, HYD, HYG, HYLD, HYMB, HYS, IAI, IAT, IAU, IBB, ICF, IDU, IDV, IEF, IEFA, IEI, IEMG, IEO, IEV, IEZ, IFGL, IGE, IGF,
IGN, IGOV, IGV, IHDG, IHE, IHF, IHI, IHY, IJH, IJJ, IJK, IJR, IJS, IJT, ILF, INDA, INDL, INDZ, INP, IOO, IPFF, ISRA, ITB, ITOT, IVE, IVV, IVW, IWB, IWC, IWD, IWF, IWN, IWO, IWP, IWR,IWS, IWV, IXC, IXJ, IXP,
IXUS, IYE, IYF, IYH, IYM, IYR, IYT, IYW, IYZ, JDST, JETS, JJC, JJG, JNK, JNUG, JO, JPNL, KBE, KBWB, KCE, KIE, KOL, KOLD, KRE, KWEB, KXI, LABD, LABU, LBJ, LEMB, LQD, LTPZ, MBB, MCHI, MDY, MGC,
MGK, MGV, MIDU, MIDZ, MLPI, MLPN, MLPX, MOAT, MOO, MUB, MUNI, MZZ, NIB, NKY, NOBL, NUGT, OEF, OIH, OIL, OUSA, PBW, PCEF, PCY, PDP, PEK, PFF, PGF, PGJ, PGX, PHB, PHO, PICK, PID, PIE,
PIN, PIZ, PJP, PKW, PNQI, PPH, PRF, PSCH, PSP, PSQ, PST, PTM, PXJ, QID, QLD, QQEW, QQQC, QQQE, QTEC, REM, REMX, RETL, REW, REZ, RING, RJA, RJI, RJN, ROM, RPV, RSP, RSX, RTH, RUSL,
RUSS, RWJ, RWK, RWL, RWM, RWO, RWR, RWX, RYH, SAA, SBIO, SCHA, SCHB, SCHC, SCHD, SCHE, SCHF, SCHG, SCHH, SCHM, SCHP, SCHV, SCHX, SCJ, SCO, SCZ, SDIV, SDOW, SDS, SDY, SEA,
SGG, SGOL, SH, SHY, SIL, SIVR, SJB, SJNK, SKF, SKYY, SLV, SLX, SMH, SMN, SOCL, SOXX, SOYB, SPHB, SPLV, SPXL, SPXS, SPXU, SQQQ, SRS, SSG, SSO, SVXY, TAN, TAO, TBF, TBT, TDIV, TECL,
TECS, TIP, TLH, TLT, TMF, TMV, TNA, TQQQ, TTT, TUR, TWM, TYD, TYO, TZA, UBIO, UBT, UCO, UDN, UGA, UGL, UNG, UNL, UPRO, URA, URE, USD, USL, USMV, USO, UST, UUP, UVXY, UWM, UYG, UYM,
VAW, VB, VBK, VBR, VCIT, VCLT, VCR, VDC, VDE, VEA, VEU, VFH, VGK, VGT, VHT, VIG, VIIX, VIX, VIXM, VIXY, VNQ, VNQI, VO, VOE, VOO, VOT, VOX, VPL, VPU, VRP, VSS, VT, VTI, VTV, VTWO, VUG, VV,
VWO, VXF, VXUS, VXX, VXZ, VYM, WEAT, WOOD, XBI, XES, XHB, XLB, XLE, XLF, XLI, XLK, XLP, XLU, XLV, XLY, XME, XOP, XPH, XPP, XRT, XSD, YANG, YAO, YCL, YCS, YINN, ZBIO, ZROZ, ZSL
Page 118

CBOE Other Exchange Traded Funds Contract Volume Detail
Month ALFA AMJ AMLP BBH BJK CIBR FBT FCG FDN FENY FHLC FNCL FTEC FV FXD FXGJan 14,064 3,077 1,207 37 623 53Feb 14,802 2,363 1,137 7 564 31 7Mar 21,387 2,213 1,804 2 151 54 12Apr 934 2,793 534 7 587 27 58May 2,719 687 630 236 3Jun 7,433 988 666 8 4 514 18 20Jul 11,562 4,293 932 41 888 523 659 15 8 5 4Aug 16,104 8,645 1,118 27 549 559 822 52 65 23 34 1,155 84 92Sep 28,118 9,907 932 65 483 431 3,241 12 36 4 1,388 64 88Oct 6,337 7,803 650 11 2 739 699 561 19 50 14 123 56 249Nov 6,164 6,440 340 3 501 425 1,108 11 24 5 54 458 11 163Dec 3 53,844 29,411 523 8 13 231 203 385 66 36 9 45 167 87 335Total 3 183,468 78,620 10,473 213 18 3,395 5,515 6,776 160 226 37 159 3,291 437 1,084
Month FXH FXL FXN FXR FXU FXZ GDX GDXJ GEX GLDX HACK HECO IAI IAT IBB ICFJan 20 63 317 20 321,475 30,883 15 6 3 27,839 446Feb 81 70 28 470 69 174,403 26,512 40 46 1 40,522 446Mar 673 110 106 593 1 218,753 21,997 1 46 72 41,407 271Apr 1,555 25 42 119 4 157,062 12,268 7 10 3 33,304 63May 2,396 55 25 212 109,466 7,847 24 12 27,283 261Jun 571 10 98 283 10 104,062 8,716 20 1,917 46 13 37,704 38Jul 933 19 3 161 6 56 220,392 14,017 2 100 13,546 33 93 51,586 88Aug 874 55 26 8 23 1 223,940 12,461 1 277 7,653 57 67 66,750 170Sep 5,901 15 18 218 86 167,462 19,131 84 1,904 4 6 33 57,529 113Oct 216 38 2 25 161,369 11,549 196 2,303 257 15 99,694 350Nov 43 34 10 38 2 3 167,054 10,656 78 1,262 36 15 44,370 87Dec 89 36 80 1 180,162 10,623 28 63 946 3 60 32,943 161Total 13,352 161 428 829 2,111 165 2,205,600 186,660 138 798 29,531 4 558 375 560,931 2,494
Month IDU IEO IEZ IGE IGN IGV IHE IHF IHI ITB IXJ IYE IYF IYH IYM IYRJan 356 94 246 1 11 18 27,069 807 46 281 101 66,556Feb 486 193 337 2 23 36 159 21,018 326 52 290 21 95,465Mar 512 141 87 48 189 10,185 236 50 378 19 112,061Apr 136 226 338 18 45 498 8,536 110 16 224 6 78,319May 134 288 195 24 66 270 2,860 80 64 145 14 172,891Jun 361 151 74 25 116 1,096 9,380 162 264 350 37 193,495Jul 169 378 171 22 133 27 1,700 7,204 98 145 359 80 77,286Aug 77 437 648 1 46 45 12 627 7 10,547 1 348 95 487 170 41,984Sep 29 305 43 10 60 43 71 330 15 9,399 13 313 32 361 58 67,113Oct 29 1,260 139 11 19 59 232 257 31 17,883 62 228 10 464 67 111,697Nov 62 236 1,698 30 12 41 98 255 29 13,213 5 419 181 148 42 173,547Dec 105 360 377 12 2 22 39 211 461 3,648 92 52 188 117 166 176,420Total 2,456 4,069 4,353 156 306 548 452 5,610 543 140,942 173 3,179 1,143 3,604 781 1,366,834
DOMESTIC SECTOR
Page 119

Month IYT IYW IYZ KBE KBWB KCE KIE KOL KRE MLPI MLPN MLPX MOAT MOO OIH PBWJan 2,633 253 48 734 16 22 7 505 6,020 16 118 218 61,490 4Feb 1,672 454 9 1,557 20 22 20 117 16,054 53 25 172 40,612 26Mar 1,940 94 8 685 1 22 23 118 13,064 13 21 240 24,320 14Apr 1,838 350 16 88 12 23 366 9,735 5 62 199 48,681May 11,269 113 50 1,675 1 26 50 9,837 33 62 447 36,967 25Jun 7,221 522 16 1,721 104 1 46 249 16,783 2 321 18,855 19Jul 2,039 560 65 414 28 28 64 954 6,532 30 110 14 139 51,466 47Aug 1,475 551 321 860 27 76 8 826 39,293 47 60 30 26 57 32,561 61Sep 1,031 495 292 33 19 11 154 11,752 88 17 13 30 159 55,607Oct 5,918 1,598 1 263 29 89 53 20 28,452 132 1 47 13 47,807Nov 1,630 890 165 250 4 17 18,467 31 20 9 45 4 34,025Dec 1,963 974 260 2,638 11 2 54 30 9,386 1,404 129 58 30 36,684 113Total 40,629 6,854 959 11,177 274 293 352 3,389 185,375 1,702 247 582 220 1,999 489,075 309
Month PDP PHO PJP PNQI PPH PSCH PXJ REMX REZ RTH RWR RWX RYH SBIO SCHH SEAJan 4 182 31 132 12 84 719 102 90 171 636Feb 27 354 105 15 119 585 260 376 76 230Mar 178 385 196 14 274 247 333 17 39 402Apr 451 557 47 42 2 77 90 180 3 99 1,080May 53 336 98 28 20 61 197 55 67 196Jun 87 490 155 22 80 324 440 115 65 38 324Jul 147 333 23 95 34 405 147 84 18 65 230Aug 8 97 414 66 69 88 388 129 136 368 45 218Sep 28 32 413 11 139 3 11 8 244 78 139 2 120 174 34 23Oct 12 19 415 22 133 62 34 97 39 45 409 80Nov 29 310 38 43 1 156 38 42 28 18 157 63Dec 10 47 282 45 38 35 5 151 626 963 15 120 198 17Total 87 1,142 4,471 837 422 39 447 141 2,304 3,194 2,648 1,061 198 860 975 3,356
Month SIL SKYY SLX SMH SOCL SOXX TAN TDIV UBIO VAW VCR VDC VDE VFH VGT VHTJan 2,591 1 52 21,283 74 31 529 212 351 124 485 182 1,201 156Feb 266 21 43 120,224 154 20 837 73 143 82 545 109 605 183Mar 376 2 20 23,305 119 958 864 55 60 119 521 76 476 520Apr 347 102 40,726 73 82 1,090 36 33 134 402 136 513 417May 566 2 297 21,164 630 119 768 53 228 69 170 117 378 376Jun 265 2 114 23,781 24 468 434 116 145 392 300 88 372 716Jul 154 74 21,689 230 314 297 78 165 81 686 877 210 249 341Aug 153 14 22 33,301 158 1,196 139 20 1,304 47 67 128 602 172 371 752Sep 261 37 13,614 283 1,404 117 11 1,399 46 265 99 463 98 489 917Oct 330 10 64 31,212 269 33 161 3,158 40 328 78 182 19 344 376Nov 333 49 21 7,512 156 135 1 1,912 7 69 74 193 70 136 96Dec 6 40 59 14,087 91 248 417 531 47 133 158 358 19 134 312Total 5,648 141 905 371,898 2,261 4,873 5,788 32 8,382 897 1,903 2,143 5,098 1,296 5,268 5,162
DOMESTIC SECTOR (Continued)
Page 120
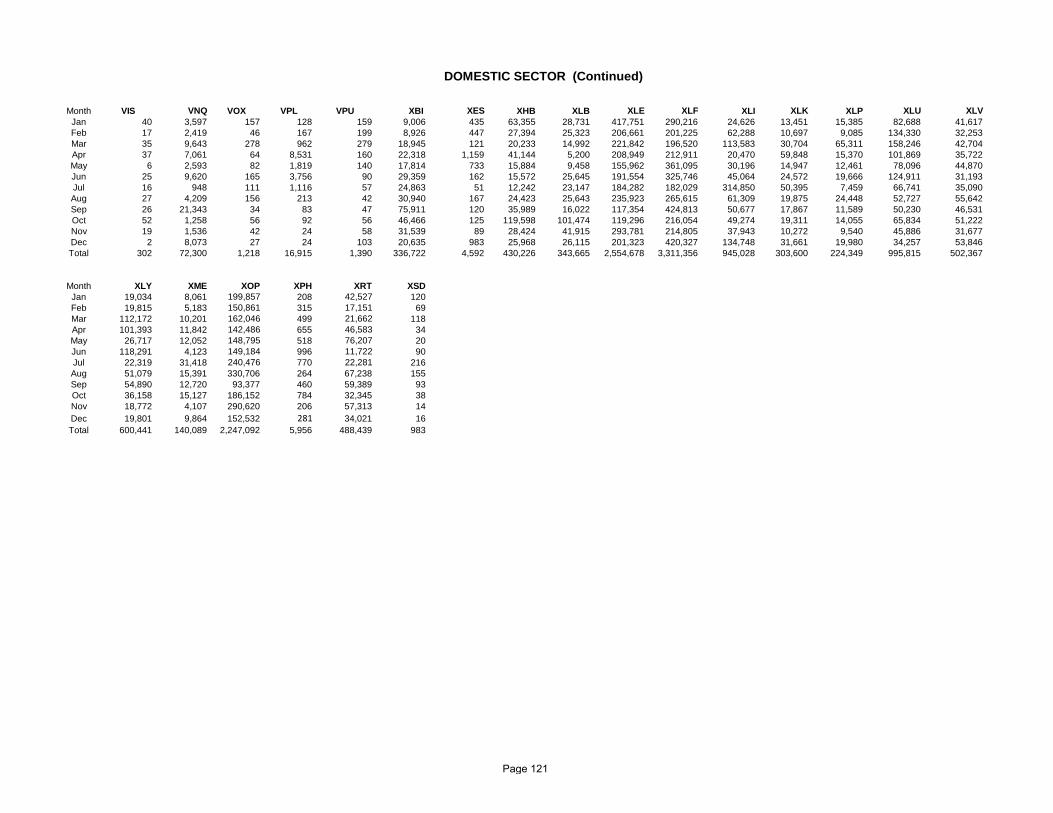
Month VIS VNQ VOX VPL VPU XBI XES XHB XLB XLE XLF XLI XLK XLP XLU XLVJan 40 3,597 157 128 159 9,006 435 63,355 28,731 417,751 290,216 24,626 13,451 15,385 82,688 41,617Feb 17 2,419 46 167 199 8,926 447 27,394 25,323 206,661 201,225 62,288 10,697 9,085 134,330 32,253Mar 35 9,643 278 962 279 18,945 121 20,233 14,992 221,842 196,520 113,583 30,704 65,311 158,246 42,704Apr 37 7,061 64 8,531 160 22,318 1,159 41,144 5,200 208,949 212,911 20,470 59,848 15,370 101,869 35,722May 6 2,593 82 1,819 140 17,814 733 15,884 9,458 155,962 361,095 30,196 14,947 12,461 78,096 44,870Jun 25 9,620 165 3,756 90 29,359 162 15,572 25,645 191,554 325,746 45,064 24,572 19,666 124,911 31,193Jul 16 948 111 1,116 57 24,863 51 12,242 23,147 184,282 182,029 314,850 50,395 7,459 66,741 35,090Aug 27 4,209 156 213 42 30,940 167 24,423 25,643 235,923 265,615 61,309 19,875 24,448 52,727 55,642Sep 26 21,343 34 83 47 75,911 120 35,989 16,022 117,354 424,813 50,677 17,867 11,589 50,230 46,531Oct 52 1,258 56 92 56 46,466 125 119,598 101,474 119,296 216,054 49,274 19,311 14,055 65,834 51,222Nov 19 1,536 42 24 58 31,539 89 28,424 41,915 293,781 214,805 37,943 10,272 9,540 45,886 31,677Dec 2 8,073 27 24 103 20,635 983 25,968 26,115 201,323 420,327 134,748 31,661 19,980 34,257 53,846Total 302 72,300 1,218 16,915 1,390 336,722 4,592 430,226 343,665 2,554,678 3,311,356 945,028 303,600 224,349 995,815 502,367
Month XLY XME XOP XPH XRT XSDJan 19,034 8,061 199,857 208 42,527 120Feb 19,815 5,183 150,861 315 17,151 69Mar 112,172 10,201 162,046 499 21,662 118Apr 101,393 11,842 142,486 655 46,583 34May 26,717 12,052 148,795 518 76,207 20Jun 118,291 4,123 149,184 996 11,722 90Jul 22,319 31,418 240,476 770 22,281 216Aug 51,079 15,391 330,706 264 67,238 155Sep 54,890 12,720 93,377 460 59,389 93Oct 36,158 15,127 186,152 784 32,345 38Nov 18,772 4,107 290,620 206 57,313 14Dec 19,801 9,864 152,532 281 34,021 16Total 600,441 140,089 2,247,092 5,956 488,439 983
DOMESTIC SECTOR (Continued)
Page 121
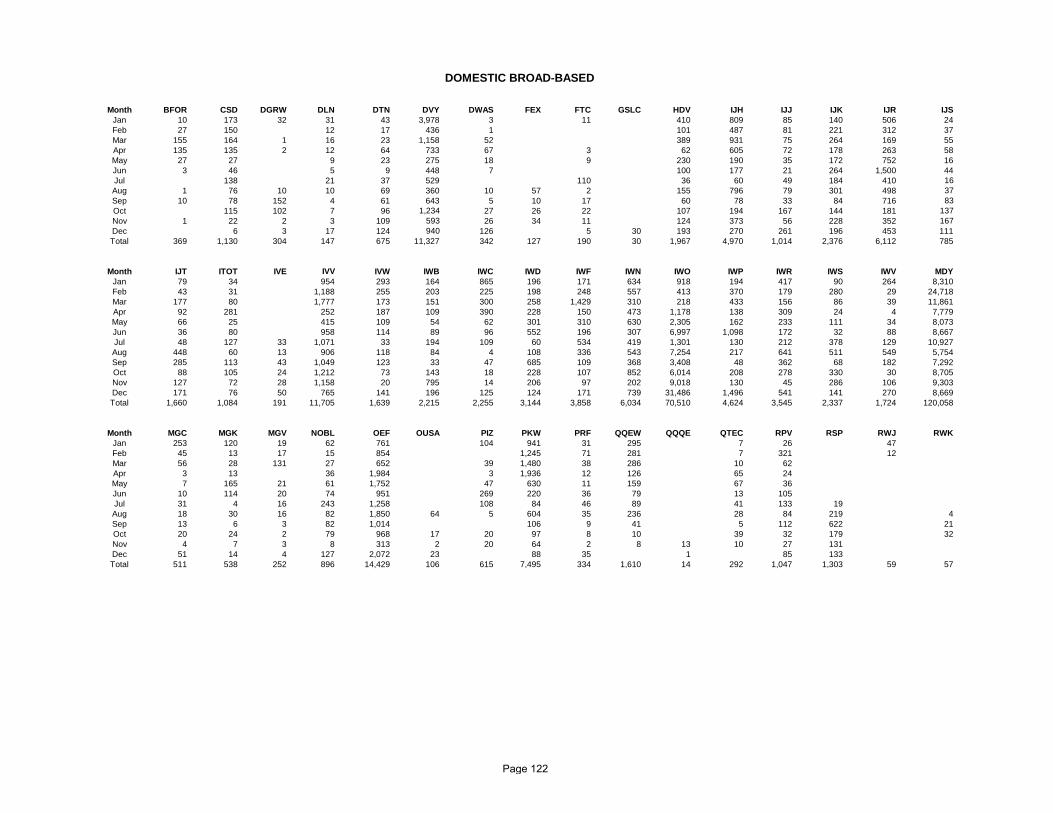
Month BFOR CSD DGRW DLN DTN DVY DWAS FEX FTC GSLC HDV IJH IJJ IJK IJR IJSJan 10 173 32 31 43 3,978 3 11 410 809 85 140 506 24Feb 27 150 12 17 436 1 101 487 81 221 312 37Mar 155 164 1 16 23 1,158 52 389 931 75 264 169 55Apr 135 135 2 12 64 733 67 3 62 605 72 178 263 58May 27 27 9 23 275 18 9 230 190 35 172 752 16Jun 3 46 5 9 448 7 100 177 21 264 1,500 44Jul 138 21 37 529 110 36 60 49 184 410 16Aug 1 76 10 10 69 360 10 57 2 155 796 79 301 498 37Sep 10 78 152 4 61 643 5 10 17 60 78 33 84 716 83Oct 115 102 7 96 1,234 27 26 22 107 194 167 144 181 137Nov 1 22 2 3 109 593 26 34 11 124 373 56 228 352 167Dec 6 3 17 124 940 126 5 30 193 270 261 196 453 111Total 369 1,130 304 147 675 11,327 342 127 190 30 1,967 4,970 1,014 2,376 6,112 785
Month IJT ITOT IVE IVV IVW IWB IWC IWD IWF IWN IWO IWP IWR IWS IWV MDYJan 79 34 954 293 164 865 196 171 634 918 194 417 90 264 8,310Feb 43 31 1,188 255 203 225 198 248 557 413 370 179 280 29 24,718Mar 177 80 1,777 173 151 300 258 1,429 310 218 433 156 86 39 11,861Apr 92 281 252 187 109 390 228 150 473 1,178 138 309 24 4 7,779May 66 25 415 109 54 62 301 310 630 2,305 162 233 111 34 8,073Jun 36 80 958 114 89 96 552 196 307 6,997 1,098 172 32 88 8,667Jul 48 127 33 1,071 33 194 109 60 534 419 1,301 130 212 378 129 10,927Aug 448 60 13 906 118 84 4 108 336 543 7,254 217 641 511 549 5,754Sep 285 113 43 1,049 123 33 47 685 109 368 3,408 48 362 68 182 7,292Oct 88 105 24 1,212 73 143 18 228 107 852 6,014 208 278 330 30 8,705Nov 127 72 28 1,158 20 795 14 206 97 202 9,018 130 45 286 106 9,303Dec 171 76 50 765 141 196 125 124 171 739 31,486 1,496 541 141 270 8,669Total 1,660 1,084 191 11,705 1,639 2,215 2,255 3,144 3,858 6,034 70,510 4,624 3,545 2,337 1,724 120,058
Month MGC MGK MGV NOBL OEF OUSA PIZ PKW PRF QQEW QQQE QTEC RPV RSP RWJ RWKJan 253 120 19 62 761 104 941 31 295 7 26 47Feb 45 13 17 15 854 1,245 71 281 7 321 12Mar 56 28 131 27 652 39 1,480 38 286 10 62Apr 3 13 36 1,984 3 1,936 12 126 65 24May 7 165 21 61 1,752 47 630 11 159 67 36Jun 10 114 20 74 951 269 220 36 79 13 105Jul 31 4 16 243 1,258 108 84 46 89 41 133 19Aug 18 30 16 82 1,850 64 5 604 35 236 28 84 219 4Sep 13 6 3 82 1,014 106 9 41 5 112 622 21Oct 20 24 2 79 968 17 20 97 8 10 39 32 179 32Nov 4 7 3 8 313 2 20 64 2 8 13 10 27 131Dec 51 14 4 127 2,072 23 88 35 1 85 133Total 511 538 252 896 14,429 106 615 7,495 334 1,610 14 292 1,047 1,303 59 57
DOMESTIC BROAD-BASED
Page 122

Month RWL SCHA SCHB SCHD SCHG SCHM SCHV SCHX SDIV SDY SPHB SPLV USMV VB VBK VBRJan 11 83 286 206 117 14 3 72 377 206 14 167 68 172 172 46Feb 6 48 141 110 20 36 11 148 458 111 160 50 95 131 69Mar 5 147 199 166 11 41 10 81 463 140 6 480 50 226 218 21Apr 75 205 79 456 16 169 36 4 343 1,223 1 275 74 64 46 16May 46 56 24 218 16 16 6 55 538 607 6 100 36 41 70 10Jun 16 47 40 481 77 143 40 17 688 206 144 559 36 127 141 117Jul 1 92 84 229 43 7 17 2 718 261 92 275 287 846 70 46Aug 36 111 170 341 30 142 15 88 523 178 34 765 2,628 1,232 391 44Sep 77 71 167 225 9 36 263 478 16 353 2,352 1,233 84 30Oct 71 9 151 49 92 12 29 40 294 520 20 135 83 82 59 10Nov 3 67 113 92 23 3 8 30 60 380 1 256 13 198 35 73Dec 57 159 84 91 10 8 51 493 455 11 490 403 371 154 198Total 270 999 1,517 2,599 761 602 183 624 5,218 4,765 345 4,015 6,080 4,687 1,571 680
Month VIG VIIX VIXM VIXY VO VOE VOO VOT VTI VTV VTWO VUG VV VXF VXX VXZ VYMJan 558 183 276 2,898 479 101 1,431 52 1,113 145 52 138 401 74 1,835,956 633 295Feb 235 166 309 1,768 117 42 385 93 890 146 25 384 223 70 1,497,098 248 197Mar 165 69 482 1,336 180 175 461 52 737 100 35 790 365 37 1,477,872 149 518Apr 109 2,053 58 1,727 86 52 408 29 282 93 21 113 81 84 1,417,845 726 90May 356 71 176 1,803 45 37 198 74 211 87 12 178 80 3 1,287,370 459 119Jun 287 113 253 2,395 37 56 697 18 906 88 26 395 114 130 1,927,453 145 266Jul 132 241 522 2,191 133 104 396 47 801 68 8 685 6 11 1,943,855 230 493Aug 336 544 764 3,924 292 112 3,944 43 1,033 92 11 345 100 27 2,548,108 218 544Sep 91 31 762 2,321 167 82 528 43 928 36 30 52 30 91 2,352,682 101 166Oct 190 60 223 1,946 223 60 219 47 1,442 73 37 191 119 5 1,638,122 2,106 140Nov 182 106 117 1,091 84 5 354 31 669 43 82 320 2 1,160,683 83 50Dec 262 269 785 1,979 74 54 331 67 914 79 5 263 219 58 1,637,076 146 58Total 2,903 3,906 4,727 25,379 1,917 880 9,352 596 9,926 1,050 262 3,616 2,058 592 20,724,120 5,244 2,936
DOMESTIC BROAD-BASED (Continued)
Page 123
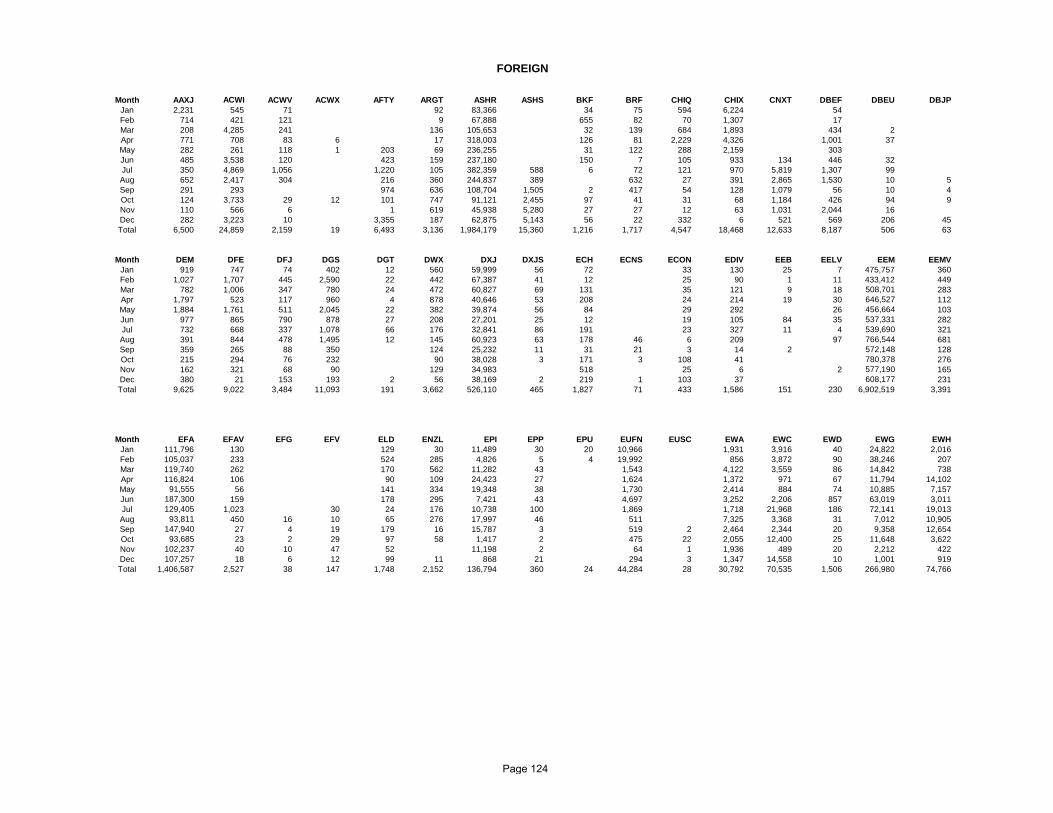
Month AAXJ ACWI ACWV ACWX AFTY ARGT ASHR ASHS BKF BRF CHIQ CHIX CNXT DBEF DBEU DBJPJan 2,231 545 71 92 83,366 34 75 594 6,224 54Feb 714 421 121 9 67,888 655 82 70 1,307 17Mar 208 4,285 241 136 105,653 32 139 684 1,893 434 2Apr 771 708 83 6 17 318,003 126 81 2,229 4,326 1,001 37May 282 261 118 1 203 69 236,255 31 122 288 2,159 303Jun 485 3,538 120 423 159 237,180 150 7 105 933 134 446 32Jul 350 4,869 1,056 1,220 105 382,359 588 6 72 121 970 5,819 1,307 99Aug 652 2,417 304 216 360 244,837 389 632 27 391 2,865 1,530 10 5Sep 291 293 974 636 108,704 1,505 2 417 54 128 1,079 56 10 4Oct 124 3,733 29 12 101 747 91,121 2,455 97 41 31 68 1,184 426 94 9Nov 110 566 6 1 619 45,938 5,280 27 27 12 63 1,031 2,044 16Dec 282 3,223 10 3,355 187 62,875 5,143 56 22 332 6 521 569 206 45Total 6,500 24,859 2,159 19 6,493 3,136 1,984,179 15,360 1,216 1,717 4,547 18,468 12,633 8,187 506 63
Month DEM DFE DFJ DGS DGT DWX DXJ DXJS ECH ECNS ECON EDIV EEB EELV EEM EEMVJan 919 747 74 402 12 560 59,999 56 72 33 130 25 7 475,757 360Feb 1,027 1,707 445 2,590 22 442 67,387 41 12 25 90 1 11 433,412 449Mar 782 1,006 347 780 24 472 60,827 69 131 35 121 9 18 508,701 283Apr 1,797 523 117 960 4 878 40,646 53 208 24 214 19 30 646,527 112May 1,884 1,761 511 2,045 22 382 39,874 56 84 29 292 26 456,664 103Jun 977 865 790 878 27 208 27,201 25 12 19 105 84 35 537,331 282Jul 732 668 337 1,078 66 176 32,841 86 191 23 327 11 4 539,690 321Aug 391 844 478 1,495 12 145 60,923 63 178 46 6 209 97 766,544 681Sep 359 265 88 350 124 25,232 11 31 21 3 14 2 572,148 128Oct 215 294 76 232 90 38,028 3 171 3 108 41 780,378 276Nov 162 321 68 90 129 34,983 518 25 6 2 577,190 165Dec 380 21 153 193 2 56 38,169 2 219 1 103 37 608,177 231Total 9,625 9,022 3,484 11,093 191 3,662 526,110 465 1,827 71 433 1,586 151 230 6,902,519 3,391
Month EFA EFAV EFG EFV ELD ENZL EPI EPP EPU EUFN EUSC EWA EWC EWD EWG EWHJan 111,796 130 129 30 11,489 30 20 10,966 1,931 3,916 40 24,822 2,016Feb 105,037 233 524 285 4,826 5 4 19,992 856 3,872 90 38,246 207Mar 119,740 262 170 562 11,282 43 1,543 4,122 3,559 86 14,842 738Apr 116,824 106 90 109 24,423 27 1,624 1,372 971 67 11,794 14,102May 91,555 56 141 334 19,348 38 1,730 2,414 884 74 10,885 7,157Jun 187,300 159 178 295 7,421 43 4,697 3,252 2,206 857 63,019 3,011Jul 129,405 1,023 30 24 176 10,738 100 1,869 1,718 21,968 186 72,141 19,013Aug 93,811 450 16 10 65 276 17,997 46 511 7,325 3,368 31 7,012 10,905Sep 147,940 27 4 19 179 16 15,787 3 519 2 2,464 2,344 20 9,358 12,654Oct 93,685 23 2 29 97 58 1,417 2 475 22 2,055 12,400 25 11,648 3,622Nov 102,237 40 10 47 52 11,198 2 64 1 1,936 489 20 2,212 422Dec 107,257 18 6 12 99 11 868 21 294 3 1,347 14,558 10 1,001 919Total 1,406,587 2,527 38 147 1,748 2,152 136,794 360 24 44,284 28 30,792 70,535 1,506 266,980 74,766
FOREIGN
Page 124

Month EWI EWJ EWK EWL EWM EWN EWP EWQ EWS EWT EWU EWW EWX EWY EWZ EZAJan 15,183 39,173 265 793 75 131 5,498 1,255 18 3,211 440 28,571 5 6,626 119,501 855Feb 2,037 63,184 208 194 6 29 4,826 1,986 122 3,312 234 82,915 56 3,828 153,694 654Mar 1,393 43,754 108 386 139 248 3,230 865 106 3,328 491 95,963 37 5,361 236,299 835Apr 1,266 41,701 40 226 114 53 2,418 1,771 653 12,291 1,319 31,674 18 7,121 274,286 932May 1,623 28,191 6 102 151 101 2,484 1,652 180 1,805 12,028 13,661 29 5,479 162,502 517Jun 1,133 35,373 466 428 410 58 8,136 887 117 2,666 670 28,815 28 6,672 115,334 329Jul 1,191 19,969 487 1,288 1,721 176 9,482 1,065 48 994 1,392 26,859 42 5,088 176,004 604Aug 1,016 85,073 145 44 6,821 227 5,736 470 92 6,394 372 25,561 26 16,145 149,375 1,388Sep 415 60,631 33 402 2 2,858 478 110 2,036 2,102 15,859 23 11,598 154,316 354Oct 1,321 13,393 7 379 36 1,107 339 33 1,227 139 4,674 34 11,915 298,108 441Nov 171 83,709 116 2 4,517 2 1,725 203 34 4,984 123 4,297 121 5,137 250,684 425Dec 305 22,628 124 8 4,769 4 546 418 5 21,069 78 15,776 11 4,590 519,528 406Total 27,054 536,779 1,965 3,511 19,504 1,067 48,046 11,389 1,518 63,317 19,388 374,625 430 89,560 2,609,631 7,740
Month EZU FCA FEM FEP FEZ FM FNDF FXI GNR GREK GUR GURU GWL GWX GXC GXGJan 7,230 2 29 16,587 239,531 132 16,598 180 30 33 105 196Feb 9,537 2 5 28,150 125,099 76 31,562 113 25 96 42 118 228Mar 2,556 67 27 15,284 214,957 116 14,569 232 13 20 58 271 1,218Apr 1,720 20 1 18,889 587,775 55 21,829 90 7 83 716 2,042May 2,564 175 21,510 437,159 39 13,059 152 10 7 167 2,004Jun 3,999 180 52 32,605 327,955 149 74,753 129 102 134 53 729 806Jul 2,729 10 25,067 516,108 140 73,773 36 14 90 424 688Aug 1,553 1 3 60 7,998 327,149 30 17,672 7 28 60 26 369 1,285Sep 984 1 5 47 7,236 2 19 339,344 30 7,964 4 15 158 1 244 221Oct 506 11 14 5,878 1,132 13 324,509 31 2,307 1 30 60 1 5,975 211Nov 412 18 1,635 910 118,778 21 1,682 3 23 380Dec 748 2 394 535 124,845 22 1,151 62 285Total 34,538 12 483 237 181,233 2,579 32 3,683,209 841 276,919 947 274 618 304 9,203 9,564
Month HAO HEDJ HEFA HEWG HEWJ HEZU IDV IEFA IEMG IEV IFGL IGF IHDG ILF INDA INPJan 295 17,892 1,627 108 1,229 3,977 11 1 152 1,108 64Feb 83 25,799 633 90 310 4,147 70 78 1,294 33Mar 347 55,420 74 583 95 576 3,017 37 5 224 1,726 19Apr 5,252 64,156 10 834 74 471 2,583 128 4,980 1May 1,711 53,843 8 593 335 1,688 3,554 59 121 2,483Jun 4,176 93,173 59 57 10 672 384 1,094 1,300 132 150 135 1,873 21Jul 4,856 58,582 6 291 101 171 748 390 377 3,670 73 34 96 1,003 35Aug 1,148 19,812 316 150 88 87 191 87 572 691 38 111 195 1,204 126Sep 1,081 11,841 20 864 100 157 178 155 705 252 12 124 276 414 5Oct 566 12,035 30 120 73 137 366 259 134 362 32 147 8 381 20Nov 14,665 182 127 146 228 93 250 215 63 28 93 169 21Dec 41 13,419 91 362 132 60 206 57 247 170 15 50 3 205 221 5Total 19,556 440,637 614 2,026 621 768 6,859 2,127 7,653 23,938 542 650 3 1,711 16,856 350
FOREIGN (Continued)
Page 125

Month IOO ISRA IXC IXP IXUS JETS KWEB KXI MCHI NKY PEK PGJ PICK PID PIE PINJan 107 149 72 118 35 15 230 131 20 19 118 4 507Feb 108 62 45 35 111 13 270 449 86 16 17 1,387Mar 85 256 37 43 45 722 527 103 186 14 640Apr 44 98 97 36 54 8,887 985 18 11 490 93 960May 53 665 66 29 72 131 3,270 618 40 1 333 57 357Jun 56 185 35 77 42 244 3,127 475 79 3 316 85 129Jul 107 1,693 39 23 30 169 4,747 10,743 1,123 34 77 20 498 22 40Aug 252 890 440 67 27 319 657 4,721 310 72 95 14 191 7 10Sep 58 1,348 49 12 193 103 2,182 345 43 12 292 98 2Oct 79 24 88 8 183 311 618 51 25 4 323 24 27 21Nov 68 10 2 186 361 92 5 14 5 144 8 80 20Dec 2 280 115 59 14 234 85 89 53 41 70 54 16 14 16Total 951 5,650 1,151 517 432 1,659 6,264 28 34,951 5,072 229 609 897 2,295 403 4,089
Month PSP QQQC RING RSX RWO SCHC SCHE SCHF SCJ SCZ TAO TUR VEA VEU VGK VNQIJan 27 130 92,234 239 68 26 134 592 2,448 1,162 1,368 12,415 82Feb 30 107 149,229 313 102 3 59 273 1,230 581 444 9,356 19Mar 9 56,477 5 2 65 78 132 824 1,701 926 720 9,832 12Apr 2 136 68,219 4 19 128 220 721 63 984 5,182 348 904 5,743 148May 6 9 23,587 4 54 62 142 3 144 1,183 1,591 748 239 7,871 33Jun 23 102 24,010 1 9 105 148 128 321 530 3,321 1,527 777 8,596 79Jul 34 2 146 38,444 15 19 180 67 45 117 584 1,155 694 821 7,118 115Aug 3 12 161 29,556 14 9 468 194 5 170 615 10,135 284 361 3,674 216Sep 1 7 44 30,326 6 14 134 103 209 440 197 815 657 146Oct 7 49 10,609 9 219 228 11 202 20 1,498 71 349 2,122 109Nov 2 5 22 14,365 2 97 18 85 114 45 943 63 356 2,001 85Dec 3 10 5 30,442 5 3 93 31 40 191 30 9,644 85 531 1,247 151Total 138 36 920 567,498 63 117 1,983 1,430 1,067 1,750 5,889 39,288 6,686 7,685 70,632 1,195
Month VSS VT VWO VXUS WOOD YAOJan 97 1,863 2,586 260 20Feb 109 502 1,672 175 61 27Mar 138 777 4,190 446 10Apr 69 1,792 3,617 257 13 289May 62 697 2,968 201 20 174Jun 192 1,814 4,033 576 220Jul 31 6,161 1,634 463 49 76Aug 72 3,584 2,579 466 14 89Sep 33 1,128 3,228 161 46Oct 22 637 3,590 647 9 11Nov 62 422 2,578 117 3Dec 11 438 1,355 813 2Total 898 19,815 34,030 4,582 196 937
FOREIGN (Continued)
Page 126
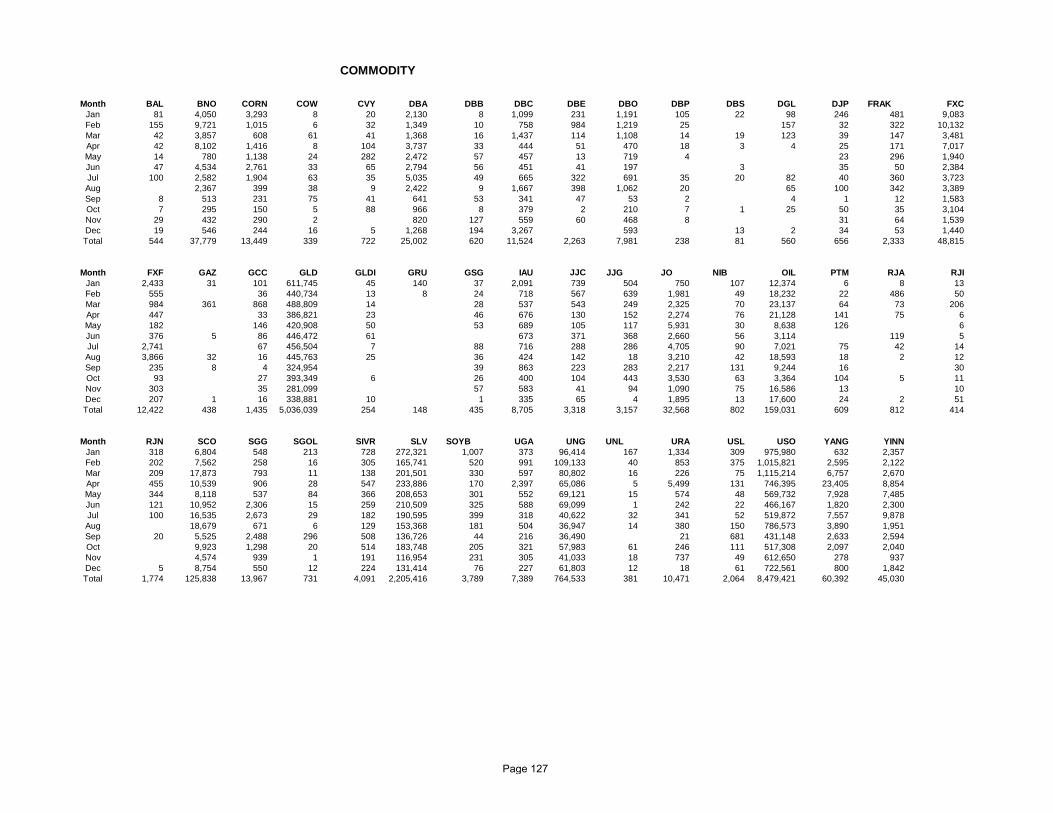
Month BAL BNO CORN COW CVY DBA DBB DBC DBE DBO DBP DBS DGL DJP FRAK FXCJan 81 4,050 3,293 8 20 2,130 8 1,099 231 1,191 105 22 98 246 481 9,083Feb 155 9,721 1,015 6 32 1,349 10 758 984 1,219 25 157 32 322 10,132Mar 42 3,857 608 61 41 1,368 16 1,437 114 1,108 14 19 123 39 147 3,481Apr 42 8,102 1,416 8 104 3,737 33 444 51 470 18 3 4 25 171 7,017May 14 780 1,138 24 282 2,472 57 457 13 719 4 23 296 1,940Jun 47 4,534 2,761 33 65 2,794 56 451 41 197 3 35 50 2,384Jul 100 2,582 1,904 63 35 5,035 49 665 322 691 35 20 82 40 360 3,723Aug 2,367 399 38 9 2,422 9 1,667 398 1,062 20 65 100 342 3,389Sep 8 513 231 75 41 641 53 341 47 53 2 4 1 12 1,583Oct 7 295 150 5 88 966 8 379 2 210 7 1 25 50 35 3,104Nov 29 432 290 2 820 127 559 60 468 8 31 64 1,539Dec 19 546 244 16 5 1,268 194 3,267 593 13 2 34 53 1,440Total 544 37,779 13,449 339 722 25,002 620 11,524 2,263 7,981 238 81 560 656 2,333 48,815
Month FXF GAZ GCC GLD GLDI GRU GSG IAU JJC JJG JO NIB OIL PTM RJA RJIJan 2,433 31 101 611,745 45 140 37 2,091 739 504 750 107 12,374 6 8 13Feb 555 36 440,734 13 8 24 718 567 639 1,981 49 18,232 22 486 50Mar 984 361 868 488,809 14 28 537 543 249 2,325 70 23,137 64 73 206Apr 447 33 386,821 23 46 676 130 152 2,274 76 21,128 141 75 6May 182 146 420,908 50 53 689 105 117 5,931 30 8,638 126 6Jun 376 5 86 446,472 61 673 371 368 2,660 56 3,114 119 5Jul 2,741 67 456,504 7 88 716 288 286 4,705 90 7,021 75 42 14Aug 3,866 32 16 445,763 25 36 424 142 18 3,210 42 18,593 18 2 12Sep 235 8 4 324,954 39 863 223 283 2,217 131 9,244 16 30Oct 93 27 393,349 6 26 400 104 443 3,530 63 3,364 104 5 11Nov 303 35 281,099 57 583 41 94 1,090 75 16,586 13 10Dec 207 1 16 338,881 10 1 335 65 4 1,895 13 17,600 24 2 51Total 12,422 438 1,435 5,036,039 254 148 435 8,705 3,318 3,157 32,568 802 159,031 609 812 414
Month RJN SCO SGG SGOL SIVR SLV SOYB UGA UNG UNL URA USL USO YANG YINNJan 318 6,804 548 213 728 272,321 1,007 373 96,414 167 1,334 309 975,980 632 2,357Feb 202 7,562 258 16 305 165,741 520 991 109,133 40 853 375 1,015,821 2,595 2,122Mar 209 17,873 793 11 138 201,501 330 597 80,802 16 226 75 1,115,214 6,757 2,670Apr 455 10,539 906 28 547 233,886 170 2,397 65,086 5 5,499 131 746,395 23,405 8,854May 344 8,118 537 84 366 208,653 301 552 69,121 15 574 48 569,732 7,928 7,485Jun 121 10,952 2,306 15 259 210,509 325 588 69,099 1 242 22 466,167 1,820 2,300Jul 100 16,535 2,673 29 182 190,595 399 318 40,622 32 341 52 519,872 7,557 9,878Aug 18,679 671 6 129 153,368 181 504 36,947 14 380 150 786,573 3,890 1,951Sep 20 5,525 2,488 296 508 136,726 44 216 36,490 21 681 431,148 2,633 2,594Oct 9,923 1,298 20 514 183,748 205 321 57,983 61 246 111 517,308 2,097 2,040Nov 4,574 939 1 191 116,954 231 305 41,033 18 737 49 612,650 278 937Dec 5 8,754 550 12 224 131,414 76 227 61,803 12 18 61 722,561 800 1,842Total 1,774 125,838 13,967 731 4,091 2,205,416 3,789 7,389 764,533 381 10,471 2,064 8,479,421 60,392 45,030
COMMODITY
Page 127
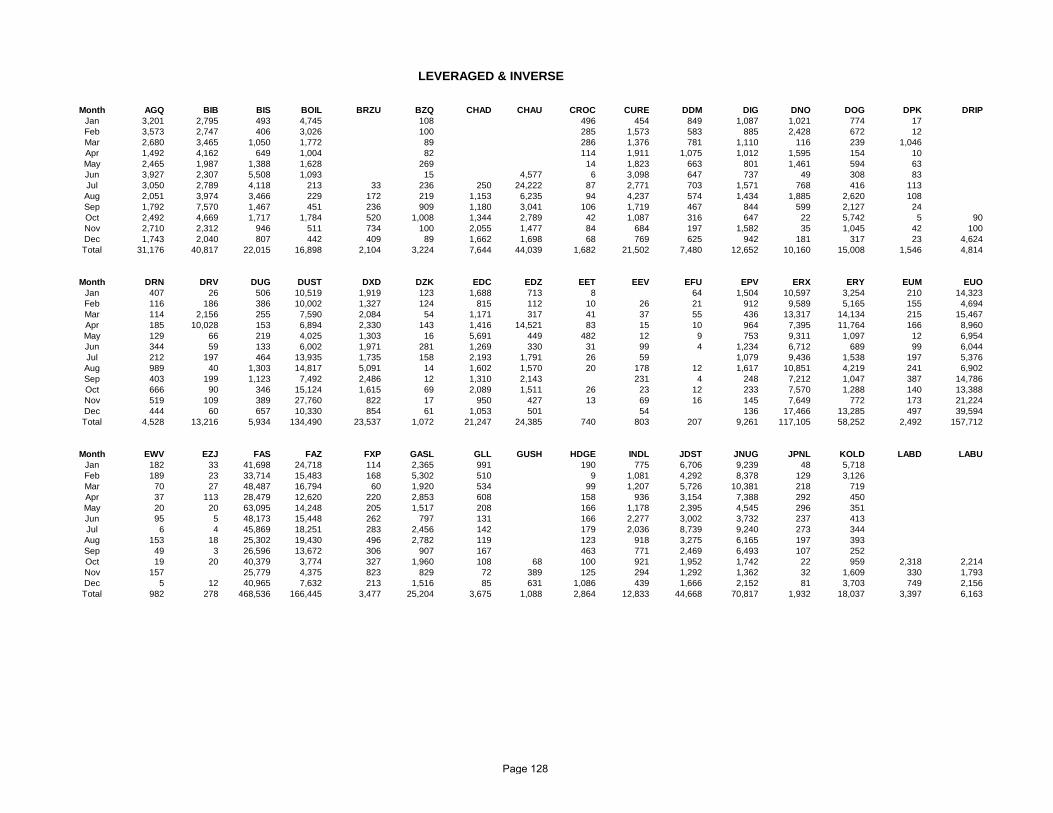
Month AGQ BIB BIS BOIL BRZU BZQ CHAD CHAU CROC CURE DDM DIG DNO DOG DPK DRIPJan 3,201 2,795 493 4,745 108 496 454 849 1,087 1,021 774 17Feb 3,573 2,747 406 3,026 100 285 1,573 583 885 2,428 672 12Mar 2,680 3,465 1,050 1,772 89 286 1,376 781 1,110 116 239 1,046Apr 1,492 4,162 649 1,004 82 114 1,911 1,075 1,012 1,595 154 10May 2,465 1,987 1,388 1,628 269 14 1,823 663 801 1,461 594 63Jun 3,927 2,307 5,508 1,093 15 4,577 6 3,098 647 737 49 308 83Jul 3,050 2,789 4,118 213 33 236 250 24,222 87 2,771 703 1,571 768 416 113Aug 2,051 3,974 3,466 229 172 219 1,153 6,235 94 4,237 574 1,434 1,885 2,620 108Sep 1,792 7,570 1,467 451 236 909 1,180 3,041 106 1,719 467 844 599 2,127 24Oct 2,492 4,669 1,717 1,784 520 1,008 1,344 2,789 42 1,087 316 647 22 5,742 5 90Nov 2,710 2,312 946 511 734 100 2,055 1,477 84 684 197 1,582 35 1,045 42 100Dec 1,743 2,040 807 442 409 89 1,662 1,698 68 769 625 942 181 317 23 4,624Total 31,176 40,817 22,015 16,898 2,104 3,224 7,644 44,039 1,682 21,502 7,480 12,652 10,160 15,008 1,546 4,814
Month DRN DRV DUG DUST DXD DZK EDC EDZ EET EEV EFU EPV ERX ERY EUM EUOJan 407 26 506 10,519 1,919 123 1,688 713 8 64 1,504 10,597 3,254 210 14,323Feb 116 186 386 10,002 1,327 124 815 112 10 26 21 912 9,589 5,165 155 4,694Mar 114 2,156 255 7,590 2,084 54 1,171 317 41 37 55 436 13,317 14,134 215 15,467Apr 185 10,028 153 6,894 2,330 143 1,416 14,521 83 15 10 964 7,395 11,764 166 8,960May 129 66 219 4,025 1,303 16 5,691 449 482 12 9 753 9,311 1,097 12 6,954Jun 344 59 133 6,002 1,971 281 1,269 330 31 99 4 1,234 6,712 689 99 6,044Jul 212 197 464 13,935 1,735 158 2,193 1,791 26 59 1,079 9,436 1,538 197 5,376Aug 989 40 1,303 14,817 5,091 14 1,602 1,570 20 178 12 1,617 10,851 4,219 241 6,902Sep 403 199 1,123 7,492 2,486 12 1,310 2,143 231 4 248 7,212 1,047 387 14,786Oct 666 90 346 15,124 1,615 69 2,089 1,511 26 23 12 233 7,570 1,288 140 13,388Nov 519 109 389 27,760 822 17 950 427 13 69 16 145 7,649 772 173 21,224Dec 444 60 657 10,330 854 61 1,053 501 54 136 17,466 13,285 497 39,594Total 4,528 13,216 5,934 134,490 23,537 1,072 21,247 24,385 740 803 207 9,261 117,105 58,252 2,492 157,712
Month EWV EZJ FAS FAZ FXP GASL GLL GUSH HDGE INDL JDST JNUG JPNL KOLD LABD LABUJan 182 33 41,698 24,718 114 2,365 991 190 775 6,706 9,239 48 5,718Feb 189 23 33,714 15,483 168 5,302 510 9 1,081 4,292 8,378 129 3,126Mar 70 27 48,487 16,794 60 1,920 534 99 1,207 5,726 10,381 218 719Apr 37 113 28,479 12,620 220 2,853 608 158 936 3,154 7,388 292 450May 20 20 63,095 14,248 205 1,517 208 166 1,178 2,395 4,545 296 351Jun 95 5 48,173 15,448 262 797 131 166 2,277 3,002 3,732 237 413Jul 6 4 45,869 18,251 283 2,456 142 179 2,036 8,739 9,240 273 344Aug 153 18 25,302 19,430 496 2,782 119 123 918 3,275 6,165 197 393Sep 49 3 26,596 13,672 306 907 167 463 771 2,469 6,493 107 252Oct 19 20 40,379 3,774 327 1,960 108 68 100 921 1,952 1,742 22 959 2,318 2,214Nov 157 25,779 4,375 823 829 72 389 125 294 1,292 1,362 32 1,609 330 1,793Dec 5 12 40,965 7,632 213 1,516 85 631 1,086 439 1,666 2,152 81 3,703 749 2,156Total 982 278 468,536 166,445 3,477 25,204 3,675 1,088 2,864 12,833 44,668 70,817 1,932 18,037 3,397 6,163
LEVERAGED & INVERSE
Page 128

Month LBJ MIDU MIDZ MZZ NUGT PSQ PST QID QLD RETL REW ROM RUSL RUSS RWM SAAJan 54 78 176 65,833 11 162 3,438 1,159 60 7,335 7,188 621 6Feb 49 61 10 22 51,069 33 279 1,542 786 21 234 9,964 7,069 127 1Mar 114 13 5 34 76,625 19 22 3,013 1,070 62 35 8,607 10,087 525Apr 163 77 51 21 50,709 81 257 3,062 1,413 29 52 7,119 7,405 87 10May 165 127 1,013 24 38,672 201 755 1,823 1,214 22 98 8,242 2,661 153Jun 86 295 28 36 42,464 73 335 3,821 2,314 47 3 4,674 3,188 296Jul 46 109 63 13 54,225 165 232 6,665 1,811 36 7 2,401 1,643 186 3Aug 24 296 131 379 58,771 290 24 5,737 2,948 18 20 2,136 936 109Sep 67 96 5,578 77 38,173 84 23 6,804 2,918 8 21 2,630 738 143 12Oct 65 65 115 16 28,403 134 4,615 1,665 34 1,436 679 117Nov 32 72 189 31 14,060 64 1 2,964 1,467 206 2,369 626 204Dec 22 38 1,765 237 17,200 94 18 3,428 1,357 3 31 1,524 758 143Total 887 1,327 9,124 890 536,204 1,249 2,108 46,912 20,122 3 243 801 58,437 42,978 2,711 32
Month SDOW SDS SH SKF SMN SPXL SPXS SPXU SQQQ SRS SSG SSO SVXY TBF TBT TECLJan 67,318 2,304 95 33 4,056 6,438 5,786 3,385 96 2 11,141 64,851 823 115,371 325Feb 53,223 1,272 64 5 3,155 9,223 3,190 13,503 255 2 12,250 48,863 422 98,208 516Mar 60,424 1,881 110 2,900 7,216 4,378 4,568 304 13,848 27,844 913 102,678 518Apr 70,541 751 99 10 2,565 3,097 23,598 15,089 184 18,004 39,378 401 73,729 228May 76,012 645 148 5 2,680 3,065 4,085 4,136 480 20,663 32,278 841 136,996 170Jun 28 77,255 712 58 5 3,084 4,422 6,435 6,165 105 10 12,965 59,065 877 113,176 389Jul 787 77,175 1,376 140 3 3,067 10,985 7,237 8,474 107 3 13,625 51,916 309 67,177 391Aug 1,542 65,767 3,125 459 12 7,494 13,252 21,296 9,403 419 92 19,079 55,011 393 58,835 351Sep 1,156 45,628 9,138 177 45 5,190 17,599 6,268 8,615 390 11 16,895 57,693 211 39,054 619Oct 686 48,534 2,571 58 69 2,354 5,360 4,703 8,105 436 13 11,822 49,265 2,488 32,303 495Nov 239 31,945 940 45 7 3,161 4,412 4,408 6,825 311 11 9,967 48,489 118 27,939 535Dec 1,417 36,543 3,040 118 10 7,609 9,170 8,216 7,681 392 9,793 61,202 175 31,146 653Total 5,855 710,365 27,755 1,571 204 47,315 94,239 99,600 95,949 3,479 144 170,052 595,855 7,971 896,612 5,190
Month TECS TMF TMV TNA TQQQ TTT TWM TYD TYO TZA UBT UCO UGL UPRO URE USDJan 79 1,252 3,953 32,661 5,797 919 777 90 938 54,342 717 27,260 271 4,910 43 8Feb 23 969 2,785 25,730 3,375 431 270 14 112 55,407 619 44,183 37 2,839 57 40Mar 6,111 294 1,804 36,730 4,908 430 464 114 471 43,762 402 53,752 159 4,091 108 12Apr 62 693 1,526 46,108 5,142 433 486 130 131 51,770 505 47,506 406 3,493 285May 41 816 3,505 46,283 4,283 729 416 8 276 43,636 581 27,021 91 2,918 300 19Jun 56 1,503 4,247 44,948 9,453 1,053 1,273 22 119 62,315 326 10,590 107 4,607 444 15Jul 93 1,321 2,698 42,670 9,880 733 1,278 27 32 46,003 288 17,986 153 3,334 125 27Aug 386 1,383 3,945 38,337 10,078 321 930 4 105 41,207 124 20,311 100 6,394 388 6Sep 112 878 1,914 29,233 8,081 535 842 75 33,999 109 14,923 58 5,195 298 14Oct 26 457 860 40,513 9,001 180 400 40 40 9,521 65 15,730 206 3,950 324 25Nov 16 352 1,077 30,796 8,471 124 327 13 100 6,796 37 13,384 493 2,514 197Dec 114 525 1,865 29,591 15,616 270 606 11,199 17 25,278 172 4,589 342 5Total 7,119 10,443 30,179 443,600 94,085 6,158 8,069 462 2,399 459,957 3,790 317,924 2,253 48,834 2,911 171
Month UST UVXY UWM UYG UYM XPP YCS ZBIO ZSLJan 314 204,564 593 399 10 573 2,813 1,078Feb 164 141,610 294 329 96 425 1,047 630Mar 470 241,833 197 838 29 378 4,691 610Apr 163 287,995 165 194 23 316 1,382 742May 210 167,079 334 372 18 255 3,662 523Jun 237 170,104 413 1,045 63 173 2,732 548Jul 7 220,138 560 269 49 189 1,867 10 558Aug 38 254,942 597 350 82 85 2,279 410 358Sep 2 273,814 465 1,080 104 57 892 2,353 192Oct 484 269,115 768 303 52 56 753 2,205 328Nov 117 268,012 415 433 82 221 639 604 455Dec 20 370,467 291 954 147 251 871 805 485Total 2,226 2,869,673 5,092 6,566 755 2,979 23,628 6,387 6,507
LEVERAGED & INVERSE (Continued)
Page 129
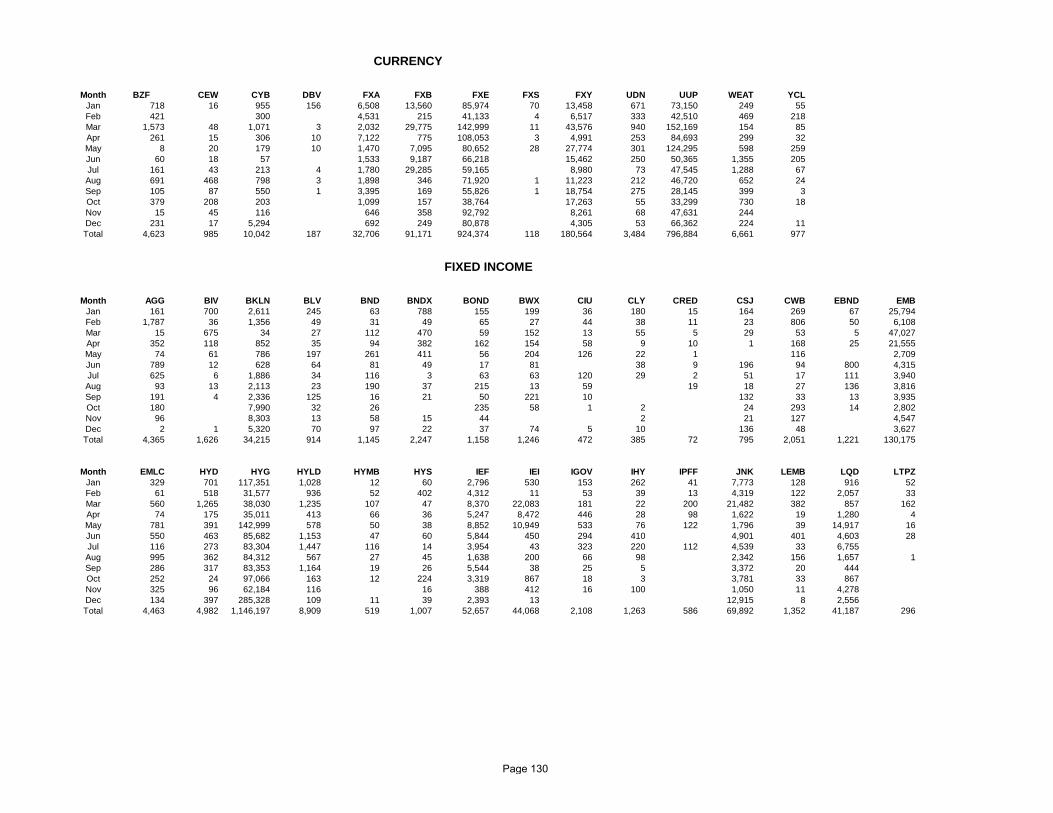
Month BZF CEW CYB DBV FXA FXB FXE FXS FXY UDN UUP WEAT YCLJan 718 16 955 156 6,508 13,560 85,974 70 13,458 671 73,150 249 55Feb 421 300 4,531 215 41,133 4 6,517 333 42,510 469 218Mar 1,573 48 1,071 3 2,032 29,775 142,999 11 43,576 940 152,169 154 85Apr 261 15 306 10 7,122 775 108,053 3 4,991 253 84,693 299 32May 8 20 179 10 1,470 7,095 80,652 28 27,774 301 124,295 598 259Jun 60 18 57 1,533 9,187 66,218 15,462 250 50,365 1,355 205Jul 161 43 213 4 1,780 29,285 59,165 8,980 73 47,545 1,288 67Aug 691 468 798 3 1,898 346 71,920 1 11,223 212 46,720 652 24Sep 105 87 550 1 3,395 169 55,826 1 18,754 275 28,145 399 3Oct 379 208 203 1,099 157 38,764 17,263 55 33,299 730 18Nov 15 45 116 646 358 92,792 8,261 68 47,631 244Dec 231 17 5,294 692 249 80,878 4,305 53 66,362 224 11Total 4,623 985 10,042 187 32,706 91,171 924,374 118 180,564 3,484 796,884 6,661 977
Month AGG BIV BKLN BLV BND BNDX BOND BWX CIU CLY CRED CSJ CWB EBND EMBJan 161 700 2,611 245 63 788 155 199 36 180 15 164 269 67 25,794Feb 1,787 36 1,356 49 31 49 65 27 44 38 11 23 806 50 6,108Mar 15 675 34 27 112 470 59 152 13 55 5 29 53 5 47,027Apr 352 118 852 35 94 382 162 154 58 9 10 1 168 25 21,555May 74 61 786 197 261 411 56 204 126 22 1 116 2,709Jun 789 12 628 64 81 49 17 81 38 9 196 94 800 4,315Jul 625 6 1,886 34 116 3 63 63 120 29 2 51 17 111 3,940Aug 93 13 2,113 23 190 37 215 13 59 19 18 27 136 3,816Sep 191 4 2,336 125 16 21 50 221 10 132 33 13 3,935Oct 180 7,990 32 26 235 58 1 2 24 293 14 2,802Nov 96 8,303 13 58 15 44 2 21 127 4,547Dec 2 1 5,320 70 97 22 37 74 5 10 136 48 3,627Total 4,365 1,626 34,215 914 1,145 2,247 1,158 1,246 472 385 72 795 2,051 1,221 130,175
Month EMLC HYD HYG HYLD HYMB HYS IEF IEI IGOV IHY IPFF JNK LEMB LQD LTPZJan 329 701 117,351 1,028 12 60 2,796 530 153 262 41 7,773 128 916 52Feb 61 518 31,577 936 52 402 4,312 11 53 39 13 4,319 122 2,057 33Mar 560 1,265 38,030 1,235 107 47 8,370 22,083 181 22 200 21,482 382 857 162Apr 74 175 35,011 413 66 36 5,247 8,472 446 28 98 1,622 19 1,280 4May 781 391 142,999 578 50 38 8,852 10,949 533 76 122 1,796 39 14,917 16Jun 550 463 85,682 1,153 47 60 5,844 450 294 410 4,901 401 4,603 28Jul 116 273 83,304 1,447 116 14 3,954 43 323 220 112 4,539 33 6,755Aug 995 362 84,312 567 27 45 1,638 200 66 98 2,342 156 1,657 1Sep 286 317 83,353 1,164 19 26 5,544 38 25 5 3,372 20 444Oct 252 24 97,066 163 12 224 3,319 867 18 3 3,781 33 867Nov 325 96 62,184 116 16 388 412 16 100 1,050 11 4,278Dec 134 397 285,328 109 11 39 2,393 13 12,915 8 2,556Total 4,463 4,982 1,146,197 8,909 519 1,007 52,657 44,068 2,108 1,263 586 69,892 1,352 41,187 296
FIXED INCOME
CURRENCY
Page 130
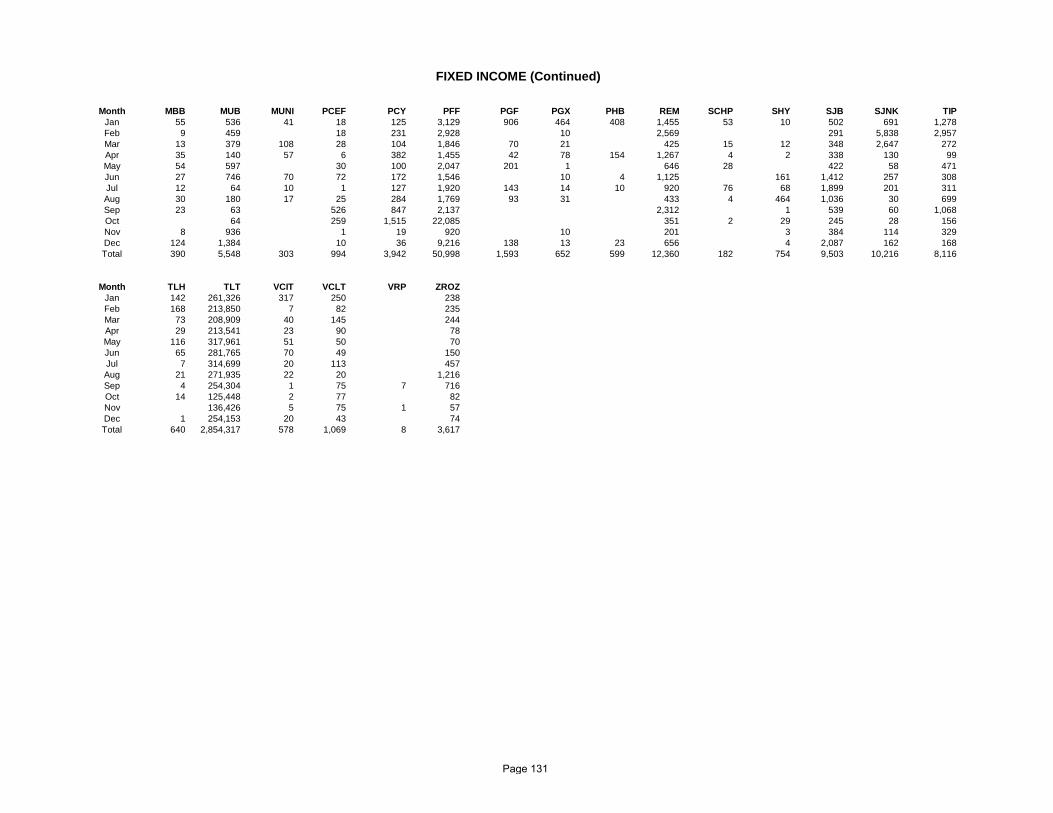
Month MBB MUB MUNI PCEF PCY PFF PGF PGX PHB REM SCHP SHY SJB SJNK TIPJan 55 536 41 18 125 3,129 906 464 408 1,455 53 10 502 691 1,278Feb 9 459 18 231 2,928 10 2,569 291 5,838 2,957Mar 13 379 108 28 104 1,846 70 21 425 15 12 348 2,647 272Apr 35 140 57 6 382 1,455 42 78 154 1,267 4 2 338 130 99May 54 597 30 100 2,047 201 1 646 28 422 58 471Jun 27 746 70 72 172 1,546 10 4 1,125 161 1,412 257 308Jul 12 64 10 1 127 1,920 143 14 10 920 76 68 1,899 201 311Aug 30 180 17 25 284 1,769 93 31 433 4 464 1,036 30 699Sep 23 63 526 847 2,137 2,312 1 539 60 1,068Oct 64 259 1,515 22,085 351 2 29 245 28 156Nov 8 936 1 19 920 10 201 3 384 114 329Dec 124 1,384 10 36 9,216 138 13 23 656 4 2,087 162 168Total 390 5,548 303 994 3,942 50,998 1,593 652 599 12,360 182 754 9,503 10,216 8,116
Month TLH TLT VCIT VCLT VRP ZROZJan 142 261,326 317 250 238Feb 168 213,850 7 82 235Mar 73 208,909 40 145 244Apr 29 213,541 23 90 78May 116 317,961 51 50 70Jun 65 281,765 70 49 150Jul 7 314,699 20 113 457Aug 21 271,935 22 20 1,216Sep 4 254,304 1 75 7 716Oct 14 125,448 2 77 82Nov 136,426 5 75 1 57Dec 1 254,153 20 43 74Total 640 2,854,317 578 1,069 8 3,617
FIXED INCOME (Continued)
Page 131
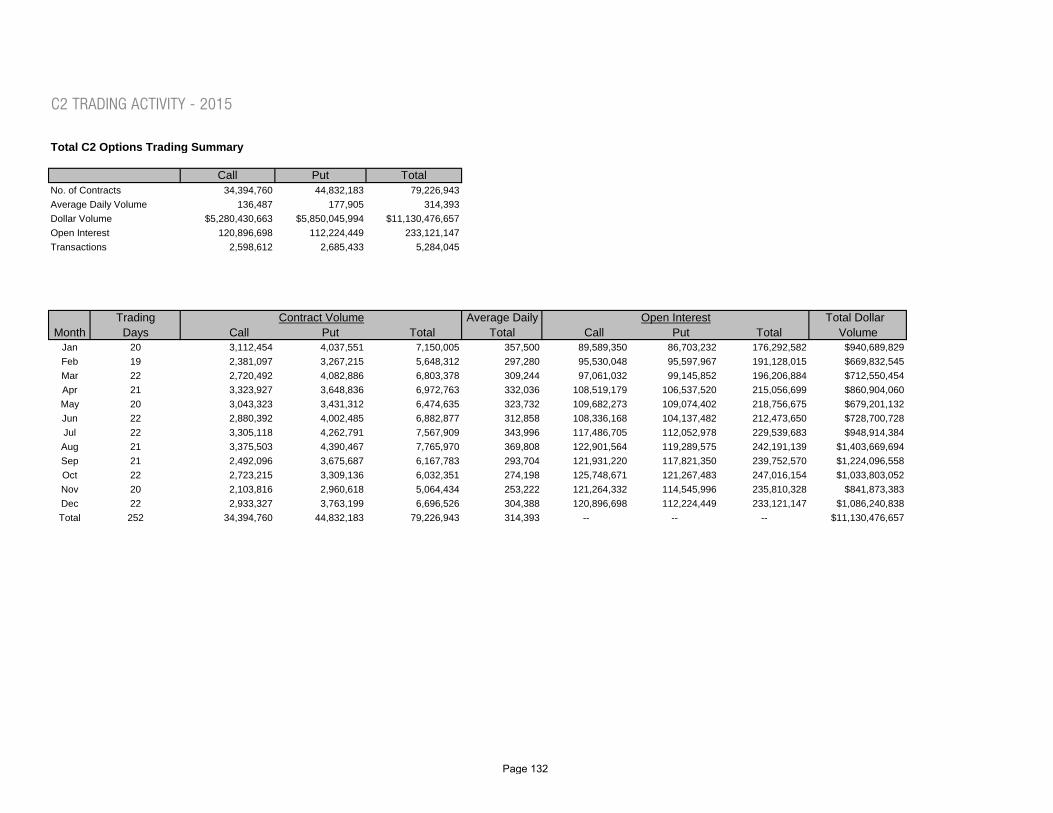
C2 TRADING ACTIVITY - 2015
Total C2 Options Trading Summary
Call Put TotalNo. of Contracts 34,394,760 44,832,183 79,226,943Average Daily Volume 136,487 177,905 314,393Dollar Volume $5,280,430,663 $5,850,045,994 $11,130,476,657Open Interest 120,896,698 112,224,449 233,121,147Transactions 2,598,612 2,685,433 5,284,045
Trading Average Daily Total Dollar Month Days Call Put Total Total Call Put Total Volume
Jan 20 3,112,454 4,037,551 7,150,005 357,500 89,589,350 86,703,232 176,292,582 $940,689,829Feb 19 2,381,097 3,267,215 5,648,312 297,280 95,530,048 95,597,967 191,128,015 $669,832,545Mar 22 2,720,492 4,082,886 6,803,378 309,244 97,061,032 99,145,852 196,206,884 $712,550,454Apr 21 3,323,927 3,648,836 6,972,763 332,036 108,519,179 106,537,520 215,056,699 $860,904,060May 20 3,043,323 3,431,312 6,474,635 323,732 109,682,273 109,074,402 218,756,675 $679,201,132Jun 22 2,880,392 4,002,485 6,882,877 312,858 108,336,168 104,137,482 212,473,650 $728,700,728Jul 22 3,305,118 4,262,791 7,567,909 343,996 117,486,705 112,052,978 229,539,683 $948,914,384Aug 21 3,375,503 4,390,467 7,765,970 369,808 122,901,564 119,289,575 242,191,139 $1,403,669,694Sep 21 2,492,096 3,675,687 6,167,783 293,704 121,931,220 117,821,350 239,752,570 $1,224,096,558Oct 22 2,723,215 3,309,136 6,032,351 274,198 125,748,671 121,267,483 247,016,154 $1,033,803,052Nov 20 2,103,816 2,960,618 5,064,434 253,222 121,264,332 114,545,996 235,810,328 $841,873,383Dec 22 2,933,327 3,763,199 6,696,526 304,388 120,896,698 112,224,449 233,121,147 $1,086,240,838Total 252 34,394,760 44,832,183 79,226,943 314,393 -- -- -- $11,130,476,657
Contract Volume Open Interest
Page 132

Total C2 Options Average Premium Per Contract, Average Contracts Per Trade and Transactions
TradingMonth Days Call Put Total Call Put Total Call Put Total
Jan 20 $145 $121 $132 16 20 18 190,700 201,209 391,909Feb 19 $152 $94 $119 12 18 15 194,171 179,137 373,308Mar 22 $121 $94 $105 13 20 17 203,745 208,086 411,831Apr 21 $146 $103 $123 13 16 14 250,819 231,265 482,084May 20 $108 $102 $105 14 17 16 213,452 203,803 417,255Jun 22 $117 $98 $106 14 19 16 210,911 214,463 425,374Jul 22 $136 $117 $125 13 17 15 245,524 255,394 500,918Aug 21 $144 $209 $181 14 15 15 240,482 288,392 528,874Sep 21 $213 $189 $198 12 15 13 211,266 246,459 457,725Oct 22 $205 $144 $171 11 14 13 239,574 235,304 474,878Nov 20 $209 $136 $166 11 15 13 192,842 200,748 393,590Dec 22 $179 $149 $162 14 17 16 205,126 221,173 426,299Total 252 $154 $130 $140 13 17 15 2,598,612 2,685,433 5,284,045
Total C2 Options Contract Volume - All Options
MonthTrading
DaysTotal
VolumeEquity
VolumeETF
VolumeIndex
VolumeJan 20 7,150,005 1,872,151 5,210,994 66,860Feb 19 5,648,312 1,823,282 3,781,693 43,337Mar 22 6,803,378 1,923,040 4,807,831 72,507Apr 21 6,972,763 2,473,639 4,369,300 129,824May 20 6,474,635 1,939,587 4,397,214 137,834Jun 22 6,882,877 1,891,329 4,823,236 168,312Jul 22 7,567,909 2,210,483 5,177,326 180,100Aug 21 7,765,970 2,326,715 5,231,117 208,138Sep 21 6,167,783 1,499,035 4,485,991 182,757Oct 22 6,032,351 1,928,838 3,907,715 195,798Nov 20 5,064,434 1,430,801 3,445,850 187,783Dec 22 6,696,526 1,543,630 4,915,402 237,494Total 252 79,226,943 22,862,530 54,553,669 1,810,744
Average Premium Per Contract Average Contracts Per Trade Transactions
Page 133

C2 EQUITY OPTIONS - 2015
C2 Equity Options Contract Volume
Trading Average DailyMonth Days Call Put Total Volume
Jan 20 1,016,376 855,775 1,872,151 93,608Feb 19 998,534 824,748 1,823,282 95,962Mar 22 1,044,888 878,152 1,923,040 87,411Apr 21 1,468,836 1,004,803 2,473,639 117,792May 20 1,132,526 807,061 1,939,587 96,979Jun 22 1,035,511 855,818 1,891,329 85,970Jul 22 1,179,257 1,031,226 2,210,483 100,477Aug 21 1,156,795 1,169,920 2,326,715 110,796Sep 21 732,560 766,475 1,499,035 71,383Oct 22 1,072,958 855,880 1,928,838 87,674Nov 20 784,655 646,146 1,430,801 71,540Dec 22 840,813 702,817 1,543,630 70,165Total 252 12,463,709 10,398,821 22,862,530 90,724
C2 Equity Options Open Interest and Dollar Volume
Month Call Put Total Call Put TotalJan 64,723,683 51,123,945 115,847,628 $222,822,986 $151,669,178 $374,492,164Feb 69,222,770 56,123,559 125,346,329 $235,086,505 $114,019,567 $349,106,072Mar 70,665,684 57,841,937 128,507,621 $182,284,394 $133,340,604 $315,624,998Apr 77,518,736 62,532,665 140,051,401 $313,624,956 $153,728,693 $467,353,649May 77,712,955 63,020,858 140,733,813 $173,428,629 $112,364,749 $285,793,378Jun 77,620,149 62,383,281 140,003,430 $149,823,848 $111,714,490 $261,538,338Jul 84,201,655 67,492,132 151,693,787 $235,370,261 $157,055,195 $392,425,456Aug 84,509,199 68,484,887 152,994,086 $218,740,765 $225,741,508 $444,482,273Sep 84,391,517 68,632,091 153,023,608 $167,710,939 $131,625,680 $299,336,619Oct 87,058,674 70,903,692 157,962,366 $306,885,497 $162,992,012 $469,877,509Nov 82,367,732 67,352,865 149,720,597 $212,657,334 $110,736,100 $323,393,434Dec 83,678,770 67,787,282 151,466,052 $175,860,403 $114,499,939 $290,360,342Total -- -- -- $2,594,296,517 $1,679,487,715 $4,273,784,232
During 2015, 22.9 million equity contracts were traded on the C2, representing options on 2.3 billion shares of underlying stock.
Open interest represents the number of outstanding options contracts at any point in time. It is the total number of options which have been purchased but not liquidated in the secondary market, exercised or expired. At year-end 2015, open interest in equity options on C2 was 151,466,052 contracts.
Open Interest Dollar Volume
Contract Volume
Page 134

C2 Equity Options Average Premium Per Contract, Average Contracts Per Trade and Transactions
Month Call Put Total Call Put Total Call Put TotalJan $219 $177 $200 9 9 9 114,936 99,481 214,417Feb $235 $138 $191 8 8 8 131,509 103,178 234,687Mar $174 $152 $164 8 8 8 130,605 110,135 240,740Apr $214 $153 $189 8 7 8 173,668 139,514 313,182May $153 $139 $147 9 8 8 130,516 106,295 236,811Jun $145 $131 $138 9 9 9 121,603 100,434 222,037Jul $200 $152 $178 8 8 8 145,386 125,481 270,867Aug $189 $193 $191 8 8 8 136,363 138,982 275,345Sep $229 $172 $200 7 8 7 103,651 99,369 203,020Oct $286 $190 $244 7 7 7 144,424 122,840 267,264Nov $271 $171 $226 7 7 7 117,016 98,397 215,413Dec $209 $163 $188 8 7 7 109,604 99,030 208,634Total $208 $162 $187 8 8 8 1,559,281 1,343,136 2,902,417
Average Premium Per Contract Average Contracts Per Trade Transactions
Page 135

Standard Symbol Stock Total Call Put Total Call Put
1 DDD 3D Systems Corp 34,234 21,591 12,643 136 86 502 MMM 3M Co 26,081 7,960 18,121 103 32 723 ABT Abbott Laboratories 28,976 16,461 12,515 115 65 504 ABBV AbbVie Inc 29,874 16,225 13,649 124 67 575 ANF Abercrombie & Fitch Co 27,828 12,004 15,824 110 48 636 ACN Accenture PLC 10,109 4,869 5,240 42 20 227 ACHN Achillion Pharmaceuticals Inc 5,016 3,409 1,607 21 14 78 ATVI Activision Blizzard Inc 28,861 18,029 10,832 115 72 439 ADBE Adobe Systems Inc 20,531 10,928 9,603 81 43 38
10 AMD Advanced Micro Devices Inc 27,430 13,683 13,747 109 54 5511 ARO Aeropostale Inc 8,389 7,644 745 35 32 312 AET Aetna Inc 17,493 11,316 6,177 69 45 2513 AFL Aflac Inc 15,752 10,733 5,019 63 43 2014 A Agilent Technologies Inc 8,909 6,961 1,948 35 28 815 AEM Agnico Eagle Mines Ltd 14,083 8,221 5,862 56 33 2316 ARG Airgas Inc 1,298 880 418 5 3 217 AKS AK Steel Holding Corp 22,821 13,401 9,420 91 53 3718 AKAM Akamai Technologies Inc 20,352 10,665 9,687 81 42 3819 ALU Alcatel-Lucent SA 4,137 3,700 437 17 15 220 AA Alcoa Inc 112,181 60,831 51,350 445 241 20421 BABA Alibaba Group Holding Ltd 469,721 336,087 133,634 1,864 1,334 53022 ACT Allergan plc 7,318 4,416 2,902 30 18 1223 AGN Allergan plc 18,711 10,530 8,181 74 42 3224 ALL Allstate Corp/The 4,130 1,996 2,134 16 8 825 ANR Alpha Natural Resources Inc 1,597 1,041 556 6 4 226 GOOGL Alphabet Inc 69,998 42,184 27,814 278 167 11027 GOOG Alphabet Inc 68,210 38,133 30,077 271 151 11928 ALTR Altera Corp 33,536 13,809 19,727 139 57 8229 MO Altria Group Inc 46,641 24,039 22,602 185 95 9030 AMRN Amarin Corp PLC 3,760 2,855 905 15 11 431 AMZN Amazon.com Inc 201,389 112,797 88,592 799 448 35232 AMBA Ambarella Inc 25,062 12,663 12,399 104 53 5133 AMED Amedisys Inc 840 389 451 3 2 234 AAL American Airlines Group Inc 153,554 113,945 39,609 637 473 16435 AGNC American Capital Agency Corp 5,493 3,001 2,492 22 12 1036 ACAS American Capital Ltd 10,614 6,722 3,892 42 27 1537 AEO American Eagle Outfitters Inc 11,790 7,908 3,882 49 33 1638 AXP American Express Co 52,261 25,831 26,430 207 103 10539 AIG American International Group Inc 54,569 29,681 24,888 217 118 9940 AMGN Amgen Inc 26,385 12,504 13,881 105 50 5541 AFSI AmTrust Financial Services Inc 1,780 609 1,171 7 3 542 APC Anadarko Petroleum Corp 33,743 22,166 11,577 134 88 4643 NLY Annaly Capital Management Inc 5,875 2,783 3,092 23 11 1244 ANTM Anthem Inc 4,502 2,528 1,974 18 10 845 APA Apache Corp 22,491 12,477 10,014 89 50 4046 APOL Apollo Education Group Inc 10,917 4,558 6,359 43 18 2547 AAPL Apple Inc 5,889,080 3,092,398 2,796,682 23,369 12,271 11,09848 AMAT Applied Materials Inc 82,735 51,361 31,374 328 204 12549 MT ArcelorMittal 8,888 5,032 3,856 35 20 1550 ACI Arch Coal Inc 23,733 16,990 6,743 94 67 2751 ADM Archer-Daniels-Midland Co 7,941 3,451 4,490 32 14 1852 ARNA Arena Pharmaceuticals Inc 2,175 1,562 613 9 6 253 ARIA ARIAD Pharmaceuticals Inc 7,383 4,889 2,494 31 20 1054 AGO Assured Guaranty Ltd 10,869 5,178 5,691 43 21 2355 AZN AstraZeneca PLC 1,610 1,119 491 7 5 256 T AT&T Inc 304,601 165,547 139,054 1,209 657 55257 ADSK Autodesk Inc 12,335 7,634 4,701 49 30 1958 CAR Avis Budget Group Inc 7,540 4,567 2,973 31 19 1259 AVP Avon Products Inc 16,449 7,630 8,819 68 32 3760 BIDU Baidu Inc 110,556 63,201 47,355 439 251 18861 BHI Baker Hughes Inc 11,634 5,601 6,033 46 22 2462 BBD Banco Bradesco SA 3,171 1,215 1,956 13 5 863 BAC Bank of America Corp 697,747 505,351 192,396 2,769 2,005 76364 BK Bank of New York Mellon Corp/The 5,779 2,702 3,077 23 11 12
C2 Equity Options Volume (Includes LEAPS®)
Contract Volume Average Daily Volume
Page 136

Standard Symbol Stock Total Call Put Total Call Put
C2 Equity Options Volume (Includes LEAPS®)
Contract Volume Average Daily Volume
65 ABX Barrick Gold Corp 87,011 63,337 23,674 345 251 9466 BAX Baxter International Inc 22,511 15,153 7,358 89 60 2967 BBT BB&T Corp 10,182 5,772 4,410 40 23 1868 BBBY Bed Bath & Beyond Inc 20,995 9,182 11,813 83 36 4769 BRKB Berkshire Hathaway Inc 14,459 8,051 6,408 57 32 2570 BBY Best Buy Co Inc 29,134 14,920 14,214 116 59 5671 BHP BHP Billiton Ltd 13,305 6,088 7,217 53 24 2972 BCRX BioCryst Pharmaceuticals Inc 1,313 842 471 5 3 273 BIIB Biogen Inc 15,597 8,807 6,790 65 37 2874 BBRY BlackBerry Ltd 53,793 39,299 14,494 213 156 5875 BX Blackstone Group LP/The 36,670 20,583 16,087 146 82 6476 BWP Boardwalk Pipeline Partners LP 1,723 1,397 326 7 6 177 BA Boeing Co/The 70,897 30,086 40,811 281 119 16278 BSX Boston Scientific Corp 9,055 5,215 3,840 36 21 1579 BP BP PLC 40,582 24,828 15,754 161 99 6380 BMY Bristol-Myers Squibb Co 51,324 27,818 23,506 204 110 9381 BRCM Broadcom Corp 31,837 16,514 15,323 126 66 6182 BRCD Brocade Communications Systems Inc 3,336 2,448 888 13 10 483 CZR Caesars Entertainment Corp 8,238 3,150 5,088 34 13 2184 CCJ Cameco Corp 10,072 6,442 3,630 42 27 1585 CSIQ Canadian Solar Inc 8,281 4,222 4,059 35 18 1786 COF Capital One Financial Corp 11,726 5,084 6,642 47 20 2687 CCL Carnival Corp 6,596 2,901 3,695 28 12 1588 CAT Caterpillar Inc 112,780 42,411 70,369 448 168 27989 CBS CBS Corp 31,473 13,526 17,947 125 54 7290 CELG Celgene Corp 59,547 32,478 27,069 236 129 10791 CX Cemex SAB de CV 21,515 8,610 12,905 85 34 5192 CENX Century Aluminum Co 5,806 1,560 4,246 23 6 1793 CF CF Industries Holdings Inc 19,467 9,234 10,233 77 37 4194 LNG Cheniere Energy Inc 25,428 11,428 14,000 101 45 5695 CHK Chesapeake Energy Corp 165,903 74,717 91,186 658 296 36296 CVX Chevron Corp 119,516 50,397 69,119 474 200 27497 CBI Chicago Bridge & Iron Co NV 22,781 6,697 16,084 95 28 6798 CMG Chipotle Mexican Grill Inc 32,777 15,806 16,971 130 63 6799 CB Chubb Ltd 1,462 416 1,046 6 2 4100 CIEN Ciena Corp 19,125 12,535 6,590 76 50 26101 CI Cigna Corp 10,303 6,216 4,087 41 25 16102 CRUS Cirrus Logic Inc 9,685 5,182 4,503 41 22 19103 CSCO Cisco Systems Inc 163,671 95,927 67,744 649 381 269104 CIT CIT Group Inc 1,952 1,317 635 8 5 3105 C Citigroup Inc 290,925 181,243 109,682 1,154 719 435106 CLF Cliffs Natural Resources Inc 49,215 22,113 27,102 195 88 108107 CME CME Group Inc/IL 7,570 4,830 2,740 32 20 11108 COH Coach Inc 16,749 8,302 8,447 70 35 35109 KO Coca-Cola Co/The 160,689 104,054 56,635 638 413 225110 CDE Coeur Mining Inc 2,732 1,259 1,473 11 5 6111 CL Colgate-Palmolive Co 16,827 6,572 10,255 67 26 41112 CMCSA Comcast Corp 80,277 41,460 38,817 319 165 154113 CMA Comerica Inc 6,638 4,137 2,501 26 16 10114 CONN Conn's Inc 4,647 3,001 1,646 19 13 7115 COP ConocoPhillips 65,992 28,519 37,473 262 113 149116 CNX CONSOL Energy Inc 34,466 18,492 15,974 137 73 63117 CLR Continental Resources Inc/OK 8,184 4,312 3,872 34 18 16118 GLW Corning Inc 70,112 29,250 40,862 278 116 162119 COST Costco Wholesale Corp 28,745 12,882 15,863 114 51 63120 CREE Cree Inc 20,888 13,396 7,492 83 53 30121 CSX CSX Corp 44,903 30,035 14,868 178 119 59122 CTIC CTI BioPharma Corp 932 652 280 4 3 1123 CTRP Ctrip.com International Ltd 15,123 8,538 6,585 63 36 28124 CMI Cummins Inc 10,217 3,715 6,502 43 16 27125 CVS CVS Health Corp 24,988 11,660 13,328 99 46 53126 CY Cypress Semiconductor Corp 14,321 10,895 3,426 57 43 14127 DHR Danaher Corp 8,203 4,287 3,916 34 18 16128 DE Deere & Co 43,889 16,124 27,765 174 64 110
Page 137
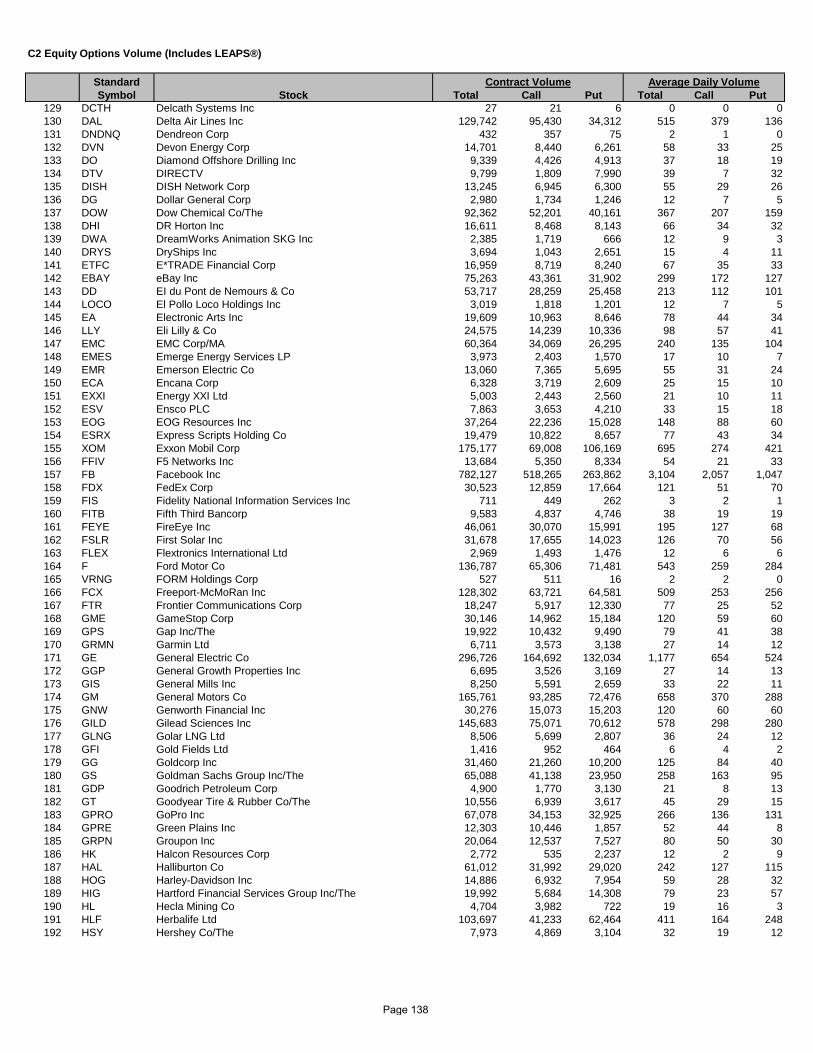
Standard Symbol Stock Total Call Put Total Call Put
C2 Equity Options Volume (Includes LEAPS®)
Contract Volume Average Daily Volume
129 DCTH Delcath Systems Inc 27 21 6 0 0 0130 DAL Delta Air Lines Inc 129,742 95,430 34,312 515 379 136131 DNDNQ Dendreon Corp 432 357 75 2 1 0132 DVN Devon Energy Corp 14,701 8,440 6,261 58 33 25133 DO Diamond Offshore Drilling Inc 9,339 4,426 4,913 37 18 19134 DTV DIRECTV 9,799 1,809 7,990 39 7 32135 DISH DISH Network Corp 13,245 6,945 6,300 55 29 26136 DG Dollar General Corp 2,980 1,734 1,246 12 7 5137 DOW Dow Chemical Co/The 92,362 52,201 40,161 367 207 159138 DHI DR Horton Inc 16,611 8,468 8,143 66 34 32139 DWA DreamWorks Animation SKG Inc 2,385 1,719 666 12 9 3140 DRYS DryShips Inc 3,694 1,043 2,651 15 4 11141 ETFC E*TRADE Financial Corp 16,959 8,719 8,240 67 35 33142 EBAY eBay Inc 75,263 43,361 31,902 299 172 127143 DD EI du Pont de Nemours & Co 53,717 28,259 25,458 213 112 101144 LOCO El Pollo Loco Holdings Inc 3,019 1,818 1,201 12 7 5145 EA Electronic Arts Inc 19,609 10,963 8,646 78 44 34146 LLY Eli Lilly & Co 24,575 14,239 10,336 98 57 41147 EMC EMC Corp/MA 60,364 34,069 26,295 240 135 104148 EMES Emerge Energy Services LP 3,973 2,403 1,570 17 10 7149 EMR Emerson Electric Co 13,060 7,365 5,695 55 31 24150 ECA Encana Corp 6,328 3,719 2,609 25 15 10151 EXXI Energy XXI Ltd 5,003 2,443 2,560 21 10 11152 ESV Ensco PLC 7,863 3,653 4,210 33 15 18153 EOG EOG Resources Inc 37,264 22,236 15,028 148 88 60154 ESRX Express Scripts Holding Co 19,479 10,822 8,657 77 43 34155 XOM Exxon Mobil Corp 175,177 69,008 106,169 695 274 421156 FFIV F5 Networks Inc 13,684 5,350 8,334 54 21 33157 FB Facebook Inc 782,127 518,265 263,862 3,104 2,057 1,047158 FDX FedEx Corp 30,523 12,859 17,664 121 51 70159 FIS Fidelity National Information Services Inc 711 449 262 3 2 1160 FITB Fifth Third Bancorp 9,583 4,837 4,746 38 19 19161 FEYE FireEye Inc 46,061 30,070 15,991 195 127 68162 FSLR First Solar Inc 31,678 17,655 14,023 126 70 56163 FLEX Flextronics International Ltd 2,969 1,493 1,476 12 6 6164 F Ford Motor Co 136,787 65,306 71,481 543 259 284165 VRNG FORM Holdings Corp 527 511 16 2 2 0166 FCX Freeport-McMoRan Inc 128,302 63,721 64,581 509 253 256167 FTR Frontier Communications Corp 18,247 5,917 12,330 77 25 52168 GME GameStop Corp 30,146 14,962 15,184 120 59 60169 GPS Gap Inc/The 19,922 10,432 9,490 79 41 38170 GRMN Garmin Ltd 6,711 3,573 3,138 27 14 12171 GE General Electric Co 296,726 164,692 132,034 1,177 654 524172 GGP General Growth Properties Inc 6,695 3,526 3,169 27 14 13173 GIS General Mills Inc 8,250 5,591 2,659 33 22 11174 GM General Motors Co 165,761 93,285 72,476 658 370 288175 GNW Genworth Financial Inc 30,276 15,073 15,203 120 60 60176 GILD Gilead Sciences Inc 145,683 75,071 70,612 578 298 280177 GLNG Golar LNG Ltd 8,506 5,699 2,807 36 24 12178 GFI Gold Fields Ltd 1,416 952 464 6 4 2179 GG Goldcorp Inc 31,460 21,260 10,200 125 84 40180 GS Goldman Sachs Group Inc/The 65,088 41,138 23,950 258 163 95181 GDP Goodrich Petroleum Corp 4,900 1,770 3,130 21 8 13182 GT Goodyear Tire & Rubber Co/The 10,556 6,939 3,617 45 29 15183 GPRO GoPro Inc 67,078 34,153 32,925 266 136 131184 GPRE Green Plains Inc 12,303 10,446 1,857 52 44 8185 GRPN Groupon Inc 20,064 12,537 7,527 80 50 30186 HK Halcon Resources Corp 2,772 535 2,237 12 2 9187 HAL Halliburton Co 61,012 31,992 29,020 242 127 115188 HOG Harley-Davidson Inc 14,886 6,932 7,954 59 28 32189 HIG Hartford Financial Services Group Inc/The 19,992 5,684 14,308 79 23 57190 HL Hecla Mining Co 4,704 3,982 722 19 16 3191 HLF Herbalife Ltd 103,697 41,233 62,464 411 164 248192 HSY Hershey Co/The 7,973 4,869 3,104 32 19 12
Page 138
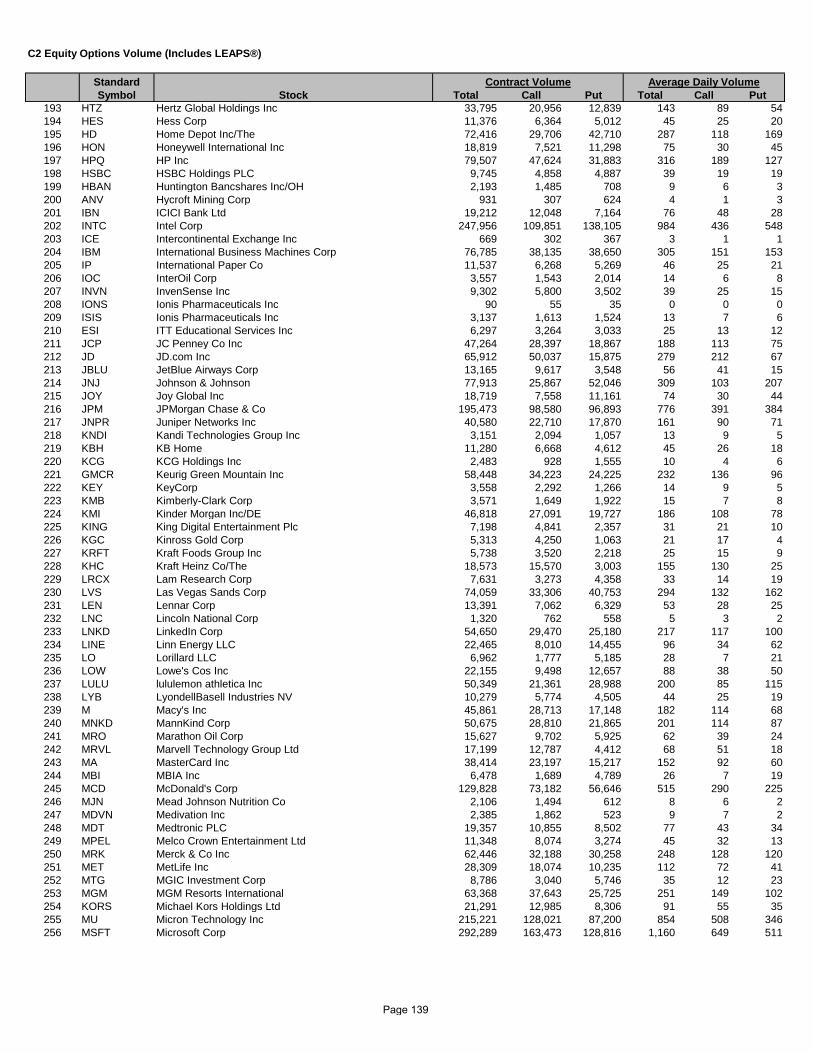
Standard Symbol Stock Total Call Put Total Call Put
C2 Equity Options Volume (Includes LEAPS®)
Contract Volume Average Daily Volume
193 HTZ Hertz Global Holdings Inc 33,795 20,956 12,839 143 89 54194 HES Hess Corp 11,376 6,364 5,012 45 25 20195 HD Home Depot Inc/The 72,416 29,706 42,710 287 118 169196 HON Honeywell International Inc 18,819 7,521 11,298 75 30 45197 HPQ HP Inc 79,507 47,624 31,883 316 189 127198 HSBC HSBC Holdings PLC 9,745 4,858 4,887 39 19 19199 HBAN Huntington Bancshares Inc/OH 2,193 1,485 708 9 6 3200 ANV Hycroft Mining Corp 931 307 624 4 1 3201 IBN ICICI Bank Ltd 19,212 12,048 7,164 76 48 28202 INTC Intel Corp 247,956 109,851 138,105 984 436 548203 ICE Intercontinental Exchange Inc 669 302 367 3 1 1204 IBM International Business Machines Corp 76,785 38,135 38,650 305 151 153205 IP International Paper Co 11,537 6,268 5,269 46 25 21206 IOC InterOil Corp 3,557 1,543 2,014 14 6 8207 INVN InvenSense Inc 9,302 5,800 3,502 39 25 15208 IONS Ionis Pharmaceuticals Inc 90 55 35 0 0 0209 ISIS Ionis Pharmaceuticals Inc 3,137 1,613 1,524 13 7 6210 ESI ITT Educational Services Inc 6,297 3,264 3,033 25 13 12211 JCP JC Penney Co Inc 47,264 28,397 18,867 188 113 75212 JD JD.com Inc 65,912 50,037 15,875 279 212 67213 JBLU JetBlue Airways Corp 13,165 9,617 3,548 56 41 15214 JNJ Johnson & Johnson 77,913 25,867 52,046 309 103 207215 JOY Joy Global Inc 18,719 7,558 11,161 74 30 44216 JPM JPMorgan Chase & Co 195,473 98,580 96,893 776 391 384217 JNPR Juniper Networks Inc 40,580 22,710 17,870 161 90 71218 KNDI Kandi Technologies Group Inc 3,151 2,094 1,057 13 9 5219 KBH KB Home 11,280 6,668 4,612 45 26 18220 KCG KCG Holdings Inc 2,483 928 1,555 10 4 6221 GMCR Keurig Green Mountain Inc 58,448 34,223 24,225 232 136 96222 KEY KeyCorp 3,558 2,292 1,266 14 9 5223 KMB Kimberly-Clark Corp 3,571 1,649 1,922 15 7 8224 KMI Kinder Morgan Inc/DE 46,818 27,091 19,727 186 108 78225 KING King Digital Entertainment Plc 7,198 4,841 2,357 31 21 10226 KGC Kinross Gold Corp 5,313 4,250 1,063 21 17 4227 KRFT Kraft Foods Group Inc 5,738 3,520 2,218 25 15 9228 KHC Kraft Heinz Co/The 18,573 15,570 3,003 155 130 25229 LRCX Lam Research Corp 7,631 3,273 4,358 33 14 19230 LVS Las Vegas Sands Corp 74,059 33,306 40,753 294 132 162231 LEN Lennar Corp 13,391 7,062 6,329 53 28 25232 LNC Lincoln National Corp 1,320 762 558 5 3 2233 LNKD LinkedIn Corp 54,650 29,470 25,180 217 117 100234 LINE Linn Energy LLC 22,465 8,010 14,455 96 34 62235 LO Lorillard LLC 6,962 1,777 5,185 28 7 21236 LOW Lowe's Cos Inc 22,155 9,498 12,657 88 38 50237 LULU lululemon athletica Inc 50,349 21,361 28,988 200 85 115238 LYB LyondellBasell Industries NV 10,279 5,774 4,505 44 25 19239 M Macy's Inc 45,861 28,713 17,148 182 114 68240 MNKD MannKind Corp 50,675 28,810 21,865 201 114 87241 MRO Marathon Oil Corp 15,627 9,702 5,925 62 39 24242 MRVL Marvell Technology Group Ltd 17,199 12,787 4,412 68 51 18243 MA MasterCard Inc 38,414 23,197 15,217 152 92 60244 MBI MBIA Inc 6,478 1,689 4,789 26 7 19245 MCD McDonald's Corp 129,828 73,182 56,646 515 290 225246 MJN Mead Johnson Nutrition Co 2,106 1,494 612 8 6 2247 MDVN Medivation Inc 2,385 1,862 523 9 7 2248 MDT Medtronic PLC 19,357 10,855 8,502 77 43 34249 MPEL Melco Crown Entertainment Ltd 11,348 8,074 3,274 45 32 13250 MRK Merck & Co Inc 62,446 32,188 30,258 248 128 120251 MET MetLife Inc 28,309 18,074 10,235 112 72 41252 MTG MGIC Investment Corp 8,786 3,040 5,746 35 12 23253 MGM MGM Resorts International 63,368 37,643 25,725 251 149 102254 KORS Michael Kors Holdings Ltd 21,291 12,985 8,306 91 55 35255 MU Micron Technology Inc 215,221 128,021 87,200 854 508 346256 MSFT Microsoft Corp 292,289 163,473 128,816 1,160 649 511
Page 139
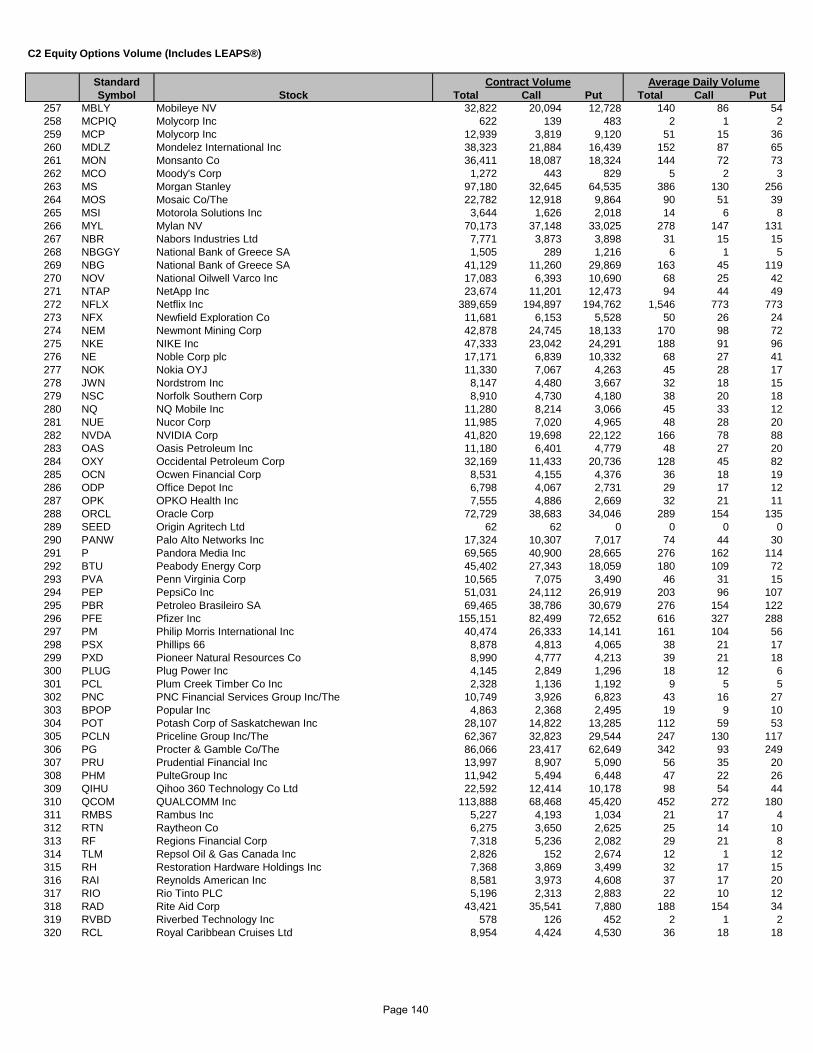
Standard Symbol Stock Total Call Put Total Call Put
C2 Equity Options Volume (Includes LEAPS®)
Contract Volume Average Daily Volume
257 MBLY Mobileye NV 32,822 20,094 12,728 140 86 54258 MCPIQ Molycorp Inc 622 139 483 2 1 2259 MCP Molycorp Inc 12,939 3,819 9,120 51 15 36260 MDLZ Mondelez International Inc 38,323 21,884 16,439 152 87 65261 MON Monsanto Co 36,411 18,087 18,324 144 72 73262 MCO Moody's Corp 1,272 443 829 5 2 3263 MS Morgan Stanley 97,180 32,645 64,535 386 130 256264 MOS Mosaic Co/The 22,782 12,918 9,864 90 51 39265 MSI Motorola Solutions Inc 3,644 1,626 2,018 14 6 8266 MYL Mylan NV 70,173 37,148 33,025 278 147 131267 NBR Nabors Industries Ltd 7,771 3,873 3,898 31 15 15268 NBGGY National Bank of Greece SA 1,505 289 1,216 6 1 5269 NBG National Bank of Greece SA 41,129 11,260 29,869 163 45 119270 NOV National Oilwell Varco Inc 17,083 6,393 10,690 68 25 42271 NTAP NetApp Inc 23,674 11,201 12,473 94 44 49272 NFLX Netflix Inc 389,659 194,897 194,762 1,546 773 773273 NFX Newfield Exploration Co 11,681 6,153 5,528 50 26 24274 NEM Newmont Mining Corp 42,878 24,745 18,133 170 98 72275 NKE NIKE Inc 47,333 23,042 24,291 188 91 96276 NE Noble Corp plc 17,171 6,839 10,332 68 27 41277 NOK Nokia OYJ 11,330 7,067 4,263 45 28 17278 JWN Nordstrom Inc 8,147 4,480 3,667 32 18 15279 NSC Norfolk Southern Corp 8,910 4,730 4,180 38 20 18280 NQ NQ Mobile Inc 11,280 8,214 3,066 45 33 12281 NUE Nucor Corp 11,985 7,020 4,965 48 28 20282 NVDA NVIDIA Corp 41,820 19,698 22,122 166 78 88283 OAS Oasis Petroleum Inc 11,180 6,401 4,779 48 27 20284 OXY Occidental Petroleum Corp 32,169 11,433 20,736 128 45 82285 OCN Ocwen Financial Corp 8,531 4,155 4,376 36 18 19286 ODP Office Depot Inc 6,798 4,067 2,731 29 17 12287 OPK OPKO Health Inc 7,555 4,886 2,669 32 21 11288 ORCL Oracle Corp 72,729 38,683 34,046 289 154 135289 SEED Origin Agritech Ltd 62 62 0 0 0 0290 PANW Palo Alto Networks Inc 17,324 10,307 7,017 74 44 30291 P Pandora Media Inc 69,565 40,900 28,665 276 162 114292 BTU Peabody Energy Corp 45,402 27,343 18,059 180 109 72293 PVA Penn Virginia Corp 10,565 7,075 3,490 46 31 15294 PEP PepsiCo Inc 51,031 24,112 26,919 203 96 107295 PBR Petroleo Brasileiro SA 69,465 38,786 30,679 276 154 122296 PFE Pfizer Inc 155,151 82,499 72,652 616 327 288297 PM Philip Morris International Inc 40,474 26,333 14,141 161 104 56298 PSX Phillips 66 8,878 4,813 4,065 38 21 17299 PXD Pioneer Natural Resources Co 8,990 4,777 4,213 39 21 18300 PLUG Plug Power Inc 4,145 2,849 1,296 18 12 6301 PCL Plum Creek Timber Co Inc 2,328 1,136 1,192 9 5 5302 PNC PNC Financial Services Group Inc/The 10,749 3,926 6,823 43 16 27303 BPOP Popular Inc 4,863 2,368 2,495 19 9 10304 POT Potash Corp of Saskatchewan Inc 28,107 14,822 13,285 112 59 53305 PCLN Priceline Group Inc/The 62,367 32,823 29,544 247 130 117306 PG Procter & Gamble Co/The 86,066 23,417 62,649 342 93 249307 PRU Prudential Financial Inc 13,997 8,907 5,090 56 35 20308 PHM PulteGroup Inc 11,942 5,494 6,448 47 22 26309 QIHU Qihoo 360 Technology Co Ltd 22,592 12,414 10,178 98 54 44310 QCOM QUALCOMM Inc 113,888 68,468 45,420 452 272 180311 RMBS Rambus Inc 5,227 4,193 1,034 21 17 4312 RTN Raytheon Co 6,275 3,650 2,625 25 14 10313 RF Regions Financial Corp 7,318 5,236 2,082 29 21 8314 TLM Repsol Oil & Gas Canada Inc 2,826 152 2,674 12 1 12315 RH Restoration Hardware Holdings Inc 7,368 3,869 3,499 32 17 15316 RAI Reynolds American Inc 8,581 3,973 4,608 37 17 20317 RIO Rio Tinto PLC 5,196 2,313 2,883 22 10 12318 RAD Rite Aid Corp 43,421 35,541 7,880 188 154 34319 RVBD Riverbed Technology Inc 578 126 452 2 1 2320 RCL Royal Caribbean Cruises Ltd 8,954 4,424 4,530 36 18 18
Page 140

Standard Symbol Stock Total Call Put Total Call Put
C2 Equity Options Volume (Includes LEAPS®)
Contract Volume Average Daily Volume
321 RSH RS Legacy Corp 10,245 9,218 1,027 41 37 4322 CRM salesforce.com Inc 44,265 26,875 17,390 176 107 69323 SNDK SanDisk Corp 55,251 33,913 21,338 219 135 85324 SD SandRidge Energy Inc 12,327 10,124 2,203 49 40 9325 SLB Schlumberger Ltd 96,399 34,097 62,302 383 135 247326 SDRL Seadrill Ltd 26,128 11,869 14,259 113 51 62327 STX Seagate Technology PLC 27,241 13,321 13,920 108 53 55328 SHLD Sears Holdings Corp 61,077 9,647 51,430 242 38 204329 SQNM Sequenom Inc 3,514 2,540 974 14 10 4330 SHAK Shake Shack Inc 2,098 1,074 1,024 22 11 11331 SLW Silver Wheaton Corp 28,823 18,236 10,587 114 72 42332 SPG Simon Property Group Inc 4,285 1,515 2,770 17 6 11333 SINA SINA Corp/China 18,754 10,065 8,689 74 40 34334 SIRI Sirius XM Holdings Inc 7,224 4,209 3,015 29 17 12335 SWKS Skyworks Solutions Inc 24,263 14,606 9,657 105 63 42336 SLM SLM Corp 1,556 413 1,143 6 2 5337 SCTY SolarCity Corp 77,904 32,185 45,719 309 128 181338 SO Southern Co/The 10,834 5,876 4,958 43 23 20339 LUV Southwest Airlines Co 25,989 16,212 9,777 111 69 42340 SWN Southwestern Energy Co 22,120 10,701 11,419 88 42 45341 SPLK Splunk Inc 10,194 5,264 4,930 44 23 21342 S Sprint Corp 26,850 17,065 9,785 107 68 39343 SPLS Staples Inc 21,461 16,847 4,614 93 73 20344 SBUX Starbucks Corp 79,537 41,539 37,998 316 165 151345 HOT Starwood Hotels & Resorts Worldwide Inc 14,707 10,034 4,673 58 40 19346 STT State Street Corp 3,099 1,096 2,003 12 4 8347 SSYS Stratasys Ltd 8,159 4,334 3,825 35 19 17348 SU Suncor Energy Inc 15,796 7,151 8,645 63 28 34349 SUNE SunEdison Inc 145,740 101,609 44,131 578 403 175350 SPWR SunPower Corp 9,134 5,700 3,434 36 23 14351 STI SunTrust Banks Inc 6,063 2,927 3,136 24 12 12352 SYMC Symantec Corp 4,847 2,856 1,991 19 11 8353 SYY Sysco Corp 9,924 6,121 3,803 43 26 16354 TGT Target Corp 49,768 23,143 26,625 197 92 106355 TASR TASER International Inc 10,936 7,191 3,745 47 31 16356 TCK Teck Resources Ltd 16,466 7,179 9,287 65 28 37357 TSLA Tesla Motors Inc 226,846 123,840 103,006 900 491 409358 TSO Tesoro Corp 26,908 10,678 16,230 107 42 64359 TEVA Teva Pharmaceutical Industries Ltd 36,368 18,694 17,674 144 74 70360 TXN Texas Instruments Inc 34,627 11,694 22,933 137 46 91361 TXT Textron Inc 2,989 1,610 1,379 12 6 5362 TIF Tiffany & Co 11,270 5,659 5,611 45 22 22363 TWX Time Warner Inc 20,014 11,972 8,042 79 48 32364 TIVO TiVo Inc 1,618 1,161 457 6 5 2365 TMUS T-Mobile US Inc 13,966 9,560 4,406 55 38 17366 TM Toyota Motor Corp 2,356 1,346 1,010 9 5 4367 RIG Transocean Ltd 83,747 25,836 57,911 332 103 230368 TSL Trina Solar Ltd 5,163 2,240 2,923 20 9 12369 TRN Trinity Industries Inc 12,769 7,430 5,339 55 32 23370 TWTR Twitter Inc 346,026 200,075 145,951 1,373 794 579371 TYC Tyco International Plc 2,790 2,182 608 11 9 2372 UPL Ultra Petroleum Corp 4,677 1,622 3,055 20 7 13373 UA Under Armour Inc 29,604 12,036 17,568 128 52 76374 UNP Union Pacific Corp 41,908 21,687 20,221 166 86 80375 UAL United Continental Holdings Inc 82,923 56,631 26,292 329 225 104376 UPS United Parcel Service Inc 54,699 32,343 22,356 217 128 89377 URI United Rentals Inc 14,609 7,904 6,705 63 34 29378 X United States Steel Corp 93,801 47,954 45,847 372 190 182379 UTX United Technologies Corp 23,923 12,854 11,069 95 51 44380 UNH UnitedHealth Group Inc 25,923 15,039 10,884 103 60 43381 USB US Bancorp 21,895 9,130 12,765 87 36 51382 VALE Vale SA 63,192 30,941 32,251 251 123 128383 VLO Valero Energy Corp 51,710 23,527 28,183 205 93 112384 VER VEREIT Inc 1,838 1,197 641 7 5 3385 ARCP VEREIT Inc 4,469 3,356 1,113 19 14 5
Page 141
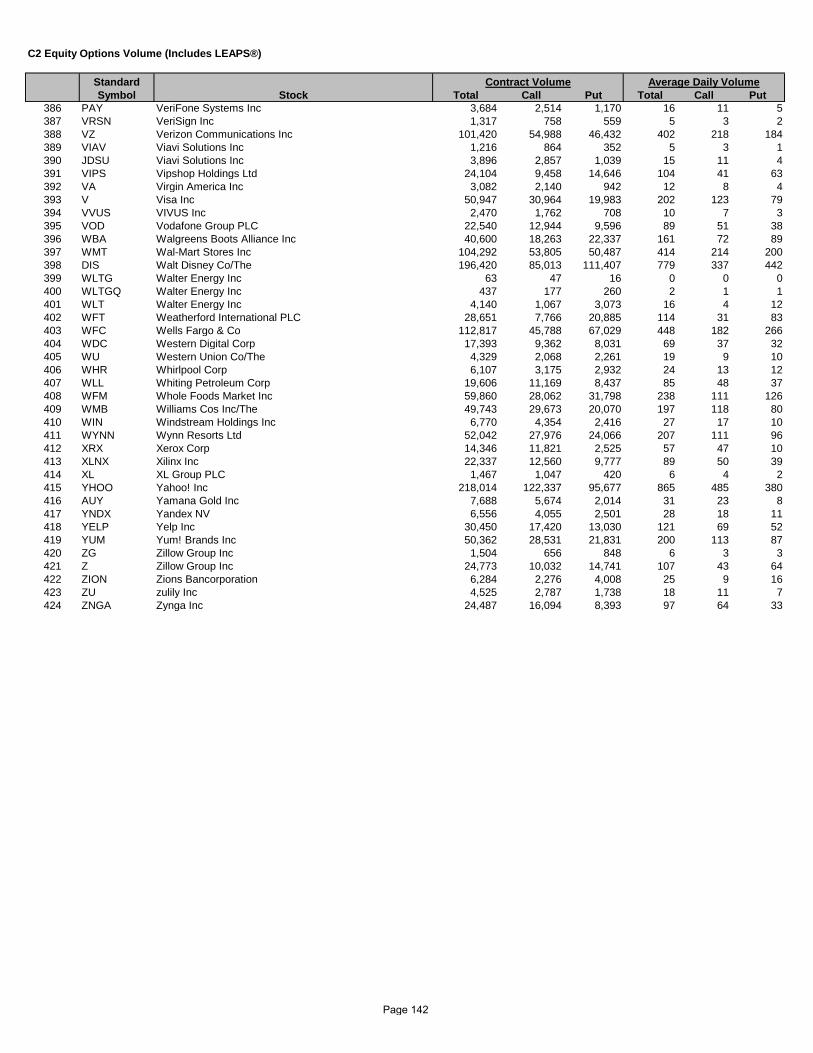
Standard Symbol Stock Total Call Put Total Call Put
C2 Equity Options Volume (Includes LEAPS®)
Contract Volume Average Daily Volume
386 PAY VeriFone Systems Inc 3,684 2,514 1,170 16 11 5387 VRSN VeriSign Inc 1,317 758 559 5 3 2388 VZ Verizon Communications Inc 101,420 54,988 46,432 402 218 184389 VIAV Viavi Solutions Inc 1,216 864 352 5 3 1390 JDSU Viavi Solutions Inc 3,896 2,857 1,039 15 11 4391 VIPS Vipshop Holdings Ltd 24,104 9,458 14,646 104 41 63392 VA Virgin America Inc 3,082 2,140 942 12 8 4393 V Visa Inc 50,947 30,964 19,983 202 123 79394 VVUS VIVUS Inc 2,470 1,762 708 10 7 3395 VOD Vodafone Group PLC 22,540 12,944 9,596 89 51 38396 WBA Walgreens Boots Alliance Inc 40,600 18,263 22,337 161 72 89397 WMT Wal-Mart Stores Inc 104,292 53,805 50,487 414 214 200398 DIS Walt Disney Co/The 196,420 85,013 111,407 779 337 442399 WLTG Walter Energy Inc 63 47 16 0 0 0400 WLTGQ Walter Energy Inc 437 177 260 2 1 1401 WLT Walter Energy Inc 4,140 1,067 3,073 16 4 12402 WFT Weatherford International PLC 28,651 7,766 20,885 114 31 83403 WFC Wells Fargo & Co 112,817 45,788 67,029 448 182 266404 WDC Western Digital Corp 17,393 9,362 8,031 69 37 32405 WU Western Union Co/The 4,329 2,068 2,261 19 9 10406 WHR Whirlpool Corp 6,107 3,175 2,932 24 13 12407 WLL Whiting Petroleum Corp 19,606 11,169 8,437 85 48 37408 WFM Whole Foods Market Inc 59,860 28,062 31,798 238 111 126409 WMB Williams Cos Inc/The 49,743 29,673 20,070 197 118 80410 WIN Windstream Holdings Inc 6,770 4,354 2,416 27 17 10411 WYNN Wynn Resorts Ltd 52,042 27,976 24,066 207 111 96412 XRX Xerox Corp 14,346 11,821 2,525 57 47 10413 XLNX Xilinx Inc 22,337 12,560 9,777 89 50 39414 XL XL Group PLC 1,467 1,047 420 6 4 2415 YHOO Yahoo! Inc 218,014 122,337 95,677 865 485 380416 AUY Yamana Gold Inc 7,688 5,674 2,014 31 23 8417 YNDX Yandex NV 6,556 4,055 2,501 28 18 11418 YELP Yelp Inc 30,450 17,420 13,030 121 69 52419 YUM Yum! Brands Inc 50,362 28,531 21,831 200 113 87420 ZG Zillow Group Inc 1,504 656 848 6 3 3421 Z Zillow Group Inc 24,773 10,032 14,741 107 43 64422 ZION Zions Bancorporation 6,284 2,276 4,008 25 9 16423 ZU zulily Inc 4,525 2,787 1,738 18 11 7424 ZNGA Zynga Inc 24,487 16,094 8,393 97 64 33
Page 142
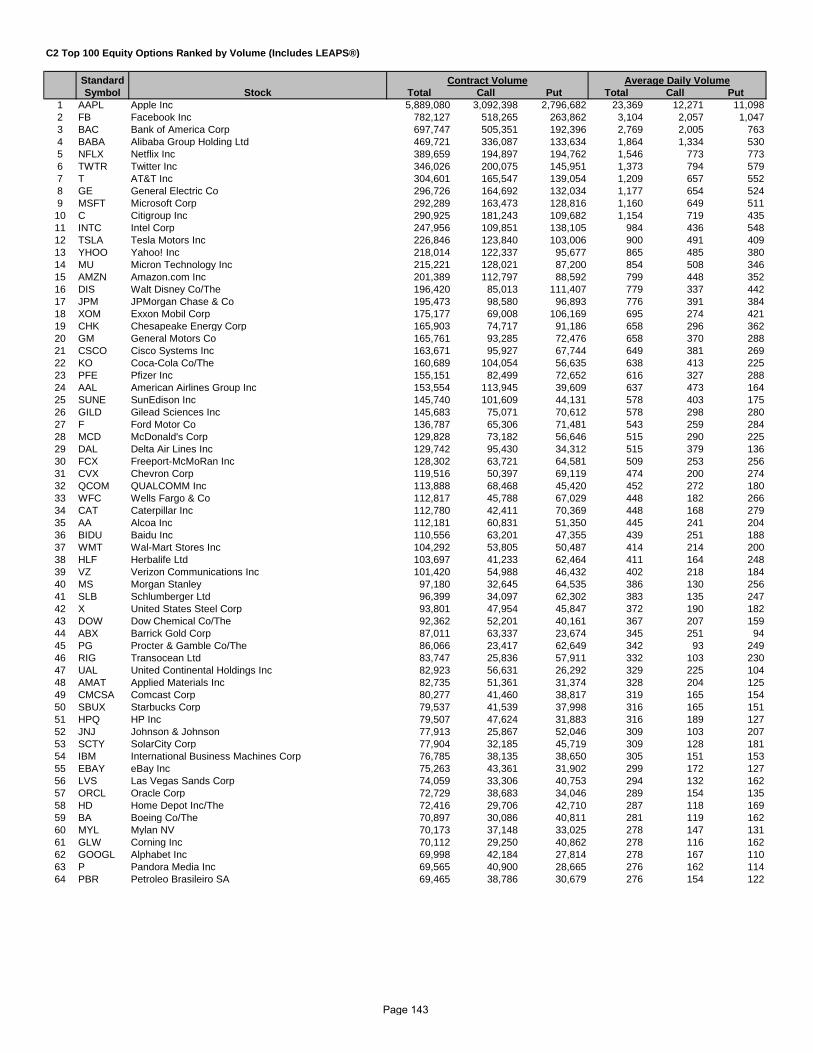
C2 Top 100 Equity Options Ranked by Volume (Includes LEAPS®)
Standard Symbol Stock Total Call Put Total Call Put
1 AAPL Apple Inc 5,889,080 3,092,398 2,796,682 23,369 12,271 11,0982 FB Facebook Inc 782,127 518,265 263,862 3,104 2,057 1,0473 BAC Bank of America Corp 697,747 505,351 192,396 2,769 2,005 7634 BABA Alibaba Group Holding Ltd 469,721 336,087 133,634 1,864 1,334 5305 NFLX Netflix Inc 389,659 194,897 194,762 1,546 773 7736 TWTR Twitter Inc 346,026 200,075 145,951 1,373 794 5797 T AT&T Inc 304,601 165,547 139,054 1,209 657 5528 GE General Electric Co 296,726 164,692 132,034 1,177 654 5249 MSFT Microsoft Corp 292,289 163,473 128,816 1,160 649 51110 C Citigroup Inc 290,925 181,243 109,682 1,154 719 43511 INTC Intel Corp 247,956 109,851 138,105 984 436 54812 TSLA Tesla Motors Inc 226,846 123,840 103,006 900 491 40913 YHOO Yahoo! Inc 218,014 122,337 95,677 865 485 38014 MU Micron Technology Inc 215,221 128,021 87,200 854 508 34615 AMZN Amazon.com Inc 201,389 112,797 88,592 799 448 35216 DIS Walt Disney Co/The 196,420 85,013 111,407 779 337 44217 JPM JPMorgan Chase & Co 195,473 98,580 96,893 776 391 38418 XOM Exxon Mobil Corp 175,177 69,008 106,169 695 274 42119 CHK Chesapeake Energy Corp 165,903 74,717 91,186 658 296 36220 GM General Motors Co 165,761 93,285 72,476 658 370 28821 CSCO Cisco Systems Inc 163,671 95,927 67,744 649 381 26922 KO Coca-Cola Co/The 160,689 104,054 56,635 638 413 22523 PFE Pfizer Inc 155,151 82,499 72,652 616 327 28824 AAL American Airlines Group Inc 153,554 113,945 39,609 637 473 16425 SUNE SunEdison Inc 145,740 101,609 44,131 578 403 17526 GILD Gilead Sciences Inc 145,683 75,071 70,612 578 298 28027 F Ford Motor Co 136,787 65,306 71,481 543 259 28428 MCD McDonald's Corp 129,828 73,182 56,646 515 290 22529 DAL Delta Air Lines Inc 129,742 95,430 34,312 515 379 13630 FCX Freeport-McMoRan Inc 128,302 63,721 64,581 509 253 25631 CVX Chevron Corp 119,516 50,397 69,119 474 200 27432 QCOM QUALCOMM Inc 113,888 68,468 45,420 452 272 18033 WFC Wells Fargo & Co 112,817 45,788 67,029 448 182 26634 CAT Caterpillar Inc 112,780 42,411 70,369 448 168 27935 AA Alcoa Inc 112,181 60,831 51,350 445 241 20436 BIDU Baidu Inc 110,556 63,201 47,355 439 251 18837 WMT Wal-Mart Stores Inc 104,292 53,805 50,487 414 214 20038 HLF Herbalife Ltd 103,697 41,233 62,464 411 164 24839 VZ Verizon Communications Inc 101,420 54,988 46,432 402 218 18440 MS Morgan Stanley 97,180 32,645 64,535 386 130 25641 SLB Schlumberger Ltd 96,399 34,097 62,302 383 135 24742 X United States Steel Corp 93,801 47,954 45,847 372 190 18243 DOW Dow Chemical Co/The 92,362 52,201 40,161 367 207 15944 ABX Barrick Gold Corp 87,011 63,337 23,674 345 251 9445 PG Procter & Gamble Co/The 86,066 23,417 62,649 342 93 24946 RIG Transocean Ltd 83,747 25,836 57,911 332 103 23047 UAL United Continental Holdings Inc 82,923 56,631 26,292 329 225 10448 AMAT Applied Materials Inc 82,735 51,361 31,374 328 204 12549 CMCSA Comcast Corp 80,277 41,460 38,817 319 165 15450 SBUX Starbucks Corp 79,537 41,539 37,998 316 165 15151 HPQ HP Inc 79,507 47,624 31,883 316 189 12752 JNJ Johnson & Johnson 77,913 25,867 52,046 309 103 20753 SCTY SolarCity Corp 77,904 32,185 45,719 309 128 18154 IBM International Business Machines Corp 76,785 38,135 38,650 305 151 15355 EBAY eBay Inc 75,263 43,361 31,902 299 172 12756 LVS Las Vegas Sands Corp 74,059 33,306 40,753 294 132 16257 ORCL Oracle Corp 72,729 38,683 34,046 289 154 13558 HD Home Depot Inc/The 72,416 29,706 42,710 287 118 16959 BA Boeing Co/The 70,897 30,086 40,811 281 119 16260 MYL Mylan NV 70,173 37,148 33,025 278 147 13161 GLW Corning Inc 70,112 29,250 40,862 278 116 16262 GOOGL Alphabet Inc 69,998 42,184 27,814 278 167 11063 P Pandora Media Inc 69,565 40,900 28,665 276 162 11464 PBR Petroleo Brasileiro SA 69,465 38,786 30,679 276 154 122
Contract Volume Average Daily Volume
Page 143

C2 Top 100 Equity Options Ranked by Volume (Includes LEAPS®)
Standard Symbol Stock Total Call Put Total Call Put
Contract Volume Average Daily Volume
65 GOOG Alphabet Inc 68,210 38,133 30,077 271 151 11966 GPRO GoPro Inc 67,078 34,153 32,925 266 136 13167 COP ConocoPhillips 65,992 28,519 37,473 262 113 14968 JD JD.com Inc 65,912 50,037 15,875 279 212 6769 GS Goldman Sachs Group Inc/The 65,088 41,138 23,950 258 163 9570 MGM MGM Resorts International 63,368 37,643 25,725 251 149 10271 VALE Vale SA 63,192 30,941 32,251 251 123 12872 MRK Merck & Co Inc 62,446 32,188 30,258 248 128 12073 PCLN Priceline Group Inc/The 62,367 32,823 29,544 247 130 11774 SHLD Sears Holdings Corp 61,077 9,647 51,430 242 38 20475 HAL Halliburton Co 61,012 31,992 29,020 242 127 11576 EMC EMC Corp/MA 60,364 34,069 26,295 240 135 10477 WFM Whole Foods Market Inc 59,860 28,062 31,798 238 111 12678 CELG Celgene Corp 59,547 32,478 27,069 236 129 10779 GMCR Keurig Green Mountain Inc 58,448 34,223 24,225 232 136 9680 SNDK SanDisk Corp 55,251 33,913 21,338 219 135 8581 UPS United Parcel Service Inc 54,699 32,343 22,356 217 128 8982 LNKD LinkedIn Corp 54,650 29,470 25,180 217 117 10083 AIG American International Group Inc 54,569 29,681 24,888 217 118 9984 BBRY BlackBerry Ltd 53,793 39,299 14,494 213 156 5885 DD EI du Pont de Nemours & Co 53,717 28,259 25,458 213 112 10186 AXP American Express Co 52,261 25,831 26,430 207 103 10587 WYNN Wynn Resorts Ltd 52,042 27,976 24,066 207 111 9688 VLO Valero Energy Corp 51,710 23,527 28,183 205 93 11289 BMY Bristol-Myers Squibb Co 51,324 27,818 23,506 204 110 9390 PEP PepsiCo Inc 51,031 24,112 26,919 203 96 10791 V Visa Inc 50,947 30,964 19,983 202 123 7992 MNKD MannKind Corp 50,675 28,810 21,865 201 114 8793 YUM Yum! Brands Inc 50,362 28,531 21,831 200 113 8794 LULU lululemon athletica Inc 50,349 21,361 28,988 200 85 11595 TGT Target Corp 49,768 23,143 26,625 197 92 10696 WMB Williams Cos Inc/The 49,743 29,673 20,070 197 118 8097 CLF Cliffs Natural Resources Inc 49,215 22,113 27,102 195 88 10898 NKE NIKE Inc 47,333 23,042 24,291 188 91 9699 JCP JC Penney Co Inc 47,264 28,397 18,867 188 113 75
100 KMI Kinder Morgan Inc/DE 46,818 27,091 19,727 186 108 78
Page 144

C2 CASH INDEX OPTIONS - 2015
Russell IndexesRussell 2000® Index (RUT): November 11, 1992.
Page 145
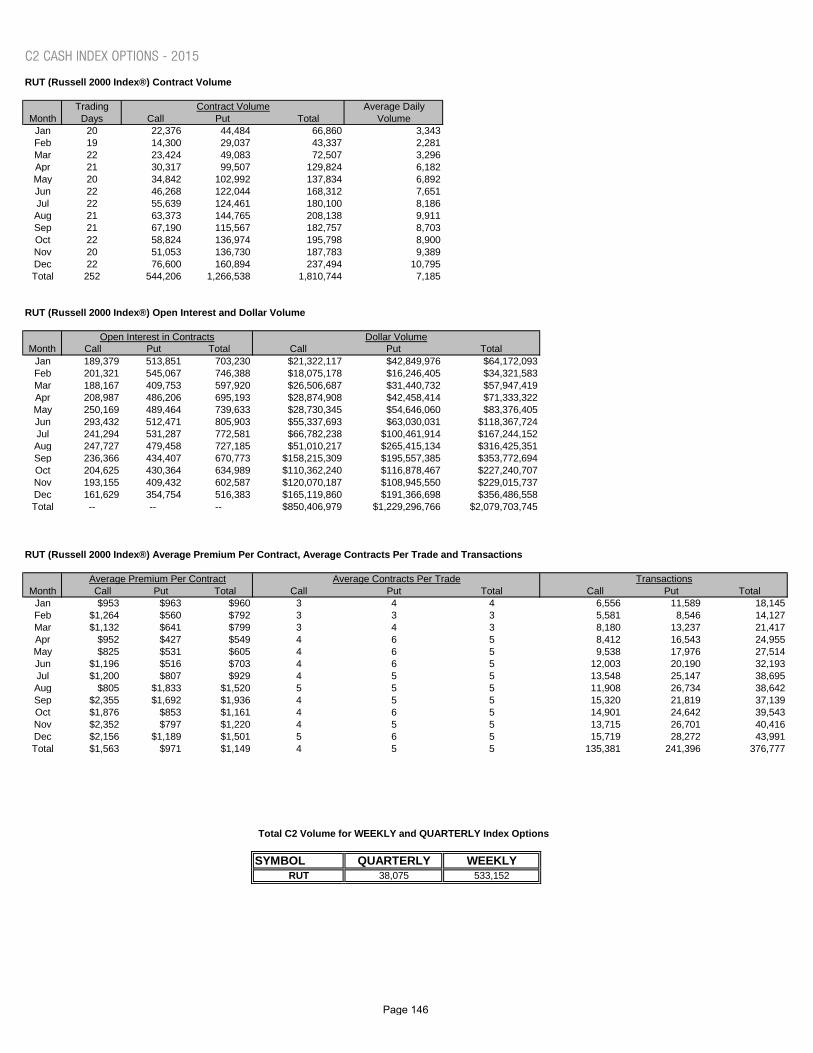
C2 CASH INDEX OPTIONS - 2015
RUT (Russell 2000 Index®) Contract Volume
Trading Average DailyMonth Days Call Put Total Volume
Jan 20 22,376 44,484 66,860 3,343Feb 19 14,300 29,037 43,337 2,281Mar 22 23,424 49,083 72,507 3,296Apr 21 30,317 99,507 129,824 6,182May 20 34,842 102,992 137,834 6,892Jun 22 46,268 122,044 168,312 7,651Jul 22 55,639 124,461 180,100 8,186Aug 21 63,373 144,765 208,138 9,911Sep 21 67,190 115,567 182,757 8,703Oct 22 58,824 136,974 195,798 8,900Nov 20 51,053 136,730 187,783 9,389Dec 22 76,600 160,894 237,494 10,795Total 252 544,206 1,266,538 1,810,744 7,185
RUT (Russell 2000 Index®) Open Interest and Dollar Volume
Month Call Put Total Call Put TotalJan 189,379 513,851 703,230 $21,322,117 $42,849,976 $64,172,093Feb 201,321 545,067 746,388 $18,075,178 $16,246,405 $34,321,583Mar 188,167 409,753 597,920 $26,506,687 $31,440,732 $57,947,419Apr 208,987 486,206 695,193 $28,874,908 $42,458,414 $71,333,322May 250,169 489,464 739,633 $28,730,345 $54,646,060 $83,376,405Jun 293,432 512,471 805,903 $55,337,693 $63,030,031 $118,367,724Jul 241,294 531,287 772,581 $66,782,238 $100,461,914 $167,244,152Aug 247,727 479,458 727,185 $51,010,217 $265,415,134 $316,425,351Sep 236,366 434,407 670,773 $158,215,309 $195,557,385 $353,772,694Oct 204,625 430,364 634,989 $110,362,240 $116,878,467 $227,240,707Nov 193,155 409,432 602,587 $120,070,187 $108,945,550 $229,015,737Dec 161,629 354,754 516,383 $165,119,860 $191,366,698 $356,486,558Total -- -- -- $850,406,979 $1,229,296,766 $2,079,703,745
RUT (Russell 2000 Index®) Average Premium Per Contract, Average Contracts Per Trade and Transactions
Month Call Put Total Call Put Total Call Put TotalJan $953 $963 $960 3 4 4 6,556 11,589 18,145Feb $1,264 $560 $792 3 3 3 5,581 8,546 14,127Mar $1,132 $641 $799 3 4 3 8,180 13,237 21,417Apr $952 $427 $549 4 6 5 8,412 16,543 24,955May $825 $531 $605 4 6 5 9,538 17,976 27,514Jun $1,196 $516 $703 4 6 5 12,003 20,190 32,193Jul $1,200 $807 $929 4 5 5 13,548 25,147 38,695Aug $805 $1,833 $1,520 5 5 5 11,908 26,734 38,642Sep $2,355 $1,692 $1,936 4 5 5 15,320 21,819 37,139Oct $1,876 $853 $1,161 4 6 5 14,901 24,642 39,543Nov $2,352 $797 $1,220 4 5 5 13,715 26,701 40,416Dec $2,156 $1,189 $1,501 5 6 5 15,719 28,272 43,991Total $1,563 $971 $1,149 4 5 5 135,381 241,396 376,777
SYMBOL QUARTERLY WEEKLYRUT 38,075 533,152
Total C2 Volume for WEEKLY and QUARTERLY Index Options
Transactions
Contract Volume
Open Interest in Contracts Dollar Volume
Average Premium Per Contract Average Contracts Per Trade
Page 146
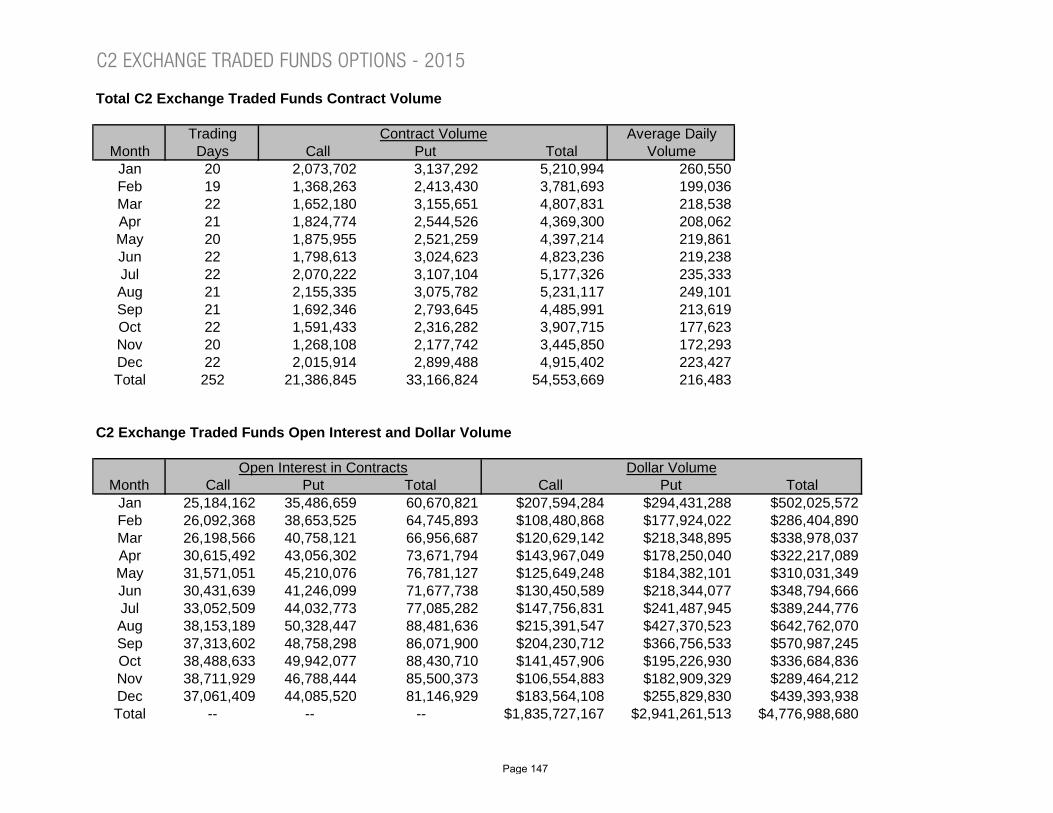
C2 EXCHANGE TRADED FUNDS OPTIONS - 2015
Total C2 Exchange Traded Funds Contract Volume
Trading Average DailyMonth Days Call Put Total Volume
Jan 20 2,073,702 3,137,292 5,210,994 260,550Feb 19 1,368,263 2,413,430 3,781,693 199,036Mar 22 1,652,180 3,155,651 4,807,831 218,538Apr 21 1,824,774 2,544,526 4,369,300 208,062May 20 1,875,955 2,521,259 4,397,214 219,861Jun 22 1,798,613 3,024,623 4,823,236 219,238Jul 22 2,070,222 3,107,104 5,177,326 235,333Aug 21 2,155,335 3,075,782 5,231,117 249,101Sep 21 1,692,346 2,793,645 4,485,991 213,619Oct 22 1,591,433 2,316,282 3,907,715 177,623Nov 20 1,268,108 2,177,742 3,445,850 172,293Dec 22 2,015,914 2,899,488 4,915,402 223,427Total 252 21,386,845 33,166,824 54,553,669 216,483
C2 Exchange Traded Funds Open Interest and Dollar Volume
Month Call Put Total Call Put TotalJan 25,184,162 35,486,659 60,670,821 $207,594,284 $294,431,288 $502,025,572Feb 26,092,368 38,653,525 64,745,893 $108,480,868 $177,924,022 $286,404,890Mar 26,198,566 40,758,121 66,956,687 $120,629,142 $218,348,895 $338,978,037Apr 30,615,492 43,056,302 73,671,794 $143,967,049 $178,250,040 $322,217,089May 31,571,051 45,210,076 76,781,127 $125,649,248 $184,382,101 $310,031,349Jun 30,431,639 41,246,099 71,677,738 $130,450,589 $218,344,077 $348,794,666Jul 33,052,509 44,032,773 77,085,282 $147,756,831 $241,487,945 $389,244,776Aug 38,153,189 50,328,447 88,481,636 $215,391,547 $427,370,523 $642,762,070Sep 37,313,602 48,758,298 86,071,900 $204,230,712 $366,756,533 $570,987,245Oct 38,488,633 49,942,077 88,430,710 $141,457,906 $195,226,930 $336,684,836Nov 38,711,929 46,788,444 85,500,373 $106,554,883 $182,909,329 $289,464,212Dec 37,061,409 44,085,520 81,146,929 $183,564,108 $255,829,830 $439,393,938Total -- -- -- $1,835,727,167 $2,941,261,513 $4,776,988,680
Contract Volume
Open Interest in Contracts Dollar Volume
Page 147

Total C2 Exchange Traded Funds Average Premium Per Contract, Average Contracts Per Trade and Transactions
Month Call Put Total Call Put Total Call Put TotalJan $100 $94 $96 30 35 33 69,208 90,139 159,347Feb $79 $74 $76 24 36 30 57,081 67,413 124,494Mar $73 $69 $71 25 37 32 64,960 84,714 149,674Apr $79 $70 $74 27 34 30 68,739 75,208 143,947May $67 $73 $71 26 32 29 73,398 79,532 152,930Jun $73 $72 $72 23 32 28 77,305 93,839 171,144Jul $71 $78 $75 24 30 27 86,590 104,766 191,356Aug $100 $139 $123 23 25 24 92,211 122,676 214,887Sep $121 $131 $127 18 22 21 92,295 125,271 217,566Oct $89 $84 $86 20 26 23 80,249 87,822 168,071Nov $84 $84 $84 20 29 25 62,111 75,650 137,761Dec $91 $88 $89 25 31 28 79,803 93,871 173,674Total $86 $89 $88 24 30 27 903,950 1,100,901 2,004,851
TransactionsAverage Premium Per Contract Average Contracts Per Trade
Page 148
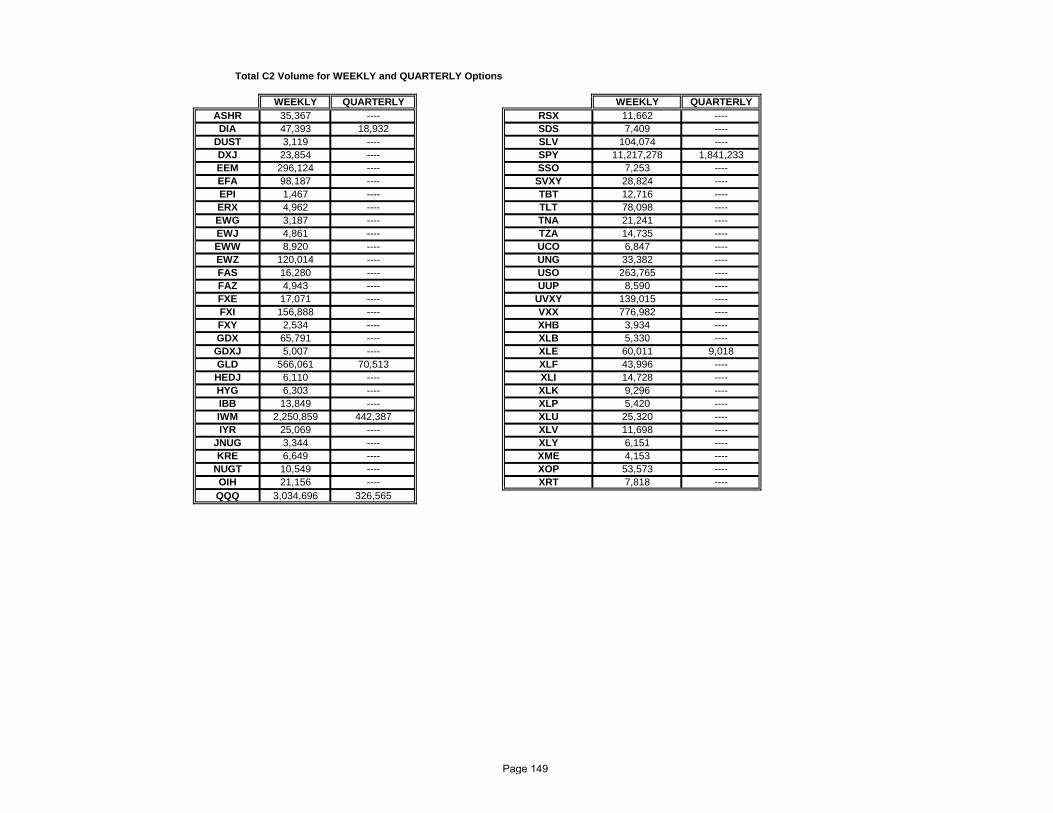
WEEKLY QUARTERLY WEEKLY QUARTERLYASHR 35,367 ---- RSX 11,662 ----DIA 47,393 18,932 SDS 7,409 ----
DUST 3,119 ---- SLV 104,074 ----DXJ 23,854 ---- SPY 11,217,278 1,841,233EEM 296,124 ---- SSO 7,253 ----EFA 98,187 ---- SVXY 28,824 ----EPI 1,467 ---- TBT 12,716 ----ERX 4,962 ---- TLT 78,098 ----EWG 3,187 ---- TNA 21,241 ----EWJ 4,861 ---- TZA 14,735 ----EWW 8,920 ---- UCO 6,847 ----EWZ 120,014 ---- UNG 33,382 ----FAS 16,280 ---- USO 263,765 ----FAZ 4,943 ---- UUP 8,590 ----FXE 17,071 ---- UVXY 139,015 ----FXI 156,888 ---- VXX 776,982 ----FXY 2,534 ---- XHB 3,934 ----GDX 65,791 ---- XLB 5,330 ----GDXJ 5,007 ---- XLE 60,011 9,018GLD 566,061 70,513 XLF 43,996 ----HEDJ 6,110 ---- XLI 14,728 ----HYG 6,303 ---- XLK 9,296 ----IBB 13,849 ---- XLP 5,420 ----IWM 2,250,859 442,387 XLU 25,320 ----IYR 25,069 ---- XLV 11,698 ----
JNUG 3,344 ---- XLY 6,151 ----KRE 6,649 ---- XME 4,153 ----
NUGT 10,549 ---- XOP 53,573 ----OIH 21,156 ---- XRT 7,818 ----QQQ 3,034,696 326,565
Total C2 Volume for WEEKLY and QUARTERLY Options
Page 149
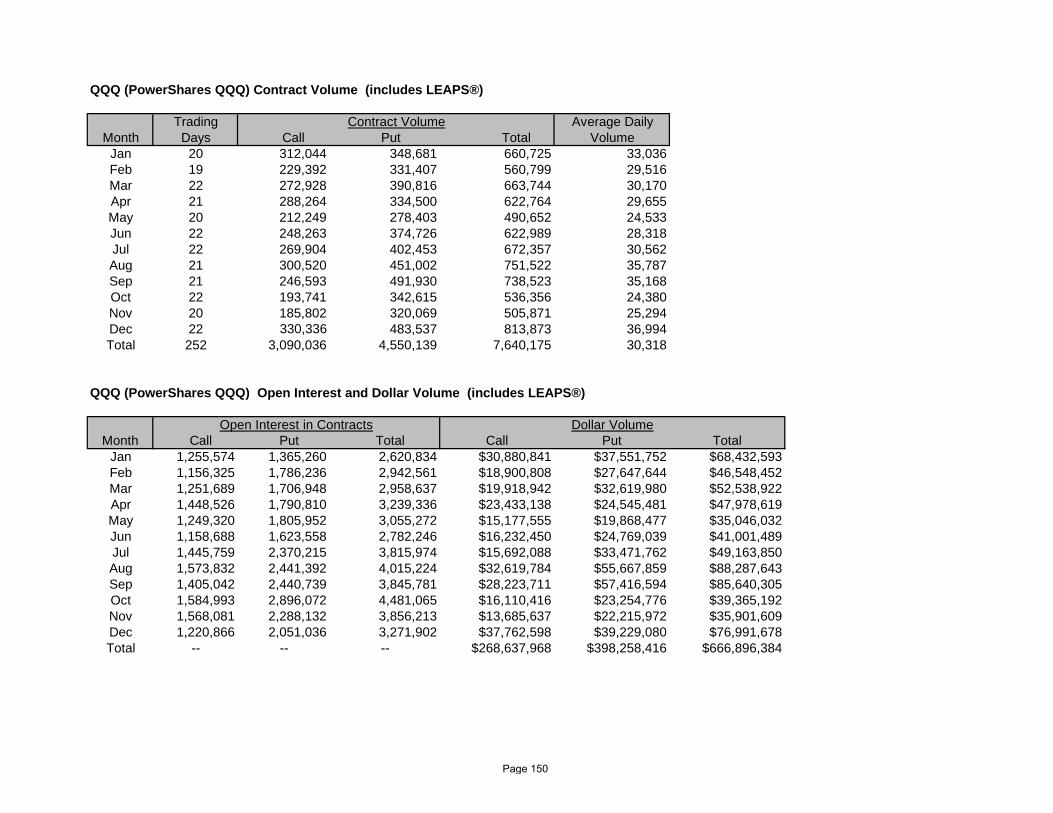
QQQ (PowerShares QQQ) Contract Volume (includes LEAPS®)
Trading Average DailyMonth Days Call Put Total Volume
Jan 20 312,044 348,681 660,725 33,036Feb 19 229,392 331,407 560,799 29,516Mar 22 272,928 390,816 663,744 30,170Apr 21 288,264 334,500 622,764 29,655May 20 212,249 278,403 490,652 24,533Jun 22 248,263 374,726 622,989 28,318Jul 22 269,904 402,453 672,357 30,562Aug 21 300,520 451,002 751,522 35,787Sep 21 246,593 491,930 738,523 35,168Oct 22 193,741 342,615 536,356 24,380Nov 20 185,802 320,069 505,871 25,294Dec 22 330,336 483,537 813,873 36,994Total 252 3,090,036 4,550,139 7,640,175 30,318
QQQ (PowerShares QQQ) Open Interest and Dollar Volume (includes LEAPS®)
Month Call Put Total Call Put TotalJan 1,255,574 1,365,260 2,620,834 $30,880,841 $37,551,752 $68,432,593Feb 1,156,325 1,786,236 2,942,561 $18,900,808 $27,647,644 $46,548,452Mar 1,251,689 1,706,948 2,958,637 $19,918,942 $32,619,980 $52,538,922Apr 1,448,526 1,790,810 3,239,336 $23,433,138 $24,545,481 $47,978,619May 1,249,320 1,805,952 3,055,272 $15,177,555 $19,868,477 $35,046,032Jun 1,158,688 1,623,558 2,782,246 $16,232,450 $24,769,039 $41,001,489Jul 1,445,759 2,370,215 3,815,974 $15,692,088 $33,471,762 $49,163,850Aug 1,573,832 2,441,392 4,015,224 $32,619,784 $55,667,859 $88,287,643Sep 1,405,042 2,440,739 3,845,781 $28,223,711 $57,416,594 $85,640,305Oct 1,584,993 2,896,072 4,481,065 $16,110,416 $23,254,776 $39,365,192Nov 1,568,081 2,288,132 3,856,213 $13,685,637 $22,215,972 $35,901,609Dec 1,220,866 2,051,036 3,271,902 $37,762,598 $39,229,080 $76,991,678Total -- -- -- $268,637,968 $398,258,416 $666,896,384
Dollar Volume
Contract Volume
Open Interest in Contracts
Page 150

QQQ (PowerShares QQQ) Average Premium Per Contract, Average Contracts Per Trade and Transactions (includes LEAPS®)
Month Call Put Total Call Put Total Call Put TotalJan $99 $108 $104 36 30 33 8,573 11,608 20,181Feb $82 $83 $83 42 47 45 5,444 7,121 12,565Mar $73 $83 $79 40 40 40 6,747 9,844 16,591Apr $81 $73 $77 42 39 40 6,910 8,597 15,507May $72 $71 $71 40 44 42 5,252 6,391 11,643Jun $65 $66 $66 46 49 48 5,391 7,713 13,104Jul $58 $83 $73 46 46 46 5,876 8,739 14,615Aug $109 $123 $117 37 36 37 8,140 12,357 20,497Sep $114 $117 $116 29 29 29 8,518 17,087 25,605Oct $83 $68 $73 34 42 39 5,741 8,128 13,869Nov $74 $69 $71 32 40 37 5,743 8,054 13,797Dec $114 $81 $95 37 42 40 8,880 11,631 20,511Total $87 $88 $87 38 39 38 81,215 117,270 198,485
Average Premium Per Contract Average Contracts Per Trade Transactions
Page 151

DIA (DIAMONDS) Contract Volume (includes LEAPS®)
Trading Average DailyMonth Days Call Put Total Volume
Jan 20 5,498 7,215 12,713 636Feb 19 4,785 4,138 8,923 470Mar 22 7,362 5,111 12,473 567Apr 21 5,821 3,664 9,485 452May 20 5,500 4,916 10,416 521Jun 22 8,031 12,204 20,235 920Jul 22 11,744 12,079 23,823 1,083Aug 21 10,923 9,648 20,571 980Sep 21 7,812 8,183 15,995 762Oct 22 7,080 9,908 16,988 772Nov 20 10,150 4,668 14,818 741Dec 22 7,163 8,283 15,446 702Total 252 91,869 90,017 181,886 722
DIA (DIAMONDS) Open Interest and Dollar Volume (includes LEAPS®)
Month Call Put Total Call Put TotalJan 239,066 279,988 519,054 $845,626 $1,410,245 $2,255,871Feb 204,573 258,269 462,842 $828,890 $552,335 $1,381,225Mar 196,352 239,236 435,588 $890,167 $886,378 $1,776,545Apr 205,918 254,159 460,077 $675,886 $730,252 $1,406,138May 204,236 266,811 471,047 $3,295,719 $795,439 $4,091,158Jun 249,680 300,538 550,218 $1,758,843 $2,816,356 $4,575,199Jul 298,708 322,178 620,886 $2,239,131 $3,372,955 $5,612,086Aug 384,907 435,111 820,018 $2,631,177 $2,941,481 $5,572,658Sep 356,733 416,934 773,667 $2,515,003 $2,193,251 $4,708,254Oct 358,288 409,093 767,381 $1,606,575 $1,754,415 $3,360,990Nov 335,292 327,706 662,998 $1,508,736 $871,202 $2,379,938Dec 386,545 315,895 702,440 $1,004,907 $1,157,974 $2,162,881Total -- -- -- $19,800,660 $19,482,283 $39,282,943
Dollar Volume
Contract Volume
Open Interest in Contracts
Page 152

DIA (DIAMONDS) Average Premium Per Contract, Average Contracts Per Trade and Transactions (includes LEAPS®)
Month Call Put Total Call Put Total Call Put TotalJan $154 $195 $177 6 7 7 940 972 1,912Feb $173 $133 $155 4 4 4 1,134 1,013 2,147Mar $121 $173 $142 6 4 5 1,212 1,413 2,625Apr $116 $199 $148 6 3 4 1,057 1,225 2,282May $599 $162 $393 3 4 4 1,672 1,141 2,813Jun $219 $231 $226 5 6 6 1,587 1,893 3,480Jul $191 $279 $236 5 6 6 2,222 2,001 4,223Aug $241 $305 $271 7 5 5 1,634 2,143 3,777Sep $322 $268 $294 5 4 4 1,543 2,062 3,605Oct $227 $177 $198 4 5 4 2,001 1,825 3,826Nov $149 $187 $161 8 4 6 1,246 1,076 2,322Dec $140 $140 $140 5 5 5 1,457 1,588 3,045Total $216 $216 $216 5 5 5 17,705 18,352 36,057
TransactionsAverage Premium Per Contract Average Contracts Per Trade
Page 153
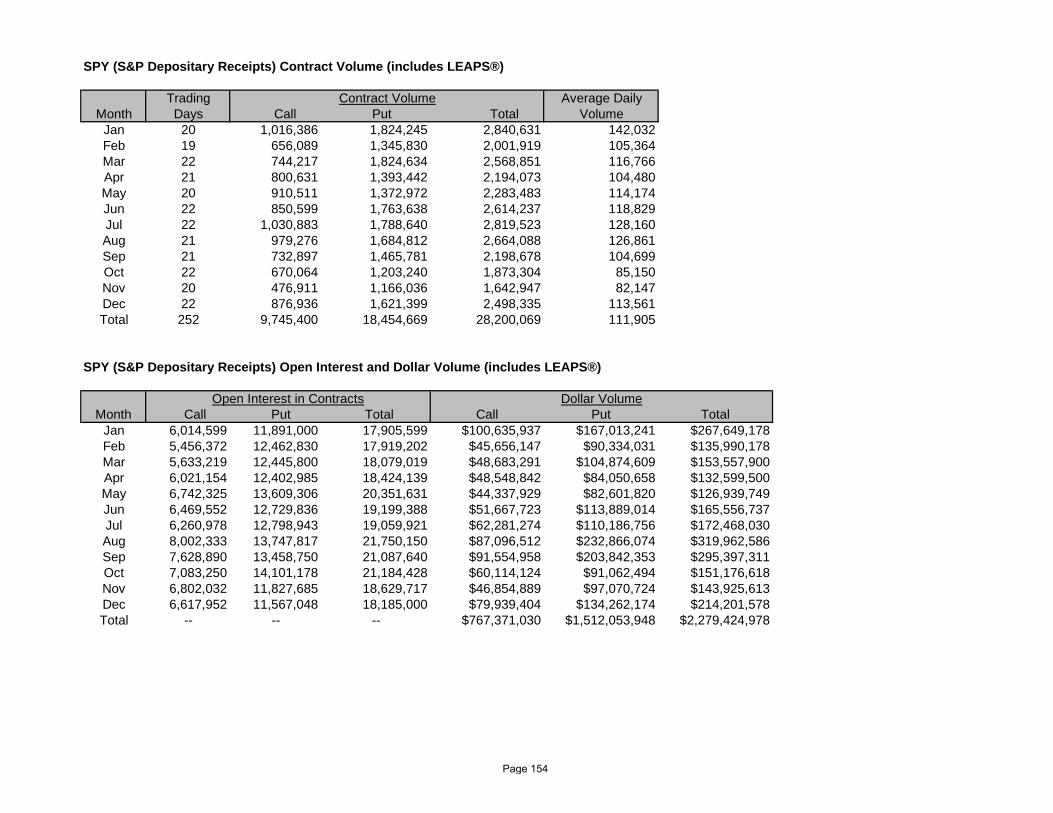
SPY (S&P Depositary Receipts) Contract Volume (includes LEAPS®)
Trading Average DailyMonth Days Call Put Total Volume
Jan 20 1,016,386 1,824,245 2,840,631 142,032Feb 19 656,089 1,345,830 2,001,919 105,364Mar 22 744,217 1,824,634 2,568,851 116,766Apr 21 800,631 1,393,442 2,194,073 104,480May 20 910,511 1,372,972 2,283,483 114,174Jun 22 850,599 1,763,638 2,614,237 118,829Jul 22 1,030,883 1,788,640 2,819,523 128,160Aug 21 979,276 1,684,812 2,664,088 126,861Sep 21 732,897 1,465,781 2,198,678 104,699Oct 22 670,064 1,203,240 1,873,304 85,150Nov 20 476,911 1,166,036 1,642,947 82,147Dec 22 876,936 1,621,399 2,498,335 113,561Total 252 9,745,400 18,454,669 28,200,069 111,905
SPY (S&P Depositary Receipts) Open Interest and Dollar Volume (includes LEAPS®)
Month Call Put Total Call Put TotalJan 6,014,599 11,891,000 17,905,599 $100,635,937 $167,013,241 $267,649,178Feb 5,456,372 12,462,830 17,919,202 $45,656,147 $90,334,031 $135,990,178Mar 5,633,219 12,445,800 18,079,019 $48,683,291 $104,874,609 $153,557,900Apr 6,021,154 12,402,985 18,424,139 $48,548,842 $84,050,658 $132,599,500May 6,742,325 13,609,306 20,351,631 $44,337,929 $82,601,820 $126,939,749Jun 6,469,552 12,729,836 19,199,388 $51,667,723 $113,889,014 $165,556,737Jul 6,260,978 12,798,943 19,059,921 $62,281,274 $110,186,756 $172,468,030Aug 8,002,333 13,747,817 21,750,150 $87,096,512 $232,866,074 $319,962,586Sep 7,628,890 13,458,750 21,087,640 $91,554,958 $203,842,353 $295,397,311Oct 7,083,250 14,101,178 21,184,428 $60,114,124 $91,062,494 $151,176,618Nov 6,802,032 11,827,685 18,629,717 $46,854,889 $97,070,724 $143,925,613Dec 6,617,952 11,567,048 18,185,000 $79,939,404 $134,262,174 $214,201,578Total -- -- -- $767,371,030 $1,512,053,948 $2,279,424,978
Open Interest in Contracts Dollar Volume
Contract Volume
Page 154

SPY (S&P Depositary Receipts) Average Premium Per Contract, Average Contracts Per Trade and Transactions (includes LEAPS®)
Month Call Put Total Call Put Total Call Put TotalJan $99 $92 $94 49 50 50 20,686 36,636 57,322Feb $70 $67 $68 42 62 54 15,520 21,734 37,254Mar $65 $57 $60 46 65 58 16,046 28,284 44,330Apr $61 $60 $60 51 60 56 15,790 23,177 38,967May $49 $60 $56 50 58 54 18,335 23,675 42,010Jun $61 $65 $63 44 53 50 19,124 33,172 52,296Jul $60 $62 $61 45 52 49 22,938 34,435 57,373Aug $89 $138 $120 38 36 37 26,037 46,400 72,437Sep $125 $139 $134 30 34 33 24,671 42,564 67,235Oct $90 $76 $81 33 47 41 20,599 25,515 46,114Nov $98 $83 $88 34 53 45 14,117 22,175 36,292Dec $91 $83 $86 46 55 51 18,999 29,581 48,580Total $79 $82 $81 42 50 47 232,862 367,348 600,210
TransactionsAverage Premium Per Contract Average Contracts Per Trade
Page 155
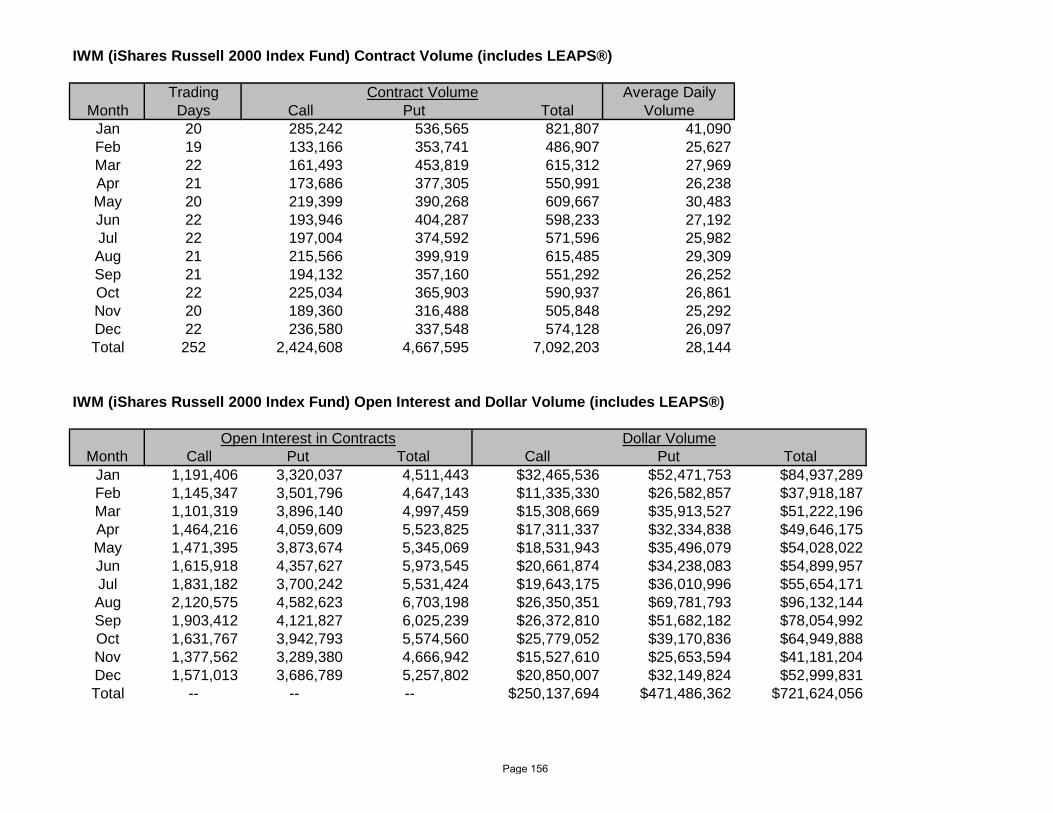
IWM (iShares Russell 2000 Index Fund) Contract Volume (includes LEAPS®)
Trading Average DailyMonth Days Call Put Total Volume
Jan 20 285,242 536,565 821,807 41,090Feb 19 133,166 353,741 486,907 25,627Mar 22 161,493 453,819 615,312 27,969Apr 21 173,686 377,305 550,991 26,238May 20 219,399 390,268 609,667 30,483Jun 22 193,946 404,287 598,233 27,192Jul 22 197,004 374,592 571,596 25,982Aug 21 215,566 399,919 615,485 29,309Sep 21 194,132 357,160 551,292 26,252Oct 22 225,034 365,903 590,937 26,861Nov 20 189,360 316,488 505,848 25,292Dec 22 236,580 337,548 574,128 26,097Total 252 2,424,608 4,667,595 7,092,203 28,144
IWM (iShares Russell 2000 Index Fund) Open Interest and Dollar Volume (includes LEAPS®)
Month Call Put Total Call Put TotalJan 1,191,406 3,320,037 4,511,443 $32,465,536 $52,471,753 $84,937,289Feb 1,145,347 3,501,796 4,647,143 $11,335,330 $26,582,857 $37,918,187Mar 1,101,319 3,896,140 4,997,459 $15,308,669 $35,913,527 $51,222,196Apr 1,464,216 4,059,609 5,523,825 $17,311,337 $32,334,838 $49,646,175May 1,471,395 3,873,674 5,345,069 $18,531,943 $35,496,079 $54,028,022Jun 1,615,918 4,357,627 5,973,545 $20,661,874 $34,238,083 $54,899,957Jul 1,831,182 3,700,242 5,531,424 $19,643,175 $36,010,996 $55,654,171Aug 2,120,575 4,582,623 6,703,198 $26,350,351 $69,781,793 $96,132,144Sep 1,903,412 4,121,827 6,025,239 $26,372,810 $51,682,182 $78,054,992Oct 1,631,767 3,942,793 5,574,560 $25,779,052 $39,170,836 $64,949,888Nov 1,377,562 3,289,380 4,666,942 $15,527,610 $25,653,594 $41,181,204Dec 1,571,013 3,686,789 5,257,802 $20,850,007 $32,149,824 $52,999,831Total -- -- -- $250,137,694 $471,486,362 $721,624,056
Dollar VolumeOpen Interest in Contracts
Contract Volume
Page 156

IWM (iShares Russell 2000 Index Fund) Average Premium Per Contract, Average Contracts Per Trade and Transactions (includes LEAPS®)
Month Call Put Total Call Put Total Call Put TotalJan $114 $98 $103 35 42 39 8,035 12,902 20,937Feb $85 $75 $78 24 45 36 5,565 7,924 13,489Mar $95 $79 $83 27 53 42 5,973 8,590 14,563Apr $100 $86 $90 39 52 47 4,419 7,213 11,632May $84 $91 $89 37 39 38 5,882 9,984 15,866Jun $107 $85 $92 25 34 30 7,755 11,949 19,704Jul $100 $96 $97 31 33 32 6,458 11,268 17,726Aug $122 $174 $156 28 25 26 7,773 16,025 23,798Sep $136 $145 $142 18 20 19 11,001 17,927 28,928Oct $115 $107 $110 25 28 27 8,907 13,226 22,133Nov $82 $81 $81 33 33 33 5,817 9,585 15,402Dec $88 $95 $92 30 31 30 7,891 11,002 18,893Total $103 $101 $102 28 34 32 85,476 137,595 223,071
Average Premium Per Contract Average Contracts Per Trade Transactions
Page 157

Other C2 Exchange Traded Funds Contract Volume
Trading Average DailyMonth Days Call Put Total Volume
Jan 20 454,532 420,586 875,118 43,756Feb 19 344,831 378,314 723,145 38,060Mar 22 466,180 481,271 947,451 43,066Apr 21 556,372 435,615 991,987 47,237May 20 528,296 474,700 1,002,996 50,150Jun 22 497,774 469,768 967,542 43,979Jul 22 560,687 529,340 1,090,027 49,547Aug 21 649,050 530,401 1,179,451 56,164Sep 21 510,912 470,591 981,503 46,738Oct 22 495,514 394,616 890,130 40,460Nov 20 405,885 370,481 776,366 38,818Dec 22 564,899 448,721 1,013,620 46,074Total 252 6,034,932 5,404,404 11,439,336 45,394
Other C2 Exchange Traded Funds Open Interest and Dollar Volume
Month Call Put Total Call Put TotalJan 16,483,517 18,630,374 35,113,891 $42,766,344 $35,984,297 $78,750,641Feb 18,129,751 20,644,394 38,774,145 $31,759,693 $32,807,155 $64,566,848Mar 18,015,987 22,469,997 40,485,984 $35,828,073 $44,054,401 $79,882,474Apr 21,475,678 24,548,739 46,024,417 $53,997,846 $36,588,811 $90,586,657May 21,903,775 25,654,333 47,558,108 $44,306,102 $45,620,286 $89,926,388Jun 20,937,801 22,234,540 43,172,341 $40,129,699 $42,631,585 $82,761,284Jul 23,215,882 24,841,195 48,057,077 $47,901,163 $58,445,476 $106,346,639Aug 26,071,542 29,121,504 55,193,046 $66,693,723 $66,113,316 $132,807,039Sep 26,019,525 28,320,048 54,339,573 $55,564,230 $51,622,153 $107,186,383Oct 27,830,335 28,592,941 56,423,276 $37,847,739 $39,984,409 $77,832,148Nov 28,628,962 29,055,541 57,684,503 $28,978,011 $37,097,837 $66,075,848Dec 27,265,033 26,464,752 53,729,785 $44,007,192 $49,030,778 $93,037,970Total -- -- -- $529,779,815 $539,980,504 $1,069,760,319
Contract Volume
Open Interest in Contracts Dollar Volume
Page 158

Other C2 Exchange Traded Funds Average Premium Per Contract, Average Contracts Per Trade and Transactions
Month Call Put Total Call Put Total Call Put TotalJan $94 $86 $90 15 15 15 30,974 28,021 58,995Feb $92 $87 $89 12 13 12 29,418 29,621 59,039Mar $77 $92 $84 13 13 13 34,982 36,583 71,565Apr $97 $84 $91 14 12 13 40,563 34,996 75,559May $84 $96 $90 13 12 12 42,257 38,341 80,598Jun $81 $91 $86 11 12 12 43,448 39,112 82,560Jul $85 $110 $98 11 11 11 49,096 48,323 97,419Aug $103 $125 $113 13 12 12 48,627 45,751 94,378Sep $109 $110 $109 11 10 11 46,562 45,631 92,193Oct $76 $101 $87 12 10 11 43,001 39,128 82,129Nov $71 $100 $85 12 11 11 35,188 34,760 69,948Dec $78 $109 $92 13 11 12 42,576 40,069 82,645Total $88 $100 $94 12 12 12 486,692 460,336 947,028
Average Premium Per Contract Average Contracts Per Trade Transactions
Includes AMJ, ASHR, DUST, DXJ, EEM, EFA, EPI, ERX, EWG, EWJ, EWT, EWW, EWY, EWZ, FAS, FAZ, FXE, FXI, FXP, FXY, GDX, GDXJ, GLD, HEDJ, HYG, IBB, IYR, JNK, JNUG, KRE, NUGT, OIH, QID, QLD, RSX, RUSL, SDS, SKF, SLV, SRS, SSO, SVXY, TBT, TLT, TNA, TZA, UCO, UNG, URE, USO, UUP, UVXY, UYG, VXX, XHB, XLB, XLE, XLF, XLI, XLK, XLP, XLU, XLV, XLY, XME, XOP, XRT
Page 159
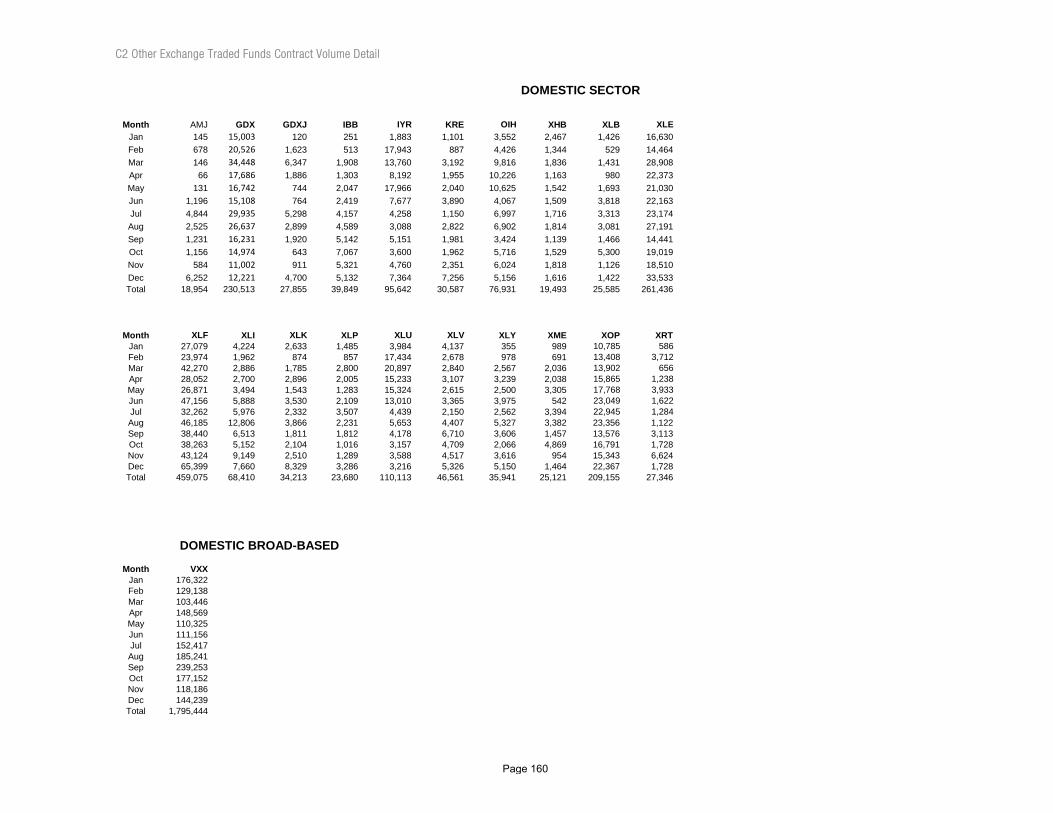
C2 Other Exchange Traded Funds Contract Volume Detail
Month AMJ GDX GDXJ IBB IYR KRE OIH XHB XLB XLEJan 145 15,003 120 251 1,883 1,101 3,552 2,467 1,426 16,630Feb 678 20,526 1,623 513 17,943 887 4,426 1,344 529 14,464Mar 146 34,448 6,347 1,908 13,760 3,192 9,816 1,836 1,431 28,908Apr 66 17,686 1,886 1,303 8,192 1,955 10,226 1,163 980 22,373May 131 16,742 744 2,047 17,966 2,040 10,625 1,542 1,693 21,030Jun 1,196 15,108 764 2,419 7,677 3,890 4,067 1,509 3,818 22,163Jul 4,844 29,935 5,298 4,157 4,258 1,150 6,997 1,716 3,313 23,174Aug 2,525 26,637 2,899 4,589 3,088 2,822 6,902 1,814 3,081 27,191Sep 1,231 16,231 1,920 5,142 5,151 1,981 3,424 1,139 1,466 14,441Oct 1,156 14,974 643 7,067 3,600 1,962 5,716 1,529 5,300 19,019Nov 584 11,002 911 5,321 4,760 2,351 6,024 1,818 1,126 18,510Dec 6,252 12,221 4,700 5,132 7,364 7,256 5,156 1,616 1,422 33,533Total 18,954 230,513 27,855 39,849 95,642 30,587 76,931 19,493 25,585 261,436
Month XLF XLI XLK XLP XLU XLV XLY XME XOP XRTJan 27,079 4,224 2,633 1,485 3,984 4,137 355 989 10,785 586Feb 23,974 1,962 874 857 17,434 2,678 978 691 13,408 3,712Mar 42,270 2,886 1,785 2,800 20,897 2,840 2,567 2,036 13,902 656Apr 28,052 2,700 2,896 2,005 15,233 3,107 3,239 2,038 15,865 1,238May 26,871 3,494 1,543 1,283 15,324 2,615 2,500 3,305 17,768 3,933Jun 47,156 5,888 3,530 2,109 13,010 3,365 3,975 542 23,049 1,622Jul 32,262 5,976 2,332 3,507 4,439 2,150 2,562 3,394 22,945 1,284Aug 46,185 12,806 3,866 2,231 5,653 4,407 5,327 3,382 23,356 1,122Sep 38,440 6,513 1,811 1,812 4,178 6,710 3,606 1,457 13,576 3,113Oct 38,263 5,152 2,104 1,016 3,157 4,709 2,066 4,869 16,791 1,728Nov 43,124 9,149 2,510 1,289 3,588 4,517 3,616 954 15,343 6,624Dec 65,399 7,660 8,329 3,286 3,216 5,326 5,150 1,464 22,367 1,728Total 459,075 68,410 34,213 23,680 110,113 46,561 35,941 25,121 209,155 27,346
Month VXXJan 176,322Feb 129,138Mar 103,446Apr 148,569May 110,325Jun 111,156Jul 152,417Aug 185,241Sep 239,253Oct 177,152Nov 118,186Dec 144,239Total 1,795,444
DOMESTIC SECTOR
DOMESTIC BROAD-BASED
Page 160

Month ASHR DXJ EEM EFA EPI EWG EWJJan 6,414 2,478 163,610 35,411 22 14 347Feb 11,011 3,360 102,310 23,690 180 1,510 5,896Mar 15,721 4,031 151,562 33,467 1,978 2,337 798Apr 56,078 6,394 116,933 20,635 1,387 2,746 2,561May 64,695 5,799 145,111 41,890 1,445 3,960 3,697Jun 26,567 4,455 164,240 59,348 426 3,829 1,424Jul 29,111 3,777 116,262 36,466 939 2,710 1,371Aug 8,266 6,437 181,830 38,244 497 1,905 2,970Sep 4,901 3,450 120,697 18,250 784 2,401 1,809Oct 3,259 6,984 113,190 24,450 85 1,554 3,224Nov 2,357 5,363 113,661 27,821 3,353 793 3,261Dec 3,549 6,868 121,030 33,970 79 200 1,074Total 231,929 59,396 1,610,436 393,642 11,175 23,959 28,432
Month EWT EWW EWY EWZ FXI HEDJ RSXJan 327 2,438 1,302 39,399 44,867Feb 509 868 550 27,518 26,396 5,519Mar 336 3,275 602 53,568 43,417 3,377Apr 2,445 3,461 1,052 37,413 76,125 8,945May 979 2,364 1,258 38,280 74,560 7,204 3,540Jun 451 8,062 1,690 16,691 73,203 5,734 1,836Jul 223 8,649 1,134 27,046 117,878 5,692 3,107Aug 1,641 3,037 2,240 40,075 52,851 1,605 5,496Sep 223 2,004 2,011 42,908 53,487 1,932 4,101Oct 339 835 1,096 37,936 48,625 1,977 1,617Nov 339 2,024 945 35,615 35,860 3,110 1,831Dec 38 1,755 1,747 36,263 43,351 1,649 3,383Total 7,850 38,772 15,627 432,712 690,620 28,903 42,752
Month GLD SLV UNG USOJan 132,083 51,314 6,698 67,707Feb 110,090 23,574 4,938 60,251Mar 116,335 21,385 4,323 107,056Apr 119,131 39,661 7,094 108,401May 80,863 65,155 8,657 74,545Jun 96,401 47,137 8,926 66,958Jul 148,208 68,378 6,502 86,848Aug 184,757 51,413 5,920 94,912Sep 174,176 35,333 4,119 51,929Oct 142,409 28,561 7,739 64,229Nov 110,093 20,906 5,058 60,837Dec 187,520 25,079 5,804 77,490Total 1,602,066 477,896 75,778 921,163
FOREIGN
COMMODITY POOLS
Page 161
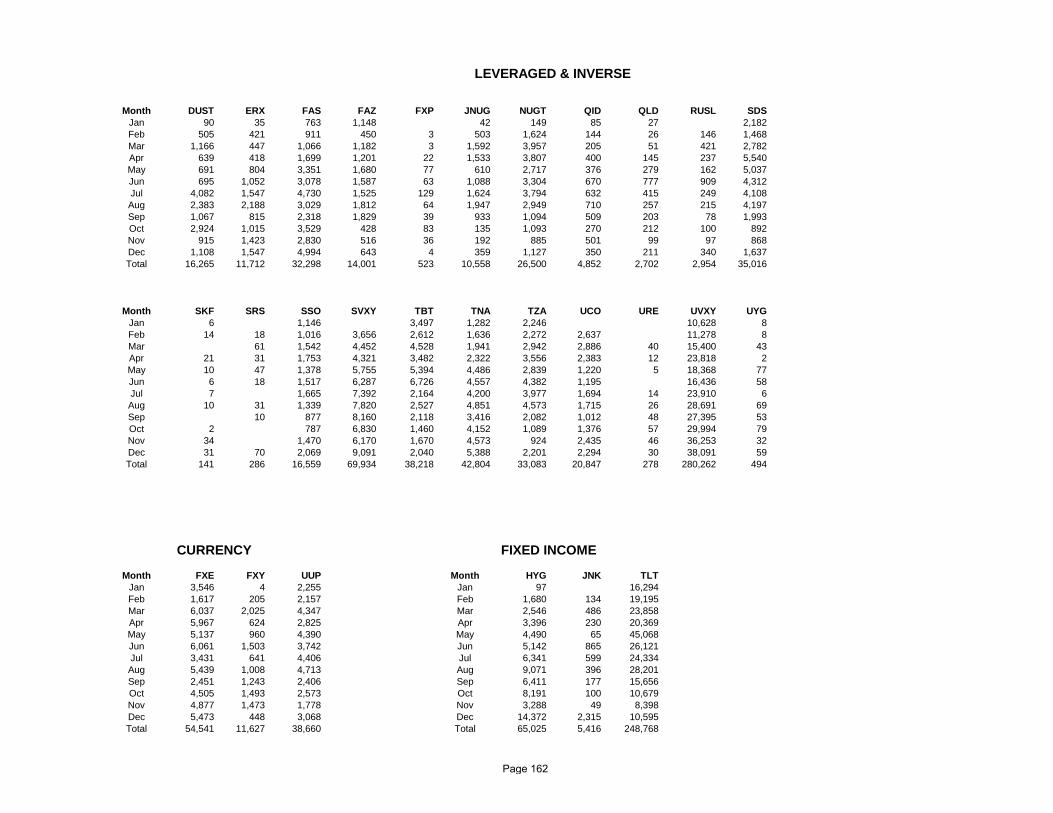
Month DUST ERX FAS FAZ FXP JNUG NUGT QID QLD RUSL SDSJan 90 35 763 1,148 42 149 85 27 2,182Feb 505 421 911 450 3 503 1,624 144 26 146 1,468Mar 1,166 447 1,066 1,182 3 1,592 3,957 205 51 421 2,782Apr 639 418 1,699 1,201 22 1,533 3,807 400 145 237 5,540May 691 804 3,351 1,680 77 610 2,717 376 279 162 5,037Jun 695 1,052 3,078 1,587 63 1,088 3,304 670 777 909 4,312Jul 4,082 1,547 4,730 1,525 129 1,624 3,794 632 415 249 4,108Aug 2,383 2,188 3,029 1,812 64 1,947 2,949 710 257 215 4,197Sep 1,067 815 2,318 1,829 39 933 1,094 509 203 78 1,993Oct 2,924 1,015 3,529 428 83 135 1,093 270 212 100 892Nov 915 1,423 2,830 516 36 192 885 501 99 97 868Dec 1,108 1,547 4,994 643 4 359 1,127 350 211 340 1,637Total 16,265 11,712 32,298 14,001 523 10,558 26,500 4,852 2,702 2,954 35,016
Month SKF SRS SSO SVXY TBT TNA TZA UCO URE UVXY UYGJan 6 1,146 3,497 1,282 2,246 10,628 8Feb 14 18 1,016 3,656 2,612 1,636 2,272 2,637 11,278 8Mar 61 1,542 4,452 4,528 1,941 2,942 2,886 40 15,400 43Apr 21 31 1,753 4,321 3,482 2,322 3,556 2,383 12 23,818 2May 10 47 1,378 5,755 5,394 4,486 2,839 1,220 5 18,368 77Jun 6 18 1,517 6,287 6,726 4,557 4,382 1,195 16,436 58Jul 7 1,665 7,392 2,164 4,200 3,977 1,694 14 23,910 6Aug 10 31 1,339 7,820 2,527 4,851 4,573 1,715 26 28,691 69Sep 10 877 8,160 2,118 3,416 2,082 1,012 48 27,395 53Oct 2 787 6,830 1,460 4,152 1,089 1,376 57 29,994 79Nov 34 1,470 6,170 1,670 4,573 924 2,435 46 36,253 32Dec 31 70 2,069 9,091 2,040 5,388 2,201 2,294 30 38,091 59Total 141 286 16,559 69,934 38,218 42,804 33,083 20,847 278 280,262 494
Month FXE FXY UUP Month HYG JNK TLTJan 3,546 4 2,255 Jan 97 16,294Feb 1,617 205 2,157 Feb 1,680 134 19,195Mar 6,037 2,025 4,347 Mar 2,546 486 23,858Apr 5,967 624 2,825 Apr 3,396 230 20,369May 5,137 960 4,390 May 4,490 65 45,068Jun 6,061 1,503 3,742 Jun 5,142 865 26,121Jul 3,431 641 4,406 Jul 6,341 599 24,334Aug 5,439 1,008 4,713 Aug 9,071 396 28,201Sep 2,451 1,243 2,406 Sep 6,411 177 15,656Oct 4,505 1,493 2,573 Oct 8,191 100 10,679Nov 4,877 1,473 1,778 Nov 3,288 49 8,398Dec 5,473 448 3,068 Dec 14,372 2,315 10,595Total 54,541 11,627 38,660 Total 65,025 5,416 248,768
CURRENCY FIXED INCOME
LEVERAGED & INVERSE
Page 162

CBOE HOLDINGS, INC. TRADING ACTIVITYAND MARKET SHARE - 2015
Total Options Contract Volume By Exchange
CBOE C2 Month CBOE C2 AMEX BATS BOX ISE NYSE ARCA PHLX NSDQ NOBO MIAX GEM EDGX TOTAL Market Share Market Share
Jan 95,516,080 7,150,005 26,335,673 31,025,524 9,913,787 36,736,616 33,477,707 55,286,310 33,412,147 2,174,904 15,475,739 6,760,438 353,264,930 27% 2%Feb 79,692,588 5,648,312 24,284,055 24,795,626 7,860,426 28,433,372 28,430,922 52,943,969 27,908,861 1,699,099 15,105,053 5,725,691 302,527,974 26% 2%Mar 84,445,287 6,803,378 28,034,198 31,613,488 7,720,989 38,652,157 27,823,131 51,492,891 24,634,584 2,368,273 22,136,779 11,309,433 337,034,588 25% 2%Apr 81,067,723 6,972,763 27,799,507 32,325,564 7,383,762 38,264,504 27,549,640 49,492,727 20,673,182 2,403,576 21,896,858 11,770,025 327,599,831 25% 2%May 75,312,874 6,474,635 24,221,232 29,593,682 6,820,200 37,487,434 25,420,647 46,108,887 18,623,083 2,087,408 20,817,673 11,165,979 304,133,734 25% 2%Jun 87,656,121 6,882,877 27,420,515 32,233,545 7,307,210 40,966,802 28,107,954 48,468,360 19,886,710 2,527,081 21,321,724 11,691,245 334,470,144 26% 2%Jul 93,889,765 7,567,909 30,816,778 40,993,310 8,970,012 47,761,477 37,095,844 52,553,121 22,480,955 3,159,505 24,588,783 9,317,504 379,194,963 25% 2%Aug 111,068,718 7,765,970 31,695,505 46,409,823 9,562,147 51,389,083 44,243,794 58,147,518 26,457,410 3,372,763 25,249,007 10,966,939 426,328,677 26% 2%Sep 92,552,037 6,167,783 30,078,169 38,825,305 8,412,502 40,846,757 34,387,371 51,300,836 20,143,422 2,873,485 20,120,736 9,074,265 354,782,668 26% 2%Oct 88,809,914 6,032,351 32,041,650 28,557,807 10,045,031 43,449,113 34,519,463 51,182,147 30,598,112 3,035,696 22,680,425 11,190,333 362,142,042 25% 2%Nov 74,221,578 5,064,434 33,128,599 27,216,054 9,312,275 36,518,741 29,368,024 55,554,622 19,762,138 2,753,141 21,180,198 8,801,882 453,980 323,335,666 23% 2%Dec 78,798,945 6,696,526 28,608,029 32,825,696 9,960,101 41,665,705 31,090,941 50,983,278 22,264,881 3,041,382 22,032,452 9,842,338 1,011,780 338,822,054 23% 2%Total 1,043,031,630 79,226,943 344,463,910 396,415,424 103,268,442 482,171,761 381,515,438 623,514,666 286,845,485 31,496,313 252,605,427 117,616,072 1,465,760 4,143,637,271 25% 2%
CBOE pioneered the concepts of listed options in 1973 and remains the largest options exchange. Options volume for stocks listed on the CBOE represented 17% and on C2 represented 1.0% of all equity options trading in 2015. At year-end there were 3,376 listed equity options on CBOE and 406 on C2.
CBOE C2Month CBOE C2 AMEX BATS BOX ISE NYSE ARCA PHLX NSDQ NOBO MIAX GEM EDGX TOTAL Market Share Market Share
Jan 37,463,301 1,872,151 15,444,383 19,633,008 6,403,900 19,267,705 19,922,872 36,872,102 22,399,094 1,448,260 9,584,784 3,551,304 193,862,864 19% 1%Feb 33,769,440 1,823,282 14,436,353 17,982,315 5,577,709 14,960,699 17,425,386 35,419,881 19,880,843 1,222,798 9,515,667 2,998,602 175,012,975 19% 1%Mar 33,439,106 1,923,040 15,436,819 22,002,654 5,080,866 19,473,463 14,487,700 30,289,616 16,445,742 1,638,986 12,824,039 6,790,183 179,832,214 19% 1%Apr 33,421,041 2,473,639 16,849,485 23,877,478 4,942,794 21,704,777 16,739,834 33,270,417 14,264,247 1,630,013 13,247,380 7,498,873 189,919,978 18% 1%May 27,973,038 1,939,587 14,348,513 21,226,225 4,418,516 20,800,276 15,530,237 30,516,236 12,821,524 1,376,205 12,158,686 7,125,877 170,234,920 16% 1%Jun 28,685,970 1,891,329 15,059,704 21,097,209 4,670,411 20,721,309 16,097,229 28,264,568 12,617,620 1,703,991 12,780,016 6,968,160 170,557,516 17% 1%Jul 31,497,561 2,210,483 16,953,623 26,726,966 5,670,861 25,111,641 23,596,756 33,616,152 14,484,661 2,164,299 15,418,326 5,000,055 202,451,384 16% 1%Aug 31,160,212 2,326,715 15,547,827 27,661,689 5,259,456 23,097,252 25,590,367 33,354,859 14,973,873 2,110,394 13,559,107 5,918,209 200,559,960 16% 1%Sep 25,793,204 1,499,035 14,056,772 22,646,703 4,635,214 16,598,883 18,659,207 27,988,016 9,566,306 1,724,755 10,321,617 4,079,973 157,569,685 16% 1%Oct 31,210,101 1,928,838 17,148,327 19,589,789 5,337,476 22,401,263 20,725,432 32,413,353 17,763,620 1,962,352 13,324,840 7,100,034 190,905,425 16% 1%Nov 29,618,215 1,430,801 22,385,940 19,053,459 5,342,318 19,725,503 19,329,049 39,413,913 10,882,646 1,864,987 13,083,006 5,634,247 271,871 188,035,955 16% 1%Dec 26,090,900 1,543,630 12,502,746 19,804,585 5,624,855 18,186,143 18,175,155 28,568,747 10,884,818 1,922,201 12,334,968 5,059,050 638,960 161,336,758 16% 1%Total 370,122,089 22,862,530 190,170,492 261,302,080 62,964,376 242,048,914 226,279,224 389,987,860 176,984,994 20,769,241 148,152,436 67,724,567 910,831 2,180,279,634 17% 1%
Cleared Total Options Volume
Total Equity Options Contract Volume By Exchange
Cleared Equity Options Volume
Page 163

Total Exchange Traded Funds Contract Volume By Exchange
CBOE C2Month CBOE C2 AMEX BATS BOX ISE NYSE ARCA PHLX NSDQ NOBO MIAX GEM EDGX TOTAL Market Share Market Share
Jan 26,701,241 5,210,994 10,348,014 11,392,516 3,509,887 17,423,597 13,118,112 18,316,550 10,987,930 726,644 5,890,955 3,199,509 126,825,949 21% 4%Feb 19,797,316 3,781,693 9,331,825 6,813,311 2,282,717 13,426,006 10,594,515 17,432,928 8,005,128 476,301 5,589,386 2,718,880 100,250,006 20% 4%Mar 23,323,765 4,807,831 12,241,265 9,610,834 2,640,123 19,011,650 12,934,502 21,094,968 8,161,562 729,287 9,312,740 4,508,571 128,377,098 18% 4%Apr 20,868,288 4,369,300 10,936,161 8,448,086 2,440,968 16,419,376 10,717,493 16,148,247 6,384,928 773,563 8,649,478 4,262,614 110,418,502 19% 4%May 19,068,582 4,397,214 9,855,417 8,367,457 2,401,684 16,574,737 9,818,870 15,494,502 5,792,839 711,203 8,658,987 4,032,446 105,173,938 18% 4%Jun 23,405,569 4,823,236 12,339,897 11,136,336 2,636,799 20,133,497 11,961,199 20,087,713 7,258,927 823,090 8,541,708 4,713,045 127,861,016 18% 4%Jul 24,004,814 5,177,326 13,830,371 14,266,344 3,299,151 22,449,130 13,437,345 18,788,656 7,975,140 995,206 9,170,457 4,303,896 137,697,836 17% 4%Aug 28,173,111 5,231,117 16,078,451 18,748,134 4,302,691 27,886,446 18,589,014 24,610,114 11,467,637 1,262,369 11,689,900 5,017,842 173,056,826 16% 3%Sep 24,599,255 4,485,991 15,982,484 16,178,602 3,777,288 24,007,100 15,669,068 23,197,243 10,566,384 1,148,730 9,799,119 4,970,798 154,382,062 16% 3%Oct 20,327,865 3,907,715 14,861,252 8,968,018 4,707,555 20,744,697 13,742,900 18,634,341 12,829,711 1,073,344 9,355,585 4,059,818 133,212,801 15% 3%Nov 15,790,176 3,445,850 10,716,071 8,162,595 3,969,957 16,521,678 9,992,027 16,026,580 8,879,492 888,154 8,097,192 3,146,095 182,109 105,817,976 15% 3%Dec 20,382,026 4,915,402 16,086,874 13,021,111 4,335,246 23,365,380 12,874,587 22,259,639 11,380,063 1,119,181 9,697,484 4,755,609 372,820 144,565,422 14% 3%Total 266,442,008 54,553,669 152,608,082 135,113,344 40,304,066 237,963,294 153,449,632 232,091,481 109,689,741 10,727,072 104,452,991 49,689,123 554,929 1,547,639,432 17% 4%
Total Cash Index Options Contract Volume By Exchange
CBOE C2Month CBOE C2 AMEX ISE NYSE ARCA PHLX NSDQ GEM Total Market Share Market Share
Jan 31,351,538 66,860 543,276 45,314 436,723 97,658 25,123 9,625 32,576,117 96% 0.2%Feb 26,125,832 43,337 515,877 46,567 411,021 91,160 22,890 8,209 27,264,893 96% 0.2%Mar 27,682,416 72,507 356,114 166,859 400,929 108,307 27,280 10,679 28,825,091 96% 0.3%Apr 26,778,394 129,824 13,861 140,345 92,313 74,063 24,007 8,538 27,261,345 98% 0.5%May 28,271,254 137,834 17,302 112,411 71,540 98,149 8,720 7,656 28,724,866 98% 0.5%Jun 35,564,582 168,312 20,914 111,996 49,526 116,079 10,163 10,040 36,051,612 99% 0.5%Jul 38,387,390 180,100 32,784 200,706 61,743 148,313 21,154 13,553 39,045,743 98% 0.5%Aug 51,735,395 208,138 69,227 405,385 64,413 182,545 15,900 30,888 52,711,891 98% 0.4%Sep 42,159,578 182,757 38,913 240,746 59,096 115,577 10,732 23,494 42,830,893 98% 0.4%Oct 37,271,948 195,798 32,071 303,152 51,131 134,453 4,781 30,481 38,023,815 98% 0.5%Nov 28,813,187 187,783 26,588 271,551 46,948 114,129 21,540 29,481,726 98% 0.6%Dec 32,326,019 237,494 18,409 114,182 41,199 154,892 27,679 32,919,874 98% 0.7%Total 406,467,533 1,810,744 1,685,336 2,159,214 1,786,582 1,435,325 170,750 202,382 415,717,866 98% 0.4%
Cleared Cash Index Options Volume
Cleared Exchange Traded Funds Option Volume
Page 164
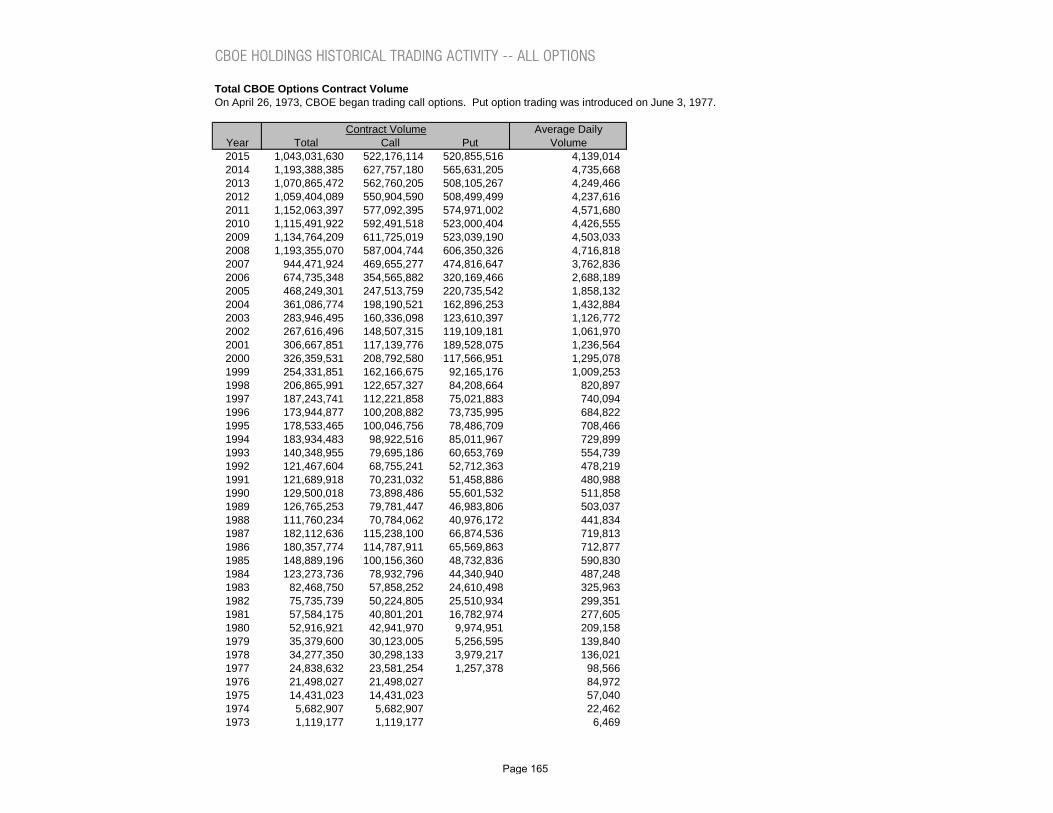
CBOE HOLDINGS HISTORICAL TRADING ACTIVITY -- ALL OPTIONS
Total CBOE Options Contract VolumeOn April 26, 1973, CBOE began trading call options. Put option trading was introduced on June 3, 1977.
Average DailyYear Total Call Put Volume2015 1,043,031,630 522,176,114 520,855,516 4,139,0142014 1,193,388,385 627,757,180 565,631,205 4,735,6682013 1,070,865,472 562,760,205 508,105,267 4,249,4662012 1,059,404,089 550,904,590 508,499,499 4,237,6162011 1,152,063,397 577,092,395 574,971,002 4,571,6802010 1,115,491,922 592,491,518 523,000,404 4,426,5552009 1,134,764,209 611,725,019 523,039,190 4,503,0332008 1,193,355,070 587,004,744 606,350,326 4,716,8182007 944,471,924 469,655,277 474,816,647 3,762,8362006 674,735,348 354,565,882 320,169,466 2,688,1892005 468,249,301 247,513,759 220,735,542 1,858,1322004 361,086,774 198,190,521 162,896,253 1,432,8842003 283,946,495 160,336,098 123,610,397 1,126,7722002 267,616,496 148,507,315 119,109,181 1,061,9702001 306,667,851 117,139,776 189,528,075 1,236,5642000 326,359,531 208,792,580 117,566,951 1,295,0781999 254,331,851 162,166,675 92,165,176 1,009,2531998 206,865,991 122,657,327 84,208,664 820,8971997 187,243,741 112,221,858 75,021,883 740,0941996 173,944,877 100,208,882 73,735,995 684,8221995 178,533,465 100,046,756 78,486,709 708,4661994 183,934,483 98,922,516 85,011,967 729,8991993 140,348,955 79,695,186 60,653,769 554,7391992 121,467,604 68,755,241 52,712,363 478,2191991 121,689,918 70,231,032 51,458,886 480,9881990 129,500,018 73,898,486 55,601,532 511,8581989 126,765,253 79,781,447 46,983,806 503,0371988 111,760,234 70,784,062 40,976,172 441,8341987 182,112,636 115,238,100 66,874,536 719,8131986 180,357,774 114,787,911 65,569,863 712,8771985 148,889,196 100,156,360 48,732,836 590,8301984 123,273,736 78,932,796 44,340,940 487,2481983 82,468,750 57,858,252 24,610,498 325,9631982 75,735,739 50,224,805 25,510,934 299,3511981 57,584,175 40,801,201 16,782,974 277,6051980 52,916,921 42,941,970 9,974,951 209,1581979 35,379,600 30,123,005 5,256,595 139,8401978 34,277,350 30,298,133 3,979,217 136,0211977 24,838,632 23,581,254 1,257,378 98,5661976 21,498,027 21,498,027 84,9721975 14,431,023 14,431,023 57,0401974 5,682,907 5,682,907 22,4621973 1,119,177 1,119,177 6,469
Contract Volume
Page 165

Total CBOE Options Year-end Open Interest and Dollar Volume
Year Total Call Put Total Call Put2015 293,455,678 153,673,603 139,782,075 $592,792,241 $283,667,392 $309,124,8482014 305,179,616 156,792,570 148,387,046 $570,709,705 $306,964,460 $263,745,2452013 288,838,988 153,080,013 135,758,975 $551,701,766 $325,390,546 $226,311,2212012 257,186,801 135,444,877 121,741,924 $564,587,194 $305,149,084 $259,438,1102011 287,097,587 153,763,441 133,334,146 $698,406,153 $331,057,741 $367,348,4122010 294,435,762 155,064,130 139,371,632 $599,332,339 $298,782,674 $300,549,6652009 268,233,481 141,397,911 126,835,570 $638,871,408 $324,804,266 $314,067,1412008 246,726,010 141,588,920 105,137,090 $969,149,693 $359,915,472 $609,234,2212007 277,987,145 146,952,723 131,034,422 $609,419,047 $311,548,311 $297,870,7362006 226,402,102 121,058,989 105,343,113 $311,676,396 $176,160,342 $135,516,0542005 180,546,883 96,452,688 84,094,195 $202,670,123 $112,617,864 $90,052,2592004 154,632,839 81,910,271 72,722,568 $165,796,951 $90,967,813 $74,829,1382003 126,320,572 68,527,351 57,793,221 $148,353,167 $83,446,496 $64,906,6702002 93,472,074 56,719,928 36,752,146 $151,870,740 $63,760,762 $88,109,9782001 81,906,961 51,447,344 30,459,617 $195,013,480 $83,694,213 $111,319,2672000 53,264,239 33,792,832 19,471,407 $324,433,366 $174,504,703 $149,928,6631999 47,549,070 28,187,566 19,361,504 $243,893,100 $162,688,061 $81,205,0391998 19,790,701 11,816,164 7,974,537 $175,124,363 $104,655,792 $70,468,5711997 15,701,630 9,414,828 6,286,802 $145,939,880 $94,343,229 $51,596,6511996 11,596,228 6,869,206 4,727,022 $103,556,272 $68,617,768 $34,938,5041995 10,065,868 5,872,728 4,193,140 $82,499,796 $58,040,292 $24,459,5041994 8,894,266 5,374,500 3,519,766 $67,165,498 $35,881,208 $31,284,2901993 7,831,078 4,795,017 3,036,061 $45,924,523 $28,424,080 $17,500,4231992 5,671,591 3,517,562 2,154,029 $44,499,077 $26,972,202 $17,526,8751991 4,562,642 2,679,410 1,883,232 $50,715,972 $33,414,169 $17,301,8031990 3,753,880 2,304,291 1,449,589 $55,362,874 $29,736,100 $25,626,7741989 3,956,914 2,689,478 1,267,436 $47,312,286 $33,014,811 $14,297,4751988 3,596,163 2,453,502 1,142,661 $39,708,577 $25,515,571 $14,193,0061987 3,773,540 2,863,162 910,378 $76,910,854 $50,403,786 $26,507,0681986 4,845,869 3,426,893 1,418,976 $55,902,000 $39,952,000 $15,950,0001985 5,444,817 3,788,635 1,656,182 $38,430,000 $29,645,000 $8,785,0001984 4,198,005 3,103,722 1,094,283 $34,367,000 $24,586,000 $9,781,0001983 7,184,514 5,325,649 1,858,865 $39,444,000 $33,397,000 $6,047,0001982 5,610,671 3,884,527 1,726,144 $32,265,764 $25,164,139 $7,101,6251981 4,772,604 3,449,959 1,322,645 $22,433,636 $17,013,970 $5,419,6661980 3,257,364 2,633,312 624,052 $27,893,035 $25,245,995 $2,647,0401979 2,258,529 2,048,463 210,066 $13,858,402 $12,131,512 $1,726,8901978 2,165,894 1,976,022 189,872 $14,403,416 $12,695,972 $17,075,0001977 1,190,636 1,831,806 128,830 $7,996,670 $7,507,300 $489,3701976 1,519,852 1,519,852 $9,039,670 $9,039,5661975 1,190,085 1,190,085 $6,443,327 $6,443,3271974 543,703 543,703 $1,657,652 $1,657,6521973 242,825 242,825 $449,615 $449,615
Open Interest Dollar Volume (thousands)
Page 166

Total CBOE Options Average Premium Per Contract and Average Contracts Per Trade
Year Total Call Put Total Call Put2015 $568 $543 $593 18.2 16.8 19.82014 $478 $489 $466 17.2 15.9 18.92013 $515 $578 $445 18.6 16.8 21.12012 $533 $554 $510 17.4 15.4 20.22011 $606 $574 $639 20.9 17.9 25.02010 $537 $504 $575 20.4 17.8 24.42009 $563 $531 $600 19.2 17.0 22.72008 $812 $613 $1,005 19.9 16.9 24.12007 $645 $663 $627 20.0 16.0 26.72006 $462 $497 $423 18.1 15.0 23.42005 $433 $455 $408 19.3 16.0 25.12004 $459 $459 $459 19.5 16.6 25.12003 $522 $520 $525 18.3 16.0 22.42002 $567 $429 $740 17.1 15.7 19.22001 $636 $714 $588 16.2 9.4 29.02000 $994 $836 $1,275 12.3 11.0 15.51999 $959 $1,003 $881 11.5 10.3 14.31998 $847 $853 $837 12.9 11.3 16.21997 $779 $841 $688 13.0 11.4 16.51996 $595 $685 $474 14.3 12.6 17.51995 $462 $580 $312 16.5 14.5 19.81994 $365 $363 $368 18.6 16.8 21.31993 $327 $357 $289 15.0 13.7 17.31992 $366 $392 $333 13.8 12.7 15.51991 $417 $476 $336 13.4 12.5 14.91990 $428 $402 $461 13.6 13.1 14.31989 $373 $414 $304 12.9 12.1 14.51988 $355 $360 $346 11.7 11.2 12.71987 $422 $437 $396 12.2 11.4 13.71986 $310 $348 $243 12.9 12.2 14.61985 $205 $305 $177 8.7 8.7 8.81984 $318 $346 $240 8.4 8.3 8.61983 $499 $597 $231 7.7 7.8 7.51982 $426 $501 $278 7.4 7.5 7.11981 $390 $417 $323 7.2 7.3 7.01980 $527 $588 $265 6.1 6.0 6.51979 $392 $403 $329 6.0 5.8 7.21978 $420 $419 $429 5.3 5.3 5.71977 $322 $318 $389 5.1 5.1 5.31976 $420 4.11975 $446 3.51974 $294 3.41973 $402 2.6
Average Premium Per Contract Average Contracts Per Trade
Page 167

Total CBOE Options Contract Volume -- All Options
YearTotal
VolumeEquity
VolumeCash Index
Volume
Exchange Traded Funds
VolumeT-Bond & T-Note
VolumeInterest Rate
Volume
Foreign CurrencyVolume
CEBOsVolume
2015 1,043,031,630 370,122,089 406,467,533 266,442,0082014 1,193,388,385 476,930,037 405,948,219 310,510,129 02013 1,070,865,472 419,858,477 372,455,566 278,551,377 522012 1,059,404,089 473,708,451 302,878,706 282,816,903 292011 1,152,063,397 496,905,783 320,077,105 335,080,378 9 1222010 1,115,491,922 571,281,150 270,006,239 274,202,116 2,4172009 1,134,764,209 634,710,477 222,781,717 277,266,218 5,7972008 1,193,355,070 604,024,956 259,496,193 329,830,388 3,523 102007 944,471,924 500,964,713 230,517,843 212,979,241 10,079 482006 674,735,348 390,657,577 157,575,349 126,481,092 21,3302005 468,249,301 275,646,980 115,657,828 76,878,867 65,6262004 361,086,774 224,316,863 85,420,267 51,259,036 90,6082003 283,946,495 173,033,965 69,675,859 41,146,233 90,4382002 267,616,496 173,207,520 64,003,053 30,362,691 43,2322001 306,667,851 232,851,089 52,009,919 21,767,252 39,5912000 326,359,531 278,585,728 47,397,039 334,664 42,1001999 254,331,851 196,460,578 56,202,470 1,626,247 42,5561998 206,865,991 137,951,223 68,282,088 555,920 76,7601997 187,243,741 116,031,496 71,136,728 75,5171996 173,944,877 88,456,579 85,394,046 94,2521995 178,533,465 77,040,466 101,427,897 65,1021994 183,934,483 68,974,809 114,743,082 216,5921993 140,348,955 58,710,818 81,573,576 64,5611992 121,467,604 44,968,235 76,442,064 57,3051991 121,689,918 45,255,301 76,384,506 76 50,0351990 129,500,018 48,486,402 80,944,668 7,109 61,8391989 126,765,253 61,902,931 64,645,248 144,356 72,7181988 111,784,045 49,393,316 62,250,400 140,3291987 182,112,636 73,315,232 108,352,440 207,476 237,4881986 180,357,774 64,744,167 114,834,854 321,021 457,7321985 148,889,091 57,523,494 90,822,067 415,001 128,5291984 123,273,736 58,674,901 64,356,841 241,9941983 82,468,750 71,695,563 10,662,498 110,6891982 75,735,739 75,721,605 14,1341981 57,584,175 57,584,1751980 52,916,921 52,916,9211979 35,379,600 35,379,6001978 34,277,350 34,277,3501977 24,838,632 24,838,6321976 21,498,027 21,498,0271975 14,431,023 14,431,0231974 5,682,907 5,682,9071973 1,119,177 1,119,177
Page 168
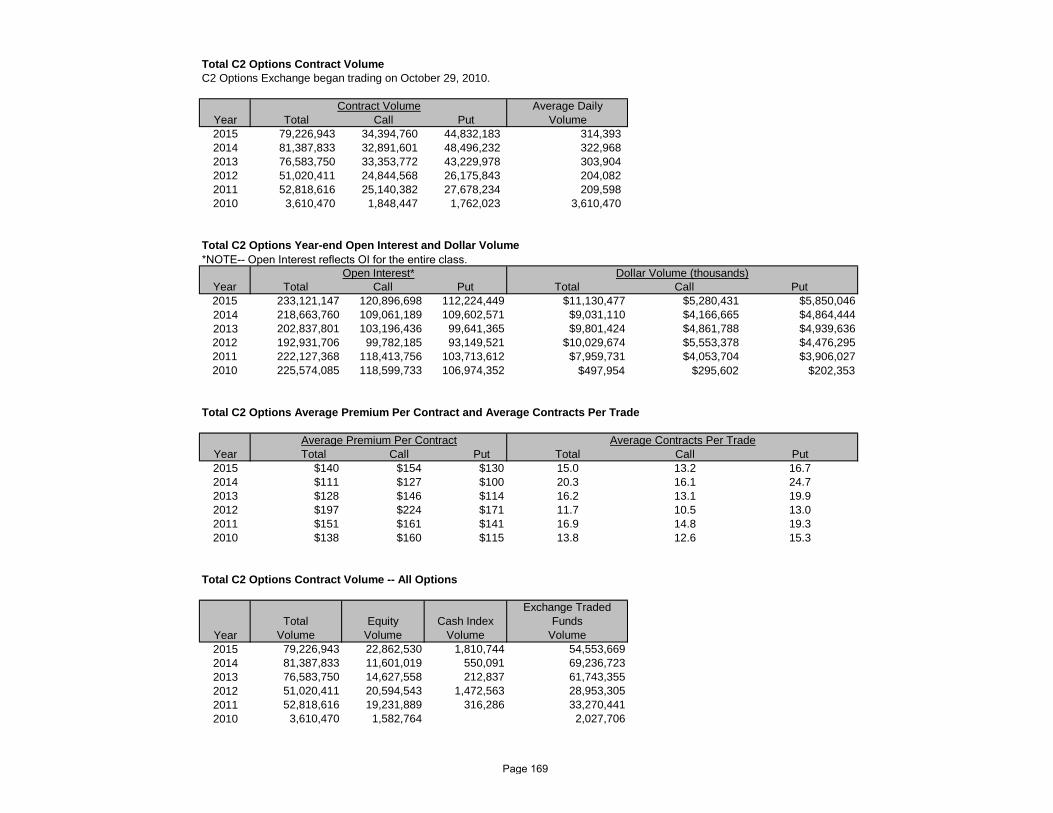
Total C2 Options Contract VolumeC2 Options Exchange began trading on October 29, 2010.
Average DailyYear Total Call Put Volume2015 79,226,943 34,394,760 44,832,183 314,3932014 81,387,833 32,891,601 48,496,232 322,9682013 76,583,750 33,353,772 43,229,978 303,9042012 51,020,411 24,844,568 26,175,843 204,0822011 52,818,616 25,140,382 27,678,234 209,5982010 3,610,470 1,848,447 1,762,023 3,610,470
Total C2 Options Year-end Open Interest and Dollar Volume*NOTE-- Open Interest reflects OI for the entire class.
Year Total Call Put Total Call Put2015 233,121,147 120,896,698 112,224,449 $11,130,477 $5,280,431 $5,850,0462014 218,663,760 109,061,189 109,602,571 $9,031,110 $4,166,665 $4,864,4442013 202,837,801 103,196,436 99,641,365 $9,801,424 $4,861,788 $4,939,6362012 192,931,706 99,782,185 93,149,521 $10,029,674 $5,553,378 $4,476,2952011 222,127,368 118,413,756 103,713,612 $7,959,731 $4,053,704 $3,906,0272010 225,574,085 118,599,733 106,974,352 $497,954 $295,602 $202,353
Total C2 Options Average Premium Per Contract and Average Contracts Per Trade
Year Total Call Put Total Call Put2015 $140 $154 $130 15.0 13.2 16.72014 $111 $127 $100 20.3 16.1 24.72013 $128 $146 $114 16.2 13.1 19.92012 $197 $224 $171 11.7 10.5 13.02011 $151 $161 $141 16.9 14.8 19.32010 $138 $160 $115 13.8 12.6 15.3
Total C2 Options Contract Volume -- All Options
YearTotal
VolumeEquity
VolumeCash Index
Volume
Exchange Traded Funds
Volume2015 79,226,943 22,862,530 1,810,744 54,553,6692014 81,387,833 11,601,019 550,091 69,236,723 2013 76,583,750 14,627,558 212,837 61,743,355 2012 51,020,411 20,594,543 1,472,563 28,953,3052011 52,818,616 19,231,889 316,286 33,270,4412010 3,610,470 1,582,764 2,027,706
Dollar Volume (thousands)
Average Premium Per Contract Average Contracts Per Trade
Contract Volume
Open Interest*
Page 169
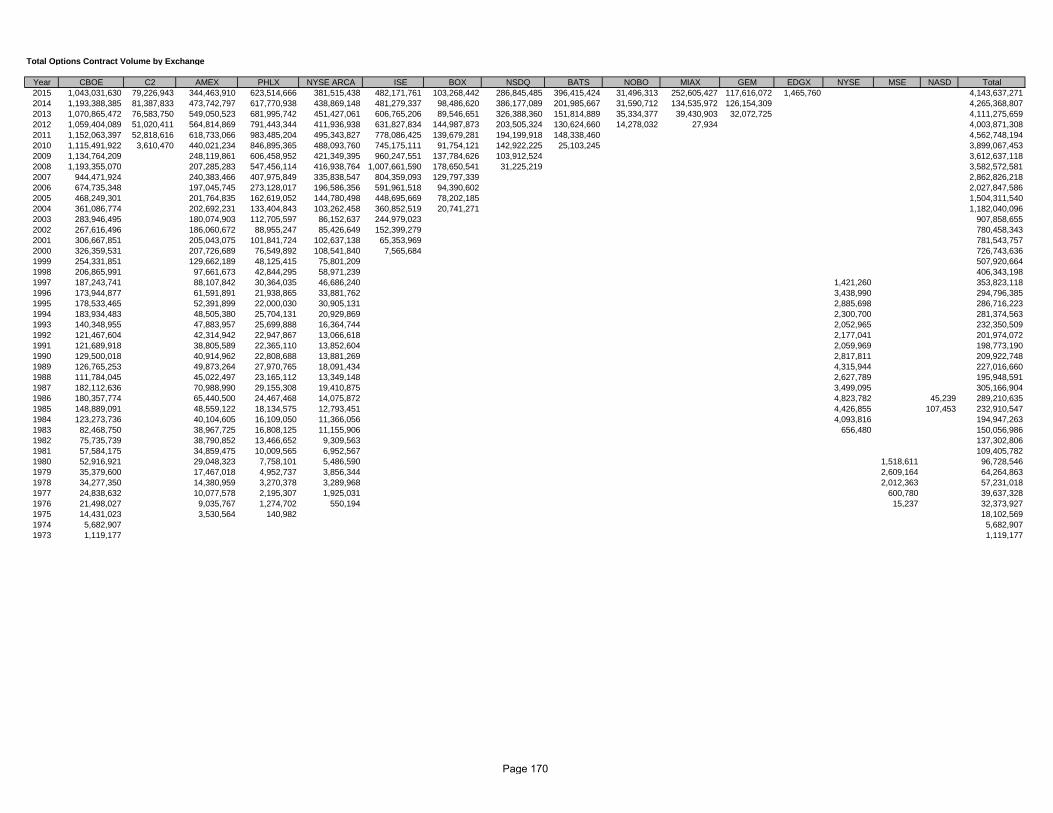
Total Options Contract Volume by Exchange
Year CBOE C2 AMEX PHLX NYSE ARCA ISE BOX NSDQ BATS NOBO MIAX GEM EDGX NYSE MSE NASD Total2015 1,043,031,630 79,226,943 344,463,910 623,514,666 381,515,438 482,171,761 103,268,442 286,845,485 396,415,424 31,496,313 252,605,427 117,616,072 1,465,760 4,143,637,2712014 1,193,388,385 81,387,833 473,742,797 617,770,938 438,869,148 481,279,337 98,486,620 386,177,089 201,985,667 31,590,712 134,535,972 126,154,309 4,265,368,8072013 1,070,865,472 76,583,750 549,050,523 681,995,742 451,427,061 606,765,206 89,546,651 326,388,360 151,814,889 35,334,377 39,430,903 32,072,725 4,111,275,6592012 1,059,404,089 51,020,411 564,814,869 791,443,344 411,936,938 631,827,834 144,987,873 203,505,324 130,624,660 14,278,032 27,934 4,003,871,3082011 1,152,063,397 52,818,616 618,733,066 983,485,204 495,343,827 778,086,425 139,679,281 194,199,918 148,338,460 4,562,748,1942010 1,115,491,922 3,610,470 440,021,234 846,895,365 488,093,760 745,175,111 91,754,121 142,922,225 25,103,245 3,899,067,4532009 1,134,764,209 248,119,861 606,458,952 421,349,395 960,247,551 137,784,626 103,912,524 3,612,637,1182008 1,193,355,070 207,285,283 547,456,114 416,938,764 1,007,661,590 178,650,541 31,225,219 3,582,572,5812007 944,471,924 240,383,466 407,975,849 335,838,547 804,359,093 129,797,339 2,862,826,2182006 674,735,348 197,045,745 273,128,017 196,586,356 591,961,518 94,390,602 2,027,847,5862005 468,249,301 201,764,835 162,619,052 144,780,498 448,695,669 78,202,185 1,504,311,5402004 361,086,774 202,692,231 133,404,843 103,262,458 360,852,519 20,741,271 1,182,040,0962003 283,946,495 180,074,903 112,705,597 86,152,637 244,979,023 907,858,6552002 267,616,496 186,060,672 88,955,247 85,426,649 152,399,279 780,458,3432001 306,667,851 205,043,075 101,841,724 102,637,138 65,353,969 781,543,7572000 326,359,531 207,726,689 76,549,892 108,541,840 7,565,684 726,743,6361999 254,331,851 129,662,189 48,125,415 75,801,209 507,920,6641998 206,865,991 97,661,673 42,844,295 58,971,239 406,343,1981997 187,243,741 88,107,842 30,364,035 46,686,240 1,421,260 353,823,1181996 173,944,877 61,591,891 21,938,865 33,881,762 3,438,990 294,796,3851995 178,533,465 52,391,899 22,000,030 30,905,131 2,885,698 286,716,2231994 183,934,483 48,505,380 25,704,131 20,929,869 2,300,700 281,374,5631993 140,348,955 47,883,957 25,699,888 16,364,744 2,052,965 232,350,5091992 121,467,604 42,314,942 22,947,867 13,066,618 2,177,041 201,974,0721991 121,689,918 38,805,589 22,365,110 13,852,604 2,059,969 198,773,1901990 129,500,018 40,914,962 22,808,688 13,881,269 2,817,811 209,922,7481989 126,765,253 49,873,264 27,970,765 18,091,434 4,315,944 227,016,6601988 111,784,045 45,022,497 23,165,112 13,349,148 2,627,789 195,948,5911987 182,112,636 70,988,990 29,155,308 19,410,875 3,499,095 305,166,9041986 180,357,774 65,440,500 24,467,468 14,075,872 4,823,782 45,239 289,210,6351985 148,889,091 48,559,122 18,134,575 12,793,451 4,426,855 107,453 232,910,5471984 123,273,736 40,104,605 16,109,050 11,366,056 4,093,816 194,947,2631983 82,468,750 38,967,725 16,808,125 11,155,906 656,480 150,056,9861982 75,735,739 38,790,852 13,466,652 9,309,563 137,302,8061981 57,584,175 34,859,475 10,009,565 6,952,567 109,405,7821980 52,916,921 29,048,323 7,758,101 5,486,590 1,518,611 96,728,5461979 35,379,600 17,467,018 4,952,737 3,856,344 2,609,164 64,264,8631978 34,277,350 14,380,959 3,270,378 3,289,968 2,012,363 57,231,0181977 24,838,632 10,077,578 2,195,307 1,925,031 600,780 39,637,3281976 21,498,027 9,035,767 1,274,702 550,194 15,237 32,373,9271975 14,431,023 3,530,564 140,982 18,102,5691974 5,682,907 5,682,9071973 1,119,177 1,119,177
Page 170
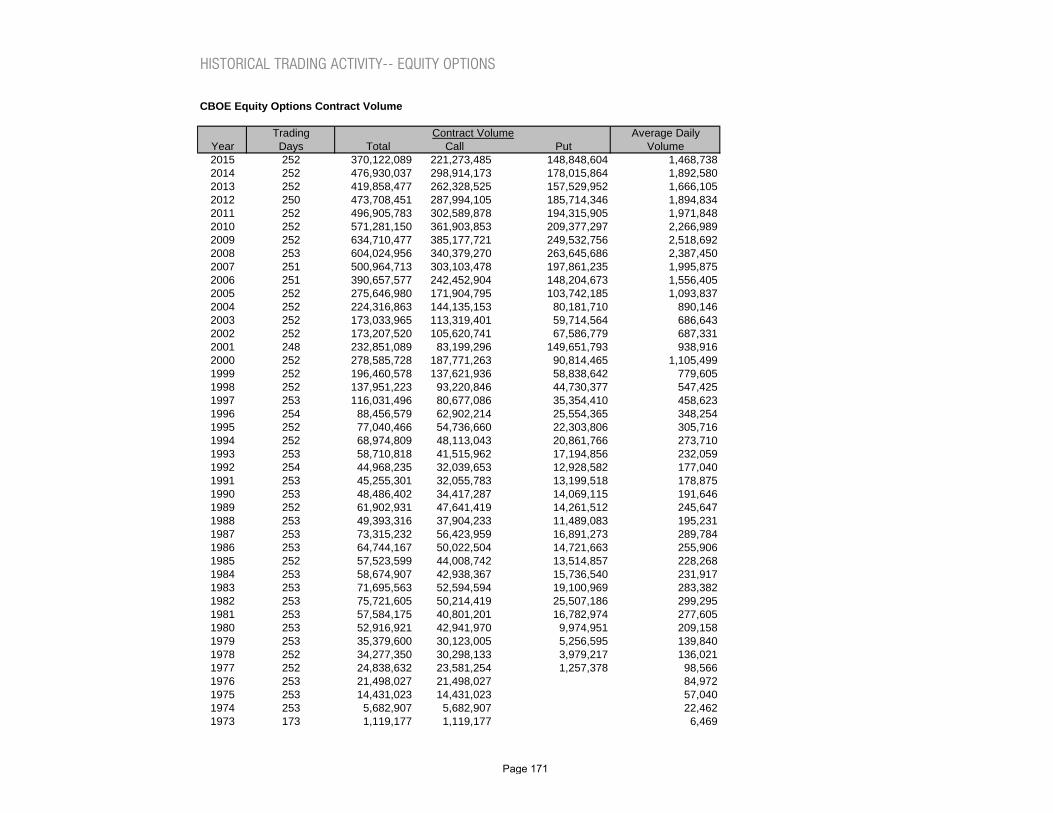
HISTORICAL TRADING ACTIVITY-- EQUITY OPTIONS
CBOE Equity Options Contract Volume
Trading Average DailyYear Days Total Call Put Volume2015 252 370,122,089 221,273,485 148,848,604 1,468,7382014 252 476,930,037 298,914,173 178,015,864 1,892,5802013 252 419,858,477 262,328,525 157,529,952 1,666,1052012 250 473,708,451 287,994,105 185,714,346 1,894,8342011 252 496,905,783 302,589,878 194,315,905 1,971,8482010 252 571,281,150 361,903,853 209,377,297 2,266,9892009 252 634,710,477 385,177,721 249,532,756 2,518,6922008 253 604,024,956 340,379,270 263,645,686 2,387,4502007 251 500,964,713 303,103,478 197,861,235 1,995,8752006 251 390,657,577 242,452,904 148,204,673 1,556,4052005 252 275,646,980 171,904,795 103,742,185 1,093,8372004 252 224,316,863 144,135,153 80,181,710 890,1462003 252 173,033,965 113,319,401 59,714,564 686,6432002 252 173,207,520 105,620,741 67,586,779 687,3312001 248 232,851,089 83,199,296 149,651,793 938,9162000 252 278,585,728 187,771,263 90,814,465 1,105,4991999 252 196,460,578 137,621,936 58,838,642 779,6051998 252 137,951,223 93,220,846 44,730,377 547,4251997 253 116,031,496 80,677,086 35,354,410 458,6231996 254 88,456,579 62,902,214 25,554,365 348,2541995 252 77,040,466 54,736,660 22,303,806 305,7161994 252 68,974,809 48,113,043 20,861,766 273,7101993 253 58,710,818 41,515,962 17,194,856 232,0591992 254 44,968,235 32,039,653 12,928,582 177,0401991 253 45,255,301 32,055,783 13,199,518 178,8751990 253 48,486,402 34,417,287 14,069,115 191,6461989 252 61,902,931 47,641,419 14,261,512 245,6471988 253 49,393,316 37,904,233 11,489,083 195,2311987 253 73,315,232 56,423,959 16,891,273 289,7841986 253 64,744,167 50,022,504 14,721,663 255,9061985 252 57,523,599 44,008,742 13,514,857 228,2681984 253 58,674,907 42,938,367 15,736,540 231,9171983 253 71,695,563 52,594,594 19,100,969 283,3821982 253 75,721,605 50,214,419 25,507,186 299,2951981 253 57,584,175 40,801,201 16,782,974 277,6051980 253 52,916,921 42,941,970 9,974,951 209,1581979 253 35,379,600 30,123,005 5,256,595 139,8401978 252 34,277,350 30,298,133 3,979,217 136,0211977 252 24,838,632 23,581,254 1,257,378 98,5661976 253 21,498,027 21,498,027 84,9721975 253 14,431,023 14,431,023 57,0401974 253 5,682,907 5,682,907 22,4621973 173 1,119,177 1,119,177 6,469
Contract Volume
Page 171
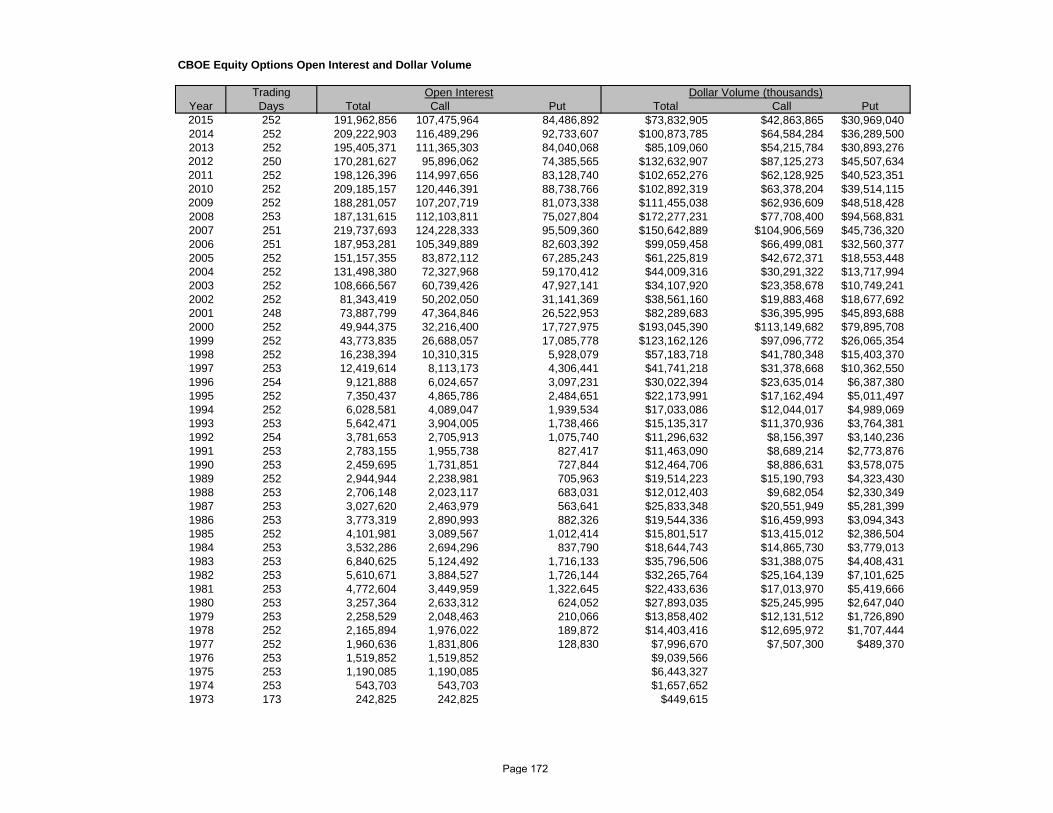
CBOE Equity Options Open Interest and Dollar Volume
TradingYear Days Total Call Put Total Call Put2015 252 191,962,856 107,475,964 84,486,892 $73,832,905 $42,863,865 $30,969,0402014 252 209,222,903 116,489,296 92,733,607 $100,873,785 $64,584,284 $36,289,5002013 252 195,405,371 111,365,303 84,040,068 $85,109,060 $54,215,784 $30,893,2762012 250 170,281,627 95,896,062 74,385,565 $132,632,907 $87,125,273 $45,507,6342011 252 198,126,396 114,997,656 83,128,740 $102,652,276 $62,128,925 $40,523,3512010 252 209,185,157 120,446,391 88,738,766 $102,892,319 $63,378,204 $39,514,1152009 252 188,281,057 107,207,719 81,073,338 $111,455,038 $62,936,609 $48,518,4282008 253 187,131,615 112,103,811 75,027,804 $172,277,231 $77,708,400 $94,568,8312007 251 219,737,693 124,228,333 95,509,360 $150,642,889 $104,906,569 $45,736,3202006 251 187,953,281 105,349,889 82,603,392 $99,059,458 $66,499,081 $32,560,3772005 252 151,157,355 83,872,112 67,285,243 $61,225,819 $42,672,371 $18,553,4482004 252 131,498,380 72,327,968 59,170,412 $44,009,316 $30,291,322 $13,717,9942003 252 108,666,567 60,739,426 47,927,141 $34,107,920 $23,358,678 $10,749,2412002 252 81,343,419 50,202,050 31,141,369 $38,561,160 $19,883,468 $18,677,6922001 248 73,887,799 47,364,846 26,522,953 $82,289,683 $36,395,995 $45,893,6882000 252 49,944,375 32,216,400 17,727,975 $193,045,390 $113,149,682 $79,895,7081999 252 43,773,835 26,688,057 17,085,778 $123,162,126 $97,096,772 $26,065,3541998 252 16,238,394 10,310,315 5,928,079 $57,183,718 $41,780,348 $15,403,3701997 253 12,419,614 8,113,173 4,306,441 $41,741,218 $31,378,668 $10,362,5501996 254 9,121,888 6,024,657 3,097,231 $30,022,394 $23,635,014 $6,387,3801995 252 7,350,437 4,865,786 2,484,651 $22,173,991 $17,162,494 $5,011,4971994 252 6,028,581 4,089,047 1,939,534 $17,033,086 $12,044,017 $4,989,0691993 253 5,642,471 3,904,005 1,738,466 $15,135,317 $11,370,936 $3,764,3811992 254 3,781,653 2,705,913 1,075,740 $11,296,632 $8,156,397 $3,140,2361991 253 2,783,155 1,955,738 827,417 $11,463,090 $8,689,214 $2,773,8761990 253 2,459,695 1,731,851 727,844 $12,464,706 $8,886,631 $3,578,0751989 252 2,944,944 2,238,981 705,963 $19,514,223 $15,190,793 $4,323,4301988 253 2,706,148 2,023,117 683,031 $12,012,403 $9,682,054 $2,330,3491987 253 3,027,620 2,463,979 563,641 $25,833,348 $20,551,949 $5,281,3991986 253 3,773,319 2,890,993 882,326 $19,544,336 $16,459,993 $3,094,3431985 252 4,101,981 3,089,567 1,012,414 $15,801,517 $13,415,012 $2,386,5041984 253 3,532,286 2,694,296 837,790 $18,644,743 $14,865,730 $3,779,0131983 253 6,840,625 5,124,492 1,716,133 $35,796,506 $31,388,075 $4,408,4311982 253 5,610,671 3,884,527 1,726,144 $32,265,764 $25,164,139 $7,101,6251981 253 4,772,604 3,449,959 1,322,645 $22,433,636 $17,013,970 $5,419,6661980 253 3,257,364 2,633,312 624,052 $27,893,035 $25,245,995 $2,647,0401979 253 2,258,529 2,048,463 210,066 $13,858,402 $12,131,512 $1,726,8901978 252 2,165,894 1,976,022 189,872 $14,403,416 $12,695,972 $1,707,4441977 252 1,960,636 1,831,806 128,830 $7,996,670 $7,507,300 $489,3701976 253 1,519,852 1,519,852 $9,039,5661975 253 1,190,085 1,190,085 $6,443,3271974 253 543,703 543,703 $1,657,6521973 173 242,825 242,825 $449,615
Open Interest Dollar Volume (thousands)
Page 172
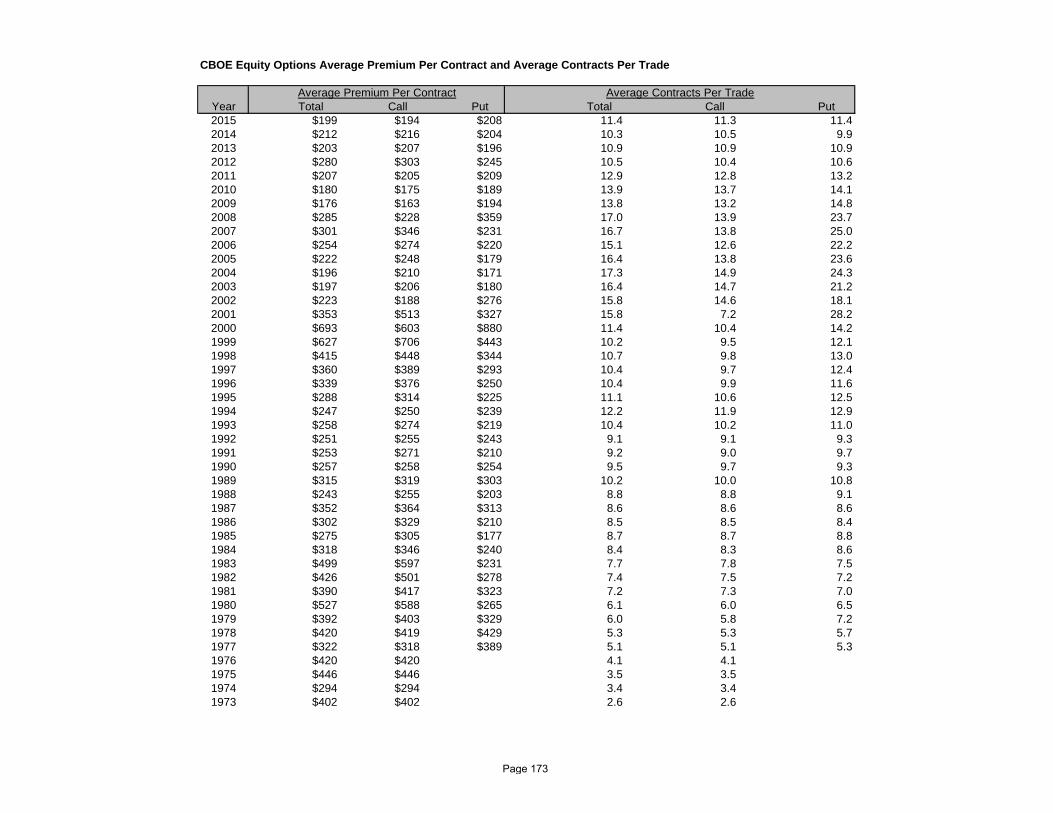
CBOE Equity Options Average Premium Per Contract and Average Contracts Per Trade
Year Total Call Put Total Call Put2015 $199 $194 $208 11.4 11.3 11.42014 $212 $216 $204 10.3 10.5 9.92013 $203 $207 $196 10.9 10.9 10.92012 $280 $303 $245 10.5 10.4 10.62011 $207 $205 $209 12.9 12.8 13.22010 $180 $175 $189 13.9 13.7 14.12009 $176 $163 $194 13.8 13.2 14.82008 $285 $228 $359 17.0 13.9 23.72007 $301 $346 $231 16.7 13.8 25.02006 $254 $274 $220 15.1 12.6 22.22005 $222 $248 $179 16.4 13.8 23.62004 $196 $210 $171 17.3 14.9 24.32003 $197 $206 $180 16.4 14.7 21.22002 $223 $188 $276 15.8 14.6 18.12001 $353 $513 $327 15.8 7.2 28.22000 $693 $603 $880 11.4 10.4 14.21999 $627 $706 $443 10.2 9.5 12.11998 $415 $448 $344 10.7 9.8 13.01997 $360 $389 $293 10.4 9.7 12.41996 $339 $376 $250 10.4 9.9 11.61995 $288 $314 $225 11.1 10.6 12.51994 $247 $250 $239 12.2 11.9 12.91993 $258 $274 $219 10.4 10.2 11.01992 $251 $255 $243 9.1 9.1 9.31991 $253 $271 $210 9.2 9.0 9.71990 $257 $258 $254 9.5 9.7 9.31989 $315 $319 $303 10.2 10.0 10.81988 $243 $255 $203 8.8 8.8 9.11987 $352 $364 $313 8.6 8.6 8.61986 $302 $329 $210 8.5 8.5 8.41985 $275 $305 $177 8.7 8.7 8.81984 $318 $346 $240 8.4 8.3 8.61983 $499 $597 $231 7.7 7.8 7.51982 $426 $501 $278 7.4 7.5 7.21981 $390 $417 $323 7.2 7.3 7.01980 $527 $588 $265 6.1 6.0 6.51979 $392 $403 $329 6.0 5.8 7.21978 $420 $419 $429 5.3 5.3 5.71977 $322 $318 $389 5.1 5.1 5.31976 $420 $420 4.1 4.11975 $446 $446 3.5 3.51974 $294 $294 3.4 3.41973 $402 $402 2.6 2.6
Average Premium Per Contract Average Contracts Per Trade
Page 173
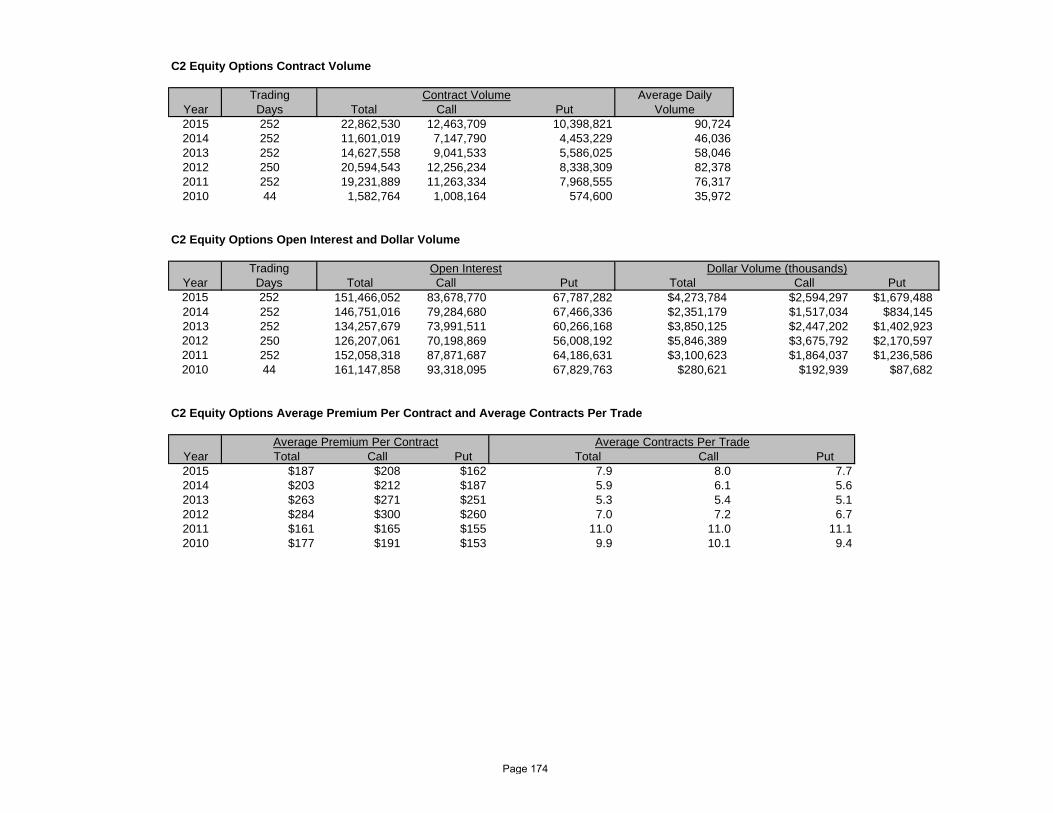
C2 Equity Options Contract Volume
Trading Average DailyYear Days Total Call Put Volume2015 252 22,862,530 12,463,709 10,398,821 90,7242014 252 11,601,019 7,147,790 4,453,229 46,0362013 252 14,627,558 9,041,533 5,586,025 58,0462012 250 20,594,543 12,256,234 8,338,309 82,3782011 252 19,231,889 11,263,334 7,968,555 76,3172010 44 1,582,764 1,008,164 574,600 35,972
C2 Equity Options Open Interest and Dollar Volume
TradingYear Days Total Call Put Total Call Put2015 252 151,466,052 83,678,770 67,787,282 $4,273,784 $2,594,297 $1,679,4882014 252 146,751,016 79,284,680 67,466,336 $2,351,179 $1,517,034 $834,1452013 252 134,257,679 73,991,511 60,266,168 $3,850,125 $2,447,202 $1,402,9232012 250 126,207,061 70,198,869 56,008,192 $5,846,389 $3,675,792 $2,170,5972011 252 152,058,318 87,871,687 64,186,631 $3,100,623 $1,864,037 $1,236,5862010 44 161,147,858 93,318,095 67,829,763 $280,621 $192,939 $87,682
C2 Equity Options Average Premium Per Contract and Average Contracts Per Trade
Year Total Call Put Total Call Put2015 $187 $208 $162 7.9 8.0 7.72014 $203 $212 $187 5.9 6.1 5.62013 $263 $271 $251 5.3 5.4 5.12012 $284 $300 $260 7.0 7.2 6.72011 $161 $165 $155 11.0 11.0 11.12010 $177 $191 $153 9.9 10.1 9.4
Open Interest Dollar Volume (thousands)
Average Premium Per Contract Average Contracts Per Trade
Contract Volume
Page 174

Equity Options Contract Volume by ExchangeCBOE C2
% Share of % Share ofYear CBOE C2 AMEX PHLX NYSE ARCA ISE BOX NSDQ BATS NOBO MIAX GEM EDGX MSE* NYSE** Total Total Volume Total Volume2015 370,122,089 22,862,530 190,170,492 389,987,860 226,279,224 242,048,914 62,964,376 176,984,994 261,302,080 20,769,241 148,152,436 67,724,567 910,831 2,180,279,634 17.0 1.02014 476,930,037 11,601,019 274,643,780 409,173,916 259,610,312 255,302,491 66,494,083 263,929,462 132,988,167 18,794,838 91,232,966 82,227,588 2,342,928,659 20.4 0.52013 419,858,477 14,627,558 324,445,932 461,632,120 259,958,771 333,647,092 63,410,732 225,500,666 107,558,226 16,960,136 25,094,950 21,077,928 2,273,772,588 18.5 0.62012 473,708,451 20,594,543 342,362,863 497,858,505 252,254,716 348,988,502 94,526,688 140,224,402 91,424,924 6,125,791 27,934 2,268,097,319 20.9 0.92011 496,905,783 19,231,889 356,638,852 590,475,002 277,507,087 430,647,628 91,956,130 106,891,519 88,507,514 2,458,761,404 20.2 0.82010 571,281,150 1,582,764 286,077,480 548,861,274 304,747,309 469,905,753 68,164,391 90,250,112 15,155,045 2,356,025,278 24.2 0.12009 634,710,477 166,605,560 427,432,643 271,897,478 672,142,392 74,924,326 52,672,323 2,300,385,199 27.62008 604,024,956 117,745,266 409,003,309 266,142,594 687,799,217 99,654,631 13,135,332 2,197,505,305 27.52007 500,964,713 158,940,325 331,458,236 259,399,433 603,361,649 95,509,373 1,949,633,729 25.72006 390,657,577 141,858,034 231,789,665 168,521,298 484,184,624 77,480,159 1,494,491,357 26.12005 275,646,980 155,020,082 138,878,659 127,621,679 384,016,841 61,318,465 1,142,502,706 24.02004 224,316,863 160,354,728 107,404,566 88,909,404 322,767,111 16,457,048 920,209,720 24.02003 173,033,965 142,184,749 89,060,733 71,112,677 225,829,026 701,221,150 24.72002 173,207,520 145,258,377 78,435,997 71,433,006 140,343,022 608,677,922 28.52001 232,851,089 167,713,954 92,955,040 95,646,008 59,201,203 648,367,294 35.92000 278,585,728 192,032,222 72,135,321 108,533,862 7,565,684 658,852,817 42.31999 196,460,578 126,821,276 44,086,183 75,770,940 443,138,977 44.31998 137,951,223 94,332,281 37,871,930 58,930,521 329,085,955 41.91997 116,031,496 83,926,288 25,021,282 46,606,429 1,413,206 272,998,701 42.51996 88,456,579 57,082,441 16,325,194 33,839,202 3,414,471 199,117,887 44.41995 77,040,466 48,886,858 14,739,706 30,852,968 2,860,273 174,380,271 44.21994 68,974,809 44,810,966 13,016,116 20,861,609 2,269,165 149,932,665 46.01993 58,710,818 43,390,722 11,411,065 16,203,312 2,010,184 131,726,101 44.61992 44,918,235 36,067,822 10,408,628 12,996,923 2,042,844 106,484,452 42.21991 45,255,301 32,829,447 11,803,703 13,781,027 1,901,208 104,850,686 43.21990 48,486,402 34,197,819 12,443,833 13,750,956 2,546,734 111,425,744 43.51989 61,902,931 41,579,453 16,768,793 17,865,387 3,723,184 141,839,748 43.61988 49,393,231 37,470,045 13,092,707 13,068,755 1,902,900 114,927,638 43.01987 73,315,232 52,770,659 18,088,192 18,951,794 1,305,974 164,431,851 44.61986 64,744,167 47,140,205 15,054,738 13,941,683 1,050,152 141,930,945 45.61985 57,523,599 36,099,739 12,068,358 12,700,805 163,593 118,556,094 48.51984 58,674,901 33,076,866 15,982,001 11,191,471 118,925,239 49.31983 71,695,563 36,199,701 16,607,806 11,155,906 135,658,976 52.81982 75,721,605 38,766,996 13,466,652 9,309,563 137,264,816 55.21981 57,584,175 34,859,475 10,009,565 6,952,567 109,405,782 52.61980 52,916,921 29,048,323 7,758,101 5,486,590 1,518,611 96,728,546 54.71979 35,379,600 17,467,018 4,952,737 3,856,344 2,609,164 64,264,863 55.11978 34,277,350 14,380,959 3,270,378 3,289,968 2,012,363 57,231,018 59.91977 24,838,632 10,077,578 2,195,307 1,925,031 600,780 39,637,328 62.71976 21,498,027 9,035,767 1,274,702 550,194 15,237 32,373,927 66.41975 14,431,023 3,530,564 140,982 18,102,569 79.71974 5,682,907 5,682,907 100.01973 1,119,177 1,119,177 100.0
*The Midwest Stock Exchange (presently the Chicago Stock Exchange) options program began in 1976 and was consolidated with the CBOE on June 2, 1980.**The New York Stock Exchange began trading options in June 1985. On April 28, 1997, CBOE assumed all NYSE options business.
Cleared Equity Options Volume
Page 175
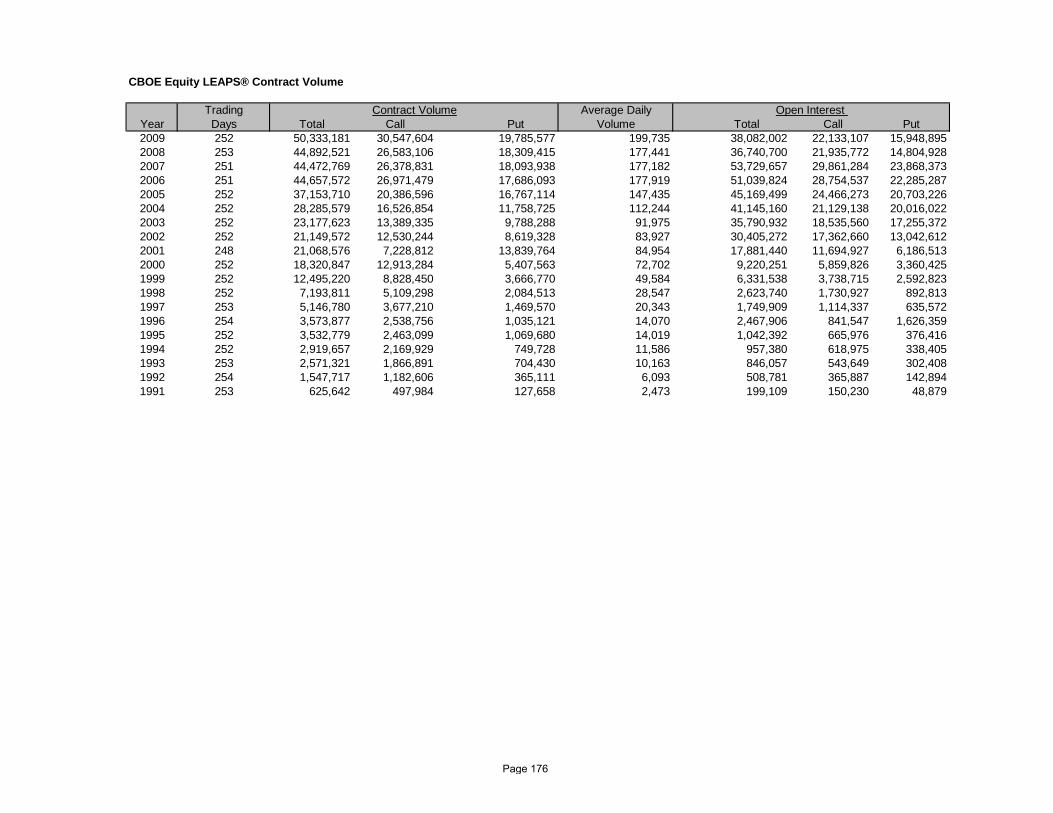
CBOE Equity LEAPS® Contract Volume
Trading Average DailyYear Days Total Call Put Volume Total Call Put2009 252 50,333,181 30,547,604 19,785,577 199,735 38,082,002 22,133,107 15,948,8952008 253 44,892,521 26,583,106 18,309,415 177,441 36,740,700 21,935,772 14,804,9282007 251 44,472,769 26,378,831 18,093,938 177,182 53,729,657 29,861,284 23,868,3732006 251 44,657,572 26,971,479 17,686,093 177,919 51,039,824 28,754,537 22,285,2872005 252 37,153,710 20,386,596 16,767,114 147,435 45,169,499 24,466,273 20,703,2262004 252 28,285,579 16,526,854 11,758,725 112,244 41,145,160 21,129,138 20,016,0222003 252 23,177,623 13,389,335 9,788,288 91,975 35,790,932 18,535,560 17,255,3722002 252 21,149,572 12,530,244 8,619,328 83,927 30,405,272 17,362,660 13,042,6122001 248 21,068,576 7,228,812 13,839,764 84,954 17,881,440 11,694,927 6,186,5132000 252 18,320,847 12,913,284 5,407,563 72,702 9,220,251 5,859,826 3,360,4251999 252 12,495,220 8,828,450 3,666,770 49,584 6,331,538 3,738,715 2,592,8231998 252 7,193,811 5,109,298 2,084,513 28,547 2,623,740 1,730,927 892,8131997 253 5,146,780 3,677,210 1,469,570 20,343 1,749,909 1,114,337 635,5721996 254 3,573,877 2,538,756 1,035,121 14,070 2,467,906 841,547 1,626,3591995 252 3,532,779 2,463,099 1,069,680 14,019 1,042,392 665,976 376,4161994 252 2,919,657 2,169,929 749,728 11,586 957,380 618,975 338,4051993 253 2,571,321 1,866,891 704,430 10,163 846,057 543,649 302,4081992 254 1,547,717 1,182,606 365,111 6,093 508,781 365,887 142,8941991 253 625,642 497,984 127,658 2,473 199,109 150,230 48,879
Contract Volume Open Interest
Page 176
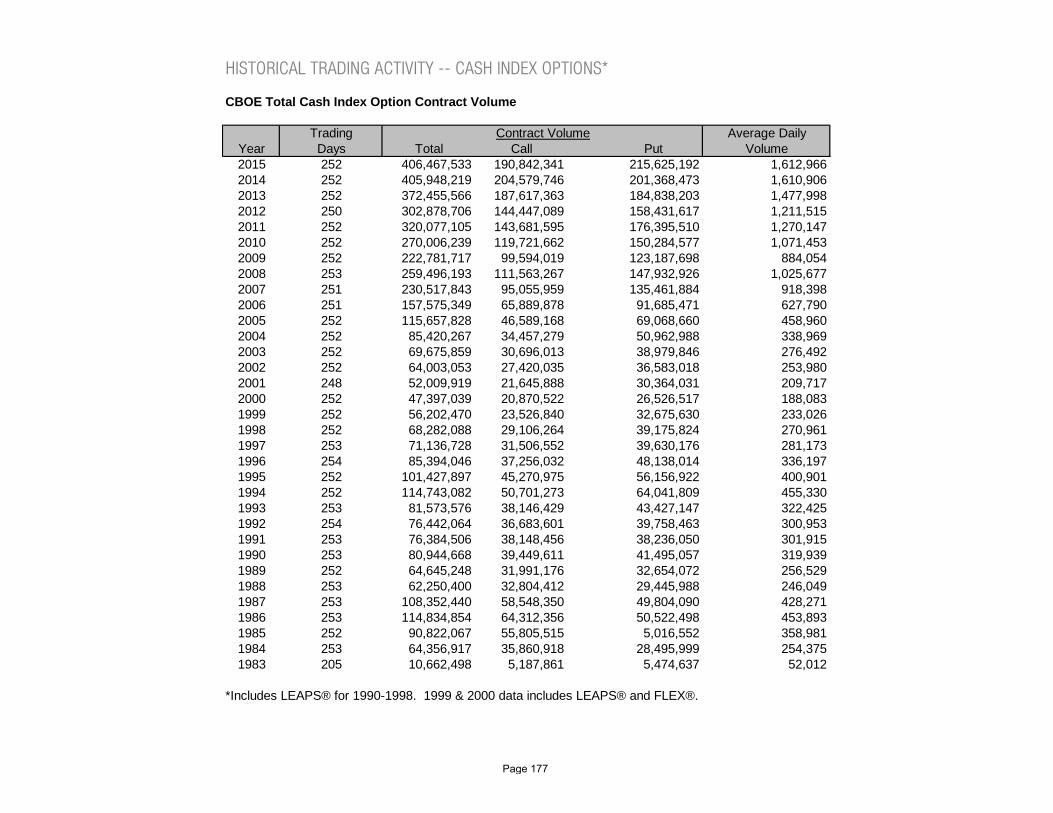
HISTORICAL TRADING ACTIVITY -- CASH INDEX OPTIONS*
CBOE Total Cash Index Option Contract Volume
Trading Average DailyYear Days Total Call Put Volume2015 252 406,467,533 190,842,341 215,625,192 1,612,9662014 252 405,948,219 204,579,746 201,368,473 1,610,9062013 252 372,455,566 187,617,363 184,838,203 1,477,9982012 250 302,878,706 144,447,089 158,431,617 1,211,5152011 252 320,077,105 143,681,595 176,395,510 1,270,1472010 252 270,006,239 119,721,662 150,284,577 1,071,4532009 252 222,781,717 99,594,019 123,187,698 884,0542008 253 259,496,193 111,563,267 147,932,926 1,025,6772007 251 230,517,843 95,055,959 135,461,884 918,3982006 251 157,575,349 65,889,878 91,685,471 627,7902005 252 115,657,828 46,589,168 69,068,660 458,9602004 252 85,420,267 34,457,279 50,962,988 338,9692003 252 69,675,859 30,696,013 38,979,846 276,4922002 252 64,003,053 27,420,035 36,583,018 253,9802001 248 52,009,919 21,645,888 30,364,031 209,7172000 252 47,397,039 20,870,522 26,526,517 188,0831999 252 56,202,470 23,526,840 32,675,630 233,0261998 252 68,282,088 29,106,264 39,175,824 270,9611997 253 71,136,728 31,506,552 39,630,176 281,1731996 254 85,394,046 37,256,032 48,138,014 336,1971995 252 101,427,897 45,270,975 56,156,922 400,9011994 252 114,743,082 50,701,273 64,041,809 455,3301993 253 81,573,576 38,146,429 43,427,147 322,4251992 254 76,442,064 36,683,601 39,758,463 300,9531991 253 76,384,506 38,148,456 38,236,050 301,9151990 253 80,944,668 39,449,611 41,495,057 319,9391989 252 64,645,248 31,991,176 32,654,072 256,5291988 253 62,250,400 32,804,412 29,445,988 246,0491987 253 108,352,440 58,548,350 49,804,090 428,2711986 253 114,834,854 64,312,356 50,522,498 453,8931985 252 90,822,067 55,805,515 5,016,552 358,9811984 253 64,356,917 35,860,918 28,495,999 254,3751983 205 10,662,498 5,187,861 5,474,637 52,012
*Includes LEAPS® for 1990-1998. 1999 & 2000 data includes LEAPS® and FLEX®.
Contract Volume
Page 177

CBOE Total Cash Index Option Open Interest and Dollar Volume
Year Total Call Put Total Call Put2015 16,504,192 7,154,957 9,349,235 $479,543,383,308 $226,618,906,535 $252,924,476,7732014 18,144,073 7,730,564 10,413,509 $427,864,933,032 $225,577,580,178 $202,287,352,8542013 19,844,539 10,086,019 9,758,520 $431,391,928,851 $255,962,697,442 $175,429,231,4092012 16,787,781 8,222,341 8,565,440 $392,482,387,448 $200,688,359,493 $191,794,027,9552011 15,261,775 6,148,200 9,113,575 $536,337,242,696 $245,133,130,659 $291,204,112,0372010 17,094,958 7,442,072 9,652,886 $451,444,699,759 $216,117,491,616 $235,327,208,1432009 16,896,384 7,822,582 9,073,802 $474,272,665,556 $235,806,525,790 $238,466,139,7662008 15,001,141 6,437,670 8,563,471 $701,965,854,990 $243,474,615,645 $458,491,239,3452007 13,510,217 5,448,068 8,062,149 $393,277,382,801 $184,204,220,553 $209,073,162,2482006 13,590,215 5,712,398 7,877,817 $180,949,552,849 $97,982,423,326 $82,967,129,5232005 10,710,125 4,419,799 6,290,326 $124,362,155,959 $63,417,089,377 $60,945,066,5822004 7,873,906 2,813,149 5,060,757 $111,789,605,607 $56,858,870,118 $54,930,735,4892003 6,219,688 2,540,180 3,679,508 $106,423,859,606 $56,846,355,697 $49,577,503,9092002 5,116,156 2,524,734 2,591,422 $106,269,617,884 $40,964,533,127 $65,305,084,7572001 4,075,603 1,862,987 2,212,616 $103,304,236,589 $40,990,346,222 $62,313,890,3672000 3,317,081 1,575,805 1,741,276 $131,117,652,021 $61,270,306,288 $69,847,345,7331999 3,706,451 1,459,002 2,247,449 $119,740,401,583 $64,882,929,610 $54,857,471,9731998 3,232,699 1,308,280 1,924,419 $117,705,321,296 $62,741,413,439 $54,963,907,8571997 3,273,034 1,296,473 1,976,561 $104,182,695,225 $62,957,704,514 $41,224,990,7111996 2,467,906 841,547 1,626,359 $73,513,538,077 $44,971,815,222 $28,541,722,8541995 2,708,600 1,003,661 1,704,939 $60,314,791,589 $40,872,092,367 $19,442,699,2111994 2,844,191 1,273,899 1,570,292 $50,092,654,182 $23,813,355,297 $26,279,298,8851993 2,185,174 889,577 1,295,597 $30,777,982,925 $17,047,779,862 $13,730,203,0631992 1,887,202 809,961 1,077,241 $33,195,348,189 $18,812,242,598 $14,383,105,5911991 1,774,620 719,990 1,054,630 $39,245,357,743 $24,321,846,057 $14,523,511,6861990 1,289,914 569,727 720,187 $42,880,469,686 $20,840,458,316 $22,040,011,3701989 1,005,657 445,741 559,916 $27,505,936,771 $17,563,299,309 $9,942,637,4621988 880,985 422,233 458,752 $27,478,205,683 $15,658,723,033 $11,819,482,6501987 741,736 396,658 345,078 $50,536,478,841 $29,612,693,832 $20,923,785,0091986 1,010,739 501,142 509,597 $35,358,087,000 $22,843,990,000 $12,514,097,0001985 1,286,108 668,340 617,768 $21,623,424,000 $15,471,594,000 $6,151,830,0001984 647,821 398,057 249,764 $15,356,000,000 $9,534,000,000 $5,822,000,0001983 334,510 195,682 138,828 $3,396,000,000 $1,882,000,000 $1,514,000,000
Open Interest in Contracts Dollar Volume
Page 178
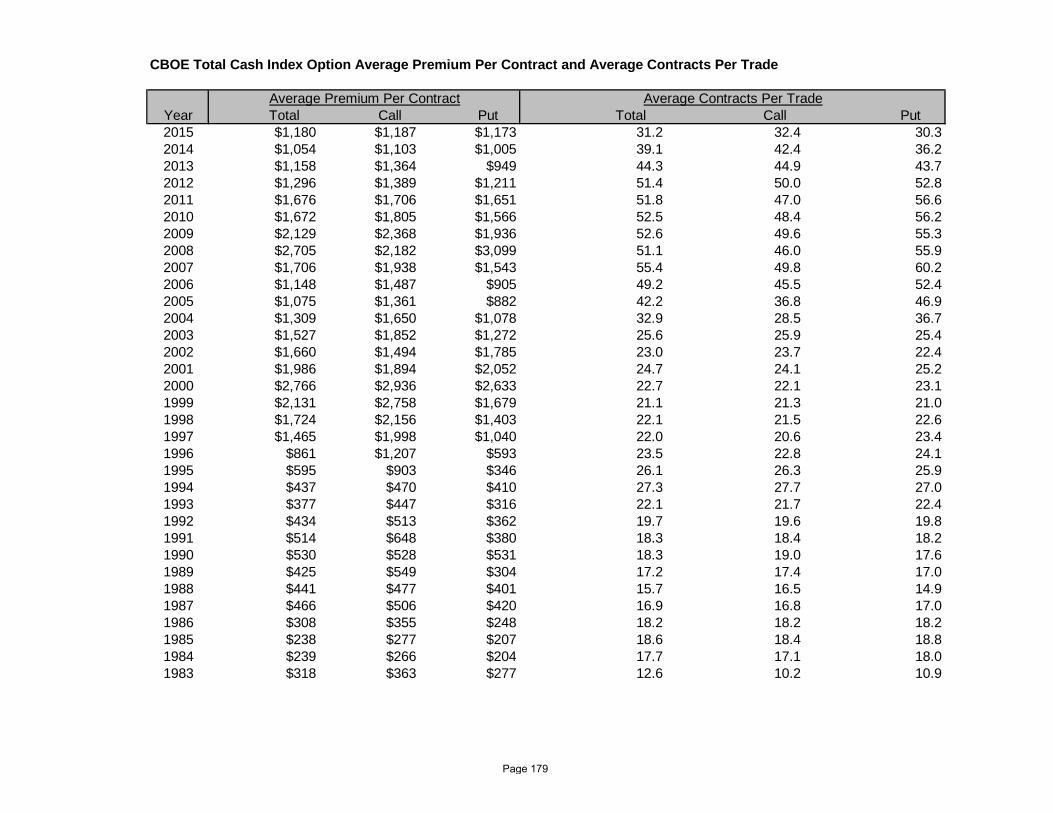
CBOE Total Cash Index Option Average Premium Per Contract and Average Contracts Per Trade
Year Total Call Put Total Call Put2015 $1,180 $1,187 $1,173 31.2 32.4 30.32014 $1,054 $1,103 $1,005 39.1 42.4 36.22013 $1,158 $1,364 $949 44.3 44.9 43.72012 $1,296 $1,389 $1,211 51.4 50.0 52.82011 $1,676 $1,706 $1,651 51.8 47.0 56.62010 $1,672 $1,805 $1,566 52.5 48.4 56.22009 $2,129 $2,368 $1,936 52.6 49.6 55.32008 $2,705 $2,182 $3,099 51.1 46.0 55.92007 $1,706 $1,938 $1,543 55.4 49.8 60.22006 $1,148 $1,487 $905 49.2 45.5 52.42005 $1,075 $1,361 $882 42.2 36.8 46.92004 $1,309 $1,650 $1,078 32.9 28.5 36.72003 $1,527 $1,852 $1,272 25.6 25.9 25.42002 $1,660 $1,494 $1,785 23.0 23.7 22.42001 $1,986 $1,894 $2,052 24.7 24.1 25.22000 $2,766 $2,936 $2,633 22.7 22.1 23.11999 $2,131 $2,758 $1,679 21.1 21.3 21.01998 $1,724 $2,156 $1,403 22.1 21.5 22.61997 $1,465 $1,998 $1,040 22.0 20.6 23.41996 $861 $1,207 $593 23.5 22.8 24.11995 $595 $903 $346 26.1 26.3 25.91994 $437 $470 $410 27.3 27.7 27.01993 $377 $447 $316 22.1 21.7 22.41992 $434 $513 $362 19.7 19.6 19.81991 $514 $648 $380 18.3 18.4 18.21990 $530 $528 $531 18.3 19.0 17.61989 $425 $549 $304 17.2 17.4 17.01988 $441 $477 $401 15.7 16.5 14.91987 $466 $506 $420 16.9 16.8 17.01986 $308 $355 $248 18.2 18.2 18.21985 $238 $277 $207 18.6 18.4 18.81984 $239 $266 $204 17.7 17.1 18.01983 $318 $363 $277 12.6 10.2 10.9
Average Premium Per Contract Average Contracts Per Trade
Page 179

OEX® (S&P 100®) Contract Volume and Open Interest
Trading Average Daily OpenYear Days Total Call Put Volume Interest2015 252 1,266,658 562,898 703,760 5,026 34,9272014 252 1,556,688 692,049 864,639 6,177 39,6162013 252 2,367,870 1,044,160 1,323,710 9,396 27,2652012 250 3,971,520 1,644,869 2,326,651 15,886 39,7082011 252 6,816,440 2,700,323 4,116,117 27,049 98,6732010 252 10,837,448 5,531,696 5,305,752 43,006 163,5332009 252 9,049,978 4,335,501 4,714,477 35,913 224,8382008 253 11,104,220 5,371,194 5,733,026 43,890 156,7262007 251 14,908,116 6,186,250 8,721,866 59,395 230,6242006 251 17,106,482 7,699,626 9,406,856 68,153 252,2642005 252 18,672,964 8,919,153 9,753,811 74,099 265,0582004 252 16,426,392 7,993,875 8,432,517 65,184 318,6902003 252 14,343,992 6,994,379 7,349,613 56,921 254,4882002 252 13,530,159 6,534,139 6,996,020 53,691 183,3552001 248 10,399,217 4,840,572 5,558,645 41,932 192,0112000 252 15,557,421 7,047,058 8,510,363 61,736 179,3711999 252 25,761,292 11,253,040 14,508,252 102,227 287,9801998 252 33,425,854 15,458,446 17,967,408 132,642 312,8051997 253 36,595,576 17,580,145 19,015,431 144,647 398,4831996 254 54,929,246 24,967,860 29,961,386 216,257 422,2201995 252 69,633,460 31,416,311 38,217,149 276,323 617,8251994 252 81,824,650 36,995,171 44,829,479 324,701 817,4471993 253 64,031,944 30,628,988 33,402,956 253,091 805,6611992 254 62,427,272 30,600,646 31,826,606 245,797 664,5271991 253 63,935,546 32,173,041 31,762,505 252,710 783,5811990 253 68,846,535 33,616,840 35,229,695 272,121 575,6331989 252 58,371,337 28,716,525 29,654,812 231,632 548,5061988 253 57,433,506 30,221,224 27,212,282 227,010 566,3231987 253 101,827,077 55,158,010 46,669,067 402,479 500,3691986 253 113,151,085 63,392,789 49,758,296 447,237 871,0431985 252 90,804,930 55,795,875 35,009,055 360,337 1,285,4471984 253 64,288,445 35,823,507 28,464,938 254,105 647,8101983 205 10,595,664 5,145,533 5,450,131 51,686 332,007
XEO® (S&P 100® European Style) Contract Volume and Open Interest
Trading Average Daily OpenYear Days Total Call Put Volume Interest2015 252 176,916 73,900 103,016 702 6,3532014 252 342,903 74,905 267,998 1,361 7,6482013 252 697,497 287,620 409,877 2,768 14,6052012 250 882,104 416,775 465,329 3,528 9,1912011 252 1,249,065 592,397 656,668 4,957 46,6282010 252 2,393,982 1,210,464 1,183,518 9,500 44,8812009 252 2,230,935 1,101,686 1,129,249 8,853 86,8692008 253 2,478,564 1,105,721 1,372,843 9,797 154,7652007 251 2,836,627 1,326,271 1,510,356 11,301 111,0932006 251 3,706,720 1,254,967 2,451,753 14,768 220,9312005 252 1,922,543 948,157 974,386 7,629 67,3582004 252 1,800,574 842,544 958,030 7,145 80,4882003 252 1,933,355 962,550 970,805 7,672 78,3862002 252 1,708,074 797,153 910,921 6,778 72,9022001 123 473,625 187,189 286,436 3,851 62,997
Contract Volume
Contract Volume
Page 180

SPX (S&P 500®) Contract Volume and Open Interest
Trading Average Daily OpenYear Days Total Call Put Volume Interest2015 252 236,532,325 80,878,894 155,653,431 938,620 10,975,5172014 252 223,798,536 80,959,773 142,838,763 888,089 11,882,7832013 252 207,488,939 82,898,646 124,590,293 823,369 11,207,6362012 250 174,457,138 66,140,996 108,316,142 697,829 9,332,2382011 252 197,509,449 70,328,866 127,180,583 783,768 10,802,8442010 252 175,291,508 66,811,419 108,480,089 695,601 11,328,7292009 252 154,869,646 61,997,990 92,871,656 614,562 10,735,9152008 253 179,045,021 67,489,789 111,555,232 707,688 10,372,6502007 251 158,084,691 55,560,969 102,523,722 629,819 8,187,4102006 251 104,312,673 40,128,731 64,183,942 415,588 7,848,7852005 252 71,802,558 26,511,165 45,291,393 284,931 6,080,3232004 252 49,472,117 17,781,545 31,690,572 196,318 4,965,8072003 252 36,754,720 15,458,872 21,295,848 145,852 3,839,5852002 252 29,939,598 12,680,856 17,258,742 118,808 3,169,4152001 248 24,271,222 10,165,544 14,105,678 97,868 2,674,6082000 252 23,290,194 10,202,047 13,088,147 92,421 2,496,3491999 252 24,699,878 10,160,737 14,539,141 98,015 2,850,5231998 252 25,708,136 10,383,764 15,324,372 102,016 1,730,7941997 253 26,494,543 10,276,751 16,217,792 104,722 1,606,3181996 254 24,844,808 10,032,433 14,812,375 97,814 1,339,6511995 252 26,726,023 11,638,290 15,087,733 106,056 1,352,8371994 252 28,016,776 11,667,855 16,348,921 111,178 1,282,4851993 253 16,454,282 7,183,029 9,271,253 65,037 1,098,6601992 254 13,420,174 5,990,574 7,429,600 52,835 993,9221991 253 11,924,719 5,850,383 6,074,336 47,133 726,0851990 253 12,089,035 5,829,971 6,259,064 47,783 708,5771989 252 6,273,911 3,274,651 2,999,260 24,952 457,1511988 253 4,816,894 2,583,188 2,233,706 19,039 314,6621987 253 6,204,793 3,199,564 3,005,229 24,525 241,3671986 253 1,682,808 919,026 763,782 6,786 139,6961985 252 7,762 4,949 2,813 31 6611984 253 11,970 5,065 6,905 47 111983 127 14,093 6,210 7,883 111 2,503
XSP (Mini S&P 500®) Contract Volume and Open Interest
Trading Average Daily OpenYear Days Total Call Put Volume Interest2015 252 1,925,119 528,840 1,396,279 7,639 300,2872014 252 1,322,973 392,086 930,887 5,250 254,2612013 252 351,503 119,588 231,915 1,395 63,3262012 250 80,109 37,486 42,623 320 12,6632011 252 92,504 31,268 61,236 367 25,7332010 252 268,399 135,603 132,796 1,065 44,3832009 252 819,013 389,451 429,562 3,250 77,7632008 253 2,853,825 1,212,293 1,641,532 11,280 239,8702007 251 1,535,570 641,738 893,832 6,118 319,5282006 251 1,771,820 799,620 972,200 7,059 937,3302005 47 709,820 382,038 327,782 15,103 981,280
Contract Volume
Contract Volume
Page 181
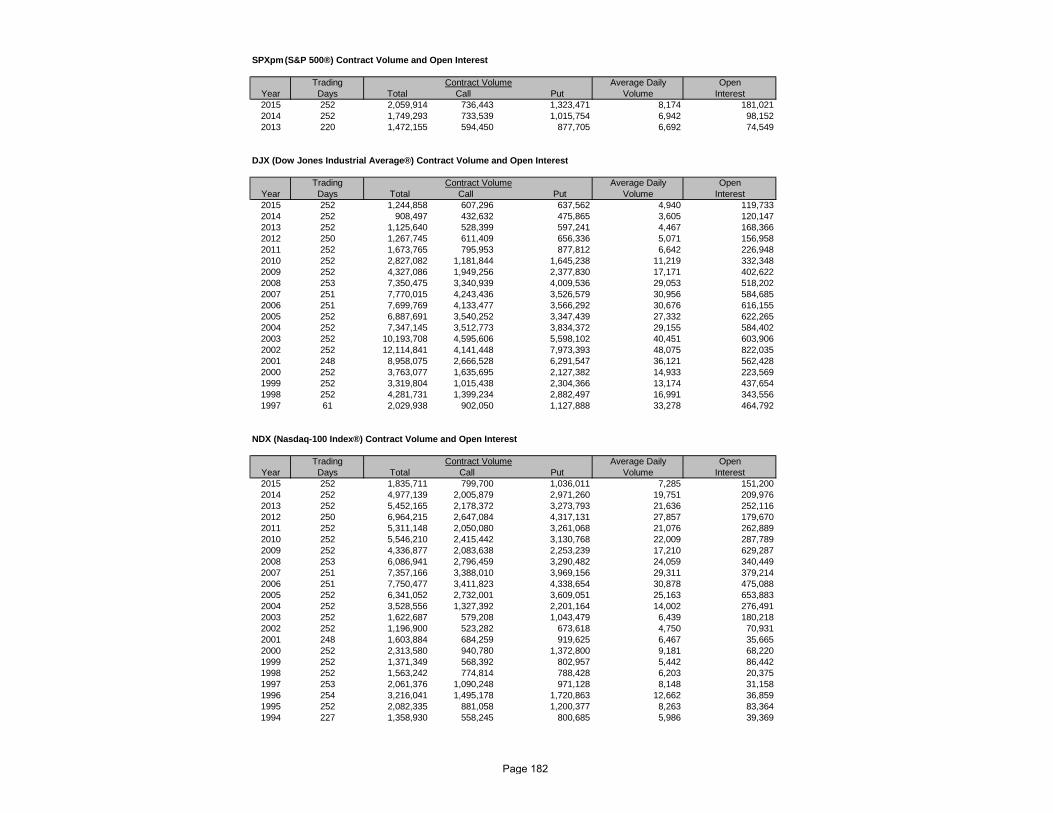
SPXpm (S&P 500®) Contract Volume and Open Interest
Trading Average Daily OpenYear Days Total Call Put Volume Interest2015 252 2,059,914 736,443 1,323,471 8,174 181,0212014 252 1,749,293 733,539 1,015,754 6,942 98,1522013 220 1,472,155 594,450 877,705 6,692 74,549
DJX (Dow Jones Industrial Average®) Contract Volume and Open Interest
Trading Average Daily OpenYear Days Total Call Put Volume Interest2015 252 1,244,858 607,296 637,562 4,940 119,7332014 252 908,497 432,632 475,865 3,605 120,1472013 252 1,125,640 528,399 597,241 4,467 168,3662012 250 1,267,745 611,409 656,336 5,071 156,9582011 252 1,673,765 795,953 877,812 6,642 226,9482010 252 2,827,082 1,181,844 1,645,238 11,219 332,3482009 252 4,327,086 1,949,256 2,377,830 17,171 402,6222008 253 7,350,475 3,340,939 4,009,536 29,053 518,2022007 251 7,770,015 4,243,436 3,526,579 30,956 584,6852006 251 7,699,769 4,133,477 3,566,292 30,676 616,1552005 252 6,887,691 3,540,252 3,347,439 27,332 622,2652004 252 7,347,145 3,512,773 3,834,372 29,155 584,4022003 252 10,193,708 4,595,606 5,598,102 40,451 603,9062002 252 12,114,841 4,141,448 7,973,393 48,075 822,0352001 248 8,958,075 2,666,528 6,291,547 36,121 562,4282000 252 3,763,077 1,635,695 2,127,382 14,933 223,5691999 252 3,319,804 1,015,438 2,304,366 13,174 437,6541998 252 4,281,731 1,399,234 2,882,497 16,991 343,5561997 61 2,029,938 902,050 1,127,888 33,278 464,792
NDX (Nasdaq-100 Index®) Contract Volume and Open Interest
Trading Average Daily OpenYear Days Total Call Put Volume Interest2015 252 1,835,711 799,700 1,036,011 7,285 151,2002014 252 4,977,139 2,005,879 2,971,260 19,751 209,9762013 252 5,452,165 2,178,372 3,273,793 21,636 252,1162012 250 6,964,215 2,647,084 4,317,131 27,857 179,6702011 252 5,311,148 2,050,080 3,261,068 21,076 262,8892010 252 5,546,210 2,415,442 3,130,768 22,009 287,7892009 252 4,336,877 2,083,638 2,253,239 17,210 629,2872008 253 6,086,941 2,796,459 3,290,482 24,059 340,4492007 251 7,357,166 3,388,010 3,969,156 29,311 379,2142006 251 7,750,477 3,411,823 4,338,654 30,878 475,0882005 252 6,341,052 2,732,001 3,609,051 25,163 653,8832004 252 3,528,556 1,327,392 2,201,164 14,002 276,4912003 252 1,622,687 579,208 1,043,479 6,439 180,2182002 252 1,196,900 523,282 673,618 4,750 70,9312001 248 1,603,884 684,259 919,625 6,467 35,6652000 252 2,313,580 940,780 1,372,800 9,181 68,2201999 252 1,371,349 568,392 802,957 5,442 86,4421998 252 1,563,242 774,814 788,428 6,203 20,3751997 253 2,061,376 1,090,248 971,128 8,148 31,1581996 254 3,216,041 1,495,178 1,720,863 12,662 36,8591995 252 2,082,335 881,058 1,200,377 8,263 83,3641994 227 1,358,930 558,245 800,685 5,986 39,369
Contract Volume
Contract Volume
Contract Volume
Page 182
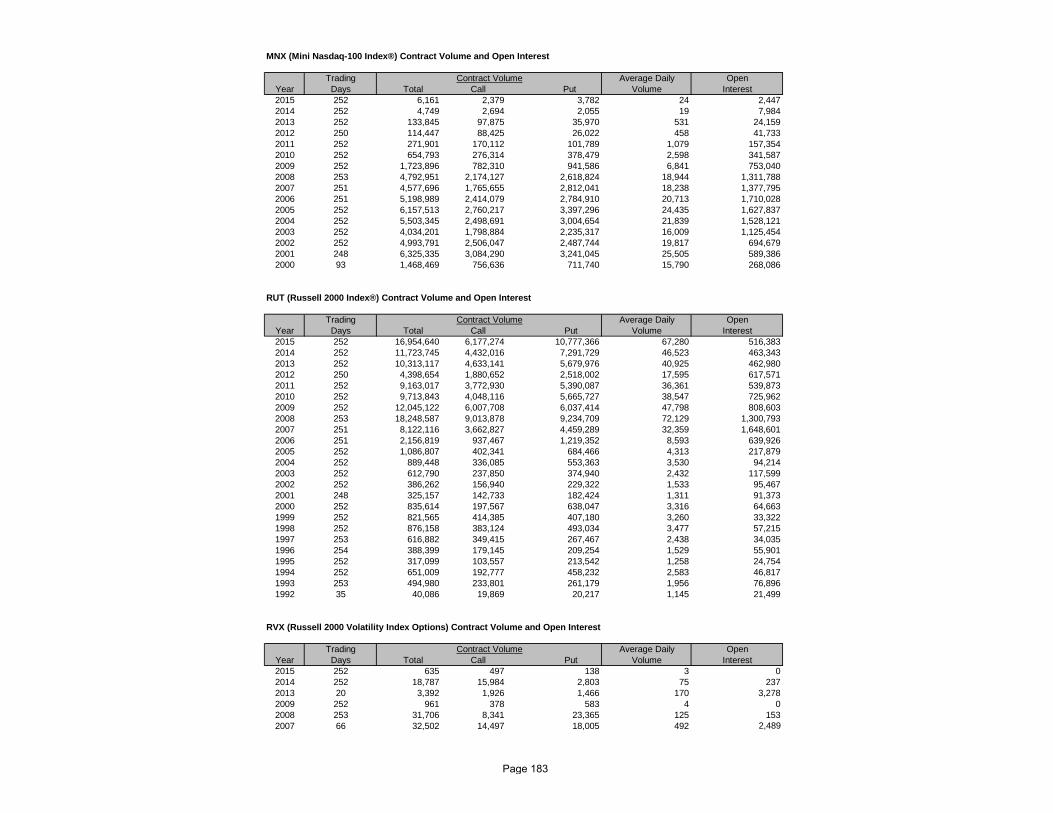
MNX (Mini Nasdaq-100 Index®) Contract Volume and Open Interest
Trading Average Daily OpenYear Days Total Call Put Volume Interest2015 252 6,161 2,379 3,782 24 2,4472014 252 4,749 2,694 2,055 19 7,9842013 252 133,845 97,875 35,970 531 24,1592012 250 114,447 88,425 26,022 458 41,7332011 252 271,901 170,112 101,789 1,079 157,3542010 252 654,793 276,314 378,479 2,598 341,5872009 252 1,723,896 782,310 941,586 6,841 753,0402008 253 4,792,951 2,174,127 2,618,824 18,944 1,311,7882007 251 4,577,696 1,765,655 2,812,041 18,238 1,377,7952006 251 5,198,989 2,414,079 2,784,910 20,713 1,710,0282005 252 6,157,513 2,760,217 3,397,296 24,435 1,627,8372004 252 5,503,345 2,498,691 3,004,654 21,839 1,528,1212003 252 4,034,201 1,798,884 2,235,317 16,009 1,125,4542002 252 4,993,791 2,506,047 2,487,744 19,817 694,6792001 248 6,325,335 3,084,290 3,241,045 25,505 589,3862000 93 1,468,469 756,636 711,740 15,790 268,086
RUT (Russell 2000 Index®) Contract Volume and Open Interest
Trading Average Daily OpenYear Days Total Call Put Volume Interest2015 252 16,954,640 6,177,274 10,777,366 67,280 516,3832014 252 11,723,745 4,432,016 7,291,729 46,523 463,3432013 252 10,313,117 4,633,141 5,679,976 40,925 462,9802012 250 4,398,654 1,880,652 2,518,002 17,595 617,5712011 252 9,163,017 3,772,930 5,390,087 36,361 539,8732010 252 9,713,843 4,048,116 5,665,727 38,547 725,9622009 252 12,045,122 6,007,708 6,037,414 47,798 808,6032008 253 18,248,587 9,013,878 9,234,709 72,129 1,300,7932007 251 8,122,116 3,662,827 4,459,289 32,359 1,648,6012006 251 2,156,819 937,467 1,219,352 8,593 639,9262005 252 1,086,807 402,341 684,466 4,313 217,8792004 252 889,448 336,085 553,363 3,530 94,2142003 252 612,790 237,850 374,940 2,432 117,5992002 252 386,262 156,940 229,322 1,533 95,4672001 248 325,157 142,733 182,424 1,311 91,3732000 252 835,614 197,567 638,047 3,316 64,6631999 252 821,565 414,385 407,180 3,260 33,3221998 252 876,158 383,124 493,034 3,477 57,2151997 253 616,882 349,415 267,467 2,438 34,0351996 254 388,399 179,145 209,254 1,529 55,9011995 252 317,099 103,557 213,542 1,258 24,7541994 252 651,009 192,777 458,232 2,583 46,8171993 253 494,980 233,801 261,179 1,956 76,8961992 35 40,086 19,869 20,217 1,145 21,499
RVX (Russell 2000 Volatility Index Options) Contract Volume and Open Interest
Trading Average Daily OpenYear Days Total Call Put Volume Interest2015 252 635 497 138 3 02014 252 18,787 15,984 2,803 75 2372013 20 3,392 1,926 1,466 170 3,2782009 252 961 378 583 4 02008 253 31,706 8,341 23,365 125 1532007 66 32,502 14,497 18,005 492 2,489
Contract Volume
Contract Volume
Contract Volume
Page 183
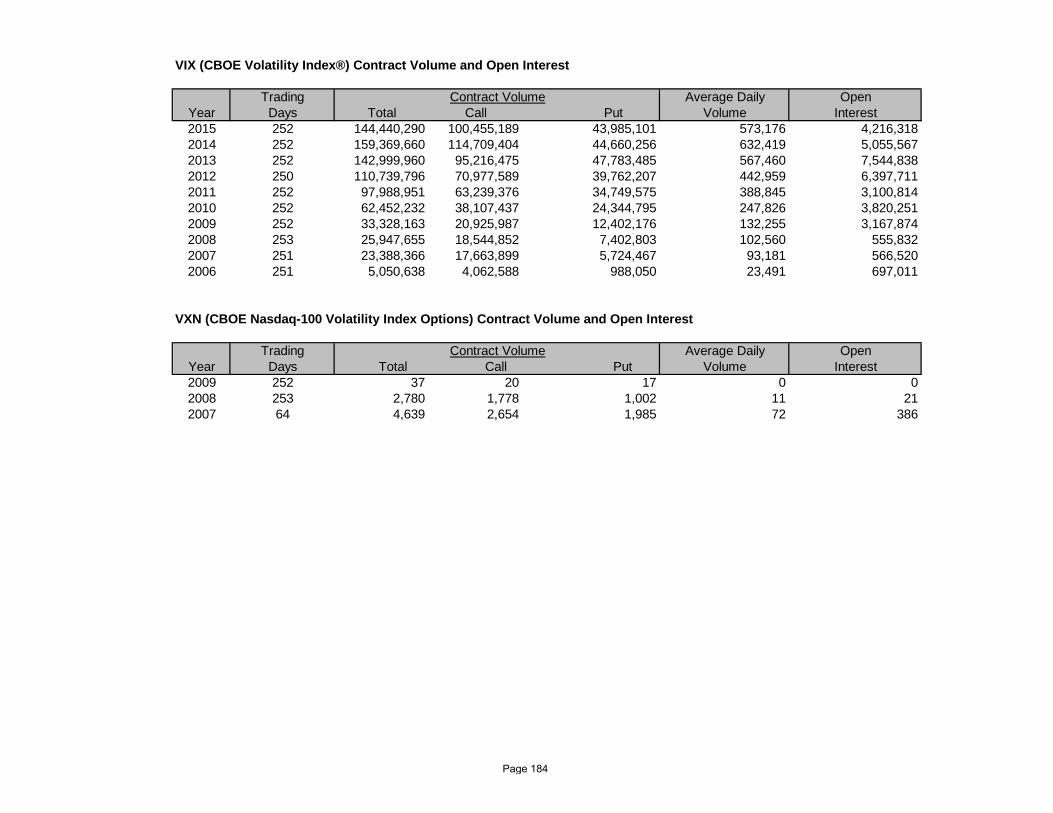
VIX (CBOE Volatility Index®) Contract Volume and Open Interest
Trading Average Daily OpenYear Days Total Call Put Volume Interest2015 252 144,440,290 100,455,189 43,985,101 573,176 4,216,3182014 252 159,369,660 114,709,404 44,660,256 632,419 5,055,5672013 252 142,999,960 95,216,475 47,783,485 567,460 7,544,8382012 250 110,739,796 70,977,589 39,762,207 442,959 6,397,7112011 252 97,988,951 63,239,376 34,749,575 388,845 3,100,8142010 252 62,452,232 38,107,437 24,344,795 247,826 3,820,2512009 252 33,328,163 20,925,987 12,402,176 132,255 3,167,8742008 253 25,947,655 18,544,852 7,402,803 102,560 555,8322007 251 23,388,366 17,663,899 5,724,467 93,181 566,5202006 251 5,050,638 4,062,588 988,050 23,491 697,011
VXN (CBOE Nasdaq-100 Volatility Index Options) Contract Volume and Open Interest
Trading Average Daily OpenYear Days Total Call Put Volume Interest2009 252 37 20 17 0 02008 253 2,780 1,778 1,002 11 212007 64 4,639 2,654 1,985 72 386
Contract Volume
Contract Volume
Page 184

C2 Total Cash Index Option Contract Volume
Trading Average DailyYear Days Total Call Put Volume2015 252 1,810,744 544,206 1,266,538 7,1852014 252 550,091 181,176 368,915 2,1832013 116 212,837 85,593 127,244 1,8352012 250 1,472,563 600,138 872,425 5,8902011 62 316,286 122,504 193,782 5,101
C2 Total Cash Index Option Open Interest and Dollar Volume
Year Total Call Put Total Call Put2015 516,383 161,629 354,754 $2,079,703,745 $850,406,979 $1,229,296,7662014 463,343 171,390 291,953 $504,917,116 $192,020,214 $312,896,9022013 462,980 201,674 261,306 $128,840,224 $67,543,688 $61,296,5362012 29,429 11,774 17,655 $851,195,627 $405,040,451 $446,155,1762011 41,573 11,922 29,651 $362,019,377 $194,198,365 $167,821,012
C2 Total Cash Index Option Average Premium Per Contract and Average Contracts Per Trade
Year Total Call Put Total Call Put2015 $1,149 $1,563 $971 4.8 4.0 5.22014 $918 $1,060 $848 3.9 3.5 4.22013 $605 $789 $482 5.7 5.2 6.02012 $578 $675 $511 9.4 9.2 9.62011 $1,145 $1,585 $866 8.8 8.0 9.3
SPXpm (S&P 500®) Contract Volume and Open Interest
Trading Average Daily OpenYear Days Total Call Put Volume Interest2013 32 136,250 56,034 80,216 4,258 54,8362012 250 1,472,563 600,138 872,425 5,890 29,4292011 62 316,286 122,504 193,782 5,101 41,573
RUT (Russell 2000 Index®) Contract Volume and Open Interest
Trading Average Daily OpenYear Days Total Call Put Volume Interest2015 252 1,810,744 544,206 1,266,538 7,185 516,3832014 252 550,091 181,176 368,915 2,183 463,3432013 84 76,587 29,559 47,028 912 462,980
Contract Volume
Contract Volume
Open Interest in Contracts Dollar Volume
Average Premium Per Contract Average Contracts Per Trade
Contract Volume
Page 185

Total Cash Index Options Contract Volume by ExchangeCBOE C2
% Share of % Share ofYear CBOE C2 AMEX PHLX NYSE ARCA ISE BOX NSDQ GEM NYSE MSE NASD Total Total Volume Total Volume2015 406,467,533 1,810,744 1,685,336 1,435,325 1,786,582 2,159,553 170,750 202,382 415,718,205 97.8% 0.44%2014 405,948,219 550,091 5,934,661 887,887 5,290,695 1,113,591 350 409,805 160,277 420,295,576 96.6% 0.13%2013 372,455,566 212,837 2,169,700 2,278,142 3,511,257 4,236,267 23,381 501,249 22,884 385,411,283 96.6% 0.06%2012 302,878,706 1,472,563 1,762,751 8,335,841 1,848,593 5,537,826 36,892 177,448 322,050,620 94.0% 0.46%2011 320,077,105 316,286 2,592,549 5,523,693 1,291,387 8,075,975 107,691 158,848 338,143,534 94.7% 0.09%2010 270,006,239 1,940,116 3,264,495 1,012,594 11,415,450 185,312 78,564 287,902,770 93.8%2009 222,781,717 3,483,300 3,768,015 403,388 13,259,920 449,064 244,145,404 91.2%2008 259,496,193 7,428,496 5,547,813 745,206 17,850,871 1,097,558 292,166,137 88.8%2007 230,517,843 13,804,541 6,719,120 295,980 15,719,177 847,448 267,904,109 86.0%2006 157,575,349 10,050,680 7,589,744 8,212,419 48,859 183,477,051 85.9%2005 115,657,828 8,678,564 6,211,858 4,464,570 135,012,820 85.7%2004 85,420,267 7,290,157 5,275,701 83,358 98,069,483 87.1%2003 69,675,859 4,272,865 3,221,784 10,833 77,181,341 90.3%2002 64,003,053 2,606,890 3,602,611 70,212,554 91.2%2001 52,306,915 1,161,485 4,517,137 57,985,537 90.2%2000 46,711,119 15,694,467 3,862,126 7,978 67,296,274 70.9%1999 57,828,717 2,840,913 3,189,587 30,269 63,889,486 90.5%1998 68,838,008 3,329,392 3,139,347 40,718 75,347,465 91.4%1997 71,136,728 4,181,554 2,776,578 79,811 8,054 78,182,725 91.0%1996 85,394,046 4,509,450 2,459,867 42,560 24,519 92,430,442 92.4%1995 101,427,897 3,505,041 2,799,964 52,163 25,425 107,810,490 94.1%1994 114,743,082 3,694,414 2,549,514 68,260 31,535 121,086,805 94.8%1993 81,573,576 4,493,235 1,153,714 161,432 42,781 87,424,738 93.3%1992 76,442,064 6,247,120 354,005 69,695 134,197 83,247,081 91.8%1991 76,384,506 5,976,142 433,686 71,577 158,761 83,024,672 92.0%1990 80,944,668 6,617,870 218,659 130,313 271,077 88,182,587 91.8%1989 64,645,248 8,282,314 151,117 226,047 592,760 73,897,486 87.5%1988 62,250,400 7,548,749 156,597 280,393 724,889 70,961,028 87.7%1987 108,352,440 18,192,811 498,756 459,081 2,193,121 129,696,209 83.5%1986 114,834,854 18,274,774 1,398,800 134,189 3,773,630 45,239 138,461,486 82.9%1985 90,822,067 12,437,897 2,321,006 92,646 4,263,262 107,453 110,044,331 82.5%1984 64,356,841 7,006,035 127,049 174,585 4,093,816 75,758,326 85.0%1983 10,662,498 2,693,153 6,278 656,480 14,018,409 76.1%
Page 186
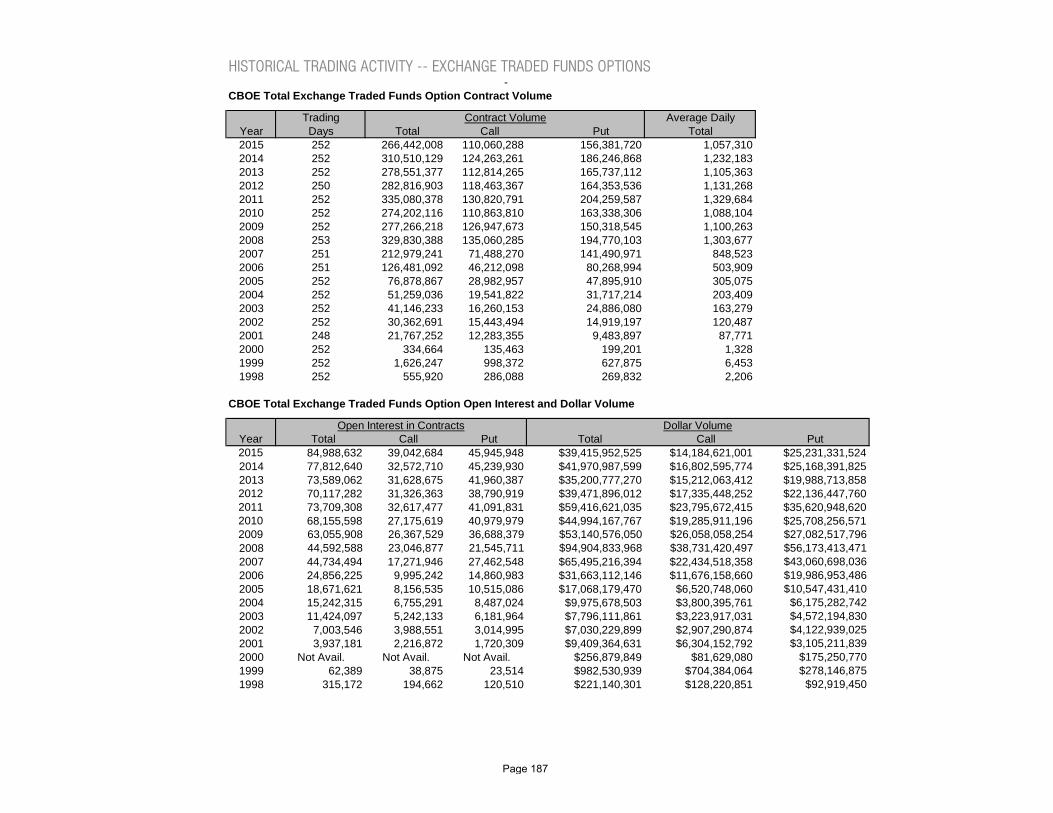
HISTORICAL TRADING ACTIVITY -- EXCHANGE TRADED FUNDS OPTIONS-
CBOE Total Exchange Traded Funds Option Contract Volume
Trading Average DailyYear Days Total Call Put Total2015 252 266,442,008 110,060,288 156,381,720 1,057,3102014 252 310,510,129 124,263,261 186,246,868 1,232,1832013 252 278,551,377 112,814,265 165,737,112 1,105,3632012 250 282,816,903 118,463,367 164,353,536 1,131,2682011 252 335,080,378 130,820,791 204,259,587 1,329,6842010 252 274,202,116 110,863,810 163,338,306 1,088,1042009 252 277,266,218 126,947,673 150,318,545 1,100,2632008 253 329,830,388 135,060,285 194,770,103 1,303,6772007 251 212,979,241 71,488,270 141,490,971 848,5232006 251 126,481,092 46,212,098 80,268,994 503,9092005 252 76,878,867 28,982,957 47,895,910 305,0752004 252 51,259,036 19,541,822 31,717,214 203,4092003 252 41,146,233 16,260,153 24,886,080 163,2792002 252 30,362,691 15,443,494 14,919,197 120,4872001 248 21,767,252 12,283,355 9,483,897 87,7712000 252 334,664 135,463 199,201 1,3281999 252 1,626,247 998,372 627,875 6,4531998 252 555,920 286,088 269,832 2,206
CBOE Total Exchange Traded Funds Option Open Interest and Dollar Volume
Year Total Call Put Total Call Put2015 84,988,632 39,042,684 45,945,948 $39,415,952,525 $14,184,621,001 $25,231,331,5242014 77,812,640 32,572,710 45,239,930 $41,970,987,599 $16,802,595,774 $25,168,391,8252013 73,589,062 31,628,675 41,960,387 $35,200,777,270 $15,212,063,412 $19,988,713,8582012 70,117,282 31,326,363 38,790,919 $39,471,896,012 $17,335,448,252 $22,136,447,7602011 73,709,308 32,617,477 41,091,831 $59,416,621,035 $23,795,672,415 $35,620,948,6202010 68,155,598 27,175,619 40,979,979 $44,994,167,767 $19,285,911,196 $25,708,256,5712009 63,055,908 26,367,529 36,688,379 $53,140,576,050 $26,058,058,254 $27,082,517,7962008 44,592,588 23,046,877 21,545,711 $94,904,833,968 $38,731,420,497 $56,173,413,4712007 44,734,494 17,271,946 27,462,548 $65,495,216,394 $22,434,518,358 $43,060,698,0362006 24,856,225 9,995,242 14,860,983 $31,663,112,146 $11,676,158,660 $19,986,953,4862005 18,671,621 8,156,535 10,515,086 $17,068,179,470 $6,520,748,060 $10,547,431,4102004 15,242,315 6,755,291 8,487,024 $9,975,678,503 $3,800,395,761 $6,175,282,7422003 11,424,097 5,242,133 6,181,964 $7,796,111,861 $3,223,917,031 $4,572,194,8302002 7,003,546 3,988,551 3,014,995 $7,030,229,899 $2,907,290,874 $4,122,939,0252001 3,937,181 2,216,872 1,720,309 $9,409,364,631 $6,304,152,792 $3,105,211,8392000 Not Avail. Not Avail. Not Avail. $256,879,849 $81,629,080 $175,250,7701999 62,389 38,875 23,514 $982,530,939 $704,384,064 $278,146,8751998 315,172 194,662 120,510 $221,140,301 $128,220,851 $92,919,450
Contract Volume
Open Interest in Contracts Dollar Volume
Page 187

CBOE Total Exchange Traded Funds Option Average Premium Per Contract and Average Contracts Per Trade
Year Total Call Put Total Call Put2015 $148 $129 $161 22.5 19.1 25.82014 $135 $135 $135 24.6 20.3 28.72013 $126 $135 $121 26.1 21.5 30.62012 $140 $146 $135 29.1 23.3 35.32011 $177 $182 $174 31.6 24.0 39.52010 $164 $174 $157 32.9 25.0 41.82009 $192 $205 $180 31.7 26.2 38.62008 $288 $287 $288 17.1 17.1 17.12007 $308 $314 $304 16.8 16.7 16.82006 $250 $253 $249 15.3 15.2 15.32005 $222 $225 $220 16.4 16.3 16.42004 $195 $194 $195 17.5 17.5 17.52003 $189 $198 $184 18.1 14.7 21.32002 $232 $188 $276 16.1 14.6 18.12001 $432 $513 $327 10.7 7.2 28.22000 $768 $603 $880 12.4 10.4 14.21999 $604 $706 $443 10.4 9.5 12.11998 $398 $448 $344 11.1 9.8 13.0
Average Premium Per Contract Average Contracts Per Trade
Page 188

QQQQ (PowerShares QQQ) Contract Volume and Open Interest
Trading Average Daily OpenYear Days Total Call Put Volume Interest2015 252 20,071,569 8,638,574 11,432,995 79,649 3,271,9022014 252 25,266,820 10,781,260 14,485,560 100,265 3,813,1392013 252 16,863,083 7,062,244 9,800,839 66,917 4,463,8132012 250 25,510,746 9,909,845 15,600,901 102,043 3,985,5432011 252 31,437,548 11,864,209 19,573,339 124,752 3,743,9212010 252 33,286,485 12,459,089 20,827,396 132,089 4,613,0542009 252 45,998,373 19,561,455 26,436,918 182,533 6,586,4162008 253 61,210,641 26,557,385 34,653,256 241,939 5,381,5072007 251 43,215,491 16,096,941 27,118,550 172,173 9,363,6522006 251 31,693,928 13,256,831 18,437,097 126,271 7,178,2092005 252 26,337,846 10,875,082 15,462,764 104,515 7,408,5182004 252 32,628,165 11,744,724 20,883,441 129,477 11,464,2442003 252 28,081,944 10,482,751 17,599,193 111,436 9,265,4542002 252 24,052,423 12,856,006 11,196,417 95,446 6,173,5502001 227 20,314,749 11,575,444 8,739,305 89,492 3,752,838
DIA (DIAMONDS) Options Contract Volume and Open Interest
Trading Average Daily OpenYear Days Total Call Put Volume Interest2015 252 1,897,069 961,096 935,973 7,528 702,4402014 252 2,463,688 1,159,601 1,304,087 9,777 518,5432013 252 2,719,832 1,263,214 1,456,618 10,793 514,9752012 250 2,619,371 1,294,188 1,325,183 10,477 658,4372011 252 2,069,702 957,528 1,112,174 8,213 764,5272010 252 3,576,433 1,730,084 1,846,349 14,192 807,8132009 252 4,706,166 2,363,899 2,342,267 18,675 1,004,1172008 253 10,415,316 5,158,471 5,256,845 41,167 1,526,2452007 251 7,965,019 3,366,939 4,598,080 31,733 1,936,1082006 251 8,239,891 3,605,401 4,634,490 32,828 1,456,3602005 252 9,126,654 4,430,628 4,696,026 36,217 1,356,7062004 252 8,552,875 4,113,430 4,439,445 33,940 722,1452003 252 9,370,722 4,020,916 5,349,806 37,185 730,4092002 157 4,500,093 1,598,219 2,901,874 28,663 274,702
Contract Volume
Contract Volume
Page 189

SPY (S&P Depositary Receipts) Contract Volume and Open Interest
Trading Average Daily OpenYear Days Total Call Put Volume Interest2015 252 127,003,574 45,173,834 81,829,740 503,982 18,185,0002014 252 138,122,971 48,568,049 89,554,922 548,107 19,507,4882013 252 129,110,255 47,101,098 82,009,157 512,342 18,090,8542012 250 132,658,552 47,662,000 84,996,552 530,634 18,299,7682011 252 146,080,174 47,049,026 99,031,148 579,683 17,581,5012010 252 93,719,864 30,629,966 63,089,898 371,904 13,980,6952009 252 86,473,960 33,756,808 52,717,152 343,151 11,445,7342008 253 96,901,151 37,718,408 59,182,743 383,009 9,170,8452007 251 49,195,190 15,455,075 33,740,115 195,997 10,860,5722006 251 24,134,052 10,047,190 14,086,862 96,152 3,337,6442005 247 16,195,307 5,841,267 10,354,040 65,568 2,537,394
IWM (iShares Russell 2000 Index Fund) Contract Volume and Open Interest
Trading Average Daily OpenYear Days Total Call Put Volume Interest2015 252 22,596,788 6,976,172 15,620,616 89,670 5,257,8022014 252 34,449,789 10,299,953 24,149,836 136,706 4,778,4412013 252 24,810,666 6,553,328 18,257,338 98,455 5,131,9222012 250 24,282,713 7,374,914 16,907,799 97,131 5,335,6572011 252 34,643,559 8,602,669 26,040,890 137,474 3,769,4702010 252 29,036,898 7,503,085 21,533,813 115,226 5,106,3532009 252 28,782,379 10,295,187 18,487,192 114,216 5,437,2672008 253 72,686,444 23,145,230 49,541,214 287,298 5,014,3962007 251 75,801,621 22,073,140 53,728,481 301,998 7,995,6922006 251 44,905,725 12,329,959 32,575,766 178,907 5,781,5342005 252 16,223,925 4,538,810 11,685,115 64,381 2,783,3762004 252 4,938,465 1,051,638 3,886,827 19,597 705,5722003 252 682,474 143,326 539,148 2,708 208,3412002 6 1,904 1,176 728 317 47,019
Contract Volume
Contract Volume
Page 190
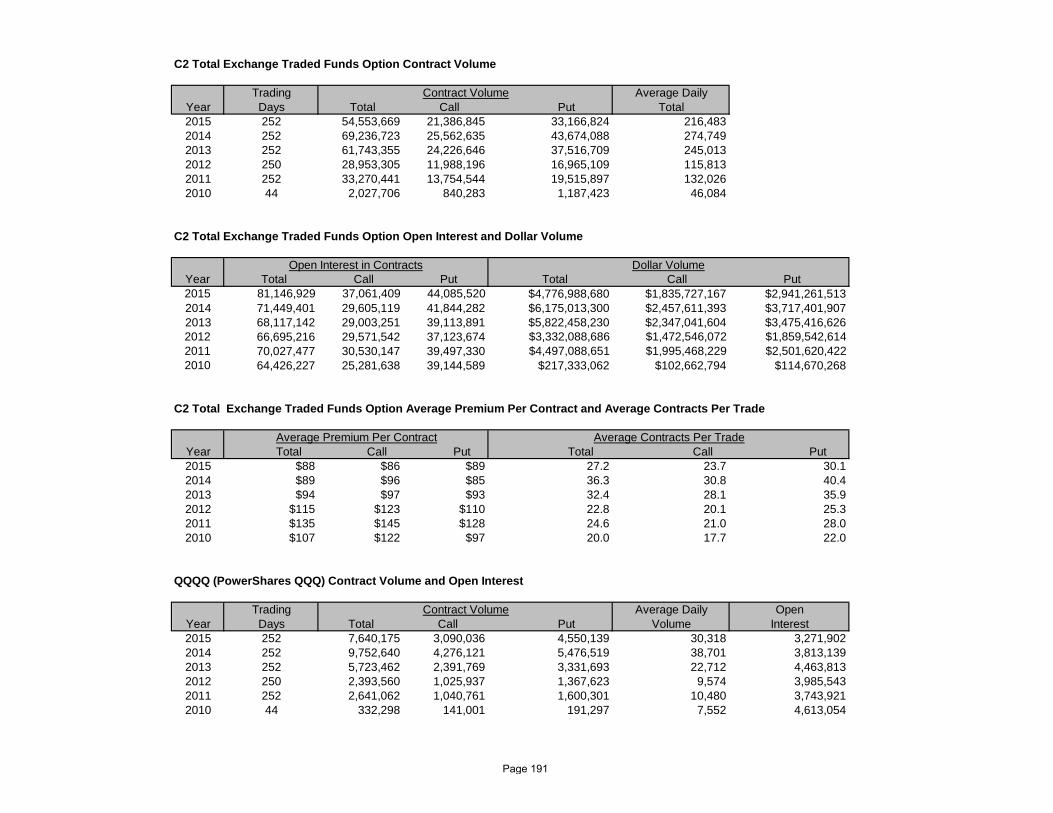
C2 Total Exchange Traded Funds Option Contract Volume
Trading Average DailyYear Days Total Call Put Total2015 252 54,553,669 21,386,845 33,166,824 216,4832014 252 69,236,723 25,562,635 43,674,088 274,7492013 252 61,743,355 24,226,646 37,516,709 245,0132012 250 28,953,305 11,988,196 16,965,109 115,8132011 252 33,270,441 13,754,544 19,515,897 132,0262010 44 2,027,706 840,283 1,187,423 46,084
C2 Total Exchange Traded Funds Option Open Interest and Dollar Volume
Year Total Call Put Total Call Put2015 81,146,929 37,061,409 44,085,520 $4,776,988,680 $1,835,727,167 $2,941,261,5132014 71,449,401 29,605,119 41,844,282 $6,175,013,300 $2,457,611,393 $3,717,401,9072013 68,117,142 29,003,251 39,113,891 $5,822,458,230 $2,347,041,604 $3,475,416,6262012 66,695,216 29,571,542 37,123,674 $3,332,088,686 $1,472,546,072 $1,859,542,6142011 70,027,477 30,530,147 39,497,330 $4,497,088,651 $1,995,468,229 $2,501,620,4222010 64,426,227 25,281,638 39,144,589 $217,333,062 $102,662,794 $114,670,268
C2 Total Exchange Traded Funds Option Average Premium Per Contract and Average Contracts Per Trade
Year Total Call Put Total Call Put2015 $88 $86 $89 27.2 23.7 30.12014 $89 $96 $85 36.3 30.8 40.42013 $94 $97 $93 32.4 28.1 35.92012 $115 $123 $110 22.8 20.1 25.32011 $135 $145 $128 24.6 21.0 28.02010 $107 $122 $97 20.0 17.7 22.0
QQQQ (PowerShares QQQ) Contract Volume and Open Interest
Trading Average Daily OpenYear Days Total Call Put Volume Interest2015 252 7,640,175 3,090,036 4,550,139 30,318 3,271,9022014 252 9,752,640 4,276,121 5,476,519 38,701 3,813,1392013 252 5,723,462 2,391,769 3,331,693 22,712 4,463,8132012 250 2,393,560 1,025,937 1,367,623 9,574 3,985,5432011 252 2,641,062 1,040,761 1,600,301 10,480 3,743,9212010 44 332,298 141,001 191,297 7,552 4,613,054
Contract Volume
Open Interest in Contracts Dollar Volume
Average Premium Per Contract Average Contracts Per Trade
Contract Volume
Page 191
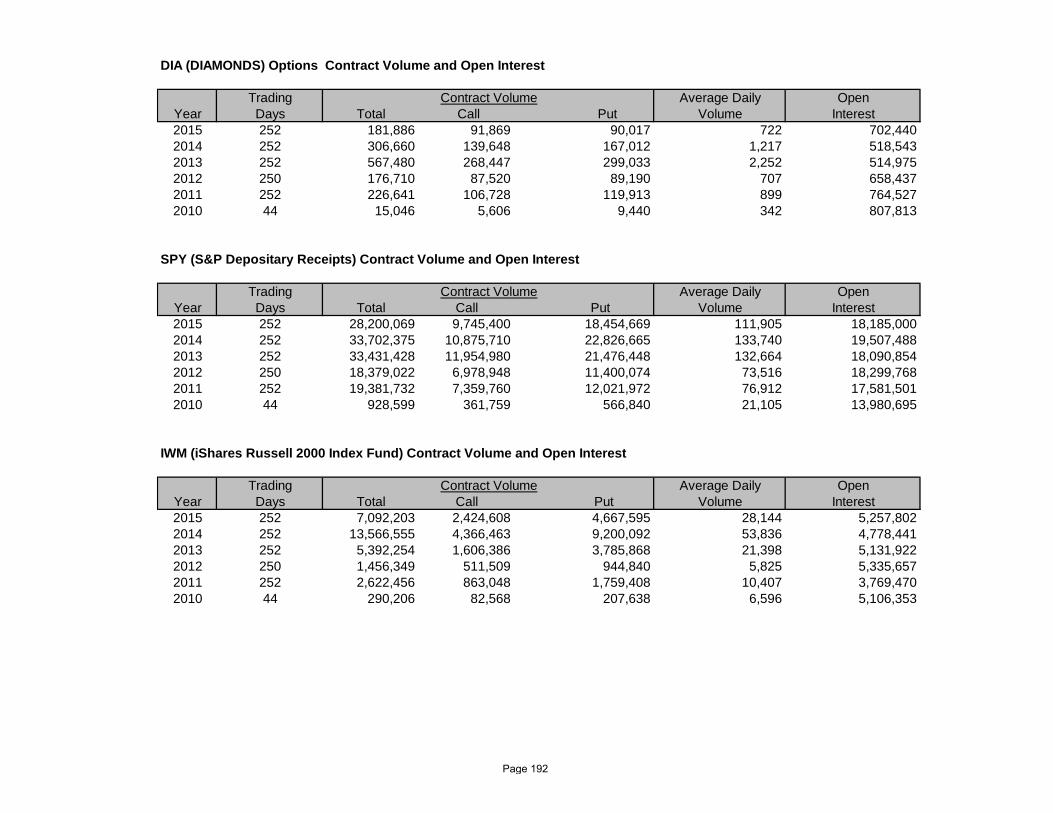
DIA (DIAMONDS) Options Contract Volume and Open Interest
Trading Average Daily OpenYear Days Total Call Put Volume Interest2015 252 181,886 91,869 90,017 722 702,4402014 252 306,660 139,648 167,012 1,217 518,5432013 252 567,480 268,447 299,033 2,252 514,9752012 250 176,710 87,520 89,190 707 658,4372011 252 226,641 106,728 119,913 899 764,5272010 44 15,046 5,606 9,440 342 807,813
SPY (S&P Depositary Receipts) Contract Volume and Open Interest
Trading Average Daily OpenYear Days Total Call Put Volume Interest2015 252 28,200,069 9,745,400 18,454,669 111,905 18,185,0002014 252 33,702,375 10,875,710 22,826,665 133,740 19,507,4882013 252 33,431,428 11,954,980 21,476,448 132,664 18,090,8542012 250 18,379,022 6,978,948 11,400,074 73,516 18,299,7682011 252 19,381,732 7,359,760 12,021,972 76,912 17,581,5012010 44 928,599 361,759 566,840 21,105 13,980,695
IWM (iShares Russell 2000 Index Fund) Contract Volume and Open Interest
Trading Average Daily OpenYear Days Total Call Put Volume Interest2015 252 7,092,203 2,424,608 4,667,595 28,144 5,257,8022014 252 13,566,555 4,366,463 9,200,092 53,836 4,778,4412013 252 5,392,254 1,606,386 3,785,868 21,398 5,131,9222012 250 1,456,349 511,509 944,840 5,825 5,335,6572011 252 2,622,456 863,048 1,759,408 10,407 3,769,4702010 44 290,206 82,568 207,638 6,596 5,106,353
Contract Volume
Contract Volume
Contract Volume
Page 192

Total Exchange Traded Funds Options Contract Volume by ExchangeCBOE C2
% Share of % Share ofYear CBOE C2 AMEX PHLX NYSE ARCA ISE BOX NSDQ BATS NOBO MIAX GEM EDGX Total Total Volume Total Volume2015 266,442,008 54,553,669 152,608,082 232,091,481 153,449,632 237,963,294 40,304,066 109,689,741 135,113,344 10,727,072 104,452,991 49,689,123 554,929 1,547,639,432 17.2% 3.5%2014 310,510,129 69,236,723 193,164,356 207,709,135 173,968,141 224,863,191 31,992,187 121,837,822 68,997,500 12,795,874 43,303,006 43,766,444 1,502,144,508 20.7% 4.6%2013 278,551,377 61,743,355 222,434,891 218,085,350 187,957,033 268,881,787 26,112,538 100,386,445 44,256,663 18,374,241 14,335,953 10,971,913 1,452,091,546 19.2% 4.3%2012 282,816,903 28,953,305 220,689,255 285,248,998 157,833,629 277,301,506 50,424,293 63,103,474 39,199,736 8,152,241 1,413,723,340 20.0% 2.0%2011 335,080,378 33,270,441 259,501,665 387,486,509 216,545,353 339,362,822 47,615,460 87,149,551 59,830,946 1,765,843,125 19.0% 1.9%2010 274,202,116 2,027,706 152,003,638 294,769,596 182,333,857 263,853,908 23,404,418 52,593,549 9,948,200 1,255,136,988 21.8% 0.2%2009 277,266,218 78,016,892 175,230,523 149,048,529 274,844,231 62,411,236 51,240,201 1,068,057,830 26.0%2008 329,830,388 82,111,402 129,630,580 150,050,779 300,545,759 77,898,352 18,089,887 1,088,157,147 30.3%2007 212,979,241 67,710,562 69,827,027 76,202,359 185,482,087 33,475,202 645,676,478 33.0%2006 126,481,092 45,142,347 33,614,672 28,073,577 99,564,422 16,861,584 349,737,694 36.2%2005 76,878,867 38,150,097 17,363,186 17,213,077 60,308,533 16,883,720 226,797,480 33.9%2004 51,259,036 35,089,619 20,529,525 14,374,597 38,063,902 4,284,223 163,600,902 31.3%2003 41,146,233 33,639,852 20,162,085 15,052,594 19,165,896 129,166,660 31.9%2002 30,362,691 38,250,334 6,977,732 14,063,428 12,067,494 101,721,679 29.8%2001 21,767,252 36,566,669 3,919,462 7,339,485 6,188,158 75,781,026 28.7%2000 1,020,584 11,816,747 167,803 275,567 13,280,701 7.7%
Page 193
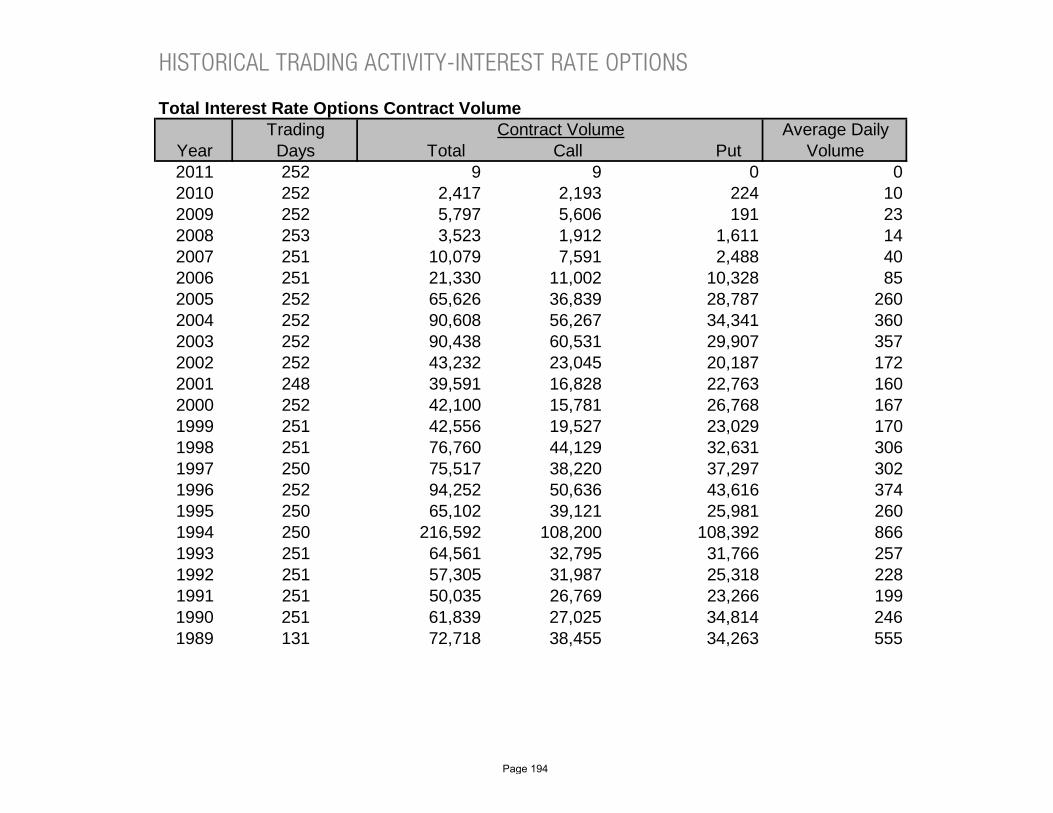
HISTORICAL TRADING ACTIVITY-INTEREST RATE OPTIONS
Total Interest Rate Options Contract VolumeTrading Average Daily
Year Days Total Call Put Volume2011 252 9 9 0 02010 252 2,417 2,193 224 102009 252 5,797 5,606 191 232008 253 3,523 1,912 1,611 142007 251 10,079 7,591 2,488 402006 251 21,330 11,002 10,328 852005 252 65,626 36,839 28,787 2602004 252 90,608 56,267 34,341 3602003 252 90,438 60,531 29,907 3572002 252 43,232 23,045 20,187 1722001 248 39,591 16,828 22,763 1602000 252 42,100 15,781 26,768 1671999 251 42,556 19,527 23,029 1701998 251 76,760 44,129 32,631 3061997 250 75,517 38,220 37,297 3021996 252 94,252 50,636 43,616 3741995 250 65,102 39,121 25,981 2601994 250 216,592 108,200 108,392 8661993 251 64,561 32,795 31,766 2571992 251 57,305 31,987 25,318 2281991 251 50,035 26,769 23,266 1991990 251 61,839 27,025 34,814 2461989 131 72,718 38,455 34,263 555
Contract Volume
Page 194

Total Interest Rate Options Open Interest and Dollar Volume
Month Total Call Put Total Call Put2011 0 0 0 $990 $990 $02010 49 48 1 $1,152,595 $1,067,315 $85,2802009 132 81 51 $3,128,115 $3,072,740 $55,3752008 666 562 104 $1,312,650 $575,335 $737,3152007 4,741 4,376 365 $1,900,451 $1,345,151 $555,3002006 2,381 1,460 921 $4,272,965 $2,679,090 $1,593,8752005 7,782 4,242 3,540 $13,968,215 $7,655,850 $6,312,3652004 18,238 13,863 4,375 $22,351,070 $17,224,745 $5,126,3252003 10,220 5,612 4,608 $25,275,575 $17,545,615 $7,729,9602002 8,953 4,593 4,360 $9,732,610 $5,470,335 $4,262,2752001 6,378 2,639 3,739 $10,195,678 $3,719,173 $6,476,5052000 2,783 627 2,156 $13,444,561 $3,085,375 $10,359,1861999 6,395 1,632 4,763 $8,041,082 $3,975,530 $4,065,5521998 4,436 2,907 1,529 $14,183,792 $5,809,911 $8,373,8811997 8,982 5,182 3,800 $15,966,935 $6,856,851 $9,110,0841996 6,434 3,002 3,432 $20,239,126 $10,938,500 $9,400,6261995 6,831 3,281 3,550 $11,013,182 $5,705,651 $5,307,5311994 21,494 11,554 9,940 $39,757,169 $23,835,743 $15,921,4261993 3,443 1,435 1,998 $11,223,338 $5,365,199 $5,858,1391992 2,736 1,688 1,048 $7,097,001 $3,562,920 $3,534,0811991 4,867 3,682 1,185 $7,347,106 $3,075,106 $4,271,2331990 4,205 2,652 1,553 $10,778,046 $4,956,810 $5,821,2361989 4,706 3,150 1,556 $12,125,585 $5,500,884 $6,624,701
Total Interest Rate Options Average Premium Per Contract, Average Contracts Per Trade and Transactions
Year Total Call Put Total Call Put2011 $110 $110 $0 2.3 2.3 0.02010 $477 $487 $381 25.2 28.9 11.22009 $540 $548 $290 6.1 6.1 8.72008 $373 $301 $458 15.5 15.2 15.82007 $189 $177 $223 26.2 32.6 16.52006 $200 $244 $154 13.3 11.0 17.02005 $213 $208 $219 11.4 8.4 20.82004 $247 $306 $149 9.4 7.8 14.42003 $279 $290 $258 9.7 9.1 11.12002 $225 $237 $211 13.1 11.4 15.92001 $258 $221 $285 12.4 12.2 12.62000 $314 $196 $387 21.9 12.9 36.21999 $189 $204 $177 16.6 16.0 17.01998 $185 $132 $257 25.3 26.6 23.81997 $211 $179 $244 24.9 21.1 30.31996 $216 $216 $216 18.9 18.1 19.91995 $169 $146 $204 17.2 15.5 20.61994 $183 $220 $147 26.5 24.2 29.31993 $174 $164 $184 24.0 20.6 28.91992 $124 $111 $140 23.5 26.0 20.91991 $147 $115 $184 14.1 17.1 11.71990 $174 $183 $167 17.1 17.9 16.51989 $167 $143 $193 14.3 15.9 12.8
Average Premium Per Contract Average Contracts Per Trade
Open Interest in Contracts Dollar Volume
Page 195

HISTORICAL TRADING ACTIVITY - CREDIT DEFAULT BASKET OPTIONS
Total Single-Name CEBO® Contract Volume, Dollar Volume and Transactions
Trading Average Daily OpenYear Days Total Call Put Volume Interest2013 252 52 52 0 0 162012 250 29 29 0 0 1112011 252 122 122 0 0 1082010 252 0 0 0 0 02009 252 0 0 0 0 02008 253 10 10 0 0 02007 136 46 46 0 0 0
Total Basket CEBO® Contract Volume, Dollar Volume and Transactions
Trading Average Daily OpenYear Days Total Call Put Volume Interest2011 252 0 0 0 0 02010 252 0 0 0 0 02009 252 0 0 0 0 02008 253 0 0 0 0 02007 87 2 2 0 0 0
Contract Volume
Contract Volume
Page 196

CFE TRADING ACTIVITY - 2015
Total CFE Trading Summary
TotalNo. of Contracts 51,675,531Average Daily Volume 205,062Open Interest 252,743Transactions 16,782,728
MonthTradingDays
Contract VolumeTotal
Average DailyTotal
Open InterestTotal
Jan 20 4,573,650 228,683 276,087Feb 19 3,166,538 166,660 322,479Mar 22 3,688,432 167,656 355,404Apr 21 3,385,940 161,235 385,126May 20 3,499,445 174,972 375,859Jun 22 4,641,754 210,989 337,201Jul 22 5,018,696 228,123 326,307Aug 21 6,408,878 305,185 327,212Sep 21 5,278,891 251,376 308,698Oct 22 3,998,723 181,760 325,175Nov 20 3,481,215 174,061 297,646Dec 22 4,533,369 206,062 252,673Total 252 51,675,531 205,062 --
Total CFE Futures Average Contracts Per Trade and Transactions
MonthTradingDays
Average Contracts Per Trade
TotalTransactions
TotalJan 20 3 1,712,451Feb 19 3 1,111,412Mar 22 3 1,156,196Apr 21 3 992,876May 20 4 915,183Jun 22 4 1,191,646Jul 22 4 1,353,761Aug 21 3 2,178,281Sep 21 3 2,091,981Oct 22 3 1,329,555Nov 20 3 1,145,785Dec 22 3 1,603,601Total 252 3 16,782,728
Page 197

CFE FUTURES TRADING ACTIVITY - 2015
VIX (CBOE Volatility Index Futures) Contract Volume
MonthTradingDays
Contract VolumeTotal
Average DailyTotal
Open InterestTotal
Jan 20 4,568,728 228,436 274,838Feb 19 3,164,386 166,547 321,786Mar 22 3,686,993 167,591 354,795Apr 21 3,384,298 161,157 384,675May 20 3,498,454 174,923 375,662Jun 22 4,641,194 210,963 336,956Jul 22 5,015,350 227,970 326,133Aug 21 6,391,571 304,361 323,275Sep 21 5,275,344 251,207 305,065Oct 22 3,994,368 181,562 321,710Nov 20 3,475,798 173,790 294,195Dec 22 4,527,217 205,783 252,598Total 252 51,623,701 204,856 --
VIX (CBOE Volatility Index Futures) Average Contracts Per Trade and Transactions
MonthTradingDays
Average Contracts Per TradeTotal
TransactionsTotal
Jan 20 3 1,711,270Feb 19 3 1,110,802Mar 22 3 1,155,734Apr 21 3 992,351May 20 4 914,804Jun 22 4 1,191,480Jul 22 4 1,353,369Aug 21 3 2,176,420Sep 21 3 2,091,333Oct 22 3 1,328,762Nov 20 3 1,144,793Dec 22 3 1,602,580Total 252 3 16,773,698
Page 198

VXW (CBOE Volatility Index Weekly Futures) Contract Volume
MonthTradingDays
Contract VolumeTotal
Average DailyTotal
Open InterestTotal
Jan 20Feb 19Mar 22Apr 21May 20Jun 22Jul 22 2,358 107Aug 21 12,683 604Sep 21 2,885 137Oct 22 3,918 178Nov 20 5,153 258Dec 22 5,664 257Total 252 32,661 130 --
VXW (CBOE Volatility Index Weekly Futures) Average Contracts Per Trade and Transactions
MonthTrading
DaysAverage Contracts Per Trade
TotalTransactions
TotalJan 20Feb 19Mar 22Apr 21May 20Jun 22Jul 22 9 259Aug 21 8 1,691Sep 21 6 496Oct 22 6 699Nov 20 6 915Dec 22 6 914Total 252 7 4,974
Page 199
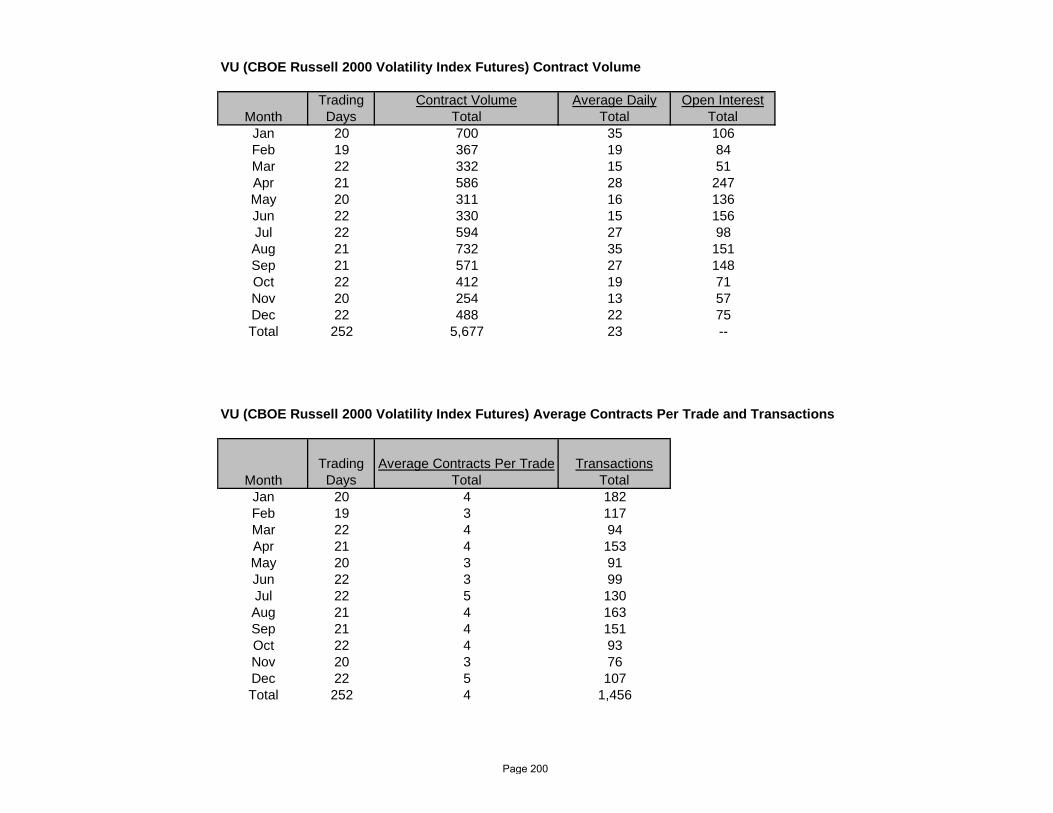
VU (CBOE Russell 2000 Volatility Index Futures) Contract Volume
MonthTradingDays
Contract VolumeTotal
Average DailyTotal
Open InterestTotal
Jan 20 700 35 106Feb 19 367 19 84Mar 22 332 15 51Apr 21 586 28 247May 20 311 16 136Jun 22 330 15 156Jul 22 594 27 98Aug 21 732 35 151Sep 21 571 27 148Oct 22 412 19 71Nov 20 254 13 57Dec 22 488 22 75Total 252 5,677 23 --
VU (CBOE Russell 2000 Volatility Index Futures) Average Contracts Per Trade and Transactions
MonthTradingDays
Average Contracts Per TradeTotal
TransactionsTotal
Jan 20 4 182Feb 19 3 117Mar 22 4 94Apr 21 4 153May 20 3 91Jun 22 3 99Jul 22 5 130Aug 21 4 163Sep 21 4 151Oct 22 4 93Nov 20 3 76Dec 22 5 107Total 252 4 1,456
Page 200
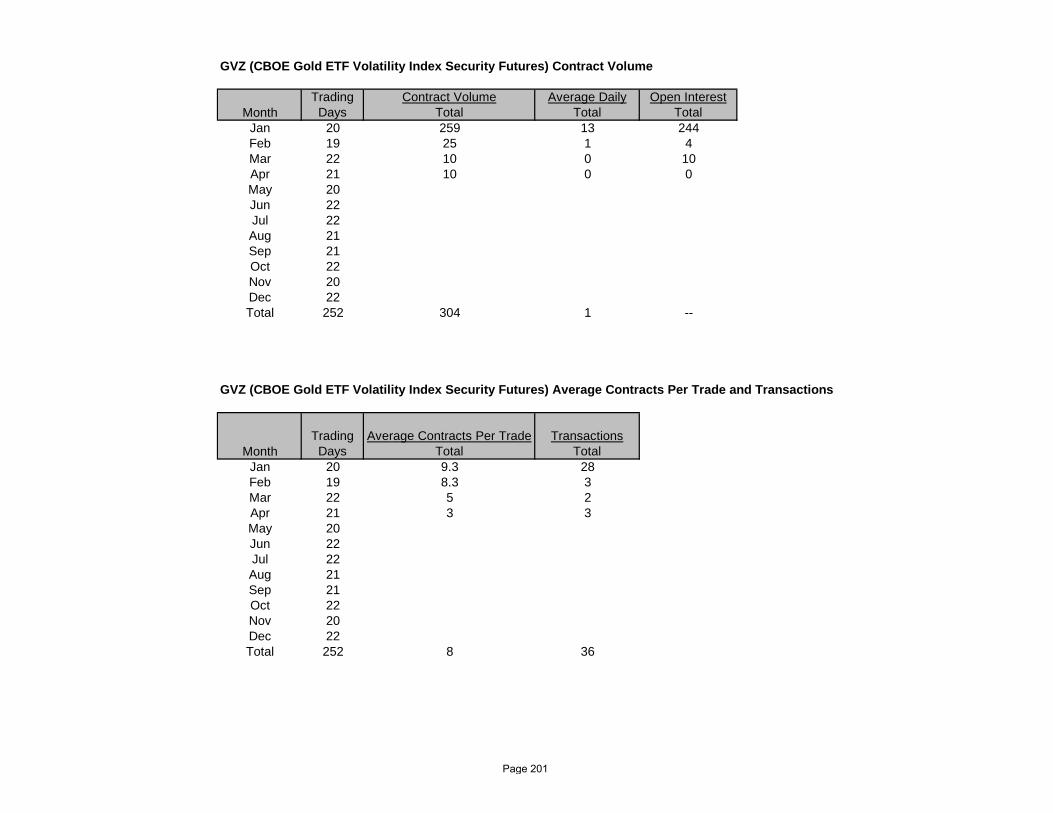
GVZ (CBOE Gold ETF Volatility Index Security Futures) Contract Volume
MonthTrading
DaysContract Volume
TotalAverage Daily
TotalOpen Interest
TotalJan 20 259 13 244Feb 19 25 1 4Mar 22 10 0 10Apr 21 10 0 0May 20Jun 22Jul 22Aug 21Sep 21Oct 22Nov 20Dec 22Total 252 304 1 --
GVZ (CBOE Gold ETF Volatility Index Security Futures) Average Contracts Per Trade and Transactions
MonthTrading
DaysAverage Contracts Per Trade
TotalTransactions
TotalJan 20 9.3 28Feb 19 8.3 3Mar 22 5 2Apr 21 3 3May 20Jun 22Jul 22Aug 21Sep 21Oct 22Nov 20Dec 22Total 252 8 36
Page 201

OVX (CBOE Oil ETF Volatility Index Security Futures) Contract Volume
MonthTrading
DaysContract Volume
TotalAverage Daily
TotalOpen Interest
TotalJan 20 1,310 66 423Feb 19 855 45 329Mar 22 287 13 267Apr 21 281 13 48May 20 115 6Jun 22Jul 22Aug 21Sep 21Oct 22Nov 20Dec 22Total 252 2,848 11 --
OVX (CBOE Oil ETF Volatility Index Security Futures) Contract Volume
MonthTrading
DaysAverage Contracts Per Trade
TotalTransactions
TotalJan 20 4 323Feb 19 3 259Mar 22 2 137Apr 21 2 164May 20 2 53Jun 22Jul 22Aug 21Sep 21Oct 22Nov 20Dec 22Total 252 3 936
Page 202
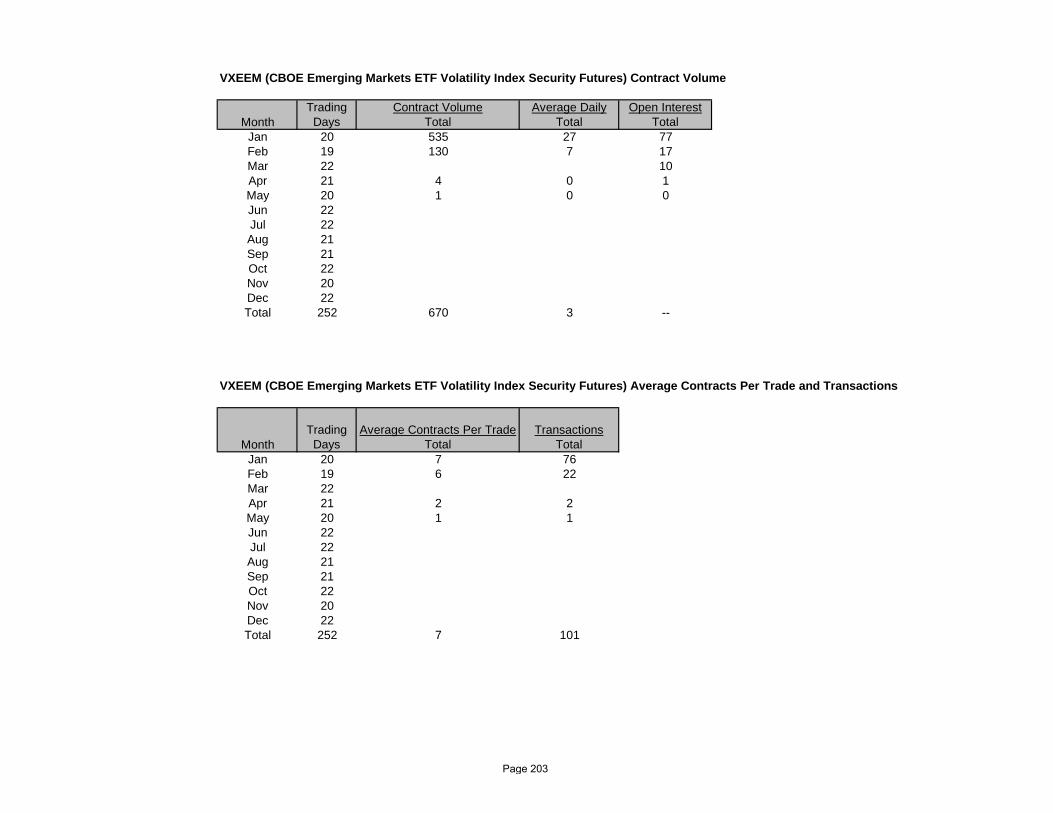
VXEEM (CBOE Emerging Markets ETF Volatility Index Security Futures) Contract Volume
MonthTradingDays
Contract VolumeTotal
Average DailyTotal
Open InterestTotal
Jan 20 535 27 77Feb 19 130 7 17Mar 22 10Apr 21 4 0 1May 20 1 0 0Jun 22Jul 22Aug 21Sep 21Oct 22Nov 20Dec 22Total 252 670 3 --
VXEEM (CBOE Emerging Markets ETF Volatility Index Security Futures) Average Contracts Per Trade and Transactions
MonthTradingDays
Average Contracts Per TradeTotal
TransactionsTotal
Jan 20 7 76Feb 19 6 22Mar 22Apr 21 2 2May 20 1 1Jun 22Jul 22Aug 21Sep 21Oct 22Nov 20Dec 22Total 252 7 101
Page 203
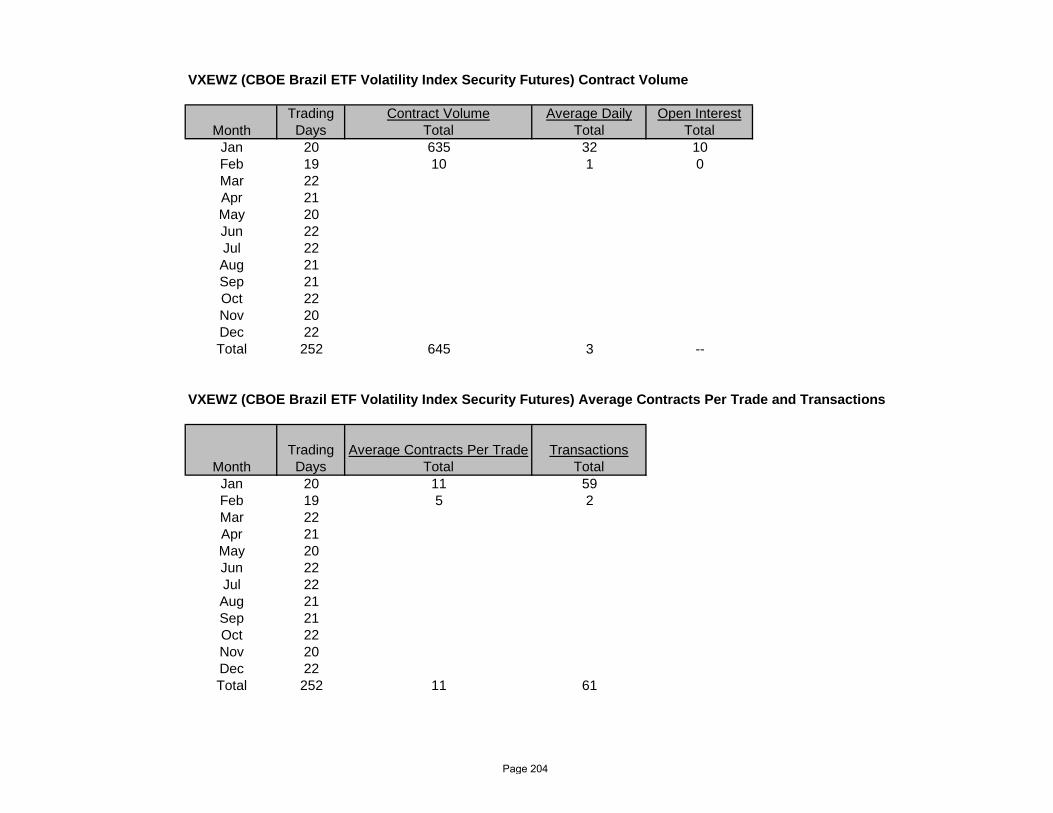
VXEWZ (CBOE Brazil ETF Volatility Index Security Futures) Contract Volume
MonthTrading
DaysContract Volume
TotalAverage Daily
TotalOpen Interest
TotalJan 20 635 32 10Feb 19 10 1 0Mar 22Apr 21May 20Jun 22Jul 22Aug 21Sep 21Oct 22Nov 20Dec 22Total 252 645 3 --
VXEWZ (CBOE Brazil ETF Volatility Index Security Futures) Average Contracts Per Trade and Transactions
MonthTrading
DaysAverage Contracts Per Trade
TotalTransactions
TotalJan 20 11 59Feb 19 5 2Mar 22Apr 21May 20Jun 22Jul 22Aug 21Sep 21Oct 22Nov 20Dec 22Total 252 11 61
Page 204

VXN (CBOE Nasdaq-100 Volatility Index Futures) Contract Volume
MonthTradingDays
Contract VolumeTotal
Average DailyTotal
Open InterestTotal
Jan 20 686 34 220Feb 19 352 19 174Mar 22 53 2 60Apr 21 42 2 26May 20 7 0 11Jun 22Jul 22Aug 21Sep 21Oct 22Nov 20Dec 22Total 252 1,140 5 --
VXN (CBOE Nasdaq-100 Volatility Index Futures) Average Contracts Per Trade and Transactions
MonthTradingDays
Average Contracts Per TradeTotal
TransactionsTotal
Jan 20 5 131Feb 19 5 70Mar 22 5 11Apr 21 2 22May 20 1 7Jun 22Jul 22Aug 21Sep 21Oct 22Nov 20Dec 22Total 252 5 241
Page 205

VA (S&P 500 Twelve-Month Variance Futures) Contract Volume
MonthTradingDays
Contract VolumeTotal
Average DailyTotal
Open InterestTotal
Jan 20Feb 19Mar 22 142 6 142Apr 21 408 19 118May 20 1 0 0Jun 22 89 4 89Jul 22 388 18 76Aug 21 3,892 185 3,786Sep 21 91 4 3,485Oct 22 3,394Nov 20 3,394Dec 22 0Total 252 5,011 20 --
VA (S&P 500 Twelve-Month Variance Futures) Average Contracts Per Trade and Transactions
MonthTradingDays
Average Contracts Per TradeTotal
TransactionsTotal
Jan 20Feb 19Mar 22 142 1Apr 21 204 2May 20 1 1Jun 22 89 1Jul 22 194 2Aug 21 556 7Sep 21 91 1Oct 22Nov 20Dec 22Total 252 334 15
Page 206

VXST (CBOE Short-Term Volatility Index Futures ) Contract Volume
MonthTradingDays
Contract VolumeTotal
Average DailyTotal
Open InterestTotal
Jan 20 796 40 168Feb 19 302 16 85Mar 22 615 28 69Apr 21 311 15 11May 20 556 28 50Jun 22 141 6 0Jul 22Aug 21Sep 21Oct 22Nov 20Dec 22Total 252 2,721 11 --
VXST (CBOE Short-Term Volatility Index Futures ) Average Contracts Per Trade and Transactions
MonthTradingDays
Average Contracts Per TradeTotal
TransactionsTotal
Jan 20 2 381Feb 19 2 132Mar 22 3 217Apr 21 2 179May 20 2 226Jun 22 2 66Jul 22Aug 21Sep 21Oct 22Nov 20Dec 22Total 252 2 1,201
Page 207

VXTYN (CBOE 10-Year U.S. Treasury Note Volatility Index Futures) Contract Volume
MonthTradingDays
Contract VolumeTotal
Average DailyTotal
Open InterestTotal
Jan 20 1 0 1Feb 19 111 6 0Mar 22Apr 21May 20Jun 22Jul 22 6 0 0Aug 21Sep 21Oct 22 25 1 0Nov 20 10 1 0Dec 22Total 252 153 1 --
VXTYN (CBOE 10-Year U.S. Treasury Note Volatility Index Futures) Average Contracts Per Trade and Transactions
MonthTradingDays
Average Contracts Per TradeTotal
TransactionsTotal
Jan 20 1 1Feb 19 22 5Mar 22Apr 21May 20Jun 22Jul 22 6 1Aug 21Sep 21Oct 22 25 1Nov 20 10 1Dec 22Total 252 17 9
Page 208
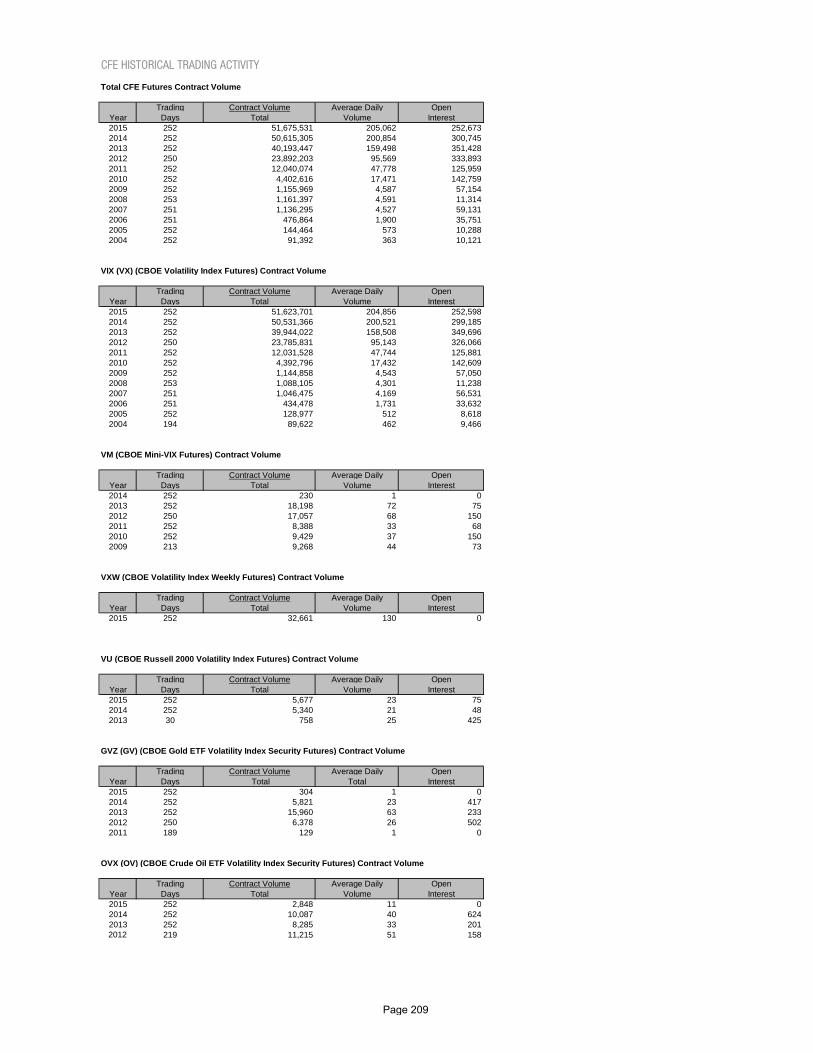
CFE HISTORICAL TRADING ACTIVITY
Total CFE Futures Contract Volume
Trading Contract Volume Average Daily OpenYear Days Total Volume Interest2015 252 51,675,531 205,062 252,6732014 252 50,615,305 200,854 300,7452013 252 40,193,447 159,498 351,4282012 250 23,892,203 95,569 333,8932011 252 12,040,074 47,778 125,9592010 252 4,402,616 17,471 142,7592009 252 1,155,969 4,587 57,1542008 253 1,161,397 4,591 11,3142007 251 1,136,295 4,527 59,1312006 251 476,864 1,900 35,7512005 252 144,464 573 10,2882004 252 91,392 363 10,121
VIX (VX) (CBOE Volatility Index Futures) Contract Volume
Trading Contract Volume Average Daily OpenYear Days Total Volume Interest2015 252 51,623,701 204,856 252,5982014 252 50,531,366 200,521 299,1852013 252 39,944,022 158,508 349,6962012 250 23,785,831 95,143 326,0662011 252 12,031,528 47,744 125,8812010 252 4,392,796 17,432 142,6092009 252 1,144,858 4,543 57,0502008 253 1,088,105 4,301 11,2382007 251 1,046,475 4,169 56,5312006 251 434,478 1,731 33,6322005 252 128,977 512 8,6182004 194 89,622 462 9,466
VM (CBOE Mini-VIX Futures) Contract Volume
Trading Contract Volume Average Daily OpenYear Days Total Volume Interest2014 252 230 1 02013 252 18,198 72 752012 250 17,057 68 1502011 252 8,388 33 682010 252 9,429 37 1502009 213 9,268 44 73
VXW (CBOE Volatility Index Weekly Futures) Contract Volume
Trading Contract Volume Average Daily OpenYear Days Total Volume Interest2015 252 32,661 130 0
VU (CBOE Russell 2000 Volatility Index Futures) Contract Volume
Trading Contract Volume Average Daily OpenYear Days Total Volume Interest2015 252 5,677 23 752014 252 5,340 21 482013 30 758 25 425
GVZ (GV) (CBOE Gold ETF Volatility Index Security Futures) Contract Volume
Trading Contract Volume Average Daily OpenYear Days Total Total Interest2015 252 304 1 02014 252 5,821 23 4172013 252 15,960 63 2332012 250 6,378 26 5022011 189 129 1 0
OVX (OV) (CBOE Crude Oil ETF Volatility Index Security Futures) Contract Volume
Trading Contract Volume Average Daily OpenYear Days Total Volume Interest2015 252 2,848 11 02014 252 10,087 40 6242013 252 8,285 33 2012012 219 11,215 51 158
Page 209

VXEEM (VXEM) (CBOE Emerging Markets ETF Volatility Index Security Futures) Contract Volume
Trading Contract Volume Average Daily OpenYear Days Total Volume Interest2015 252 670 3 02014 252 21,689 86 1212013 252 24,751 98 5252012 246 55,388 225 381
VXEWZ (VXEW) (CBOE Brazil ETF Volatility Index Security Futures) Contract Volume
Trading Contract Volume Average Daily OpenYear Days Total Volume Interest2015 252 645 3 02014 252 18,087 72 2152013 252 8,490 34 252012 211 7,262 34 451
VXN (VN) (Nasdaq-100 Volatility Index Futures) Contract Volume
Trading Contract Volume Average Daily OpenYear Days Total Volume Interest2015 252 1,140 5 02014 252 10,430 41 902013 252 6,576 26 2152012 152 2,316 15 22011 N/A N/A N/A N/A2010 N/A N/A N/A N/A2009 252 0 0 02008 253 2,581 10 82007 125 3,163 25 140
VA (S&P 500 Variance Futures) Contract Volume
Trading Contract Volume Average Daily OpenYear Days Total Volume Interest2015 252 5,011 20 02014 252 2,308 9 02013 252 166,287 660 332012 15 6,550 437 6,023
VXST (CBOE Short-Term Volatility Index Futures ) Contract Volume
Trading Contract Volume Average Daily OpenYear Days Total Volume Interest2015 252 2,721 11 02014 252 9,933 39 45
VXTY (CBOE/CBOT 10-Year U.S. Treasury Note Volatility Index Futures) Contract Volume
Trading Contract Volume Average Daily OpenYear Days Total Volume Interest2015 252 153 1 02014 33 14 0 0
RPXCP (RPXC) (Radar Logic 28-Day Real Estate Index Futures ) Contract Volume
Trading Contract Volume Average Daily OpenYear Days Total Volume Interest2013 252 120 0 02012 223 170 1 160
Page 210

VT (CBOE S&P 500 Three-Month Variance Futures) Contract Volume
Trading Contract Volume Average Daily OpenYear Days Total Volume Interest2012 250 36 0 02011 252 29 0 102010 252 388 2 02009 252 123 0 32008 253 2,078 8 72007 251 9,302 37 2462006 251 3,787 15 3402005 252 5,033 20 1322004 158 1,129 7 391
VA (CBOE S&P 500 Twelve-Month Variance Futures) Contract Volume
Trading Contract Volume Average Daily OpenYear Days Total Volume Interest2010 252 3 0 02009 252 31 0 282008 253 940 4 412007 251 56 0 662006 196 110 1 10
VR (Russell 2000 Volatility Index Futures) Contract Volume Trading Contract Volume Average Daily Open
Year Days Total Volume Interest2009 252 670 3 02008 253 26,956 107 22007 123 30,011 244 1,415
DV (CBOE DJIA Volatility Index Futures) Contract Volume
Trading Contract Volume Average Daily OpenYear Days Total Volume Interest2009 252 1,019 4 02008 253 40,706 161 182007 251 43,555 174 7322006 251 38,238 152 1,7662005 175 9,546 55 1,357
BX (CBOE S&P 500 BuyWrite Index Futures) Contract Volume
Trading Contract Volume Average Daily OpenYear Days Total Volume Interest2008 253 31 0 02007 251 3,731 15 12006 61 8 0 1
CX (China Index Futures) Contract Volume
Trading Contract Volume Average Daily OpenYear Days Total Volume Interest2007 251 2 0 02006 251 171 1 22005 252 512 2 212004 53 641 12 264
Page 211

GZ (CFE West Coast Gas at the Pump) Contract Volume
Trading Contract Volume Average Daily OpenYear Days Total Volume Interest2006 239 8 0 0
GA (CFE East Coast Gas at the Pump) Contract Volume
Trading Contract Volume Average Daily OpenYear Days Total Volume Interest2006 251 6 0 02005 44 31 1 0
GJ (CFE Gulf Coast Gas at the Pump) Contract Volume
Trading Contract Volume Average Daily OpenYear Days Total Volume Interest2006 251 0 0 02005 44 114 3 65
GH (CFE Midwest Coast Gas at the Pump) Contract Volume
Trading Contract Volume Average Daily OpenYear Days Total Volume Interest2006 251 4 0 02005 44 5 0 5
GN (CFE Rocky Mountain Gas at the Pump) Contract Volume
Trading Contract Volume Average Daily OpenYear Days Total Volume Interest2006 251 2 0 02005 44 121 3 67
GU (CFE US Gas at the Pump) Contract Volume
Trading Contract Volume Average Daily OpenYear Days Total Volume Interest2006 251 52 0 02005 44 125 3 23
CFE HISTORICAL OPTIONS ON FUTURES TRADING ACTIVITY
VOW (CBOE Volatility Index Options on Futures) Contract Volume
Trading Contract Volume Average Daily OpenYear Days Total Volume Interest2011 252 4,617 18 22010 66 182 3 22
Page 212

The information contained in this document is for general information purposes only. Chicago Board Options Exchange, Incorporated and its affiliates (collectively, “CBOE”) make no representations or warranties, either expressed, implied, or statutory, about the accuracy, completeness, or reliability of this information. Accordingly, CBOE, its officers, directors, trading permit holders, employees, subsidiaries, agents and third party suppliers shall not be responsible or liable to you or any third party for any damages of any kind for (i) any errors or omissions in the information or (ii) loss or damage arising therefrom or occasioned thereby. CBOE®, Chicago Board Options Exchange®, BATS®, CBOE Volatility Index®, Livevol®, CEBO®, CFE®, FLEX®, Flexible EXchange®, LEAPS®, OEX®, VIX®, and XEO® are registered trademarks and BXM, BuyWrite, CBOE Options Institute, CBOE Vest, Weeklys, XSP, CBOE Futures Exchange, C2, C2 Options Exchange, CBOE Brazil ETF Volatility Index, VXEW, VXEWZ, CBOE Crude Oil ETF Volatility Index, OVX, OV, CBOE Emerging Markets ETF Volatility Index, VXEM, VXEEM, CBOE Gold ETF Volatility Index, GVZ, GV, RVX, VA, VM, VXN, VN, VU, and VX are service marks of CBOE Holdings, Inc. and its subsidiaries. Standard & Poor’s®, S&P®, S&P 100® and S&P 500® are trademarks of Standard & Poor’s Financial Services, LLC and have been licensed for use by Chicago Board Options Exchange, Incorporated, C2 and CBOE Futures Exchange, LLC (CFE). Dow Jones, Dow Jones Industrial Average and Diamonds are registered trademarks of Dow Jones Trademark Holdings LLC ("Dow Jones"). These trademarks have been licensed to S&P Dow Jones Indices LLC. It is not possible to invest directly in an index. S&P Dow Jones Indices LLC, Dow Jones, S&P and their respective affiliates (collectively "S&P Dow Jones Indices") do not sponsor, endorse, sell, or promote any investment fund or other investment vehicle that is offered by third parties and that seeks to provide an investment return based on the performance of any index. CBOT is a trademark of CME Group, Inc. (CME). CBOE has, with the permission of CME, used the CBOT trademark in the CBOE/CBOT 10-year U.S. Treasury Note Volatility Index. Russell 1000®, Russell 2000®, Russell 3000® and Russell MidCap are registered trademarks of Russell Investments, used under license. The Nasdaq-100 Index®, Nasdaq-100® and Nasdaq® are trademark or service marks of The Nasdaq Stock Market, Inc. (with which its affiliates are the “Corporations”). These marks are licensed for use by CBOE in connection with the trading of products based on the Nasdaq-100 Index. The products have not been passed on by the Corporations as to their legality or suitability. The products are not issued, endorsed, sold or promoted by the Corporations. THE CORPORATIONS MAKE NO WARRANTIES AND BEAR NO LIABILITY WITH RESPECT TO THE PRODUCT(S). Other names, logos, designs, titles, words or phrases in this publication may constitute trademarks, service marks, or trade names of Chicago Board Options Exchange, Incorporated or its affiliates or other entities and which may be registered in certain jurisdictions. All other trademarks and service marks are the property of their respective owners. © 1995 – 2017 CBOE Holdings, Inc. All rights reserved. Printed in the USA

About CBOE Holdings, Inc.
CBOE Holdings, Inc. (BATS: CBOE | NASDAQ: CBOE), owner of the Chicago Board Options Exchange, the Bats exchanges, CBOE Futures Exchange (CFE) and other subsidiaries, is one of the world’s largest exchange holding companies and a leader in providing global investors cutting-edge trading and investment solutions.
The company offers trading across a diverse range of products in multiple asset classes and geographies, including options, futures, U.S. and European equities, exchange-traded funds (ETFs), and multi-asset volatility and global foreign exchange (FX) products. CBOE Holdings’ 14 trading venues include the largest options exchange in the U.S. and the largest stock exchange in Europe, and the company is the second-largest stock exchange operator in the U.S. and a leading market globally for ETF trading.
CBOE Holdings is home to the CBOE Volatility Index (VIX Index), the world’s barometer for equity market volatility; the CBOE Options Institute, the company’s world-renowned education arm; CBOE Livevol, a leading provider of options technology, trading analytics and market data services; CBOE Vest, an asset management company specializing in target-outcome investment strat-egies; CBOE Risk Management Conferences (RMC), the premier financial industry forums on derivatives and volatility products; ETF.com, a leading provider of ETF news, data and analysis; and Hotspot, a leading platform for global FX trading.
The company is headquartered in Chicago with offices in Kansas City, New York, London, San Francisco, Singapore and Ecuador. For more information, visit www.cboe.com.
Chicago Board Options Exchange | 400 South LaSalle Street | Chicago, IL 60605
www.cboe.com