holland creek environmental monitoring
TRANSCRIPT

i
Holland Creek Environmental Monitoring
Water Quality and Invertebrate Population Assessment
December 2012
RMOT 306
Shaun MacNeill
&
Braeden Lattanzi

ii
Executive Summary
Holland Creek is located in Ladysmith, British Columbia on Vancouver Island and
runs approximately 12km before emptying into Ladysmith Harbour. This is a productive
fish bearing stream with Chum Salmon (Oncorhynchus keta), Coho (Oncorhynchus
kisutch), Cutthroat Trout (Oncorhychus clarkii) and Rainbow Trout (Oncorhynchus
mykiss). There are numerous manmade structures that limit the passage of
anadromous fish species to the lower 2.3 kilometers, such as the impassible falls, upper
and lower colliery dams and the chicken ladder dam. This stream is one of the main
drinking water sources for the town of Ladysmith and as such its health is of great
importance to everyone in the area. A significant restoration and water monitoring
project was started in 2004 by Department of Fisheries and Oceans, Coastal BC, the
Pacific Salmon Foundation, Timber West, the Town of Ladysmith, and many volunteers.
This is the second year the Bachelor of Natural Resource Protection (BNRP)
program has done water quality monitoring on Holland Creek. Two sampling events
took place, one during low flow in October and the other during high flow in November.
Water quality analysis was conducted both by VIU students and ALS Laboratories in
Vancouver, British Columbia. Microbiology, stream invertebrate populations and
hydrology were also measured at each of the 4 sites selected in Holland Creek Walking
Trail (Figure 3).
This year’s monitoring program found the stream to be extremely sensitive, but in
generally good health. Benthic invertebrate populations increased dramatically, but at
the cost of a lowered EPT index score as much of the population growth was within the
group of category 3 pollution intolerant species. The overall assessment based on the
iii
EPT index was positive, but it will be important to keep track of population trends in the
future to ensure 2012’s marginalization of category 1 species does not continue.
Water quality results showed a stream generally within suggested guideline
parameters, but with minor issues regarding acidity. The second sampling event
analyzed by ALS showed 2 sites slightly below the suggested pH range, but this was
conflicted by field measurements made with a YSI. Alkalinity measurements were
extremely low, averaging 10 mg Ca²+/L, the upper limit for high acid sensitivity
(RISK,1998).
Iron levels during the first event were found to be above BC water guidelines for
aquatic life on one occasion, though it was at a site that exhibited a large amount of
variation in all readings as a result of nearby tributary streams. The overall impact of this
result is negligible however, as parameters at the next site downstream were back with
guidelines and the spike in iron levels was not detected during the second event.
Aluminum levels were also uncharacteristically high during the first event, peaking at the
same site where high iron levels were detected (Appx 6.2).
Acknowledgements
At this time BS Consulting would like to thank John Morgan for his time and effort
in helping conduct this report and Vancouver Island University for allowing us to use
materials and laboratory time to complete the testing for this report. We would also like
to thank Dave Clough and the Ladysmith Sportsman’s club for their involvement at
Holland Creek and the information on past projects that they provided.

iv
Table of Contents
Executive Summary
Acknowledgments
1.0 Introduction
1.1 Project Overview 1
1.2 Historical Review 2
1.3 Potential Environmental Concerns 4
2.0 Methods
2.1 Overview 5
2.2 Sample Site Locations 6
2.3 Hydrology 10
2.4 Microbiology 11
2.5 Water Quality 12
2.6 Stream Invertebrate Communities 12
3.0 Results and Discussion
3.1 General Field Conditions 13
3.2 Water Quality 14
3.2.1 Field Measurements 14
3.2.2 VIU Laboratory Analysis 16
3.2.3 ALS Analysis 18
3.3 Benthic Invertebrate Communities 21
3.4 Microbiology 23
4.0 Conclusions and Recommendations 24
5.0 References 26
6.0 Appendix 27
6.1 Tables 27
6.2 ALS Results 30
6.3 Invertebrate Survey Field Data Sheets 33

v
List of Tables & Figures
Figure 1- Log spur placement in Holland Creek. 2
Figure 2- Map of trails throughout Holland watershed. 4
Figure 3- Sample station locations 6
Figure 4- Sample site 1 7
Figure 5- Sample site 2 8
Figure 6- Sample site 3 9
Figure 7- Sample site 4 10
Figure 8- Pollution tolerance distribution 22
Table 1.-Date and time of each sampling event 6
Table 2- Hydrological data during event 1 15
Table 3- Hydrological data during event 2 16
Table 4- Condensed ALS event 1 results 20
Table 5- Condensed ALS event 2 results 21
Table 6- EPT index ratings 22
Table 7- Individual species abundance by pollution tolerance 23

1
1.0 Introduction
1.1 Project Overview
BS consulting of Vancouver Island University (VIU) and the RMOT 306
Environmental Monitoring class conducted a stream survey on Holland Creek located in
the town of Ladysmith, British Columbia. The study took place between October 31st
and November 21st 2012 (Table 1) and monitored 4 locations pre-determined by 2011
Resource Management Officer Technology students from the Vancouver Island
University (Figure 3).
Samples from each site were analyzed for water quality, microbiology,
invertebrate populations and hydrology. Information was also collected on overall
environmental conditions, biological health and environmental issues to examine human
influence from development and use of Holland Creek area. Water quality, coliform
testing, invertebrate sampling and hydrology were performed at all 4 locations during
low flow (October) sampling event, while only water quality and hydrology testing was
completed during high flow (November) sampling event. Data collected during this
project will be used in continuation with the data collection from past years to provide
Fisheries and Oceans Canada with a baseline report on the stream health and
rehabilitation status of Holland Creek.
2
1.2 Historical Review
The Holland Creek watershed covers an area of 28 square kilometers and
originates West of Ladysmith in the Coronation Mountains (Coastal BC, 2004). The
watershed as a whole has been put through a significant amount of stress over the last
100 years. The area has been heavily logged in the past which has left what was once
stable and productive fish habitat flashy and degraded. Human encroachment and the
proximity to the town of Ladysmith have also significantly affected the quality of the
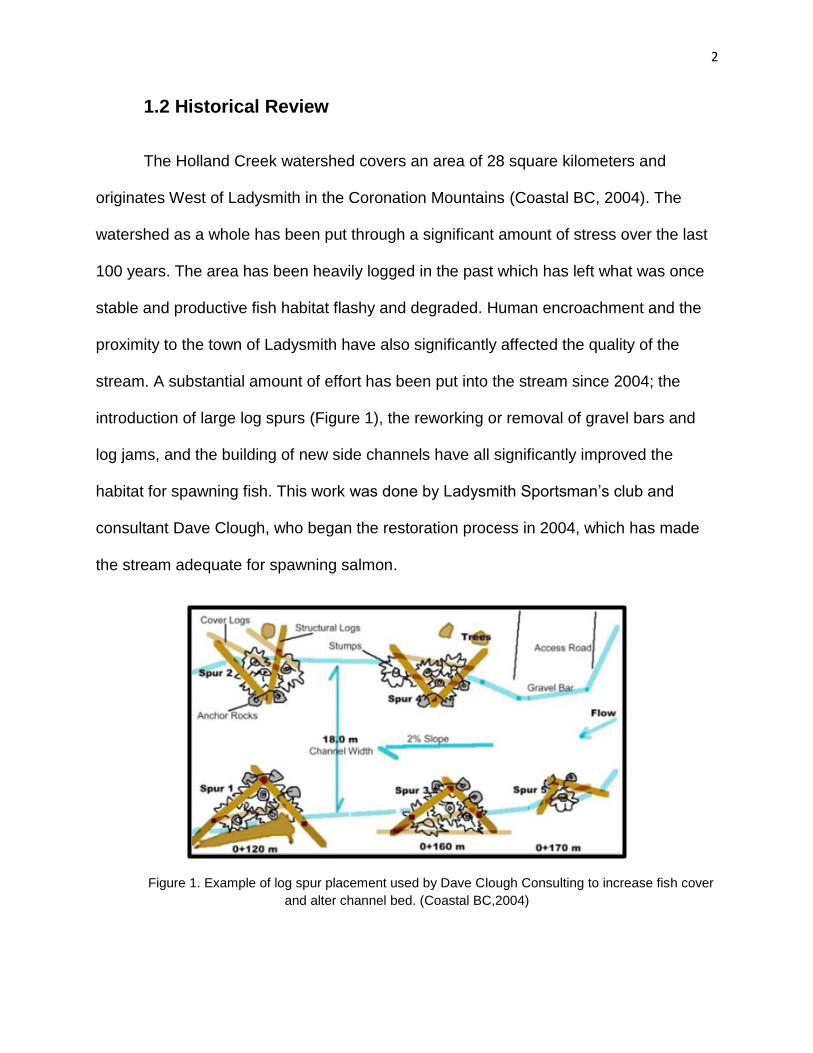
stream. A substantial amount of effort has been put into the stream since 2004; the
introduction of large log spurs (Figure 1), the reworking or removal of gravel bars and
log jams, and the building of new side channels have all significantly improved the
habitat for spawning fish. This work was done by Ladysmith Sportsman’s club and
consultant Dave Clough, who began the restoration process in 2004, which has made
the stream adequate for spawning salmon.
Figure 1. Example of log spur placement used by Dave Clough Consulting to increase fish cover
and alter channel bed. (Coastal BC,2004)
3
The Holland Creek Fish Habitat Enhancement Project was funded with the help
of Department of Fisheries and Oceans, Coastal BC, the Pacific Salmon Foundation,
Timber West, the Town of Ladysmith, and private donors. Holland Creek is now a fish
bearing stream with annual Coho Salmon (Oncorhynchus kisutch) and Chum Salmon
(Oncorhynchus keta) runs, as well as Cutthroat Trout (Oncorhynchus clarkii) and
Rainbow Trout (Oncorhynchus Mykiss) populations located at multiple locations within
the watershed.
On the stream’s 12km run to Ladysmith Harbour there are numerous manmade
structures that limit anadromous fish to the bottom 2.3 kilometers such as the
impassible falls, upper and lower colliery dams and the chicken ladder dam. Since the
enhancement project Holland Creek escapement numbers are on the rise, with
approximately 10,500 Chum salmon, 75 Coho salmon and 25 Steelhead. A portion of
the creek runs through Holland Creek Trail which is 5.9 kilometers of heavily forested
area complete with an extensive network of walking paths, and bridges throughout. All 4
sampling sites for this project are within the Holland Creek Trail system, sites 2-4 are
located alongside populated areas of Ladysmith, while site 1 is slightly further inland
(Figure 3). The Holland Creek watershed has various deciduous and non-deciduous
tree species consisting mainly of Red Cedar (Thuja plicata), Douglas Fir (Pseudosuga
menziesii), Red Alder (Alnus rubra), along with high amounts of Salal (Ericaceae) and
sword ferns (Polystichum munitum).

4
Figure 2. Map of trails throughout the Holland Creek watershed. (Town of Ladysmith, 2010)
1.3 Potential Environmental Concerns
With the proximity to Ladysmith and the town’s continuous growth there is going
to be continued environmental concerns associated with non-point source effluent
entering the Holland Creek watershed. These include urban development, logging,
recreational use, storm drains and road runoff. This concentration of anthropogenic
sources has the potential to cause large increases in the levels of nutrients such as
nitrates and phosphorus, both of which can cause significant damage.

5
Numerous newly formed small tributary streams were noted being cut into the
riparian zone hillside due largely to this excess runoff, which significantly altered our
readings at one monitoring site. The flashy nature of this creek has in the past forced
the City of Ladysmith to use the water of Stocking Lake as a drinking water source, as
the sporadically high turbidity and increased coliform counts have made Holland Creek
water unfit for consumption (Town of Ladysmith,2010)
2.0 Methods
2.1 Overview
Environmental sampling was completed at four pre-determined location along
Holland Creek in Ladysmith, British Columbia (Figure 3). This is the second year of
sampling by RMOT students on Holland Creek. Parameters tested included
microbiology, invertebrate diversity and water quality testing in an effort to determine the
environmental concerns associated with Holland Creek.
Sampling occurred two times once during low flow on October 31st 2012 and the
second sampling event occurred November 21st /22nd, 2012. Water Quality was
measured at each of the four sample sites during both sampling events and replicate
samples were taken at site 3 during sampling event one and site 1 during sampling
event two. Three additional samples were collected at sites 2, 3, 4 during both sampling
events to be analyzed by ALS Laboratories in Vancouver, British Columbia. Hydrology
measurements were taken at all four sample sites during both October low flow
sampling event and November high flow sampling event. Microbiology tests were
conducted during the first sampling event at all 4 site locations but were not tested for
6
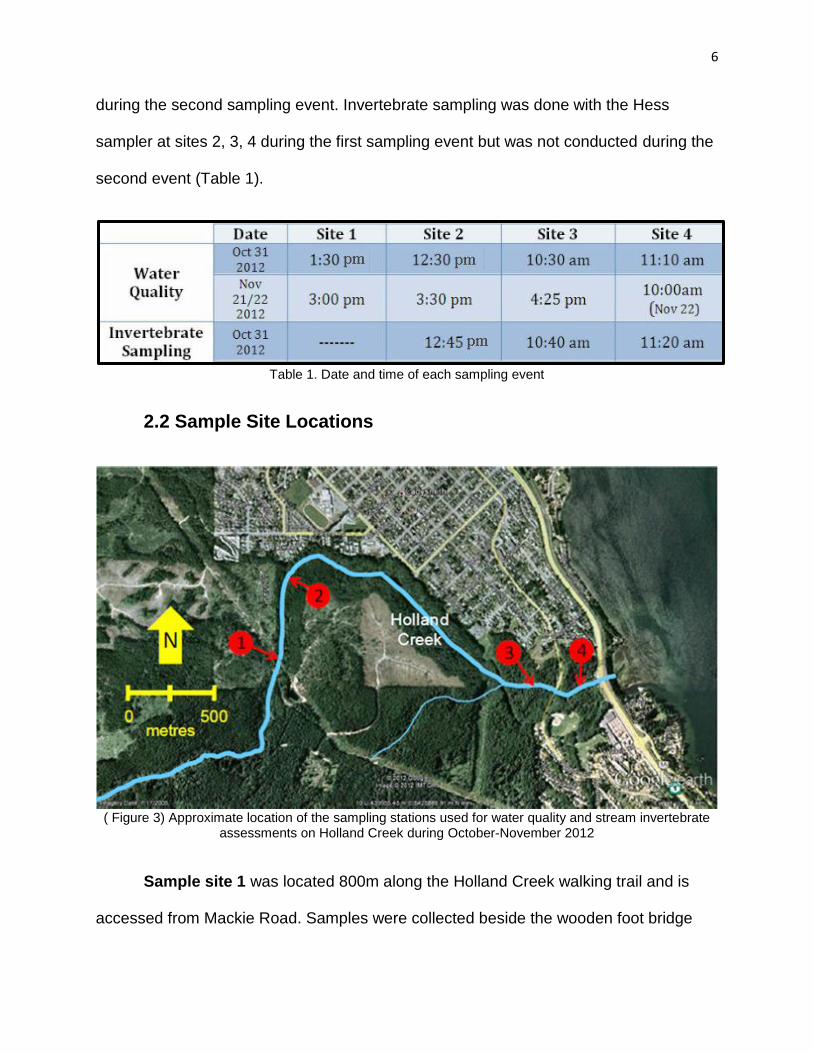
during the second sampling event. Invertebrate sampling was done with the Hess
sampler at sites 2, 3, 4 during the first sampling event but was not conducted during the
second event (Table 1).
Table 1. Date and time of each sampling event
2.2 Sample Site Locations
( Figure 3) Approximate location of the sampling stations used for water quality and stream invertebrate
assessments on Holland Creek during October-November 2012
Sample site 1 was located 800m along the Holland Creek walking trail and is
accessed from Mackie Road. Samples were collected beside the wooden foot bridge

7
crossing the creek. Large boulders are present at this site along with cobble-gravel
substrates. Vegetation in the surrounding area is dense with both deciduous and non-
deciduous tree species, mainly Red Cedar (Thuja plicata), Douglas Fir (Pseudosuga
menziesii), Red Alder (Alnus rubra). The total canopy cover over the stream is
approximately 35%. (Figure 4)
Figure 4. Sample site 1. Photo taken by Braeden Lattanzi
Sample site 2 was located 300m along the Holland Creek walking trail and is
accessed from Mackie Road. Samples were collected in lower flow areas near the side
of the stream. Recent landscaping by the city has added new fir trees to the bank, while
large amounts of Salal, deciduous and non-deciduous trees are also scattered along the
river. The canopy cover in this area is approximately 15%. Large boulders are present
at this site along with cobble-gravel substrates (Figure 5).

8
Figure 5. Sample site 2. Photo taken by Braeden Lattanzi
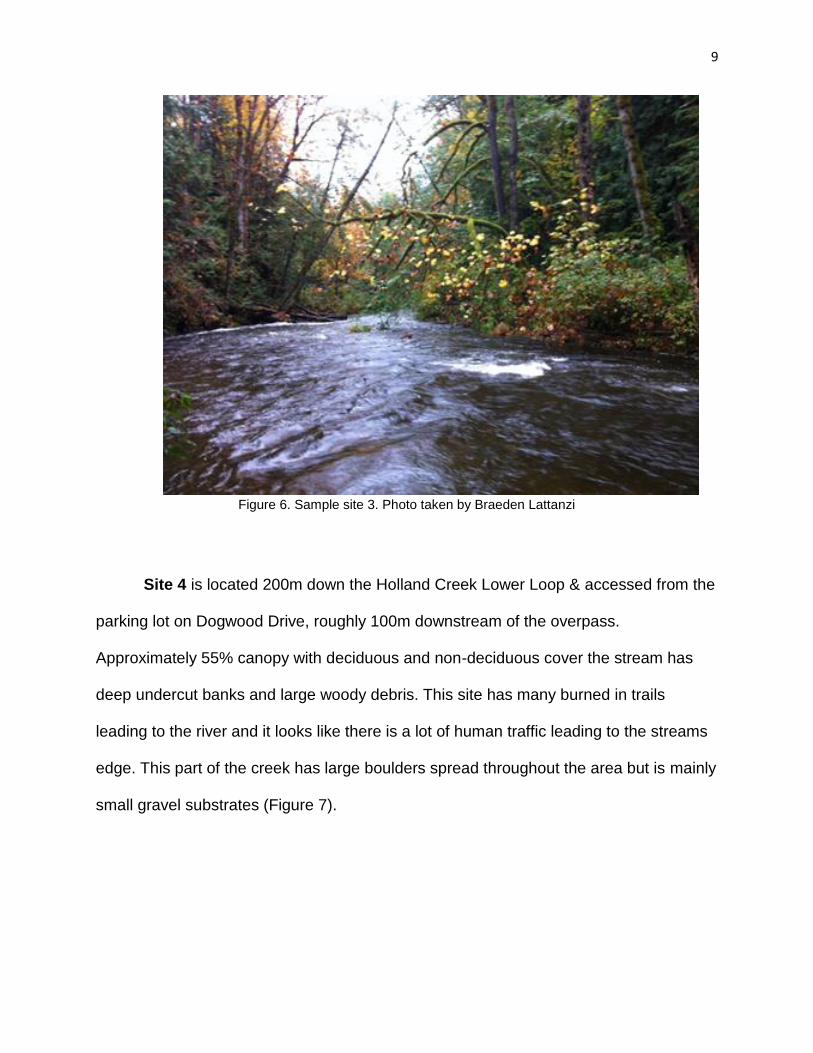
Sample site 3 is located approximately 100m upstream of the overpass and
accessible from the parking lot on Dogwood Drive. Approximately 150m along the
Holland Creek Lower Loop with large deciduous and non-deciduous growing throughout
with approximately 45% canopy cover. There are no large boulders at this site but
mostly cobble and small gravel substrates. This site looked to be the most productive
area for Chum salmon spawning during water quality monitoring, likely due to its low
gradient and optimal substrate size.
9
Figure 6. Sample site 3. Photo taken by Braeden Lattanzi
Site 4 is located 200m down the Holland Creek Lower Loop & accessed from the
parking lot on Dogwood Drive, roughly 100m downstream of the overpass.
Approximately 55% canopy with deciduous and non-deciduous cover the stream has
deep undercut banks and large woody debris. This site has many burned in trails
leading to the river and it looks like there is a lot of human traffic leading to the streams
edge. This part of the creek has large boulders spread throughout the area but is mainly
small gravel substrates (Figure 7).

10
Figure 7. Location of sample site 4. 2011. File corruption prevented use of 2012 photo.
Taken by Stephanie Righi.
2.3 Hydrology
Discharge measurements were taken at all 4 sampling sites during low flow
October monitoring and high flow November monitoring. Discharge was determined by
measuring the wetted width across the creek and depth measurements at 25, 50, 75
percent across the stream. A 10m measurement along the creek was conducted and a
ping pong ball was dropped 5 times at the upstream end of the 10 meters. The length of
time it took for the ping pong ball to travel the 10m interval was then used to calculate
water velocity. The cross sectional areas obtained by previous width and depth
measurements were then multiplied by the velocity to estimate the discharge rate for
each section of the creek.

11
Field water quality measurements taken during these sampling events included
dissolved oxygen, pH, conductivity and temperature and were done using an YSI
pro200. One sample bottle along with a field blank and replicate sample were collected
and analyzed at Vancouver Island University laboratories for each of the stations at both
low and high flow sampling events. Parameters measured during these sampling events
were alkalinity, hardness, total nitrate (NO3-), and total phosphate (PO43-). Additionally,
3 samples were taken at site 2, 3, 4 to be sent to ALS laboratories in Vancouver, British
Columbia to test for pH, total suspended solids, alkalinity, total metals and nutrients.
Quality control and quality assurance were taken into account during all monitoring
events following the MOE aquatic monitoring guidelines.
2.4 Microbiology
Water samples to test for total coliforms and fecal coliforms were collected in
sterile whirl packs while in the field. 50 ml from each site was then filtered through a
0.45 µm membrane using a vacuum pump. Once filtered, the membrane was then
transferred onto a petri dish containing a pad soaked in m-ColiBlue24 broth before
being incubated at approximately 37 degree Celsius for 48 hrs The sample was then
analyzed and counted for colony forming units (CFU) and the data was tallied. Fecal
coliform units had a bluish colour, non-fecal coliforms had a red colour and non-
coliform bacteria had a clear to crème colour. Microbiology testing took place during the
low flow October 31st sampling period but not during the high flow November sampling

12
period. Quality assurance measures were taken by using gloves during collection and
analysis, as well as using alcohol on forceps and burning off to sterilize during filtration.
2.5 Water Quality
3 water samples were collected and analyzed by ALS private laboratories in
Vancouver, BC and by students working on Holland creek in the Vancouver Island
University laboratories. Numerous steps were taken to ensure minimal sample
contamination; all sample containers were pre-labeled and rinsed 3-5 times before
water collection, gloves were worn at all times and samples were collected below the
surface water level after approaching from downstream. Field blanks and trip blanks
were used to verify that there was no contamination during sampling and transportation.
Sample preservation during transport to ALS private laboratories was achieved
by adding sulphuric acid to the water sample measuring metals in order to keep them
dissolved, while nitric acid was added to the sample to be analyzed for nutrient levels in
order to prevent the losses of organic compounds. Water samples that are to be
analyzed by Vancouver Island University students are conductivity, pH, total hardness,
phosphate, nitrate, total alkalinity and turbidity. These parameters will be tested to the
BC aquatic life guidelines to determine if they are within acceptable parameters
2.6 Stream Invertebrate Communities
Macro-invertebrate population sampling took place during the low flow October
sampling event from sites 3 and 4. Duplicate samples were taken at each site in order
to account for the variance in abundance and distribution that is commonly found in

13
freshwater environments. A Hess sampler was used to contain and collect the
organisms and a brush was then used to remove any cobble to ensure no invertebrates
were lost. Once the larger cobble was removed, the remaining substrate was disturbed
for 60 seconds and any invertebrates present were washed down into the collection jar.
The jar was then emptied into a tray and the large pieces of debris were rinsed
and removed in the field, upon completion all specimens were preserved in a pre-
labeled jar with 70% ethanol for future sorting by taxonomy in the labs at VIU. This
information was then used to calculate abundance, density, predominant taxon,
pollution tolerance index, EPT index, EPT to total ratio index, diversity and overall site
assessment rating.
3.0 Results and Discussion
3.1 General Field Conditions
The first sampling event took place on October 31st in a substantial amount of
precipitation. 11.2mm of rain fell between 2pm and 7pm, only exacerbating the already
muddy conditions resulting from 35mm of rainfall the previous day. Ambient
temperature was 10.2 ͦC. The second event took place on November 21st when the
ambient temperature had dropped to 4.9 ͦC, while 4.9mm of precipitation fell. (Weather
Office, 2012)
14
3.2 Water Quality
3.2.1 Field Measurements
Four water quality parameters were measured while in the field; dissolved
oxygen, temperature, conductivity and pH. Conductivity at was fairly consistent across
sampling events and stations, with the exception of station 3 during the first event.
While the other sites’ conductivity measured between 16-22 µs/cm over both events, on
October 31st site 3 was found to have a conductivity reading of 36 µs/cm when tested in
the field and 45.3 µs/cm when analyzed by ALS (appx.-table 5). This anomaly in the
water quality was reflected later by multiple parameters, as site 3’s hardness,
phosphorus, aluminum, silicon, sodium and turbidity varied greatly from the other
stations. We believe this to be result of small tributary streams that had recently formed
nearby as a result of significant October rainfall following an abnormally dry September.
The second event was taken during high flow and showed no noticeable trend at station
3, making it likely that the increased flow on Nov 21 diluted the incoming runoff to
normal levels.
Dissolved oxygen readings were well within guidelines for invertebrates, fish and
fish embryos. Over both events the dissolved oxygen ranged from 11.1-11.9 mg/L, while
anything over 9 mg/L is suitable for even the most sensitive life in coastal streams (ie.
fish embryos)(Appx table 9).
Water temperature readings at each station were stable in relation to each other,
but as expected dropped slightly over the two sampling trips. Temperature during the

15
first event ranged from 6.5-6.7 ͦC, while the second event ranged from 4.7-5.1 ͦC.(appx
table 8)
PH was tested both in the field and by ALS; field measurements found it to be
within range (6.5-9) at all but the 3rd site during the first sampling event when it was
measured 6.3 (other sites ranged from 6.7-7.3). This was contradicted by ALS analysis
that found all sites within range during the first event, and sites 2 and 3 below range
during the second event. While this difference stands out initially, the largest
discrepancy between ALS and field readings was 1, with ALS’s reading during event 2
at site 3 was 6.35 and field measurements were 7.35; this caused site 3 to drop below
guidelines by 0.15.(Appx table 4)
Hydrological data was taken during both events at 3 sites. It was our intention to
monitor flow rate at the same sites during both trips, but the drastic increase in flow
during the second event made unsafe to enter the water at site 2 (Tables 2, 3). Because
of this, we had difficulty interpreting the data in the manner that we had intended.
Event 1
Site number Average Depth
(m) Wetted Width
(m) Cross sectional
area (m²)
Average Velocity (m/sec)
Flow Rate (m³/sec)
2 0.21 6.8 1.43 0.43 0.61
3 0.22 7.2 1.58 0.16 0.25
4 0.18 9.7 1.75 0.19 0.33 Table 2. Hydrological data during event 1
Event 2
Site Number Average Depth
(m) Wetted Width
(m) Cross sectional
area (m²)
Average Velocity (m/sec)
Flow Rate (m³/sec)
16
1 0.58 12.0 6.9 -- --
3 0.55 14.2 7.81 0.79 6.17
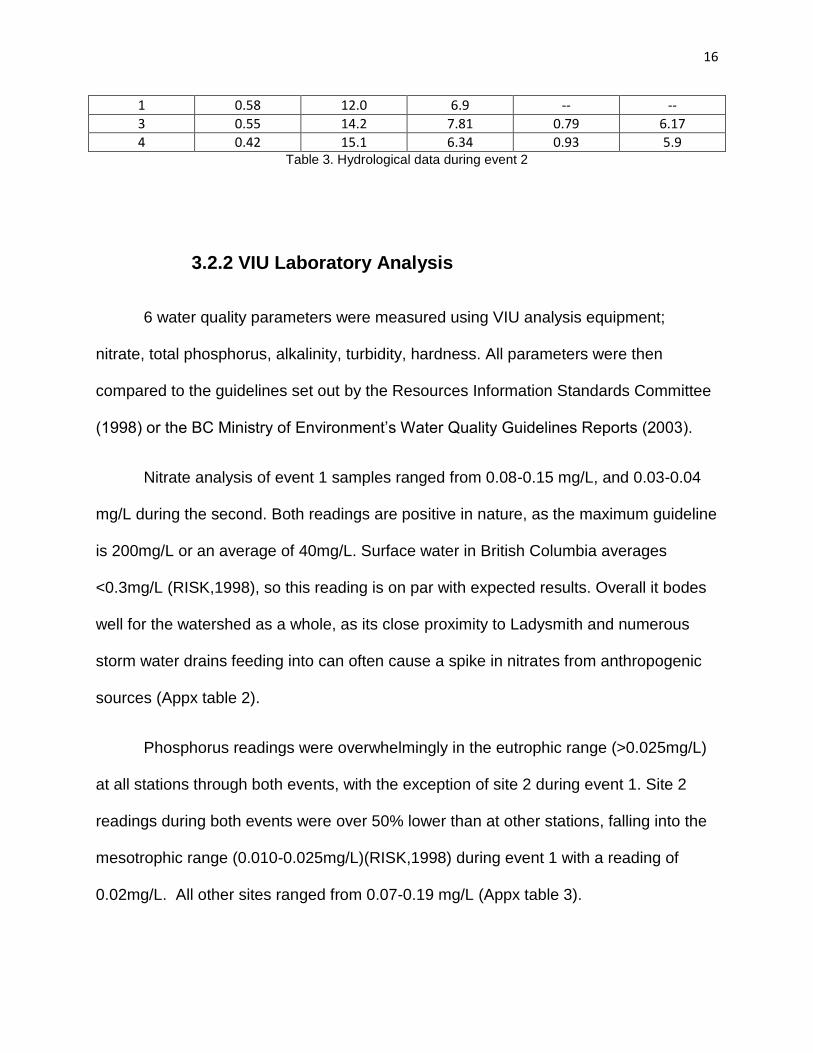
4 0.42 15.1 6.34 0.93 5.9 Table 3. Hydrological data during event 2
3.2.2 VIU Laboratory Analysis
6 water quality parameters were measured using VIU analysis equipment;
nitrate, total phosphorus, alkalinity, turbidity, hardness. All parameters were then
compared to the guidelines set out by the Resources Information Standards Committee
(1998) or the BC Ministry of Environment’s Water Quality Guidelines Reports (2003).
Nitrate analysis of event 1 samples ranged from 0.08-0.15 mg/L, and 0.03-0.04
mg/L during the second. Both readings are positive in nature, as the maximum guideline
is 200mg/L or an average of 40mg/L. Surface water in British Columbia averages
<0.3mg/L (RISK,1998), so this reading is on par with expected results. Overall it bodes
well for the watershed as a whole, as its close proximity to Ladysmith and numerous
storm water drains feeding into can often cause a spike in nitrates from anthropogenic
sources (Appx table 2).
Phosphorus readings were overwhelmingly in the eutrophic range (>0.025mg/L)
at all stations through both events, with the exception of site 2 during event 1. Site 2
readings during both events were over 50% lower than at other stations, falling into the
mesotrophic range (0.010-0.025mg/L)(RISK,1998) during event 1 with a reading of
0.02mg/L. All other sites ranged from 0.07-0.19 mg/L (Appx table 3).

17
Alkalinity testing found Holland Creek to have a moderate to high sensitivity to
acid inputs. Across both events, results ranged from 8-12.4 mg Ca²+/L. Guidelines have
the high acid sensitivity range as 0-10 mg Ca²+/L, while 10-20 mg Ca²+/L is described
as moderate sensitivity (RISK, 1998). No broad trends between sites were found (Appx
table 6).
Turbidity readings between sites were fairly consistent with the exception of the
previously mentioned anomalous site 3 during event 1. During both events turbidity
showed a slight trend of increasing at each station moving downstream, although this
progression is distorted by a reading of 6.17 NTU at site 3, while the other sites ranged
from 1.23-2.5 NTU during the first event. Event 2 readings stabilized significantly, with
no deviation between readings more than 0.07 NTU. Instead, event 2 unexpectedly had
a significantly lower average turbidity reading (0.38 NTU) despite greatly increased flow.
This may be a result of October precipitation being the first noteworthy rainfall since the
beginning of summer, introducing a high amount of loose soil and substrate into the
stream which lowered and stabilized over time (Appx table 7).
Hardness averaged 9.75 mg CaCO3/L during event 2, and 10.25 during event 2
(Appx table 10). This is including the comparably high reading from site 3(14 mg/L vs
8,8,9 mg/L at S1,S2, S4 respectively), which unexpectedly carried over between
sampling events, unlike any of the other high readings from site 3. Overall, the water
with the Holland Creek watershed is extremely soft, with <60 mg/L being the upper limit
for soft water (RISK,1998)
.

18
3.2.3 ALS Laboratory Analysis
During both events, separate samples were taken from sites 2, 3 and 4 with the
goal of having more advanced analysis done by ALS. 3 samples from each station were
taken; one for total metals, one for anions and nutrients and one for general water
quality parameters. Certain tests overlapped with the laboratory work done at VIU
(conductivity, hardness, pH, nitrates and phosphates) which offered the opportunity to
compare results.
The results of the physical tests (conductivity, hardness, pH) were fairly
consistent with those obtained from VIU analysis. The abnormal readings from the VIU
analysis of site 3 were reflected in those from ALS, though at slightly different quantities;
conductivity at sites 2, 3 and 4 according to VIU analysis was 16, 36 and 20 µs/cm
respectively, ALS results showed 18.9, 45.3 and 22.3 µs/cm (Table 4). Despite this,
there was only an average of 15% difference found. This slight variance in readings
continues through measurements of hardness and pH, though the discrepancies are not
nearly as pronounced. Event 2’s physical test results when compared to VIU analysis
was accurate with regards to conductivity and pH, but hardness showed deviations too
high for the VIU measurement to be considered precise. Event two also showed a pH
reading below acceptable guidelines at site 2 and 3 by 0.22 pH and 0.15 pH
respectively.
The next section of analysis done by ALS was anions and nutrients. Ammonia,
nitrate, nitrite, orthophosphate and phosphorus was tested, though only nitrate and
phosphorus readings were above detectable limits. Nitrate and phosphate readings
19
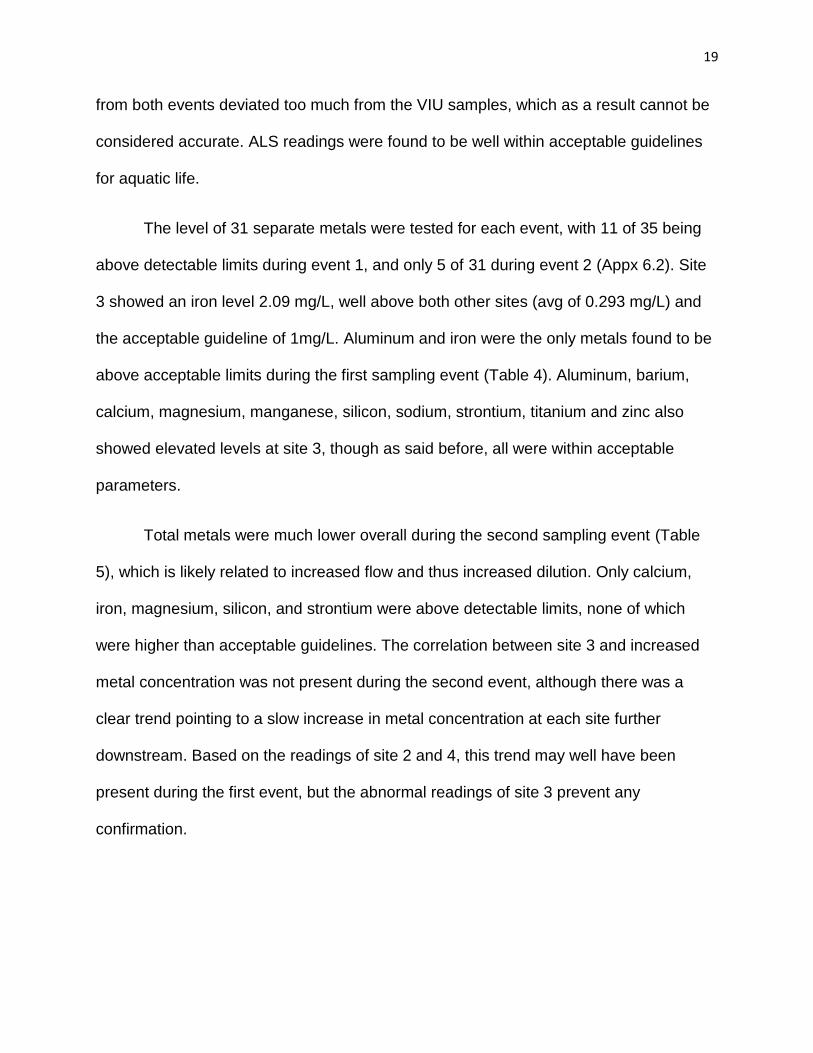
from both events deviated too much from the VIU samples, which as a result cannot be
considered accurate. ALS readings were found to be well within acceptable guidelines
for aquatic life.
The level of 31 separate metals were tested for each event, with 11 of 35 being
above detectable limits during event 1, and only 5 of 31 during event 2 (Appx 6.2). Site
3 showed an iron level 2.09 mg/L, well above both other sites (avg of 0.293 mg/L) and
the acceptable guideline of 1mg/L. Aluminum and iron were the only metals found to be
above acceptable limits during the first sampling event (Table 4). Aluminum, barium,
calcium, magnesium, manganese, silicon, sodium, strontium, titanium and zinc also
showed elevated levels at site 3, though as said before, all were within acceptable
parameters.
Total metals were much lower overall during the second sampling event (Table
5), which is likely related to increased flow and thus increased dilution. Only calcium,
iron, magnesium, silicon, and strontium were above detectable limits, none of which
were higher than acceptable guidelines. The correlation between site 3 and increased
metal concentration was not present during the second event, although there was a
clear trend pointing to a slow increase in metal concentration at each site further
downstream. Based on the readings of site 2 and 4, this trend may well have been
present during the first event, but the abnormal readings of site 3 prevent any
confirmation.

20
HOLLAND CREEK STN 2
HOLLAND CREEK STN 3
HOLLAND CREEK STN 4
Water Quality Guidelines (maximum allowable level)
DATE 31-OCT-12
31-OCT-12 31-OCT-12
TIME OF SAMPLE 12:30 pm 10:30 am 11:10 am
Physical Tests
Conductivity 18.9 45.3 22.3 ----
Hardness (as CaCO3) 7.68 17.9 9.07 ----
pH 6.78 7.12 6.94 6.5-9.0
Anions and Nutrients
Nitrate (as N) 0.158 0.171 0.168 200 mg/L
Phosphorus (P)-Total 0.0166 0.0666 0.019 <0.010- Oligotrophic 0.010-0.025- Mesotrophic ≥0.025- Eutrophic
Total Metals
Aluminum (Al)-Total 0.33 1.99 0.37 0.1 when pH >6.5
Barium (Ba)-Total <0.010 0.016 <0.010 1 mg/L
Calcium (Ca)-Total 2.29 5.39 2.74 ≤4- High acid sensitivity 4 – 8- Moderate acid sensitivity >8- Low acid sensitivity
Iron (Fe)-Total 0.254 2.09 0.332 1 mg/L
Magnesium (Mg)-Total 0.48 1.08 0.54 ----
Manganese (Mn)-Total 0.0127 0.0501 0.0154 0.65mg/L (at avg hardness of 10)
Silicon (Si)-Total 2.58 4.55 2.71 ----
Sodium (Na)-Total <2.0 3.5 <2.0 ----
Strontium (Sr)-Total 0.0129 0.0423 0.0165 ----
Titanium (Ti)-Total <0.010 0.091 0.014 ----
Zinc (Zn)-Total <0.0050 0.0088 <0.0050 0.033mg/L (when hardness <90)
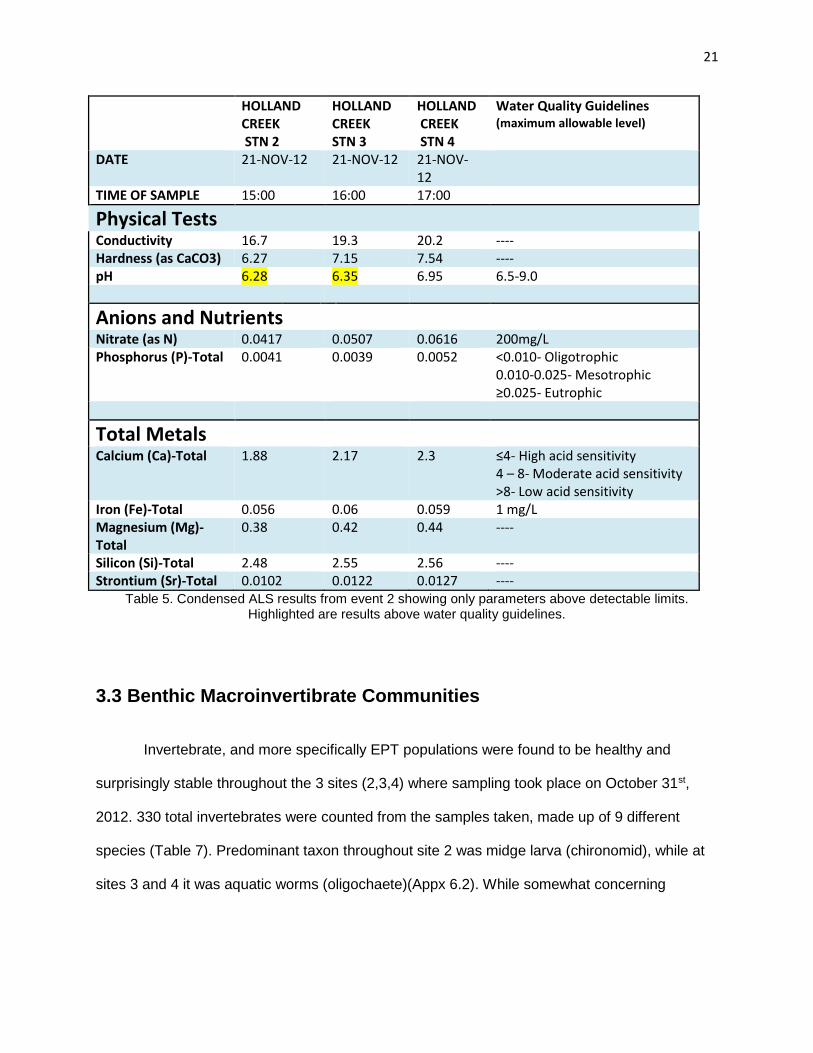
Table 4. Condensed ALS results from event 1 showing only parameters above detectable limits. Highlighted are results above water quality guidelines.
21
HOLLAND CREEK STN 2
HOLLAND CREEK STN 3
HOLLAND CREEK STN 4
Water Quality Guidelines (maximum allowable level)
DATE 21-NOV-12 21-NOV-12 21-NOV-12
TIME OF SAMPLE 15:00 16:00 17:00
Physical Tests
Conductivity 16.7 19.3 20.2 ---- Hardness (as CaCO3) 6.27 7.15 7.54 ---- pH 6.28 6.35 6.95 6.5-9.0
Anions and Nutrients
Nitrate (as N) 0.0417 0.0507 0.0616 200mg/L Phosphorus (P)-Total 0.0041 0.0039 0.0052 <0.010- Oligotrophic
0.010-0.025- Mesotrophic ≥0.025- Eutrophic
Total Metals Calcium (Ca)-Total 1.88 2.17 2.3 ≤4- High acid sensitivity
4 – 8- Moderate acid sensitivity >8- Low acid sensitivity
Iron (Fe)-Total 0.056 0.06 0.059 1 mg/L Magnesium (Mg)-Total
0.38 0.42 0.44 ----
Silicon (Si)-Total 2.48 2.55 2.56 ---- Strontium (Sr)-Total 0.0102 0.0122 0.0127 ----
Table 5. Condensed ALS results from event 2 showing only parameters above detectable limits. Highlighted are results above water quality guidelines.
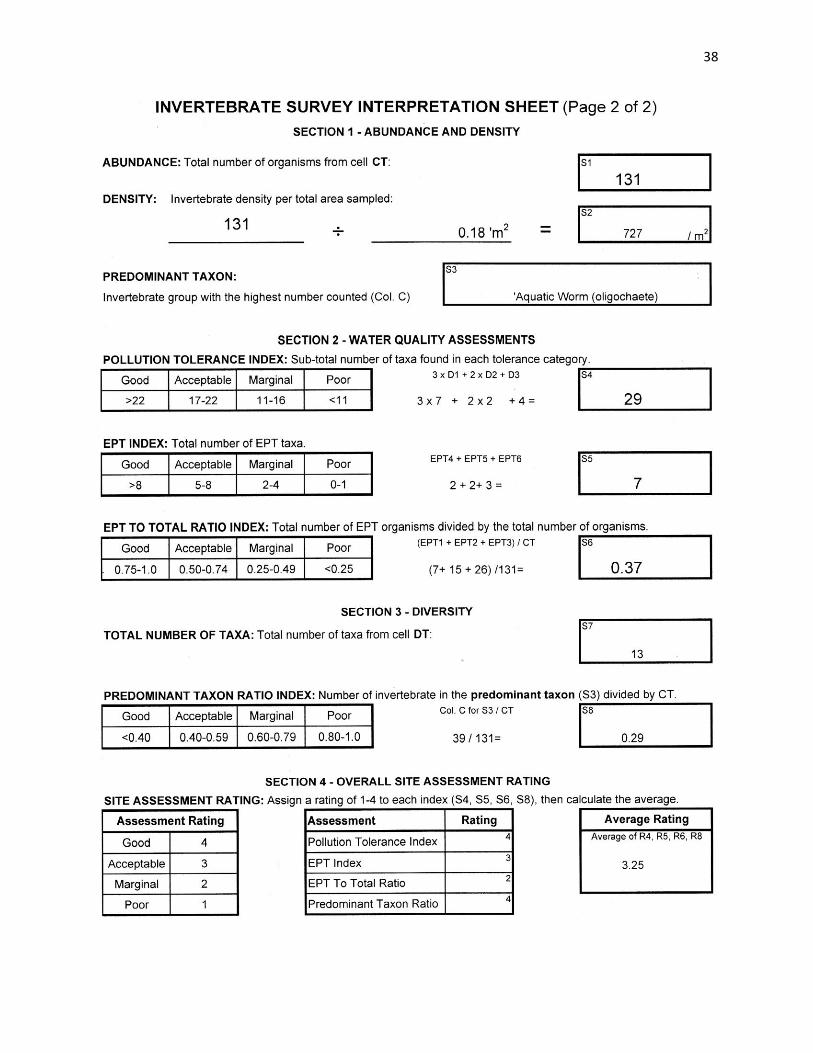
3.3 Benthic Macroinvertibrate Communities
Invertebrate, and more specifically EPT populations were found to be healthy and
surprisingly stable throughout the 3 sites (2,3,4) where sampling took place on October 31st,
2012. 330 total invertebrates were counted from the samples taken, made up of 9 different
species (Table 7). Predominant taxon throughout site 2 was midge larva (chironomid), while at
sites 3 and 4 it was aquatic worms (oligochaete)(Appx 6.2). While somewhat concerning
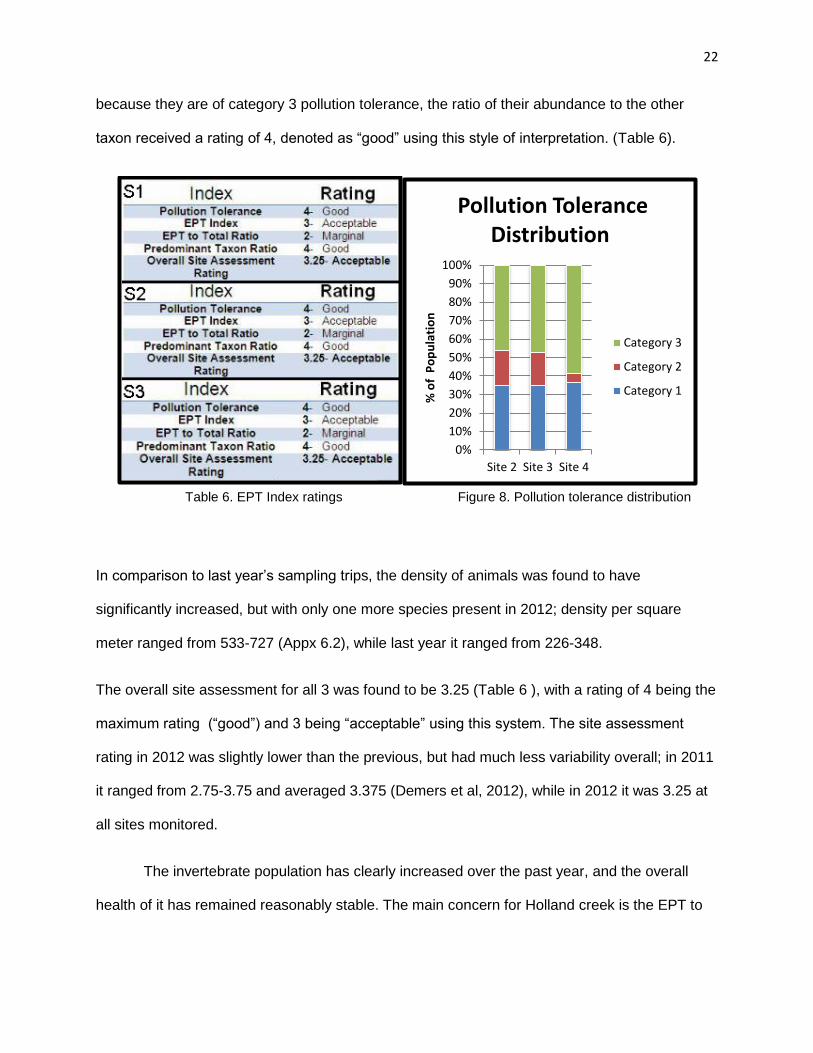
22
because they are of category 3 pollution tolerance, the ratio of their abundance to the other
taxon received a rating of 4, denoted as “good” using this style of interpretation. (Table 6).
Table 6. EPT Index ratings Figure 8. Pollution tolerance distribution
In comparison to last year’s sampling trips, the density of animals was found to have
significantly increased, but with only one more species present in 2012; density per square
meter ranged from 533-727 (Appx 6.2), while last year it ranged from 226-348.
The overall site assessment for all 3 was found to be 3.25 (Table 6 ), with a rating of 4 being the
maximum rating (“good”) and 3 being “acceptable” using this system. The site assessment
rating in 2012 was slightly lower than the previous, but had much less variability overall; in 2011
it ranged from 2.75-3.75 and averaged 3.375 (Demers et al, 2012), while in 2012 it was 3.25 at
all sites monitored.
The invertebrate population has clearly increased over the past year, and the overall
health of it has remained reasonably stable. The main concern for Holland creek is the EPT to
0%
10%
20%
30%
40%
50%
60%
70%
80%
90%
100%
Site 2 Site 3 Site 4
% o
f P
op
ula
tio
n
Pollution Tolerance Distribution
Category 3
Category 2
Category 1
23
Total Population ratio, which was the lowest scoring quality during the site assessment, with a
rating of 2 (“marginal”)(Figure 8).
Pollution Tolerance Species Site 2 Site 3 Site 4
Category 1 Caddisfly Larva Mayfly Nymph
Stonefly Nymph
10 12 12
9 20 13
7 15 26
Category 2 Cranefly Larva
Damselfly Larva Crayfish
2 15 1
5 14 0
5 1 0
Category 3 Aquatic Worm Blackfly Larva Midge Larva
20 0 24
25 3 20
39 2 36
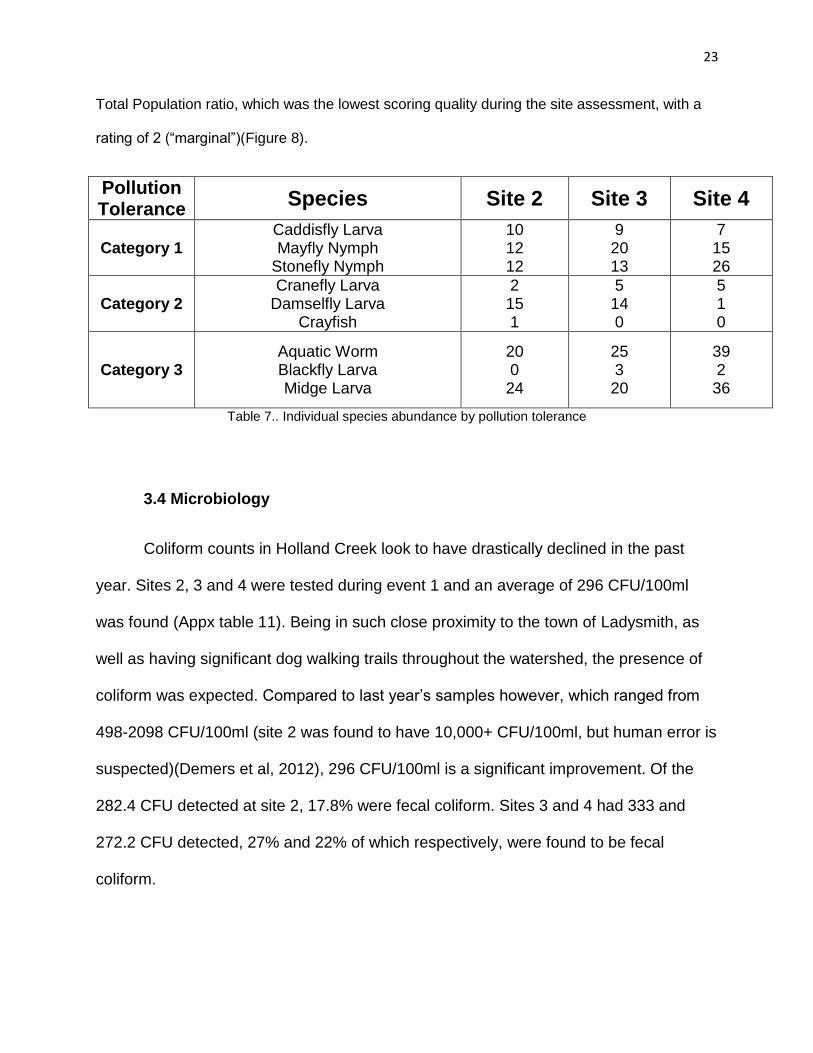
Table 7.. Individual species abundance by pollution tolerance
3.4 Microbiology
Coliform counts in Holland Creek look to have drastically declined in the past
year. Sites 2, 3 and 4 were tested during event 1 and an average of 296 CFU/100ml
was found (Appx table 11). Being in such close proximity to the town of Ladysmith, as
well as having significant dog walking trails throughout the watershed, the presence of
coliform was expected. Compared to last year’s samples however, which ranged from
498-2098 CFU/100ml (site 2 was found to have 10,000+ CFU/100ml, but human error is
suspected)(Demers et al, 2012), 296 CFU/100ml is a significant improvement. Of the
282.4 CFU detected at site 2, 17.8% were fecal coliform. Sites 3 and 4 had 333 and
272.2 CFU detected, 27% and 22% of which respectively, were found to be fecal
coliform.

24
4.0 Conclusions and Recommendations
It is clear after this monitoring project that the past improvements to fish habitat
have benefited the salmon runs considerably, as the stream again supports a significant
chum run, as well as a minor Coho Run. The introduction of numerous log spurs along
the length of the stream have worked to narrow and deepen channels, resulting in many
more pools essential to the rearing of juveniles and the protection of adult fish of all
species. The newly constructed side channels have yet to make their intended impact,
as very few fish were observed in them during out monitoring trips. We feel however
that this is temporary and will improve over time as vegetation both in, and at
streamside grows to make it more suitable habitat.
Water quality readings were generally within guidelines for aquatic life in BC. As
outlined in previous sections, site 3 during event 1 provided multiple unique readings in
comparison to the other sites. We believe this to be a result of numerous small streams
originating from the roadside and draining into the stream in the vicinity of the testing
site. Higher overall flow seems to have mitigated this to some degree as parameters
were much closer to the other sites during the 2nd sampling event. This will need to be
monitored closely in the future during low flow periods, as the volume of water in the
creek during the summer may not always be sufficient to dilute metal concentration to
acceptable levels. We feel it would be beneficial to the watershed as a whole if streams
that can be traced back to the roadside are monitored for contaminants, as preliminary
findings point to non-point source pollution; though we do recognize that funding likely
will not allow for this.

25
Invertebrate counts showed the area to be in good health, and had a surprisingly
uniform ratio of Category 1, 2 & 3 species across the separate sites. Aquatic worms and
midge larva were the most common species, but were not found in alarming
abundance. EPT species were found to be in good abundance. Compared to the
previous year, the ratio of EPT to Total invertebrates was lower, though a drastic
increase in overall abundance of all other species mitigates these concerns to some
degree. Being only the second year of monitoring, there is still much more monitoring
necessary before a reliable baseline can be established, and thus we recommend the
long term monitoring of trends with regards to EPT ratio.
With Holland Creek being a continued source of municipal water as well as
valuable fish habitat, it is of the utmost importance monitoring of water volume drawn is
continued. Ladysmith’s recent tax credit initiatives aimed at lowering water consumption
are a step in the right direction, and we hope to hear of similar programs being
established in the future.

26
5.0 References
CoastalBC. 2004. Holland Creek Fish Habitat Enhancement Program http://www.coastalbc.com/fish/st402holland.htm BC Ministry of Environment (MOE). 2003. Water Quality Guidelines (Criteria) Reports <http://www.env.gov.bc.ca/wat/wq/wq_guidelines.html>
National Climate Data and Information Archive. 2012. <http://climate.weatheroffice.gc.ca)>
Resources Information Standards Committee (RISK). 1998. Guidelines for Interpreting Water Quality Data. <http://archive.ilmb.gov.bc.ca/risc/pubs/aquatic/interp/index.htm>
Town of Ladysmith. 2010. Annual Water Report 2010 – Town of Ladysmith. Vancouver Island University (VIU: G. Faasse, J. Klassen, N. McEwan, S. Righi, and E. Demers). 2012. Water Quality and Stream Invertebrate Assessment for Holland Creek, BC (Fall 2011). Data Report.

27
6.0 Appendix
6.1 Tables
Table 1. Description of the sampling stations used for water quality and stream invertebrate
assessments on Holland Creek during October-November 2012. All northing and easting coordinates were approximated with Google Earth and are based on zone 10U.
Table 2
Table 3
Site Number Nitrate (mg/L)
Event 1 Event 2
1 0.15 0.03
2 0.08 0.04
3 0.14 0.04
4 0.13 0.04
Site Number Phosphorus (mg/L)
Event 1 Event 2
1 0.07 0.13
2 0.02 0.06
3 0.10 0.18
4 0.11 0.19

28
Table 4
Table 5
Table 6
Table 7
Site Number pH
Event 1 Event 2
1 7.3 7.18
2 7.1 7.13
3 6.3 7.35
4 6.7 7.09
Site Number Conductivity (µs/cm)
Event 1 Event 2
1 16 17
2 16 17
3 36 20
4 20 21
Site Number Alkalinity (mg Ca²+/L)
Event 1 Event 2
1 8 10
2 9.6 11
3 12.4 10
4 9.6 9.6
Site Number Turbidity (NTU)
Event 1 Event 2
1 1.23 0.33
2 1.59 0.39
3 6.17 0.40
4 2.5 0.40
29
Table 8
Table 9
Table 10
Table 11
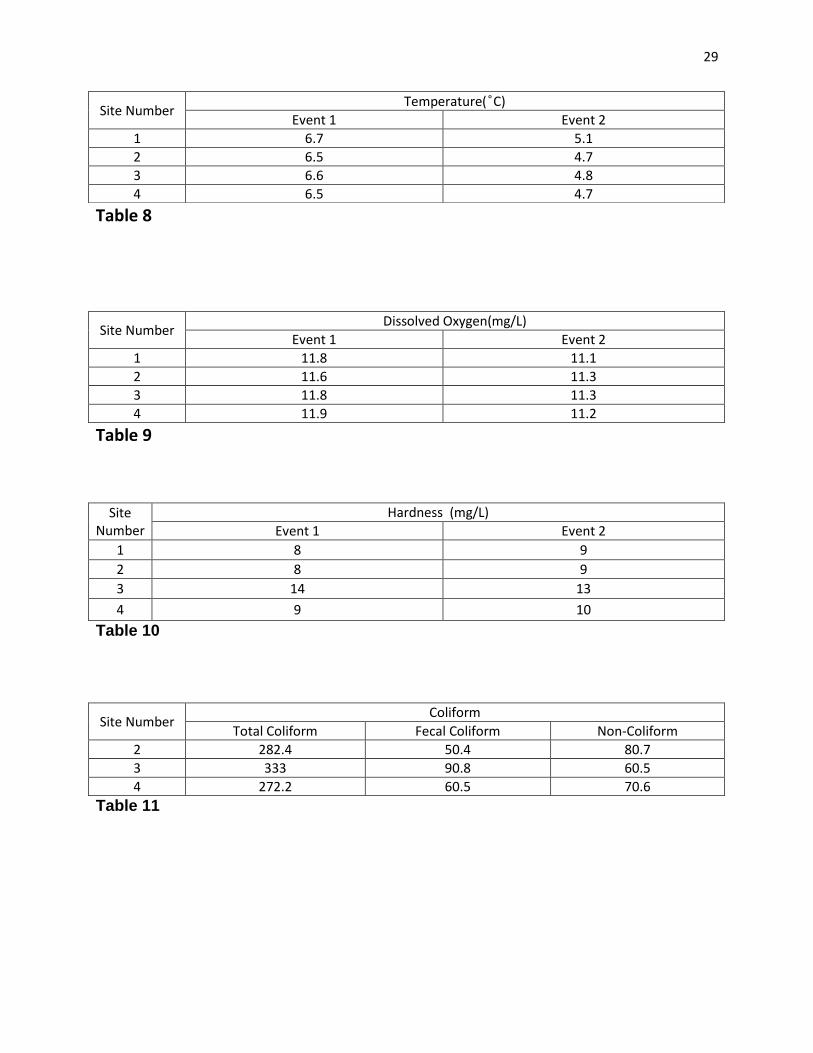
Site Number Temperature( Cͦ)
Event 1 Event 2
1 6.7 5.1
2 6.5 4.7
3 6.6 4.8
4 6.5 4.7
Site Number Dissolved Oxygen(mg/L)
Event 1 Event 2
1 11.8 11.1
2 11.6 11.3
3 11.8 11.3
4 11.9 11.2
Site Number
Hardness (mg/L)
Event 1 Event 2
1 8 9
2 8 9
3 14 13
4 9 10
Site Number Coliform
Total Coliform Fecal Coliform Non-Coliform
2 282.4 50.4 80.7
3 333 90.8 60.5
4 272.2 60.5 70.6

30
6.2 ALS Results
Event 1
HOLLAND CREEK STN 2
HOLLAND CREEK STN 3
HOLLAND CREEK STN 4
DATE 31-OCT-12 31-OCT-12 31-OCT-12
TIME OF SAMPLE 12:30 pm 10:30 am 11:10 am
Physical Tests
Conductivity 18.9 45.3 22.3
Hardness (as CaCO3) 7.68 17.9 9.07
pH 6.78 7.12 6.94
Anions and Nutrients
Ammonia, Total (as N) <0.0050 <0.0050 <0.0050
Nitrate (as N) 0.158 0.171 0.168
Nitrite (as N) <0.0010 <0.0010 <0.0010
Orthophosphate- Dissolved (as P)
<0.0010 <0.0010 <0.0010
Phosphorus (P)-Total 0.0166 0.0666 0.019
Total Metals
Aluminum (Al)-Total 0.33 1.99 0.37
Antimony (Sb)-Total <0.20 <0.20 <0.20
Arsenic (As)-Total <0.20 <0.20 <0.20
Barium (Ba)-Total <0.010 0.016 <0.010
Beryllium (Be)-Total <0.0050 <0.0050 <0.0050
Bismuth (Bi)-Total <0.20 <0.20 <0.20
Boron (B)-Total <0.10 <0.10 <0.10
Cadmium (Cd)-Total <0.010 <0.010 <0.010
Calcium (Ca)-Total 2.29 5.39 2.74
Chromium (Cr)-Total <0.010 <0.010 <0.010
Cobalt (Co)-Total <0.010 <0.010 <0.010
Copper (Cu)-Total <0.010 <0.010 <0.010
Iron (Fe)-Total 0.254 2.09 0.332
Lead (Pb)-Total <0.050 <0.050 <0.050
Lithium (Li)-Total <0.010 <0.010 <0.010

31
Magnesium (Mg)-Total 0.48 1.08 0.54
Manganese (Mn)-Total 0.0127 0.0501 0.0154
Molybdenum (Mo)-Total <0.030 <0.030 <0.030
Nickel (Ni)-Total <0.050 <0.050 <0.050
Phosphorus (P)-Total <0.30 <0.30 <0.30
Potassium (K)-Total <2.0 <2.0 <2.0
Selenium (Se)-Total <0.20 <0.20 <0.20
Silicon (Si)-Total 2.58 4.55 2.71
Silver (Ag)-Total <0.010 <0.010 <0.010
Sodium (Na)-Total <2.0 3.5 <2.0
Strontium (Sr)-Total 0.0129 0.0423 0.0165
Thallium (Tl)-Total <0.20 <0.20 <0.20
Tin (Sn)-Total <0.030 <0.030 <0.030
Titanium (Ti)-Total <0.010 0.091 0.014
Vanadium (V)-Total <0.030 <0.030 <0.030
Zinc (Zn)-Total <0.0050 0.0088 <0.0050
Event 2
HOLLAND CREEK STN 2
HOLLAND CREEK STN 3
HOLLAND CREEK STN 4
DATE 21-NOV-12 21-NOV-12 21-NOV-12 TIME OF SAMPLE 15:00 16:00 17:00
Physical Tests
Conductivity 16.7 19.3 20.2 Hardness (as CaCO3) 6.27 7.15 7.54 pH 6.28 6.35 6.95
Anions and Nutrients
Ammonia, Total (as N) <0.0050 <0.0050 <0.0050 Nitrate (as N) 0.0417 0.0507 0.0616 Nitrite (as N) <0.0010 <0.0010 <0.0010 Orthophosphate-Dissolved (as P)
<0.0010 <0.0010 <0.0010
Phosphorus (P)-Total 0.0041 0.0039 0.0052
Total Metals

32
Aluminum (Al)-Total <0.20 <0.20 <0.20 Antimony (Sb)-Total <0.20 <0.20 <0.20 Arsenic (As)-Total <0.20 <0.20 <0.20 Barium (Ba)-Total <0.010 <0.010 <0.010 Beryllium (Be)-Total <0.0050 <0.0050 <0.0050 Bismuth (Bi)-Total <0.20 <0.20 <0.20 Boron (B)-Total <0.10 <0.10 <0.10 Cadmium (Cd)-Total <0.010 <0.010 <0.010 Calcium (Ca)-Total 1.88 2.17 2.3 Chromium (Cr)-Total <0.010 <0.010 <0.010 Cobalt (Co)-Total <0.010 <0.010 <0.010 Copper (Cu)-Total <0.010 <0.010 <0.010 Iron (Fe)-Total 0.056 0.06 0.059 Lead (Pb)-Total <0.050 <0.050 <0.050 Lithium (Li)-Total <0.010 <0.010 <0.010 Magnesium (Mg)-Total 0.38 0.42 0.44 Manganese (Mn)-Total <0.0050 <0.0050 <0.0050 Molybdenum (Mo)-Total <0.030 <0.030 <0.030 Nickel (Ni)-Total <0.050 <0.050 <0.050 Phosphorus (P)-Total <0.30 <0.30 <0.30 Potassium (K)-Total <2.0 <2.0 <2.0 Selenium (Se)-Total <0.20 <0.20 <0.20 Silicon (Si)-Total 2.48 2.55 2.56 Silver (Ag)-Total <0.010 <0.010 <0.010 Sodium (Na)-Total <2.0 <2.0 <2.0 Strontium (Sr)-Total 0.0102 0.0122 0.0127 Thallium (Tl)-Total <0.20 <0.20 <0.20 Tin (Sn)-Total <0.030 <0.030 <0.030 Titanium (Ti)-Total <0.010 <0.010 <0.010 Vanadium (V)-Total <0.030 <0.030 <0.030 Zinc (Zn)-Total <0.0050 <0.0050 <0.0050

33
6.3 Invertebrate Survey Field Data Sheets

34

35
Stream Name: Date:
Station Name: Flow status:
Sampler Used: Number of replicates Total area sampled (Hess, Surber = 0.09 m2) x no. replicates
0.18 m2
Caddisfly Larva (EPT)
Mayfly Nymph (EPT)
Stonefly Nymph (EPT)
Dobsonfly (hellgrammite)
Gilled Snail
Riffle Beetle
Water Penny
Alderfly Larva
Aquatic Beetle
Aquatic Sowbug
Clam, Mussel
Cranefly Larva
Crayfish
Damselfly Larva
Dragonfly Larva
Fishfly Larva
Amphipod (freshwater shrimp)
Watersnipe Larva
Aquatic Worm (oligochaete)
Blackfly Larva
Leech
Midge Larva (chironomid)
Planarian (flatworm)
Pouch and Pond Snails
True Bug Adult
Water Mite
1
Sub-Total
TOTAL
INVERTEBRATE SURVEY FIELD DATA SHEET (Page 1 of 2)
Sub-Total
Sub-Total
CT 103 DT 13
3 1
C3 48 D3 4
25 2
20
14 1
C2 19 D2 2
5 1
C1 36 D1 7
Category 3
Pollution
Tolerant
EPT1 9 EPT4 2
EPT2 20 EPT5 3
EPT3 13 EPT6 2
2
Column D
Number of Taxa
Column A
Pollution Tolerance
Column B
Common Name
Column C
Number Counted
31-Oct-12
Medium
Category 1
Pollution
Intolerant
Category 2
Somewhat
Pollution
Tolerant
Holland Creek
Site 3

36
ABUNDANCE: Total number of organisms from cell CT: S1
103
DENSITY: Invertebrate density per total area sampled:
S2
572/ m2
PREDOMINANT TAXON:S3
Invertebrate group with the highest number counted (Col. C) Aquatic Worm (oligochaete)
POLLUTION TOLERANCE INDEX: Sub-total number of taxa found in each tolerance category.
Good Acceptable Marginal Poor S4
>22 17-22 11-16 <11 29
EPT INDEX: Total number of EPT taxa.
Good Acceptable Marginal Poor S5
>8 5-8 2-4 0-1 7
EPT TO TOTAL RATIO INDEX: Total number of EPT organisms divided by the total number of organisms.
Good Acceptable Marginal Poor S6
0.75-1.0 0.50-0.74 0.25-0.49 <0.25 0.35
TOTAL NUMBER OF TAXA: Total number of taxa from cell DT:S7
13
PREDOMINANT TAXON RATIO INDEX: Number of invertebrate in the predominant taxon (S3) divided by CT.
Good Acceptable Marginal Poor S8
<0.40 0.40-0.59 0.60-0.79 0.80-1.0 0.24
SITE ASSESSMENT RATING: Assign a rating of 1-4 to each index (S4, S5, S6, S8), then calculate the average.
Assessment Rating
Good 4 Pollution Tolerance Index 4
Acceptable 3 EPT Index 3
Marginal 2 EPT To Total Ratio 23.25
Poor 1 Predominant Taxon Ratio 4
SECTION 3 - DIVERSITY
Average of R4, R5, R6, R8
Assessment Rating Average Rating
SECTION 4 - OVERALL SITE ASSESSMENT RATING
Col. C for S3 / CT
25/ 103=
S1 103
(9+20 + 13) /103=
3 x D1 + 2 x D2 + D3
EPT4 + EPT5 + EPT6
(EPT1 + EPT2 + EPT3) / CT
0.18 m2 =
2+ 3+ 2 =
3 x 7+ 2 x2 +4 =
INVERTEBRATE SURVEY INTERPRETATION SHEET (Page 2 of 2)
SECTION 1 - ABUNDANCE AND DENSITY
SECTION 2 - WATER QUALITY ASSESSMENTS

37
38