fineout and schoof's creek monitoring study 2013 · fineout and schoof’s creek monitoring...
TRANSCRIPT
Fineout and Schoof’s Creek Monitoring Study 2013 Page 1
Fineout and Schoof's Creek Monitoring Study 2013
By Tip of the Mitt Watershed Council
Report written by:
Kevin L. Cronk
Monitoring and Research Director

Fineout and Schoof’s Creek Monitoring Study 2013 Page 2
TABLE OF CONTENTS
INTRODUCTION ............................................................................................................................... 4
Study Area ................................................................................................................................... 4
Prior Monitoring and Studies ...................................................................................................... 6
METHODS ........................................................................................................................................ 8
Physical and Chemical Monitoring .............................................................................................. 8
Biological Monitoring ................................................................................................................ 11
Pollutant loading calculations ................................................................................................... 12
RESULTS......................................................................................................................................... 13
Bacteria ..................................................................................................................................... 13
Nutrients.................................................................................................................................... 14
Chloride, Conductivity, and Total Solids ................................................................................... 16
Dissolved Oxygen, Temperature, and pH .................................................................................. 18
Discharge and Loads .................................................................................................................. 20
Aquatic Macroinvertebrates ..................................................................................................... 21
DISCUSSION ................................................................................................................................... 23
Bacteria ..................................................................................................................................... 23
Nutrients.................................................................................................................................... 24
Chloride and Conductivity ......................................................................................................... 27
Dissolved Oxygen, Temperature, pH, and Total Suspended Solids .......................................... 28
Biological Assessment ............................................................................................................... 30
RECOMMENDATIONS ................................................................................................................... 31
LITERATURE AND DATA REFERENCED........................................................................................... 33
Appendix A. Stream Data from 1987 Project Vigilant .................................................................. 35

Fineout and Schoof’s Creek Monitoring Study 2013 Page 3
TABLES AND FIGURES
Table 1: Fineout Creek, Schoof’s Creek, and Walloon Lake Watersheds’ land cover in 2006. ...... 6
Table 2: Project CLEAR water quality data for three Walloon Lake tributaries (1977). ................. 7
Table 3: Project Vigilant water quality data for Schoof’s and Fineout Creeks (1987). .................. 7
Table 4: Bacteria concentrations in Fineout Creek. ..................................................................... 13
Table 5: Bacteria concentrations in Schoof’s Creek. .................................................................... 14
Table 6: Nutrient concentrations in Fineout Creek. ..................................................................... 15
Table 7: Nutrient concentrations in Schoof’s Creek. .................................................................... 15
Table 8: Chloride, conductivity, and total solids in Fineout Creek. .............................................. 17
Table 9: Chloride, conductivity, and total solids in Schoof’s Creek. ............................................. 18
Table 10: Dissolved oxygen, temperature, and pH in Fineout Creek. .......................................... 19
Table 11: Dissolved oxygen, temperature, and pH in Schoof’s Creek. ......................................... 19
Table 12: Discharge and loads from Fineout Creek. ..................................................................... 20
Table 13: Discharge and loads from Schoof’s Creek. ................................................................... 21
Table 14: Aquatic macroinvertebrate data from Fineout Creek. ................................................. 22
Table 15: Aquatic macroinvertebrate data from Schoof’s Creek. ................................................ 22
Table 16: Nutrient, chloride, and conductivity data from the CWQM program. ......................... 25
Table 17: Data from the Tip of the Mitt Volunteer Stream Monitoring program, 2005 to 2012. 30
Figure 1: Land cover 2006 in the Walloon Lake Watershed. .......................................................... 5
Figure 2: Fineout and Schoof’s Creeks monitoring study sites. ..................................................... 9

Fineout and Schoof’s Creek Monitoring Study 2013 Page 4
INTRODUCTION
Walloon Lake is a 4600-acre oligotrophic lake in the Northern Lower Peninsula of Michigan that
drains into Lake Michigan at Little Traverse Bay via the Bear River. The Walloon Lake
Association (WLA) and Walloon Lake Trust and Conservancy (WLTC) have worked for decades to
protect the lake and its watershed. In 2011, WLTC contracted with Tip of the Mitt Watershed
Council (TOMWC) to perform a comprehensive assessment of the watershed’s largest wetland
complexes and associated inlet tributaries, as well as a watershed-wide ecological evaluation of
individual properties. Based on recommendations from this assessment, WLA and WLTC again
contracted with TOMWC to conduct a water quality monitoring study of the two largest
tributaries of Walloon Lake: Fineout Creek (also known as South Arm Creek) and Schoof’s
Creeks. The Fineout and Schoof’s Creek Monitoring Study was carried out in 2012 and 2013. It
consisted of physical, chemical, and biological water quality monitoring at multiple sites in each
creek’s watershed. This report provides the results of monitoring activities, a discussion of
those results, and comparisons with water quality data from past studies.
Study Area
Fineout Creek is located in Evangeline and Melrose Townships of Charlevoix County at the
southern tip of Walloon Lake’s Foot Basin (Figure 1). The main branch flows from south to north
through extensive wetland complexes, crisscrossing M75 and flowing under Shadow Trails
before draining into Walloon Lake. The west branch of the creek originates in the vicinity of a
small lake encircled by wetlands and flows from west to east along Fineout Road. The main
branch drops over 70’ throughout 3 miles of channel length, whereas the west branch drops
approximately 80’ over the course of 1.25 miles.
Schoof’s Creek is located in Resort and Bear Creek Townships of Emmet County at the northern
tip of Walloon Lake’s North Arm (Figure 1). The main branch flows over 4 miles from north to
south, roughly following Resort Pike to Williams Road, where it then flows southeast through a
large wetland complex before draining into Walloon Lake. Another tributary of Schoof’s Creek,
which originates in the Little Traverse Conservancy Bubbling Spring Preserve at Intertown Road,
flows approximately 2 miles before it converges with the main branch to the south of Williams
Road. The main branch drop approximately 70’ throughout its length.
Fineout Creek and Schoof’s Creek, at 4,100 and 4,400 acres respectively, are the largest sub-
watersheds of the Walloon Lake Watershed. Land cover data from 2006 show a higher
percentage of both urban and agricultural land cover in the Schoof’s Creek Watershed as
compared to that of Fineout Creek and the larger Walloon Lake Watershed (Table 1). Fineout
and Schoof’s Creeks’ Watersheds also possess the largest wetland complexes (Figure 1).

Fineout and Schoof’s Creek Monitoring Study 2013 Page 5
Figure 1: Land cover 2006 in the Walloon Lake Watershed.

Fineout and Schoof’s Creek Monitoring Study 2013 Page 6
Table 1: Fineout Creek, Schoof’s Creek, and Walloon Lake Watersheds’ land cover in 2006.
Land Cover Type
Fineout
Creek
(acres)
Fineout
Creek
(percent)
Schoof's
Creek
(acres)
Schoof's
Creek
(percent)
Walloon
Lake
(acres)
Walloon
Lake
(percent)
Agriculture 643 15.68 2062 46.81 5835 21.99
Barren 0 0.00 35 0.81 48 0.18
Forested 1773 43.21 1045 23.72 10468 39.46
Grassland 684 16.68 257 5.83 1975 7.44
Scrub/Shrub 137 3.33 112 2.55 620 2.34
Urban 129 3.13 235 5.33 927 3.5
Water 40 0.98 1 0.02 4699 17.71
Wetland 697 16.98 657 14.93 1958 7.38
TOTAL 4103 100.00 4404 100.00 26531 100.00
Both Fineout and Schoof’s Creek are managed as cold-water trout streams by the Michigan
Department of Natural Resources. As of 2012, no information was available regarding specific
fish species in these streams (H. Seites-Hettinger, personal communication, 2012).
Prior Monitoring and Studies
TOMWC performed an extensive literature and data search as part of the Walloon Lake
Wetlands and Tributary Assessment (TOMWC 2012). Relevant findings include the Project
CLEAR Technical Report (Gold 1978) and Project Vigilant (Rodgers 1987).
Project CLEAR was undertaken by University of Michigan Biological Station researchers to
examine nutrient management in the Walloon Lake Watershed, which included water quality
monitoring for both Fineout and Schoof’s Creek. The results of nutrient and chloride monitoring
from Project CLEAR show levels that are within typical ranges for non-impacted, high quality
streams of Northern Michigan (Table 2).
Project Vigilant was a water quality monitoring study carried out by Limno-Tech Inc., a
consulting firm from Ann Arbor. Monitoring was performed near the mouths of Fineout and
Schoof’s Creek multiple times throughout 1986 and 1987. Averages and ranges for the
parameters monitored are presented in Table 3 (complete data set available in Appendix A).
Project Vigilant also included discharge (flow) measurements, which were collected multiple
times during 1986 and 1987 at five locations on Schoof’s Creek and two on Finout Creek. All
discharge data are included in Appendix A. The Project Vigilant report indicated that the
tributaries were found to have high quality water, but that phosphorus concentrations and

Fineout and Schoof’s Creek Monitoring Study 2013 Page 7
loads increased dramatically during wet weather events. Phosphorus concentrations were
found to reach levels up to ten times higher than typical for dry weather, and phosphorus loads
were approximately two times higher during wet weather.
Table 2: Project CLEAR water quality data for three Walloon Lake tributaries (1977).
Stream Name Location Date TP* (ppb)
NO3-N* (ppb)
NH3-N* (ppb)
Cl* (ppm)
Fineout Creek outlet 7/7/1977 32.0 13.0 16.0 3.1
Fineout Creek outlet 7/30/1977 21.0 42.0 27.0 4.2
Schoof's Creek outlet 5/5/1977 6.6 ND 8.6 3.4
Schoof's Creek outlet 7/7/1977 43.0 43.0 153.0 12.0
Skornia Creek (Lily Pad Bay) outlet 7/7/1977 27.0 40.0 17.0 3.6
*TP=total phosphorus, NO3-N=nitrate nitrogen, NH3-N=ammonia nitrogen, Cl=chloride, ppb=parts per
billion, ppm=parts per million.
Table 3: Project Vigilant water quality data for Schoof’s and Fineout Creeks (1987).
Parameter*
Average
(Schoof'sƗ)
Low
(Schoof'sƗ)
High
(Schoof'sƗ)
Average
(FineoutƗ)
Low
(FineoutƗ)
High
(FineoutƗ)
TP (ppb) 8.2 2.9 14.6 13.4 4.6 21.8
SRP (ppb) 2.1 1 5.2 4 1 15.5
TKN (ppb) 670 420 1100 546 350 800
NH3-N (ppb) 400 400 400 60 60 60
NO3-N (ppb) 60 60 60 320 320 320
Cl (ppm) 7.3 5 9.3 7.3 6 9
Alk (ppm) 217 166 252 174 144 220
Ca (ppm) 69 39 83.5 55 42 64
Fecal (#/100mL) 0 430 95 72 0 300
Chl-a (ppb) 0.49 0.49 0.49 ND ND ND ƗData collected from locations near the mouth of both creeks.
*TP=total phosphorus, SRP=soluble reactive phosphorus, TKN=total Kjeldahl nitrogen, NH3-N=ammonia
nitrogen, NO3-N=nitrate nitrogen, Cl=chloride, Alk=alkalinity, Ca=calcium, Fecal=fecal coliforms, Chl-
a=chlorophyll-a, ppb=parts per billion, ppm=parts per million, #/100mL=number of organisms per 100
mLs.

Fineout and Schoof’s Creek Monitoring Study 2013 Page 8
METHODS
Physical and Chemical Monitoring
Water quality and discharge data were collected from four sites on Fineout Creek and five sites
on Schoof’s Creek (Figure 2). Fineout Creek sites are:
FIN001: the furthest upstream road crossing on M75 near 01658 M75,
FIN002: the furthest downstream site on M75,
FIN003: the Clute Road crossing near the intersection of Shadow Trails,
FIN004: the mouth at Walloon Lake.
Identification labels and locations for the Schoof’s Creek sites are:
SHF001: the Intertown Road crossing,
SHF002: the Little Traverse Conservancy Bubbling Spring Preserve,
SHF003: the mid-stream site on Resort Pike (2939 Resort Pike),
SHF004: the Williams Road crossing,
SHF005: the mouth at Walloon Lake.
Four sites were monitored in the fall of 2012 (Williams Rd and mouth on Schoof’s; M75
upstream and mouth on Fineout). The Bubbling Spring Preserve was monitored in February of
2013. Eight sites (all but Bubbling Spring) were monitored in the spring and summer of 2013. All
sample events, except for the February event, occurred in wet weather conditions.
At each site, surface grab samples were collected in the middle of the stream with three
separate bottles for chemical, suspended solids, and bacteriological analyses. Acid-rinsed 250
mL (milliliters) Nalgene bottles were used to collect water samples for chemical analysis and
were rinsed three times with stream water (both bottle and cap) prior to collecting the sample.
Clean 1000 mL Nalgene bottles were used to collect water samples for total suspended solids
measurements, which were also rinsed with stream water at the site prior to collecting the
water sample. Sterilized bottles acquired from the Emmet County Health Department were

Fineout and Schoof’s Creek Monitoring Study 2013 Page 9
Figure 2: Fineout and Schoof’s Creeks monitoring study sites.

Fineout and Schoof’s Creek Monitoring Study 2013 Page 10
used to collect water samples for bacteriological analysis, filling once and capping per
instructions provided by the Health Department. All water samples were immediately placed in
a cooler containing ice.
Water samples collected for bacteriological analysis were delivered directly to the Health
Department Laboratory in Gaylord, where they were analyzed to determine the number of
Escherichia coli (E. coli) per 100 mLs. Water samples collected for chemical analysis were frozen
upon returning to the Watershed Council office while samples collected for total suspended
solids measurements were refrigerated; both were transported to the University of Michigan
Biological Station (UMBS) within a week of collecting the samples. The UMBS laboratory
analyzed samples to determine concentrations of orthophosphates (PO4-), total phosphorus
(TP), nitrate-nitrogen (NO3-), total nitrogen (TN), dissolved organic carbon (DOC), chloride (CL
-),
and total suspended solids (TSS).
Physical parameters, including dissolved oxygen, specific conductivity, pH, and water
temperature, were measured using a Hydrolab MiniSonde®. The MiniSonde® was calibrated
prior to field work using methods detailed in the manual; dissolved oxygen was calibrated with
the percent saturation method using current barometric pressure; specific conductivity was
calibrated using a standard solution of 447 microSiemens/cm; and pH was calibrated using
standard buffer solutions of 7 and 10 units pH. At each monitoring site the MiniSonde® was
placed in the water in the middle of the stream and allowed to stabilize for several minutes
before saving readings to the memory in the Surveyor4a handheld unit. Readings from the
MiniSonde® were also recorded on a field datasheet. Upon returning to the office, data were
transferred from the Surveyor4a to a computer and consolidated in a Microsoft Excel®
workbook.
After collecting water samples and physical parameter data, stream discharge was measured at
each site. The stream channel in the immediate area was examined to determine the best
location for measuring discharge. The ideal area was without upstream or downstream
obstructions (e.g., woody debris, aquatic plants), without undercut banks, and with at least two
inches of water depth. A transect for measuring discharge was established by affixing a nylon

Fineout and Schoof’s Creek Monitoring Study 2013 Page 11
measuring tape to stakes on each side of the stream and suspending the tape across the stream
channel perpendicular to the direction of flow. A Marsh McBirney digital current meter and
wading rod were used to measure flow velocity and water depth at intervals across the stream
channel. Intervals across the transect were selected based on changes in depth and current
velocity. Prior to recording flow velocity, the velocity sensor of the current meter was adjusted
to six tenths the depth at each location across the channel. All data were recorded on a field
datasheet and later entered into a Microsoft Excel® workbook.
Biological Monitoring
At all sample sites, an assessment of the aquatic macroinvertebrate community was conducted
using methods from the Tip of the Mitt Volunteer Stream Monitoring Program. The mouths of
both streams - Schoof’s Creek at Williams Road and Fineout Creek at the M75 upstream site -
were sampled in the October of 2012. The Bubbling Spring Preserve site was sampled in
February of 2013 and all other sites were sampled in July of 2013.
The assessment consisted of a thorough search at each site to document the aquatic
macroinvertebrate community composition, which entailed two to three hours of sampling by
experienced field staff. D-frame nets were used to sample all available habitat types in a 300’
stream reach, including riffles, runs, pools, stream margins, undercut banks, aquatic vegetation,
overhanging vegetation, leaf packs, and cobble. Aquatic macroinvertebrate specimens
representing the total diversity were preserved at the site in 70% ethanol. Specimens were
identified in the laboratory to the lowest taxonomic level possibleusing microscopes and
taxonomic keys (usually to the family level).
Biological data from sample sites were used to assess stream ecosystem health in terms of
aquatic macroinvertebrate diversity using three biotic indices: total taxa, EPT taxa, and sensitive
taxa. As implied by the name, the total taxa index is the summation of the total number of
macroinvertebrate families found at a site. The EPT taxa index is the sum of taxa belonging to
Ephemeroptera, Plecoptera, and Tricoptera (mayflies, stoneflies, and caddisflies, respectively),
which are considered the most pollution-sensitive insect orders. The sensitive taxa index is the
Fineout and Schoof’s Creek Monitoring Study 2013 Page 12
sum of taxa at the site rated as 0, 1, or 2 in Hilsenhoff’s family-level biotic index, which rates
aquatic macroinvertebrate sensitivity to nonpoint source pollution (Hilsenhoff 1988).
Pollutant loading calculations
Pollutant loadings were calculated for each sample event at all sites using discharge and
pollutant concentration values. The total stream discharge was calculated by multiplying the
width, average depth and average current velocity for each transect section, and then summing
the calculated discharge of all sections. Pollutant loads were calculated by multiplying discharge
(in cubic meters per second), the pollutant’s measured concentration, and a conversion factor
(190.48 for parameters measured in parts per million or 0.1905 for those in parts per billion).
Fineout and Schoof’s Creek Monitoring Study 2013 Page 13
RESULTS
Bacteria
In terms of regulation for small streams, Rule 62 (R 323.1062) of DEQ Part 4 Water Quality
Standards states that “All waters of the state protected for partial body contact recreation
shall not contain more than a maximum of 1000 E. coli per 100 mLs. Compliance shall be based
on the geometric mean of 3 or more samples, taken during the same sampling event, at
representative locations within a defined sampling area.” Pertinent to sample sites near
Walloon Lake where full-body contact does occur, Rule 62 states that “All waters of the state
protected for total body contact recreation shall not contain more than 130 Escherichia coli (E.
coli) per 100 mLs, as a 30-day geometric mean” and that, “At no time shall the waters of the
state protected for total body contact recreation contain more than a maximum of 300 E. coli
per 100 mLs.”
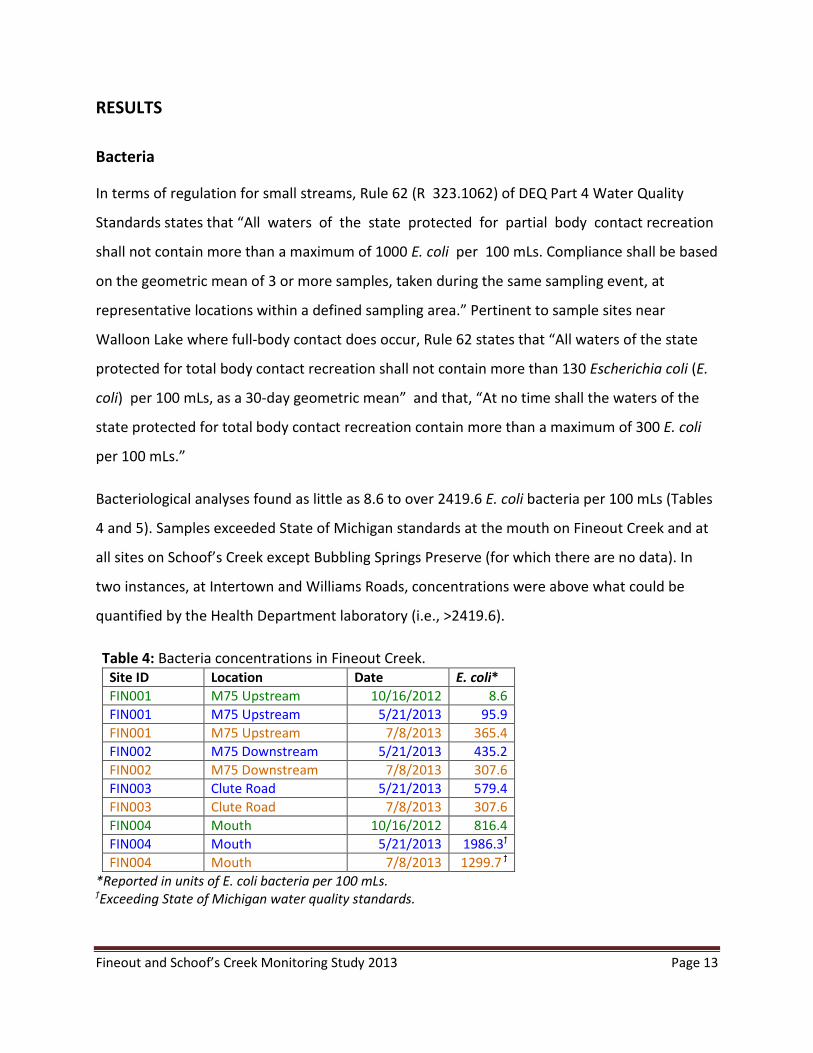
Bacteriological analyses found as little as 8.6 to over 2419.6 E. coli bacteria per 100 mLs (Tables
4 and 5). Samples exceeded State of Michigan standards at the mouth on Fineout Creek and at
all sites on Schoof’s Creek except Bubbling Springs Preserve (for which there are no data). In
two instances, at Intertown and Williams Roads, concentrations were above what could be
quantified by the Health Department laboratory (i.e., >2419.6).
Table 4: Bacteria concentrations in Fineout Creek.
Site ID Location Date E. coli*
FIN001 M75 Upstream 10/16/2012 8.6
FIN001 M75 Upstream 5/21/2013 95.9
FIN001 M75 Upstream 7/8/2013 365.4
FIN002 M75 Downstream 5/21/2013 435.2
FIN002 M75 Downstream 7/8/2013 307.6
FIN003 Clute Road 5/21/2013 579.4
FIN003 Clute Road 7/8/2013 307.6
FIN004 Mouth 10/16/2012 816.4
FIN004 Mouth 5/21/2013 1986.3ϯ
FIN004 Mouth 7/8/2013 1299.7 ϯ
*Reported in units of E. coli bacteria per 100 mLs. ϯExceeding State of Michigan water quality standards.

Fineout and Schoof’s Creek Monitoring Study 2013 Page 14
Table 5: Bacteria concentrations in Schoof’s Creek.
Site ID Location Date E. coli*
SHF001 Intertown Rd 5/21/2013 135.4
SHF001 Intertown Rd 7/8/2013 >2419.6ϯ
SHF002 Bubbling Spring 2/16/2013 No data
SHF003 Resort Pike 5/21/2013 167.0
SHF003 Resort Pike 7/8/2013 1553.1ϯ
SHF004 Williams Rd 10/17/2012 248.1
SHF004 Williams Rd 5/21/2013 613.1
SHF004 Williams Rd 7/8/2013 >2416.6ϯ
SHF005 Mouth 10/17/2012 101.7
SHF005 Mouth 5/21/2013 1299.7ϯ
SHF005 Mouth 7/8/2013 1046.2ϯ
*Reported in units of E. coli bacteria per 100 mLs. ϯExceeding State of Michigan water quality standards.
Nutrients
Total phosphorus, which is a measure of all phosphorus types in the water sample, was found in
low concentrations in the Fineout and Schoof’s Creeks; all readings were less than 30 µg/L
(micrograms per liter or parts per billion) and nearly half were less than 10 µg/L (Table 6 and 7).
The highest total phosphorus concentrations occurred at the downstream site of M75 on
Fineout Creek and at the Resort Pike site on Schoof’s Creek. Soluble reactive phosphorus, the
portion of total phosphorus that is readily available for uptake by algae and higher aquatic
plants, was found on average to be 44% of the total phosphorus in Fineout Creek and 51% in
Schoof’s Creek.
DEQ Part 4 Water Quality Standards do not include a numerical standard for nutrient
concentration limits for surface waters. Regulation for surface waters is limited to the following
narrative standard from Rule 60 (323.1060): “nutrients shall be limited to the extent necessary
to prevent stimulation of growths of aquatic rooted, attached, suspended, and floating plants,
fungi or bacteria which are or may become injurious to the designated uses of the waters of the
state.” A total phosphorus concentration of 12 µg/L or less for streams in the Northern
Michigan ecoregion is considered the reference condition by the United States Environmental
Protection Agency (USEPA) “because it is likely associated with minimally impacted conditions,

Fineout and Schoof’s Creek Monitoring Study 2013 Page 15
will be protective of designated uses, and provides management flexibility” (USEPA, 2001).
Total phosphorus concentrations were found in excess of the 12 µg/L reference condition six
times on Fineout Creek and five times on Schoof’s Creek.
Table 6: Nutrient concentrations in Fineout Creek.
Site ID Location Date SRP* TP* NO3-N* TN* DOC*
FIN001 M75 Upstream 10/16/2012 2.6 5.1 181 393 7.20
FIN001 M75 Upstream 5/21/2013 1.6 4.7 64 337 12.21
FIN001 M75 Upstream 7/8/2013 3.0 4.5 154 340 5.14
FIN002 M75 Downstream 5/21/2013 1.3 7.7 3 390 16.95
FIN002 M75 Downstream 7/8/2013 16.4 26.1 8 400 12.78
FIN003 Clute Road 5/21/2013 2.9 13.1 15 479 18.32
FIN003 Clute Road 7/8/2013 5.2 7.4 46 197 5.11
FIN004 Mouth 10/16/2012 5.9 18.0 1 410 16.40
FIN004 Mouth 5/21/2013 2.6 14.0 5 449 12.21
FIN004 Mouth 7/8/2013 13.7 21.1 92 464 10.11
Average Mouth 7.4 17.7 33 441 12.91
Average All sites 5.5 12.2 57 386 11.64
*SRP=soluble reactive phosphorus, TP=total phosphorus, NO3-N=nitrate nitrogen, TN=total nitrogen,
DOC=dissolved organic carbon. All data reported in µg/L (micrograms per liter or parts per billion).
Table 7: Nutrient concentrations in Schoof’s Creek.
Site ID Location Date SRP* TP* NO3-N* TN* DOC*
SHF001 Intertown Rd 5/21/2013 2.5 14.3 88 531 10.46
SHF001 Intertown Rd 7/8/2013 7.4 11.4 488 776 8.22
SHF002 Bubbling Spring 2/16/2013 1.4 18.1 2119 2816 1.06
SHF003 Resort Pike 5/21/2013 15.2 24.5 353 732 10.46
SHF003 Resort Pike 7/8/2013 20.3 23.5 390 690 8.91
SHF004 Williams Rd 10/17/2012 6.2 8.3 1156 1482 7.10
SHF004 Williams Rd 5/21/2013 3.9 14.2 478 822 10.08
SHF004 Williams Rd 7/8/2013 6.6 8.0 1879 2390 4.36
SHF005 Mouth 10/17/2012 4.0 9.9 272 703 10.30
SHF005 Mouth 5/21/2013 1.8 7.7 681 1018 5.67
SHF005 Mouth 7/8/2013 7.5 9.6 1315 1652 4.70
Average Mouth 4.4 9.1 756 1124 6.89
Average All sites 7.0 13.6 838 982 7.39
*SRP=soluble reactive phosphorus, TP=total phosphorus, NO3-N=nitrate nitrogen, TN=total nitrogen,
DOC=dissolved organic carbon. All data reported in µg/L (micrograms per liter or parts per billion).
Fineout and Schoof’s Creek Monitoring Study 2013 Page 16
Total nitrogen is a measure of all nitrogen types in a water sample. The USEPA total nitrogen
reference condition of 440 ppb for minimally impacted conditions for Northern Michigan
streams was exceeded in five samples (USEPA, 2001). Total nitrogen concentrations were less
than 500 µg/L in Fineout Creek, whereas concentrations in Schoof’s Creek reached 2816 µg/L
(Table 6 and 7). The highest total nitrogen concentrations were found on Schoof’s Creek at the
Bubbling Spring Preserve and at Williams Road. Nitrate-nitrogen is the water soluble form that
is readily available for uptake by plants, which, on average, accounted for 16.1% of total
nitrogen in Fineout Creek and 60% in Schoof’s Creek.
Organic matter in lakes and streams originating from sources throughout the watershed can be
measured by analyzing water samples for dissolved organic carbon (DOC). DOC concentrations
in streams range from less than one to 50 mg/L (Mulholland, 2003) and from studies of other
Midwest streams have been found in the range of 1-18 mg/L (Royer and David 2003, and Volk
et. al 2002). DOC concentrations documented at all sites in this study fell within this range
(Tables 6 and 7).
Chloride, Conductivity, and Total Solids
Chloride, a component of salt, is naturally present at low levels in Northern Michigan surface
waters due to the marine origin of the underlying bedrock (typically < 5 mg/L). Although
Michigan has not set limits for chloride in surface waters, the USEPA recommends that 230
mg/L be established for chronic toxicity and 860 mg/L for acute toxicity (USEPA, 2012).
Although current chloride levels in Northern Michigan are generally far below the USEPA
toxicity thresholds, increases are indicative of other pollutants reaching our waterways (e.g.,
automotive fluids from roads; nutrients/bacteria from septic systems). Chloride concentrations
in Fineout and Schoof’s Creek were well below toxicity thresholds recommended by the USEPA.
The range of chloride concentrations was similar in both creeks, though on average higher in
Schoof’s Creek (Table 8).
Conductivity is a measure of the ability of water to conduct an electric current resulting from the
concentration of charged particles (ions) dissolved in the water. Conductivity is not addressed in

Fineout and Schoof’s Creek Monitoring Study 2013 Page 17
DEQ Part 4 Water Quality Standards, though Rule 51 (323.1051) provides a framework for
regulating total dissolved solid (TDS) concentrations from point source discharge. TDS in mg/L
can be estimated from specific conductivity readings by using the widely applied multiplication
factor of 0.67. Estimated TDS concentrations for conductivity measurements from all sites on
Fineout and Schoof’s Creeks were below the Rule 51 TDS maximum of 750 mg/L. On average,
conductivity readings were highest on Schoof’s Creek (Table 8).
Total suspended solids is a measure of the amount of sediment and other particles in water
bodies, which is done by filtering, drying, and weighing the particles in a given volume of water.
State of Michigan water quality standards do not have numerical limits for suspended solids,
but rather a narrative standard that states “that waters of the state shall not have any of the
following unnatural physical properties in quantities which are or may become injurious to any
designated use: turbidity, color, oil films, floating solids, foam, settleable solids, suspended
solids, and deposits.” Water is generally considered to be clear when total suspended solids
measure 20 mg/L or less, cloudy between 40 and 80 mg/L, and dirty when over 150 mg/L. Most
of the total suspended solid measurements from Fineout and Schoof’s Creeks were less than 20
mg/L, indicating clear water (Table 8). There were three readings on Schoof’s Creek above 40
mg/L, but none above 150 mg/L.
Table 8: Chloride, conductivity, and total solids in Fineout Creek.
Site ID Location Date Chloride* Conductivity*
Total
Dissolved
Solids*
Total
Suspended
Solids*
FIN001 M75 Upstream 10/16/2012 11.0 311.0 208.4 1.0
FIN001 M75 Upstream 5/21/2013 11.1 269.0 180.3 8.4
FIN001 M75 Upstream 7/8/2013 30.0 468.2 313.7 18.2
FIN002 M75 Downstream 5/21/2013 13.8 268.8 180.1 1.3
FIN002 M75 Downstream 7/8/2013 17.1 521.8 349.6 3.2
FIN003 Clute Road 5/21/2013 4.5 202.0 135.3 10.3
FIN003 Clute Road 7/8/2013 26.9 341.8 229.0 27.1
FIN004 Mouth 10/16/2012 13.0 227.0 152.1 1.2
FIN004 Mouth 5/21/2013 13.4 267.3 179.1 3.9
FIN004 Mouth 7/8/2013 24.8 480.6 322.0 2.8
Average Mouth 17.1 325.0 217.7 2.6
Average All sites 16.6 335.7 225.0 7.7

Fineout and Schoof’s Creek Monitoring Study 2013 Page 18
*Chloride, total dissolved solids, and total suspended solids reported in mg/L (milligrams per liter or parts
per million), conductivity in microsiemens. Total dissolved solids estimated from conductivity using
coefficient of 0.67.
Table 9: Chloride, conductivity, and total solids in Schoof’s Creek.
Site ID Location Date Chloride* Conductivity*
Total
Dissolved
Solids*
Total
Suspended
Solids*
SHF001 Intertown Rd 5/21/2013 7.4 363.0 243.2 2.4
SHF001 Intertown Rd 7/8/2013 33.5 666.0 446.2 55.7
SHF002 Bubbling Spring 2/16/2013 20.2 475.0 No data No data
SHF003 Resort Pike 5/21/2013 27.4 470.8 315.4 2.4
SHF003 Resort Pike 7/8/2013 41.8 700.1 469.0 44.9
SHF004 Williams Rd 10/17/2012 27.0 506.5 339.4 4.0
SHF004 Williams Rd 5/21/2013 24.3 456.7 306.0 29.5
SHF004 Williams Rd 7/8/2013 23.9 630.0 422.1 101.9
SHF005 Mouth 10/17/2012 8.7 325.5 218.1 1.0
SHF005 Mouth 5/21/2013 13.5 388.8 260.5 2.3
SHF005 Mouth 7/8/2013 24.6 547.5 366.8 4.1
Average Mouth 15.6 420.6 281.8 2.5
Average All sites 22.9 502.7 338.7 24.8
*Chloride, total dissolved solids, and total suspended solids reported in mg/L (milligrams per liter or parts
per million), conductivity in microsiemens. Total dissolved solids estimated from conductivity using
coefficient of 0.67.
Dissolved Oxygen, Temperature, and pH
Dissolved oxygen concentrations in the Fineout and Schoof’s Creeks ranged from 0.15 to 13.05
mg/L (Table 10 and 11). The DEQ Part 4 Water Quality Standards minimum dissolved oxygen
concentration for sustaining a cold-water fishery is 7 mg/L. Levels were below the 7 mg/L
standard on five occasions on Fineout Creek and three times on Schoof’s Creek.
Water temperatures ranged from 7.18° to 21.26° Celsius and were, on average, higher in
Fineout Creek (Table 10 and 11). According to DEQ Part 4 Water Quality Standards, monthly
maximum temperatures for streams supporting cold-water fish are set at 65° Fahrenheit (18.3°
Celsius) for May, 68° Fahrenheit (20.0° Celsius) for July, and 56° Fahrenheit (13.3° Celsius) for
October. Water temperatures exceeded State Water Quality Standards at two sites on Fineout
Creek and at one site on Schoof’s Creek.

Fineout and Schoof’s Creek Monitoring Study 2013 Page 19
Hydrogen ion concentration, expressed as pH, ranged from 7.47 to 8.21 in Fineout and Schoof’s
Creeks (Table 10 and 11). All pH readings fell within the range of 6.5 to 9.0 required for all
Michigan surface waters according to DEQ Part 4 Water Quality Standards, Rule 53 (323.1053).
Table 10: Dissolved oxygen, temperature, and pH in Fineout Creek.
Site ID Location Date
Dissolved
Oxygen* Temperature* pH*
FIN001 M75 Upstream 10/16/2012 9.54 8.71 7.84
FIN001 M75 Upstream 5/21/2013 7.41 13.13 7.77
FIN001 M75 Upstream 7/8/2013 8.17 14.86 8.05
FIN002 M75 Downstream 5/21/2013 4.57ϯ 18.95
ϯ 7.52
FIN002 M75 Downstream 7/8/2013 0.15 ϯ 20.89
ϯ 7.47
FIN003 Clute Road 5/21/2013 7.32 18.08 7.73
FIN003 Clute Road 7/8/2013 8.26 18.75 8.21
FIN004 Mouth 10/16/2012 6.28 ϯ 7.18 7.76
FIN004 Mouth 5/21/2013 5.42 ϯ 20.31
ϯ 7.77
FIN004 Mouth 7/8/2013 4.03 ϯ 19.93 7.79
Average All sites 6.11 16.08 7.79
*Temperature in °Celsius, dissolved oxygen in mg/L or parts per million. ϯ Non-conforming with State of Michigan water quality standards.
Table 11: Dissolved oxygen, temperature, and pH in Schoof’s Creek.
Site ID Location Date
Dissolved
Oxygen* Temperature* pH*
SHF001 Intertown Rd 5/21/2013 9.93 7.82 8.09
SHF001 Intertown Rd 7/8/2013 5.94 ϯ 16.77 7.64
SHF002 Bubbling Spring 2/16/2013 13.05 8.91 8.09
SHF003 Resort Pike 5/21/2013 9.11 8.84 8.13
SHF003 Resort Pike 7/8/2013 6.02 ϯ 16.91 7.89
SHF004 Williams Rd 10/17/2012 9.20 7.72 7.75
SHF004 Williams Rd 5/21/2013 9.06 8.75 8.10
SHF004 Williams Rd 7/8/2013 7.75 15.49 7.96
SHF005 Mouth 10/17/2012 9.10 8.16 7.70
SHF005 Mouth 5/21/2013 9.80 9.69 8.20
SHF005 Mouth 7/8/2013 5.99 ϯ 21.26
ϯ 7.91
Average All sites 8.63 11.85 7.95
*Temperature in °Celsius, dissolved oxygen in mg/L or parts per million. ϯ Non-conforming with State of Michigan water quality standards.

Fineout and Schoof’s Creek Monitoring Study 2013 Page 20
Discharge and Loads
Discharge was accurately measured at the mouths of the creeks during two monitoring events.
Based on the average of the two discharge measurements, Fineout Creek discharged 8.21 cubic
feet per second (cfs) into Walloon Lake while Schoof’s Creek discharged 16.98 cfs (Table 12 and
13). As would be expected, discharge generally increased in a downstream direction, though
there was a slight (<0.05 cfs) decrease between upstream and downstream sites on three
occasions.
Total phosphorus loads coming into Walloon Lake at the mouths of Fineout and Schoof’s Creeks
were approximately the same, whereas nitrogen loads were much higher in Schoof’s Creek
(Table 12 and 13). Nutrient loads increased steadily from upstream to downstream during all
sample events on Fineout Creek. In Schoof’s Creek, there were instances where phosphorus or
nitrogen loads decreased between sites in a downstream direction.
The total suspended solid loads discharged into Walloon Lake at the creek mouths were on
average higher from Schoof’s than Fineout (Table 12 and 13). There was considerable variability
in terms of suspended solid load accrual or loss between sites in a downstream direction.
Table 12: Discharge and loads from Fineout Creek.
Site ID Location Date
Discharge*
(cfs)
TP Load*
(lbs/day)
TN Load*
(lbs/day)
TSS Load*
(lbs/day)
FIN001 M75 Upstream 10/16/2012 0.4889 0.013 1.04 2.64
FIN001 M75 Upstream 5/21/2013 1.7107 0.043 3.11 77.51
FIN001 M75 Upstream 7/8/2013 0.8432 0.020 1.55 82.78
FIN002 M75 Downstream 5/21/2013 8.9210 0.371 18.77 62.55
FIN002 M75 Downstream 7/8/2013 0.7983 0.112 1.72 13.78
FIN003 Clute Road 5/21/2013 0.9954 0.070 2.57 55.27
FIN003 Clute Road 7/8/2013 0.3591 0.014 0.38 52.49
FIN004 Mouth 10/16/2012 5.3261 0.517 11.78 34.47
FIN004 Mouth 5/21/2013 11.0984 0.838 26.88 233.46
FIN004 Mouth 7/8/2013 1.4703 0.167 3.68 22.21
Average Mouth (all events) 5.96 0.51 14.11 96.71
Average Mouth (1st
two events) ϯ 8.21 0.68 19.33 133.97
*cfs=cubic feet per second, TP=total phosphorus, TN=total nitrogen, TSS=total suspended solids. ϯAveraged for first two events to facilitate comparisons with Schoof’s Creek.

Fineout and Schoof’s Creek Monitoring Study 2013 Page 21
Table 13: Discharge and loads from Schoof’s Creek.
Site ID Location Date
Discharge*
(cfs)
TP Load*
(lbs/day)
TN Load*
(lbs/day)
TSS Load*
(lbs/day)
SHF001 Intertown Rd 5/21/2013 1.7173 0.132 4.92 22.23
SHF001 Intertown Rd 7/8/2013 0.0252 0.002 0.11 7.56
SHF002 Bubbling Spring 2/16/2013 0.0447 0.004 0.68 No data
SHF003 Resort Pike 5/21/2013 3.7483 0.495 14.80 48.52
SHF003 Resort Pike 7/8/2013 0.1033 0.013 0.38 25.01
SHF004 Williams Rd 10/17/2012 1.1303 0.051 9.04 24.39
SHF004 Williams Rd 5/21/2013 3.7108 0.284 16.45 590.46
SHF004 Williams Rd 7/8/2013 0.5886 0.025 7.59 323.49
SHF005 Mouth 10/17/2012 10.2701 0.548 38.94 55.39
SHF005 Mouth 5/21/2013 23.6910 0.984 130.08 293.90
SHF005 Mouth 7/8/2013 NDϯ ND
ϯ ND
ϯ ND
ϯ
Average At mouth 16.98 0.77 84.51 174.65
*cfs=cubic feet per second, TP=total phosphorus, TN=total nitrogen, TSS=total suspended solids, ND=no data. ϯDue to slow flow and south wind pushing lake water into creek mouth, flow velocities were undetectable at most
stations and therefore, discharge and loading data considered invalid.
Aquatic Macroinvertebrates
In general, the total diversity of the aquatic macroinvertebrate community in Fineout Creek
increased in a downstream direction while sensitive taxa diversity decreased. In Fineout Creek,
28 taxa were found at the mouth and only 18 found at the upstream site on M75 (Table 14).
Conversely, EPT and sensitive taxa were much higher upstream than at the mouth. Only two
EPT taxa and no sensitive taxa were found where a small tributary stream crosses M75 and
flows into Fineout Creek between upstream and downstream sites on M75.
Biological data from Schoof’s Creek also show an increase in total diversity moving
downstream, with less than 20 taxa found at the headwater sites (i.e., Bubbling Spring Preserve
and Intertown Road) while over 20 taxa were found at the downstream sites (Table 15).
Sensitive taxa were found in higher numbers in the headwaters than at the mouth. However,
both EPT and sensitive taxa diversity were found to be as high or higher at Williams Road than
at upstream sites.

Fineout and Schoof’s Creek Monitoring Study 2013 Page 22
Table 14: Aquatic macroinvertebrate data from Fineout Creek.
Sample Site Date Total Taxa EPT Taxa Sensitive Taxa
M75, upstream 10/17/2012 18 9 4
M75, midstream tributaryϯ 7/1/2013 21 2 0
Clute Road 7/1/2013 19 6 3
Mouth 10/17/2012 28 3 1
*Total Taxa=total number of taxa found at the site, EPT Taxa=number of taxa found at site belonging to
Ephemeroptera, Plecoptera, and Trichoptera insect orders; Sensitive Taxa=number of taxa rated as 0, 1,
or 2 in Hilsenhoff’s family-level biotic index. ϯthe midstream tributary on M75 was mistakenly sampled on 7/1/2013 instead of the downstream M75
site, so there is no biological data for the latter.
Table 15: Aquatic macroinvertebrate data from Schoof’s Creek.
Sample Site Date Total Taxa EPT Taxa Sensitive Taxa
Bubbling Spring Preserve 2/16/2013 13 8 5
Intertown Rd 6/11/2013 17 3 2
Resort Pike 6/11/2013 23 7 2
Williams Rd 10/17/2012 25 9 5
Mouth, Walloon Lake 10/17/2012 23 4 1
*Total Taxa=total number of taxa found at the site, EPT Taxa=number of taxa found at site belonging to
Ephemeroptera, Plecoptera, and Trichoptera insect orders; Sensitive Taxa=number of taxa rated as 0, 1,
or 2 in Hilsenhoff’s family-level biotic index.
Fineout and Schoof’s Creek Monitoring Study 2013 Page 23
DISCUSSION
Bacteria
E. coli is a species of fecal coliform bacteria that is specific to fecal material from humans and
other warm-blooded animals. E. coli is commonly used to monitor surface waters because it is
considered a good indicator of health risk from body contact in recreational waters.
Bacteria concentrations exceeded State of Michigan partial-body contact limits (1000 E. coli per
100 mLs) at four sites on Schoof’s Creek during the July 8, 2013 sample event. Although field
notes indicate that it did rain during the morning, discharge measurements at all sites on
Schoof’s Creek on July 8th
were lower than during other sample periods. There are a variety of
circumstances that could explain the high concentrations throughout the stream system on July
8th
. The most probable explanations are: 1) the July 8th
sampling event captured high bacteria
concentrations associated with the first flush of a storm event; 2) elevated bacteria
concentrations typical during base-flow were diluted during the other sampling events; or 3)
the high bacteria concentrations were caused by poor waste management practices (e.g.,
manure spilling from a storage lagoon, manure washing directly into the creek, or livestock
being allowed access to the creek).
The longitudinal patterns in bacteria concentrations from headwater sites to the creek mouths
was probably the result of seasonal differences in water temperature. Research shows that
water temperature may be the most important factor in in predicting fecal coliform survival and
that survival of E. coli is negatively correlated with increasing water temperature (Faust et al,
1975). This provides an explanation for the steady increase in E. coli concentrations in a
downstream direction in both creeks during the cool weather of May, as compared to the
decreases that occurred between some sample sites during the warmer summer weather of
July.
Five of the six samples collected at the mouths of the two creeks exceeded State of Michigan
full-body contact limits (300 E. coli per 100 mLs). Although the samples were collected at
stream sites regulated for partial-body contact limits, there are potential threats to public
Fineout and Schoof’s Creek Monitoring Study 2013 Page 24
health due to the proximity of the sample sites to swimming areas in the receiving waters of
Walloon Lake.
Nutrients
Nutrients are necessary to sustain a healthy aquatic ecosystem. However, elevated levels,
particularly phosphorus, can result in problematic algae and plant growth. An increase in algal
blooms has the potential to become a recreational nuisance due to algal mats and scum that
form on the lake’s surface. Additionally, some species produce toxins that can threaten public
health, including hepatotoxins (toxins that cause liver damage) and neurotoxins (toxins that
affect the nervous system). Increased abundance of aquatic macrophytes (higher or vascular
plants) can become a nuisance to recreation in shallow areas (typically less than 20 feet of
depth). In addition, excess growth of both macrophytes and algae has the potential to degrade
water quality by depleting the ecosystem’s dissolved oxygen stores. Plants compete with other
organisms for a limited oxygen supply during nighttime respiration and, furthermore, the
decomposition of dead algae and plant material has the potential to deplete dissolved oxygen
supplies due to the aerobic activity of decomposers, particularly in the deeper waters of
stratified lakes.
Total phosphorus increased in a downstream direction in Fineout Creek, though concentrations
remained relatively low at the mouth (<=21 ug/l, Table 6). The increase was probably a result of
allochthonous inputs as opposed to anthropogenic sources considering the sparse
residential/urban and limited agricultural land cover in the watershed (Table 1). Uptake by soils
and plants in the expansive wetlands buffer between agricultural or residential/urban areas and
the creek probably contributed to the relatively low phosphorus concentrations in the creek
(Figure 1).
Phosphorus concentrations increased between the first two sites in Schoof’s Creek (from
Intertown Road to Resort Pike) and then decreased markedly downstream of Resort Pike (Table
7). Total phosphorus loads also decreased during one sample event between Resort Pike and
Williams Road (Table 13). The observed decreases in phosphorus could be the result of uptake
Fineout and Schoof’s Creek Monitoring Study 2013 Page 25
by algae and higher aquatic plants living in the creeks since phosphorus was consistently found
to be the limiting nutrient (N:P ratio > 16:1).
Phosphorus concentrations at the mouths of both streams varied little from findings in the
1987 Project Vigilant study (Tables 3, 6, and 7) and were slightly lower than values reported in
the 1977 Project Clear data. Relative to Tip of the Mitt Watershed Council’s Comprehensive
Water Quality Monitoring (CWQM) program river data, phosphorus concentrations in the
creeks were high. However, this was not surprising as a number of the rivers monitored in the
CWQM program drain large oligotrophic lakes that naturally possess low nutrient levels (Table
16). Considering total phosphorus concentrations at the creek mouths were within or just
slightly above the range of what has been found in the largely nutrient-poor rivers monitored in
the CWQM program, it is unlikely that phosphorus from the creeks will negatively impact the
lake ecosystem.
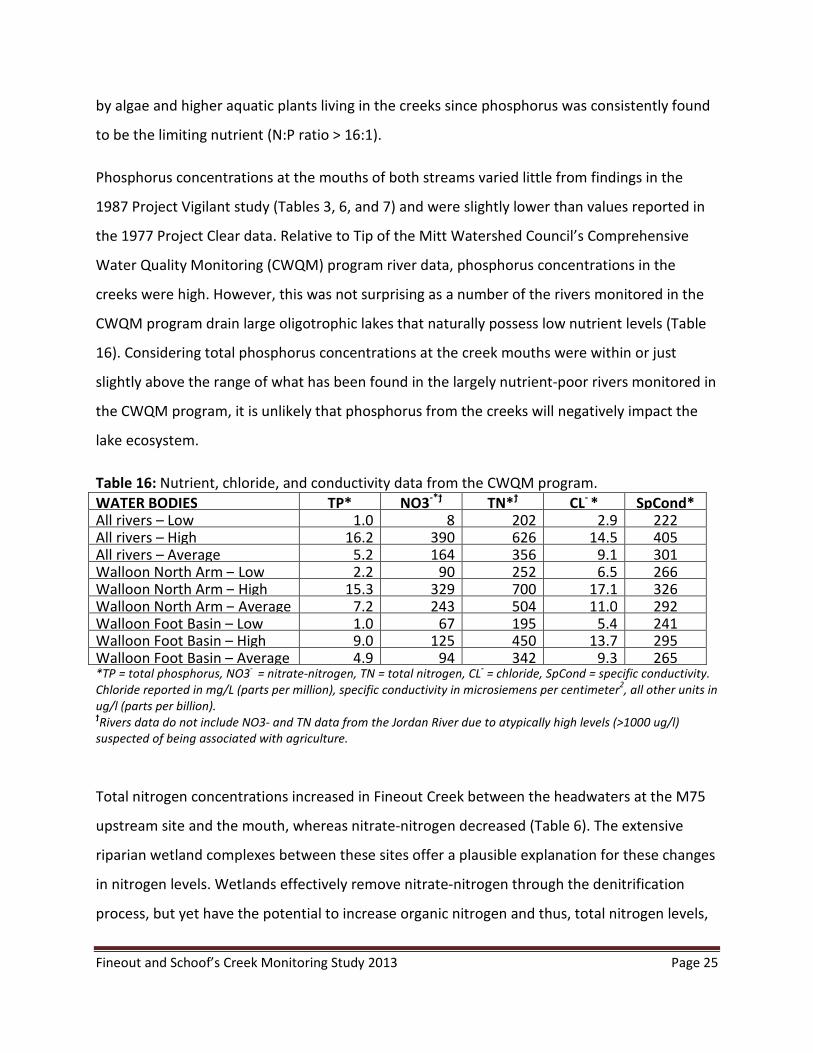
Table 16: Nutrient, chloride, and conductivity data from the CWQM program.
WATER BODIES TP* NO3-*ϯ
TN*ϯ CL
- * SpCond*
All rivers – Low 1.0 8 202 2.9 222 All rivers – High 16.2 390 626 14.5 405 All rivers – Average 5.2 164 356 9.1 301 Walloon North Arm – Low 2.2 90 252 6.5 266 Walloon North Arm – High 15.3 329 700 17.1 326 Walloon North Arm – Average 7.2 243 504 11.0 292 Walloon Foot Basin – Low 1.0 67 195 5.4 241 Walloon Foot Basin – High 9.0 125 450 13.7 295 Walloon Foot Basin – Average 4.9 94 342 9.3 265 *TP = total phosphorus, NO3
- = nitrate-nitrogen, TN = total nitrogen, CL
- = chloride, SpCond = specific conductivity.
Chloride reported in mg/L (parts per million), specific conductivity in microsiemens per centimeter2, all other units in
ug/l (parts per billion). ϯRivers data do not include NO3- and TN data from the Jordan River due to atypically high levels (>1000 ug/l)
suspected of being associated with agriculture.
Total nitrogen concentrations increased in Fineout Creek between the headwaters at the M75
upstream site and the mouth, whereas nitrate-nitrogen decreased (Table 6). The extensive
riparian wetland complexes between these sites offer a plausible explanation for these changes
in nitrogen levels. Wetlands effectively remove nitrate-nitrogen through the denitrification
process, but yet have the potential to increase organic nitrogen and thus, total nitrogen levels,

Fineout and Schoof’s Creek Monitoring Study 2013 Page 26
through allochthonous inputs (i.e. inputs of leaves, branches and other plant matter). However,
agricultural and residential land use in the watershed could also contribute to in-stream
nutrient enrichment (Figure 1). Data also indicate that nitrogen concentrations at the mouth
were likely influenced by inputs from the west branch on Clute Road.
Nitrogen concentrations generally increased in a downstream direction in Schoof’s Creek,
though levels decreased between Williams Road and the mouth on two occasions (Table 7).
Total nitrogen loads increased consistently moving downstream (Table 13). The increase in both
nitrate-nitrogen and total nitrogen concentrations was most pronounced between the sites on
Resort Pike and Williams Road, which indicates that nutrient pollution is likely occurring
somewhere in this stretch. Agricultural operations in this section are suspected of contributing
to elevated nitrogen levels, though residential development along Resort Pike could also be a
source (Figure 1). The decreases noted between Williams Road and the mouth are probably the
result of uptake, settling, and denitrification in the large wetland complex buffering both sides
of the creek throughout this section.
Comparisons of nitrogen between the current and historic studies were problematic due to
different forms measured and the number of measurements made for some forms. Total
Kjedahl nitrogen was measured in the Project Vigilant study while total nitrogen was measured
in this study. Total nitrogen varies from total Kjeldahl nitrogen in that Kjedahl does not include
the nitrate and nitrite forms of nitrogen. Nitrate concentrations were measured for just a few
samples from the Project Vigilant study. A comparison of the sum of total Kjedahl nitrogen and
nitrate-nitrogen from the Project Vigilant study with total nitrogen from the current study
shows that levels were higher in Fineout Creek and lower in Schoof’s Creek in 1987 (Tables 3, 6,
and 7).
Total nitrogen levels in Schoof’s Creek were found to be much higher than what is typically
found in rivers of Northern Michigan (Table 16). Similar to the Jordan River, agricultural activity
in the watershed is suspected of contributing to the high nitrogen concentrations that were
found in this study (see footnote under Table 16). Furthermore, the apparent nutrient pollution
Fineout and Schoof’s Creek Monitoring Study 2013 Page 27
occurring in the Schoof’s Creek Watershed may be contributing to the abnormally high nitrogen
concentrations found in the open water of the North Arm of Walloon Lake (Table 16).
Dissolved organic carbon (DOC) is influenced by wetlands in that research has shown that in-
stream DOC concentrations increase as the amount of wetlands increase (Echardt and Moore
1990). Although the percentage difference was small (~2%), the higher DOC concentrations in
Fineout Creek as compared to Schoof’s Creek may be indicative of the greater percentage of
wetlands in the Fineout Creek Watershed (Table 1).
Chloride and Conductivity
Chloride is an excellent indicator of human disturbance in a watershed because many products
associated with human activities contain chloride (e.g., de-icing salts, water softener salts,
fertilizers, and bleach) and it is a “mobile ion,” meaning it is not removed by chemical or
biological processes in soil or water. Research by Herlihy et al. (1998) found that “chloride
concentration is a good surrogate indicator for general human disturbance in the watershed”.
Research shows that conductivity is also a good indicator of human impacts on aquatic
ecosystems because levels usually increase as urbanization of a watershed increases (Jones and
Clark 1987, Lenat and Crawford 1992). Chloride is related to conductivity in that it is a major
inorganic anion in water.
The majority of the chloride and conductivity data from Fineout Creek show typical levels for
streams in this region, though elevated concentrations were found on a handful of occasions
(Tables 8 and 16). Chloride and conductivity levels were higher in Schoof’s Creek than in
Fineout and higher than what is typical for the region’s streams (Tables 9 and 16), which is likely
due to the extensive agricultural land use in the watershed. Land cover data from 2006 show
higher percentages of both agriculture and urban/residential in the Schoof’s Creek Watershed
as compared to Fineout Creek, as well as the greater Walloon Lake Watershed (Table 1).
Relatively high chloride and conductivity levels were found throughout Fineout and Schoof’s
Creeks during the July 8th
monitoring event (Table 8 and 9). Similar to inferences made

Fineout and Schoof’s Creek Monitoring Study 2013 Page 28
regarding bacteriological results, the high levels recorded on July 8th
may indicate that sampling
captured higher concentrations of pollutants associated with the first flush following a rain
event. Although there are many potential sources of chlorides and other charged particles
contributing to the elevated conductivity levels, residual de-icing salts in roadside ditches are
suspected.
Differing from nutrient trends in Schoof’s Creek, chloride and conductivity levels increased
between the most upstream site at Intertown Road and the next site down at Resort Pike,
followed by steady decreases to the mouth. Considering that chloride is a mobile ion and
therefore, not removed by biological or chemical processes in water, the reductions that
occurred between Resort Pike and the mouth may be the result of dilution resulting from
surface and groundwater accrual. However, the extensive wetland complexes in the riparian
areas of these lower sections also serve as a sink for salts.
Chloride concentrations were much higher in the current study compared with data from the
1977 Project Clear and 1987 Project Vigilant studies (Tables 2, 3, 8, and 9). In addition, averaged
data show that chloride concentrations at the mouths of both creeks were higher than those
documented in the open water of Walloon Lake and the CWQM rivers (Table 16). However,
chloride concentrations were far below levels that adversely impact aquatic life.
Dissolved Oxygen, Temperature, pH, and Total Suspended Solids
Dissolved oxygen, temperature, and pH are very influential parameters in terms of a stream’s
water quality. Low dissolved oxygen levels, high water temperatures, or highly acidic or alkaline
waters can rapidly degrade a stream ecosystem. Results show that pH levels at all sites in both
tributaries were in an acceptable range typical of Northern Michigan streams. Dissolved oxygen
and temperature data, however, show that the streams may not be attaining standards
required to maintain healthy cold-water fisheries.
Dissolved oxygen and temperature monitoring results indicate that much of the main branch of
Fineout Creek may not be attaining State of Michigan water quality standards. Dissolved oxygen
Fineout and Schoof’s Creek Monitoring Study 2013 Page 29
concentrations were low at the M75 downstream and mouth sites during all sample events,
and water temperatures were high during most events. The elevated temperatures and low
oxygen levels are probably a result of the creek meandering through vast wetland complexes
throughout much of its length. Sluggish flow resulting from the flat terrain, lack of shading and
subsequent exposure of much of the water surface to direct sunlight, as well as allochthonous
inputs from riparian vegetation all contribute to high water temperatures and low oxygen
levels. Although perhaps due to natural conditions, the data indicate that only the west branch
of Fineout Creek and the most upstream areas of the main branch may be capable of
supporting a cold-water fishery throughout the year.
Dissolved oxygen and water temperature data indicate that large stretches of Schoof’s Creek
may not be attaining State of Michigan water quality standards during the warm summer
months. Data show that dissolved oxygen concentrations were lower than state standards at all
sites but Williams Road during the July monitoring event. Similar to Fineout Creek, sections of
Schoof’s Creek may not be capable of sustaining a cold-water fishery, at least during portions of
the year.
Sediments in surface waters can have a variety of negative impacts on aquatic ecosystems.
Large amounts of sediment in water can degrade aquatic habitat, interfere with navigation,
harm aquatic life, and impair water quality. Sediments are commonly measured in terms of
total suspended solids and total dissolve solids. Suspended and dissolved solids were generally
found to be low in Fineout and Schoof’s Creeks. Total solids were higher in Schoof’s Creek than
Fineout Creek and, similar to findings regarding other parameters in this study, the elevated
solids concentrations mostly occurred during the July 8th
sampling event (Tables 8 and 9).
However, concentrations never reached what is considered to give the water a “dirty”
appearance (>150 mg/L) by State of Michigan water quality standards.
Total suspended solids loads were higher on average in Fineout Creek than Schoof’s Creek in
spite of higher water discharge rates from Schoof’s. This could be due to greater sediment
inputs in Fineout Creek or high rates of solids settling in the lower section of Schoof’s Creek.
The limited dataset of just two observations should also be considered.
Fineout and Schoof’s Creek Monitoring Study 2013 Page 30
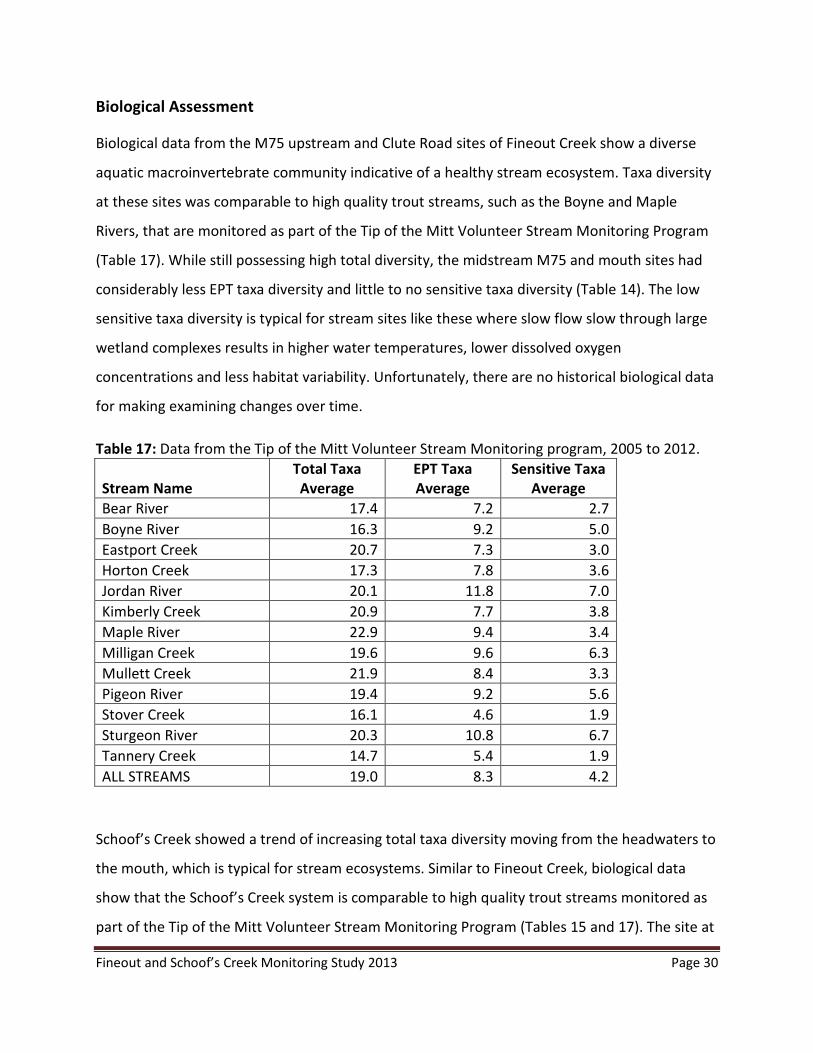
Biological Assessment
Biological data from the M75 upstream and Clute Road sites of Fineout Creek show a diverse
aquatic macroinvertebrate community indicative of a healthy stream ecosystem. Taxa diversity
at these sites was comparable to high quality trout streams, such as the Boyne and Maple
Rivers, that are monitored as part of the Tip of the Mitt Volunteer Stream Monitoring Program
(Table 17). While still possessing high total diversity, the midstream M75 and mouth sites had
considerably less EPT taxa diversity and little to no sensitive taxa diversity (Table 14). The low
sensitive taxa diversity is typical for stream sites like these where slow flow slow through large
wetland complexes results in higher water temperatures, lower dissolved oxygen
concentrations and less habitat variability. Unfortunately, there are no historical biological data
for making examining changes over time.
Table 17: Data from the Tip of the Mitt Volunteer Stream Monitoring program, 2005 to 2012.
Stream Name
Total Taxa
Average
EPT Taxa
Average
Sensitive Taxa
Average
Bear River 17.4 7.2 2.7
Boyne River 16.3 9.2 5.0
Eastport Creek 20.7 7.3 3.0
Horton Creek 17.3 7.8 3.6
Jordan River 20.1 11.8 7.0
Kimberly Creek 20.9 7.7 3.8
Maple River 22.9 9.4 3.4
Milligan Creek 19.6 9.6 6.3
Mullett Creek 21.9 8.4 3.3
Pigeon River 19.4 9.2 5.6
Stover Creek 16.1 4.6 1.9
Sturgeon River 20.3 10.8 6.7
Tannery Creek 14.7 5.4 1.9
ALL STREAMS 19.0 8.3 4.2
Schoof’s Creek showed a trend of increasing total taxa diversity moving from the headwaters to
the mouth, which is typical for stream ecosystems. Similar to Fineout Creek, biological data
show that the Schoof’s Creek system is comparable to high quality trout streams monitored as
part of the Tip of the Mitt Volunteer Stream Monitoring Program (Tables 15 and 17). The site at
Fineout and Schoof’s Creek Monitoring Study 2013 Page 31
the mouth of Schoof’s Creek had lower sensitive taxa diversity than the other sites, which likely
results from the same conditions noted at the mouth of Fineout Creek.
RECOMMENDATIONS
Results from this study provided the means to assess the current status of the Fineout and
Schoof’s Creeks’ ecosystems, to compare them with past studies and determine any changes or
trends that have occurred over time. Based on these assessments and comparisons,
recommendations have been developed to guide follow-up actions that will address problems
identified by this study, as well as further efforts to monitor and study the creeks and their
watersheds.
Specific recommendations are as follow:
1. Share study results and report with appropriate organizations, agencies, and people,
including the Little Traverse Bay Watershed Plan Advisory Committee, Emmet County
Conservation District, Charlevoix County Conservation District, Natural Resources
Conservation Service (USDA), Michigan Department of Environmental Quality (MDEQ),
Michigan Department of Natural Resources (MDNR), Little Traverse Bay Bands of Odawa
(LTBB), Health Department of Northwest Michigan, Bear Creek Township, Resort
Township, Evangeline Township, and Melrose Township.
2. Identify all potential sources of nutrient pollution and bacteriological contamination in
the watersheds of both creeks.
3. Work with appropriate organizations to address sources of nutrient pollution and
bacteria in the creeks’ watersheds, with particular focus on Schoof’s Creek.
4. Examine historical land cover changes and project future landscape development trends
in both watersheds. Based on this analysis, determine actions needed to protect and
improve the stream ecosystems (e.g., permanent land protection priorities, appropriate
planning and zoning, and ordinance development).

Fineout and Schoof’s Creek Monitoring Study 2013 Page 32
5. Determine how stream channels have changed over time, particularly near the mouths,
using historical aerial imagery or other data (e.g., determine if channel widths or
sinuosity have changed over time). Fill in gaps in stream channel mapping with GPS and
on-the ground reconnaissance.
6. Continue to monitor water quality of the creeks to fill in gaps and track changes.
Request that MDEQ and LTBB assist with monitoring. Form a volunteer team to assist
with regular aquatic macroinvertebrate monitoring in the streams as part of the
TOMWC Volunteer Stream Monitoring Program. Develop a regular monitoring schedule.
7. Assess sediment and nutrient pollution from agricultural and urban activity in the
watershed to the wetlands, streams, and lakes by building a SWAT (Surface Water
Assessment Tool) or other appropriate model. Use model results to identify problematic
areas that could be addressed to help protect and improve the water quality of the
tributaries, wetlands, and open water of Walloon Lake. Governmental agencies,
academic researchers, or consulting firms could help develop a SWAT model.
8. Request that MDNR perform fish surveys to determine which species and communities
inhabit the creeks. Fish surveys will also help determine if the creeks or sections of the
creeks no longer support cold-water fisheries.

Fineout and Schoof’s Creek Monitoring Study 2013 Page 33
LITERATURE AND DATA REFERENCED
Arndt, J.L., and J.L. Richardson. 1993. Temporal variations in the salinity of shallow
groundwaters collected from the periphery of some North Dakota USA wetlands. Journal of
Hydrology 141:75-105.
Charlevoix County GIS Office. 2010. Aerial orthoimagery. Charlevoix, MI.
http://www.charlevoixcounty.org/
Eckhardt, B. W. and T. R. Moore, 1990. Controls on dissolved organic carbon concentrations in
streams, southern Quebec. Canadian Journal of Fisheries and Aquatic Science 47: 1537–1544.
Emmet County GIS Department. 2012. Aerial orthoimagery. Petoskey, MI.
http://emmetcounty.org/
Faust, M. A., A. E. Aotaky, and M. T. Hargadon. 1975. Effect of physical parameters on the in
situ survival of Escherichia coli MC-6 in an estuarine environment. Appl. Microbiol. 30:800-806.
Gold, A. et al. 1978. Technical Report No. 6 by Project CLEAR staff: Environmental Features of
Walloon Lake and its Watershed With Special Reference to Nutrient Management. The
University of Michigan Biological Station. Pellston, MI.
Herlihy, A.T., J.L. Stoddard, and C. B. Johnson. 1998. The relationship between stream chemistry
and watershed land cover data in the Mid-Atlantic Region. Water, Air, and Soil Pollution
105:377-386.
Hilsenhoff, W. L. 1988. Rapid field assessment of organic pollution with a family-level biotic
index. Journal of the North American Benthological Society 7(1): 65 - 68.
Jones, R.C., and C. Clark. 1987. Impact of watershed urbanization on stream insect
communities. Water Resources Bulletin 15:1047-1055.
Klein, R. 1979. Urbanization and stream quality impairment. Water Resources Bulletin 15:948-
963.
Lenat, D.R., and J.K. Crawford. 1994. Effects of land use on water quality and aquatic biota of
three North Carolina Piedmont streams. Hydrobiologia 294:185-199.
Rodgers, P.W. 1987. Walloon Lake Water Quality Studies: Phase Two of Project Vigilant. LTI,
Limno-Tech, Inc. Ann Arbor, MI.
Rodgers, P.W. and M.S. Kieser. 1989. Predicting the Impact of Land Use on Walloon Lake Water
Quality: Modeling Studies and Management Implications. LTI, Limno-Tech, Inc. Ann Arbor, MI.
Fineout and Schoof’s Creek Monitoring Study 2013 Page 34
Michigan Department of Environmental Quality. 2012. Surface Water Information Management
System. Lansing, MI. http://www.mcgi.state.mi.us/miswims/
Michigan Department of Environmental Quality Water Bureau. 1994. Part 4. Water Quality
Standards. Sections 3103 and 3106 of 1994 PA 451. Lansing, MI.
Michigan Department of Information Technology, Center for Geographic Information. 2012.
Michigan Geographic Data. Lansing, MI. http://www.mcgi.state.mi.us/mgdl/
Michigan Department of Natural Resources. 2012. Designated Trout Streams For Michigan.
Lansing, MI. http://www.michigan.gov/documents/dnr/FO_210.10_317504_7.pdf
Mulholland, P. J., 2003. Large-scale patterns in dissolved organic carbon concentration, flux,
and sources. In: S. E. G. Findlay and R. L. Sinsabaugh (eds.), Aquatic Ecosystems: Interactivity of
Dissolved Organic Matter, Academic Press, New York, pp.139–159.
National Oceanic and Atmospheric Administration, Coastal Services Center. 2007. Coastal Great
Lakes Land Cover Project. Charleston, SC. http://www.csc.noaa.gov/crs/lca/greatlakes.html
Royer, T.V., and M.B. David. 2005. Export of dissolved organic carbon from agricultural streams
in Illinois, USA. Aquatic Science 67 (2005) 465-471.
Tip of the Mitt Watershed Council. 2007. Comprehensive Water Quality Monitoring Program.
Petoskey, MI. http://www.watershedcouncil.org/
Tip of the Mitt Watershed Council. 2012. Tip of the Mitt Volunteer Stream Monitoring Program.
Petoskey, MI. http://www.watershedcouncil.org/
Tip of the Mitt Watershed Council. 2012. Walloon Lake Wetlands and Tributary Assessment
2012. Petoskey, MI. http://www.watershedcouncil.org/
United States Environmental Protection Agency. 2001. Ambient Water Quality Criteria
Recommendations. USEPA Office of Water. Washington DC.
http://water.epa.gov/scitech/swguidance/standards/upload/2007_09_27_criteria_nutrient_ec
oregions_rivers_rivers_8.pdf
United States Environmental Protection Agency. 2012. National Recommended Water Quality
Criteria. USEPA Office of Water. Washington DC.
http://water.epa.gov/scitech/swguidance/standards/criteria/current/index.cfm

Fineout and Schoof’s Creek Monitoring Study 2013 Page 35
Appendix A. Stream Data from 1987 Project Vigilant
Sub-
Watershed
Trib
Station
Sampling
Date
Julian
Day
Total
Phosphorus
(ug/L)
Soluble
Reactive
Phosphorus
(ug/L)
TKN
(ug/L)
Chloride
(mg/L)
Alkalinity
(mg/L)
Fecal
Coliform
(/100mL)
Calcium
(mg/L)
Chloro
phyll-a
(ug/L)
Ammonia-
Nitrogen
(ug/L)
Nitrate-
Nitrogen
(ug/L)
Total
Dissolved
Phosphorus
(ug/L)
Schoofs Ck R25 4/13/1986 103 6.8 2.5 635 5 166 5 57
Schoofs Ck R25 5/6/1986 126 8.2 4.4 920 6 222 62 71
Schoofs Ck R25 5/28/1986 148 2.9 2.7 1100 8 200 16 78
Schoofs Ck R25 6/19/1986 170 11.8 1 800 6 224 20 77.6
Schoofs Ck R25 6/30/1986 181 8.8 2.6 900 7 222 39
Schoofs Ck R25 7/13/1986 194 14.6 5.2 800 6 180 430 56
Schoofs Ck R25 7/29/1986 210 9.6 1.1 620 7 252 95 83.5
Schoofs Ck R25 8/12/1986 224 9.8 2.9 650 7 235 180 79
Schoofs Ck R25 8/27/1986 239 10 1 460 8 248 31 80
Schoofs Ck R25 9/17/1986 260 9.6 1.5 500 7 222 180 71
Schoofs Ck R25 10/16/1986 289 4.4 1 600 8 217 0 72 0.49 400 60
Schoofs Ck R25 11/20/1986 324 6.4 1 420 8 224 68
Schoofs Ck R25 2/5/1987 401 6.8 1.4 520 9.3 228 71
Schoofs Ck R25 3/12/1987 436 8 2.2 450 8 220 76 5.9
Schoofs Ck R25 4/9/1987 464 5.7 1 9 200 23 55 4.9
S. Arm Ck M18C 4/13/1986 103 4.6 2.5 450 6 152 0 48 25 320
S. Arm Ck M18C 5/6/1986 126 15.1 6.8 750 6 172 28 60
S. Arm Ck M18C 5/28/1986 148 18 15.5 580 9 164 16 57
S. Arm Ck M18C 6/19/1986 170 21.2 1.8 800 6 166 208 51
S. Arm Ck M18C 8/30/1986 181 21.2 4.9 680 8 186 52 58
S. Arm Ck M18C 7/13/1986 194 21.8 9 600 6.5 179 300 60
S. Arm Ck M18C 8/1/1986 213 13 5.6 430 7 193 73 60
S. Arm Ck M18C 8/12/1986 224 13.1 6.4 520 7.9 196 86 62.6
S. Arm Ck M18C 8/27/1986 239 12.3 1 620 7 204 74 64
S. Arm Ck M18C 9/16/1986 259 14 2.4 800 7 150 60 56
S. Arm Ck M18C 10/13/1986 286 10 1 480 8 144 33 43
S. Arm Ck M18C 11/19/1986 323 7.9 1.3 380 7 162 4
S. Arm Ck M18C 12/16/1986 350 9.7 1 460 8 152
S. Arm Ck M18C 2/3/1987 399 11 2.8 350 8 180 57
S. Arm Ck M18C 3/12/1987 436 11 1 450 8 220 5.9
S. Arm Ck M18C 4/8/1987 463 11.1 1 390 8 160 2 42 7.8
Water Quality Data for Walloon Tributary Stations

Fineout and Schoof’s Creek Monitoring Study 2013 Page 36
Walloon Tributary Flows (cfs) * indicates wet weather during sampling
Julian Day-> 99 103 113 119 126 135 138* 138* 142 148 161 163* 163* 164*
Trib Station 4/9/1986 4/13/1986 4/23/1986 4/29/1986 5/6/1986 5/15/1986 5/18/86* 5/18/86* 5/22/1986 5/28/1986 6/10/1986 6/12/86* 6/12/86* 6/13/86*
Schoofs Ck R23b 0.43 0.38 0.27 0.35 1.39 0.78 0.43 0.2 0.17 6* 2.5 0.69
Schoofs Ck R23a 3.51 2.81 2.05 1.62 1.13 1.67 6.58 3.71 1.49 0.55 0.48 18.6 15.1 2.9
Schoofs Ck R24 1.89 1.49 1.38* 1.26 1.08 1.39 4.71 2.71 1.43 0.8 0.67 13.4* 7.2 2.1
Schoofs Ck R19 0.04 0
Schoofs Ck BC30 0.55 0.72 0.56 0.4 0.41 1.16 0.7 0.3 0.26 2 0.58 0.36
Jones Lan- BC31a 0.19 0.15 0.13 0.14 0.04
Jones Lan- BC31b 0.2 0.17 0.14 0.15 0.13 0.12
S. Arm Ck M18a 1.24 1.02 0.77 1.01 2.21 1.44 0.91 0.53 0.44 5.33 4 2
S. Arm Ck M18b 3.81 2.22 2.49 1.59 3.07 8.11 7.68 2.99 1.7 1* 19* 23.4 15.7
Sub-
Watershed
Julian Day-> 167 170* 181 194* 213 224 239 259 273* 286* 301 323 350 399
Trib Station 6/16/1986 6/19/1986 6/30/1986 7/13/1986 8/1/1986 8/12/1986 8/27/1986 9/16/1986 9/30/1986 10/13/1986 10/28/1986 11/19/1986 12/16/1986 2/3/1987
Schoofs Ck R23b 0.27 0.74 0.4 >6.5* 0.19 0.2 0.2 0.61 0.56 1.34 0.4 0.36 0.44 0.3
Schoofs Ck R23a 0.89 2.6 0.6 24.7 1.11 1 0.63 1.92 1.63 3.83 1.26 1 1.38 1
Schoofs Ck R24 0.85 3.15 0.78 12.7 0.93 1.06 0.69 1.58 1.43 2.62 1.14 0.97 1.15 0.95
Schoofs Ck R19 0.09
Schoofs Ck BC30 0.61 0.36 0.58 0.18 0.23 0.24 0.38 0.77 0.64 0.51 0.36 0.3
Jones Lan- BC31a 0.33 0.17 0.54 0.02 0.12 0.07 0.19 0.18 0.26 0.07 0.14 .09*
Jones Lan- BC31b 0.33 0.12 0.19 0.13 0.04 0.12 0.13 0.13 0.18 0.12 0.14 0.12
S. Arm Ck M18a 1.4 0.51 0.96 0.39 0.57 0.45 1.85 1.21 1.94 0.91 1.1 0.58
S. Arm Ck M18b 3.51 1.56 2.9 1.33 2.2 1.95 4.61 5.7 6.96 2.2 2.3 1.5
Sub-
Watershed

Fineout and Schoof’s Creek Monitoring Study 2013 Page 37
Snowmelt Snowmelt
Sub- Julian Day-> 431 432 436 443 444 463 Standard Maximum Minimum # of Data
Trib Station 3/7/1986 3/8/1986 3/12/1986 3/19/1986 3/20/1986 4/8/1986 Average
Schoofs Ck R23b 0.92 2.5 0.3 0.51 0.51 0.31
Schoofs Ck R23a 2.51 4.79 1.12 1.84 1.55 1.37
Schoofs Ck R24 1.84 2.99 0.91 1.25 1.3 1.19
Schoofs Ck R19 .5* .1* .02* .04* .04* .03*
Schoofs Ck BC30 1.58 1.32 0.27 0.31 0.59 0.42 2 0.18 28
Jones Lan- BC31a .07* .11* 0.14 0.13 0.54 0 0.19
Jones Lan- BC31b 0.11 .11* 0.14 0.05 0.33 0.04 20
S. Arm Ck M18a 2.41 1.82 0.79 0.8 0.72 0.94
S. Arm Ck M18b 2.41 1.82 0.79 0.8 0.72 0.94

Fineout and Schoof’s Creek Monitoring Study 2013 Page 38