alexander creek water quality monitoring report 2015 – 2017
TRANSCRIPT
Alexander Creek Water Quality Monitoring Report
2015 – 2017
Prepared by: Lotic Environmental Ltd, Mainstreams Environmental Society, and
Elk River Alliance
Prepared for: The Columbia Basin Water Quality Monitoring Project
June 2018
Alexander Creek Water Quality Monitoring Report 2015-2017
ii
Suggested Citation McPherson, S.1,, K. Baranowska1, L. Duncan2, and A. Ferguson3. 2018. Alexander Creek, water
quality monitoring report 2015 to 2017. A Columbia Basin Water Quality Monitoring Project. Prepared by Lotic Environmental Ltd1, Mainstreams Environmental Society2, and the Elk River Alliance3, for the Columbia Basin Water Quality Monitoring Project.
Alexander Creek Water Quality Monitoring Report 2015-2017
iii
Acknowledgements We are very thankful to the following individuals and organizations for their specific support to the Alexander Creek monitoring project, conducted under the Columbia Basin Water Quality Monitoring Project (CBWQ):
o Allie Ferguson, Beth Millions, Ayla Bennett and Lee-Anne Walker of Elk RiverAlliance for conducting the field collection;
o CBWQ coordinators Jim & Laura Duncan for their valuable support;o Sparwood Fish and Wildlife Association for their support in building a kiosk and a
riparian bank stabilization project just upstream of the site;o Teck Coal for access to the property; and,o Ryan MacDonald and Danielle Marcotte of MacDonald Hydrology Consultants Ltd.
for providing a report review and mapping services, respectively.
We also acknowledge the following for their support to the CBWQ as a whole: o Columbia Basin Trust (CBT) for funding the project;o Kindy Gosal, Heather Mitchell, and Tim Hicks from CBT;o Karen Nickurak from Columbia Basin Watershed Network;o Stephanie Strachan, Gail Moyle, and Tim Pascoe from Environment and Climate
Change Canada;o Hans Schreier and Ken Hall, Professors Emeriti, University of British Columbia; ando Jody Fisher and Jolene Raggett from the BC Ministry of Environment and Climate
Change Strategy.
Lastly, we wish to recognize Sherri McPherson, Kathryn Kuchapski, Ryan MacDonald, and Guy Duke for preparing the initial CBWQ report template in 2013.
Contact Information Elk River Alliance
Alya Bennett [email protected]
Columbia Basin Water Quality Monitoring Project Coordinators: Laura Duncan ([email protected]) Jim Duncan ([email protected]) Columbia Basin Water Quality Monitoring Project website www.cbwq.ca
Lotic Environmental, Senior Aquatic Biologist Sherri McPherson ([email protected])
Columbia Basin Trust Contact Wendy Horan, Manager, Environment ([email protected])
Columbia Basin Watershed Network website www.cbwn.ca
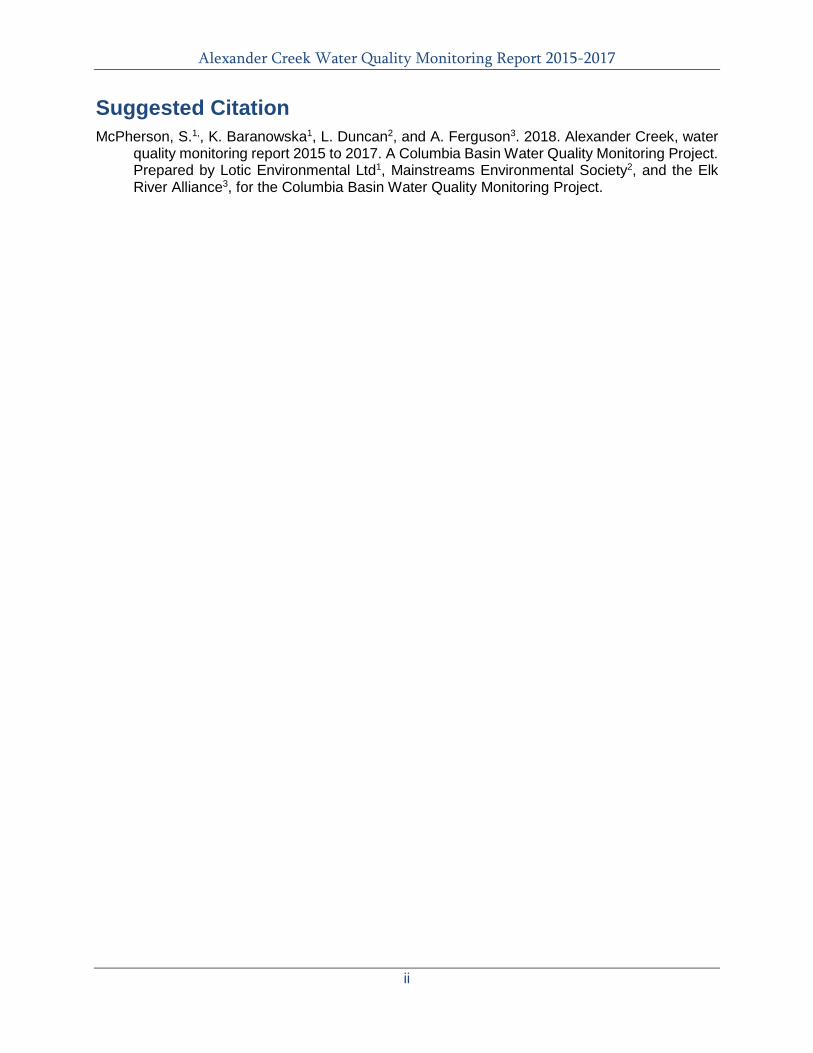
Cover photo Upstream view of Alexander Creek site NGALX03, September 12, 2016
Alexander Creek Water Quality Monitoring Report 2015-2017
iv
Project Highlights The Columbia Basin Water Quality Monitoring Project (CBWQ) is an environmental stewardship project funded by the Columbia Basin Trust. Under the CBWQ, Mainstreams Environmental Society partnered with Elk River Alliance to conduct baseline water quality monitoring in Alexander Creek from 2015 to 2017. Alexander Creek was identified as a priority for monitoring since it is in an area experiencing increasing development pressures (i.e., highway influences, logging activity, road-building, cattle grazing, and proposed coal mining in adjacent valleys). Monitoring was conducted at NGALX03, located at the downstream end of the creek, near the confluence with Michel Creek. Four components were monitored: benthic macro-invertebrate community using Canadian Aquatic Biomonitoring Network (CABIN), water quality, water temperature, and hydrologic characteristics (i.e., velocity and streamflow). The benthic macro-invertebrate results identified NGALX03 as being unstressed in all years sampled. This was evident through all expected taxa were present based on reference group conditions, as well as key metrics being similar or better than the reference group values (i.e., total abundance, % EPT taxa, %chironomidae, %two most dominant taxa, and taxa richness). The benthic macro-invertebrate results were supported by the water quality and hydrometric results. Water quality was good at NGALX03, with total phosphorous being the only parameter to exceed the aquatic life guidelines. The exceedances occurred once in the spring of 2015 and once in the spring of 2017. All drinking water guidelines were met. Water temperatures in spring through fall did not exceed the guidelines for rearing Bull Trout. The Bull Trout minimum temperature guideline for egg incubation was regularly not met during the winter months. However, this study did not review whether the monitoring site was actually used by this species for spawning. Fish would be expected to seek out suitable habitat elsewhere in the watershed. Streamflow followed a typical nival pattern of being high in the spring during freshet and decreasing throughout the summer to baseflow in the winter months. The three-year baseline monitoring program provides an understanding of natural conditions and variation. This baseline will be valuable to assess changes over time.
Alexander Creek Water Quality Monitoring Report 2015-2017
v
Contents Suggested Citation ii Acknowledgements iii Contact Information iii Project Highlights iv Contents v 1 Introduction 1
1.1 Alexander Creek background 2 1.2 Fish community 5
2 Methods 6 2.1 Data collection, data entry, and initial data presentation, completed by the CBWQ stewardship group 6 2.2 Analysis overview 7 2.3 CABIN data analysis 8
2.3.1 Reference Condition Approach: BEAST analysis and site assessment 8 2.3.2 RIVPACS analysis 9 2.3.3 Community composition metrics 9
2.4 Water quality data analysis 9 2.4.1 Water quality QA/QC 9 2.4.2 Guideline review 10
2.5 Stream temperature analysis 10 2.6 Hydrometric data analysis 10
3 Results 11 3.1 CABIN results 11
3.1.1 Reference Condition Approach: BEAST analysis and site assessment 11 3.1.2 RIVPACS analysis 11 3.1.3 Community composition metrics 11 3.1.4 Habitat conditions 13
3.2 Water quality results 13 3.2.1 Water quality QA/QC 13 3.2.2 Guideline review 13
3.3 Stream temperature results 14 3.4 Hydrometric results 17
4 Conclusions 18 5 Recommendations 18 6 References 19 Table of Tables Table 1. Fish species historically documented in Alexander Creek, and neighbouring Michel Creek* (Source: BC MoE 2018a) ............................................................................................... 5 Table 2. CABIN model assessment of the test site against reference condition as defined by the preliminary Okanagan-Columbia reference model; assessment, prediction of reference group and probability of group membership. .......................................................................................11 Table 3. RIVPACS Observed:Expected Ratios of taxa at test sites. ..........................................11 Table 4. Benthic macro-invertebrate community composition metrics measured in 3 min kicknet samples, 2015 - 2017 at NGALX03. Condition indicated as shaded background* .....................12 Table 5. Select physical habitat characteristics for the predicted reference group (± standard deviation (SD)), and NGALX03. ................................................................................................13
Alexander Creek Water Quality Monitoring Report 2015-2017
vi
Table 6. Monthly average (Avg) and standard deviation (Std Dev) in daily average stream temperature (°C) from 2015 – 2017 at NGALX03. .....................................................................15
Table of Figures Figure 1. Sensitive Habitat Inventory and Mapping of Alexander Creek, 2012. .......................... 2 Figure 2. Alexander Creek monitoring location. .......................................................................... 4 Figure 3. Downstream and across stream view of NGALX03 monitoring site, September 2016 and 2017, respectively. Photos by Ayla Bennett and Allie Ferguson. ......................................... 5 Figure 4. Stream condition analysis steps. ................................................................................. 8 Figure 5. Stream average daily temperatures in Alexander Creek (NGALX01) from March 28, 2015 to October 10, 2017. The guidelines presented are for the protection of aquatic life for streams with Bull Trout present (BC MoE 2018b). .....................................................................16 Figure 6. Streamflow at NGALX03, 2015-2017. No measurements were collected during the spring high flow period, due to safety concerns. ........................................................................17
Table of Appendices Appendix A. CABIN data Appendix B. Water quality data
Alexander Creek Water Quality Monitoring Report 2015-2017
1
1 Introduction Community-based water quality monitoring in the Columbia River Basin plays an important role in gathering baseline information to understand watershed function and potential influences of concern. This information can help inform management decisions, to ensure that aquatic ecosystems are preserved, which in turn will contribute to maintaining sustainable communities. It is imperative that current and future water quality and quantity concerns be assessed in the Columbia River Basin as environmental change poses substantial risk to ecosystem and societal health. Changes in land use and climate change have the potential to substantially alter water quality and quantity in the Columbia River Basin (Carver 2017). Current and future reductions in snow accumulation (Barnett et al. 2008) and glacial ice (Jost et al. 2012) have been shown to result in reduced water supply in the Columbia Basin, particularly for the low flow summer periods (Burger et al. 2011). Lower streamflow leads to a reduced ability for streams to dilute pollution, potentially resulting in substantial water quality issues. In addition to climate change, the diverse land uses of the Columbia River Basin, including: recreational and industrial development, stream flow regulation, municipal and industrial waste water, and non-point source pollution present a challenge for community-based water quality management. A first step in addressing present and future water quality and quantity issues is developing community awareness and involvement. The Columbia Basin Water Quality Monitoring Project (CBWQ) had its beginnings at a 2005 Watershed Stewardship Symposium sponsored by the Columbia Basin Trust (CBT), where the Columbia Basin Watershed Network was born. A key resolution from that meeting was for CBT to build capacity for watershed groups to monitor water quality in their watersheds. Consequently, on a sunny weekend in June 2006 reps from watershed groups from across the Columbia Basin met in Kimberley to attend a monitoring workshop with Dr. Hans Schreier and Dr. Ken Hall from UBC. At the end of the workshop Mainstreams agreed to coordinate the Columbia Basin Water Quality Monitoring Project and four groups began water quality monitoring in September 2007 with the following goals:
1. Develop a science-based model for community-based water quality monitoring;
2. Establish online accessibility to water quality data; and, 3. Link the monitoring project with community awareness activities.
All told, twelve watershed stewardship groups have participated in the project. Data collected by these groups can be found at the CBWQ website www.cbwq.ca. In order to meet these goals, the Elk River Alliance (or the stewardship group) conducted water quality monitoring in Alexander Creek from 2015 to 2017. Four components were monitored: benthic macro-invertebrate community using Canadian Aquatic Biomonitoring Network (CABIN) methods, water quality, water temperature, and hydrologic characteristics (i.e., velocity and flow). This report presents the data, analyses the results, relates biological results to physical monitoring findings, and provides recommendations for future stream health monitoring. Ongoing funding from the CBT has been and continues to be key to keeping this unique project, guided and administered by community watershed groups operating until June 2018.
Alexander Creek Water Quality Monitoring Report 2015-2017
2
1.1 Alexander Creek background Alexander Creek is located approximately 15 km east of Sparwood, B.C. It is a tributary of Michel Creek, which flows into the Elk River near Sparwood. Alexander Creek is a fourth order stream, which flows west from the Continental Divide of the Rocky Mountains. The total length of Alexander Creek from the source to the mouth is over 30 km. Other general information about Alexander Creek is as follows:
• The majority of Alexander Creek’s annual flow is from snow melt. Flows are highest in May and June, and lowest from August to March (generally decreasing over winter). This is consistent with other interior rivers in the area (Swain 2007).
• The geology of the Alexander Creek area is sedimentary with expressions of coal-bearing rock from the Lewis thrust sheet (Grieve & Price, 1987).
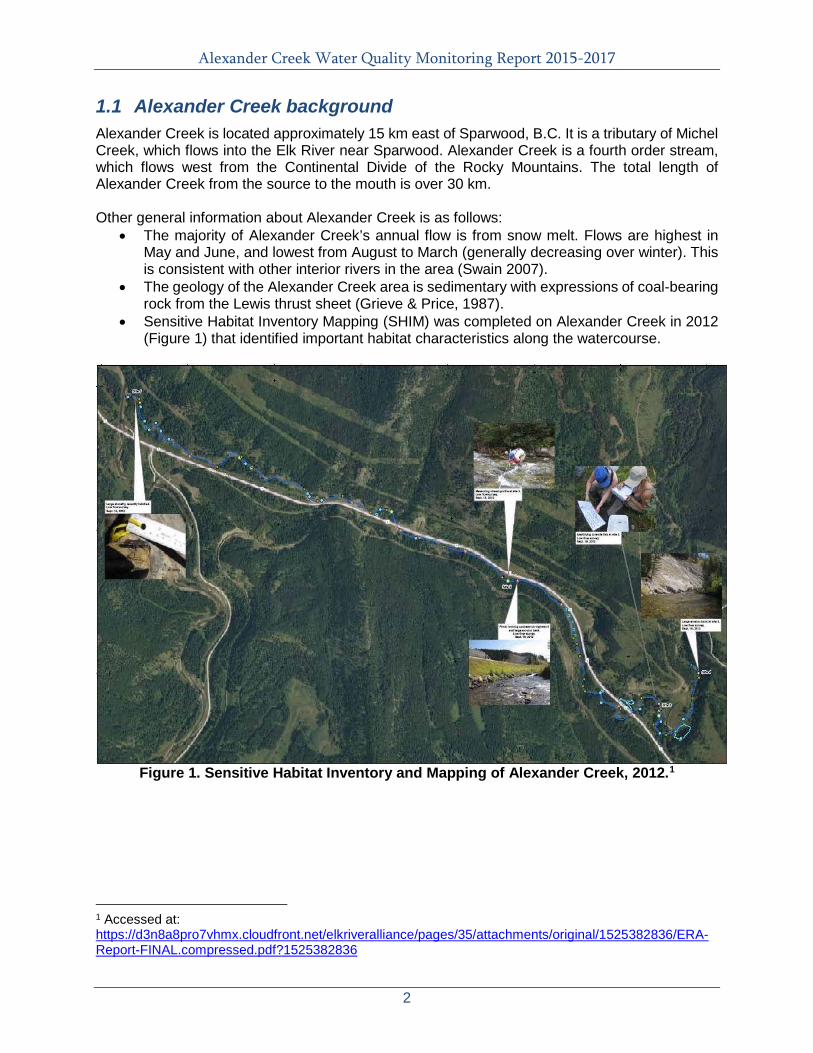
• Sensitive Habitat Inventory Mapping (SHIM) was completed on Alexander Creek in 2012 (Figure 1) that identified important habitat characteristics along the watercourse.
Figure 1. Sensitive Habitat Inventory and Mapping of Alexander Creek, 2012.1
1 Accessed at: https://d3n8a8pro7vhmx.cloudfront.net/elkriveralliance/pages/35/attachments/original/1525382836/ERA-Report-FINAL.compressed.pdf?1525382836
Alexander Creek Water Quality Monitoring Report 2015-2017
3
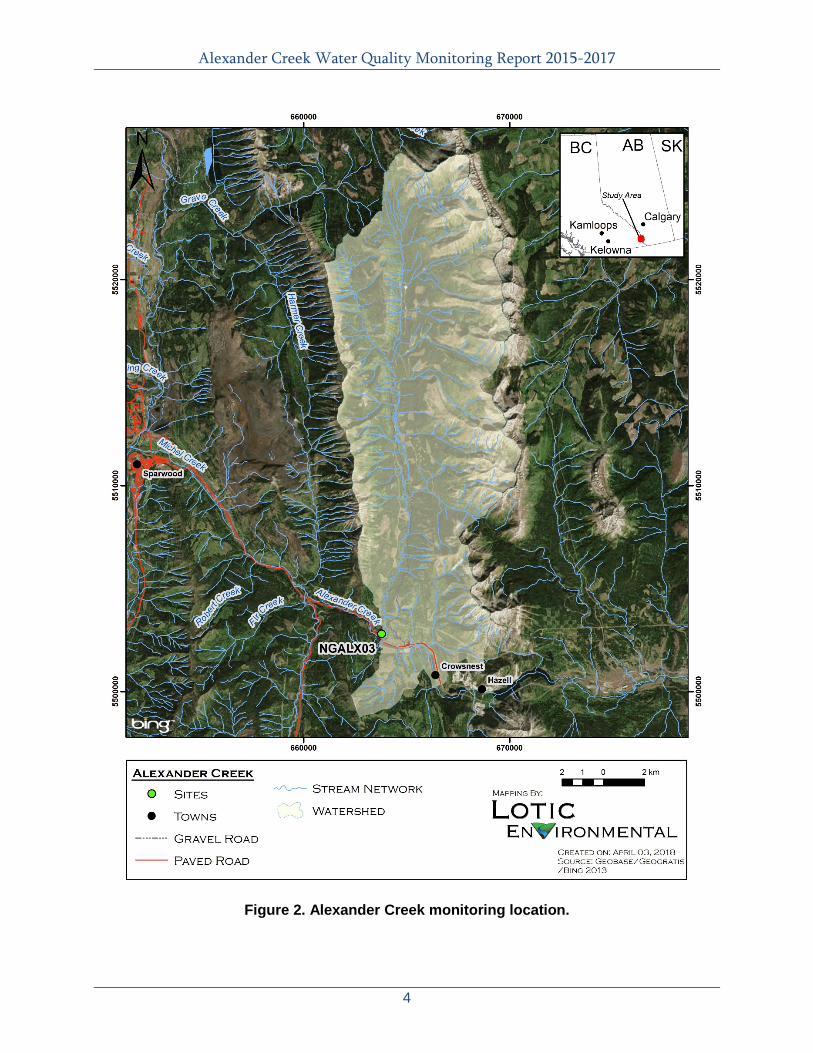
Alexander Creek was selected as a priority for CBWQ monitoring, since it was a significant tributary to Michel Creek. It also was in an area with several human (anthropogenic) pressures including: Highway 3 influences, recent logging activities, road-building, grazing lease for cattle, and proposed coal mining in adjacent valleys. Monitoring was conducted at NGALX03. This site was located near the confluence with Michel Creek (Figure 2 and Figure 3). The site was also located immediately downstream of streamside restoration project implemented by the Elk River Alliance from 2016 to 2017. Because of the mounting anthropogenic activities, obtaining a water quality and quantity baseline for Alexander Creek was important. The vision is for the site to be monitored long-term, so trends in stream health can be detected, and options to address potential issues identified. The riparian zone at the monitoring location is generally dominated by coniferous trees, including Engelmann Spruce, Douglas Fir and Subalpine Fir. Major deciduous trees and shrubs include red osier dogwood, trembling aspen and black cottonwood. The Sparwood Rod and Gun Club rifle range is located immediately upstream of the monitoring location.
Alexander Creek Water Quality Monitoring Report 2015-2017
4
Figure 2. Alexander Creek monitoring location.
Alexander Creek Water Quality Monitoring Report 2015-2017
5
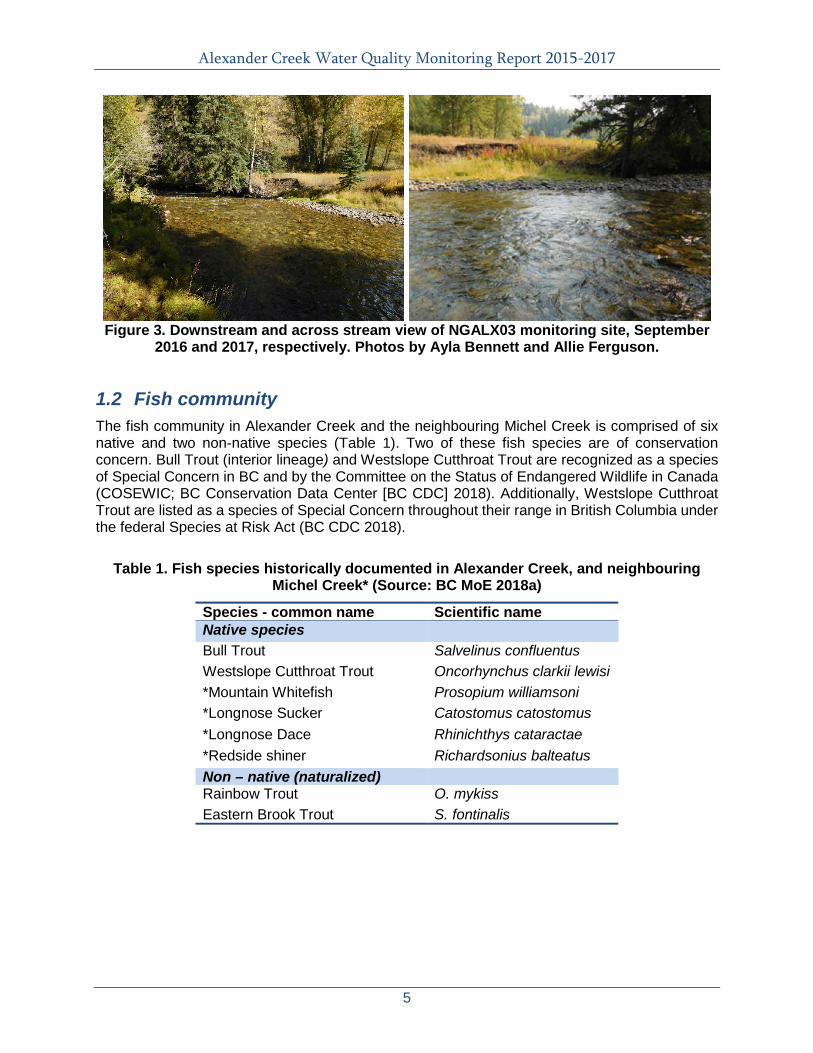
Figure 3. Downstream and across stream view of NGALX03 monitoring site, September
2016 and 2017, respectively. Photos by Ayla Bennett and Allie Ferguson.
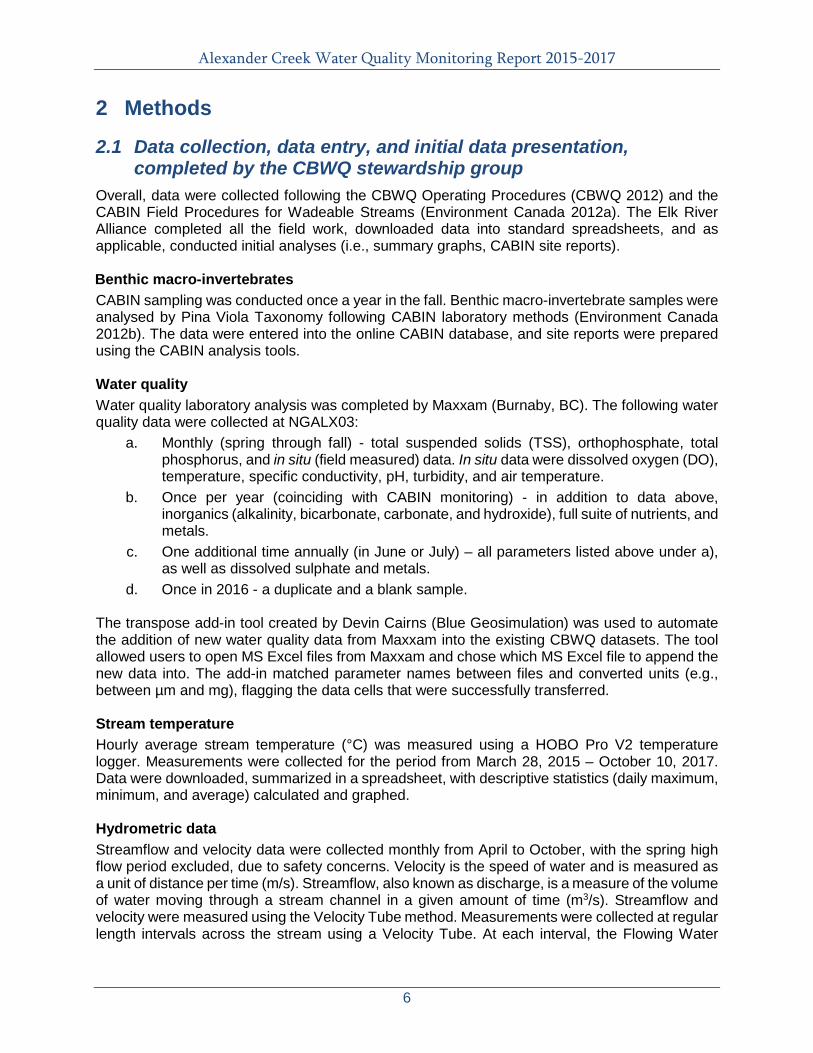
1.2 Fish community The fish community in Alexander Creek and the neighbouring Michel Creek is comprised of six native and two non-native species (Table 1). Two of these fish species are of conservation concern. Bull Trout (interior lineage) and Westslope Cutthroat Trout are recognized as a species of Special Concern in BC and by the Committee on the Status of Endangered Wildlife in Canada (COSEWIC; BC Conservation Data Center [BC CDC] 2018). Additionally, Westslope Cutthroat Trout are listed as a species of Special Concern throughout their range in British Columbia under the federal Species at Risk Act (BC CDC 2018).
Table 1. Fish species historically documented in Alexander Creek, and neighbouring Michel Creek* (Source: BC MoE 2018a)
Species - common name Scientific name Native species Bull Trout Salvelinus confluentus Westslope Cutthroat Trout Oncorhynchus clarkii lewisi *Mountain Whitefish Prosopium williamsoni *Longnose Sucker Catostomus catostomus *Longnose Dace Rhinichthys cataractae *Redside shiner Richardsonius balteatus Non – native (naturalized) Rainbow Trout O. mykiss Eastern Brook Trout S. fontinalis
Alexander Creek Water Quality Monitoring Report 2015-2017
6
2 Methods 2.1 Data collection, data entry, and initial data presentation,
completed by the CBWQ stewardship group Overall, data were collected following the CBWQ Operating Procedures (CBWQ 2012) and the CABIN Field Procedures for Wadeable Streams (Environment Canada 2012a). The Elk River Alliance completed all the field work, downloaded data into standard spreadsheets, and as applicable, conducted initial analyses (i.e., summary graphs, CABIN site reports). Benthic macro-invertebrates CABIN sampling was conducted once a year in the fall. Benthic macro-invertebrate samples were analysed by Pina Viola Taxonomy following CABIN laboratory methods (Environment Canada 2012b). The data were entered into the online CABIN database, and site reports were prepared using the CABIN analysis tools. Water quality Water quality laboratory analysis was completed by Maxxam (Burnaby, BC). The following water quality data were collected at NGALX03:
a. Monthly (spring through fall) - total suspended solids (TSS), orthophosphate, total phosphorus, and in situ (field measured) data. In situ data were dissolved oxygen (DO), temperature, specific conductivity, pH, turbidity, and air temperature.
b. Once per year (coinciding with CABIN monitoring) - in addition to data above, inorganics (alkalinity, bicarbonate, carbonate, and hydroxide), full suite of nutrients, and metals.
c. One additional time annually (in June or July) – all parameters listed above under a), as well as dissolved sulphate and metals.
d. Once in 2016 - a duplicate and a blank sample. The transpose add-in tool created by Devin Cairns (Blue Geosimulation) was used to automate the addition of new water quality data from Maxxam into the existing CBWQ datasets. The tool allowed users to open MS Excel files from Maxxam and chose which MS Excel file to append the new data into. The add-in matched parameter names between files and converted units (e.g., between µm and mg), flagging the data cells that were successfully transferred. Stream temperature Hourly average stream temperature (°C) was measured using a HOBO Pro V2 temperature logger. Measurements were collected for the period from March 28, 2015 – October 10, 2017. Data were downloaded, summarized in a spreadsheet, with descriptive statistics (daily maximum, minimum, and average) calculated and graphed. Hydrometric data Streamflow and velocity data were collected monthly from April to October, with the spring high flow period excluded, due to safety concerns. Velocity is the speed of water and is measured as a unit of distance per time (m/s). Streamflow, also known as discharge, is a measure of the volume of water moving through a stream channel in a given amount of time (m3/s). Streamflow and velocity were measured using the Velocity Tube method. Measurements were collected at regular length intervals across the stream using a Velocity Tube. At each interval, the Flowing Water
Alexander Creek Water Quality Monitoring Report 2015-2017
7
Depth (cm) was measured, from within the interior of the tube, as this area acts as a stilling well. The ‘head’ built up on the upstream side of the tube was also measured (Depth of Stagnation [cm]). The difference between the Flowing Water Depth and the Depth of Stagnation was inserted into Equation 1, to calculate Velocity
Equation 1. Water Velocity (V) V = √[2(ΔD/100)*9.81] where ΔD was the average difference between the flowing water depth and the depth of stagnation
Flow was calculated using Equation 2, where the Average Stream Width and Average Depth was determined in the Stream Profile, and the Average Velocity was calculated above.
Equation 2: Stream flow (Q) Q = Wetted Stream Width (m) x Average Depth (m) x Average Velocity (m/s).
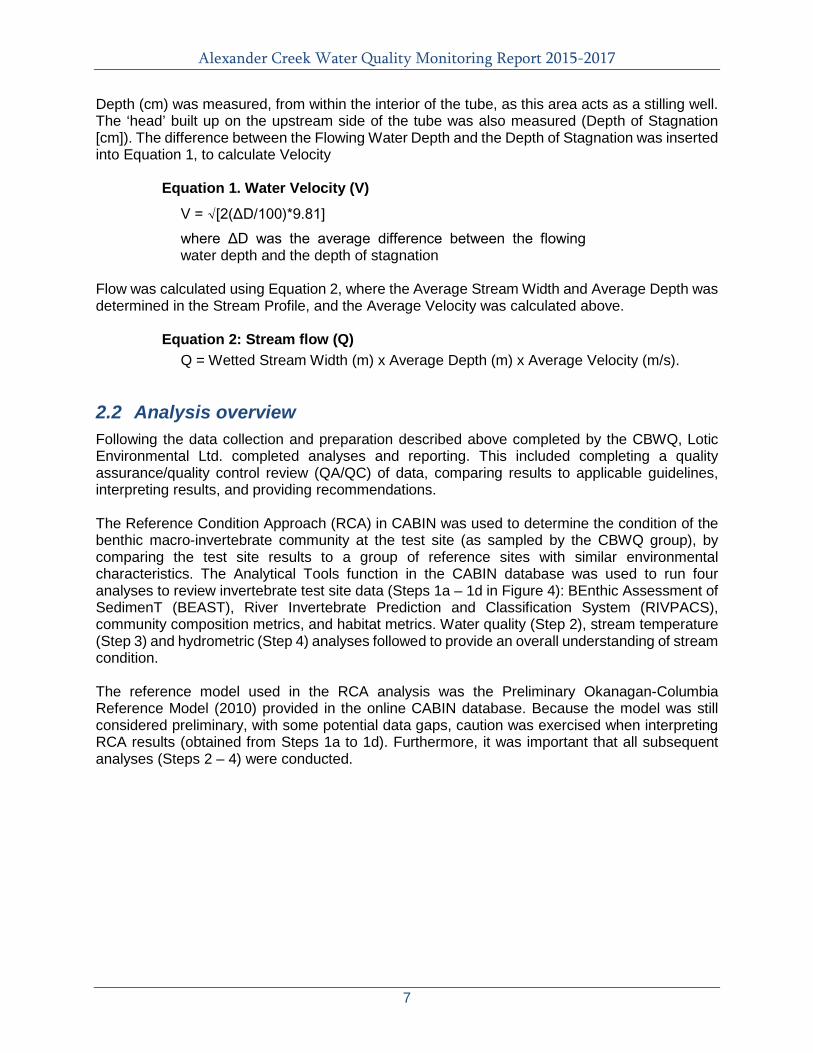
2.2 Analysis overview Following the data collection and preparation described above completed by the CBWQ, Lotic Environmental Ltd. completed analyses and reporting. This included completing a quality assurance/quality control review (QA/QC) of data, comparing results to applicable guidelines, interpreting results, and providing recommendations. The Reference Condition Approach (RCA) in CABIN was used to determine the condition of the benthic macro-invertebrate community at the test site (as sampled by the CBWQ group), by comparing the test site results to a group of reference sites with similar environmental characteristics. The Analytical Tools function in the CABIN database was used to run four analyses to review invertebrate test site data (Steps 1a – 1d in Figure 4): BEnthic Assessment of SedimenT (BEAST), River Invertebrate Prediction and Classification System (RIVPACS), community composition metrics, and habitat metrics. Water quality (Step 2), stream temperature (Step 3) and hydrometric (Step 4) analyses followed to provide an overall understanding of stream condition. The reference model used in the RCA analysis was the Preliminary Okanagan-Columbia Reference Model (2010) provided in the online CABIN database. Because the model was still considered preliminary, with some potential data gaps, caution was exercised when interpreting RCA results (obtained from Steps 1a to 1d). Furthermore, it was important that all subsequent analyses (Steps 2 – 4) were conducted.
Alexander Creek Water Quality Monitoring Report 2015-2017
8
Figure 4. Stream condition analysis steps.
2.3 CABIN data analysis
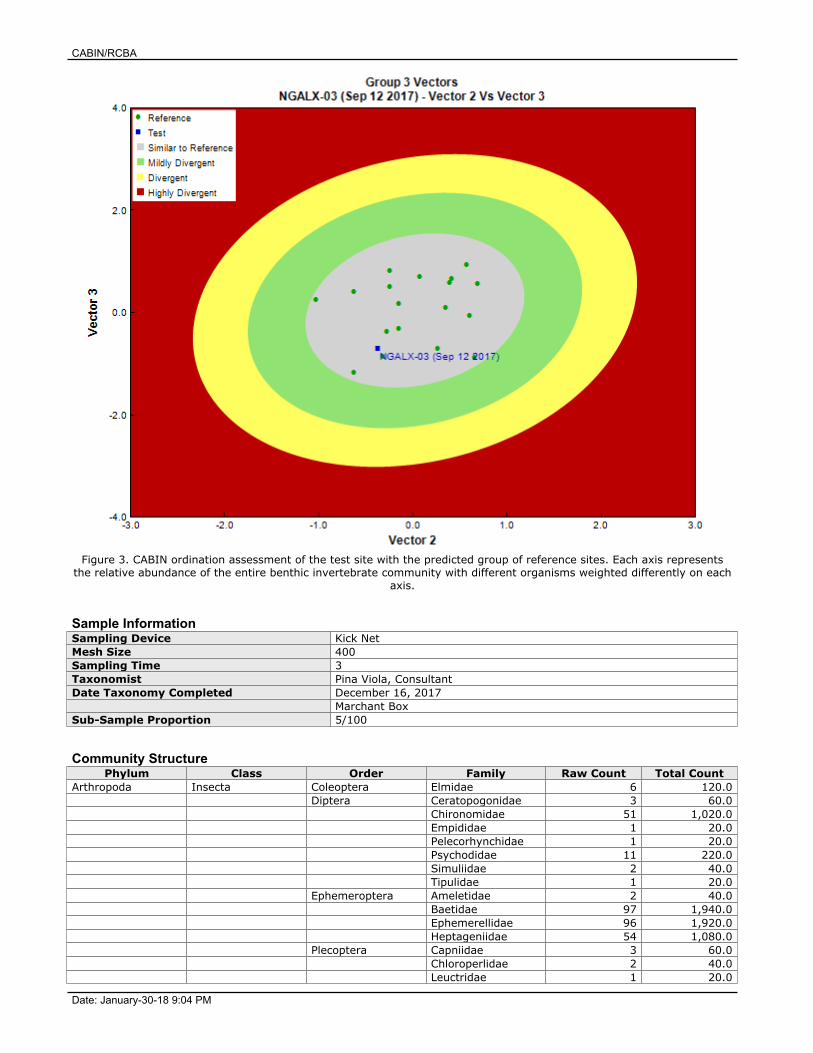
2.3.1 Reference Condition Approach: BEAST analysis and site assessment BEAST analysis was used to predict test sites to a reference group from the preliminary Okanagan-Columbia reference model provided by Environment Canada through the CABIN database. BEAST used a classification analysis that determined the probability of test site membership to a reference group based on habitat variables (Rosenberg et al. 1999). Habitat variables used to predict group membership in the Okanagan-Columbia reference model were latitude, longitude, percent area of watershed with a gradient <30%, percent area of watershed with permanent ice cover and average channel depth. CABIN model hybrid multi-dimensional scaling ordination assessment was then used to evaluate benthic community stress based on divergence from reference condition. This analysis placed test sites into assessment bands corresponding to a stress level ranging from unstressed to severely stressed. In the ordination assessment, sites that were unstressed fell within the 90% confidence ellipse around the cloud of reference sites, which means that their communities were similar or equivalent to reference (Rosenberg et al. 1999). Potentially stressed, stressed and severely stressed sites indicate mild divergence, divergence, or high divergence of the benthic community from reference condition (Rosenberg et al. 1999).
4. Hydrologic Conditions Were seasonal flows consistent?
3. Stream Temperature Did values exceed accepted water quality guidelines?
2. Water Quality Did any parameters exceed accepted water quality guidelines?
d. Habitat MetricsWhat was the habitat quality?
c. Community Composition MetricsWhat was the test site community composition?
b. RIVPACS AnalysisWhat taxa were expected at the test site and what was found?
a. Beast AnalysisAppropriate reference sites Community comparison to reference
1. CABIN Data Assessment
Alexander Creek Water Quality Monitoring Report 2015-2017
9
2.3.2 RIVPACS analysis RIVPACS ratios were calculated in the Analytical tools section of the CABIN database. RIVPACS analysis relied on presence/absence data for individual taxa. The RIVPACS ratio determined the ratio of observed taxa at test sites to taxa expected to be present at the test site based on their presence at reference sites. A RIVPACS ratio close to 1.00 indicated that a site was in good condition, as all taxa expected to be present were found at the test site. A RIVPACS ratio >1.00 could indicate community enrichment, while a ratio <1.00 could indicate that the benthic community was in poor condition.
2.3.3 Community composition metrics Benthic community composition metrics were calculated in the CABIN database using the Metrics section of the Analytical Tools menu. A collection of relevant measures of community richness, abundance, diversity and composition were selected to describe the test site communities. Using metrics, indicator attributes were used to interpret the response to environmental disturbances. Metrics are complimentary to an RCA analysis.
2.4 Water quality data analysis
2.4.1 Water quality QA/QC Raw data were first subjected to a quality control evaluation to assess the accuracy and precision of the laboratory and field methods. For all water samples analysed, the laboratory assessed accuracy through the use of matrix spike, spiked blank, and method blank samples. As well, the laboratory measured precision through duplicate sample analysis. As per standard practice, all laboratory quality control results were reviewed and confirmed to meet standard criteria prior to proceeding with processing of field samples (Maxxam 2012). Field duplicates were submitted to the laboratory to measure both field sampling error plus local environmental variance. Duplicate review was based on relative percent difference (RPD) as determined by Equation 3. For duplicate values at or greater than five times the Reportable Detection Limit (RDL), RPD values >50% indicated a problem, most likely either contamination or lack of sample representativeness (BC MoE 2003). Where RPD values were greater than 50%, the source of the problem was determined, and the impact upon the sample data ascertained (BC MoE 2003). If data were found to be within acceptable ranges, subsequent analyses included only the first of the duplicate samples. Equation 3: Duplicate sample quality control
Relative Percent Difference = (Absolute difference of duplicate 1 and 2/average of duplicate 1 and 2)*100
Duplicate 1 – Duplicate 2 (Duplicate 1+Duplicate 2)/2
Field blank data were collected to monitor possible contamination prior to receipt at the laboratory. Field blanks were collected using laboratory issued de-ionized water. Field blank results were analysed using Equation 4. Field blank values that were 2 times greater than the reportable detection limit were considered levels of alert (Maxxam 2012, Horvath pers. comm.). Field blank
X 100 RPD=
Alexander Creek Water Quality Monitoring Report 2015-2017
10
values that exceeded the alert level were reviewed in more detail to identify the potential source(s) for contamination; additionally, other data collected on that day were compared to historical data to identify if there were anomalies possibly related to contamination.
Equation 4: Field Blank sample quality control
Field Blank Value Reportable Detection Limit (RDL)
2.4.2 Guideline review A guideline is a maximum and/or a minimum value for a characteristic of water, which in order to prevent specified detrimental effects from occurring, should not be exceeded (BC MoE 2018). Water quality results were compared to the applicable provincial and federal guidelines for the protection of aquatic life and drinking water. Exceedances of guidelines were flagged to provide an understanding of the potential impacts to aquatic life or drinking water. When there was more than one guideline for a parameter, the following hierarchy was applied to determine the guideline that would apply (BC MoE 2016):
a. BC Approved Water Quality Guidelines (BC MoE 2018b) b. BC Working Water Quality Guidelines (BC MoE 2017) c. The Canadian Environmental Quality Guidelines (Canadian Council of Ministers of the
Environment [CCME] 2017), or Health Canada (2017). When both long-term and short-term exposure guidelines were available, the long-term guideline was reviewed, since sampling was assumed to have occurred under ‘normal’ conditions.
2.5 Stream temperature analysis The stream temperature data were reviewed against the BC stream temperature guidelines for the protection of aquatic life and drinking water that were most applicable to the monitored site. The aquatic life guidelines are dependent on the fish species (mostly salmonids) found in the stream for different life stages (rearing, spawning, and incubation) (BC MoE 2018b). Monthly stream temperature averages were also calculated and compared qualitatively among the years.
2.6 Hydrometric data analysis Hydrometric data were reviewed for consistency and anomalies. Streamflow results were graphed, with seasonal patterns compared qualitatively amongst the years.
Blank x difference =
Alexander Creek Water Quality Monitoring Report 2015-2017
11
3 Results
3.1 CABIN results
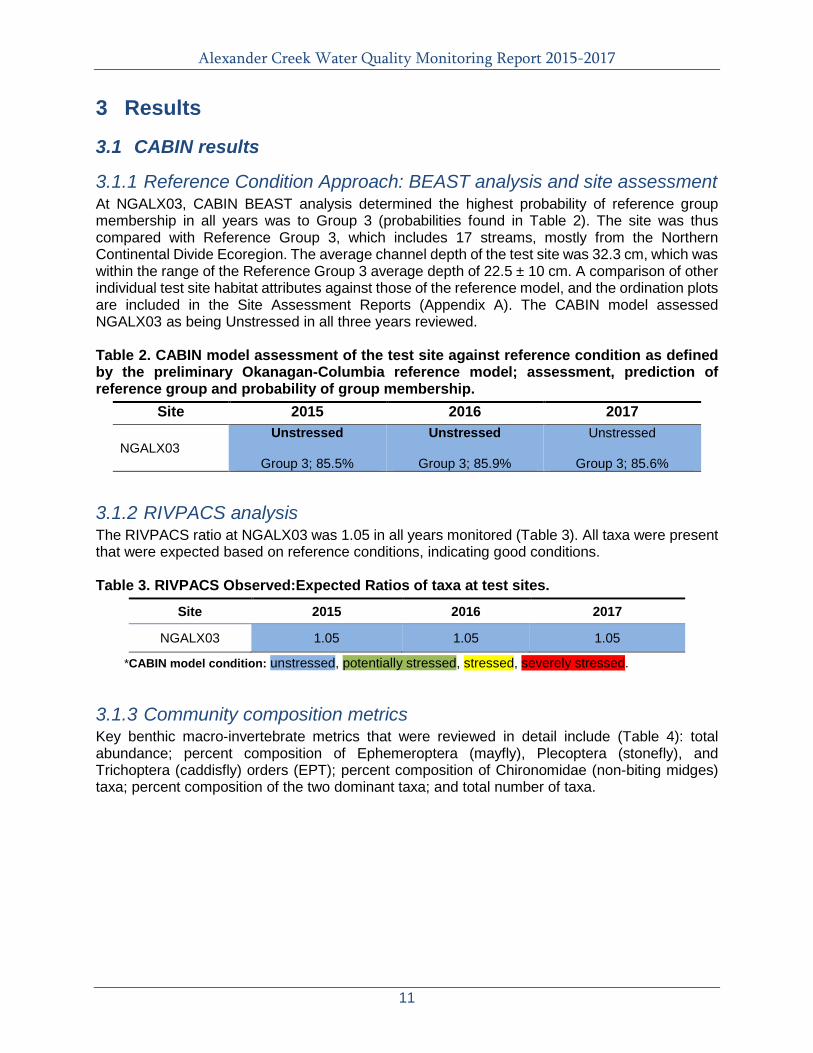
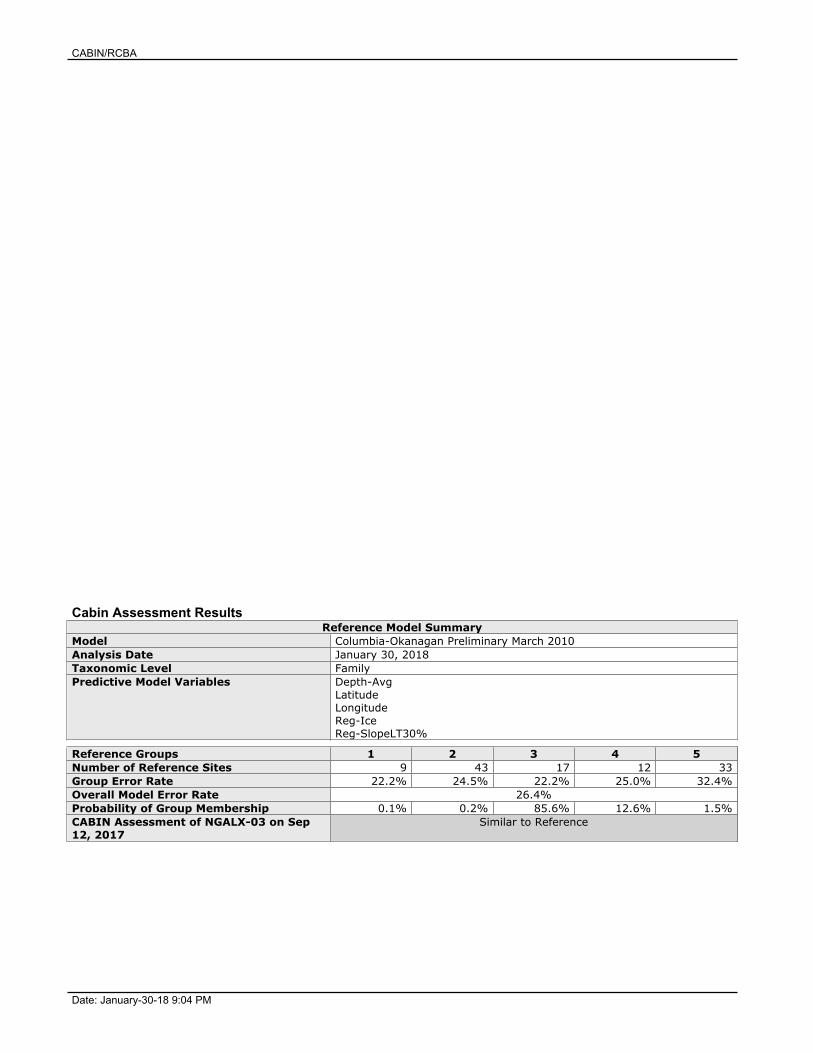
3.1.1 Reference Condition Approach: BEAST analysis and site assessment At NGALX03, CABIN BEAST analysis determined the highest probability of reference group membership in all years was to Group 3 (probabilities found in Table 2). The site was thus compared with Reference Group 3, which includes 17 streams, mostly from the Northern Continental Divide Ecoregion. The average channel depth of the test site was 32.3 cm, which was within the range of the Reference Group 3 average depth of 22.5 ± 10 cm. A comparison of other individual test site habitat attributes against those of the reference model, and the ordination plots are included in the Site Assessment Reports (Appendix A). The CABIN model assessed NGALX03 as being Unstressed in all three years reviewed. Table 2. CABIN model assessment of the test site against reference condition as defined by the preliminary Okanagan-Columbia reference model; assessment, prediction of reference group and probability of group membership.
Site 2015 2016 2017
NGALX03 Unstressed
Group 3; 85.5%
Unstressed
Group 3; 85.9%
Unstressed
Group 3; 85.6%
3.1.2 RIVPACS analysis The RIVPACS ratio at NGALX03 was 1.05 in all years monitored (Table 3). All taxa were present that were expected based on reference conditions, indicating good conditions. Table 3. RIVPACS Observed:Expected Ratios of taxa at test sites.
Site 2015 2016 2017
NGALX03 1.05 1.05 1.05
*CABIN model condition: unstressed, potentially stressed, stressed, severely stressed.
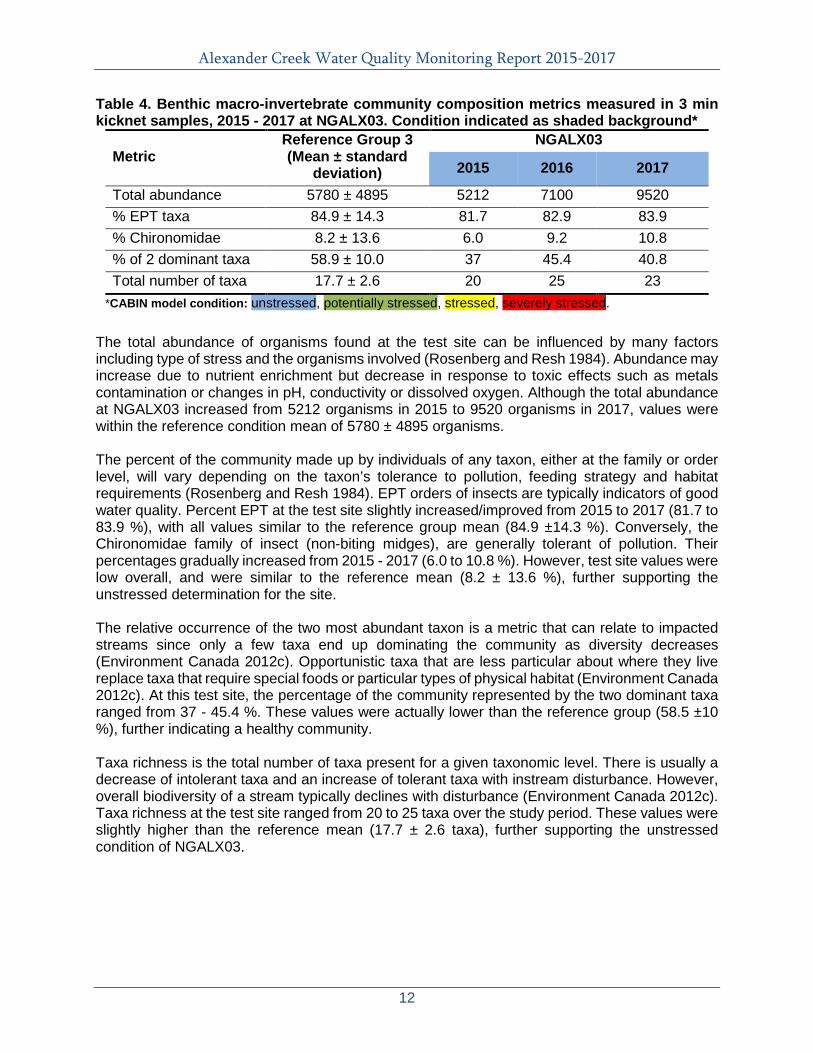
3.1.3 Community composition metrics Key benthic macro-invertebrate metrics that were reviewed in detail include (Table 4): total abundance; percent composition of Ephemeroptera (mayfly), Plecoptera (stonefly), and Trichoptera (caddisfly) orders (EPT); percent composition of Chironomidae (non-biting midges) taxa; percent composition of the two dominant taxa; and total number of taxa.
Alexander Creek Water Quality Monitoring Report 2015-2017
12
Table 4. Benthic macro-invertebrate community composition metrics measured in 3 min kicknet samples, 2015 - 2017 at NGALX03. Condition indicated as shaded background*
Metric Reference Group 3 (Mean ± standard
deviation)
NGALX03
2015 2016 2017
Total abundance 5780 ± 4895 5212 7100 9520 % EPT taxa 84.9 ± 14.3 81.7 82.9 83.9 % Chironomidae 8.2 ± 13.6 6.0 9.2 10.8 % of 2 dominant taxa 58.9 ± 10.0 37 45.4 40.8 Total number of taxa 17.7 ± 2.6 20 25 23
*CABIN model condition: unstressed, potentially stressed, stressed, severely stressed. The total abundance of organisms found at the test site can be influenced by many factors including type of stress and the organisms involved (Rosenberg and Resh 1984). Abundance may increase due to nutrient enrichment but decrease in response to toxic effects such as metals contamination or changes in pH, conductivity or dissolved oxygen. Although the total abundance at NGALX03 increased from 5212 organisms in 2015 to 9520 organisms in 2017, values were within the reference condition mean of 5780 ± 4895 organisms. The percent of the community made up by individuals of any taxon, either at the family or order level, will vary depending on the taxon’s tolerance to pollution, feeding strategy and habitat requirements (Rosenberg and Resh 1984). EPT orders of insects are typically indicators of good water quality. Percent EPT at the test site slightly increased/improved from 2015 to 2017 (81.7 to 83.9 %), with all values similar to the reference group mean (84.9 ±14.3 %). Conversely, the Chironomidae family of insect (non-biting midges), are generally tolerant of pollution. Their percentages gradually increased from 2015 - 2017 (6.0 to 10.8 %). However, test site values were low overall, and were similar to the reference mean (8.2 ± 13.6 %), further supporting the unstressed determination for the site. The relative occurrence of the two most abundant taxon is a metric that can relate to impacted streams since only a few taxa end up dominating the community as diversity decreases (Environment Canada 2012c). Opportunistic taxa that are less particular about where they live replace taxa that require special foods or particular types of physical habitat (Environment Canada 2012c). At this test site, the percentage of the community represented by the two dominant taxa ranged from 37 - 45.4 %. These values were actually lower than the reference group (58.5 ±10 %), further indicating a healthy community. Taxa richness is the total number of taxa present for a given taxonomic level. There is usually a decrease of intolerant taxa and an increase of tolerant taxa with instream disturbance. However, overall biodiversity of a stream typically declines with disturbance (Environment Canada 2012c). Taxa richness at the test site ranged from 20 to 25 taxa over the study period. These values were slightly higher than the reference mean (17.7 ± 2.6 taxa), further supporting the unstressed condition of NGALX03.
Alexander Creek Water Quality Monitoring Report 2015-2017
13
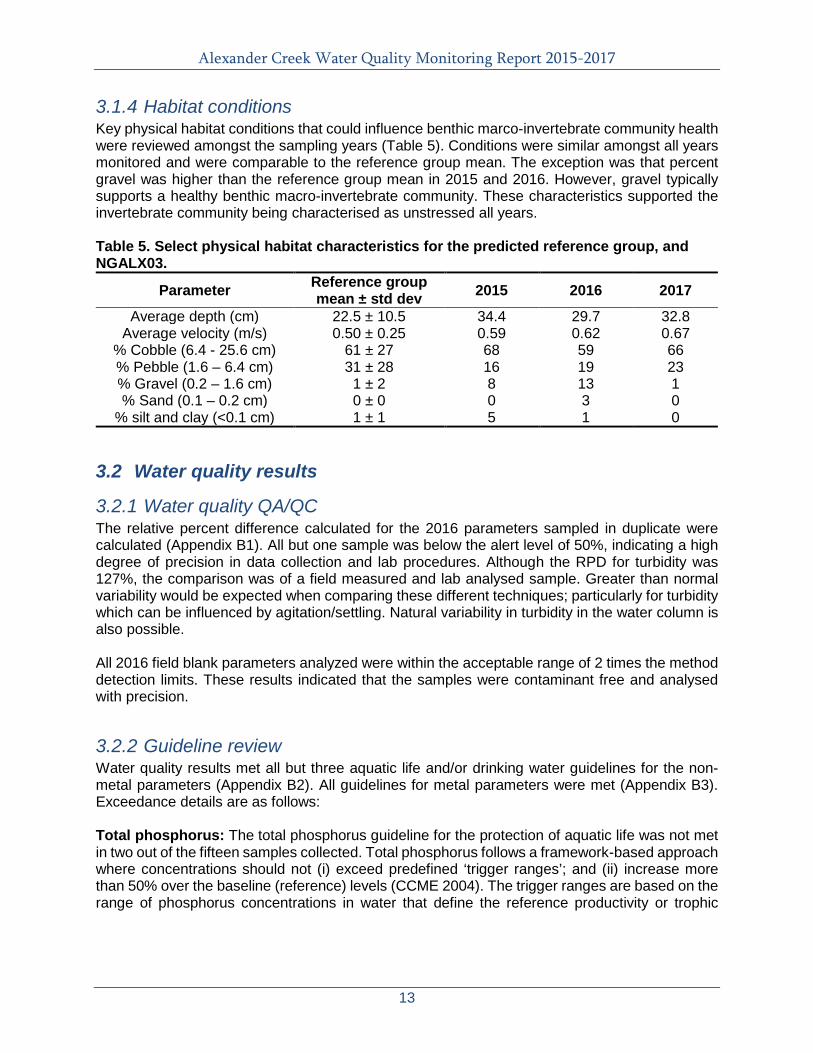
3.1.4 Habitat conditions Key physical habitat conditions that could influence benthic marco-invertebrate community health were reviewed amongst the sampling years (Table 5). Conditions were similar amongst all years monitored and were comparable to the reference group mean. The exception was that percent gravel was higher than the reference group mean in 2015 and 2016. However, gravel typically supports a healthy benthic macro-invertebrate community. These characteristics supported the invertebrate community being characterised as unstressed all years. Table 5. Select physical habitat characteristics for the predicted reference group, and NGALX03.
Parameter Reference group mean ± std dev 2015 2016 2017
Average depth (cm) 22.5 ± 10.5 34.4 29.7 32.8 Average velocity (m/s) 0.50 ± 0.25 0.59 0.62 0.67
% Cobble (6.4 - 25.6 cm) 61 ± 27 68 59 66 % Pebble (1.6 – 6.4 cm) 31 ± 28 16 19 23 % Gravel (0.2 – 1.6 cm) 1 ± 2 8 13 1 % Sand (0.1 – 0.2 cm) 0 ± 0 0 3 0
% silt and clay (<0.1 cm) 1 ± 1 5 1 0
3.2 Water quality results
3.2.1 Water quality QA/QC The relative percent difference calculated for the 2016 parameters sampled in duplicate were calculated (Appendix B1). All but one sample was below the alert level of 50%, indicating a high degree of precision in data collection and lab procedures. Although the RPD for turbidity was 127%, the comparison was of a field measured and lab analysed sample. Greater than normal variability would be expected when comparing these different techniques; particularly for turbidity which can be influenced by agitation/settling. Natural variability in turbidity in the water column is also possible. All 2016 field blank parameters analyzed were within the acceptable range of 2 times the method detection limits. These results indicated that the samples were contaminant free and analysed with precision.
3.2.2 Guideline review Water quality results met all but three aquatic life and/or drinking water guidelines for the non-metal parameters (Appendix B2). All guidelines for metal parameters were met (Appendix B3). Exceedance details are as follows: Total phosphorus: The total phosphorus guideline for the protection of aquatic life was not met in two out of the fifteen samples collected. Total phosphorus follows a framework-based approach where concentrations should not (i) exceed predefined ‘trigger ranges’; and (ii) increase more than 50% over the baseline (reference) levels (CCME 2004). The trigger ranges are based on the range of phosphorus concentrations in water that define the reference productivity or trophic
Alexander Creek Water Quality Monitoring Report 2015-2017
14
status2 for the site (CCME 2004). Excluding the two highest values, total phosphorus ranged from <0.005 - 0.010 mg/L at NGALX03. Based on this data, the baseline range for total phosphorus was determined to be 0.004 - 0.010 mg/L, representing oligotrophic conditions. This is typical of unimpacted areas and generally supports diverse and abundant aquatic life and is self-sustaining (CCME 2004). Data was evaluated against the site-specific guideline, calculated as 1.5 x the upper end of the baseline range, which is equivalent to 0.015 µg/L. The exceedances occurred in April 2015 and May 2017, with values of 0.018 and 0.024 mg/l, respectively. Nutrient loading into a watercourse is anticipated during the spring, as a result of melting snow and rain events causing overland runoff. Since the exceedances were not prolonged, aquatic life impacts were not expected. Turbidity and Total Suspended Solids (TSS): The guidelines for turbidity and TSS refer to changes from background, resulting from a direct/known anthropogenic activity (e.g., construction). Because there was no such specific activity, a comparison to the guidelines was not applicable. However, it was noted that turbidity and TSS increased during the spring high flow period (freshet), from April - June. On May 26, 2015, values were highest with turbidity at 39.2 NTU, and TSS at 51.8 mg/l. Conversely, during the clear flow period, turbidity was below 2 NTU and TSS was less than the detectable limit of 4 mg/l. It is normal for these increases to occur during the spring freshet, but they can be exacerbated by loss of vegetative cover in the watershed. These baseline data will be valuable for monitoring changes that may occur with increased development.
3.3 Stream temperature results Temperature plays an important role in many biological, chemical, and physical processes. The effects of temperature on aquatic organisms are listed in the technical appendix for the BC MoE approved water quality guideline (Oliver & Fidler 2001), with the following generally occurring in aquatic organisms as water temperatures increase:
o Increased cardiovascular and respiratory functions, which in turn may increase the uptake of chemical toxins.
o Increased oxygen demand, while the dissolved oxygen content of water decreases. o Reduced ability to cope with swimming demands, which is compounded by biological
stresses such as predation and disease. o In waters where dissolved gases are supersaturated, elevated water temperatures may
worsen the effects of gas bubble trauma in fish. Overall, monthly average water temperatures were fairly consistent among the three years sampled at NGALX03 (Table 6). Monitoring over a longer time period would be required to determine trends.
2 Trophic status refers to the productivity of a waterbody, with eutrophic systems having high productivity and oligotrophic having low. Nutrient addition, primarily phosphorus, contributes to eutrophication, which is when the waterbody’s productivity is accelerated from natural (Wetzel 2001).
Alexander Creek Water Quality Monitoring Report 2015-2017
15
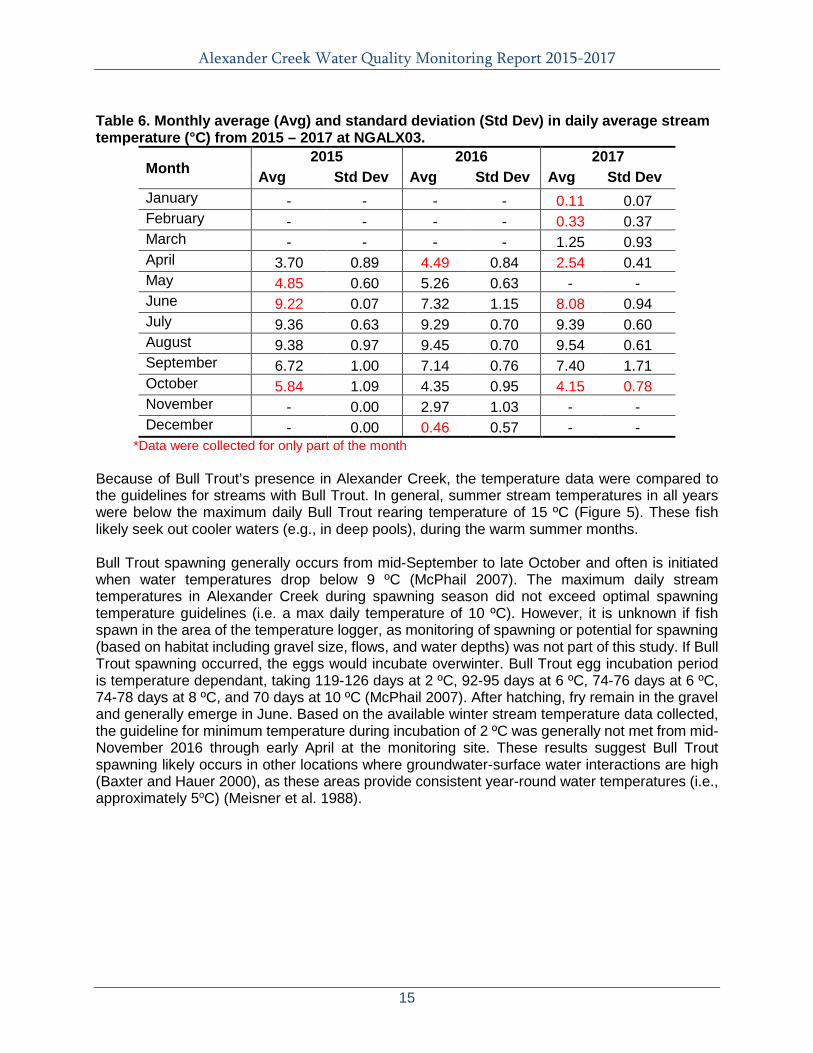
Table 6. Monthly average (Avg) and standard deviation (Std Dev) in daily average stream temperature (°C) from 2015 – 2017 at NGALX03.
Month 2015 2016 2017
Avg Std Dev Avg Std Dev Avg Std Dev January - - - - 0.11 0.07 February - - - - 0.33 0.37 March - - - - 1.25 0.93 April 3.70 0.89 4.49 0.84 2.54 0.41 May 4.85 0.60 5.26 0.63 - - June 9.22 0.07 7.32 1.15 8.08 0.94 July 9.36 0.63 9.29 0.70 9.39 0.60 August 9.38 0.97 9.45 0.70 9.54 0.61 September 6.72 1.00 7.14 0.76 7.40 1.71 October 5.84 1.09 4.35 0.95 4.15 0.78 November - 0.00 2.97 1.03 - - December - 0.00 0.46 0.57 - -
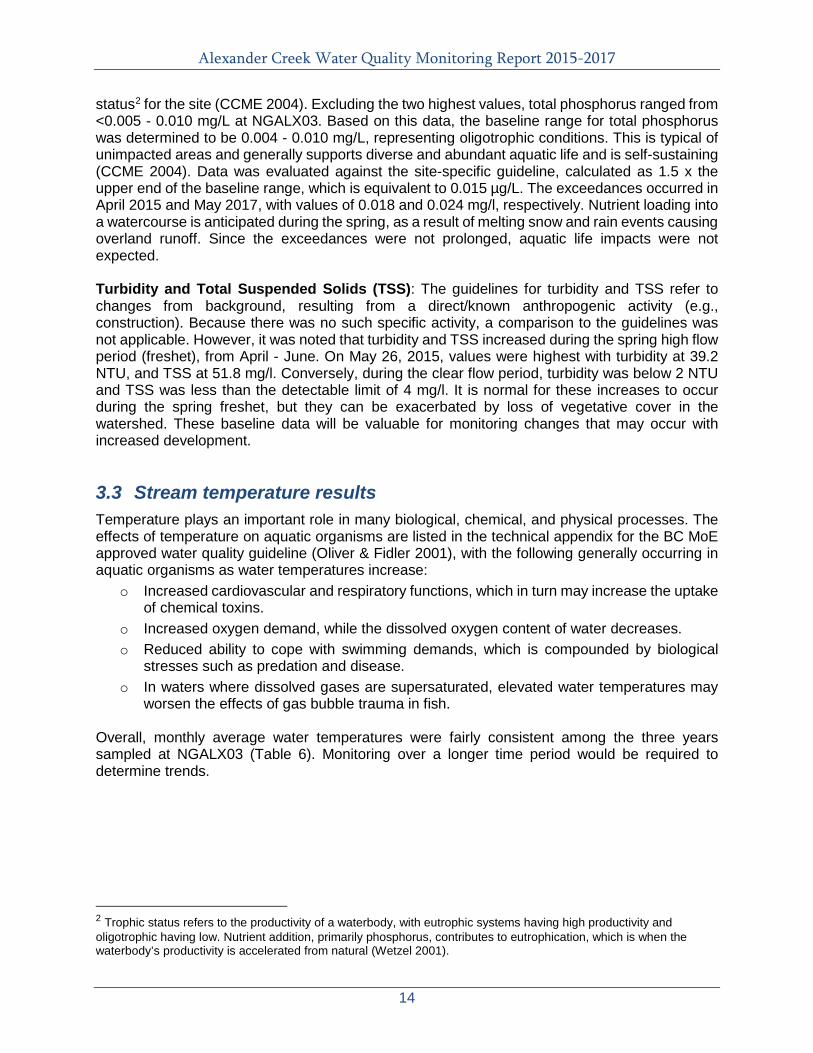
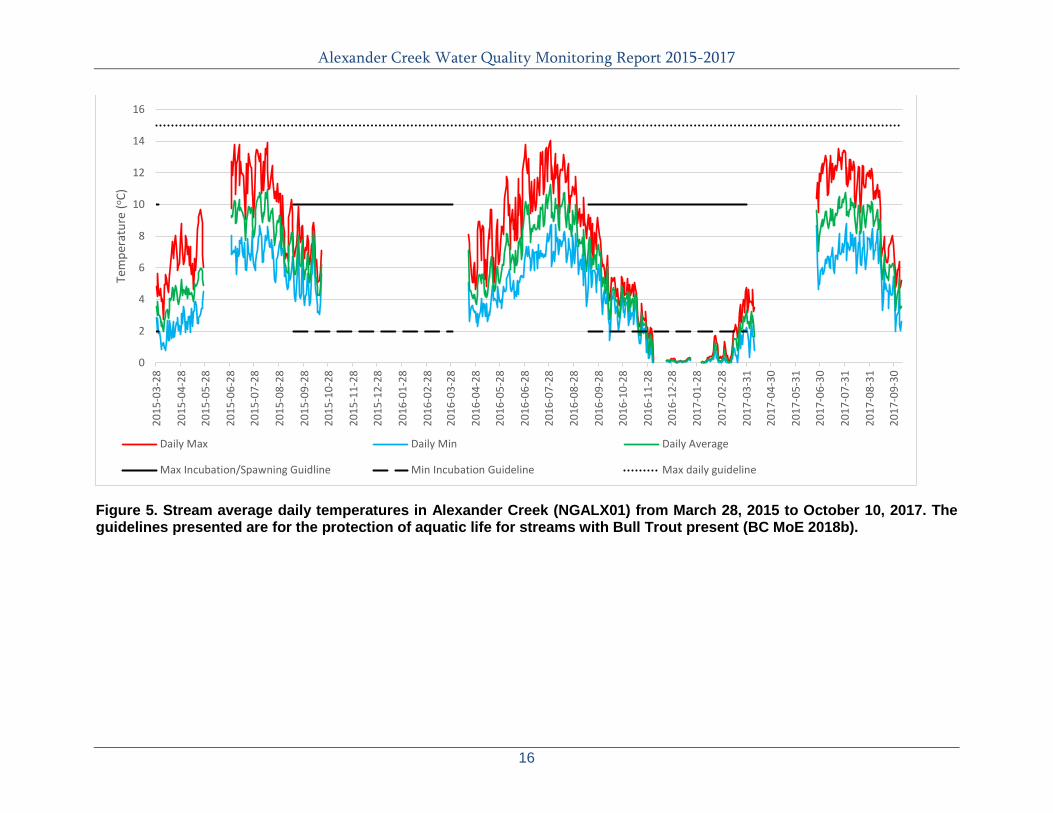
*Data were collected for only part of the month Because of Bull Trout’s presence in Alexander Creek, the temperature data were compared to the guidelines for streams with Bull Trout. In general, summer stream temperatures in all years were below the maximum daily Bull Trout rearing temperature of 15 ºC (Figure 5). These fish likely seek out cooler waters (e.g., in deep pools), during the warm summer months. Bull Trout spawning generally occurs from mid-September to late October and often is initiated when water temperatures drop below 9 ºC (McPhail 2007). The maximum daily stream temperatures in Alexander Creek during spawning season did not exceed optimal spawning temperature guidelines (i.e. a max daily temperature of 10 ºC). However, it is unknown if fish spawn in the area of the temperature logger, as monitoring of spawning or potential for spawning (based on habitat including gravel size, flows, and water depths) was not part of this study. If Bull Trout spawning occurred, the eggs would incubate overwinter. Bull Trout egg incubation period is temperature dependant, taking 119-126 days at 2 ºC, 92-95 days at 6 ºC, 74-76 days at 6 ºC, 74-78 days at 8 ºC, and 70 days at 10 ºC (McPhail 2007). After hatching, fry remain in the gravel and generally emerge in June. Based on the available winter stream temperature data collected, the guideline for minimum temperature during incubation of 2 ºC was generally not met from mid-November 2016 through early April at the monitoring site. These results suggest Bull Trout spawning likely occurs in other locations where groundwater-surface water interactions are high (Baxter and Hauer 2000), as these areas provide consistent year-round water temperatures (i.e., approximately 5oC) (Meisner et al. 1988).
Alexander Creek Water Quality Monitoring Report 2015-2017
16
Figure 5. Stream average daily temperatures in Alexander Creek (NGALX01) from March 28, 2015 to October 10, 2017. The guidelines presented are for the protection of aquatic life for streams with Bull Trout present (BC MoE 2018b).
0
2
4
6
8
10
12
14
16
2015
-03-
28
2015
-04-
28
2015
-05-
28
2015
-06-
28
2015
-07-
28
2015
-08-
28
2015
-09-
28
2015
-10-
28
2015
-11-
28
2015
-12-
28
2016
-01-
28
2016
-02-
28
2016
-03-
28
2016
-04-
28
2016
-05-
28
2016
-06-
28
2016
-07-
28
2016
-08-
28
2016
-09-
28
2016
-10-
28
2016
-11-
28
2016
-12-
28
2017
-01-
28
2017
-02-
28
2017
-03-
31
2017
-04-
30
2017
-05-
31
2017
-06-
30
2017
-07-
31
2017
-08-
31
2017
-09-
30
Tem
pera
ture
(o C)
Daily Max Daily Min Daily Average
Max Incubation/Spawning Guidline Min Incubation Guideline Max daily guideline
Alexander Creek Water Quality Monitoring Report 2015-2017
17
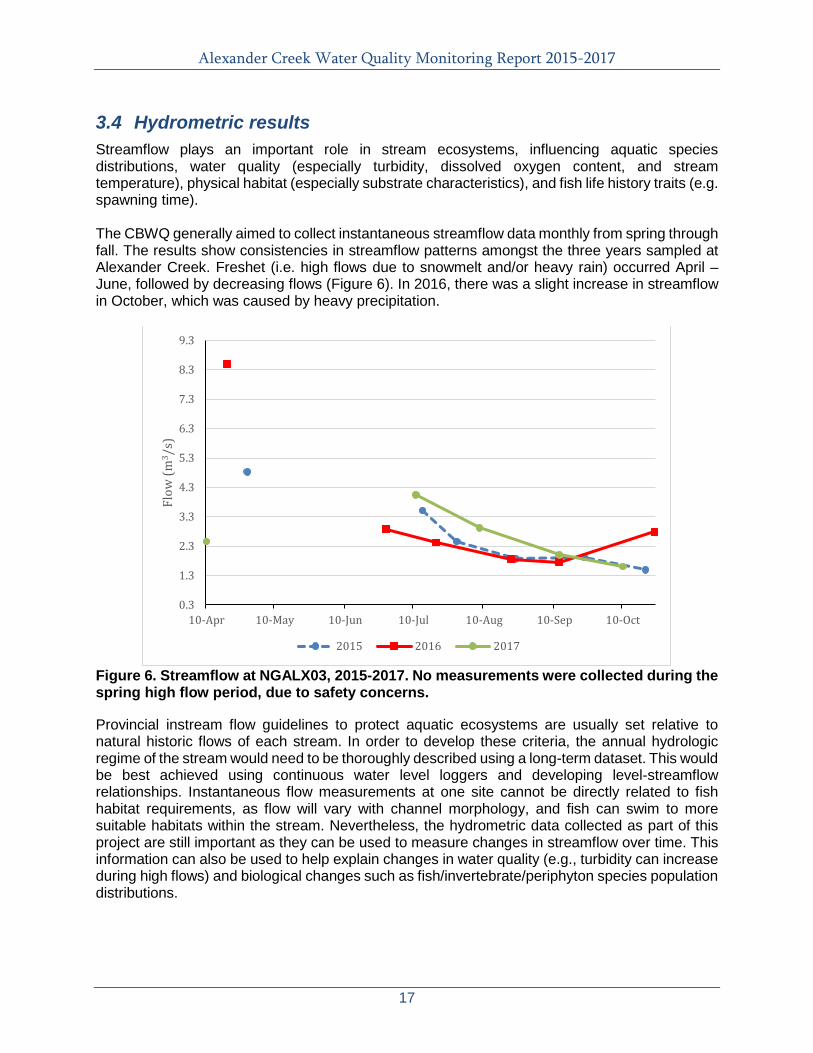
3.4 Hydrometric results Streamflow plays an important role in stream ecosystems, influencing aquatic species distributions, water quality (especially turbidity, dissolved oxygen content, and stream temperature), physical habitat (especially substrate characteristics), and fish life history traits (e.g. spawning time). The CBWQ generally aimed to collect instantaneous streamflow data monthly from spring through fall. The results show consistencies in streamflow patterns amongst the three years sampled at Alexander Creek. Freshet (i.e. high flows due to snowmelt and/or heavy rain) occurred April – June, followed by decreasing flows (Figure 6). In 2016, there was a slight increase in streamflow in October, which was caused by heavy precipitation.
Figure 6. Streamflow at NGALX03, 2015-2017. No measurements were collected during the spring high flow period, due to safety concerns. Provincial instream flow guidelines to protect aquatic ecosystems are usually set relative to natural historic flows of each stream. In order to develop these criteria, the annual hydrologic regime of the stream would need to be thoroughly described using a long-term dataset. This would be best achieved using continuous water level loggers and developing level-streamflow relationships. Instantaneous flow measurements at one site cannot be directly related to fish habitat requirements, as flow will vary with channel morphology, and fish can swim to more suitable habitats within the stream. Nevertheless, the hydrometric data collected as part of this project are still important as they can be used to measure changes in streamflow over time. This information can also be used to help explain changes in water quality (e.g., turbidity can increase during high flows) and biological changes such as fish/invertebrate/periphyton species population distributions.
0.3
1.3
2.3
3.3
4.3
5.3
6.3
7.3
8.3
9.3
10-Apr 10-May 10-Jun 10-Jul 10-Aug 10-Sep 10-Oct
Flow
(m3 /
s)
2015 2016 2017
Alexander Creek Water Quality Monitoring Report 2015-2017
18
4 Conclusions The CABIN analysis of the benthic macro-invertebrate monitoring results identified NGALX03 as being unstressed in all three years sampled (2015-2017). This was evident through all taxa being present that were expected based on reference group conditions, as well as key metrics (i.e., total abundance, % EPT taxa, % chironomidae, % two most dominant taxa, and taxa richness), being similar or better than the reference group values. The benthic macro-invertebrate results were supported by the water quality and hydrometric results. Water quality was good at NGALX03, with total phosphorous being the only parameter to exceed the aquatic life guidelines. The exceedances occurred once in the spring of 2015 and once in the spring of 2017. All drinking water guidelines were met. Stream temperatures in spring through fall did not exceed the guidelines for the protection of Bull Trout rearing. The Bull Trout minimum stream temperature guideline for egg incubation was regularly not met during the winter months. However, this study did not review whether the monitoring site was actually used by this species for spawning. Fish would be expected to seek out suitable habitat elsewhere in the watershed. Flows followed a typical nival pattern, with higher flows in the spring during freshet and decreasing throughout the summer and fall towards baseflow in the winter months.
5 Recommendations The existing monitoring program was very useful for developing a baseline. Three years of monitoring provides a good picture of aquatic invertebrate health and water quality, assuming that the years captured were relatively representative of general conditions in the watershed and there were no changes in land-use during the years monitored. This information can be used in the future to identify if there are any water quality or benthic macro-invertebrate changes caused by increased disturbance. Obtaining data over a longer period, of course, would help provide a greater understanding of natural variability in the system over time, but we recognize that resources are limited and a three-year period is realistic and achievable. Once baseline data have been attained, sampling should be focussed on other locations experiencing ongoing development pressures. There is a variety of other information that was outside of the scope of this monitoring project that could be potentially collected to support a baseline understanding of a watershed. This may include, but not be limited to: 1) determining the hydrologic regime of the stream using continuous level loggers, 2) conducting fish habitat assessments, 3) conducting fish assessments (e.g., composition, abundance and life-history use). The Elk River Alliance would need to look at existing data available, to determine where there were information gaps needing to be filled.
Alexander Creek Water Quality Monitoring Report 2015-2017
19
6 References Baxter, C.V., and F.R. Hauer. 2000. Geomorphology, hyporheic exchange, and selection of
spawning habitat by bull trout (Salvelinus confluentus). Canadian Journal of Fisheries and Aquatic Sciences. 57(7): 1470-1481.
BC Ministry of Environment (BC MoE). 2018a. Fish Information Summary System. Website: http://a100.gov.bc.ca/pub/fidq/main.do;jsessionid=31f493fcb8d91d759539bbbaf51d5deeb30bb2a7b641610f3d1f4a0e1ab70fcc.e3uMah8KbhmLe3iLbNaObxmSay1ynknvrkLOlQzNp65In0
BC Ministry of Environment. 2018b. British Columbia Approved Water Quality Guidelines. Environmental Protection and Sustainability Branch. Accessed at: https://www2.gov.bc.ca/gov/content/environment/air-land-water/water/water-quality/water-quality-guidelines/approved-water-quality-guidelines.
BC Ministry of Environment. 2017. British Columbia Working Water Quality Guidelines: Aquatic Life, Wildlife, and Agriculture. Water Protection and Sustainability Branch. Accessed at: https://www2.gov.bc.ca/assets/gov/environment/air-land-water/water/waterquality/wqgs-wqos/bc_env_working_water_quality_guidelines.pdf.
BC Ministry of Environment. 2016. Environmental Management Act Authorizations, Technical Guidance 4: Annual Reporting Under the Environmental Management Act. Version 1.3. Accessed at: http://www2.gov.bc.ca/assets/gov/environment/waste-management/industrial-waste/industrial-waste/mining-smelt-energy/annual_reporting_guidance_for_mines.pdf
BC Ministry of Environment. 2003. Water quality field sampling manual. Government of British Columbia.
BC CDC (BC Conservation Data Centre). 2018. BC Species and Ecosystems Explorer. B.C. Ministry of Environment. Accessed at: http://a100.gov.bc.ca/pub/eswp/.
Burger, G., J. Schulla, and T. Werner. 2011. Estimates of future flow, including extremes, of the Columbia River headwaters. Water Resources Research, 47: W10520, doi:10.1029/2010WR009716.
Carver, M. 2017. Water Monitoring and Climate Change in the Upper Columbia Basin Summary of Current Status and Opportunities. Report prepared for the Columbia Basin Trust.
CCME. 2018. Canadian Water Quality Guidelines for the Protection of Aquatic Life: Introduction. Updated 2001. Cited in Canadian Environmental Quality Guidelines,1999 (plus updates), Canadian Council of Ministers of the Environment, Winnipeg. Accessed at: http://ceqg-rcqe.ccme.ca/
CCME. 2004. Canadian water quality guidelines for the protection of aquatic life: Phosphorus: Canadian Guidance Framework for the Management of Freshwater Systems. In: Canadian environmental quality guidelines, 2004, Canadian Council of Ministers of the Environment, Winnipeg.
Alexander Creek Water Quality Monitoring Report 2015-2017
20
Columbia Basin Water Quality Monitoring Program (CBWQ). 2012. Operating Procedures.
Environment Canada. 2012a. Canadian Aquatic Biomonitoring Network: Wadeable Streams Field Manual. Accessed at: http://ec.gc.ca/Publications/default.asp?lang=En&xml=C183563B-CF3E-42E3-9A9E-F7CC856219E1.
Environment Canada. 2012b. Canadian Aquatic Biomonitoring Network Laboratory Methods: Processing, Taxonomy and Quality Control of benthic Macro-invertebrate Samples. Accessed at: http://www.ec.gc.ca/Publications/default.asp?lang=En&xml=CDC2A655-A527-41F0-9E61-824BD4288B98
Environment Canada 2012c. CABIN Module 3 – sample processing and introduction to taxonomy and benthic macro-invertebrates.
Grieve, D.A. and Price, R.A. 1987. Preliminary Map No. 63: Geology of the Elk Valley Coalfield (South Half) (NTS 082G15,082J/02). BC Ministry of Energy and Mines. Accessed at: http://www.empr.gov.bc.ca/Mining/Geoscience/Publications. Catalogue/Maps/PreliminaryMaps/Pages/63.aspx .
Health Canada. 2017. Guidelines for Canadian Drinking Water Quality. Accessed at: https://www.canada.ca/en/health-canada/services/environmental-workplace-health/reports-publications/water-quality/guidelines-canadian-drinking-water-quality-summary-table.html.
Jost, G., R.D. Moore, D. Gluns, and R.S. Smith. 2012. Quantifying the contribution of glacier runoff to streamflow in the upper Columbia River basin, Canada. Hydrology and Earth Systems Science 16: 849-860, doi:10.5194/hess-16-1-2012.
Maxxam Analytics. 2012. Environmental QA/QC Interpretation Guide (COR FCD-00097/5).
McPhail, J.D. 2007. The freshwater fishes of British Columbia. The University of Alberta Press. Edmonton, Alberta. 620 p.
Meisner, J.D., Rosenfeld, J.S., Regier, H.A., 1988. The role of groundwater in the impact of climate warming on stream salmonines. Fisheries 13, 2–8. Cited in MacDonald, R.J., S Boon, J.M. Byrne. 2014. A process-based stream temperature modelling approach for mountain regions. Journal of Hydrology 511:920-931.
Oliver G.G., and L.E. Fidler. 2001. Towards a Water Quality Guideline for Temperature in the Province of British Columbia. Prepared by Aspen Applied Sciences Ltd. for the B.C. Ministry of Environment, Lands, and Parks. 54 pp + appendices.
Rosenberg, D.M., T.B. Reynoldson and V.H. Resh. 1999. Establishing reference conditions for benthic invertebrate monitoring in the Fraser River Catchment British Columbia, Canada. Fraser River Action Plan, Environment Canada, Vancouver BC Accessed at: http://www.rem. sfu.ca/FRAP/9832.pdf
Swain, L. G. 2007. Water Quality Assessment of Elk River at Highway 93 near Elko (1968-2005). BC Ministry of Environment and Environment Canada.
Alexander Creek Water Quality Monitoring Report 2015-2017
21
Wetzel, R.G. 2001. Limnology – Lake and River Ecosystems (third edition). Academic Press, San Diego, USA. 1006 pp.
Personal Communications
Horvath, Steve. Senior lab officer. Water and air monitoring & reporting section, BC Ministry of Environment, Surrey.
Alexander Creek Water Quality Monitoring Report 2015-2017
22
Appendix A. CABIN data
CABIN/RCBA
Date: September-09-16 10:59 AM
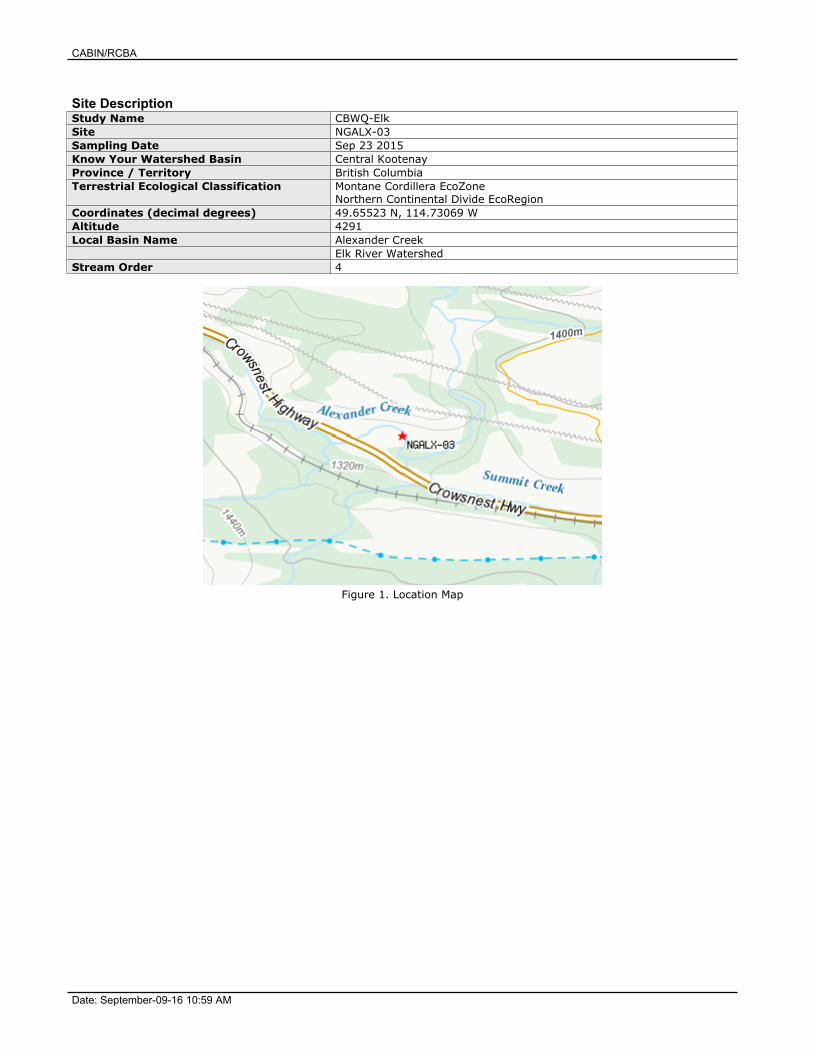
Site DescriptionStudy Name CBWQ-ElkSite NGALX-03Sampling Date Sep 23 2015Know Your Watershed Basin Central KootenayProvince / Territory British ColumbiaTerrestrial Ecological Classification Montane Cordillera EcoZone
Northern Continental Divide EcoRegionCoordinates (decimal degrees) 49.65523 N, 114.73069 WAltitude 4291Local Basin Name Alexander Creek
Elk River WatershedStream Order 4
Figure 1. Location Map
CABIN/RCBA
Date: September-09-16 10:59 AM
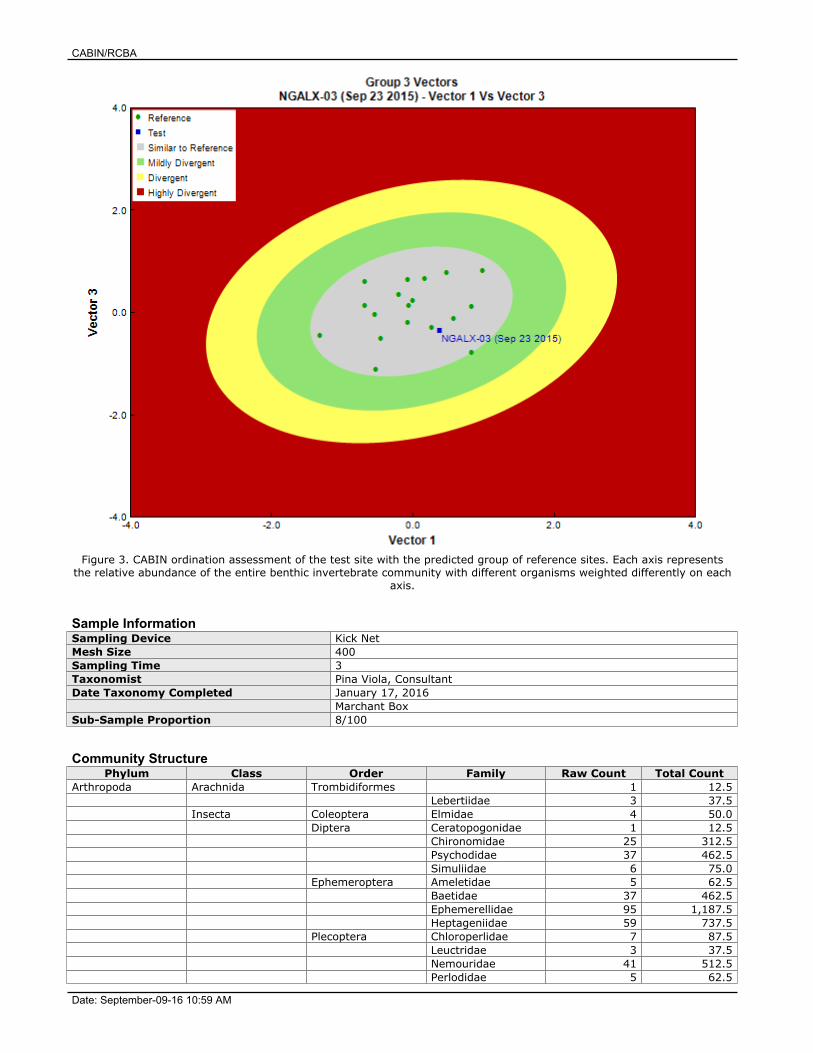
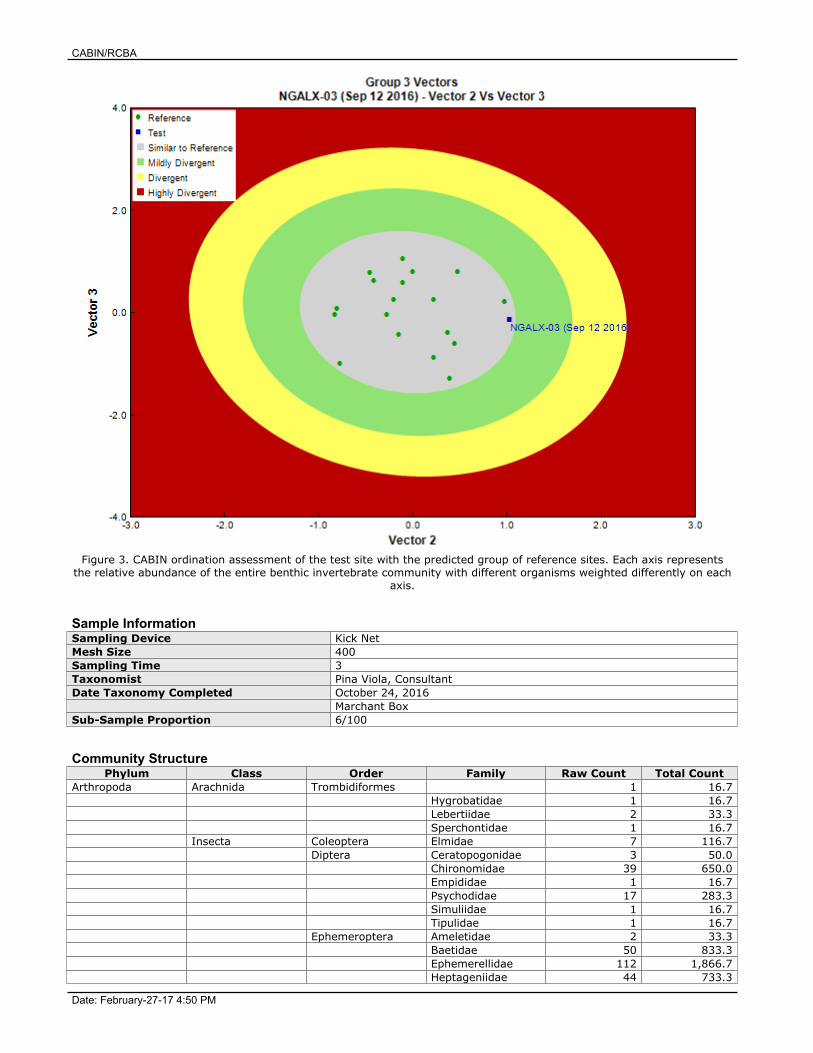
Figure 3. CABIN ordination assessment of the test site with the predicted group of reference sites. Each axis representsthe relative abundance of the entire benthic invertebrate community with different organisms weighted differently on each
axis.
Sample InformationSampling Device Kick NetMesh Size 400Sampling Time 3Taxonomist Pina Viola, ConsultantDate Taxonomy Completed January 17, 2016
Marchant BoxSub-Sample Proportion 8/100
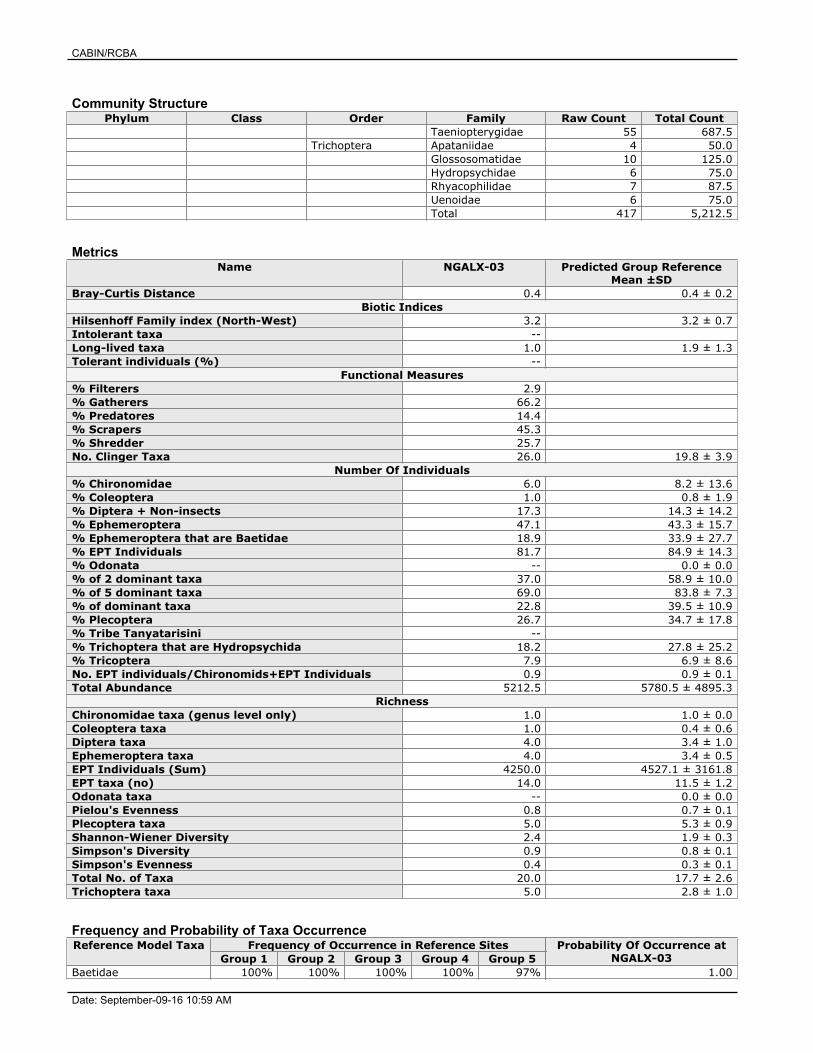
Community StructurePhylum Class Order Family Raw Count Total Count
Arthropoda Arachnida Trombidiformes 1 12.5Lebertiidae 3 37.5
Insecta Coleoptera Elmidae 4 50.0Diptera Ceratopogonidae 1 12.5
Chironomidae 25 312.5Psychodidae 37 462.5Simuliidae 6 75.0
Ephemeroptera Ameletidae 5 62.5Baetidae 37 462.5Ephemerellidae 95 1,187.5Heptageniidae 59 737.5
Plecoptera Chloroperlidae 7 87.5Leuctridae 3 37.5Nemouridae 41 512.5Perlodidae 5 62.5
CABIN/RCBA
Date: September-09-16 10:59 AM
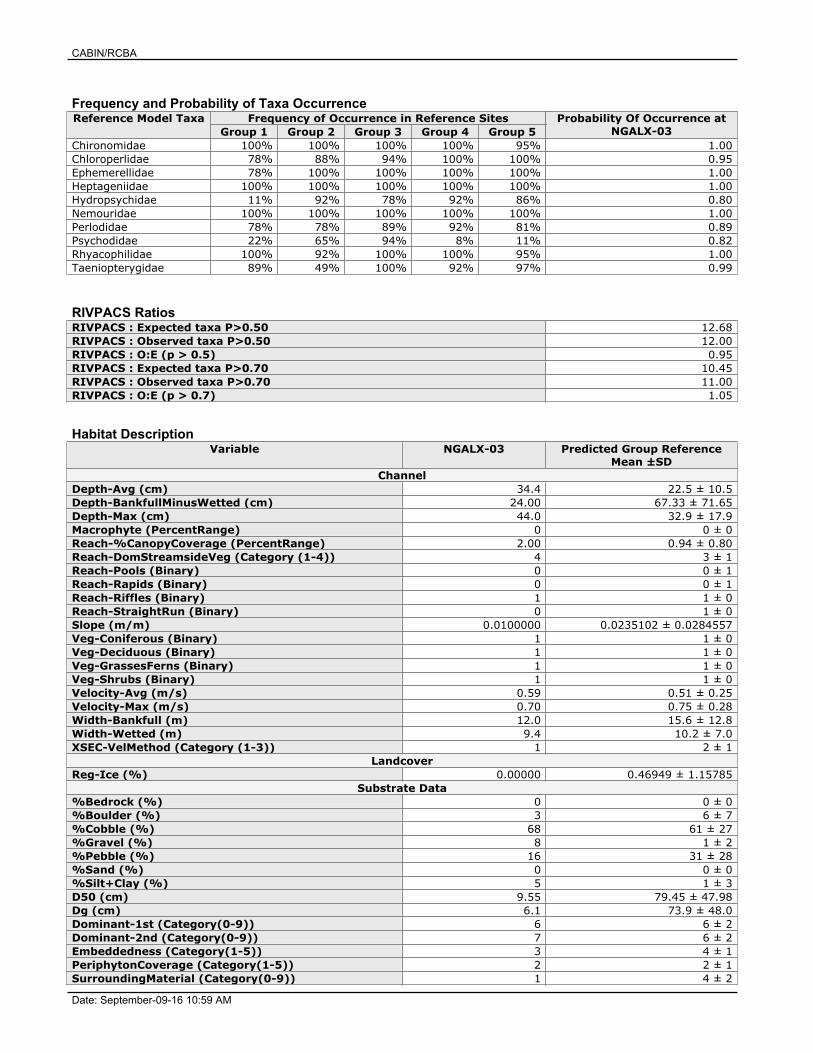
Community StructurePhylum Class Order Family Raw Count Total Count
Taeniopterygidae 55 687.5Trichoptera Apataniidae 4 50.0
Glossosomatidae 10 125.0Hydropsychidae 6 75.0Rhyacophilidae 7 87.5Uenoidae 6 75.0Total 417 5,212.5
MetricsName NGALX-03 Predicted Group Reference
Mean ±SDBray-Curtis Distance 0.4 0.4 ± 0.2
Biotic IndicesHilsenhoff Family index (North-West) 3.2 3.2 ± 0.7Intolerant taxa --Long-lived taxa 1.0 1.9 ± 1.3Tolerant individuals (%) --
Functional Measures% Filterers 2.9% Gatherers 66.2% Predatores 14.4% Scrapers 45.3% Shredder 25.7No. Clinger Taxa 26.0 19.8 ± 3.9
Number Of Individuals% Chironomidae 6.0 8.2 ± 13.6% Coleoptera 1.0 0.8 ± 1.9% Diptera + Non-insects 17.3 14.3 ± 14.2% Ephemeroptera 47.1 43.3 ± 15.7% Ephemeroptera that are Baetidae 18.9 33.9 ± 27.7% EPT Individuals 81.7 84.9 ± 14.3% Odonata -- 0.0 ± 0.0% of 2 dominant taxa 37.0 58.9 ± 10.0% of 5 dominant taxa 69.0 83.8 ± 7.3% of dominant taxa 22.8 39.5 ± 10.9% Plecoptera 26.7 34.7 ± 17.8% Tribe Tanyatarisini --% Trichoptera that are Hydropsychida 18.2 27.8 ± 25.2% Tricoptera 7.9 6.9 ± 8.6No. EPT individuals/Chironomids+EPT Individuals 0.9 0.9 ± 0.1Total Abundance 5212.5 5780.5 ± 4895.3
RichnessChironomidae taxa (genus level only) 1.0 1.0 ± 0.0Coleoptera taxa 1.0 0.4 ± 0.6Diptera taxa 4.0 3.4 ± 1.0Ephemeroptera taxa 4.0 3.4 ± 0.5EPT Individuals (Sum) 4250.0 4527.1 ± 3161.8EPT taxa (no) 14.0 11.5 ± 1.2Odonata taxa -- 0.0 ± 0.0Pielou's Evenness 0.8 0.7 ± 0.1Plecoptera taxa 5.0 5.3 ± 0.9Shannon-Wiener Diversity 2.4 1.9 ± 0.3Simpson's Diversity 0.9 0.8 ± 0.1Simpson's Evenness 0.4 0.3 ± 0.1Total No. of Taxa 20.0 17.7 ± 2.6Trichoptera taxa 5.0 2.8 ± 1.0
Frequency and Probability of Taxa OccurrenceReference Model Taxa Frequency of Occurrence in Reference Sites Probability Of Occurrence at
NGALX-03Group 1 Group 2 Group 3 Group 4 Group 5Baetidae 100% 100% 100% 100% 97% 1.00
CABIN/RCBA
Date: September-09-16 10:59 AM
Frequency and Probability of Taxa OccurrenceReference Model Taxa Frequency of Occurrence in Reference Sites Probability Of Occurrence at
NGALX-03Group 1 Group 2 Group 3 Group 4 Group 5Chironomidae 100% 100% 100% 100% 95% 1.00Chloroperlidae 78% 88% 94% 100% 100% 0.95Ephemerellidae 78% 100% 100% 100% 100% 1.00Heptageniidae 100% 100% 100% 100% 100% 1.00Hydropsychidae 11% 92% 78% 92% 86% 0.80Nemouridae 100% 100% 100% 100% 100% 1.00Perlodidae 78% 78% 89% 92% 81% 0.89Psychodidae 22% 65% 94% 8% 11% 0.82Rhyacophilidae 100% 92% 100% 100% 95% 1.00Taeniopterygidae 89% 49% 100% 92% 97% 0.99
RIVPACS RatiosRIVPACS : Expected taxa P>0.50 12.68RIVPACS : Observed taxa P>0.50 12.00RIVPACS : O:E (p > 0.5) 0.95RIVPACS : Expected taxa P>0.70 10.45RIVPACS : Observed taxa P>0.70 11.00RIVPACS : O:E (p > 0.7) 1.05
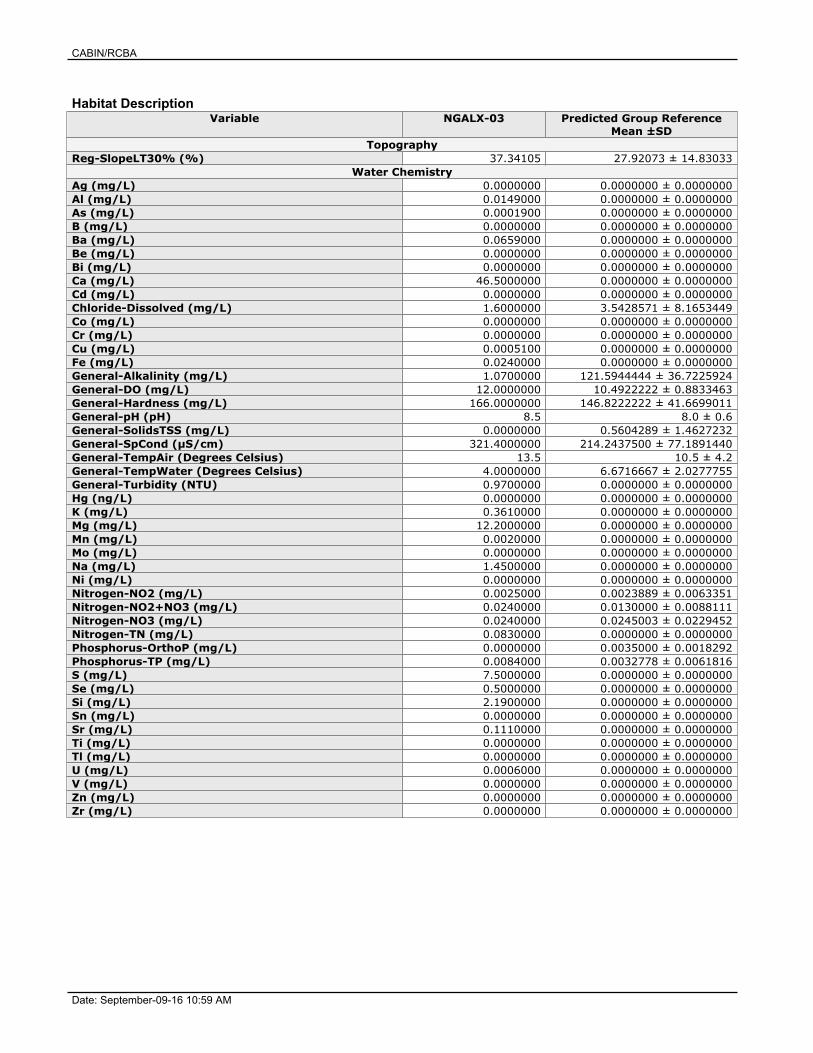
Habitat DescriptionVariable NGALX-03 Predicted Group Reference
Mean ±SDChannel
Depth-Avg (cm) 34.4 22.5 ± 10.5Depth-BankfullMinusWetted (cm) 24.00 67.33 ± 71.65Depth-Max (cm) 44.0 32.9 ± 17.9Macrophyte (PercentRange) 0 0 ± 0Reach-%CanopyCoverage (PercentRange) 2.00 0.94 ± 0.80Reach-DomStreamsideVeg (Category (1-4)) 4 3 ± 1Reach-Pools (Binary) 0 0 ± 1Reach-Rapids (Binary) 0 0 ± 1Reach-Riffles (Binary) 1 1 ± 0Reach-StraightRun (Binary) 0 1 ± 0Slope (m/m) 0.0100000 0.0235102 ± 0.0284557Veg-Coniferous (Binary) 1 1 ± 0Veg-Deciduous (Binary) 1 1 ± 0Veg-GrassesFerns (Binary) 1 1 ± 0Veg-Shrubs (Binary) 1 1 ± 0Velocity-Avg (m/s) 0.59 0.51 ± 0.25Velocity-Max (m/s) 0.70 0.75 ± 0.28Width-Bankfull (m) 12.0 15.6 ± 12.8Width-Wetted (m) 9.4 10.2 ± 7.0XSEC-VelMethod (Category (1-3)) 1 2 ± 1
LandcoverReg-Ice (%) 0.00000 0.46949 ± 1.15785
Substrate Data%Bedrock (%) 0 0 ± 0%Boulder (%) 3 6 ± 7%Cobble (%) 68 61 ± 27%Gravel (%) 8 1 ± 2%Pebble (%) 16 31 ± 28%Sand (%) 0 0 ± 0%Silt+Clay (%) 5 1 ± 3D50 (cm) 9.55 79.45 ± 47.98Dg (cm) 6.1 73.9 ± 48.0Dominant-1st (Category(0-9)) 6 6 ± 2Dominant-2nd (Category(0-9)) 7 6 ± 2Embeddedness (Category(1-5)) 3 4 ± 1PeriphytonCoverage (Category(1-5)) 2 2 ± 1SurroundingMaterial (Category(0-9)) 1 4 ± 2
CABIN/RCBA
Date: September-09-16 10:59 AM
Habitat DescriptionVariable NGALX-03 Predicted Group Reference
Mean ±SDTopography
Reg-SlopeLT30% (%) 37.34105 27.92073 ± 14.83033Water Chemistry
Ag (mg/L) 0.0000000 0.0000000 ± 0.0000000Al (mg/L) 0.0149000 0.0000000 ± 0.0000000As (mg/L) 0.0001900 0.0000000 ± 0.0000000B (mg/L) 0.0000000 0.0000000 ± 0.0000000Ba (mg/L) 0.0659000 0.0000000 ± 0.0000000Be (mg/L) 0.0000000 0.0000000 ± 0.0000000Bi (mg/L) 0.0000000 0.0000000 ± 0.0000000Ca (mg/L) 46.5000000 0.0000000 ± 0.0000000Cd (mg/L) 0.0000000 0.0000000 ± 0.0000000Chloride-Dissolved (mg/L) 1.6000000 3.5428571 ± 8.1653449Co (mg/L) 0.0000000 0.0000000 ± 0.0000000Cr (mg/L) 0.0000000 0.0000000 ± 0.0000000Cu (mg/L) 0.0005100 0.0000000 ± 0.0000000Fe (mg/L) 0.0240000 0.0000000 ± 0.0000000General-Alkalinity (mg/L) 1.0700000 121.5944444 ± 36.7225924General-DO (mg/L) 12.0000000 10.4922222 ± 0.8833463General-Hardness (mg/L) 166.0000000 146.8222222 ± 41.6699011General-pH (pH) 8.5 8.0 ± 0.6General-SolidsTSS (mg/L) 0.0000000 0.5604289 ± 1.4627232General-SpCond (µS/cm) 321.4000000 214.2437500 ± 77.1891440General-TempAir (Degrees Celsius) 13.5 10.5 ± 4.2General-TempWater (Degrees Celsius) 4.0000000 6.6716667 ± 2.0277755General-Turbidity (NTU) 0.9700000 0.0000000 ± 0.0000000Hg (ng/L) 0.0000000 0.0000000 ± 0.0000000K (mg/L) 0.3610000 0.0000000 ± 0.0000000Mg (mg/L) 12.2000000 0.0000000 ± 0.0000000Mn (mg/L) 0.0020000 0.0000000 ± 0.0000000Mo (mg/L) 0.0000000 0.0000000 ± 0.0000000Na (mg/L) 1.4500000 0.0000000 ± 0.0000000Ni (mg/L) 0.0000000 0.0000000 ± 0.0000000Nitrogen-NO2 (mg/L) 0.0025000 0.0023889 ± 0.0063351Nitrogen-NO2+NO3 (mg/L) 0.0240000 0.0130000 ± 0.0088111Nitrogen-NO3 (mg/L) 0.0240000 0.0245003 ± 0.0229452Nitrogen-TN (mg/L) 0.0830000 0.0000000 ± 0.0000000Phosphorus-OrthoP (mg/L) 0.0000000 0.0035000 ± 0.0018292Phosphorus-TP (mg/L) 0.0084000 0.0032778 ± 0.0061816S (mg/L) 7.5000000 0.0000000 ± 0.0000000Se (mg/L) 0.5000000 0.0000000 ± 0.0000000Si (mg/L) 2.1900000 0.0000000 ± 0.0000000Sn (mg/L) 0.0000000 0.0000000 ± 0.0000000Sr (mg/L) 0.1110000 0.0000000 ± 0.0000000Ti (mg/L) 0.0000000 0.0000000 ± 0.0000000Tl (mg/L) 0.0000000 0.0000000 ± 0.0000000U (mg/L) 0.0006000 0.0000000 ± 0.0000000V (mg/L) 0.0000000 0.0000000 ± 0.0000000Zn (mg/L) 0.0000000 0.0000000 ± 0.0000000Zr (mg/L) 0.0000000 0.0000000 ± 0.0000000
CABIN/RCBA
Date: February-27-17 4:50 PM
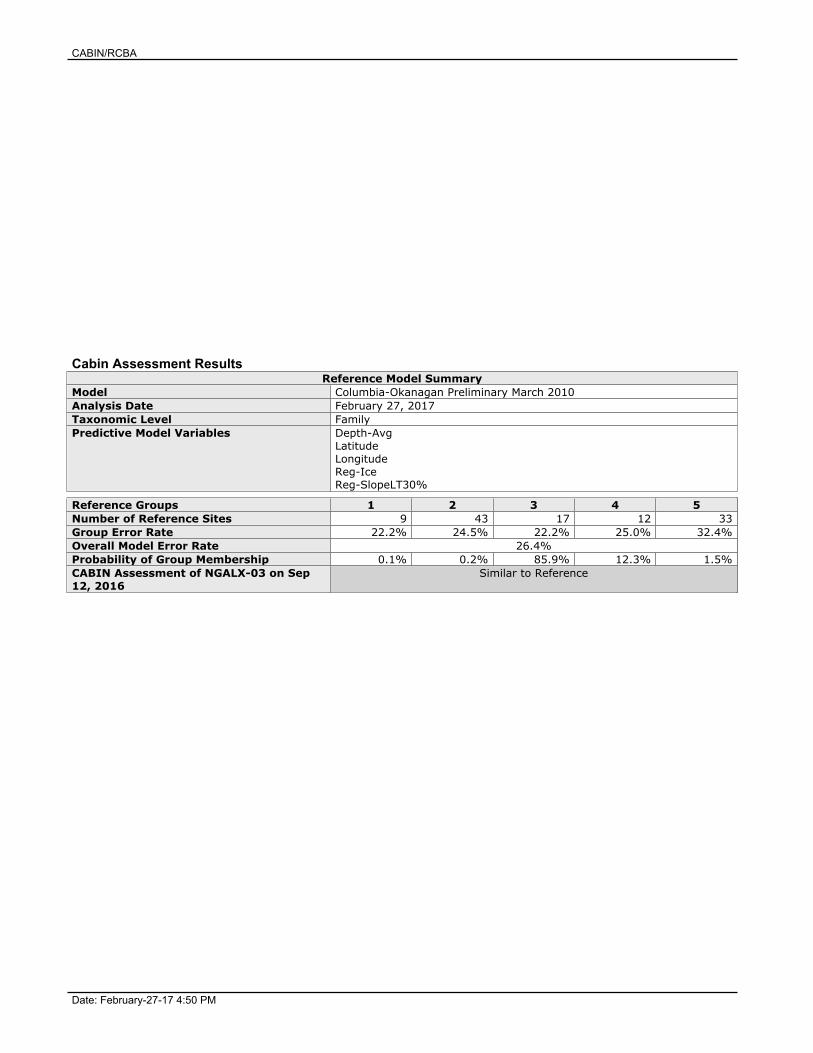
Cabin Assessment ResultsReference Model Summary
Model Columbia-Okanagan Preliminary March 2010Analysis Date February 27, 2017Taxonomic Level FamilyPredictive Model Variables Depth-Avg
LatitudeLongitudeReg-IceReg-SlopeLT30%
Reference Groups 1 2 3 4 5Number of Reference Sites 9 43 17 12 33Group Error Rate 22.2% 24.5% 22.2% 25.0% 32.4%Overall Model Error Rate 26.4%Probability of Group Membership 0.1% 0.2% 85.9% 12.3% 1.5%CABIN Assessment of NGALX-03 on Sep12, 2016
Similar to Reference
CABIN/RCBA
Date: February-27-17 4:50 PM
Figure 3. CABIN ordination assessment of the test site with the predicted group of reference sites. Each axis representsthe relative abundance of the entire benthic invertebrate community with different organisms weighted differently on each
axis.
Sample InformationSampling Device Kick NetMesh Size 400Sampling Time 3Taxonomist Pina Viola, ConsultantDate Taxonomy Completed October 24, 2016
Marchant BoxSub-Sample Proportion 6/100
Community StructurePhylum Class Order Family Raw Count Total Count
Arthropoda Arachnida Trombidiformes 1 16.7Hygrobatidae 1 16.7Lebertiidae 2 33.3Sperchontidae 1 16.7
Insecta Coleoptera Elmidae 7 116.7Diptera Ceratopogonidae 3 50.0
Chironomidae 39 650.0Empididae 1 16.7Psychodidae 17 283.3Simuliidae 1 16.7Tipulidae 1 16.7
Ephemeroptera Ameletidae 2 33.3Baetidae 50 833.3Ephemerellidae 112 1,866.7Heptageniidae 44 733.3
CABIN/RCBA
Date: February-27-17 4:50 PM
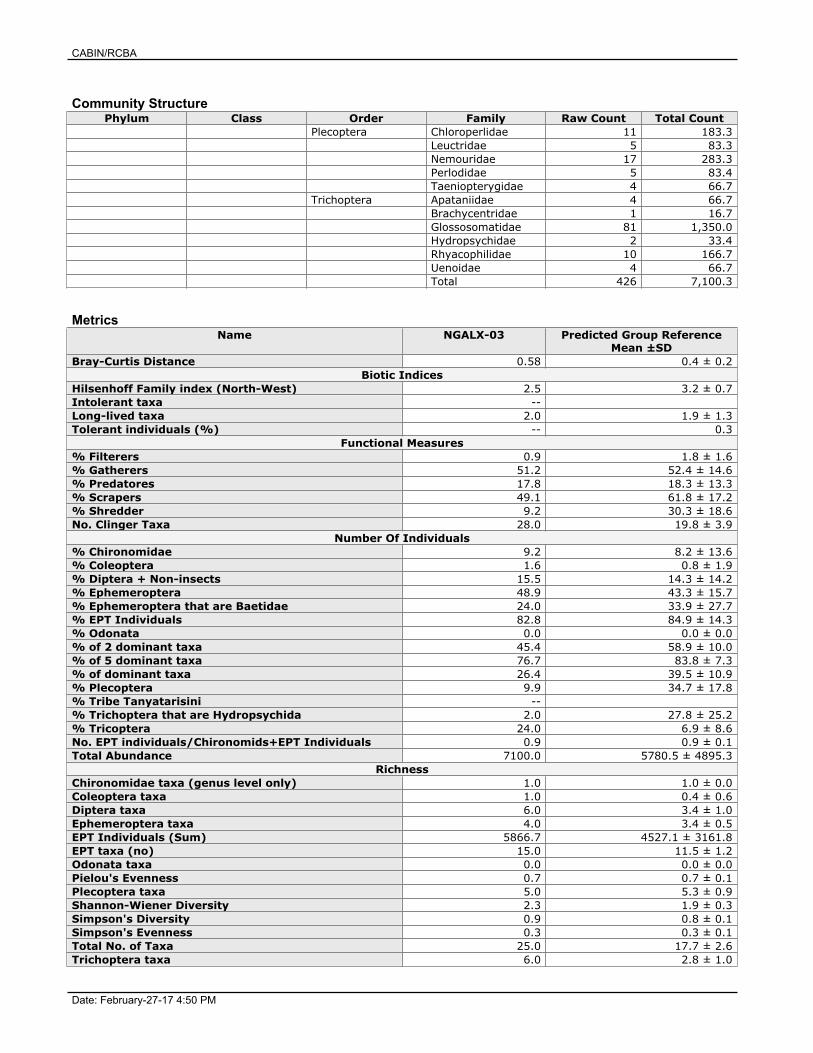
Community StructurePhylum Class Order Family Raw Count Total Count
Plecoptera Chloroperlidae 11 183.3Leuctridae 5 83.3Nemouridae 17 283.3Perlodidae 5 83.4Taeniopterygidae 4 66.7
Trichoptera Apataniidae 4 66.7Brachycentridae 1 16.7Glossosomatidae 81 1,350.0Hydropsychidae 2 33.4Rhyacophilidae 10 166.7Uenoidae 4 66.7Total 426 7,100.3
MetricsName NGALX-03 Predicted Group Reference
Mean ±SDBray-Curtis Distance 0.58 0.4 ± 0.2
Biotic IndicesHilsenhoff Family index (North-West) 2.5 3.2 ± 0.7Intolerant taxa --Long-lived taxa 2.0 1.9 ± 1.3Tolerant individuals (%) -- 0.3
Functional Measures% Filterers 0.9 1.8 ± 1.6% Gatherers 51.2 52.4 ± 14.6% Predatores 17.8 18.3 ± 13.3% Scrapers 49.1 61.8 ± 17.2% Shredder 9.2 30.3 ± 18.6No. Clinger Taxa 28.0 19.8 ± 3.9
Number Of Individuals% Chironomidae 9.2 8.2 ± 13.6% Coleoptera 1.6 0.8 ± 1.9% Diptera + Non-insects 15.5 14.3 ± 14.2% Ephemeroptera 48.9 43.3 ± 15.7% Ephemeroptera that are Baetidae 24.0 33.9 ± 27.7% EPT Individuals 82.8 84.9 ± 14.3% Odonata 0.0 0.0 ± 0.0% of 2 dominant taxa 45.4 58.9 ± 10.0% of 5 dominant taxa 76.7 83.8 ± 7.3% of dominant taxa 26.4 39.5 ± 10.9% Plecoptera 9.9 34.7 ± 17.8% Tribe Tanyatarisini --% Trichoptera that are Hydropsychida 2.0 27.8 ± 25.2% Tricoptera 24.0 6.9 ± 8.6No. EPT individuals/Chironomids+EPT Individuals 0.9 0.9 ± 0.1Total Abundance 7100.0 5780.5 ± 4895.3
RichnessChironomidae taxa (genus level only) 1.0 1.0 ± 0.0Coleoptera taxa 1.0 0.4 ± 0.6Diptera taxa 6.0 3.4 ± 1.0Ephemeroptera taxa 4.0 3.4 ± 0.5EPT Individuals (Sum) 5866.7 4527.1 ± 3161.8EPT taxa (no) 15.0 11.5 ± 1.2Odonata taxa 0.0 0.0 ± 0.0Pielou's Evenness 0.7 0.7 ± 0.1Plecoptera taxa 5.0 5.3 ± 0.9Shannon-Wiener Diversity 2.3 1.9 ± 0.3Simpson's Diversity 0.9 0.8 ± 0.1Simpson's Evenness 0.3 0.3 ± 0.1Total No. of Taxa 25.0 17.7 ± 2.6Trichoptera taxa 6.0 2.8 ± 1.0
CABIN/RCBA
Date: February-27-17 4:50 PM
Frequency and Probability of Taxa OccurrenceReference Model Taxa Frequency of Occurrence in Reference Sites Probability Of Occurrence at
NGALX-03Group 1 Group 2 Group 3 Group 4 Group 5Baetidae 100% 100% 100% 100% 97% 1.00Chironomidae 100% 100% 100% 100% 95% 1.00Chloroperlidae 78% 88% 94% 100% 100% 0.95Ephemerellidae 78% 100% 100% 100% 100% 1.00Heptageniidae 100% 100% 100% 100% 100% 1.00Hydropsychidae 11% 92% 78% 92% 86% 0.80Nemouridae 100% 100% 100% 100% 100% 1.00Perlodidae 78% 78% 89% 92% 81% 0.89Psychodidae 22% 65% 94% 8% 11% 0.82Rhyacophilidae 100% 92% 100% 100% 95% 1.00Taeniopterygidae 89% 49% 100% 92% 97% 0.99
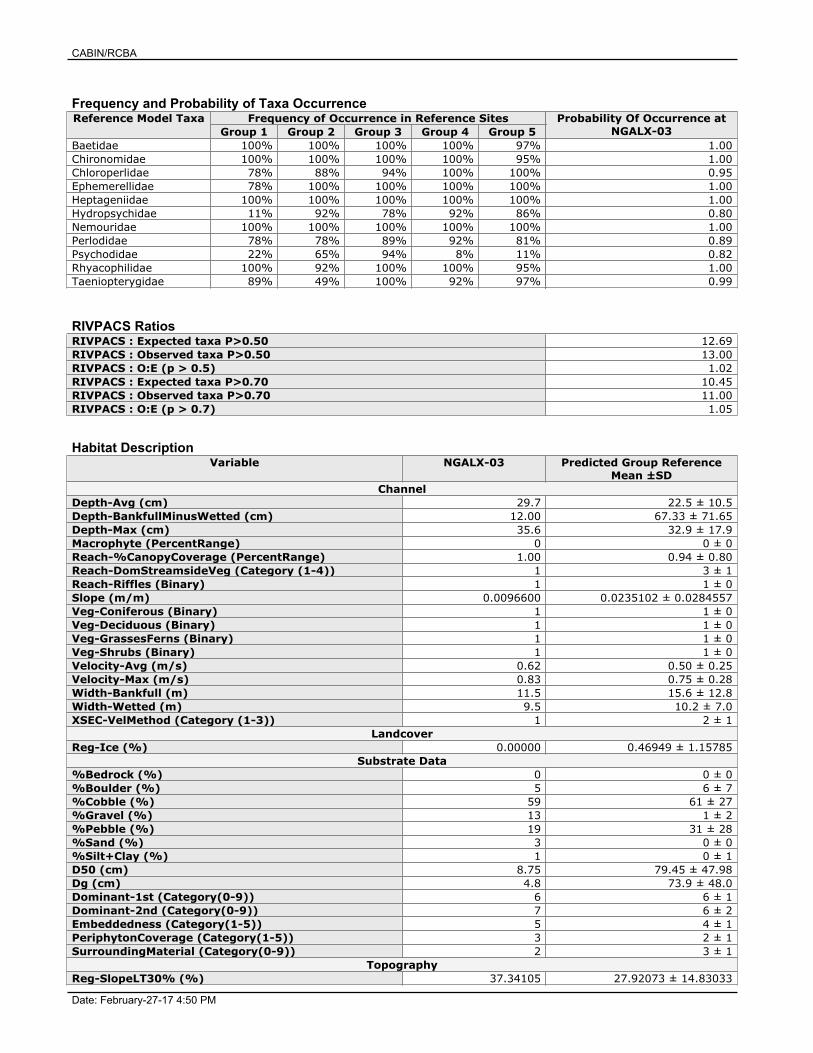
RIVPACS RatiosRIVPACS : Expected taxa P>0.50 12.69RIVPACS : Observed taxa P>0.50 13.00RIVPACS : O:E (p > 0.5) 1.02RIVPACS : Expected taxa P>0.70 10.45RIVPACS : Observed taxa P>0.70 11.00RIVPACS : O:E (p > 0.7) 1.05
Habitat DescriptionVariable NGALX-03 Predicted Group Reference
Mean ±SDChannel
Depth-Avg (cm) 29.7 22.5 ± 10.5Depth-BankfullMinusWetted (cm) 12.00 67.33 ± 71.65Depth-Max (cm) 35.6 32.9 ± 17.9Macrophyte (PercentRange) 0 0 ± 0Reach-%CanopyCoverage (PercentRange) 1.00 0.94 ± 0.80Reach-DomStreamsideVeg (Category (1-4)) 1 3 ± 1Reach-Riffles (Binary) 1 1 ± 0Slope (m/m) 0.0096600 0.0235102 ± 0.0284557Veg-Coniferous (Binary) 1 1 ± 0Veg-Deciduous (Binary) 1 1 ± 0Veg-GrassesFerns (Binary) 1 1 ± 0Veg-Shrubs (Binary) 1 1 ± 0Velocity-Avg (m/s) 0.62 0.50 ± 0.25Velocity-Max (m/s) 0.83 0.75 ± 0.28Width-Bankfull (m) 11.5 15.6 ± 12.8Width-Wetted (m) 9.5 10.2 ± 7.0XSEC-VelMethod (Category (1-3)) 1 2 ± 1
LandcoverReg-Ice (%) 0.00000 0.46949 ± 1.15785
Substrate Data%Bedrock (%) 0 0 ± 0%Boulder (%) 5 6 ± 7%Cobble (%) 59 61 ± 27%Gravel (%) 13 1 ± 2%Pebble (%) 19 31 ± 28%Sand (%) 3 0 ± 0%Silt+Clay (%) 1 0 ± 1D50 (cm) 8.75 79.45 ± 47.98Dg (cm) 4.8 73.9 ± 48.0Dominant-1st (Category(0-9)) 6 6 ± 1Dominant-2nd (Category(0-9)) 7 6 ± 2Embeddedness (Category(1-5)) 5 4 ± 1PeriphytonCoverage (Category(1-5)) 3 2 ± 1SurroundingMaterial (Category(0-9)) 2 3 ± 1
TopographyReg-SlopeLT30% (%) 37.34105 27.92073 ± 14.83033
CABIN/RCBA
Date: February-27-17 4:50 PM
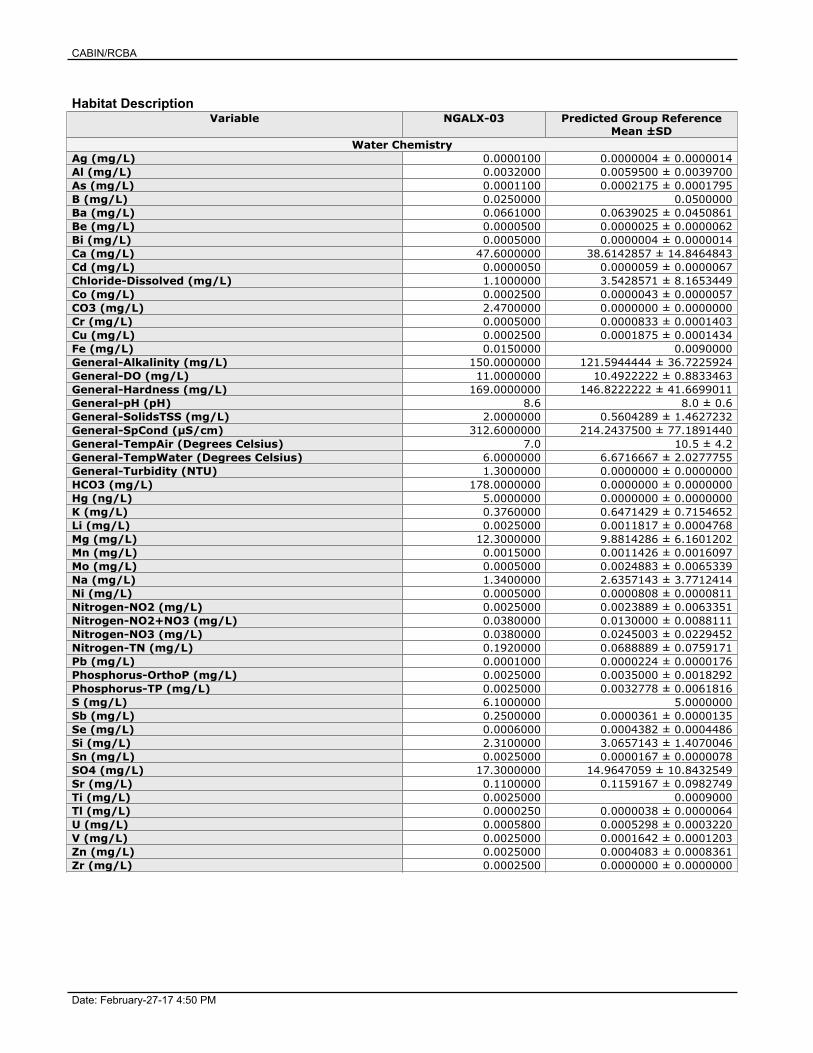
Habitat DescriptionVariable NGALX-03 Predicted Group Reference
Mean ±SDWater Chemistry
Ag (mg/L) 0.0000100 0.0000004 ± 0.0000014Al (mg/L) 0.0032000 0.0059500 ± 0.0039700As (mg/L) 0.0001100 0.0002175 ± 0.0001795B (mg/L) 0.0250000 0.0500000Ba (mg/L) 0.0661000 0.0639025 ± 0.0450861Be (mg/L) 0.0000500 0.0000025 ± 0.0000062Bi (mg/L) 0.0005000 0.0000004 ± 0.0000014Ca (mg/L) 47.6000000 38.6142857 ± 14.8464843Cd (mg/L) 0.0000050 0.0000059 ± 0.0000067Chloride-Dissolved (mg/L) 1.1000000 3.5428571 ± 8.1653449Co (mg/L) 0.0002500 0.0000043 ± 0.0000057CO3 (mg/L) 2.4700000 0.0000000 ± 0.0000000Cr (mg/L) 0.0005000 0.0000833 ± 0.0001403Cu (mg/L) 0.0002500 0.0001875 ± 0.0001434Fe (mg/L) 0.0150000 0.0090000General-Alkalinity (mg/L) 150.0000000 121.5944444 ± 36.7225924General-DO (mg/L) 11.0000000 10.4922222 ± 0.8833463General-Hardness (mg/L) 169.0000000 146.8222222 ± 41.6699011General-pH (pH) 8.6 8.0 ± 0.6General-SolidsTSS (mg/L) 2.0000000 0.5604289 ± 1.4627232General-SpCond (µS/cm) 312.6000000 214.2437500 ± 77.1891440General-TempAir (Degrees Celsius) 7.0 10.5 ± 4.2General-TempWater (Degrees Celsius) 6.0000000 6.6716667 ± 2.0277755General-Turbidity (NTU) 1.3000000 0.0000000 ± 0.0000000HCO3 (mg/L) 178.0000000 0.0000000 ± 0.0000000Hg (ng/L) 5.0000000 0.0000000 ± 0.0000000K (mg/L) 0.3760000 0.6471429 ± 0.7154652Li (mg/L) 0.0025000 0.0011817 ± 0.0004768Mg (mg/L) 12.3000000 9.8814286 ± 6.1601202Mn (mg/L) 0.0015000 0.0011426 ± 0.0016097Mo (mg/L) 0.0005000 0.0024883 ± 0.0065339Na (mg/L) 1.3400000 2.6357143 ± 3.7712414Ni (mg/L) 0.0005000 0.0000808 ± 0.0000811Nitrogen-NO2 (mg/L) 0.0025000 0.0023889 ± 0.0063351Nitrogen-NO2+NO3 (mg/L) 0.0380000 0.0130000 ± 0.0088111Nitrogen-NO3 (mg/L) 0.0380000 0.0245003 ± 0.0229452Nitrogen-TN (mg/L) 0.1920000 0.0688889 ± 0.0759171Pb (mg/L) 0.0001000 0.0000224 ± 0.0000176Phosphorus-OrthoP (mg/L) 0.0025000 0.0035000 ± 0.0018292Phosphorus-TP (mg/L) 0.0025000 0.0032778 ± 0.0061816S (mg/L) 6.1000000 5.0000000Sb (mg/L) 0.2500000 0.0000361 ± 0.0000135Se (mg/L) 0.0006000 0.0004382 ± 0.0004486Si (mg/L) 2.3100000 3.0657143 ± 1.4070046Sn (mg/L) 0.0025000 0.0000167 ± 0.0000078SO4 (mg/L) 17.3000000 14.9647059 ± 10.8432549Sr (mg/L) 0.1100000 0.1159167 ± 0.0982749Ti (mg/L) 0.0025000 0.0009000Tl (mg/L) 0.0000250 0.0000038 ± 0.0000064U (mg/L) 0.0005800 0.0005298 ± 0.0003220V (mg/L) 0.0025000 0.0001642 ± 0.0001203Zn (mg/L) 0.0025000 0.0004083 ± 0.0008361Zr (mg/L) 0.0002500 0.0000000 ± 0.0000000

CABIN/RCBA
Date: January-30-18 9:04 PM
Site DescriptionStudy Name CBWQ-ElkSite NGALX-03Sampling Date Sep 12 2017Know Your Watershed Basin Central KootenayProvince / Territory British ColumbiaTerrestrial Ecological Classification Montane Cordillera EcoZone
Northern Continental Divide EcoRegionCoordinates (decimal degrees) 49.65544 N, 114.73064 WAltitude 4317Local Basin Name Alexander Creek
Elk River WatershedStream Order 4
Figure 1. Location Map
CABIN/RCBA
Date: January-30-18 9:04 PM
Cabin Assessment ResultsReference Model Summary
Model Columbia-Okanagan Preliminary March 2010Analysis Date January 30, 2018Taxonomic Level FamilyPredictive Model Variables Depth-Avg
LatitudeLongitudeReg-IceReg-SlopeLT30%
Reference Groups 1 2 3 4 5Number of Reference Sites 9 43 17 12 33Group Error Rate 22.2% 24.5% 22.2% 25.0% 32.4%Overall Model Error Rate 26.4%Probability of Group Membership 0.1% 0.2% 85.6% 12.6% 1.5%CABIN Assessment of NGALX-03 on Sep12, 2017
Similar to Reference
CABIN/RCBA
Date: January-30-18 9:04 PM
Figure 3. CABIN ordination assessment of the test site with the predicted group of reference sites. Each axis representsthe relative abundance of the entire benthic invertebrate community with different organisms weighted differently on each
axis.
Sample InformationSampling Device Kick NetMesh Size 400Sampling Time 3Taxonomist Pina Viola, ConsultantDate Taxonomy Completed December 16, 2017
Marchant BoxSub-Sample Proportion 5/100
Community StructurePhylum Class Order Family Raw Count Total Count
Arthropoda Insecta Coleoptera Elmidae 6 120.0Diptera Ceratopogonidae 3 60.0
Chironomidae 51 1,020.0Empididae 1 20.0Pelecorhynchidae 1 20.0Psychodidae 11 220.0Simuliidae 2 40.0Tipulidae 1 20.0
Ephemeroptera Ameletidae 2 40.0Baetidae 97 1,940.0Ephemerellidae 96 1,920.0Heptageniidae 54 1,080.0
Plecoptera Capniidae 3 60.0Chloroperlidae 2 40.0Leuctridae 1 20.0
CABIN/RCBA
Date: January-30-18 9:04 PM
Community StructurePhylum Class Order Family Raw Count Total Count
Nemouridae 63 1,260.0Perlodidae 3 60.0Taeniopterygidae 34 680.0
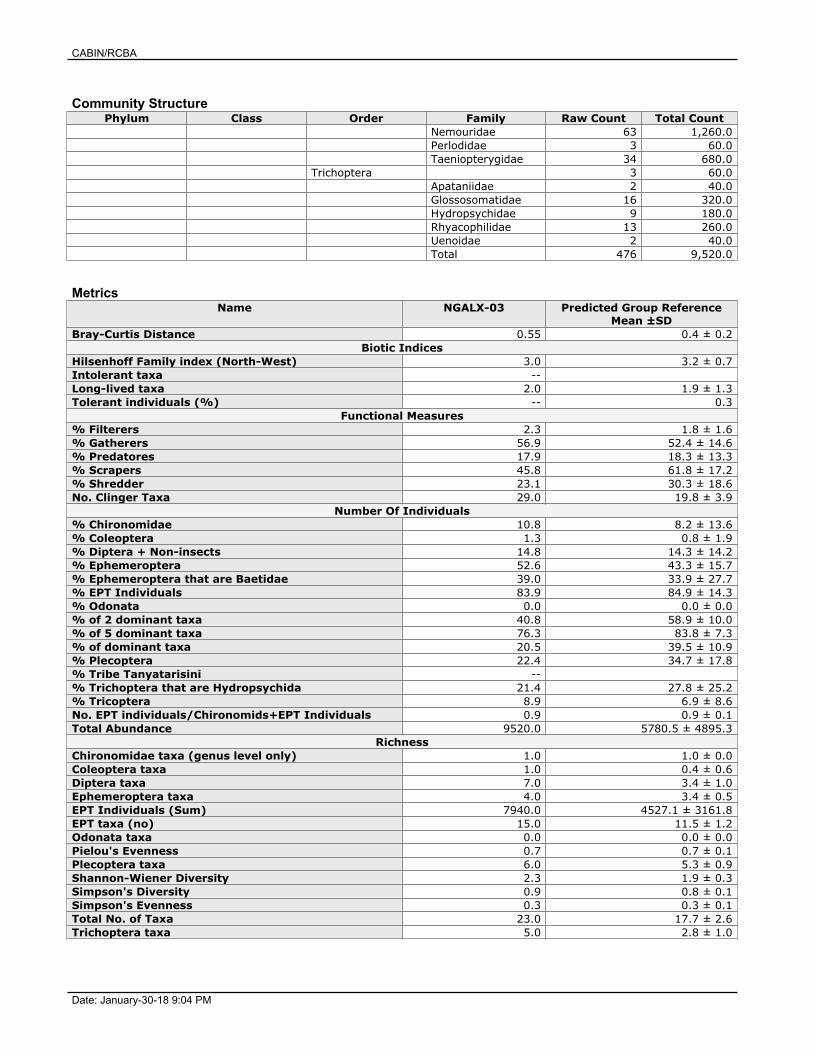
Trichoptera 3 60.0Apataniidae 2 40.0Glossosomatidae 16 320.0Hydropsychidae 9 180.0Rhyacophilidae 13 260.0Uenoidae 2 40.0Total 476 9,520.0
MetricsName NGALX-03 Predicted Group Reference
Mean ±SDBray-Curtis Distance 0.55 0.4 ± 0.2
Biotic IndicesHilsenhoff Family index (North-West) 3.0 3.2 ± 0.7Intolerant taxa --Long-lived taxa 2.0 1.9 ± 1.3Tolerant individuals (%) -- 0.3
Functional Measures% Filterers 2.3 1.8 ± 1.6% Gatherers 56.9 52.4 ± 14.6% Predatores 17.9 18.3 ± 13.3% Scrapers 45.8 61.8 ± 17.2% Shredder 23.1 30.3 ± 18.6No. Clinger Taxa 29.0 19.8 ± 3.9
Number Of Individuals% Chironomidae 10.8 8.2 ± 13.6% Coleoptera 1.3 0.8 ± 1.9% Diptera + Non-insects 14.8 14.3 ± 14.2% Ephemeroptera 52.6 43.3 ± 15.7% Ephemeroptera that are Baetidae 39.0 33.9 ± 27.7% EPT Individuals 83.9 84.9 ± 14.3% Odonata 0.0 0.0 ± 0.0% of 2 dominant taxa 40.8 58.9 ± 10.0% of 5 dominant taxa 76.3 83.8 ± 7.3% of dominant taxa 20.5 39.5 ± 10.9% Plecoptera 22.4 34.7 ± 17.8% Tribe Tanyatarisini --% Trichoptera that are Hydropsychida 21.4 27.8 ± 25.2% Tricoptera 8.9 6.9 ± 8.6No. EPT individuals/Chironomids+EPT Individuals 0.9 0.9 ± 0.1Total Abundance 9520.0 5780.5 ± 4895.3
RichnessChironomidae taxa (genus level only) 1.0 1.0 ± 0.0Coleoptera taxa 1.0 0.4 ± 0.6Diptera taxa 7.0 3.4 ± 1.0Ephemeroptera taxa 4.0 3.4 ± 0.5EPT Individuals (Sum) 7940.0 4527.1 ± 3161.8EPT taxa (no) 15.0 11.5 ± 1.2Odonata taxa 0.0 0.0 ± 0.0Pielou's Evenness 0.7 0.7 ± 0.1Plecoptera taxa 6.0 5.3 ± 0.9Shannon-Wiener Diversity 2.3 1.9 ± 0.3Simpson's Diversity 0.9 0.8 ± 0.1Simpson's Evenness 0.3 0.3 ± 0.1Total No. of Taxa 23.0 17.7 ± 2.6Trichoptera taxa 5.0 2.8 ± 1.0
CABIN/RCBA
Date: January-30-18 9:04 PM
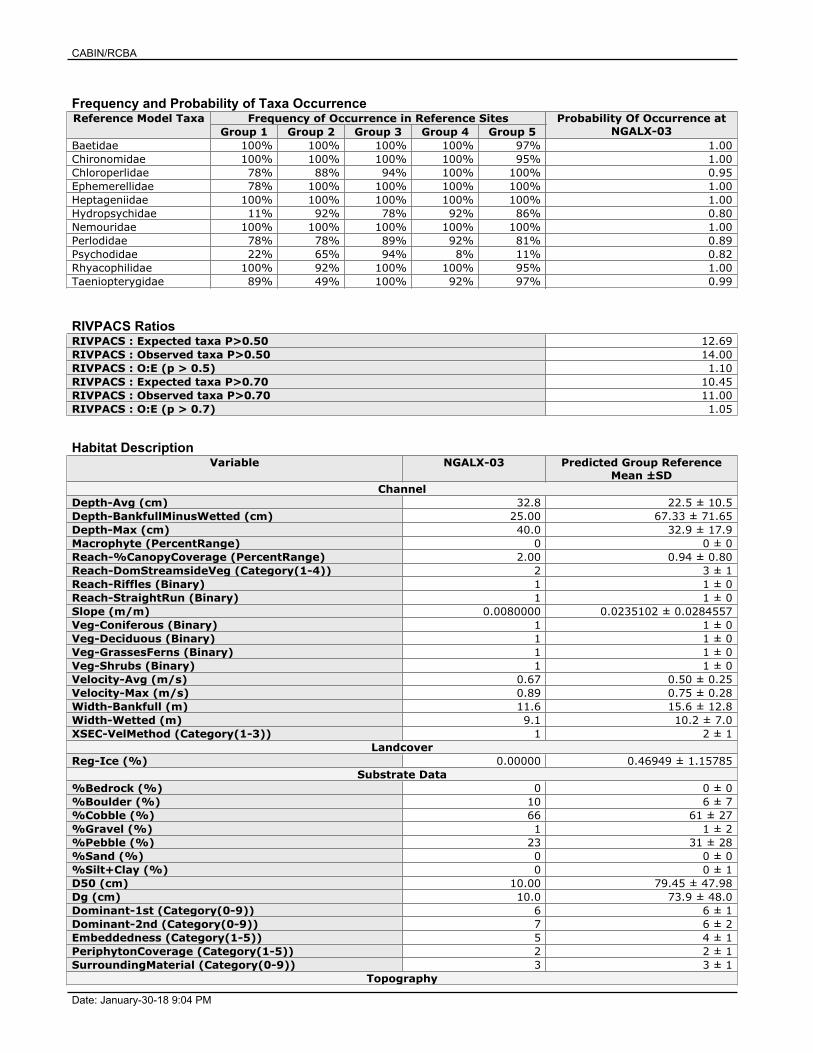
Frequency and Probability of Taxa OccurrenceReference Model Taxa Frequency of Occurrence in Reference Sites Probability Of Occurrence at
NGALX-03Group 1 Group 2 Group 3 Group 4 Group 5Baetidae 100% 100% 100% 100% 97% 1.00Chironomidae 100% 100% 100% 100% 95% 1.00Chloroperlidae 78% 88% 94% 100% 100% 0.95Ephemerellidae 78% 100% 100% 100% 100% 1.00Heptageniidae 100% 100% 100% 100% 100% 1.00Hydropsychidae 11% 92% 78% 92% 86% 0.80Nemouridae 100% 100% 100% 100% 100% 1.00Perlodidae 78% 78% 89% 92% 81% 0.89Psychodidae 22% 65% 94% 8% 11% 0.82Rhyacophilidae 100% 92% 100% 100% 95% 1.00Taeniopterygidae 89% 49% 100% 92% 97% 0.99
RIVPACS RatiosRIVPACS : Expected taxa P>0.50 12.69RIVPACS : Observed taxa P>0.50 14.00RIVPACS : O:E (p > 0.5) 1.10RIVPACS : Expected taxa P>0.70 10.45RIVPACS : Observed taxa P>0.70 11.00RIVPACS : O:E (p > 0.7) 1.05
Habitat DescriptionVariable NGALX-03 Predicted Group Reference
Mean ±SDChannel
Depth-Avg (cm) 32.8 22.5 ± 10.5Depth-BankfullMinusWetted (cm) 25.00 67.33 ± 71.65Depth-Max (cm) 40.0 32.9 ± 17.9Macrophyte (PercentRange) 0 0 ± 0Reach-%CanopyCoverage (PercentRange) 2.00 0.94 ± 0.80Reach-DomStreamsideVeg (Category(1-4)) 2 3 ± 1Reach-Riffles (Binary) 1 1 ± 0Reach-StraightRun (Binary) 1 1 ± 0Slope (m/m) 0.0080000 0.0235102 ± 0.0284557Veg-Coniferous (Binary) 1 1 ± 0Veg-Deciduous (Binary) 1 1 ± 0Veg-GrassesFerns (Binary) 1 1 ± 0Veg-Shrubs (Binary) 1 1 ± 0Velocity-Avg (m/s) 0.67 0.50 ± 0.25Velocity-Max (m/s) 0.89 0.75 ± 0.28Width-Bankfull (m) 11.6 15.6 ± 12.8Width-Wetted (m) 9.1 10.2 ± 7.0XSEC-VelMethod (Category(1-3)) 1 2 ± 1
LandcoverReg-Ice (%) 0.00000 0.46949 ± 1.15785
Substrate Data%Bedrock (%) 0 0 ± 0%Boulder (%) 10 6 ± 7%Cobble (%) 66 61 ± 27%Gravel (%) 1 1 ± 2%Pebble (%) 23 31 ± 28%Sand (%) 0 0 ± 0%Silt+Clay (%) 0 0 ± 1D50 (cm) 10.00 79.45 ± 47.98Dg (cm) 10.0 73.9 ± 48.0Dominant-1st (Category(0-9)) 6 6 ± 1Dominant-2nd (Category(0-9)) 7 6 ± 2Embeddedness (Category(1-5)) 5 4 ± 1PeriphytonCoverage (Category(1-5)) 2 2 ± 1SurroundingMaterial (Category(0-9)) 3 3 ± 1
Topography
CABIN/RCBA
Date: January-30-18 9:04 PM
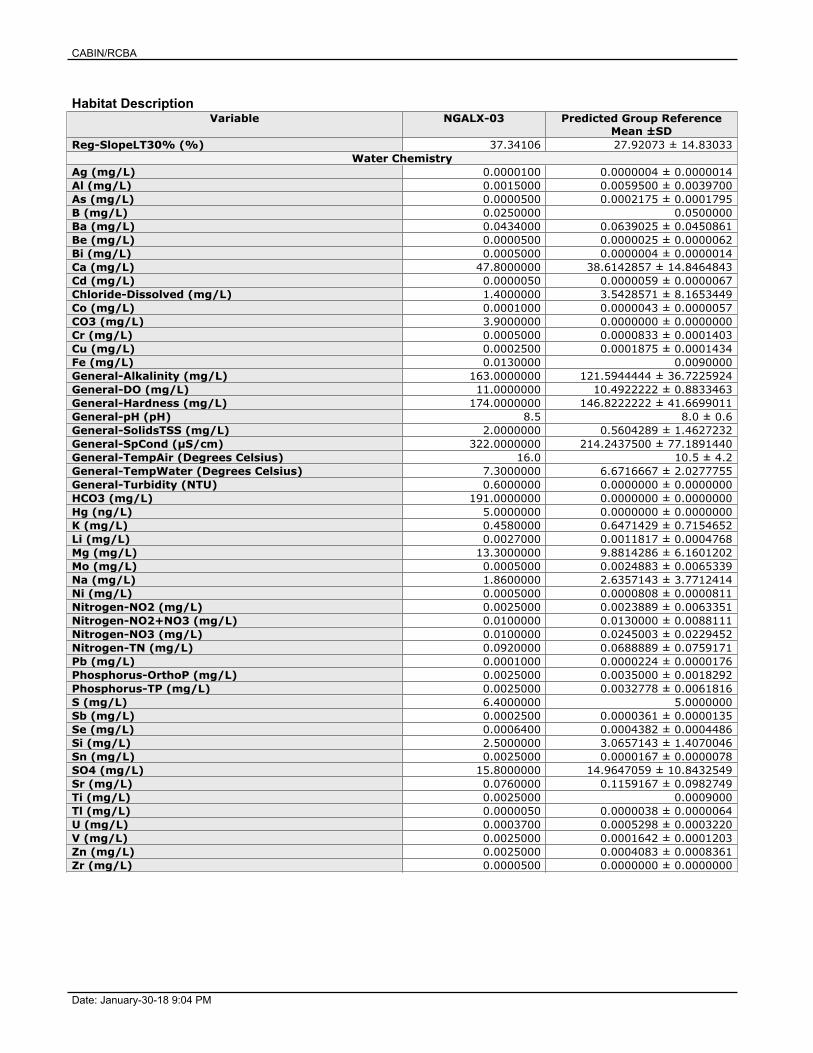
Habitat DescriptionVariable NGALX-03 Predicted Group Reference
Mean ±SDReg-SlopeLT30% (%) 37.34106 27.92073 ± 14.83033
Water ChemistryAg (mg/L) 0.0000100 0.0000004 ± 0.0000014Al (mg/L) 0.0015000 0.0059500 ± 0.0039700As (mg/L) 0.0000500 0.0002175 ± 0.0001795B (mg/L) 0.0250000 0.0500000Ba (mg/L) 0.0434000 0.0639025 ± 0.0450861Be (mg/L) 0.0000500 0.0000025 ± 0.0000062Bi (mg/L) 0.0005000 0.0000004 ± 0.0000014Ca (mg/L) 47.8000000 38.6142857 ± 14.8464843Cd (mg/L) 0.0000050 0.0000059 ± 0.0000067Chloride-Dissolved (mg/L) 1.4000000 3.5428571 ± 8.1653449Co (mg/L) 0.0001000 0.0000043 ± 0.0000057CO3 (mg/L) 3.9000000 0.0000000 ± 0.0000000Cr (mg/L) 0.0005000 0.0000833 ± 0.0001403Cu (mg/L) 0.0002500 0.0001875 ± 0.0001434Fe (mg/L) 0.0130000 0.0090000General-Alkalinity (mg/L) 163.0000000 121.5944444 ± 36.7225924General-DO (mg/L) 11.0000000 10.4922222 ± 0.8833463General-Hardness (mg/L) 174.0000000 146.8222222 ± 41.6699011General-pH (pH) 8.5 8.0 ± 0.6General-SolidsTSS (mg/L) 2.0000000 0.5604289 ± 1.4627232General-SpCond (µS/cm) 322.0000000 214.2437500 ± 77.1891440General-TempAir (Degrees Celsius) 16.0 10.5 ± 4.2General-TempWater (Degrees Celsius) 7.3000000 6.6716667 ± 2.0277755General-Turbidity (NTU) 0.6000000 0.0000000 ± 0.0000000HCO3 (mg/L) 191.0000000 0.0000000 ± 0.0000000Hg (ng/L) 5.0000000 0.0000000 ± 0.0000000K (mg/L) 0.4580000 0.6471429 ± 0.7154652Li (mg/L) 0.0027000 0.0011817 ± 0.0004768Mg (mg/L) 13.3000000 9.8814286 ± 6.1601202Mo (mg/L) 0.0005000 0.0024883 ± 0.0065339Na (mg/L) 1.8600000 2.6357143 ± 3.7712414Ni (mg/L) 0.0005000 0.0000808 ± 0.0000811Nitrogen-NO2 (mg/L) 0.0025000 0.0023889 ± 0.0063351Nitrogen-NO2+NO3 (mg/L) 0.0100000 0.0130000 ± 0.0088111Nitrogen-NO3 (mg/L) 0.0100000 0.0245003 ± 0.0229452Nitrogen-TN (mg/L) 0.0920000 0.0688889 ± 0.0759171Pb (mg/L) 0.0001000 0.0000224 ± 0.0000176Phosphorus-OrthoP (mg/L) 0.0025000 0.0035000 ± 0.0018292Phosphorus-TP (mg/L) 0.0025000 0.0032778 ± 0.0061816S (mg/L) 6.4000000 5.0000000Sb (mg/L) 0.0002500 0.0000361 ± 0.0000135Se (mg/L) 0.0006400 0.0004382 ± 0.0004486Si (mg/L) 2.5000000 3.0657143 ± 1.4070046Sn (mg/L) 0.0025000 0.0000167 ± 0.0000078SO4 (mg/L) 15.8000000 14.9647059 ± 10.8432549Sr (mg/L) 0.0760000 0.1159167 ± 0.0982749Ti (mg/L) 0.0025000 0.0009000Tl (mg/L) 0.0000050 0.0000038 ± 0.0000064U (mg/L) 0.0003700 0.0005298 ± 0.0003220V (mg/L) 0.0025000 0.0001642 ± 0.0001203Zn (mg/L) 0.0025000 0.0004083 ± 0.0008361Zr (mg/L) 0.0000500 0.0000000 ± 0.0000000
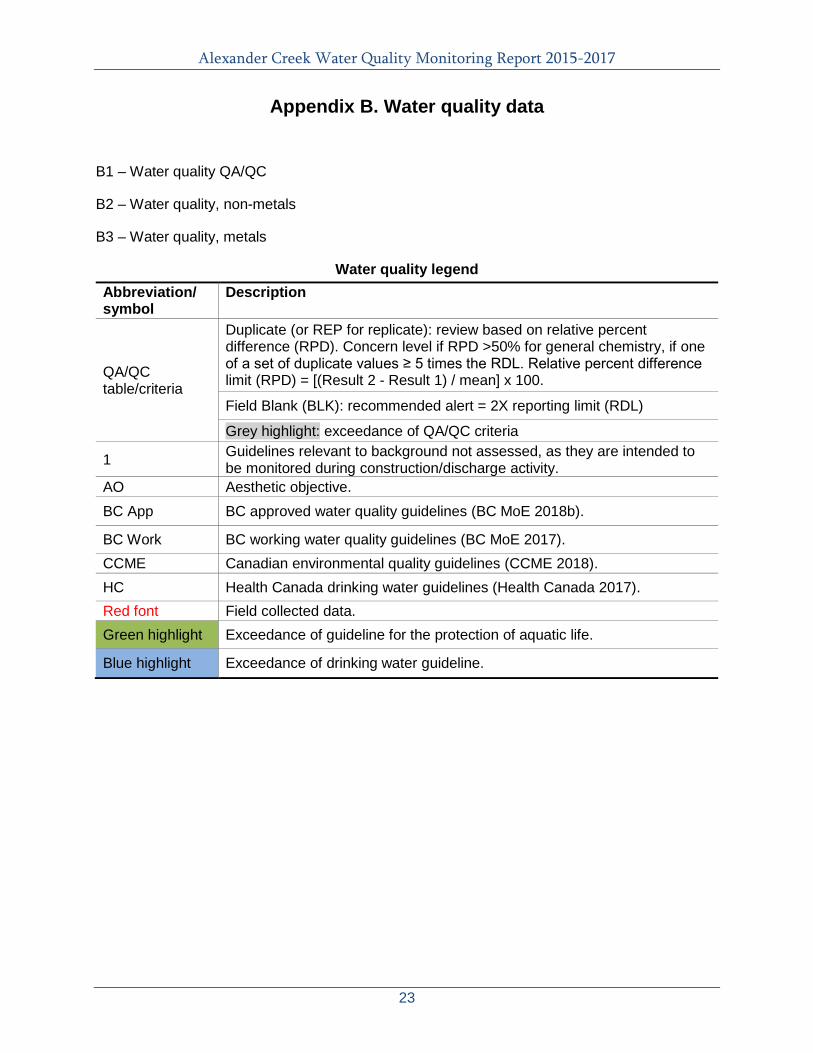
Alexander Creek Water Quality Monitoring Report 2015-2017
23
Appendix B. Water quality data
B1 – Water quality QA/QC
B2 – Water quality, non-metals
B3 – Water quality, metals
Water quality legend Abbreviation/ symbol
Description
QA/QC table/criteria
Duplicate (or REP for replicate): review based on relative percent difference (RPD). Concern level if RPD >50% for general chemistry, if one of a set of duplicate values ≥ 5 times the RDL. Relative percent difference limit (RPD) = [(Result 2 - Result 1) / mean] x 100.
Field Blank (BLK): recommended alert = 2X reporting limit (RDL)
Grey highlight: exceedance of QA/QC criteria
1 Guidelines relevant to background not assessed, as they are intended to be monitored during construction/discharge activity.
AO Aesthetic objective. BC App BC approved water quality guidelines (BC MoE 2018b).
BC Work BC working water quality guidelines (BC MoE 2017). CCME Canadian environmental quality guidelines (CCME 2018). HC Health Canada drinking water guidelines (Health Canada 2017). Red font Field collected data. Green highlight Exceedance of guideline for the protection of aquatic life.
Blue highlight Exceedance of drinking water guideline.
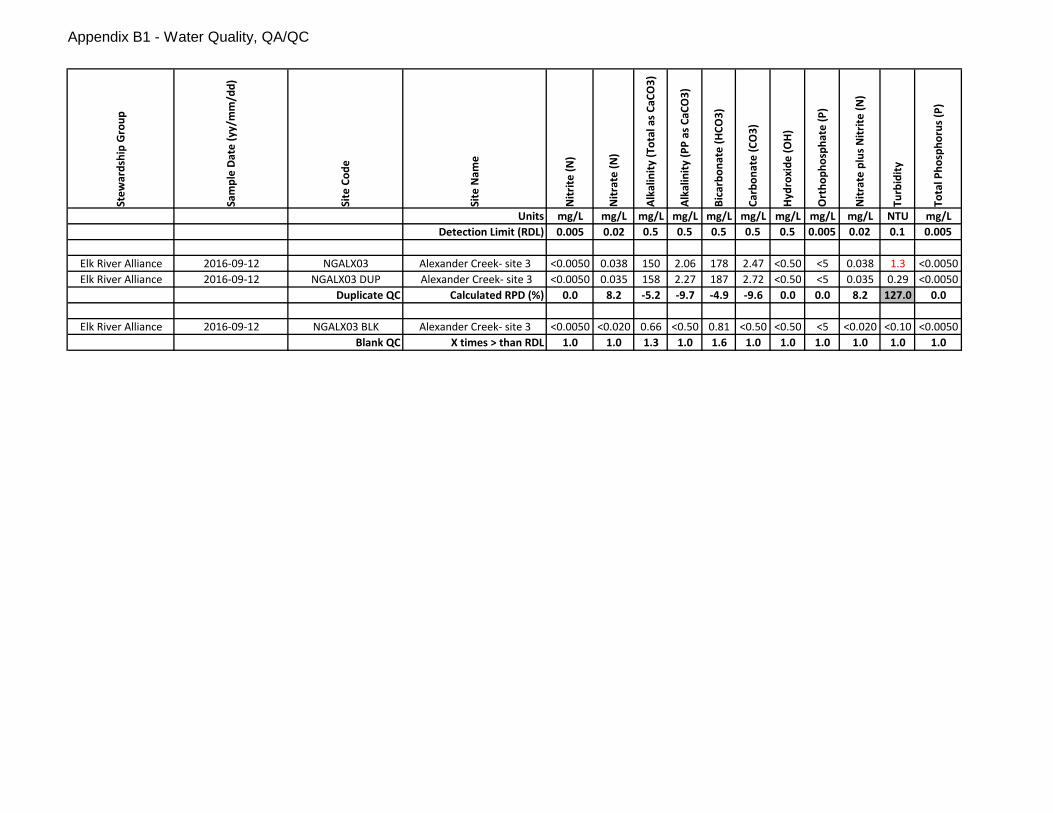
Appendix B1 - Water Quality, QA/QC
Stew
ards
hip
Gro
up
Sam
ple
Date
(yy/
mm
/dd)
Site
Cod
e
Site
Nam
e
Nitr
ite (N
)
Nitr
ate
(N)
Alka
linity
(Tot
al a
s CaC
O3)
Alka
linity
(PP
as C
aCO
3)
Bica
rbon
ate
(HCO
3)
Carb
onat
e (C
O3)
Hydr
oxid
e (O
H)
Ort
hoph
osph
ate
(P)
Nitr
ate
plus
Nitr
ite (N
)
Turb
idity
Tota
l Pho
spho
rus (
P)
Units mg/L mg/L mg/L mg/L mg/L mg/L mg/L mg/L mg/L NTU mg/LDetection Limit (RDL) 0.005 0.02 0.5 0.5 0.5 0.5 0.5 0.005 0.02 0.1 0.005
Elk River Alliance 2016-09-12 NGALX03 Alexander Creek- site 3 <0.0050 0.038 150 2.06 178 2.47 <0.50 <5 0.038 1.3 <0.0050Elk River Alliance 2016-09-12 NGALX03 DUP Alexander Creek- site 3 <0.0050 0.035 158 2.27 187 2.72 <0.50 <5 0.035 0.29 <0.0050
Duplicate QC Calculated RPD (%) 0.0 8.2 -5.2 -9.7 -4.9 -9.6 0.0 0.0 8.2 127.0 0.0
Elk River Alliance 2016-09-12 NGALX03 BLK Alexander Creek- site 3 <0.0050 <0.020 0.66 <0.50 0.81 <0.50 <0.50 <5 <0.020 <0.10 <0.0050Blank QC X times > than RDL 1.0 1.0 1.3 1.0 1.6 1.0 1.0 1.0 1.0 1.0 1.0
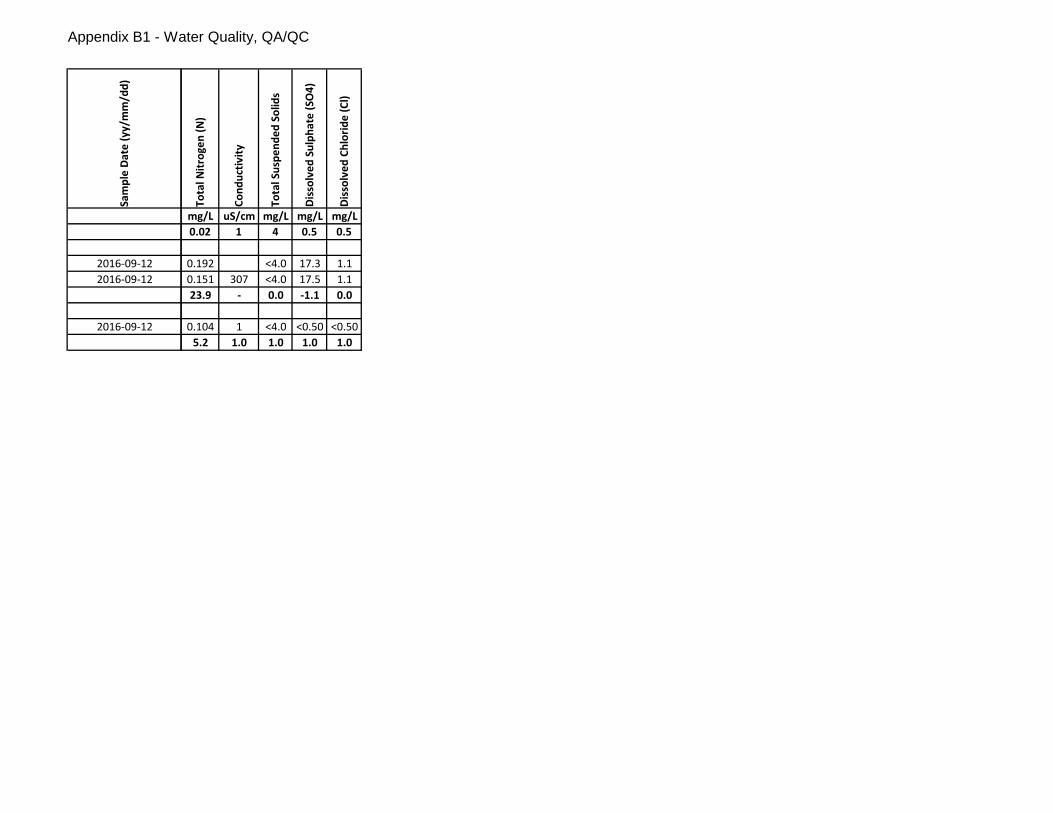
Appendix B1 - Water Quality, QA/QC
Sam
ple
Date
(yy/
mm
/dd)
2016-09-122016-09-12
2016-09-12
Tota
l Nitr
ogen
(N)
Cond
uctiv
ity
Tota
l Sus
pend
ed S
olid
s
Diss
olve
d Su
lpha
te (S
O4)
Diss
olve
d Ch
lorid
e (C
l)
mg/L uS/cm mg/L mg/L mg/L0.02 1 4 0.5 0.5
0.192 <4.0 17.3 1.10.151 307 <4.0 17.5 1.123.9 - 0.0 -1.1 0.0
0.104 1 <4.0 <0.50 <0.505.2 1.0 1.0 1.0 1.0
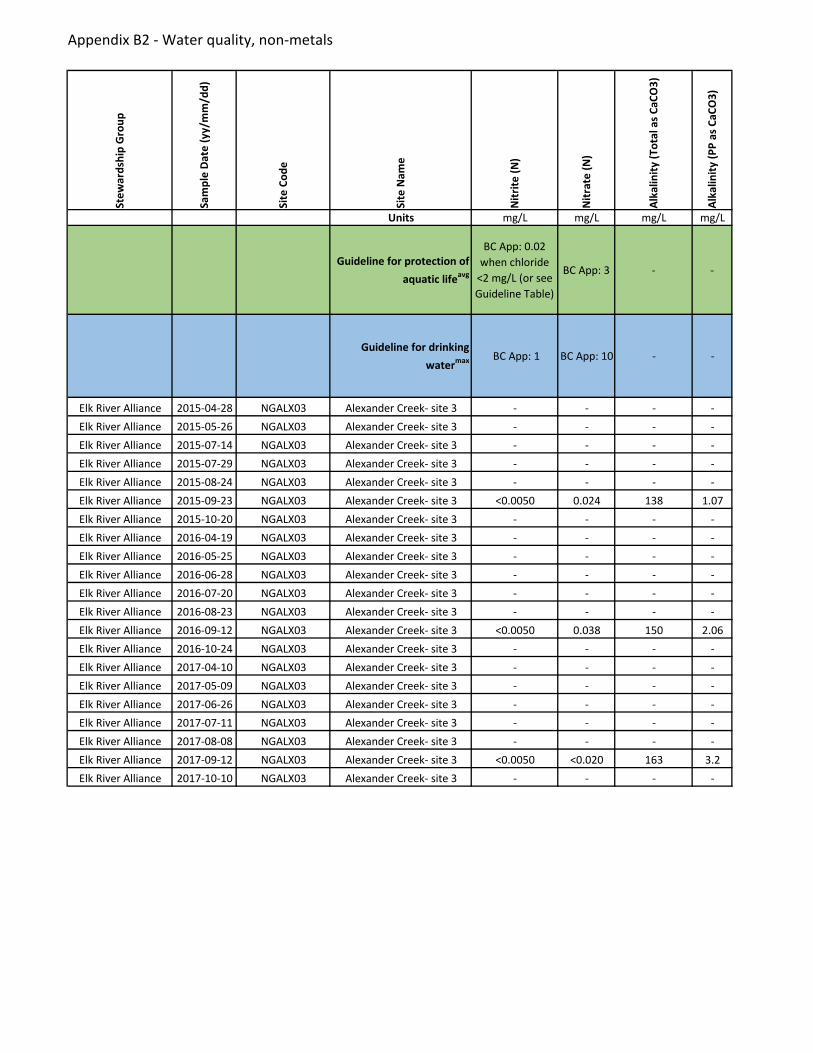
Appendix B2 - Water quality, non-metals
Stew
ards
hip
Gro
up
Sam
ple
Date
(yy/
mm
/dd)
Site
Cod
e
Site
Nam
e
Nitr
ite (N
)
Nitr
ate
(N)
Alka
linity
(Tot
al a
s CaC
O3)
Alka
linity
(PP
as C
aCO
3)
Units mg/L mg/L mg/L mg/L
Guideline for protection of aquatic lifeavg
BC App: 0.02 when chloride
<2 mg/L (or see Guideline Table)
BC App: 3 - -
Guideline for drinking watermax BC App: 1 BC App: 10 - -
Elk River Alliance 2015-04-28 NGALX03 Alexander Creek- site 3 - - - -Elk River Alliance 2015-05-26 NGALX03 Alexander Creek- site 3 - - - -Elk River Alliance 2015-07-14 NGALX03 Alexander Creek- site 3 - - - -Elk River Alliance 2015-07-29 NGALX03 Alexander Creek- site 3 - - - -Elk River Alliance 2015-08-24 NGALX03 Alexander Creek- site 3 - - - -Elk River Alliance 2015-09-23 NGALX03 Alexander Creek- site 3 <0.0050 0.024 138 1.07Elk River Alliance 2015-10-20 NGALX03 Alexander Creek- site 3 - - - -Elk River Alliance 2016-04-19 NGALX03 Alexander Creek- site 3 - - - -Elk River Alliance 2016-05-25 NGALX03 Alexander Creek- site 3 - - - -Elk River Alliance 2016-06-28 NGALX03 Alexander Creek- site 3 - - - -Elk River Alliance 2016-07-20 NGALX03 Alexander Creek- site 3 - - - -Elk River Alliance 2016-08-23 NGALX03 Alexander Creek- site 3 - - - -Elk River Alliance 2016-09-12 NGALX03 Alexander Creek- site 3 <0.0050 0.038 150 2.06Elk River Alliance 2016-10-24 NGALX03 Alexander Creek- site 3 - - - -Elk River Alliance 2017-04-10 NGALX03 Alexander Creek- site 3 - - - -Elk River Alliance 2017-05-09 NGALX03 Alexander Creek- site 3 - - - -Elk River Alliance 2017-06-26 NGALX03 Alexander Creek- site 3 - - - -Elk River Alliance 2017-07-11 NGALX03 Alexander Creek- site 3 - - - -Elk River Alliance 2017-08-08 NGALX03 Alexander Creek- site 3 - - - -Elk River Alliance 2017-09-12 NGALX03 Alexander Creek- site 3 <0.0050 <0.020 163 3.2Elk River Alliance 2017-10-10 NGALX03 Alexander Creek- site 3 - - - -
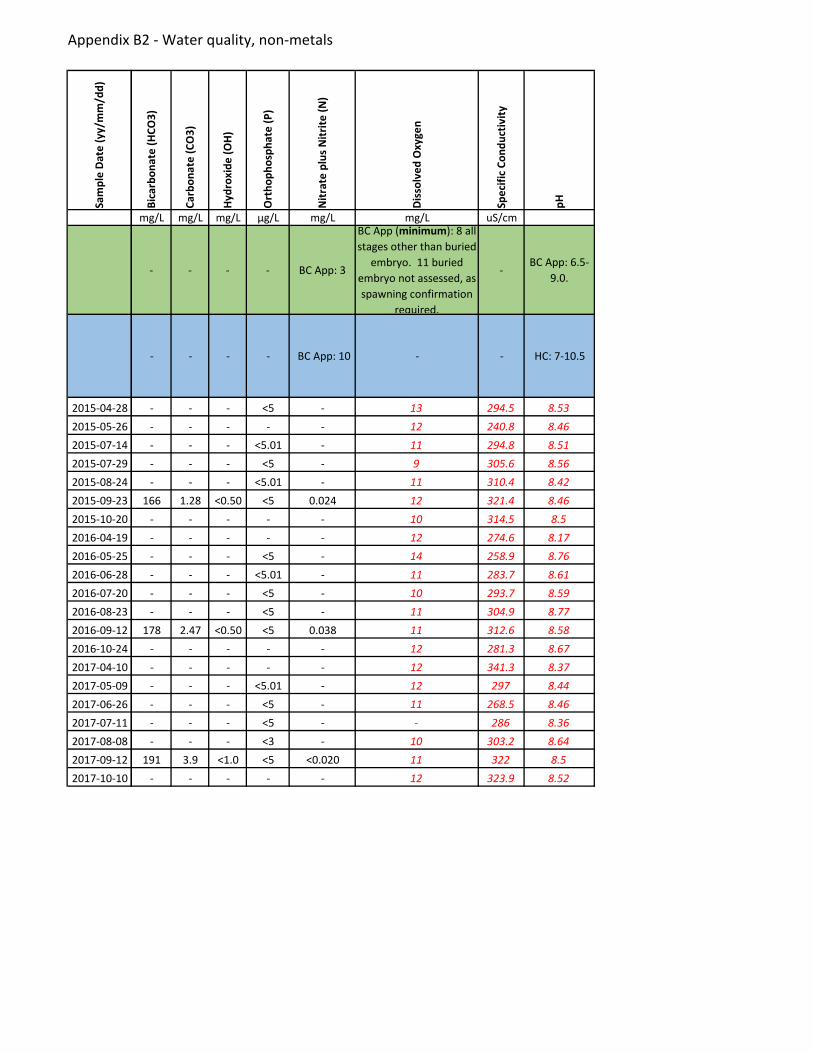
Appendix B2 - Water quality, non-metals
Sam
ple
Date
(yy/
mm
/dd)
2015-04-282015-05-262015-07-142015-07-292015-08-242015-09-232015-10-202016-04-192016-05-252016-06-282016-07-202016-08-232016-09-122016-10-242017-04-102017-05-092017-06-262017-07-112017-08-082017-09-122017-10-10
Bica
rbon
ate
(HCO
3)
Carb
onat
e (C
O3)
Hydr
oxid
e (O
H)
Ort
hoph
osph
ate
(P)
Nitr
ate
plus
Nitr
ite (N
)
Diss
olve
d O
xyge
n
Spec
ific
Cond
uctiv
ity
pH
mg/L mg/L mg/L µg/L mg/L mg/L uS/cm
- - - - BC App: 3
BC App (minimum): 8 all stages other than buried
embryo. 11 buried embryo not assessed, as spawning confirmation
required.
-BC App: 6.5-
9.0.
- - - - BC App: 10 - - HC: 7-10.5
- - - <5 - 13 294.5 8.53- - - - - 12 240.8 8.46- - - <5.01 - 11 294.8 8.51- - - <5 - 9 305.6 8.56- - - <5.01 - 11 310.4 8.42
166 1.28 <0.50 <5 0.024 12 321.4 8.46- - - - - 10 314.5 8.5- - - - - 12 274.6 8.17- - - <5 - 14 258.9 8.76- - - <5.01 - 11 283.7 8.61- - - <5 - 10 293.7 8.59- - - <5 - 11 304.9 8.77
178 2.47 <0.50 <5 0.038 11 312.6 8.58- - - - - 12 281.3 8.67- - - - - 12 341.3 8.37- - - <5.01 - 12 297 8.44- - - <5 - 11 268.5 8.46- - - <5 - - 286 8.36- - - <3 - 10 303.2 8.64
191 3.9 <1.0 <5 <0.020 11 322 8.5- - - - - 12 323.9 8.52
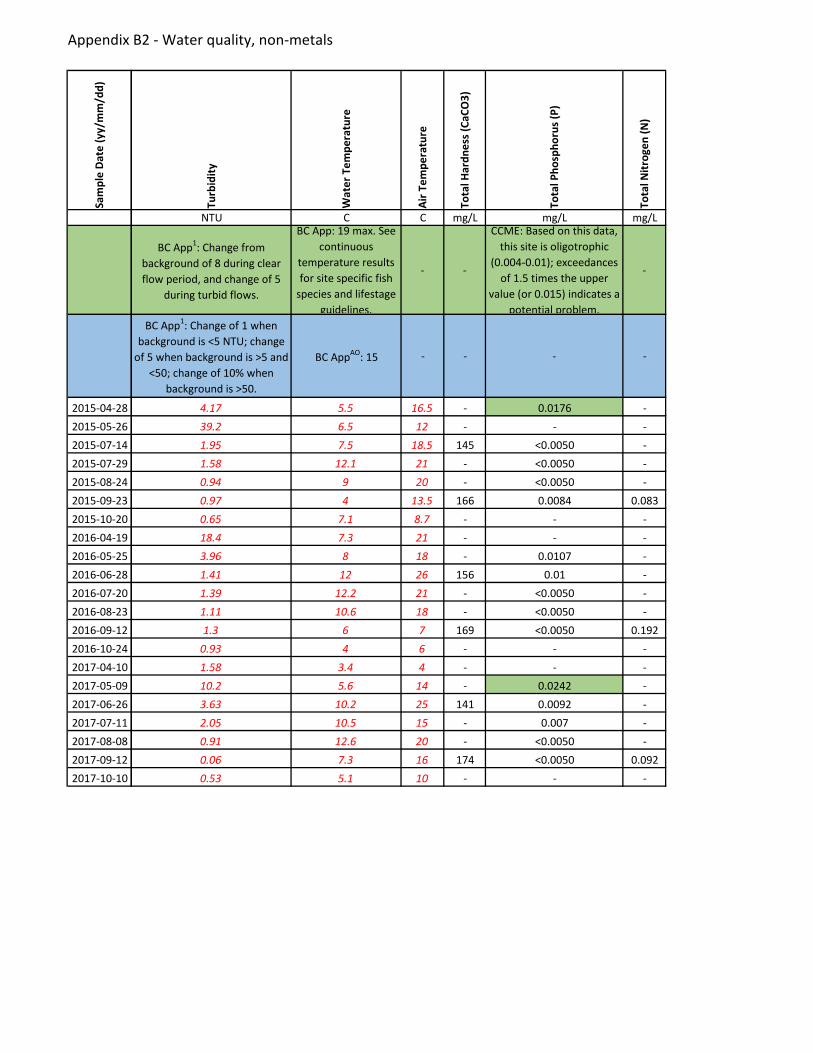
Appendix B2 - Water quality, non-metals
Sam
ple
Date
(yy/
mm
/dd)
2015-04-282015-05-262015-07-142015-07-292015-08-242015-09-232015-10-202016-04-192016-05-252016-06-282016-07-202016-08-232016-09-122016-10-242017-04-102017-05-092017-06-262017-07-112017-08-082017-09-122017-10-10
Turb
idity
Wat
er T
empe
ratu
re
Air T
empe
ratu
re
Tota
l Har
dnes
s (Ca
CO3)
Tota
l Pho
spho
rus (
P)
Tota
l Nitr
ogen
(N)
NTU C C mg/L mg/L mg/L
BC App1: Change from background of 8 during clear flow period, and change of 5
during turbid flows.
BC App: 19 max. See continuous
temperature results for site specific fish
species and lifestage guidelines.
- -
CCME: Based on this data, this site is oligotrophic
(0.004-0.01); exceedances of 1.5 times the upper
value (or 0.015) indicates a potential problem.
-
BC App1: Change of 1 when background is <5 NTU; change
of 5 when background is >5 and <50; change of 10% when
background is >50.
BC AppAO: 15 - - - -
4.17 5.5 16.5 - 0.0176 -39.2 6.5 12 - - -1.95 7.5 18.5 145 <0.0050 -1.58 12.1 21 - <0.0050 -0.94 9 20 - <0.0050 -0.97 4 13.5 166 0.0084 0.0830.65 7.1 8.7 - - -18.4 7.3 21 - - -3.96 8 18 - 0.0107 -1.41 12 26 156 0.01 -1.39 12.2 21 - <0.0050 -1.11 10.6 18 - <0.0050 -1.3 6 7 169 <0.0050 0.192
0.93 4 6 - - -1.58 3.4 4 - - -10.2 5.6 14 - 0.0242 -3.63 10.2 25 141 0.0092 -2.05 10.5 15 - 0.007 -0.91 12.6 20 - <0.0050 -0.06 7.3 16 174 <0.0050 0.0920.53 5.1 10 - - -
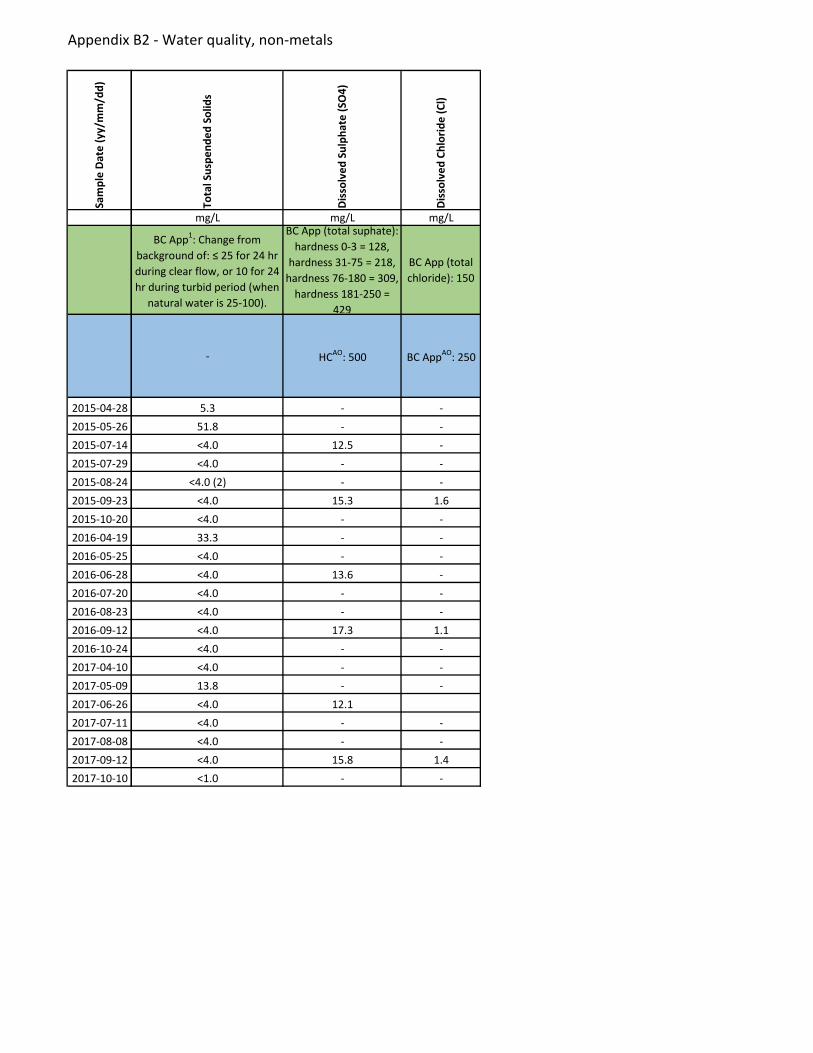
Appendix B2 - Water quality, non-metals
Sam
ple
Date
(yy/
mm
/dd)
2015-04-282015-05-262015-07-142015-07-292015-08-242015-09-232015-10-202016-04-192016-05-252016-06-282016-07-202016-08-232016-09-122016-10-242017-04-102017-05-092017-06-262017-07-112017-08-082017-09-122017-10-10
Tota
l Sus
pend
ed S
olid
s
Diss
olve
d Su
lpha
te (S
O4)
Diss
olve
d Ch
lorid
e (C
l)
mg/L mg/L mg/L
BC App1: Change from background of: ≤ 25 for 24 hr during clear flow, or 10 for 24 hr during turbid period (when
natural water is 25-100).
BC App (total suphate): hardness 0-3 = 128,
hardness 31-75 = 218, hardness 76-180 = 309,
hardness 181-250 = 429
BC App (total chloride): 150
- HCAO: 500 BC AppAO: 250
5.3 - -51.8 - -<4.0 12.5 -<4.0 - -
<4.0 (2) - -<4.0 15.3 1.6<4.0 - -33.3 - -<4.0 - -<4.0 13.6 -<4.0 - -<4.0 - -<4.0 17.3 1.1<4.0 - -<4.0 - -13.8 - -<4.0 12.1<4.0 - -<4.0 - -<4.0 15.8 1.4<1.0 - -
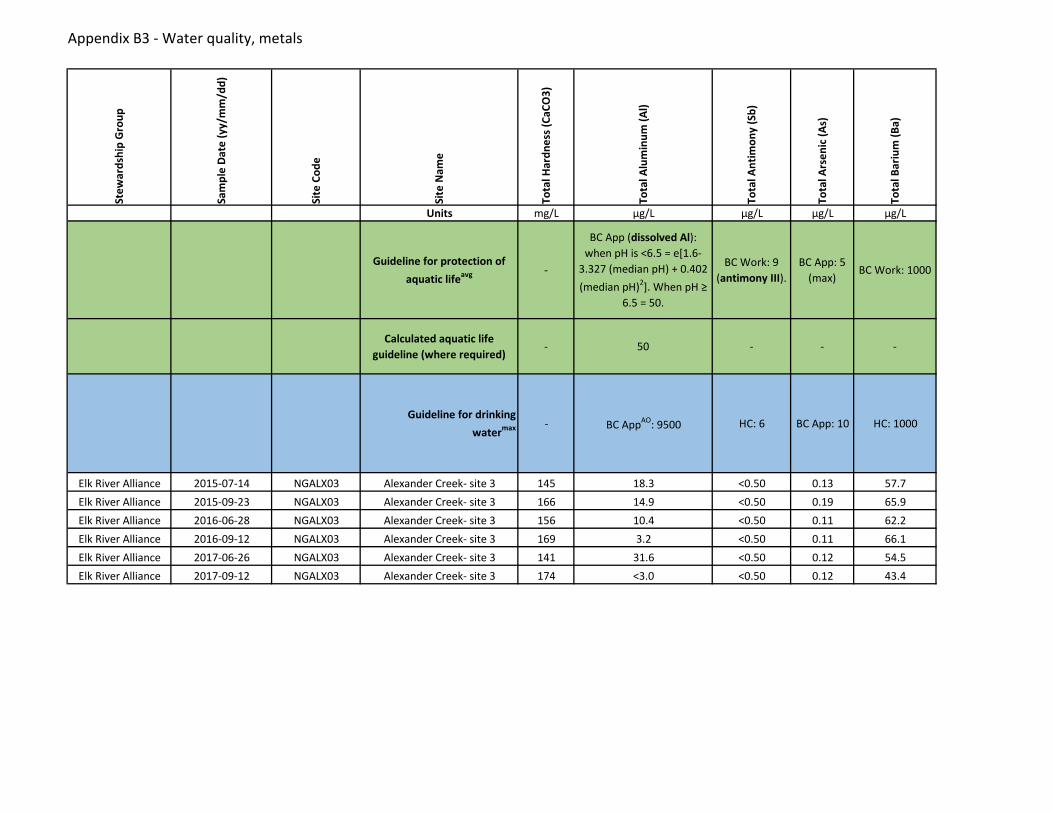
Appendix B3 - Water quality, metals
Stew
ards
hip
Gro
up
Sam
ple
Date
(yy/
mm
/dd)
Site
Cod
e
Site
Nam
e
Tota
l Har
dnes
s (Ca
CO3)
Tota
l Alu
min
um (A
l)
Tota
l Ant
imon
y (S
b)
Tota
l Ars
enic
(As)
Tota
l Bar
ium
(Ba)
Units mg/L µg/L µg/L µg/L µg/L
Guideline for protection of aquatic lifeavg -
BC App (dissolved Al): when pH is <6.5 = e[1.6-
3.327 (median pH) + 0.402 (median pH)2]. When pH ≥
6.5 = 50.
BC Work: 9 (antimony III).
BC App: 5 (max)
BC Work: 1000
Calculated aquatic life guideline (where required)
- 50 - - -
Guideline for drinking watermax - BC AppAO: 9500 HC: 6 BC App: 10 HC: 1000
Elk River Alliance 2015-07-14 NGALX03 Alexander Creek- site 3 145 18.3 <0.50 0.13 57.7Elk River Alliance 2015-09-23 NGALX03 Alexander Creek- site 3 166 14.9 <0.50 0.19 65.9Elk River Alliance 2016-06-28 NGALX03 Alexander Creek- site 3 156 10.4 <0.50 0.11 62.2Elk River Alliance 2016-09-12 NGALX03 Alexander Creek- site 3 169 3.2 <0.50 0.11 66.1Elk River Alliance 2017-06-26 NGALX03 Alexander Creek- site 3 141 31.6 <0.50 0.12 54.5Elk River Alliance 2017-09-12 NGALX03 Alexander Creek- site 3 174 <3.0 <0.50 0.12 43.4
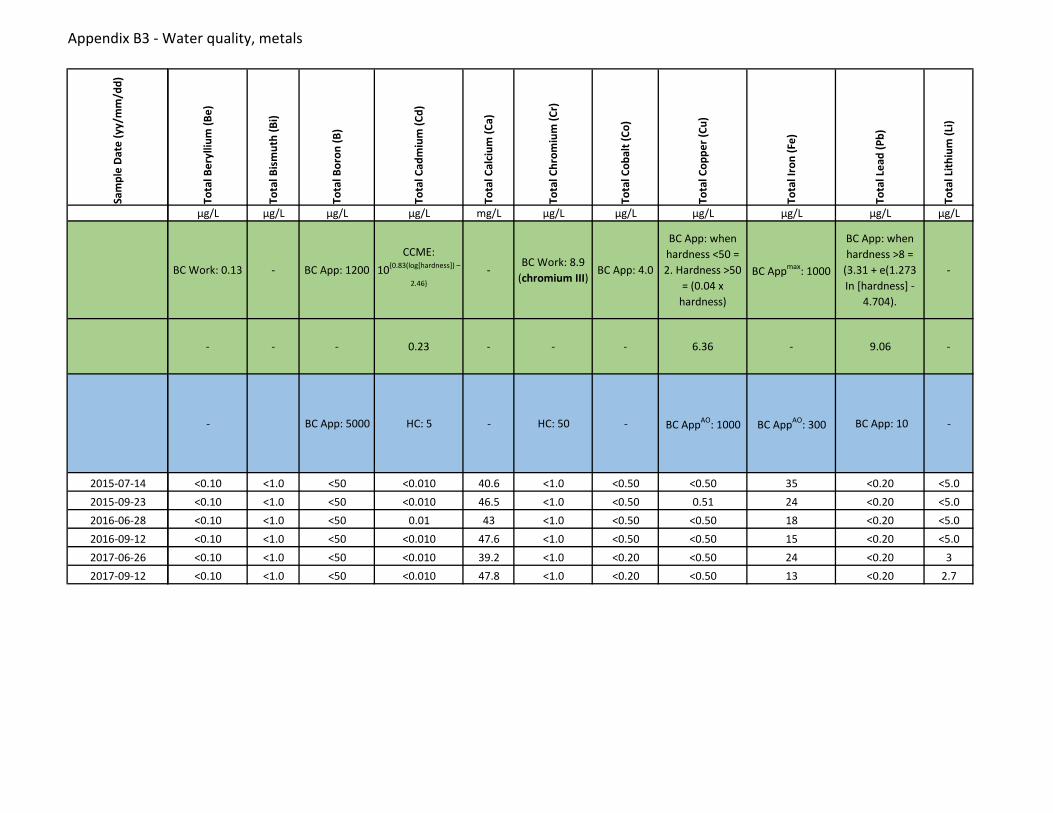
Appendix B3 - Water quality, metals
Sam
ple
Date
(yy/
mm
/dd)
2015-07-142015-09-232016-06-282016-09-122017-06-262017-09-12
Tota
l Ber
ylliu
m (B
e)
Tota
l Bis
mut
h (B
i)
Tota
l Bor
on (B
)
Tota
l Cad
miu
m (C
d)
Tota
l Cal
cium
(Ca)
Tota
l Chr
omiu
m (C
r)
Tota
l Cob
alt (
Co)
Tota
l Cop
per (
Cu)
Tota
l Iro
n (F
e)
Tota
l Lea
d (P
b)
Tota
l Lith
ium
(Li)
µg/L µg/L µg/L µg/L mg/L µg/L µg/L µg/L µg/L µg/L µg/L
BC Work: 0.13 - BC App: 1200CCME:
10{0.83(log[hardness]) –
2.46}-
BC Work: 8.9 (chromium III)
BC App: 4.0
BC App: when hardness <50 = 2. Hardness >50
= (0.04 x hardness)
BC Appmax: 1000
BC App: when hardness >8 =
(3.31 + e(1.273 In [hardness] -
4.704).
-
- - - 0.23 - - - 6.36 - 9.06 -
- BC App: 5000 HC: 5 - HC: 50 - BC AppAO: 1000 BC AppAO: 300 BC App: 10 -
<0.10 <1.0 <50 <0.010 40.6 <1.0 <0.50 <0.50 35 <0.20 <5.0<0.10 <1.0 <50 <0.010 46.5 <1.0 <0.50 0.51 24 <0.20 <5.0<0.10 <1.0 <50 0.01 43 <1.0 <0.50 <0.50 18 <0.20 <5.0<0.10 <1.0 <50 <0.010 47.6 <1.0 <0.50 <0.50 15 <0.20 <5.0<0.10 <1.0 <50 <0.010 39.2 <1.0 <0.20 <0.50 24 <0.20 3<0.10 <1.0 <50 <0.010 47.8 <1.0 <0.20 <0.50 13 <0.20 2.7
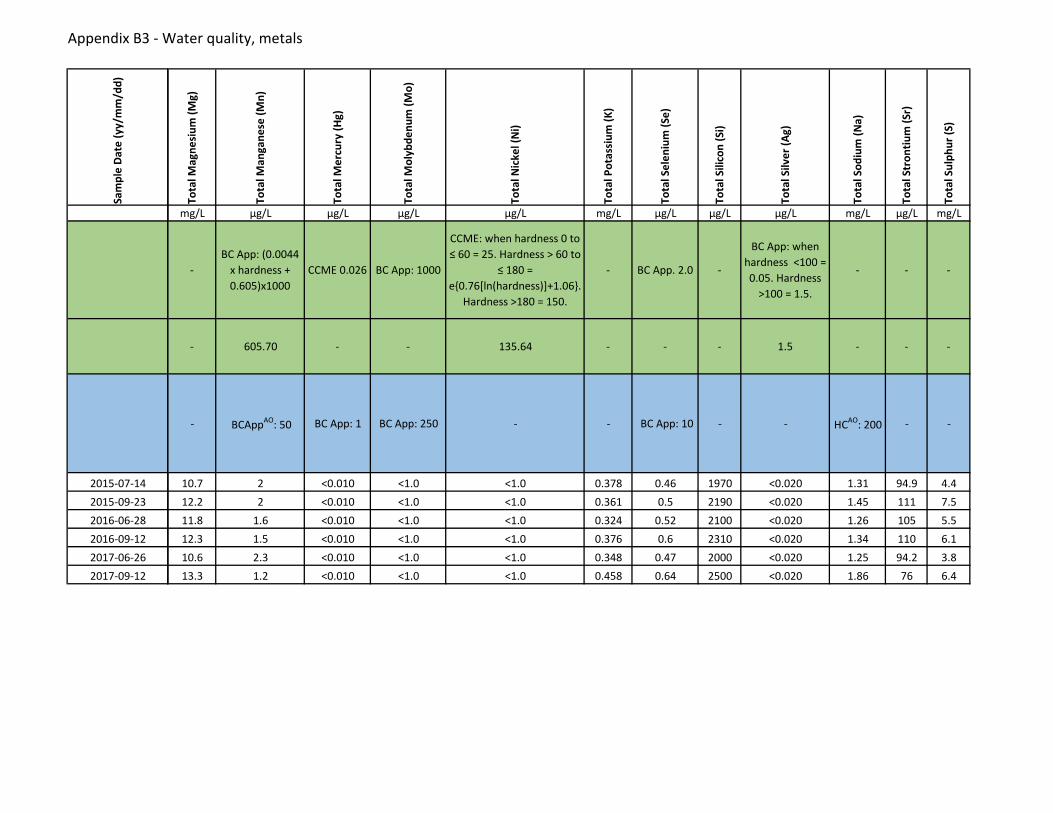
Appendix B3 - Water quality, metals
Sam
ple
Date
(yy/
mm
/dd)
2015-07-142015-09-232016-06-282016-09-122017-06-262017-09-12
Tota
l Mag
nesi
um (M
g)
Tota
l Man
gane
se (M
n)
Tota
l Mer
cury
(Hg)
Tota
l Mol
ybde
num
(Mo)
Tota
l Nic
kel (
Ni)
Tota
l Pot
assi
um (K
)
Tota
l Sel
eniu
m (S
e)
Tota
l Sili
con
(Si)
Tota
l Silv
er (A
g)
Tota
l Sod
ium
(Na)
Tota
l Str
ontiu
m (S
r)
Tota
l Sul
phur
(S)
mg/L µg/L µg/L µg/L µg/L mg/L µg/L µg/L µg/L mg/L µg/L mg/L
-BC App: (0.0044
x hardness + 0.605)x1000
CCME 0.026 BC App: 1000
CCME: when hardness 0 to ≤ 60 = 25. Hardness > 60 to
≤ 180 = e{0.76[ln(hardness)]+1.06}.
Hardness >180 = 150.
- BC App. 2.0 -
BC App: when hardness <100 = 0.05. Hardness
>100 = 1.5.
- - -
- 605.70 - - 135.64 - - - 1.5 - - -
- BCAppAO: 50 BC App: 1 BC App: 250 - - BC App: 10 - - HCAO: 200 - -
10.7 2 <0.010 <1.0 <1.0 0.378 0.46 1970 <0.020 1.31 94.9 4.412.2 2 <0.010 <1.0 <1.0 0.361 0.5 2190 <0.020 1.45 111 7.511.8 1.6 <0.010 <1.0 <1.0 0.324 0.52 2100 <0.020 1.26 105 5.512.3 1.5 <0.010 <1.0 <1.0 0.376 0.6 2310 <0.020 1.34 110 6.110.6 2.3 <0.010 <1.0 <1.0 0.348 0.47 2000 <0.020 1.25 94.2 3.813.3 1.2 <0.010 <1.0 <1.0 0.458 0.64 2500 <0.020 1.86 76 6.4
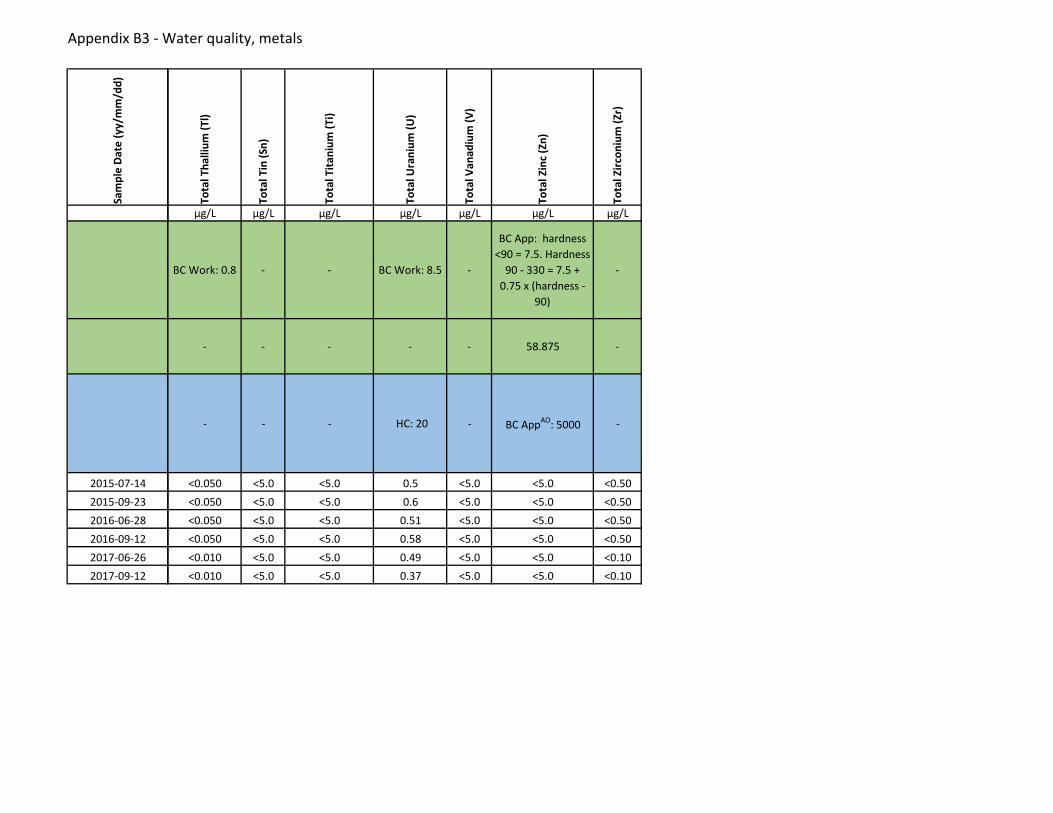
Appendix B3 - Water quality, metals
Sam
ple
Date
(yy/
mm
/dd)
2015-07-142015-09-232016-06-282016-09-122017-06-262017-09-12
Tota
l Tha
llium
(Tl)
Tota
l Tin
(Sn)
Tota
l Tita
nium
(Ti)
Tota
l Ura
nium
(U)
Tota
l Van
adiu
m (V
)
Tota
l Zin
c (Z
n)
Tota
l Zirc
oniu
m (Z
r)
µg/L µg/L µg/L µg/L µg/L µg/L µg/L
BC Work: 0.8 - - BC Work: 8.5 -
BC App: hardness <90 = 7.5. Hardness
90 - 330 = 7.5 + 0.75 x (hardness -
90)
-
- - - - - 58.875 -
- - - HC: 20 - BC AppAO: 5000 -
<0.050 <5.0 <5.0 0.5 <5.0 <5.0 <0.50<0.050 <5.0 <5.0 0.6 <5.0 <5.0 <0.50<0.050 <5.0 <5.0 0.51 <5.0 <5.0 <0.50<0.050 <5.0 <5.0 0.58 <5.0 <5.0 <0.50<0.010 <5.0 <5.0 0.49 <5.0 <5.0 <0.10<0.010 <5.0 <5.0 0.37 <5.0 <5.0 <0.10