holmberg, nico; sammalkorpi, maria; laasonen, kari ion ... · this document is the accepted...
TRANSCRIPT
This is an electronic reprint of the original article.This reprint may differ from the original in pagination and typographic detail.
Powered by TCPDF (www.tcpdf.org)
This material is protected by copyright and other intellectual property rights, and duplication or sale of all or part of any of the repository collections is not permitted, except that material may be duplicated by you for your research use or educational purposes in electronic or print form. You must obtain permission for any other use. Electronic or print copies may not be offered, whether for sale or otherwise to anyone who is not an authorised user.
Holmberg, Nico; Sammalkorpi, Maria; Laasonen, Kari
Ion transport through water - organic solvent liquid-liquid interface: a simulation study
Published in:Journal of Physical Chemistry B
DOI:10.1021/jp412162c
Published: 01/01/2014
Document VersionPeer reviewed version
Please cite the original version:Holmberg, N., Sammalkorpi, M., & Laasonen, K. (2014). Ion transport through water - organic solvent liquid-liquid interface: a simulation study. Journal of Physical Chemistry B, 118(22), 5957-5970.https://doi.org/10.1021/jp412162c
Ion transport through water – organic solvent
liquid-liquid interface: a simulation study
Nico Holmberg, Maria Sammalkorpi, and Kari Laasonen∗
Department of Chemistry, Aalto University, Finland
E-mail: [email protected]
∗To whom correspondence should be addressed
1
This document is the Accepted Manuscript version of a Published Work that appeared in finalform in the Journal of Physical Chemistry B, copyright © American Chemical Society after peerreview and technical editing by the publisher.To access the final edited and published work see http://pubs.acs.org/doi/abs/10.1021/jp412162c
J. Phys. Chem. B, 2014, 118 (22), pp 5957–5970DOI: 10.1021/jp412162c
Abstract
Ion interactions and partitioning at the water-organic solvent interface and the
solvation characteristics have been characterized by molecular dynamics simulations.
More precisely, we study sodium cation transport through water-cyclohexane, water-
1, 2-dichloroethane, and water-pentanol interfaces providing a systematic character-
ization of the ion interfacial behavior including barriers against entering the apolar
phase, as well as, characterization of the interfaces in the presence of the ions. We
find a sodium depletion zone at the apolar interface and persistent hydration of the
cation when entering the apolar phase. The barrier against the cation entering the
apolar phase and ion hydration depend strongly on specific characteristics of the or-
ganic solvent. The strength of both barrier and hydration shell binding (persistence
of the cation hydration) go with the apolarity and the surface tension at the inter-
face, that is, both decrease in order cyclohexane-water > 1, 2-dichloroethane-water >
pentanol-water. However, the size of the hydration shell measured in water molecules
bound by the cation entering the less polar phase behaves oppositely with the cation
carrying most water to the pentanol phase, and a much smaller in size, but very tightly
bound water shell to cyclohexane. We discuss the implications of the observations for
ion transport through the interface of immiscible, or poorly miscible liquids, and for
materials of confined ion transport such as ion conduction membranes or biological ion
channel activity.
Keywords: molecular dynamics, hydration, ion interactions, thermodynamic inte-
gration.
Introduction
The interface between two immiscible liquids remains a region on which very little is known
at the microscopic level.1–3 Besides the interfacial microstructure, understanding transport
through the interface remains a major unsolved problem of electrochemistry, despite both
the fundamental and practical importance of the interface formed by two liquids. E.g.,
2
ion transport through membranes, ion selective electrodes, protein folding, biological ion
channels, salting in and out of biological macromolecules, and emulsification processes all
depend on immiscible liquids, their interfaces, and ions at the interfaces. In particular, in
all of these, free energy of transfer through the interface of water and different non-polar,
organic liquids and the size and persistence of the hydration shell of the transported ion
are the key factors in understanding the transport. Here, we tackle the topic by molecular
simulations of ion transport through organic-water interfaces of varying degree of polarity
and the molecular behavior at the interface providing a systematic characterization of the
interfacial behavior as a function of immiscibility of the two liquids toward the purpose of
understanding better barriers for electrochemical transport at interfaces and especially in
porous systems such as ion conduction membranes.
Whereas the structure of bulk liquids can, at molecular level, be characterized by, e.g.,
scattering techniques, the molecular level interface of two immiscible liquids, and charge
interactions there, remain challenging for experimental techniques. Only recently, experi-
mental techniques with molecular level resolution have matured sufficiently to provide spe-
cific information about the aqueous interface. The basic understanding obtained by second
harmonic generation (SHS),4–6 vibrational sum-frequency generation (VSFG),1,7–11 and pho-
toelectron spectroscopy12–15 is that the interfaces have ion-type and interface specific, active
interactions with the ions. Molecular simulations, on the other hand, readily provide infor-
mation of such interfaces providing coinciding information, which presents the interfaces as
rather active and showing ion specificity in their interactions. For recent reviews, see for
example refs 2, 16, and 17. In particular, the binding strength of the ion hydration shell
has direct consequences for their interfacial behavior; small hard ions that form a strong
hydration shell, such as alkali cations or fluoride, are depleted from the interface, whereas
large polarizable ions, for example heavier halides and hydronium, may show propensity for
the interface.2,5,18–21
The possibility to characterize the liquid-liquid interface on a microstructural level and
3
the detailed dynamics information readily available have raised significant interest on molec-
ular dynamics simulations of ions and their interactions at immiscible water - organic solvent
interfaces since 1990s,4,22–33 but only recently molecular simulations have reached the system
sizes and timescales sufficient to describe interfacial coarsening and transport through the
interface in atomistic detail.32,34 The approaches taken are dominantly classical, point-like
partial charge models although the need for polarizable, or quantum mechanical models, has
been argued.17,35 Polarizable models have been used for the study of ions at the water - vapor
interface17,36–38 but also for ion interactions at liquid-liquid interfaces in, e.g., refs 39–43,
and ion transport in, e.g., refs 40,44–46. These studies show that accounting for polarization
in the model affects the ion-interface behavior, especially when large, polarizable anions are
considered; whereas for sodium, a small and hard ion, the effect is reduced.
We probe the ion transport through water - organic solvent interface by a set of basic
laboratory systems representing interfaces from aqueous-strongly apolar interface (water-
cyclohexane) to partially miscible aqueous-polar liquid interface (water-pentanol). Inter-
mediate interface is provided by water and a slightly polar organic solvent (water-1, 2-
dichloroethane). In agreement with earlier related studies,32,37,40,43,47 we find an interfacial
depletion zone corresponding to the hydration of the sodium cation. Furthermore, we report
persistent hydration of the cation when entering the apolar liquids. For the more polar
pentanol, the remaining hydration shell includes more water molecules but their dynamics
are faster and the hydration is less persistent with some of the water molecules replaced
by alcohol groups dynamically every now and then. Moreover, the observed barrier against
entering the less polar phase depends strongly on specific molecular characteristics of the
liquid with the barrier decreasing with changing the organic solvent from cyclohexane to
dichloroethane to pentanol in this order.
To our knowledge, with the exception of Benjamin’s48,49 pioneering comparisons of in-
terfaces of water and an apolar, a weakly polar, or a polar solvent, this is the first time
a series of liquid interfaces with varying polarity difference has been studied; the existing
4
studies are typically limited to a specific aqueous interface at each time which makes compar-
ison of different interfaces difficult. The present work provides significant new microscopic
understanding of the differences of the interfaces as here the interfaces are characterized in
atomistic detail both in water and the organic solvent with dynamics included. Additionally,
to our knowledge, this is the first time a series of system sizes and time scales sufficient to
characterize the interfacial coarsening and its dynamics are presented. We relate the bar-
rier height, interfacial coarsening, and ion hydration between the different systems enabling
comparison. Furthermore, to provide an estimate on the effects of polarizability, we perform
comparative simulations with a fully polarizable force field using the cyclohexane-water sys-
tem. Finally, we discuss the implications of the observations, especially the barrier and the
persistent hydration.
Methods
Computational Model
The Gromacs 4.5.6 simulation package50–52 with GROMOS43A153 united atom force field
with the corresponding ions were employed for the atomistic molecular dynamics (MD)
simulations. GROMOS43a1 is parametrized based on the reproduction of molecular volumes
and heats of vaporization of small chemical species. Cyclohexane and dichloroethane (DCE)
are rather well within the parametrization regime but the pentanol results depend delicately
on the exact miscibility of the two liquids here, as the extent and width of water fingers
penetrating into the alcohol phase (interface raggedness) depend on the mutual solubility
of the alcohol and water molecules within the simulation model. Therefore, for comparison,
in addition to the GROMOS43a1 simulations, we performed the pentanol-water interfacial
study also with pentanol described within the OPLS-aa54 force field which is based on
optimizing organic liquid properties (however, not specifically alcohol-water partitioning).
The OPLS-aa simulations use the standard Aqvist sodium55 and Chandrasekhar chloride56
5
parameters. In compliance with the GROMOS43a1 force field, the SPC water model57
is used for the water phase in the simulations. With the exception of the cyclohexane
system, the SPC/E58 variant, which introduces a minor polarization change to the water
partial charges correcting for density and diffusion, has been used. The same water model
is used for consistency also with the OPLS-aa comparison of pentanol despite not being the
recommended OPLS-aa water model.
The liquid-liquid interface in all systems was constructed by first creating separate cubic
slabs of organic solvent and water. These slabs were first energy minimized using the steepest
descent method and initially relaxed by very short 0.1 ns NVT and 1.0 ns NPT simulations
on individual slabs. Next, the two slabs were united to create the liquid-liquid interface.
The relaxed final system sizes varied between 4.24 nm×4.24 nm×8.47 nm (cyclohexane -
water) to 4.75 nm×4.75 nm×9.51 nm (pentanol - water). These correspond to 2178 −
3844 water molecules in the aqueous phase. The variation in final system sizes result from
differences in initial organic liquid component density. The GROMACS genion algorithm
was used to generate Na+ and Cl− ions in an amount corresponding to an initial 4 M total
ion concentration in the water slab in all systems. Depending on the water slab size, the
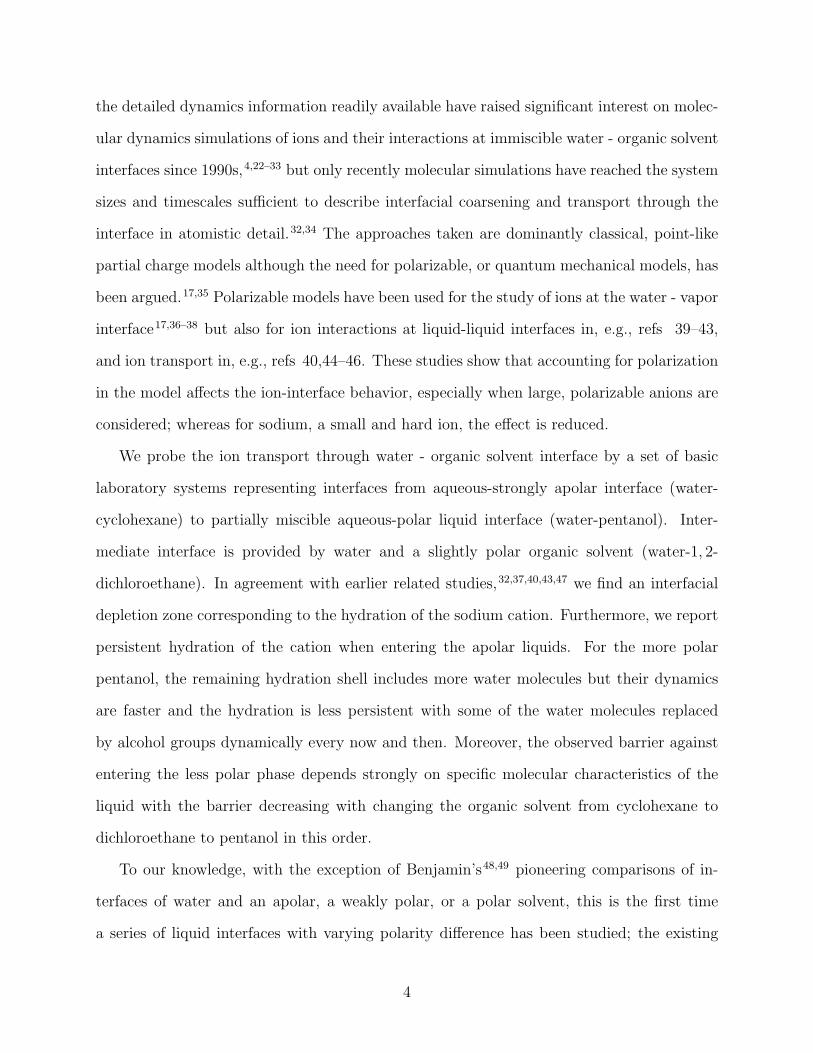
number of ions varied between 192 and 300. Consequently, a bi-interfacial periodic liquid-
liquid system was created with ions spread out in the aqueous phase, see 1 for the resulting
cyclohexane-water system. For calculating the interfacial tensions between the liquids, the
individual slabs were simulated separately in the absence of ions. To ensure that the high
salt concentration or the system size do not affect the physical results, identical cyclohexane-
water simulations were performed at 2 M and 1 M NaCl concentrations, as well as, using a
system where the thickness of the cyclohexane phase was doubled (at NaCl concentrations
of 2 M and 30 mM) and a system where the interfacial surface area was increased by a factor
of 9 (at a NaCl concentration of 2 M). No observable change in ion transport behavior was
observed with the exception of ion pairing behavior, see 4, which is concentration dependent.
Following initialization, all simulations were performed in the NPT ensemble at p = 1 bar
6
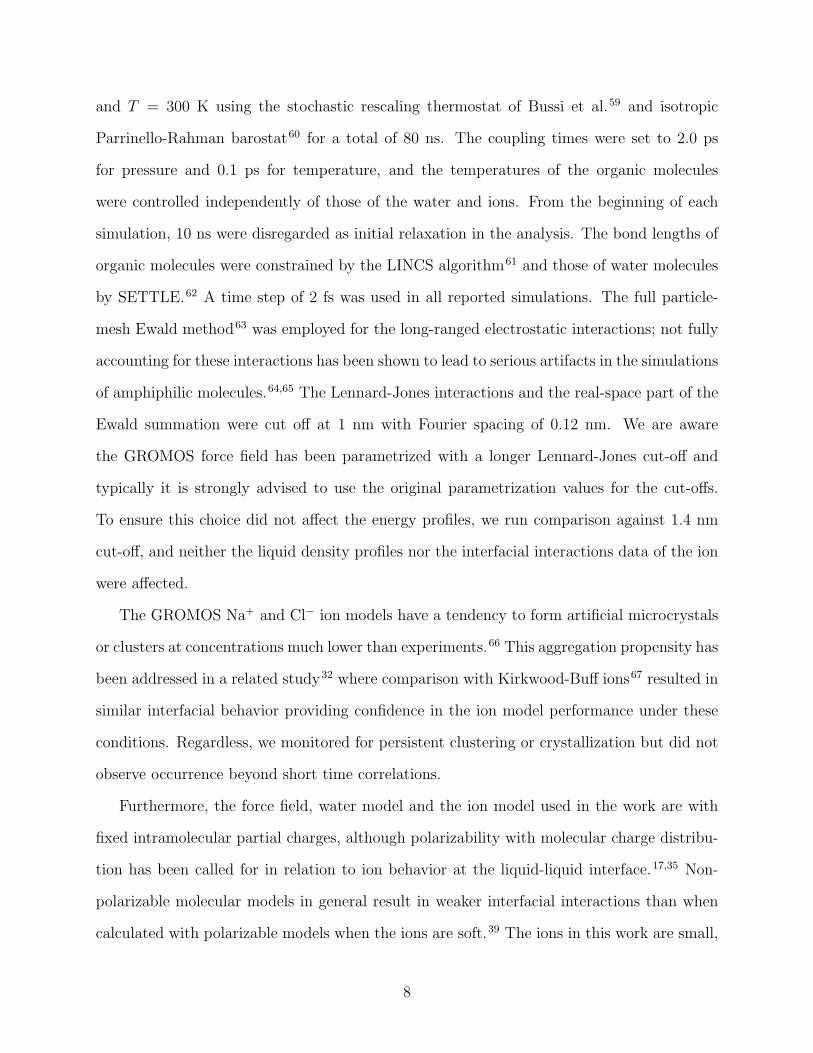
Figure 1: The bi-interfacial cyclohexane-water system. At left, a surface plot of water phaseplotted as its accessible surface area using a 0.3 nm in diameter probe. The water-cyclohexaneinterface is molecularly sharp with some fluctuations. Cyclohexane and the ions are omittedin the surface visualization. At right, the corresponding molecular detail visualization ofthe cross section with both water and cyclohexane phase visualized. Ions are enlarged inthe visualization with sodium represented in black and chloride in green. The snapshotscorrespond to 80 ns.
7
and T = 300 K using the stochastic rescaling thermostat of Bussi et al.59 and isotropic
Parrinello-Rahman barostat60 for a total of 80 ns. The coupling times were set to 2.0 ps
for pressure and 0.1 ps for temperature, and the temperatures of the organic molecules
were controlled independently of those of the water and ions. From the beginning of each
simulation, 10 ns were disregarded as initial relaxation in the analysis. The bond lengths of
organic molecules were constrained by the LINCS algorithm61 and those of water molecules
by SETTLE.62 A time step of 2 fs was used in all reported simulations. The full particle-
mesh Ewald method63 was employed for the long-ranged electrostatic interactions; not fully
accounting for these interactions has been shown to lead to serious artifacts in the simulations
of amphiphilic molecules.64,65 The Lennard-Jones interactions and the real-space part of the
Ewald summation were cut off at 1 nm with Fourier spacing of 0.12 nm. We are aware
the GROMOS force field has been parametrized with a longer Lennard-Jones cut-off and
typically it is strongly advised to use the original parametrization values for the cut-offs.
To ensure this choice did not affect the energy profiles, we run comparison against 1.4 nm
cut-off, and neither the liquid density profiles nor the interfacial interactions data of the ion
were affected.
The GROMOS Na+ and Cl− ion models have a tendency to form artificial microcrystals
or clusters at concentrations much lower than experiments.66 This aggregation propensity has
been addressed in a related study32 where comparison with Kirkwood-Buff ions67 resulted in
similar interfacial behavior providing confidence in the ion model performance under these
conditions. Regardless, we monitored for persistent clustering or crystallization but did not
observe occurrence beyond short time correlations.
Furthermore, the force field, water model and the ion model used in the work are with
fixed intramolecular partial charges, although polarizability with molecular charge distribu-
tion has been called for in relation to ion behavior at the liquid-liquid interface.17,35 Non-
polarizable molecular models in general result in weaker interfacial interactions than when
calculated with polarizable models when the ions are soft.39 The ions in this work are small,
8
hard ions, and they remain solvated by a water shell crossing the interface. This reduces
the magnitude of expected polarization changes. However, to evaluate the significance of
polarizability here, we performed comparative simulations for the cyclohexane-water sys-
tem using the CHARMM-based, Drude-polarizable force field68 at an ion concentration of
40 mM. The cyclohexane-water system was chosen for these comparison simulations because
cyclohexane has the largest polarizability of the studied organic molecules. The correspond-
ing non-polarizable reference data were obtained with the regular CHARMM36 force field.69
Additional details regarding these comparison simulations are reported in the Supporting
Information.
Simulation methods and analysis
To extract an approximation of the effective free energy landscape the cation observes in
an immiscible system of water and apolar organic solvent, we determined the potential of
mean force observed by the cation. In practice, a Na+ ion residing in the bulk water phase
was randomly selected and moved slowly stepwise with a constant rate toward and through
the interface into the organic phase. The ion degrees of freedom on the plane parallel to
the interface were unconstrained during the translation through the interface. The resultant
force magnitude and direction on the ion being slowly moved from one phase to another
fluctuates between consequent steps but provided the ion movement is slow enough, and
allows sufficient sampling of configurations at each averaging step to provide accurate values,
the mean force on the ion corresponds to the effective energy landscape observed by the ion.
We determine this mean force computationally and in this work, the averaging is done over
5000 steps (10 ps).
The ionic solvation was determined by calculating the number of water molecules within
a radius corresponding to the second solvation shell of the ion. For Na in water, this is
determined to be 0.53 nm based on the minimum after the 2nd peak in the radial distribution
function of water solvating Na. For an ion in the organic solvents, this radius is ambiguous,
9
and depends on the system. In order to maintain comparability of the results within different
systems, the same 0.53 nm cut-off was used also in the organic solvent phases for the hydrated
ions. The sensibility of using the second solvation shell as the cut-off was verified by analyzing
the final solvation clusters around Na ions in the cyclohexane and dichloroethane phases;
these contain water in 1st and 2nd solvation shell but beyond that, only the organic solvent
is present. In the partially miscible alcohol systems, frequent exchange of water molecules
and alcohol groups in the solvation shell takes place; also here the same cut-off is used for
comparability.
Molecular stability of the solvation shell was characterized by determining the persistence
time the molecules typically remained in this solvation shell of the ion. The density profiles
were calculated slabwise using an equal division of the simulation box into 100 bins in the
direction perpendicular to the interface.
Simulated system
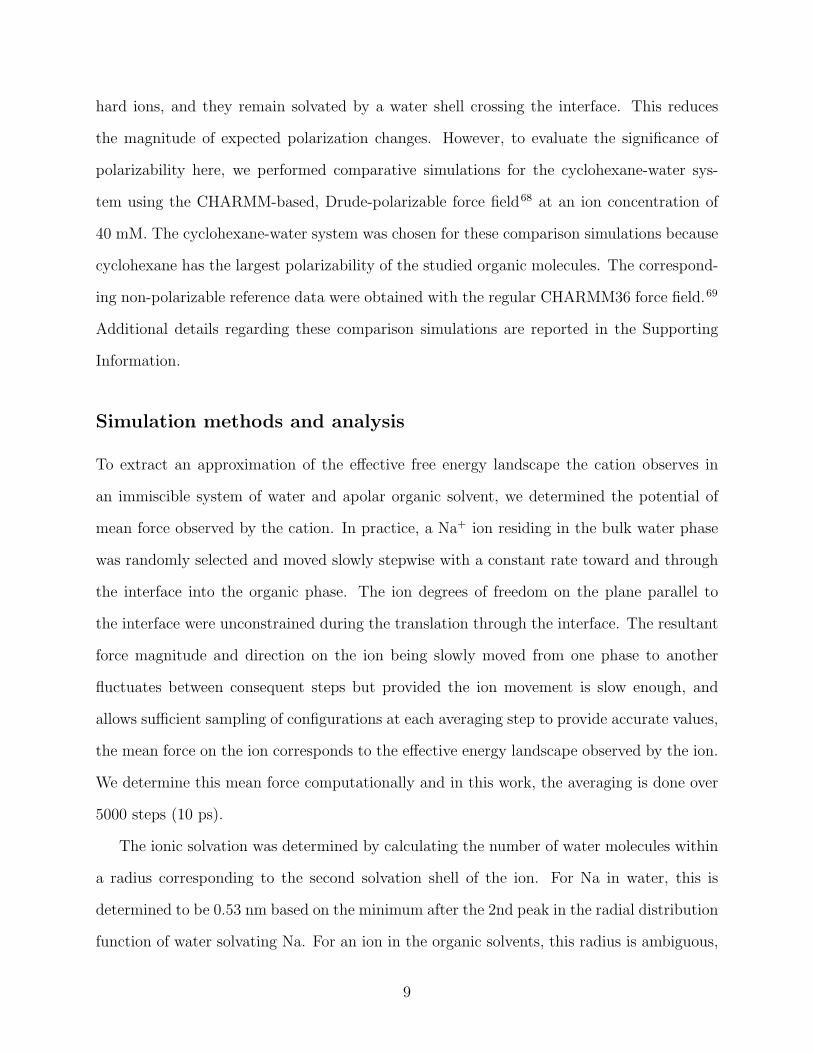
2 shows the chemical structures, as well as, the employed simulation model atom types and
partial charges for the organic molecules in this study. No partial charges were assigned
for cyclohexane molecules making cyclohexane completely apolar. The partial charges of
1, 2-dichloroethane and pentanol are based on the partial charges of refs 70 and 54 with
the all-atom charges of the non-polar hydrogens and the neighboring heavy atom combined
in the united atom parametrizations. For pentanol, the counter charge of the alcohol group
is divided between the two closest carbons to the group, see 2. In addition to the pentanol-
water interface, we also run comparison simulations with the even more miscible butanol-
water interface with an analogous model. However, as this system did not equilibrate within
the simulation time scale due to high degree of miscibility and formation of extensive water
channels into the butanol phase, the results were deemed quantitatively inconclusive and are
included only at cursory level.
The water molecules follow the SPC57 and SPC/E58 models depending on the system.
10
All parameters not explicitly specified are according to the standard force field interactions
in GROMOS 43a1.53 The molecular topologies were generated using the PRODRG server.71
CH2
δ = 0.0
CH2
δ = 0.0
CH2
δ = 0.0
CH2
δ = 0.0
CH2
δ = 0.0
CH2
δ = 0.0
CH2
δ = +0.2
CH2
δ = +0.2
CL
δ = -0.2
CL
δ = -0.2
CH3
δ = 0.0
CH2
δ = 0.0
CH2
δ = 0.0
CH2
δ = +0.1325
CH2
δ = +0.1325
OA
δ = -0.683
H
δ = +0.418 H (opls_155)
δ = +0.418
O (opls_154)
δ = -0.683
C (opls_157)
δ = +0.145
H (opls_156)
δ = +0.06
C (opls_157)
δ = -0.12
H (opls_156)
δ = +0.06
C (opls_157)
δ = -0.18
H (opls_156)
δ = +0.06
Figure 2: The structures of the simulated organic molecules; cyclohexane (top left), 1, 2-dichloroethane (top right), pentanol in GROMOS43a1 united atom description (bottomleft), and pentanol in OPLS-all-atom description (bottom right). In addition, the force fieldspecific atom type labels and assigned values of partial charges, δ, used in the simulationsare shown. The values shown for individual hydrogens apply to each hydrogen connected tothe same atom.
Results
Water-cyclohexane interface
The water-cyclohexane interface was chosen as a model interface for two immiscible liquids,
see 1. In the simulations of joint water and cyclohexane slabs, both the water and the cyclo-
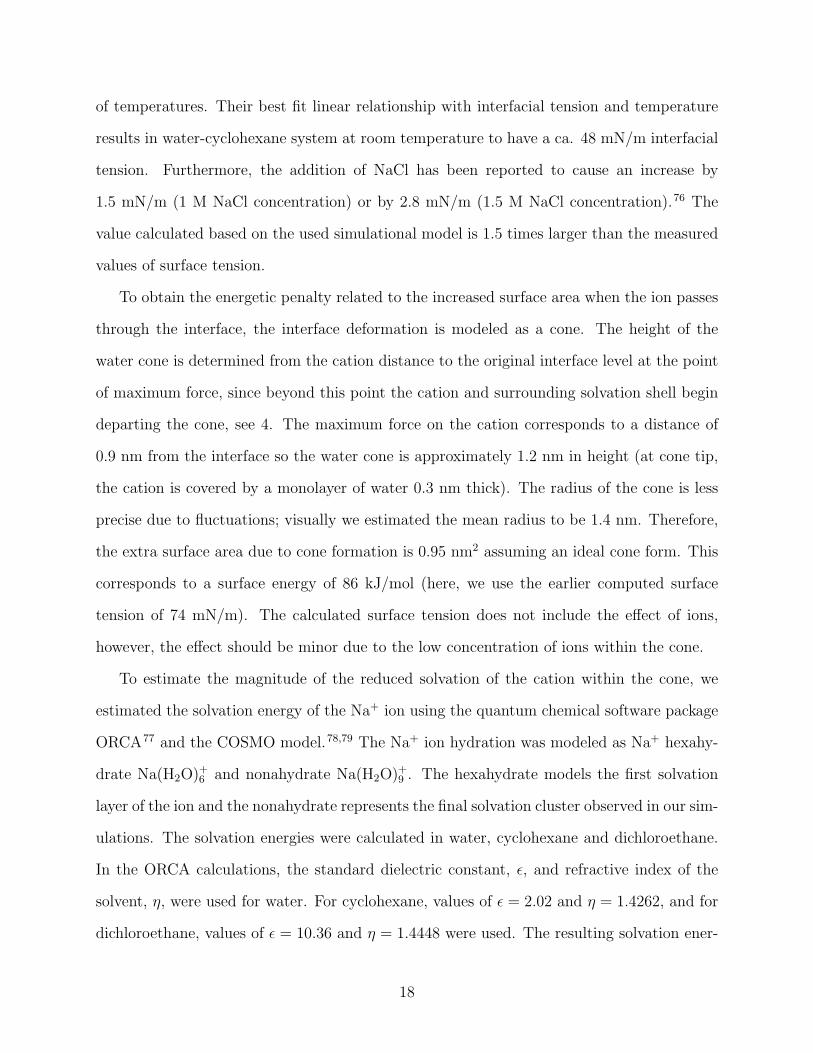
hexane phase quickly equilibrate to form the uniform density profiles presented in 3 at left.
The symmetric dual-interface results from the usage of periodic boundary conditions. The
11
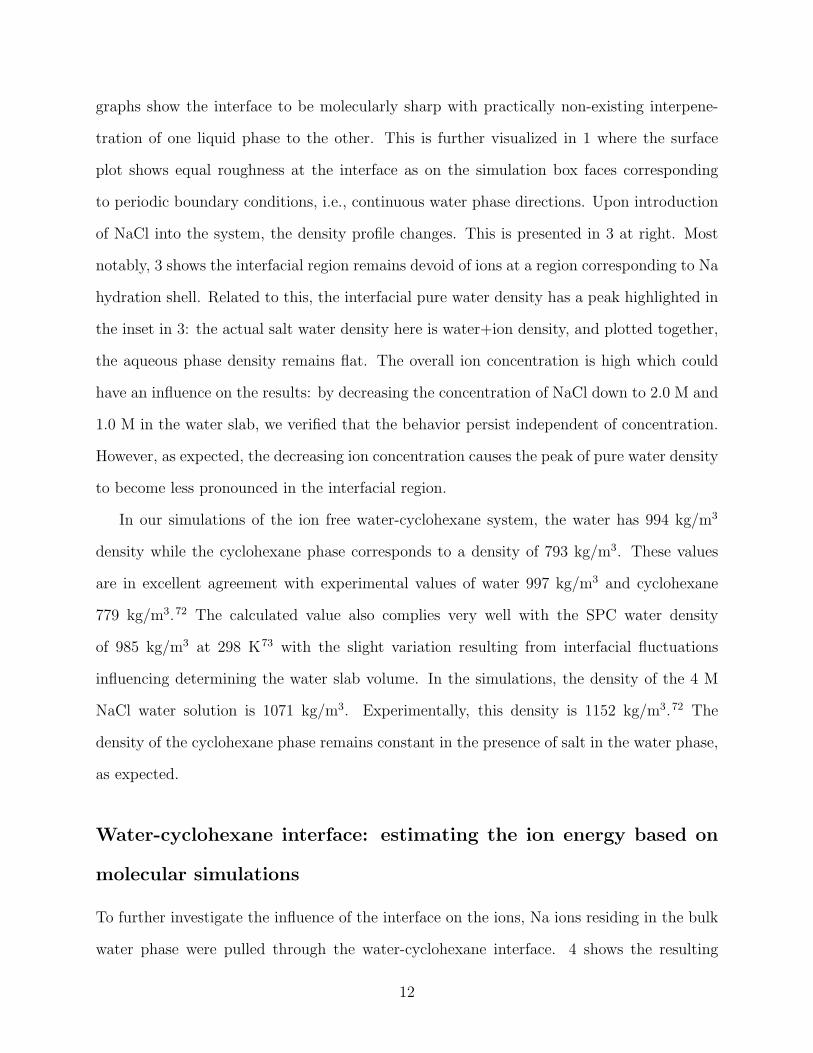
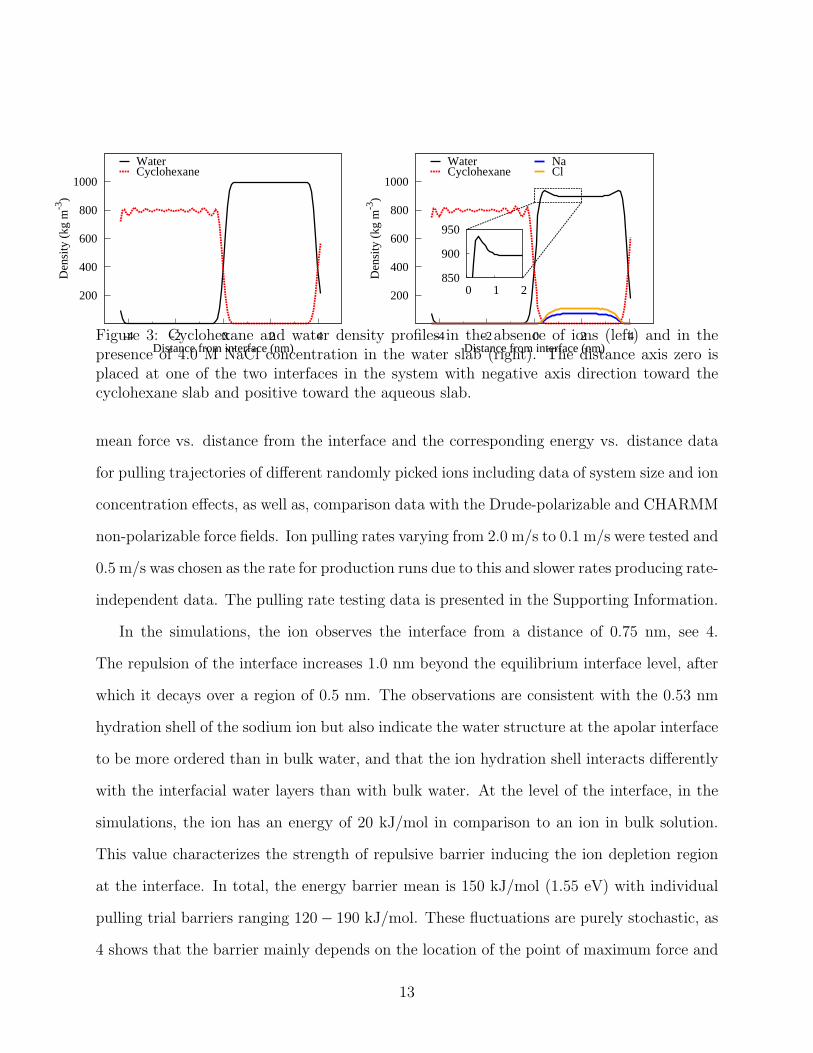
graphs show the interface to be molecularly sharp with practically non-existing interpene-
tration of one liquid phase to the other. This is further visualized in 1 where the surface
plot shows equal roughness at the interface as on the simulation box faces corresponding
to periodic boundary conditions, i.e., continuous water phase directions. Upon introduction
of NaCl into the system, the density profile changes. This is presented in 3 at right. Most
notably, 3 shows the interfacial region remains devoid of ions at a region corresponding to Na
hydration shell. Related to this, the interfacial pure water density has a peak highlighted in
the inset in 3: the actual salt water density here is water+ion density, and plotted together,
the aqueous phase density remains flat. The overall ion concentration is high which could
have an influence on the results: by decreasing the concentration of NaCl down to 2.0 M and
1.0 M in the water slab, we verified that the behavior persist independent of concentration.
However, as expected, the decreasing ion concentration causes the peak of pure water density
to become less pronounced in the interfacial region.
In our simulations of the ion free water-cyclohexane system, the water has 994 kg/m3
density while the cyclohexane phase corresponds to a density of 793 kg/m3. These values
are in excellent agreement with experimental values of water 997 kg/m3 and cyclohexane
779 kg/m3.72 The calculated value also complies very well with the SPC water density
of 985 kg/m3 at 298 K73 with the slight variation resulting from interfacial fluctuations
influencing determining the water slab volume. In the simulations, the density of the 4 M
NaCl water solution is 1071 kg/m3. Experimentally, this density is 1152 kg/m3.72 The
density of the cyclohexane phase remains constant in the presence of salt in the water phase,
as expected.
Water-cyclohexane interface: estimating the ion energy based on
molecular simulations
To further investigate the influence of the interface on the ions, Na ions residing in the bulk
water phase were pulled through the water-cyclohexane interface. 4 shows the resulting
12
200
400
600
800
1000
-4 -2 0 2 4
Den
sity
(kg
m-3
)
Distance from interface (nm)
WaterCyclohexane
200
400
600
800
1000
-4 -2 0 2 4
Den
sity
(kg
m-3
)
Distance from interface (nm)
WaterCyclohexane
NaCl
850
900
950
0 1 2
Figure 3: Cyclohexane and water density profiles in the absence of ions (left) and in thepresence of 4.0 M NaCl concentration in the water slab (right). The distance axis zero isplaced at one of the two interfaces in the system with negative axis direction toward thecyclohexane slab and positive toward the aqueous slab.
mean force vs. distance from the interface and the corresponding energy vs. distance data
for pulling trajectories of different randomly picked ions including data of system size and ion
concentration effects, as well as, comparison data with the Drude-polarizable and CHARMM
non-polarizable force fields. Ion pulling rates varying from 2.0 m/s to 0.1 m/s were tested and
0.5 m/s was chosen as the rate for production runs due to this and slower rates producing rate-
independent data. The pulling rate testing data is presented in the Supporting Information.
In the simulations, the ion observes the interface from a distance of 0.75 nm, see 4.
The repulsion of the interface increases 1.0 nm beyond the equilibrium interface level, after
which it decays over a region of 0.5 nm. The observations are consistent with the 0.53 nm
hydration shell of the sodium ion but also indicate the water structure at the apolar interface
to be more ordered than in bulk water, and that the ion hydration shell interacts differently
with the interfacial water layers than with bulk water. At the level of the interface, in the
simulations, the ion has an energy of 20 kJ/mol in comparison to an ion in bulk solution.
This value characterizes the strength of repulsive barrier inducing the ion depletion region
at the interface. In total, the energy barrier mean is 150 kJ/mol (1.55 eV) with individual
pulling trial barriers ranging 120− 190 kJ/mol. These fluctuations are purely stochastic, as
4 shows that the barrier mainly depends on the location of the point of maximum force and
13
the environment surrounding the ion at the interfacial boundary.
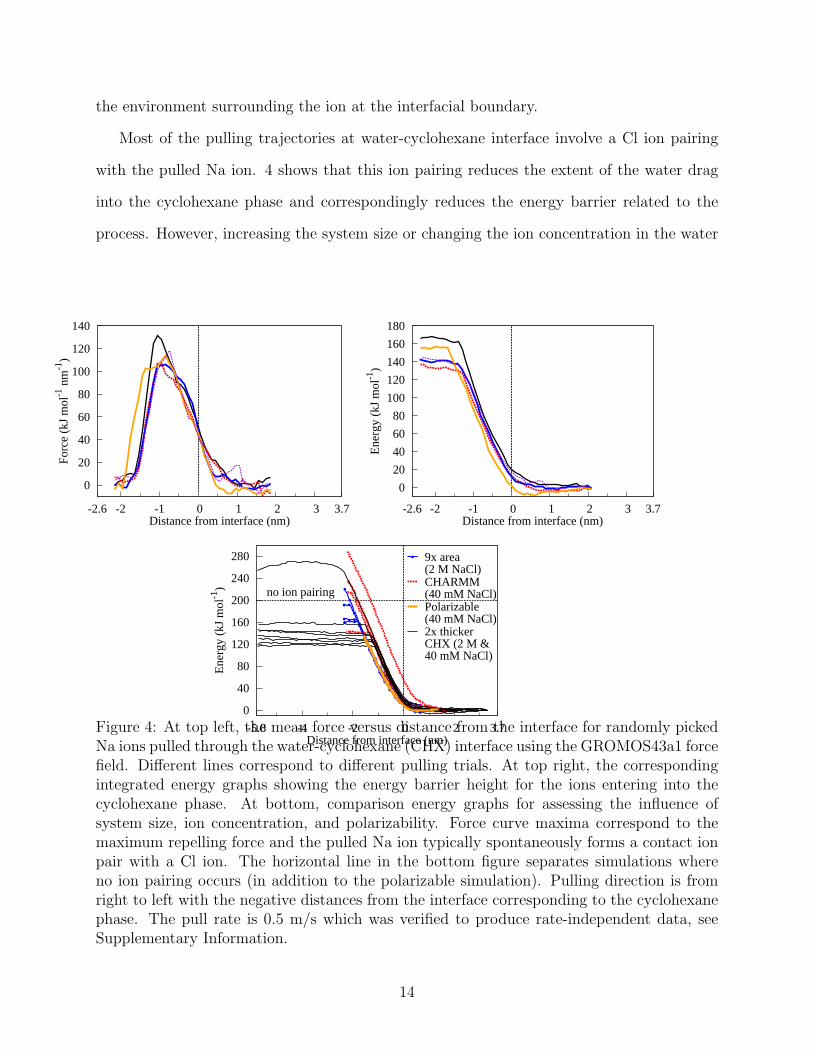
Most of the pulling trajectories at water-cyclohexane interface involve a Cl ion pairing
with the pulled Na ion. 4 shows that this ion pairing reduces the extent of the water drag
into the cyclohexane phase and correspondingly reduces the energy barrier related to the
process. However, increasing the system size or changing the ion concentration in the water
0
20
40
60
80
100
120
140
-2.6 3.7-2 -1 0 1 2 3
Forc
e (k
J m
ol-1
nm
-1)
Distance from interface (nm)
0
20
40
60
80
100
120
140
160
180
-2.6 3.7-2 -1 0 1 2 3
Ene
rgy
(kJ
mol
-1)
Distance from interface (nm)
0
40
80
120
160
200
240
280
-5.8 3.7-4 -2 0 2
Ene
rgy
(kJ
mol
-1)
Distance from interface (nm)
no ion pairing
9x area(2 M NaCl)CHARMM(40 mM NaCl)Polarizable(40 mM NaCl)2x thickerCHX (2 M &40 mM NaCl)
Figure 4: At top left, the mean force versus distance from the interface for randomly pickedNa ions pulled through the water-cyclohexane (CHX) interface using the GROMOS43a1 forcefield. Different lines correspond to different pulling trials. At top right, the correspondingintegrated energy graphs showing the energy barrier height for the ions entering into thecyclohexane phase. At bottom, comparison energy graphs for assessing the influence ofsystem size, ion concentration, and polarizability. Force curve maxima correspond to themaximum repelling force and the pulled Na ion typically spontaneously forms a contact ionpair with a Cl ion. The horizontal line in the bottom figure separates simulations whereno ion pairing occurs (in addition to the polarizable simulation). Pulling direction is fromright to left with the negative distances from the interface corresponding to the cyclohexanephase. The pull rate is 0.5 m/s which was verified to produce rate-independent data, seeSupplementary Information.
14
slab, have little effect on the force and energy values, see 4. Furthermore, our simulation
model has a van der Waals interaction cut-off coinciding with the observed repulsion region.
To verify whether the extent of the repulsion region, or the outcome, is dependent on the van
der Waals cut-off, comparison simulations with a longer cut-off of 1.4 nm were performed;
the results remained intact and we conclude that the result is not related to interaction
cut-off.
The results obtained with the CHARMM non-polarizable force field are analogous to
GROMOS43a1, see 4, showing similar barriers and extent of the water drag regardless
whether ion pairing occurs during pulling. In the fully polarizable simulation, no ion pair-
ing is observed but the force maximum corresponds to energy levels of the majority of the
pulling curves. Consequently, we find that polarization decreases the energy barrier for the
transport of the naked ion to the level of the ion pair in non-polarizable simulations, thus,
conserving the overall barrier. Moreover, analogous to non-polarizable simulations, the inter-
face remains repulsive to the cation as the ion energy at interface level is 10 kJ/mol. Unlike
the non-polarizable simulations, the polarizable force field pulling trajectory is terminated at
the point of maximum force, which corresponds to most of the total energy barrier, because
beyond this level the ion is fully surrounded by cyclohexane (although in water shell) and the
overpolarization caused by the water shell reorganization around the Na causes the model to
become unstable under these conditions. The stability difficulties are likely to be caused by
a lack of damping of the short-range interactions between the ion and cyclohexane, which
falls beyond the parametrization scheme of the force field.74 For additional methodological
discussion, see Supplementary Information. All in all, the polarizable force field results sug-
gest that polarization has only a minor influence on the overall transport energy of Na, so
the other systems, which are less polarizable than the examined cyclohexane, are studied
only with a non-polarizable treatment.
The extent of the retracting force on the ion deep beyond the water-cyclohexane interface
in 4 results from the ion dragging water into the cyclohexane phase. This is presented in 5.
15

Here, a cone-like water wedge forms and penetrates into the cyclohexane region pushing away
cyclohexane. The wedge grows as the ion is pulled further from the equilibrium interface,
and finally breaks at an elongation dependent on the surface tension. The width of the
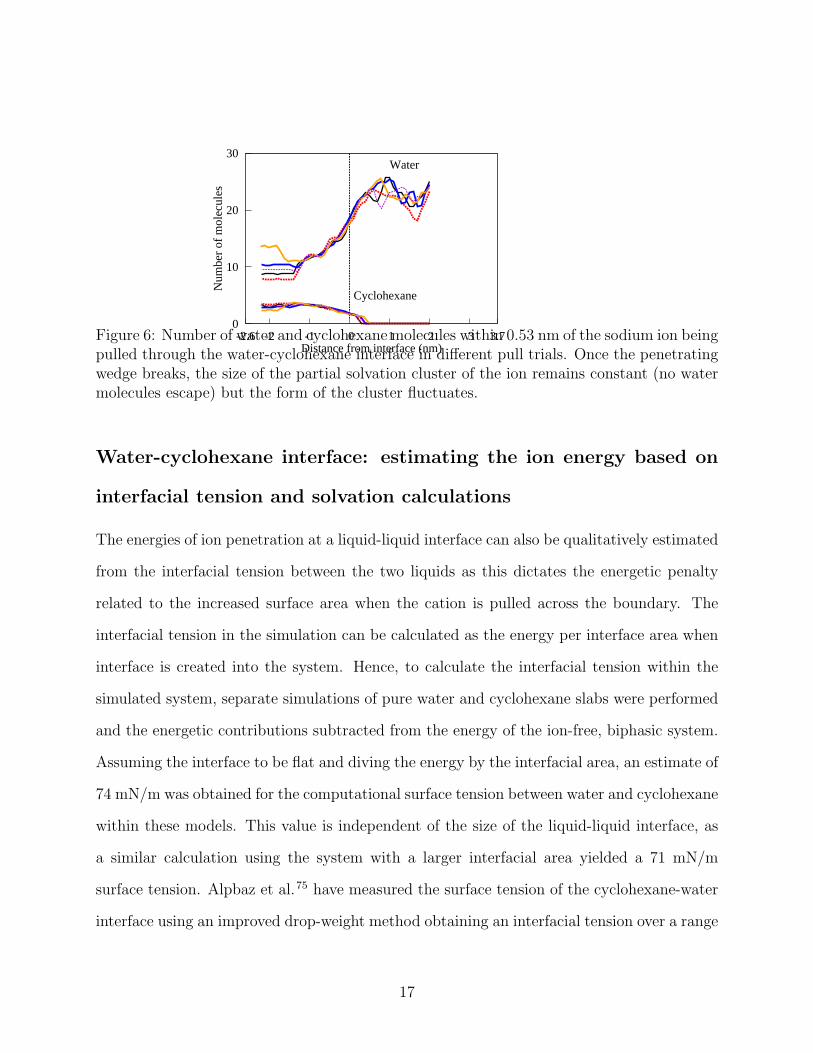
lagging tail of the cone varies between 9 and 3 water molecules. 6 shows the corresponding
temporal evolution of the ion solvation shell when the ion is pulled into cyclohexane. As
the graph shows, upon cone breakage, the ion being pulled keeps carrying with it a small
number of water molecules (between 7 and 14), and occasionally an other ion. These form
a cluster in the cyclohexane phase.
Figure 5: Sample structure of the water cone formed by water dragged into the cyclohexanephase by the penetrating ion. The sodium ion being pulled is presented by the black dot atthe tip of the cone. A solvation shell persists around the ion being pulled in all directions,that is, the size of the ion being pulled has been increased for visualizing it at the surface.In the visualization, the simulation box is shown by a wireframe, cyclohexane is omitted forclarity, and water is plotted as surface plot using an accessible surface probe diameter of0.3 nm. In comparison, 1 shows the unperturbed interface and its molecular sharpness.
16
0
10
20
30
-2.6 3.7-2 -1 0 1 2 3
Num
ber
of m
olec
ules
Distance from interface (nm)
Water
Cyclohexane
Figure 6: Number of water and cyclohexane molecules within 0.53 nm of the sodium ion beingpulled through the water-cyclohexane interface in different pull trials. Once the penetratingwedge breaks, the size of the partial solvation cluster of the ion remains constant (no watermolecules escape) but the form of the cluster fluctuates.
Water-cyclohexane interface: estimating the ion energy based on
interfacial tension and solvation calculations
The energies of ion penetration at a liquid-liquid interface can also be qualitatively estimated
from the interfacial tension between the two liquids as this dictates the energetic penalty
related to the increased surface area when the cation is pulled across the boundary. The
interfacial tension in the simulation can be calculated as the energy per interface area when
interface is created into the system. Hence, to calculate the interfacial tension within the
simulated system, separate simulations of pure water and cyclohexane slabs were performed
and the energetic contributions subtracted from the energy of the ion-free, biphasic system.
Assuming the interface to be flat and diving the energy by the interfacial area, an estimate of
74 mN/m was obtained for the computational surface tension between water and cyclohexane
within these models. This value is independent of the size of the liquid-liquid interface, as
a similar calculation using the system with a larger interfacial area yielded a 71 mN/m
surface tension. Alpbaz et al.75 have measured the surface tension of the cyclohexane-water
interface using an improved drop-weight method obtaining an interfacial tension over a range
17
of temperatures. Their best fit linear relationship with interfacial tension and temperature
results in water-cyclohexane system at room temperature to have a ca. 48 mN/m interfacial
tension. Furthermore, the addition of NaCl has been reported to cause an increase by
1.5 mN/m (1 M NaCl concentration) or by 2.8 mN/m (1.5 M NaCl concentration).76 The
value calculated based on the used simulational model is 1.5 times larger than the measured
values of surface tension.
To obtain the energetic penalty related to the increased surface area when the ion passes
through the interface, the interface deformation is modeled as a cone. The height of the
water cone is determined from the cation distance to the original interface level at the point
of maximum force, since beyond this point the cation and surrounding solvation shell begin
departing the cone, see 4. The maximum force on the cation corresponds to a distance of
0.9 nm from the interface so the water cone is approximately 1.2 nm in height (at cone tip,
the cation is covered by a monolayer of water 0.3 nm thick). The radius of the cone is less
precise due to fluctuations; visually we estimated the mean radius to be 1.4 nm. Therefore,
the extra surface area due to cone formation is 0.95 nm2 assuming an ideal cone form. This
corresponds to a surface energy of 86 kJ/mol (here, we use the earlier computed surface
tension of 74 mN/m). The calculated surface tension does not include the effect of ions,
however, the effect should be minor due to the low concentration of ions within the cone.
To estimate the magnitude of the reduced solvation of the cation within the cone, we
estimated the solvation energy of the Na+ ion using the quantum chemical software package
ORCA77 and the COSMO model.78,79 The Na+ ion hydration was modeled as Na+ hexahy-
drate Na(H2O)+6 and nonahydrate Na(H2O)+9 . The hexahydrate models the first solvation
layer of the ion and the nonahydrate represents the final solvation cluster observed in our sim-
ulations. The solvation energies were calculated in water, cyclohexane and dichloroethane.
In the ORCA calculations, the standard dielectric constant, ϵ, and refractive index of the
solvent, η, were used for water. For cyclohexane, values of ϵ = 2.02 and η = 1.4262, and for
dichloroethane, values of ϵ = 10.36 and η = 1.4448 were used. The resulting solvation ener-
18
gies for Na(H2O)+9 were 2.571 eV (248.1 kJ/mol), 1.024 eV (98.8 kJ/mol) and 2.240 eV (216.1
kJ/mol) for water, cyclohexane, and dichloroethane, respectively. If we assume that 1/4 of
the ion environment at the cone tip is water, and 3/4 consists of the organic solvent, the
values above result in a solvation energy reduction of 112 kJ/mol, at the water-cyclohexane
interface, and 24 kJ/mol, at the water-dichloroethane interface, for the ion at the cone tip.
This reduction is insensitive to the number of waters, that is, the reduction obtained using
hexahydrate as the hydrated ion, is essentially the same.
Water-cyclohexane interface: ion hydration shell
4 provides comparison between the trajectories where pairing occurs and those where a lone
Na+ moves across the interface. In the mean force curves of 4, the maximum repelling
force corresponds to the maximum extension of the water wedge dragged by the ion into
the cyclohexane phase. When the water cone breaks, the force required to pull the ion
forward rapidly decreases, and equilibrates to a constant value corresponding to dragging
the remaining small ion solvation cluster through the cyclohexane phase. Such a small
solvation cluster remains as direct exposure of the Na ion to the cyclohexane is energetically
extremely unfavorable due to unavailability of ion-dipole bonding; the water molecules form
a shielding barrier for the ion lowering its energy in the cyclohexane phase.
When the ion penetrates further into the cyclohexane phase, the exchange frequency, i.e.,
how often one water molecule in the solvation shell is replaced by another from outside the
solvation shell, goes down. This is expected because a more extended water wedge dragged
by the ion has less water molecules readily available for exchange diffusion to the solvation
shell. Once the water wedge breaks into the small cluster shielding the ion in the cyclohexane
phase, no exchange with bulk water is observed, that is, the cluster size remains constant.
19
Water-1,2-dichloroethane interface
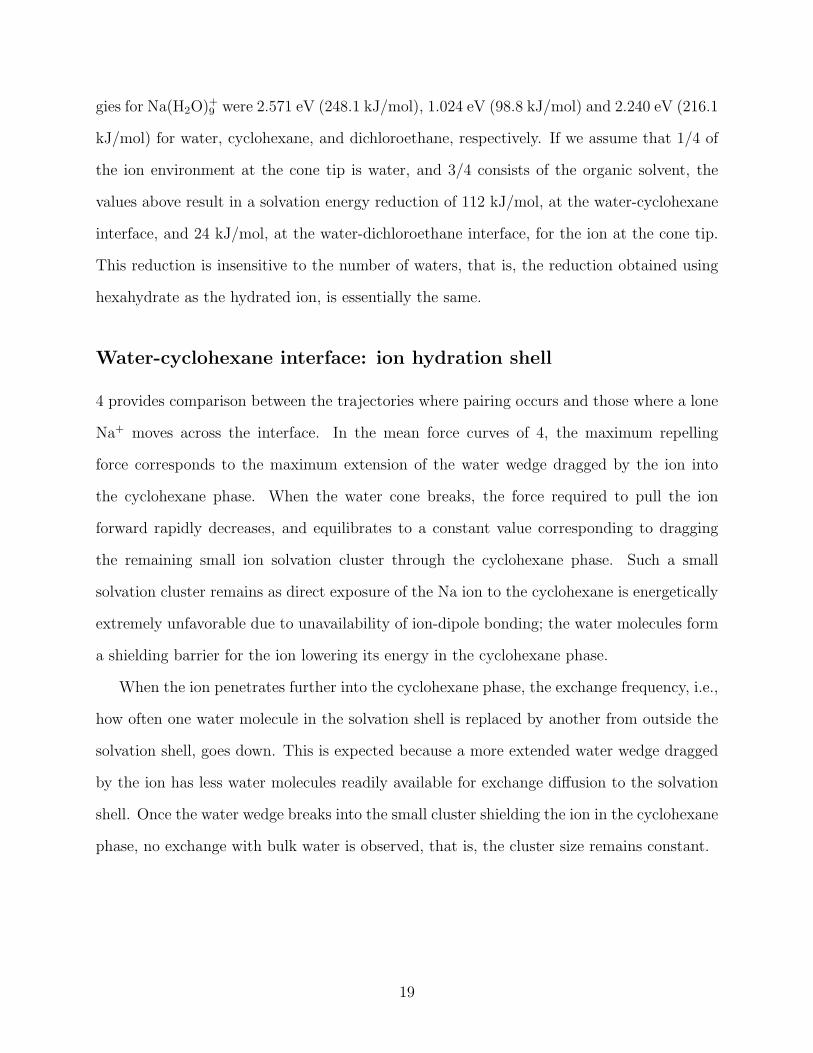
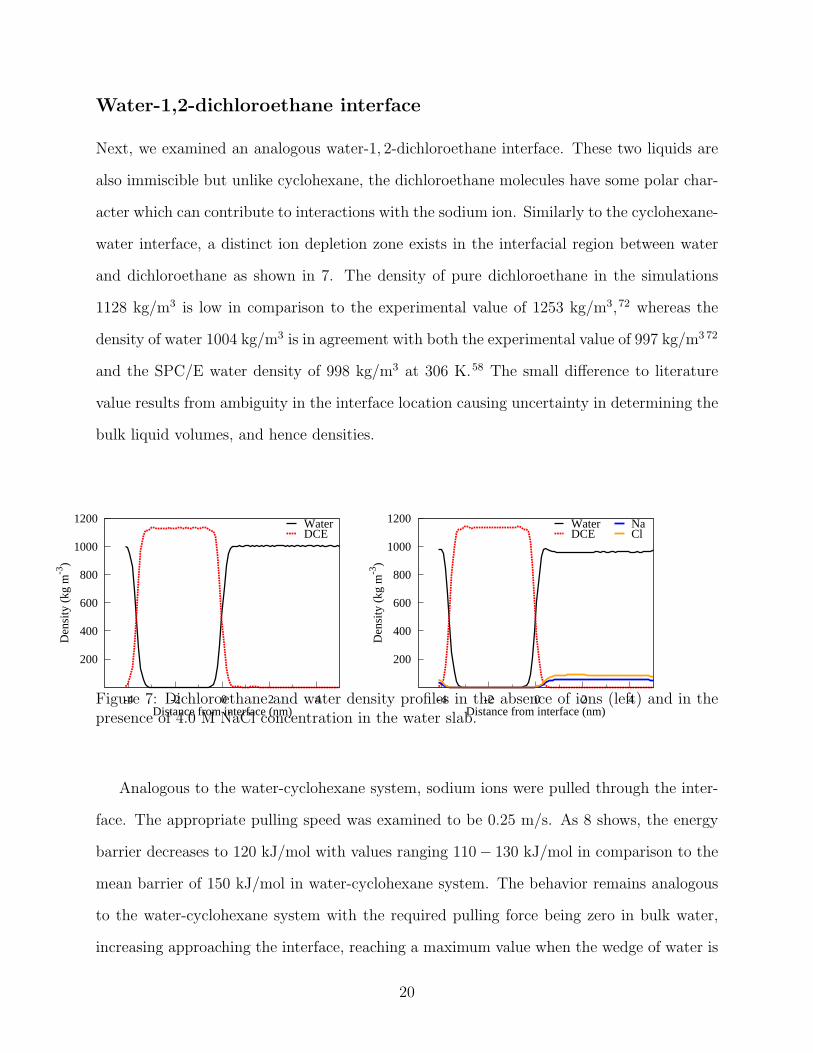
Next, we examined an analogous water-1, 2-dichloroethane interface. These two liquids are
also immiscible but unlike cyclohexane, the dichloroethane molecules have some polar char-
acter which can contribute to interactions with the sodium ion. Similarly to the cyclohexane-
water interface, a distinct ion depletion zone exists in the interfacial region between water
and dichloroethane as shown in 7. The density of pure dichloroethane in the simulations
1128 kg/m3 is low in comparison to the experimental value of 1253 kg/m3,72 whereas the
density of water 1004 kg/m3 is in agreement with both the experimental value of 997 kg/m3 72
and the SPC/E water density of 998 kg/m3 at 306 K.58 The small difference to literature
value results from ambiguity in the interface location causing uncertainty in determining the
bulk liquid volumes, and hence densities.
200
400
600
800
1000
1200
-4 -2 0 2 4
Den
sity
(kg
m-3
)
Distance from interface (nm)
WaterDCE
200
400
600
800
1000
1200
-4 -2 0 2 4
Den
sity
(kg
m-3
)
Distance from interface (nm)
WaterDCE
NaCl
Figure 7: Dichloroethane and water density profiles in the absence of ions (left) and in thepresence of 4.0 M NaCl concentration in the water slab.
Analogous to the water-cyclohexane system, sodium ions were pulled through the inter-
face. The appropriate pulling speed was examined to be 0.25 m/s. As 8 shows, the energy
barrier decreases to 120 kJ/mol with values ranging 110− 130 kJ/mol in comparison to the
mean barrier of 150 kJ/mol in water-cyclohexane system. The behavior remains analogous
to the water-cyclohexane system with the required pulling force being zero in bulk water,
increasing approaching the interface, reaching a maximum value when the wedge of water is
20
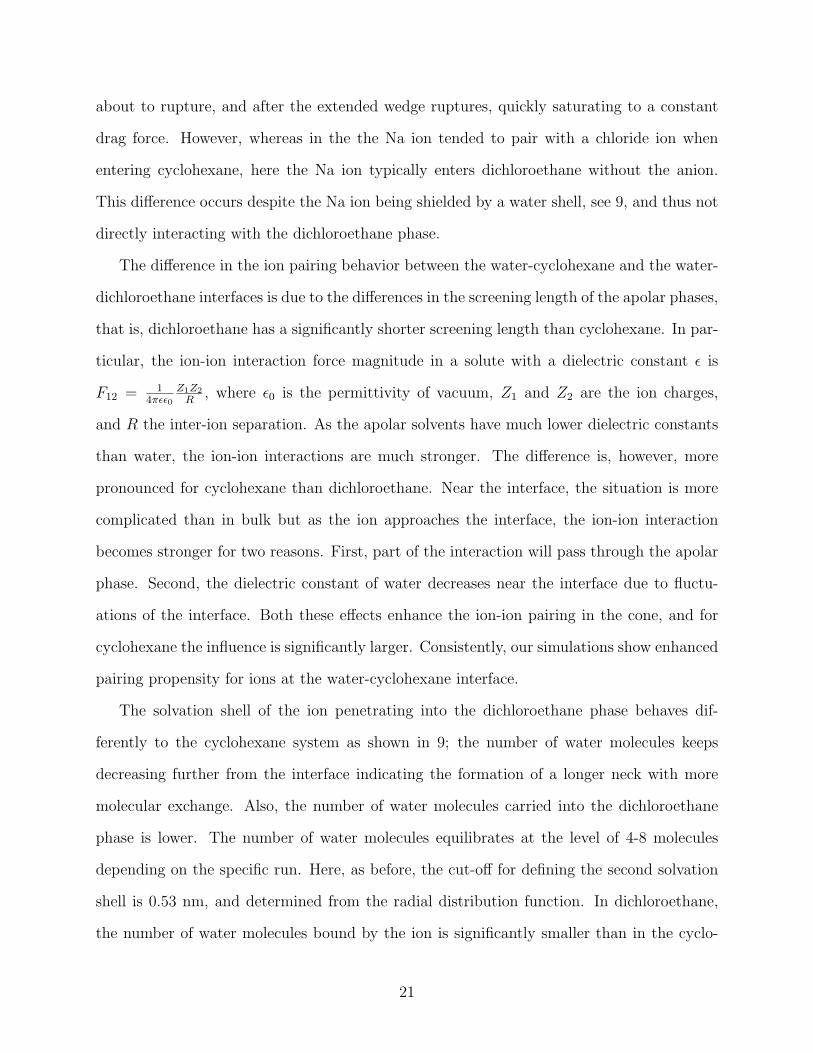
about to rupture, and after the extended wedge ruptures, quickly saturating to a constant
drag force. However, whereas in the the Na ion tended to pair with a chloride ion when
entering cyclohexane, here the Na ion typically enters dichloroethane without the anion.
This difference occurs despite the Na ion being shielded by a water shell, see 9, and thus not
directly interacting with the dichloroethane phase.
The difference in the ion pairing behavior between the water-cyclohexane and the water-
dichloroethane interfaces is due to the differences in the screening length of the apolar phases,
that is, dichloroethane has a significantly shorter screening length than cyclohexane. In par-
ticular, the ion-ion interaction force magnitude in a solute with a dielectric constant ϵ is
F12 = 14πϵϵ0
Z1Z2
R, where ϵ0 is the permittivity of vacuum, Z1 and Z2 are the ion charges,
and R the inter-ion separation. As the apolar solvents have much lower dielectric constants
than water, the ion-ion interactions are much stronger. The difference is, however, more
pronounced for cyclohexane than dichloroethane. Near the interface, the situation is more
complicated than in bulk but as the ion approaches the interface, the ion-ion interaction
becomes stronger for two reasons. First, part of the interaction will pass through the apolar
phase. Second, the dielectric constant of water decreases near the interface due to fluctu-
ations of the interface. Both these effects enhance the ion-ion pairing in the cone, and for
cyclohexane the influence is significantly larger. Consistently, our simulations show enhanced
pairing propensity for ions at the water-cyclohexane interface.
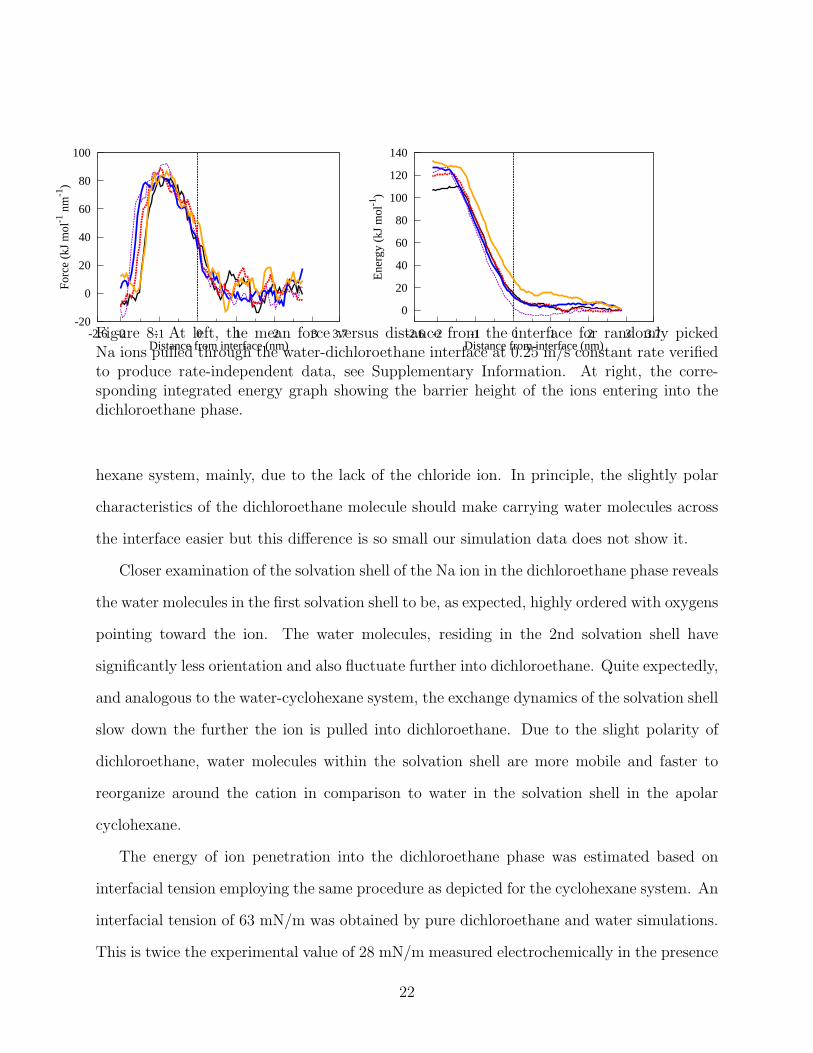
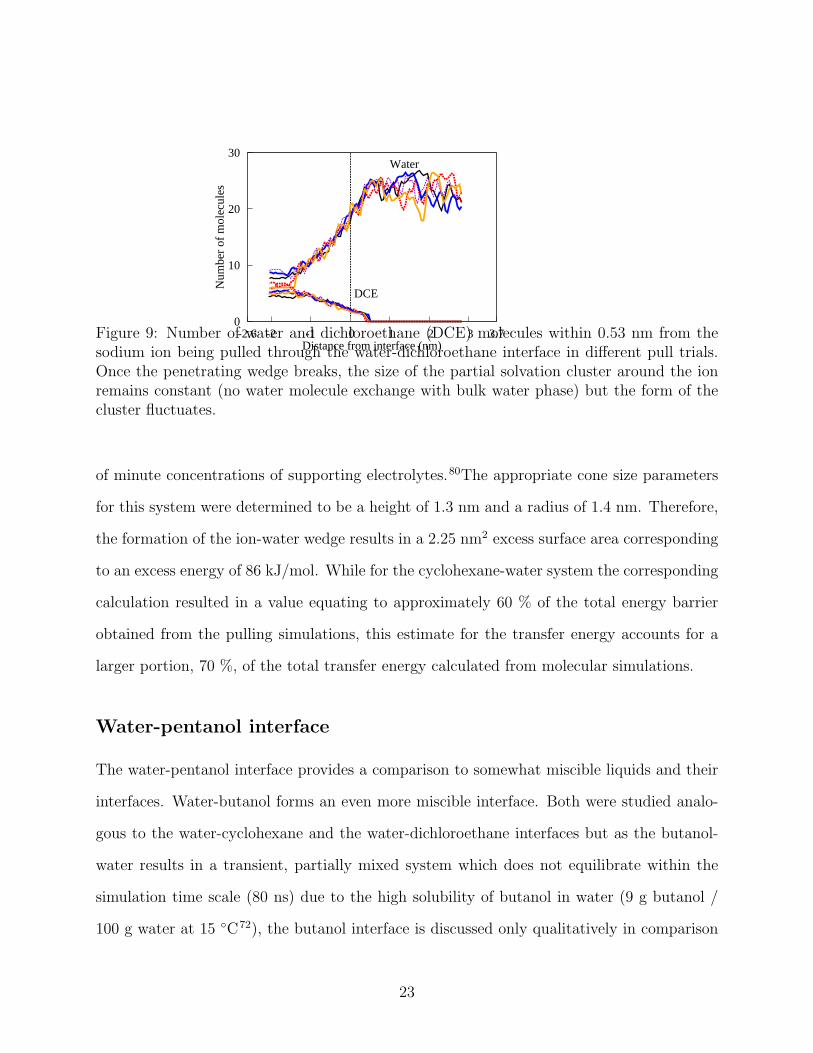
The solvation shell of the ion penetrating into the dichloroethane phase behaves dif-
ferently to the cyclohexane system as shown in 9; the number of water molecules keeps
decreasing further from the interface indicating the formation of a longer neck with more
molecular exchange. Also, the number of water molecules carried into the dichloroethane
phase is lower. The number of water molecules equilibrates at the level of 4-8 molecules
depending on the specific run. Here, as before, the cut-off for defining the second solvation
shell is 0.53 nm, and determined from the radial distribution function. In dichloroethane,
the number of water molecules bound by the ion is significantly smaller than in the cyclo-
21
-20
0
20
40
60
80
100
-2.6 3.7-2 -1 0 1 2 3
Forc
e (k
J m
ol-1
nm
-1)
Distance from interface (nm)
0
20
40
60
80
100
120
140
-2.6 3.7-2 -1 0 1 2 3
Ene
rgy
(kJ
mol
-1)
Distance from interface (nm)Figure 8: At left, the mean force versus distance from the interface for randomly pickedNa ions pulled through the water-dichloroethane interface at 0.25 m/s constant rate verifiedto produce rate-independent data, see Supplementary Information. At right, the corre-sponding integrated energy graph showing the barrier height of the ions entering into thedichloroethane phase.
hexane system, mainly, due to the lack of the chloride ion. In principle, the slightly polar
characteristics of the dichloroethane molecule should make carrying water molecules across
the interface easier but this difference is so small our simulation data does not show it.
Closer examination of the solvation shell of the Na ion in the dichloroethane phase reveals
the water molecules in the first solvation shell to be, as expected, highly ordered with oxygens
pointing toward the ion. The water molecules, residing in the 2nd solvation shell have
significantly less orientation and also fluctuate further into dichloroethane. Quite expectedly,
and analogous to the water-cyclohexane system, the exchange dynamics of the solvation shell
slow down the further the ion is pulled into dichloroethane. Due to the slight polarity of
dichloroethane, water molecules within the solvation shell are more mobile and faster to
reorganize around the cation in comparison to water in the solvation shell in the apolar
cyclohexane.
The energy of ion penetration into the dichloroethane phase was estimated based on
interfacial tension employing the same procedure as depicted for the cyclohexane system. An
interfacial tension of 63 mN/m was obtained by pure dichloroethane and water simulations.
This is twice the experimental value of 28 mN/m measured electrochemically in the presence
22
0
10
20
30
-2.6 3.7-2 -1 0 1 2 3
Num
ber
of m
olec
ules
Distance from interface (nm)
Water
DCE
Figure 9: Number of water and dichloroethane (DCE) molecules within 0.53 nm from thesodium ion being pulled through the water-dichloroethane interface in different pull trials.Once the penetrating wedge breaks, the size of the partial solvation cluster around the ionremains constant (no water molecule exchange with bulk water phase) but the form of thecluster fluctuates.
of minute concentrations of supporting electrolytes.80The appropriate cone size parameters
for this system were determined to be a height of 1.3 nm and a radius of 1.4 nm. Therefore,
the formation of the ion-water wedge results in a 2.25 nm2 excess surface area corresponding
to an excess energy of 86 kJ/mol. While for the cyclohexane-water system the corresponding
calculation resulted in a value equating to approximately 60 % of the total energy barrier
obtained from the pulling simulations, this estimate for the transfer energy accounts for a
larger portion, 70 %, of the total transfer energy calculated from molecular simulations.
Water-pentanol interface
The water-pentanol interface provides a comparison to somewhat miscible liquids and their
interfaces. Water-butanol forms an even more miscible interface. Both were studied analo-
gous to the water-cyclohexane and the water-dichloroethane interfaces but as the butanol-
water results in a transient, partially mixed system which does not equilibrate within the
simulation time scale (80 ns) due to the high solubility of butanol in water (9 g butanol /
100 g water at 15 ◦C72), the butanol interface is discussed only qualitatively in comparison
23
with pentanol below. All data shown corresponds to the pentanol-water interface system.
Pentanol forms a better defined interface due to the longer apolar hydrocarbon chain and
the liquid-liquid interface equilibrates within the employed simulation time and ion pulling
speeds. In these alcohol-water systems, the alcohol group forms hydrogen bonds with the
ion, and transport through the interface is significantly aided by the polar nature of the
molecules.
In the simulations, butanol slowly mixes with the aqueous phase with water forming
fingering channels into the butanol phase but remaining out of equilibrium. The channel
formation reminds of the initial steps of microemulsion formation. The formation of fingering
water channels renders the barrier against the cation moving from the aqueous phase to
the butanol phase ambiguous because there is no well-defined interface and the fingering
aqueous regions enable easier penetration into the dominantly butanol phase. The partial
miscibility also allows the ion to carry significant, loosely bound water shell with frequent
molecular exchange with the bulk liquids with it to the dominantly butanol phase. We
conclude there is a non-zero interfacial barrier but the barrier is very low compared to the
truly immiscible interfaces examined earlier. The attempted ion pulling rates for butanol
were fast compared to the water fingering reorganization time scales in the water-butanol
system, and therefore the pulling runs correspond to a nearly static interface (an interface
with little or no structural reorganization). In conclusion, the butanol interface is discussed
only qualitatively concluding the existence of a finite barrier but otherwise inconclusive with
respect to the interfacial behavior.
For pentanol, in comparison to the strongly intermingling water-butanol interface, a well-
defined interface but with some fingering penetration of the water phase to the pentanol phase
is observed. To evaluate the significance of the chosen force field, we performed the water-
pentanol interface studies with both GROMOS43a1 and OPLS-aa force fields, see Methods.
We do, indeed, observe some difference in the interfaces and in the ion pulling data between
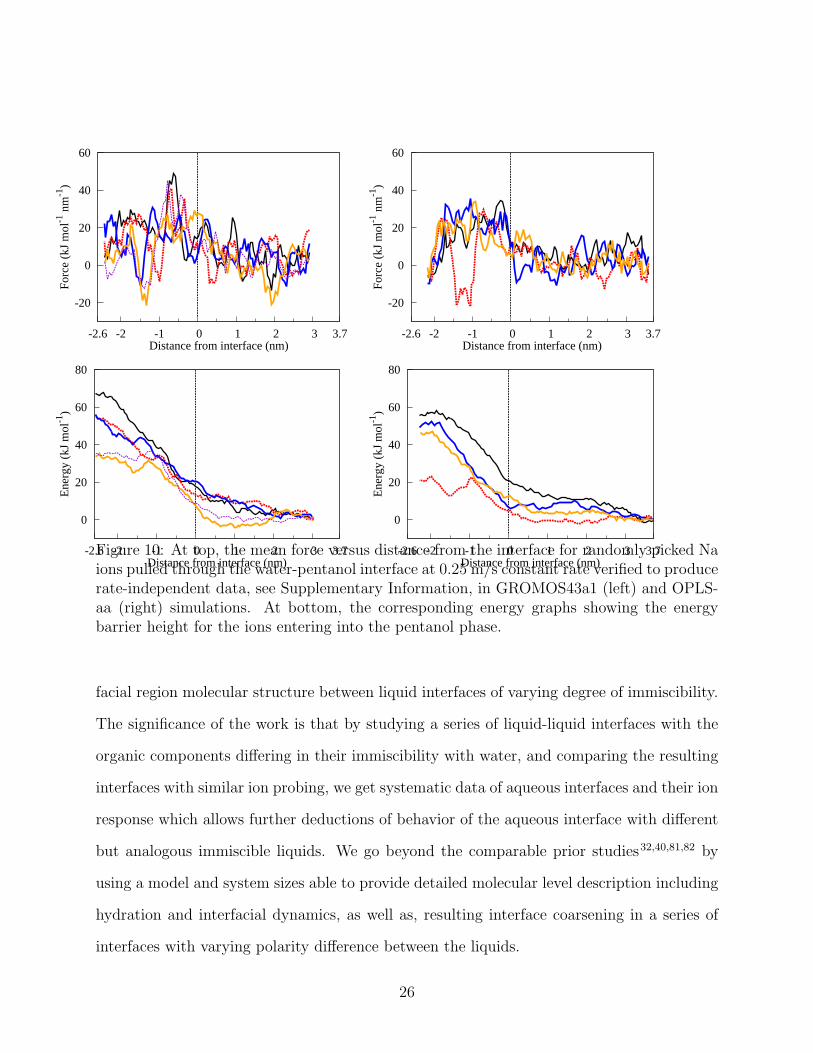
the two tested force fields, see 10 and 11. First, even though slowly equilibrating, the graphs
24
of 11 are symmetric indicating compositional equilibrium. Pentanol is more soluble in the
GROMOS43a1 model than in the OPLS-aa model which shows as more pentanol entering
into the water phase and larger, more extended fingering. In comparison to butanol, however,
the magnitude is much smaller.
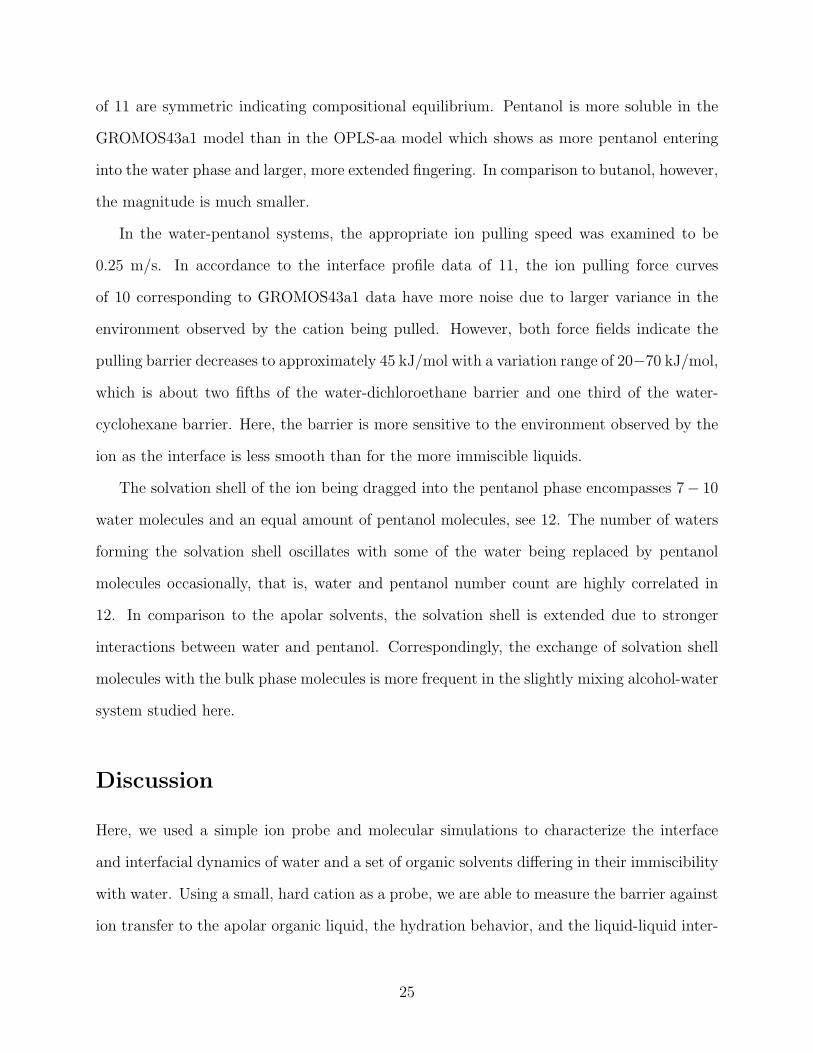
In the water-pentanol systems, the appropriate ion pulling speed was examined to be
0.25 m/s. In accordance to the interface profile data of 11, the ion pulling force curves
of 10 corresponding to GROMOS43a1 data have more noise due to larger variance in the
environment observed by the cation being pulled. However, both force fields indicate the
pulling barrier decreases to approximately 45 kJ/mol with a variation range of 20−70 kJ/mol,
which is about two fifths of the water-dichloroethane barrier and one third of the water-
cyclohexane barrier. Here, the barrier is more sensitive to the environment observed by the
ion as the interface is less smooth than for the more immiscible liquids.
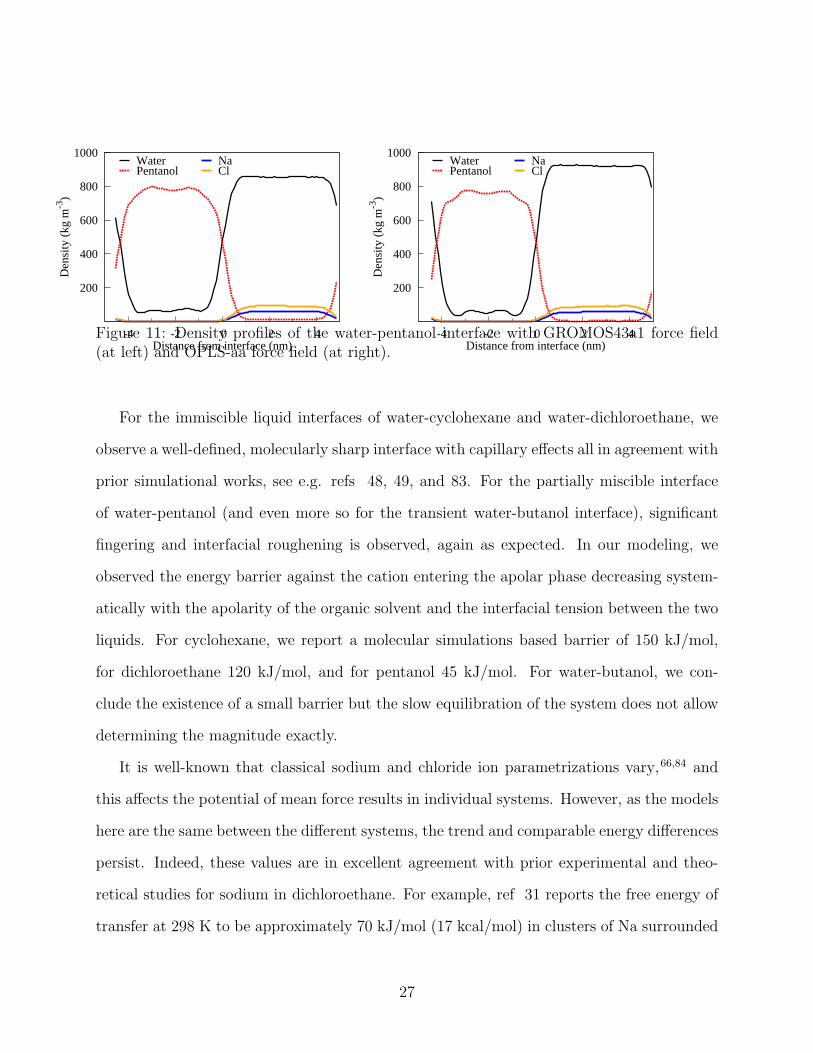
The solvation shell of the ion being dragged into the pentanol phase encompasses 7− 10
water molecules and an equal amount of pentanol molecules, see 12. The number of waters
forming the solvation shell oscillates with some of the water being replaced by pentanol
molecules occasionally, that is, water and pentanol number count are highly correlated in
12. In comparison to the apolar solvents, the solvation shell is extended due to stronger
interactions between water and pentanol. Correspondingly, the exchange of solvation shell
molecules with the bulk phase molecules is more frequent in the slightly mixing alcohol-water
system studied here.
Discussion
Here, we used a simple ion probe and molecular simulations to characterize the interface
and interfacial dynamics of water and a set of organic solvents differing in their immiscibility
with water. Using a small, hard cation as a probe, we are able to measure the barrier against
ion transfer to the apolar organic liquid, the hydration behavior, and the liquid-liquid inter-
25
-20
0
20
40
60
-2.6 3.7-2 -1 0 1 2 3
Forc
e (k
J m
ol-1
nm
-1)
Distance from interface (nm)
-20
0
20
40
60
-2.6 3.7-2 -1 0 1 2 3
Forc
e (k
J m
ol-1
nm
-1)
Distance from interface (nm)
0
20
40
60
80
-2.6 3.7-2 -1 0 1 2 3
Ene
rgy
(kJ
mol
-1)
Distance from interface (nm)
0
20
40
60
80
-2.6 3.7-2 -1 0 1 2 3
Ene
rgy
(kJ
mol
-1)
Distance from interface (nm)Figure 10: At top, the mean force versus distance from the interface for randomly picked Naions pulled through the water-pentanol interface at 0.25 m/s constant rate verified to producerate-independent data, see Supplementary Information, in GROMOS43a1 (left) and OPLS-aa (right) simulations. At bottom, the corresponding energy graphs showing the energybarrier height for the ions entering into the pentanol phase.
facial region molecular structure between liquid interfaces of varying degree of immiscibility.
The significance of the work is that by studying a series of liquid-liquid interfaces with the
organic components differing in their immiscibility with water, and comparing the resulting
interfaces with similar ion probing, we get systematic data of aqueous interfaces and their ion
response which allows further deductions of behavior of the aqueous interface with different
but analogous immiscible liquids. We go beyond the comparable prior studies32,40,81,82 by
using a model and system sizes able to provide detailed molecular level description including
hydration and interfacial dynamics, as well as, resulting interface coarsening in a series of
interfaces with varying polarity difference between the liquids.
26
200
400
600
800
1000
-4 -2 0 2 4
Den
sity
(kg
m-3
)
Distance from interface (nm)
WaterPentanol
NaCl
200
400
600
800
1000
-4 -2 0 2 4
Den
sity
(kg
m-3
)
Distance from interface (nm)
WaterPentanol
NaCl
Figure 11: Density profiles of the water-pentanol interface with GROMOS43a1 force field(at left) and OPLS-aa force field (at right).
For the immiscible liquid interfaces of water-cyclohexane and water-dichloroethane, we
observe a well-defined, molecularly sharp interface with capillary effects all in agreement with
prior simulational works, see e.g. refs 48, 49, and 83. For the partially miscible interface
of water-pentanol (and even more so for the transient water-butanol interface), significant
fingering and interfacial roughening is observed, again as expected. In our modeling, we
observed the energy barrier against the cation entering the apolar phase decreasing system-
atically with the apolarity of the organic solvent and the interfacial tension between the two
liquids. For cyclohexane, we report a molecular simulations based barrier of 150 kJ/mol,
for dichloroethane 120 kJ/mol, and for pentanol 45 kJ/mol. For water-butanol, we con-
clude the existence of a small barrier but the slow equilibration of the system does not allow
determining the magnitude exactly.
It is well-known that classical sodium and chloride ion parametrizations vary,66,84 and
this affects the potential of mean force results in individual systems. However, as the models
here are the same between the different systems, the trend and comparable energy differences
persist. Indeed, these values are in excellent agreement with prior experimental and theo-
retical studies for sodium in dichloroethane. For example, ref 31 reports the free energy of
transfer at 298 K to be approximately 70 kJ/mol (17 kcal/mol) in clusters of Na surrounded
27
0
10
20
30
-2.6 3.7-2 -1 0 1 2 3
Num
ber
of m
olec
ules
Distance from interface (nm)
Water
Pentanol
0
10
20
30
-2.6 3.7-2 -1 0 1 2 3
Num
ber
of m
olec
ules
Distance from interface (nm)
Water
Pentanol
Figure 12: Number of water and pentanol molecules within 0.53 nm from the sodium ionbeing pulled through the water-pentanol interface in different pull trials. At left, GRO-MOS43a1 force field and at right OPLS-aa force field data is presented.
by 4 water molecules. Experimental values have been reported in the range between 49
and 64 kJ/mol.85–89 The values are in reasonable agreement with our result of 120 kJ/mol
given that the interface tension is overestimated in our simulations. For ion partitioning
at cyclohexane-water interface, experimental data is scarce because of the strongly apolar
nature of the organic solvent. A thorough review of ion behavior at various interfaces is pro-
vided by Marcus.90 Furthermore, Zhao and Abraham91 provide extensive characterization
of partitioning between ions in water and solvents including dichloroethane and alcohols of
varying tail length below and above pentanol.
Polarization has been shown to affect ion partitioning at liquid-liquid interfaces; refs 39,
42, and 43 report anions to have an increasing propensity towards the interface with growing
polarizability of the ion, which also causes a charge compensating peak in the density of the
cation near the interface. Furthermore, for the highly polarizable iodide, Wick and Dang46
report polarization introduces a free energy minimum for the ion at the water-CCl4 inter-
face and this minimum is not present in non-polarizable simulations. However, it remains
unclear whether this influences the total barrier observed by the ion. For ions with lower
polarizability, the influence seems less pronounced, as Darvas et al.92 report a 55 kJ/mol
barrier for chloride transfer from water to 1,2-dichloroethane in line with results from polar-
28
izable simulations.40 Similarly, in this work, the Drude-polarizable force field resulted for the
cyclohexane-water system in a reduction of the transfer energy of the unpaired Na to level
of the paired ion obtained with non-polarizable force fields. This suggests that polarization
compensates for the energetic penalty, as the ion penetrates into the apolar cyclohexane
phase without a charge neutralizing counterion, so that the overall barrier remains unaf-
fected. Furthermore, since here the other studied organic molecules are more polar and
less polarizable, the effect of polarization should diminish in the order cyclohexane ¿ 1,2-
dichloroethane ¿ pentanol. Consequently, polarization might have a quantitative influence
on the transfer energy of Na but it should not change the observed ordering of the energy
barriers.
Besides molecular simulations, we estimated the ion transfer energy based on interfacial
tension between cyclohexane and water and dichloroethane and water. For cyclohexane, the
computed transfer energy accounted for approximately 60% of the total energy barrier ob-
tained in the molecular simulations and for dichloroethane approximately 70%. This crude
model seems to indicate that the numbers our molecular simulations provide for the barriers
are an overestimate. In line, the simulations based interfacial tension clearly overshoots the
experimental interfacial tension between the immiscible liquids. Jointly, these factors result
in the molecular modelling overestimating the barrier of ion transfer. Deviations from the
absolute values, when using empirical force fields to predict quantities outside their original
parametrization region, are expected. In this work, GROMOS43A1 force field was chosen for
the main simulations as the GROMOS parametrization relies on reproduction of condensed
phase properties of alkanes, ideally partitioning between apolar and water phases. This
provides a founded basis for expecting phenomenological accuracy, and the force field per-
formance was qualitatively checked by comparison simulations with OPLS-aa, CHARMM36,
and polarizable force field simulations in the systems where most critical. Furthermore, ion
pulling rates were chosen such that the results are independent of the rate (slow enough
rates) and the observed phenomenology remained insensitive to simulation box size in finite
29
size tests. However, the partially miscible alcohol systems have interfacial fingering which
causes variation in the observed environment, and the simulation results of individual pulling
trials unavoidably reflect this variation. In summary, all the comparison simulations provided
comparable behavior and transfer energy barriers in the studied systems. As said above, the
molecular modelling seems to overestimate the barriers. Further quantitative accuracy might
be achieved by force fields derived to represent specifically partitioning, such as TraPPE,93
but the force field testing here already shows the observed phenomenology to be universal
in empirical force fields of a variety of parametrization basis including a polarizable model.
However, it is interesting to note that if we used surface tension values corresponding to the
experimental values (about half of the computational values) in calculating the analytical
estimate for the transfer energy, the value obtained for dichloroethane would be very close to
experimentally measured values even though the analytical estimate we made is very crude.
The characteristics of the ion transfer are affected by the polarity difference between the
two liquids. Whereas in water-cyclohexane system the sodium probe being pulled across the
interface typically pairs with a chloride ion, in dichloroethane, and pentanol, the sodium is
more probable to enter the less polar liquid without the neutralizing counterion contact ion
pair in its hydration shell. This is because the apolar cyclohexane is ineffective in screening
the hydrated sodium ion charge. This increases the sodium probe visibility also in the
polar liquid and increases the probability of counterion pairing. Dichloroethane, although
also apolar, has more effective charge screening properties, and thus the hydrated sodium
probe entering into the dichloroethane, is less likely to attract a counterion to pair with
it. In our simulations, the pairing propensity is also affected by the ion concentration and
the simulation time scale, i.e., if the ion pulling is slower, or there are more ions in the
system, a higher probability for a chloride ion to diffuse close enough the sodium being
pulled across the interface to pair with it exists. The ion pulling speed and the high ion
concentration in the simulation act in opposite directions the former reducing the pairing
probability and the latter increasing. Prior calculations on NaCl pairing propensity at liquid-
30
liquid interface include NaCl at water-dichloroethane interface. Whereas Schweighofer and
Benjamin94 observe an increased stability of the ion pair relative to bulk water, Wick and
Dang95 report the organic dichloroethane interface destabilizes the pair in comparison to
bulk water. We argue the ion pairing, or lack of pairing depends on charge screening (ion
hydration), the dielectric constants of the liquids, and interface form (surface tension) when
the ion is penetrating the interface.
For the water-cyclohexane system, the size of the observed hydration shell is the joint
hydration shell of also the chloride ion being dragged with the sodium. Dichloroethane has
some polar character, and here the sodium frequently enters without the pairing chloride
ion in our simulations. Therefore, even though it is energetically easier to drag water into
dichloroethane, the actual solvation shell is smaller than the joint solvation shell of the NaCl
pair in cyclohexane. Pentanol and butanol receive a large hydration wedge, with only a
minor part of the second solvation shell being lost when the ion penetrates the less polar
phase. Our observations of the magnitude of hydration, and the consistent partial loss of the
second solvation shell are in excellent agreement with prior studies; dos Santos and Gomes81
report cesium, and Chorny and Benjamin96 sodium losing comparable amounts of its second
solvation shell when entering nitrobenzene, but persistent first shell hydration. Furthermore,
refs 33 and 97 discuss similar water wedge formation and encapsulation of cation K+ at
water-dichloromethane interface.
The observed water necking and persistent hydration behavior have significance in biol-
ogy in, e.g., ion channel activity98 and protein pumps such as bacteriorhodopsin,99 as well
as, in technology in ion transport in nanoporous materials, for example, ion exchange or
separation membranes, as well as, electrochemical capacitors.100,101 Here, the persistence of
the hydration and the dragged water wedge size are controlling factors in ion transport.
The present work relates these quantities to the type of interfaces and shows how sodium
ion hydration persistence differs between immiscible interfaces of a variety of nature, and
discuss the dragged water wedge changes showing how molecular simulations can be used as
31
tools to understand these systems.
Conclusions
In conclusion, we presented a molecular detail characterization of the liquid-liquid interface
as a function of interfacial immiscibility, and demonstrated the significance of ion hydration
and its persistence in ion transfer through such immiscible, or poorly miscible interfaces.
The results show interfacial tension has a significant role in the ion transfer and energy
barriers involved. Furthermore, the energy barrier against penetration is sensitive to polarity
difference between the two liquids with a larger polarity difference resulting in larger barrier
against penetration. Hydration shell behaves the opposite way with more water being carried,
and more easily, into the liquids with less polarity difference to water. All in all, the current
study is one of the first molecular detail studies addressing ion transport through immiscible
and partially miscible interfaces. The results show modern molecular simulations are a
powerful and a versatile tool in obtaining detailed interfacial information of ion interactions
and the immiscible interface including the interfacial dynamics.
Supporting Information Available
The simulations of the water-cyclohexane system with the Drude-polarizable and CHARMM
force fields are described in the Supporting information. Additionally, the convergence tests
on the appropriate ion pulling rate are reported. This material is available free of charge
via the Internet at http://pubs.acs.org/.
Acknowledgement
The authors thank Dr. Lasse Murtomaki for useful discussions and comments related to the
manuscript. This research was supported by Academy of Finland and a Marie Curie Ca-
reer Integration Grant within the 7th European Community Framework Programme (M.S.).
32
Computational resources by CSC IT Centre for Science, Finland, are gratefully acknowl-
edged.
References
(1) Moore, F. G.; Richmond, G. L. Integration or Segregation: How Do Molecules Behave
at Oil/Water Interfaces? Acc. Chem. Res. 2008, 41, 739–748.
(2) Jungwirth, P.; Winter, B. Ions at Aqueous Interfaces: FromWater Surface to Hydrated
Proteins. Annu. Rev. Phys. Chem. 2008, 59, 343–366.
(3) McFearin, C. L.; Beaman, D. K.; Moore, F. G.; Richmond, G. L. From Franklin to
Today: Toward a Molecular Level Understanding of Bonding and Adsorption at the
Oil-Water Interface. J. Phys. Chem. C 2009, 113, 1171–1188.
(4) Petersen, P. B.; Saykally, R. J. Confirmation of Enhanced Anion Concentration at the
Liquid Water Surface. Chem. Phys. Lett. 2004, 397, 51–55.
(5) Petersen, P. B.; Saykally, R. J. On the Nature of Ions at the Liquid Water Surface.
Annu. Rev. Phys. Chem. 2006, 57, 333–364.
(6) Otten, D. E.; Shaffer, P. R.; Geissler, P. L.; Saykally, R. J. Elucidating the Mechanism
of Selective Ion Adsorption to the Liquid Water Surface. Proc. Natl. Acad. Sci. U.S.A.
2012, 109, 701–705.
(7) Liu, D. F.; Ma, G.; Levering, L. M.; Allen, H. C. Vibrational Spectroscopy of Aqueous
Sodium Halide Solutions and Air-Liquid Interfaces: Observation of Increased Interfa-
cial Depth. J. Phys. Chem. B 2004, 108, 2252–2260.
(8) Raymond, E. A.; Richmond, G. L. Probing the Molecular Structure and Bonding of
the Surface of Aqueous Salt Solutions. J. Phys. Chem. B 2004, 108, 5051–5059.
33
(9) Tarbuck, T. L.; Ota, S. T.; Richmond, G. L. Spectroscopic Studies of Solvated Hydro-
gen and Hydroxide Ions at Aqueous Surfaces. J. Am. Chem. Soc. 2006, 128, 14519–
14527.
(10) Viswanath, P.; Motschmann, H. Oriented Thiocyanate Anions at the Air-Electrolyte
Interface and Its Implications on Interfacial Water - A Vibrational Sum Frequency
Spectroscopy Study. J. Phys. Chem. C 2007, 111, 4484–4486.
(11) McFearin, C. L.; Richmond, G. L. The Role of Interfacial Molecular Structure in
the Adsorption of Ions at the Liquid-Liquid Interface. J. Phys. Chem. C 2009, 113,
21162–21168.
(12) Weber, R.; Winter, B.; Schmidt, P. M.; Widdra, W.; Hertel, I. V.; Dittmar, M.;
Faubel, M. Photoemission from Aqueous Alkali-Metal-Iodide Salt Solutions Using
EUV Synchrotron Radiation. J. Phys. Chem. B 2004, 108, 4729–4736.
(13) Winter, B.; Weber, R.; Widdra, W.; Dittmar, M.; Faubel, M.; Hertel, I. V. Full Valence
Band Photoemission from Liquid Water Using EUV Synchrotron Radiation. J. Phys.
Chem. A 2004, 108, 2625–2632.
(14) Ghosal, S.; Hemminger, J. C.; Bluhm, H.; Mun, B. S.; Hebenstreit, E. L. D.; Ket-
teler, G.; Ogletree, D. F.; Requejo, F. G.; Salmeron, M. Electron Spectroscopy of
Aqueous Solution Interfaces Reveals Surface Enhancement of Halides. Science 2005,
307, 563–566.
(15) Ghosal, S.; Verdaguer, A.; Hemminger, J. C.; Salmeron, M. In Situ Study of Water-
Induced Segregation of Bromide in Bromide-Doped Sodium Chloride by Scanning
Polarization Force Microscopy. J. Phys. Chem. A 2005, 109, 4744–4749.
(16) Benjamin, I. Solute Dynamics at Aqueous Interfaces. Chem. Phys. Lett. 2009, 469,
229–241.
34
(17) Netz, R. R.; Horinek, D. Progress in Modeling of Ion Effects at the Vapor/Water
Interface. Annu. Rev. Phys. Chem. 2012, 63, 401–418.
(18) Gopalakrishnan, S.; Liu, D. F.; Allen, H. C.; Kuo, M.; Shultz, M. J. Vibrational
Spectroscopic Studies of Aqueous Interfaces: Salts, Acids, Bases, and Nanodrops.
Chem. Rev. 2006, 106, 1155–1175.
(19) Winter, B.; Faubel, M.; Hertel, I. V.; Pettenkofer, C.; Bradforth, S. E.; Jagoda-
Cwiklik, B.; Cwiklik, L.; Jungwirth, P. Electron Binding Energies of Hydrated H3O+
and OH−: Photoelectron Spectroscopy of Aqueous Acid and Base Solutions Combined
with Electronic Structure Calculations. J. Am. Chem. Soc. 2006, 128, 3864–3865.
(20) Chang, T. M.; Dang, L. X. Recent Advances in Molecular Simulations of Ion Solvation
at Liquid Interfaces. Chem. Rev. 2006, 106, 1305–1322.
(21) Zimmermann, R.; Freudenberg, U.; Schweiss, R.; Kuttner, D.; Werner, C. Hydroxide
and Hydronium Ion Adsorption - A Survey. Curr. Opin. Colloid Interface Sci. 2010,
15, 196–202.
(22) Benjamin, I. Molecular-Dynamics Study of the Free-Energy Functions for Electron-
Transfer Reactions at the Liquid Liquid Interface. J. Phys. Chem. 1991, 95, 6675–
6683.
(23) Wilson, M. A.; Pohorille, A. Interaction of Monovalent Ions with the Water Liquid
Vapor Interface - A Molecular-Dynamics Study. J. Chem. Phys. 1991, 95, 6005–6013.
(24) Schweighofer, K. J.; Benjamin, I. Transfer of Small Ions Across the Water/1,2-
Dichloroethane Interface. J. Phys. Chem. 1995, 99, 9974–9985.
(25) Schweighofer, K.; Benjamin, I. Transfer of a Tetramethylammonium Ion Across the
Water-Nitrobenzene Interface: Potential of Mean Force and Nonequilibrium Dynam-
ics. J. Phys. Chem. A 1999, 103, 10274–10279.
35
(26) Jungwirth, P.; Tobias, D. J. Molecular Structure of Salt Solutions: A New View of
the Interface with Implications for Heterogeneous Atmospheric Chemistry. J. Phys.
Chem. B 2001, 105, 10468–10472.
(27) Dang, L. X. Computational Study of Ion Binding to the Liquid Interface of Water. J.
Phys. Chem. B 2002, 106, 10388–10394.
(28) Bhatt, D.; Newman, J.; Radke, C. J. Molecular Dynamics Simulations of Surface
Tensions of Aqueous Electrolytic Solutions. J. Phys. Chem. B 2004, 108, 9077–9084.
(29) Archontis, G.; Leontidis, E.; Andreou, G. Attraction of Iodide Ions by the Free Water
Surface, Revealed by Simulations with a Polarizable Force Field Based on Drude
Oscillators. J. Phys. Chem. B 2005, 109, 17957–66.
(30) Ishiyama, T.; Morita, A. Molecular Dynamics Study of Gas-Liquid Aqueous Sodium
Halide Interfaces. I. Flexible and Polarizable Molecular Modeling and Interfacial Prop-
erties. J. Phys. Chem. C 2007, 111, 721–737.
(31) Rose, D.; Benjamin, I. Free Energy of Transfer of Hydrated Ion Clusters from Water
to an Immiscible Organic Solvent. J. Phys. Chem. B 2009, 113, 9296–9303.
(32) Rodriguez-Ropero, F.; Fioroni, M. Effect of Na+, Mg2+, and Zn2+ Chlorides on the
Structural and Thermodynamic Properties of Water/n-Heptane Interfaces. J. Comput.
Chem. 2011, 32, 1876–1886.
(33) Valente, M.; Sousa, S. F.; Magalhaes, A. L.; Freire, C. Transfer of the K+ Cation
Across a Water/Dichloromethane Interface: A Steered Molecular Dynamics Study
with Implications in Cation Extraction. J. Phys. Chem. B 2012, 116, 1843–1849.
(34) Yang, L. J.; Fan, Y. B.; Gao, Y. Q. Differences of Cations and Anions: Their Hydra-
tion, Surface Adsorption, and Impact on Water Dynamics. J. Phys. Chem. B 2011,
115, 12456–12465.
36
(35) Wick, C. D.; Kuo, I. F. W.; Mundy, C. J.; Dang, L. X. The Effect of Polarizability
for Understanding the Molecular Structure of Aqueous Interfaces. J. Chem. Theory
Comput. 2007, 3, 2002–2010.
(36) Warren, G. L.; Patel, S. Electrostatic Properties of Aqueous Salt Solution Interfaces:
A Comparison of Polarizable and Nonpolarizable Ion Models. J. Phys. Chem. B 2008,
112, 11679–11693.
(37) Caleman, C.; Hub, J. S.; van Maaren, P. J.; van der Spoel, D. Atomistic Simulation
of Ion Solvation in Water Explains Surface Preference of Halides. Proc. Natl. Acad.
Sci. U.S.A. 2011, 108, 6838–6842.
(38) Bauer, B. A.; Ou, S. C.; Patel, S. Solvation Structure and Energetics of Single Ions at
the Aqueous Liquid-Vapor Interface. Chem. Phys. Lett. 2012, 527, 22–26.
(39) Vazdar, M.; Pluharova, E.; Mason, P. E.; Vacha, R.; Jungwirth, P. Ions at Hydrophobic
Aqueous Interfaces: Molecular Dynamics with Effective Polarization. J. Phys. Chem.
Lett. 2012, 3, 2087–2091.
(40) Wick, C. D.; Dang, L. X. Molecular Dynamics Study of Ion Transfer and Distribution
at the Interface of Water and 1,2-Dichlorethane. J. Phys. Chem. C 2008, 112, 647–
649.
(41) Xiuquan, S.; Dang, L. X. Computational Studies of Aqueous Interfaces of RbBr Salt
Solutions. J. Chem. Phys. 2009, 130, 124709.
(42) Wick, C. D.; Dang, L. X. Recent Advances in Understanding Transfer Ions Across
Aqueous Interfaces. Chem. Phys. Lett. 2008, 458, 1–5.
(43) Shamay, E. S.; Richmond, G. L. Ionic Disruption of the Liquid-Liquid Interface. J.
Phys. Chem. C 2010, 114, 12590–12597.
37
(44) Dang, L. X. A Mechanism for Ion Transport Across the Water/Dichloromethane In-
terface: A Molecular Dynamics Study Using Polarizable Potential Models. J. Phys.
Chem. B 2001, 105, 804–809.
(45) Dang, L. X. Computer Simulation Studies of Ion Transport Across a Liquid/Liquid
Interface. J. Phys. Chem. B 1999, 103, 8195–8200.
(46) Wick, C.; Dang, L. X. Molecular Mechanism of Transporting a Polarizable Iodide
Anion Across the Water-CCl4 Liquid/Liquid Interface. J. Chem. Phys. 2007, 126,
134702.
(47) Levin, Y.; dos Santos, A. P.; Diehl, A. Ions at the Air-Water Interface: An End to a
Hundred-Year-Old Mystery? Phys. Rev. Lett. 2009, 103, 257802.
(48) Michael, D.; Benjamin, I. Molecular Dynamics Computer Simulations of Solvation
Dynamics at Liquid/Liquid Interfaces. J. Chem. Phys. 2001, 114, 2817–2824.
(49) Benjamin, I. Hydrogen Bond Dynamics at Water/Organic Liquid Interfaces. J. Phys.
Chem. B 2005, 109, 13711–13715.
(50) Berendsen, H. J. C.; Vanderspoel, D.; Vandrunen, R. GROMACS - A Message-Passing
Parallel Molecular-Dynamics Implementation. Comput. Phys. Commun. 1995, 91, 43–
56.
(51) Lindahl, E.; Hess, B.; van der Spoel, D. GROMACS 3.0: A Package for Molecular
Simulation and Trajectory Analysis. J. Mol. Model. 2001, 7, 306–317.
(52) van der Spoel, D.; Lindahl, E.; Hess, B.; Groenhof, G.; Mark, A. E.; Berendsen, H.
J. C. GROMACS: Fast, Flexible, and Free. J. Comput. Chem. 2005, 26, 1701–1718.
(53) van Gunsteren, W. F.; Billeter, S. R.; Eking, A. A.; Hiinenberger, P. H.; Kriiger, P.;
Mark, A. E.; Scott, W. R. P.; Tironi, I. G. Biomolecular Simulation, The GROMOS96
Manual and User Guide. 1996.
38
(54) Jorgensen, W. L.; Maxwell, D. S.; Tirado-Rives, J. Development and Testing of the
OPLS All-Atom Force Field on Conformational Energetics and Properties of Organic
Liquids. J. Am. Chem. Soc. 1996, 118, 11225–11236.
(55) Aqvist, J. Ion Water Interaction Potentials Derived from Free-Energy Perturbation
Simulations. J. Phys. Chem. 1990, 94, 8021–8024.
(56) Chandrasekhar, J.; Spellmeyer, D. C.; Jorgensen, W. L. Energy Component Analysis
for Dilute Aqueous-Solutions of Li+, Na+, F−, and Cl− Ions. J. Am. Chem. Soc. 1984,
106, 903–910.
(57) Berendsen, H.; Postma, J.; Gunsteren, W.; Hermans, J. In Intermolecular Forces ;
Pullman, B., Ed.; The Jerusalem Symposia on Quantum Chemistry and Biochemistry;
Springer Netherlands, 1981; Vol. 14; pp 331–342.
(58) Berendsen, H. J. C.; Grigera, J. R.; Straatsma, T. P. The Missing Term in Effective
Pair Potentials. J. Phys. Chem. 1987, 91, 6269–6271.
(59) Bussi, G.; Donadio, D.; Parrinello, M. Canonical Sampling Through Velocity Rescal-
ing. J. Chem. Phys. 2007, 126, 7.
(60) Parrinello, M.; Rahman, A. Polymorphic Transitions in Single-Crystals - A New
Molecular-Dynamics Method. J. Appl. Phys. 1981, 52, 7182–7190.
(61) Hess, B.; Bekker, H.; Berendsen, H. J. C.; Fraaije, J. LINCS: A Linear Constraint
Solver for Molecular Simulations. J. Comput. Chem. 1997, 18, 1463–1472.
(62) Miyamoto, S.; Kollman, P. A. SETTLE - An Analytical Version of the SHAKE and
RATTLE Algorithm for Rigid Water Models. J. Comput. Chem. 1992, 13, 952–962.
(63) Essmann, U.; Perera, L.; Berkowitz, M. L.; Darden, T.; Lee, H.; Pedersen, L. G. A
Smooth Particle Mesh Ewald Method. J. Chem. Phys. 1995, 103, 8577–8593.
39
(64) York, D. M.; Darden, T. A.; Pedersen, L. G. The Effect of Long-Range Electrostatic
Interactions in Simulations of Macromolecular Crystals - A Comparison of the Ewald
and Truncated List Methods. J. Chem. Phys. 1993, 99, 8345–8348.
(65) Patra, M.; Karttunen, M.; Hyvonen, M. T.; Falck, E.; Vattulainen, I. Lipid Bilayers
Driven to a Wrong Lane in Molecular Dynamics Simulations by Subtle Changes in
Long-Range Electrostatic Interactions. J. Phys. Chem. B 2004, 108, 4485–4494.
(66) Hess, B.; Holm, C.; van der Vegt, N. Osmotic Coefficients of Atomistic NaCl (aq)
Force Fields. J. Chem. Phys. 2006, 124, 164509.
(67) Weerasinghe, S.; Smith, P. E. A Kirkwood-Buff Derived Force Field for Sodium Chlo-
ride in Water. J. Chem. Phys. 2003, 119, 11342–11349.
(68) Lamoureux, G.; Roux, B. Modeling Induced Polarization with Classical Drude Oscil-
lators: Theory and Molecular Dynamics Simulation Algorithm. J. Chem. Phys. 2003,
119, 3025–3039.
(69) Brooks, B. R.; Brooks, C. L.; Mackerell, A. D., Jr; Nilsson, L.; Petrella, R. J.; Roux, B.;
Won, Y.; Archontis, G.; Bartels, C.; Boresch, S. et al. CHARMM: The Biomolecular
Simulation Program. J. Comput. Chem. 2009, 30, 1545–1614.
(70) Jorgensen, W. L.; McDonald, N. A.; Selmi, M.; Rablen, P. R. Importance of Polar-
ization for Dipolar Solutes in Low-Dielectric Media: 1,2-Dichloroethane and Water in
Cyclohexane. J. Am. Chem. Soc. 1995, 117, 11809–11810.
(71) Schuttelkopf, A. W.; van Aalten, D. M. F. PRODRG: A Tool for High-Throughput
Crystallography of Protein-Ligand Complexes. Acta Crystallogr., Sect D: Biol. Crys-
tallogr. 2004, 60, 1355–1363.
(72) Dean, J. A., Ed. Lange’s Handbook of Chemistry, 12th ed.; McGraw-Hill Book Com-
pany: U.S.A., 1979.
40
(73) Jorgensen, W. L.; Corky, J. Temperature Dependence of TIP3P, SPC, and TIP4P Wa-
ter from NPT Monte Carlo Simulations: Seeking Temperatures of Maximum Density.
J. Comput. Chem. 1998, 19, 1179–1186.
(74) Yu, H.; van Gunsteren, W. F. Accounting for Polarization in Molecular Simulation.
Comput. Phys. Commun. 2005, 172, 69 – 85.
(75) Alpbaz, M.; Bilgesu, A.; Tutkun, O. The Measurement of Interfacial Tension by Drop-
Weight Method. Commun. Fac. Sci. Univ. Ank. Serie B 1988, 34, 100–112.
(76) Lima, E. R. A.; de Melo, B. M.; Baptista, L. T.; Paredes, M. L. L. Specific Ion Effects
on the Interfacial Tension of Water/Hydrocarbon Systems. Braz. J. Chem. Eng. 2013,
30, 55–62.
(77) Neese, F. The ORCA Program System. Wiley Interdiscip Rev Comput Mol Sci 2012,
2, 73–78.
(78) Klamt, A.; Schuurmann, G. COSMO - A New Approach to Dielectric Screening in
Solvents with Explicit Expressions for the Screening Energy and Its Gradient. J. Chem.
Soc., Perkin Trans. 2 1993, 799–805.
(79) Klamt, A. The COSMO and COSMO-RS Solvation Models. Wiley Interdiscip Rev
Comput Mol Sci 2011, 1, 699–709.
(80) Hou, B.; Laanait, N.; Yu, H.; Bu, W.; Yoon, J.; Lin, B.; Meron, M.; Luo, G.; Vany-
sek, P.; Schlossman, M. L. Ion Distributions at the Water/1,2-Dichloroethane Inter-
face: Potential of Mean Force Approach to Analyzing X-ray Reflectivity and Interfacial
Tension Measurements. J. Phys. Chem. B 2013, 117, 5365–5378.
(81) dos Santos, D.; Gomes, J. Molecular Dynamics Study of the Calcium Ion Transfer
Across the Water/Nitrobenzene Interface. ChemPhysChem 2002, 3, 946–951.
41
(82) Bauer, B. A.; Ou, S. C.; Patel, S. Role of Spatial Ionic Distribution on the Energetics
of Hydrophobic Assembly and Properties of the Water/Hydrophobe Interface. Phys.
Chem. Chem. Phys. 2012, 14, 1892–1906.
(83) Benjamin, I. Molecular Structure and Dynamics at Liquid-Liquid Interfaces. Annu.
Rev. Phys. Chem. 1997, 48, 407–451.
(84) Patra, M.; Karttunen, M. Systematic Comparison of Force Fields for Microscopic
Simulations of NaCl in Aqueous Solutions: Diffusion, Free Energy of Hydration, and
Structural Properties. J. Comput. Chem. 2004, 25, 678–689.
(85) Rais, J.; Okada, T.; Alexova, J. Gibbs Energies of Transfer of Alkali Metal Cations
Between Mutually Saturated Water-Solvent Systems Determined from Extraction Ex-
periments with Radiotracer Cs-137. J. Phys. Chem. B 2006, 110, 8432–8440.
(86) Sabela, A.; Marecek, V.; Samec, Z.; Fuoco, R. Standard Gibbs Energies of Transfer of
Univalent Ions from Water to 1,2-Dichloroethane. Electrochim. Acta 1992, 37, 231–
235.
(87) Shao, Y.; Stewart, A. A.; Girault, H. H. Determination of the Half-Wave Potential of
the Species Limiting the Potential Window. Measurement of Gibbs Transfer Energies
at the Water/1,2-Dichloroethane Interface. J. Chem. Soc., Faraday Trans. 1991, 87,
2593–2597.
(88) Ulmeanu, S. M.; Jensen, H.; Samec, Z.; Bouchard, G.; Carrupt, P.-A.; Girault, H. H.
Cyclic Voltammetry of Highly Hydrophilic Ions at a Supported Liquid Membrane. J.
Electroanal. Chem. 2002, 530, 10–15.
(89) Yoshida, Y.; Matsui, M.; Shirai, O.; Maeda, K.; Kihara, S. Evaluation of Distribution
Ratio in Ion Pair Extraction Using Fundamental Thermodynamic Quantities. Anal.
Chim. Acta 1998, 373, 213–225.
42
(90) Marcus, Y. Ion Solvation; John Wiley and Sons Ltd.: Chichester, 1985.
(91) Zhao, Y. H.; Abraham, M. H. Octanol/Water Partition of Ionic Species, Including 544
Cations. J. Org. Chem. 2005, 70, 2633–2640.
(92) Darvas, M.; Jorge, M.; Cordeiro, M. N. D. S.; Kantorovich, S. S.; Sega, M.;
Jedlovszky, P. Calculation of the Intrinsic Solvation Free Energy Profile of an Ionic
Penetrant Across a Liquid-Liquid Interface with Computer Simulations. J. Phys.
Chem. B 2013, 117, 16148–16156.
(93) Keasler, S. J.; Charan, S. M.; Wick, C. D.; Economou, I. G.; Siepmann, J. I. Trans-
ferable Potentials for Phase Equilibria - United Atom Description of Five- and Six-
Membered Cyclic Alkanes and Ethers. J. Phys. Chem. B 2012, 116, 11234–11246.
(94) Schweighofer, K.; Benjamin, I. Ion Pairing and Dissociation at Liquid/Liquid Inter-
faces: Molecular Dynamics and Continuum Models. J. Chem. Phys. 2000, 112, 1474–
1482.
(95) Wick, C. D.; Dang, L. X. Computational Investigation of the Influence of Organic-
Aqueous Interfaces on NaCl Dissociation Dynamics. J. Chem. Phys. 2010, 132, 8.
(96) Chorny, I.; Benjamin, I. Hydration Shell Exchange Dynamics During Ion Transfer
Across the Liquid/Liquid Interface. J. Phys. Chem. B 2005, 109, 16455–16462.
(97) Valente, M.; Sousa, S. F.; Magalhaes, A. L.; Freire, C. Decomplexation and Complex-
ation of Alkali Metal Cations by a Crown-Ether-Type Podand in Dichloromethane: A
Steered Molecular Dynamics Study. Theor. Chem. Acc. 2012, 131, 1171.
(98) Gouaux, E.; MacKinnon, R. Principles of Selective Ion Transport In Channels and
Pumps. Science 2005, 310, 1461–1465.
43
(99) Grigorieff, N.; Ceska, T. A.; Downing, K. H.; Baldwin, J. M.; Henderson, R. Electron-
Crystallographic Refinement of the Structure of Bacteriorhodopsin. J. Mol. Biol.
1996, 259, 393–421.
(100) Holtzel, A.; Tallarek, U. Ionic Conductance of Nanopores in Microscale Analysis Sys-
tems: Where Microfluidics Meets Nanofluidics. J. Sep. Sci. 2007, 30, 1398–1419.
(101) Simon, P.; Gogotsi, Y. Materials for Electrochemical Capacitors. Nat. Mater. 2008,
7, 845–854.
44
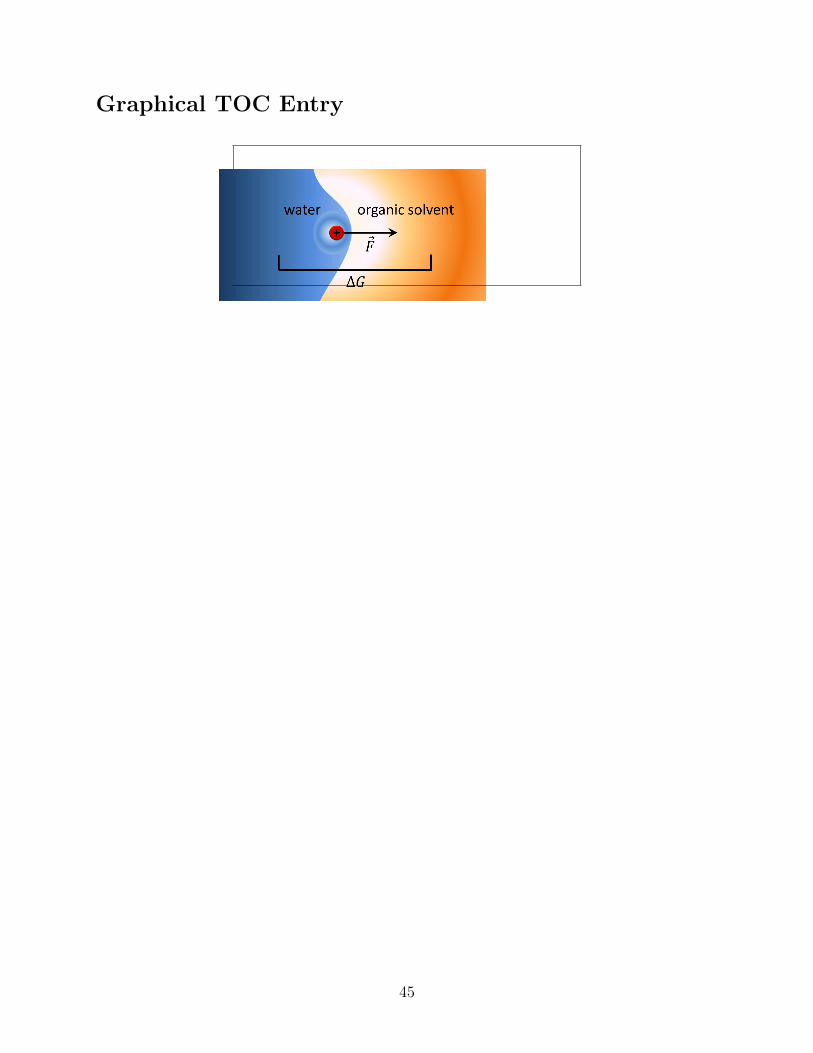
Graphical TOC Entry
45