batys, piotr; luukkonen, sohvi; sammalkorpi, maria ability of … · dynamics predicted ion...
TRANSCRIPT
This is an electronic reprint of the original article.This reprint may differ from the original in pagination and typographic detail.
Powered by TCPDF (www.tcpdf.org)
This material is protected by copyright and other intellectual property rights, and duplication or sale of all or part of any of the repository collections is not permitted, except that material may be duplicated by you for your research use or educational purposes in electronic or print form. You must obtain permission for any other use. Electronic or print copies may not be offered, whether for sale or otherwise to anyone who is not an authorised user.
Batys, Piotr; Luukkonen, Sohvi; Sammalkorpi, MariaAbility of Poisson-Boltzmann Equation to Capture Molecular Dynamics Predicted IonDistribution around Polyelectrolytes
Published in:Physical Chemistry Chemical Physics
DOI:10.1039/C7CP02547E
Published: 01/09/2017
Document VersionPeer reviewed version
Please cite the original version:Batys, P., Luukkonen, S., & Sammalkorpi, M. (2017). Ability of Poisson-Boltzmann Equation to CaptureMolecular Dynamics Predicted Ion Distribution around Polyelectrolytes. Physical Chemistry Chemical Physics,19, 24583-24593. https://doi.org/10.1039/C7CP02547E
PCCP
ARTICLE
This journal is © The Royal Society of Chemistry 20xx J. Name., 2013, 00, 1-3 | 1
Please do not adjust margins
Please do not adjust margins
Received 19th April 2017,
Accepted 11th August 2017
DOI: 10.1039/c7cp02547e
www.rsc.org/
Ability of Poisson-Boltzmann Equation to Capture Molecular Dynamics Predicted Ion Distribution around Polyelectrolytes
Piotr Batys,a,b,* Sohvi Luukkonena and Maria Sammalkorpia
Here, we examine polyelectrolyte (PE) and ion chemistry specificity in ion condensation via all-atom molecular dynamics
(MD) simulations and assess the ability of the Poisson-Boltzmann (PB) equation to describe the ion distribution predicted by
the MD simulations. The PB model enables extracting parameters characterizing the ion condensation. We find that the
modified PB equation which contains the effective PE radius and the energy of the ion-specific interaction as empirical fitting
parameters describes ion distribution accurately at large distances but close to the PE, especially when strongly localized
charge or specific ion binding sites are present, the mean field description of PB fails. However, the PB model captures the
MD predicted ion condensation in terms of Manning radius and fraction of condensed counterions for all the examined PEs
and ion species. We show that the condensed ion layer thickness in our MD simulations collapses on a single master curve
for all the examined simple, monovalent ions (Na+, Br+, Cs+, Cl-, and Br-) and PEs when plotted against the Manning parameter
(and consequently the PE line charge density). The significance of this finding is that, contrary to the Manning radius
extracted from the mean field PB model, the condensed layer thickness in the all atom detail MD modelling does not depend
on the PE chemistry or counterion type. Furthermore, the fraction of condensed counterions in the MD simulations exceeds
the PB theory prediction. The findings contribute toward understanding and modelling ion distribution around PEs and other
charged macromolecules in aqueous solutions, such as DNA, functionalized nanotubes, and viruses.
Introduction
Polyelectrolytes (PEs) are polymers that contain ionic or
ionisable repeating electrolyte groups. In aqueous solution, the
electrolyte groups dissociate to solvated counterions and a
charged polymer. Depending on the PE and the counterion
species, as well as, solution characteristics including excess salt,
the solvated ions can condense onto the polyions. The degree
and extent of this ion condensation, and its influence on PE-PE
interactions, is at key role in dictating PE materials
characteristics, for example for using them in industrial
solubilisation and flocculation,1-3 separation,4-6 drug delivery,7-
10 tunable and responsive coatings,8,11-13 adhesives,14
sensors,6,15-17 and tissue engineering.18,19 Besides technological
interest, many important biopolymers, such as DNA, RNA and
proteins, are PEs and experience ion condensation.
Excess salt contributes to the ion atmosphere around the PEs.
Therefore, it is not surprising that the responses of hydrated PE
assemblies, namely complexes and multilayers, are sensitive to
the addition of salt. The presence of ions can lead to responses
such as shrinking, swelling, loosening, or even dissociation at
high enough concentration.20-26 Furthermore, the counterion
type has been linked to the solubility,27 kinetics,28 stability,29
and composition of PE complexes,30-33 as well as their thermal
response.23
Most commonly, ion condensation in PE systems is described by
Manning’s theory, a mean field Poisson-Boltzmann (PB)
description that models the polyion as an idealized, infinitely
long line charge and the counterions within Debye-Huckel
approximation.34,35 Sharp has elaborated the Manning picture
by investigating the effect of excess salt in the system through
the nonlinear Poisson−Boltzmann equation.36 For monovalent
ions and low charge densities, the PB approach is consistent
with simple numerical models37,38 and is able to predict various
PE solution proprieties including electrophoretic migration,
surface adsorption or osmotic pressure in a concentration range
from 0.0003 to 0.15 M.38-40 Notably, the Manning mean field
picture breaks down in the presence of additional divalent salt,
or strongly interacting systems.37,41-43 Specifically, several
studies in which the PE is defined as a rigid rod or a line charge
with varying charge density,37,44 or a flexible chain of beads,45
have pointed out the importance of charge correlations in ion
condensation around PEs in strongly interacting systems.
Mean-field models do not take into account the molecular level
structure and inhomogeneity in the PE charge distribution. Ion
type specific effects can be incorporated partially to the PB
description via modifications, see e.g. Refs.46,47. All these effects
in PE-ion systems, however, can be captured by particle level
descriptions, such as Monte Carlo, or molecular dynamics (MD).
Both, primitive numerical models in which the PEs are described
as a rigid rod or a line charge with varying charge density37,42,48-
a. Department of Chemistry and Materials Science, School of Chemical Engineering, Aalto University, P.O. Box 16100, FI-00076 Aalto, Finland.
b. Jerzy Haber Institute of Catalysis and Surface Chemistry, Polish Academy of Sciences, Niezapominajek 8, PL-30239 Krakow, Poland.
† E-mail: [email protected]; [email protected]; Tel: +358-50-371-7434. Electronic Supplementary Information (ESI) available: Additional details and data about the system size and force-field comparison. See DOI: 10.1039/x0xx00000x
ARTICLE Journal Name
2 | J. Name., 2012, 00, 1-3 This journal is © The Royal Society of Chemistry 20xx
Please do not adjust margins
Please do not adjust margins
50 and detailed all-atom simulations20,46,51,52 have outlined the
significance of chemistry specific effects via charge correlations.
Specifically, the effect of ion species on the condensation of ions
has been demonstrated in Refs.20,53-56. However, systematic
studies of the effect of ion type and PE chemistry on the ion
condensation are lacking.
In this work, the ion condensation around several different PEs
is examined using two different theoretical approaches: 1) all-
atom MD simulations and 2) a modified mean-field PB model.
The detailed atomistic molecular dynamics simulations model
takes into account the local atomistic structure of the
polyelectrolyte and water, as well as, finite size and chemistry
specificity of the ions. It also captures van der Waals
interactions between the atoms and steric effects. The second
approach is a simplistic Poisson-Boltzmann equation. This
mean-field electrostatic model neglects atomistic detail,
solvent-polymer interactions, and all non-Coulombic
interactions but the ion specificity is partially retained via an
additional term; the all-atom MD model serves as a reference
to the PB. The current study provides both a systematic study
of the effect of ion type and PE chemistry on the ion
condensation in all-atom detail and a charting of the extent to
which the mean-field level PB model captures the distribution.
The examined PEs differ in charge per length, chemistry and the
degree of ionisation. The ion condensation of different
monovalent ions is compared via the fraction of condensed
counterions and the Manning radius rM, and crucial parameters
describing the ion condensation are extracted.
To our knowledge, this is the first study where the all-atom ion
condensation response of a large number of different PEs and
ions are compared with the PB model: the mapping enables
capturing molecular detail features that govern the quality of
the PB fit. Furthermore, we find that the condensed ion cloud
thickness falls on a master curve for all the examined ion types
and PEs. This means that although both the PE effective
diameter and the Manning radius rM are PE chemistry or
counterion type dependent in the mean field description, the
condensed layer thickness in the all-atom MD modelling is not.
Methods
Molecular Dynamics simulations
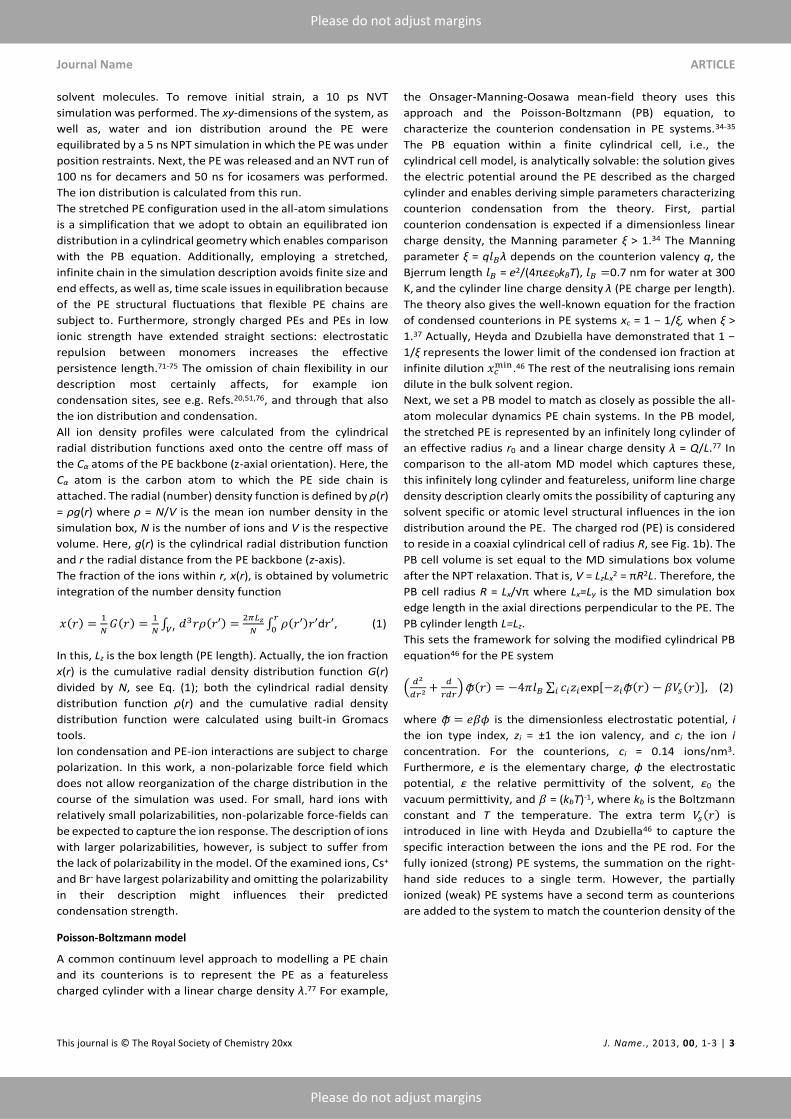
The all-atom molecular dynamics simulations employ the
Gromacs 4.6.5 package.57,58 Polystyrene sulfonate (PSS),
polydiallyldimethylammonium (PDA), polyacrylic acid (PAA),
polyallylamine (PAA), α–poly-L-lysine (PLL), and polyglutamic
acid (PGA) chains with Na+, K+, Cs+, Cl−, and Br− as counterions
were examined. Figure 1c) shows the PE structures. The
polyelectrolytes and polypeptides chosen for the study are very
common and provide a set that varies in both line charge
density and molecular structure significantly. To describe the
PEs and the ions, the OPLS-aa force field59 was used. The
ammonium and carboxylate groups parameters follow Ref.60.
Cation parameters originate from Ref.61 and chloride and
bromide ion parameters from Refs.62 and63 respectively. For
water, in compliance with the force-field choice, the explicit
TIP4P water model64 was employed.
For NVT ensemble simulations, the V-rescale thermostat65 with
coupling constant 0.1 ps was applied at reference temperature
T=300 K. The NPT ensemble simulations used the same
thermostat scheme and additionally the semi-isotropic
Parrinello-Rahman barostat66 with the coupling constant 1 ps
and reference pressure 1 bar. To calculate long-range
electrostatic interactions, the PME method was used.67 Van der
Waals interactions were described using the Lennard-Jones
potential with a 1.0 nm cut-off (direct cut-off, no shift).
Throughout the simulations, all the bonds in the PEs and water
molecules were controlled by the LINCS68 and SETTLE69
algorithms, respectively. A 2 fs time step within the leap-frog
integration scheme was applied and the trajectories were
written every 1 ps to obtain a frequent sampling of the ion
positions. This setup provides a classical empirical force-field
based all-atom detail molecular dynamics simulations model
with explicit solvent and ions present and rigorous treatment of
both electrostatics and van der Waals interactions in addition to
intramolecular and steric considerations. VMD software
package70 was used for all simulation snapshots.
To achieve a cylindrical setup that can be compared with the PB
theory, the MD simulation configurations were constructed so
that the PE chains spanned the cuboid simulation box as
straight, z-axial chains, see Figure 1a). To straighten the PE
chains, they were first aligned in the z-axial direction and then
stretched by a force of 1000 kJ mol-1 nm-1 along the z-axial
direction in vacuum in a 1 ns MD simulation with time step 0.5
fs. Next, the terminal groups were connected over the periodic
boundary conditions via introducing a bond between the
termini monomers, defining the appropriate angle and dihedral
interactions, as well as, excluding the neighbouring 1-4
interactions. The simulation box volume is 𝑉 = 𝐿𝑥𝐿𝑦𝐿𝑧, where
Lx=Ly, and Lz is defined by the stretched chain length, see Figure
1a).
The straight PE chain that spans the simulation box axially was
solvated by water molecules. An appropriate number of
counterions was introduced in the simulation box via replacing
Journal Name ARTICLE
This journal is © The Royal Society of Chemistry 20xx J. Name., 2013, 00, 1-3 | 3
Please do not adjust margins
Please do not adjust margins
solvent molecules. To remove initial strain, a 10 ps NVT
simulation was performed. The xy-dimensions of the system, as
well as, water and ion distribution around the PE were
equilibrated by a 5 ns NPT simulation in which the PE was under
position restraints. Next, the PE was released and an NVT run of
100 ns for decamers and 50 ns for icosamers was performed.
The ion distribution is calculated from this run.
The stretched PE configuration used in the all-atom simulations
is a simplification that we adopt to obtain an equilibrated ion
distribution in a cylindrical geometry which enables comparison
with the PB equation. Additionally, employing a stretched,
infinite chain in the simulation description avoids finite size and
end effects, as well as, time scale issues in equilibration because
of the PE structural fluctuations that flexible PE chains are
subject to. Furthermore, strongly charged PEs and PEs in low
ionic strength have extended straight sections: electrostatic
repulsion between monomers increases the effective
persistence length.71-75 The omission of chain flexibility in our
description most certainly affects, for example ion
condensation sites, see e.g. Refs.20,51,76, and through that also
the ion distribution and condensation.
All ion density profiles were calculated from the cylindrical
radial distribution functions axed onto the centre off mass of
the Cα atoms of the PE backbone (z-axial orientation). Here, the
Cα atom is the carbon atom to which the PE side chain is
attached. The radial (number) density function is defined by ρ(r)
= ρg(r) where ρ = N/V is the mean ion number density in the
simulation box, N is the number of ions and V is the respective
volume. Here, g(r) is the cylindrical radial distribution function
and r the radial distance from the PE backbone (z-axis). The fraction of the ions within r, x(r), is obtained by volumetric
integration of the number density function
𝑥(𝑟) =1
𝑁𝐺(𝑟) =
1
𝑁∫ 𝑑3𝑟𝜌(𝑟′)
𝑉′=
2𝜋𝐿𝑧
𝑁∫ 𝜌(𝑟′)𝑟′d𝑟′
𝑟
0, (1)
In this, Lz is the box length (PE length). Actually, the ion fraction
x(r) is the cumulative radial density distribution function G(r)
divided by N, see Eq. (1); both the cylindrical radial density
distribution function ρ(r) and the cumulative radial density
distribution function were calculated using built-in Gromacs
tools.
Ion condensation and PE-ion interactions are subject to charge
polarization. In this work, a non-polarizable force field which
does not allow reorganization of the charge distribution in the
course of the simulation was used. For small, hard ions with
relatively small polarizabilities, non-polarizable force-fields can
be expected to capture the ion response. The description of ions
with larger polarizabilities, however, is subject to suffer from
the lack of polarizability in the model. Of the examined ions, Cs+
and Br- have largest polarizability and omitting the polarizability
in their description might influences their predicted
condensation strength.
Poisson-Boltzmann model
A common continuum level approach to modelling a PE chain
and its counterions is to represent the PE as a featureless
charged cylinder with a linear charge density λ.77 For example,
the Onsager-Manning-Oosawa mean-field theory uses this
approach and the Poisson-Boltzmann (PB) equation, to
characterize the counterion condensation in PE systems.34-35
The PB equation within a finite cylindrical cell, i.e., the
cylindrical cell model, is analytically solvable: the solution gives
the electric potential around the PE described as the charged
cylinder and enables deriving simple parameters characterizing
counterion condensation from the theory. First, partial
counterion condensation is expected if a dimensionless linear
charge density, the Manning parameter ξ > 1.34 The Manning
parameter ξ = q𝑙𝐵λ depends on the counterion valency q, the
Bjerrum length 𝑙𝐵 = e2/(4πεε0kBT), 𝑙𝐵 =0.7 nm for water at 300
K, and the cylinder line charge density λ (PE charge per length).
The theory also gives the well-known equation for the fraction
of condensed counterions in PE systems xc = 1 − 1/ξ, when ξ >
1.37 Actually, Heyda and Dzubiella have demonstrated that 1 −
1/ξ represents the lower limit of the condensed ion fraction at
infinite dilution 𝑥𝑐min.46 The rest of the neutralising ions remain
dilute in the bulk solvent region.
Next, we set a PB model to match as closely as possible the all-
atom molecular dynamics PE chain systems. In the PB model,
the stretched PE is represented by an infinitely long cylinder of
an effective radius r0 and a linear charge density λ = Q/L.77 In
comparison to the all-atom MD model which captures these,
this infinitely long cylinder and featureless, uniform line charge
density description clearly omits the possibility of capturing any
solvent specific or atomic level structural influences in the ion
distribution around the PE. The charged rod (PE) is considered
to reside in a coaxial cylindrical cell of radius R, see Fig. 1b). The
PB cell volume is set equal to the MD simulations box volume
after the NPT relaxation. That is, V = LzLx2 = πR2L. Therefore, the
PB cell radius R = Lx/√π where Lx=Ly is the MD simulation box
edge length in the axial directions perpendicular to the PE. The
PB cylinder length L=Lz.
This sets the framework for solving the modified cylindrical PB
equation46 for the PE system
(𝑑2
𝑑𝑟2 +𝑑
𝑟𝑑𝑟) 𝜙~(𝑟) = −4𝜋𝑙𝐵 ∑ 𝑐𝑖𝑧𝑖exp[−𝑧𝑖𝜙~(𝑟) − 𝛽𝑉𝑠(𝑟)],𝑖 (2)
where 𝜙~ = 𝑒𝛽𝜙 is the dimensionless electrostatic potential, i
the ion type index, zi = ±1 the ion valency, and ci the ion i
concentration. For the counterions, ci = 0.14 ions/nm3.
Furthermore, e is the elementary charge, ϕ the electrostatic
potential, ε the relative permittivity of the solvent, ε0 the
vacuum permittivity, and 𝛽 = (kbT)-1, where kb is the Boltzmann
constant and T the temperature. The extra term 𝑉𝑠(𝑟) is
introduced in line with Heyda and Dzubiella46 to capture the
specific interaction between the ions and the PE rod. For the
fully ionized (strong) PE systems, the summation on the right-
hand side reduces to a single term. However, the partially
ionized (weak) PE systems have a second term as counterions
are added to the system to match the counterion density of the

ARTICLE Journal Name
4 | J. Name., 2012, 00, 1-3 This journal is © The Royal Society of Chemistry 20xx
Please do not adjust margins
Please do not adjust margins
fully charged PE systems (0.14 ions/nm3). The second term
corresponds to the co-ions that neutralize the charge of the
added counterions (ci is 0.03, 0.07, 0.10 or 0.14 ions/nm3).
Physically, the 𝑉𝑠(𝑟) is based on hydration47 but a shifted
Gaussian functional form is used to approximate 𝑉𝑠(𝑟):46
𝑉𝑠(𝑟) = 𝑉0exp[−(𝑟 − 𝑟0)2 𝜎2⁄ ] (3)
Here, 𝑉0 sets the energy scale and σ the length scale of the ion-
specific interaction. While 𝑉0 < 0 and r0 are ion specific fitting
parameters in the work, 𝜎 is set to 0.6 nm following Heyda and
Dzubiella.46 Significant deviation from σ = 0.6 nm resulted in
worse fits when we tested the parameter sensitivity. In general,
the magnitude of the ion specific interactions increases with the
absolute value of V0 and a smaller r0 value means that the ions
condense closer to the PE backbone.
The cylindrical PB equation, Eq. (2), was numerically solved
using the bvp4c function of Matlab with the boundary
conditions ϕ'(R) = 0 and ϕ'(r0) = −2ξ/r0. The electric field at the
surface of a charged cylinder was obtained by Gauss’ law. After
this, the charge density of ions of type i is given by
𝜌𝑖 = 𝑐𝑖exp[−𝑧𝑖𝜙~(𝑟) − 𝛽𝑉𝑠(𝑟)]. (4)
Now, Equation (1) provides the ion fraction x(r) within a
cylindrical region of radius r. The ion specific parameters 𝑉0 and
r0 were fitted so that the resulting ion fraction matches with the
x(r) profiles of the MD simulations trajectories with focus being
on the long-distance fit as atomic level correlations in the MD
simulations are most dominant at short radial distances.
Polyelectrolytes and their computational setups
First, ion-specific counterion condensation was studied on four
fully ionised strong PEs with different counterions in all-atom
detail, and later via the PB model. These PEs are PGA, PSS, PDA
and PLL. The counterions for the polyanions are Na+, K+, and Cs+
and for the polycations Cl− and Br−. Monovalent counterions
were chosen for the study based on the known basic description
accuracy ranges of the two models: the PB approach fails to
describe multivalent counterions37 and the employed atomistic
detail model does not capture the polarizability effects needed
for accurate description of the larger ions, such as iodide. All the
PE systems had a counterion concentration of 0.14 ions/nm3. As
all the monomers are monovalent, the net charge of a fully
ionized PE chain is equal to the number of monomers in the
simulation box. For all PEs except PDA, chains of 20 monomers
(icosamers) and for PDA chains of 10 monomers (decamers)
were examined. PDA has the smaller number of monomers
because PDA monomers are longer. Finite size effects were
mapped for PGA via comparing the PGA icosamers with
decamers.
Next, the ion condensation to a weak polyanion (PAA) and a
weak polycation (PAH) at different degrees of ionization was
examined again first in all-atom detail, and later via the PB
model. As PAA and PAH are weak PEs, their degree of ionization,
and hence also net charge, varies with pH. Degrees of ionization
100%, 75%, 50%, 25% and 0% were examined. These
correspond to pH-values around >9.5, 7.5, 6.5, 5.7, and <2 for
PAA and < 4.0, 7.7, 8.8, 10.3, and > 12 for PAH.78
Journal Name ARTICLE
This journal is © The Royal Society of Chemistry 20xx J. Name., 2013, 00, 1-3 | 5
Please do not adjust margins
Please do not adjust margins
The systems at different degrees of ionization are referred to as
PAA-20, PAA-15, PAA-10, PAA-5, and PAA-0 for PAA, and
correspondingly for PAH. The number indicates the number of
ionized monomers in the icosamer system, that is, PAA-20 and
PAH-20 are 100% ionized. In all systems, the ionized monomers
are uniformly distributed. The systems were studied with only
one type of counterion: PAH counterion is Cl− and PAA
counterion is Na+. The counterion concentration was set at 0.14
ions/nm3 as this results in a constant counterion concentration
in the systems. For the partially ionized PEs, the excess counter
charge is neutralized by adding a sufficient number of Na+ or Cl−
co-ions. Table I summarizes the simulations set up information
and MD parameters. Fig. 1c) contains the chemical structures of
all the studied PEs. The finite size effects of the results, as well
as, the dependency of the results on the force-field choice were
checked. Two force-fields, i.e., OPLS-aa59 and Amber0379 with
the Dang’s ion parameters80 and SPC/E water model81 were
compared. Finite size effects were examined by comparison of
the counterion condensation around 10 and 20 monomer long
PGA chains. The mean number count of ions adsorbed directly
on the PE differed slightly between the PGA systems of different
length but the calculated overall fraction of condensed
counterions xc varied very little.
Based on the comparison, we concluded PE chains of 20
monomers or comparable length, are sufficiently long to
examine the xc response. On the other hand, the two examined
force-fields result in different ion binding characteristics but
follow very similar overall trends. The observation that the
atomic detail ion binding characteristics bear some dependency
on the force-field and ion model is not really surprising; ion
binding dependencies have been reported earlier, for example
in Ref.76. The details of these checks, the resulting ion
distributions, and their detail comparison can be found in the
Electronic Supplementary Information.
For fitting the PB model to the all-atom MD simulations data
and extracting parameters from the fit, it is instructive to
introduce some terms: The range where the ion condensation
occurs in the Manning model is called the Manning radius rM.
Here, it is determined by the inflection point criteria37,38,46,82
that is commonly used with the PB theory. The fraction of
condensed ions xc is obtained, by definition, as the fraction of
ions closer to the PE than the Manning radius: xc ≡ x(rM). The PB
theory predicts also a scaling rM ∝ R1/2.37 This dependency on R
was not taken into account in the comparison of the rM values,
as R differs relatively little between the PE systems.
In the Manning theory, a PE is a uniformly charged line.
However, the PEs in the MD simulations have a finite radius. In
the PB model, this is captured by representing the PEs as
charged cylinders with an effective radius r0 that depends on
the PE and ion species. As the PE effective radius varies
significantly for the examined PEs and also depends on the
counterion species, instead of directly comparing the values of
the Manning radii, a parameter rcl = rM − r0 is introduced to
describe the condensed ion cloud thickness. This condensed ion
cloud thickness proves out to be a convenient parameter that
allows comparison between the different PEs and counterions.
ARTICLE Journal Name
6 | J. Name., 2012, 00, 1-3 This journal is © The Royal Society of Chemistry 20xx
Please do not adjust margins
Please do not adjust margins
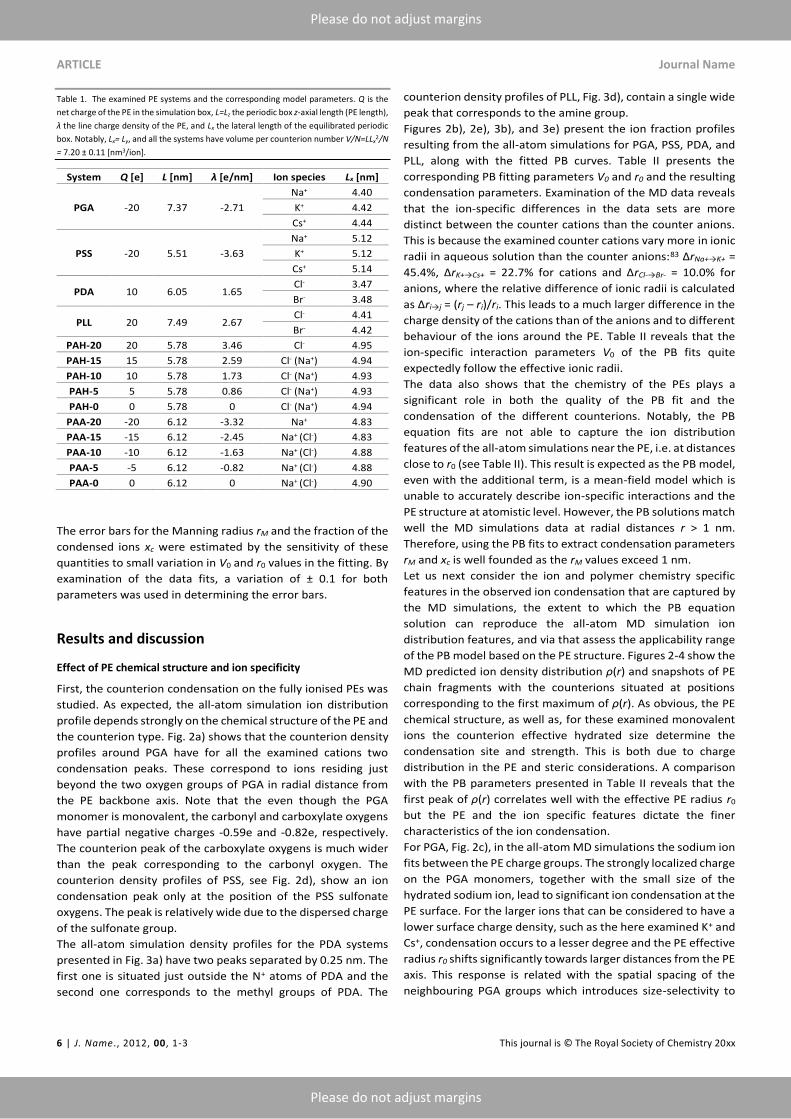
Table 1. The examined PE systems and the corresponding model parameters. Q is the
net charge of the PE in the simulation box, L=Lz the periodic box z-axial length (PE length),
λ the line charge density of the PE, and Lx the lateral length of the equilibrated periodic
box. Notably, Lx= Ly, and all the systems have volume per counterion number V/N=LLx2/N
= 7.20 ± 0.11 [nm3/ion].
System Q [e] L [nm] λ [e/nm] Ion species Lx [nm]
PGA -20 7.37 -2.71
Na+ 4.40
K+ 4.42
Cs+ 4.44
PSS -20 5.51 -3.63
Na+ 5.12
K+ 5.12
Cs+ 5.14
PDA 10 6.05 1.65 Cl- 3.47
Br- 3.48
PLL 20 7.49 2.67 Cl- 4.41
Br- 4.42
PAH-20 20 5.78 3.46 Cl- 4.95
PAH-15 15 5.78 2.59 Cl- (Na+) 4.94
PAH-10 10 5.78 1.73 Cl- (Na+) 4.93
PAH-5 5 5.78 0.86 Cl- (Na+) 4.93
PAH-0 0 5.78 0 Cl- (Na+) 4.94
PAA-20 -20 6.12 -3.32 Na+ 4.83
PAA-15 -15 6.12 -2.45 Na+ (Cl-) 4.83
PAA-10 -10 6.12 -1.63 Na+ (Cl-) 4.88
PAA-5 -5 6.12 -0.82 Na+ (Cl-) 4.88
PAA-0 0 6.12 0 Na+ (Cl-) 4.90
The error bars for the Manning radius rM and the fraction of the
condensed ions xc were estimated by the sensitivity of these
quantities to small variation in V0 and r0 values in the fitting. By
examination of the data fits, a variation of ± 0.1 for both
parameters was used in determining the error bars.
Results and discussion
Effect of PE chemical structure and ion specificity
First, the counterion condensation on the fully ionised PEs was
studied. As expected, the all-atom simulation ion distribution
profile depends strongly on the chemical structure of the PE and
the counterion type. Fig. 2a) shows that the counterion density
profiles around PGA have for all the examined cations two
condensation peaks. These correspond to ions residing just
beyond the two oxygen groups of PGA in radial distance from
the PE backbone axis. Note that the even though the PGA
monomer is monovalent, the carbonyl and carboxylate oxygens
have partial negative charges -0.59e and -0.82e, respectively.
The counterion peak of the carboxylate oxygens is much wider
than the peak corresponding to the carbonyl oxygen. The
counterion density profiles of PSS, see Fig. 2d), show an ion
condensation peak only at the position of the PSS sulfonate
oxygens. The peak is relatively wide due to the dispersed charge
of the sulfonate group.
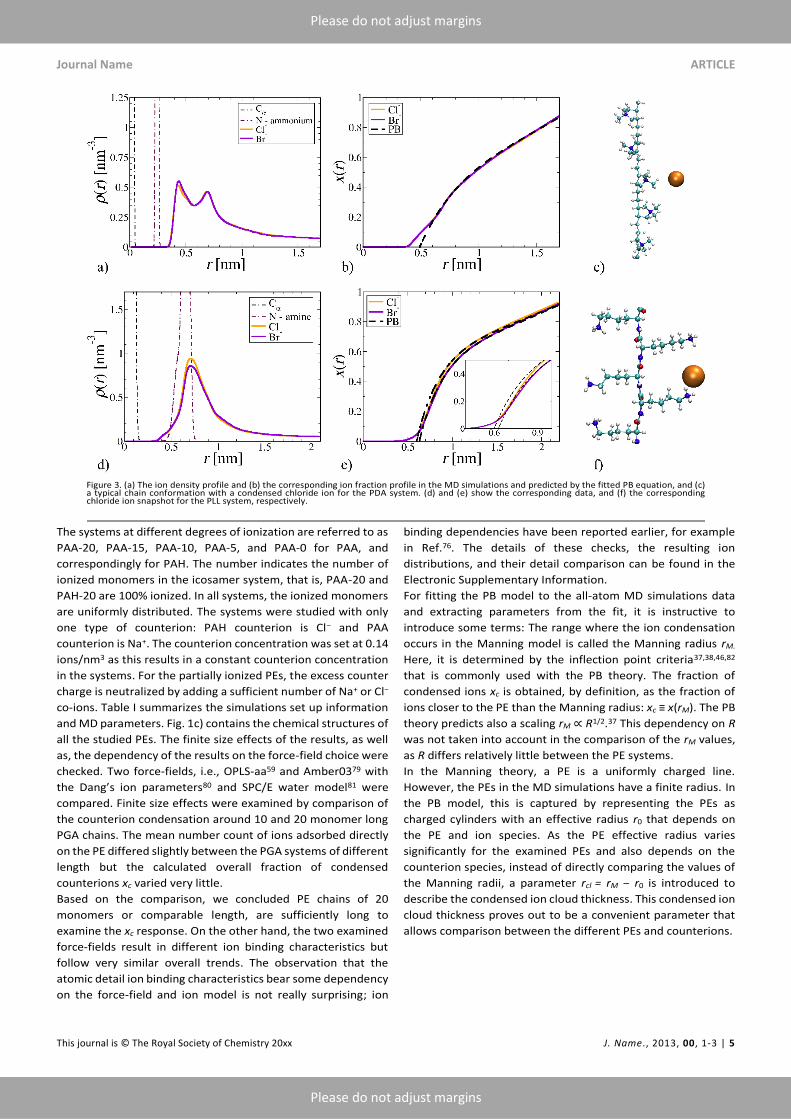
The all-atom simulation density profiles for the PDA systems
presented in Fig. 3a) have two peaks separated by 0.25 nm. The
first one is situated just outside the N+ atoms of PDA and the
second one corresponds to the methyl groups of PDA. The
counterion density profiles of PLL, Fig. 3d), contain a single wide
peak that corresponds to the amine group.
Figures 2b), 2e), 3b), and 3e) present the ion fraction profiles
resulting from the all-atom simulations for PGA, PSS, PDA, and
PLL, along with the fitted PB curves. Table II presents the
corresponding PB fitting parameters V0 and r0 and the resulting
condensation parameters. Examination of the MD data reveals
that the ion-specific differences in the data sets are more
distinct between the counter cations than the counter anions.
This is because the examined counter cations vary more in ionic
radii in aqueous solution than the counter anions:83 ∆rNa+→K+ =
45.4%, ∆rK+→Cs+ = 22.7% for cations and ∆rCl-→Br- = 10.0% for
anions, where the relative difference of ionic radii is calculated
as ∆ri→j = (rj – ri)/ri. This leads to a much larger difference in the
charge density of the cations than of the anions and to different
behaviour of the ions around the PE. Table II reveals that the
ion-specific interaction parameters V0 of the PB fits quite
expectedly follow the effective ionic radii.
The data also shows that the chemistry of the PEs plays a
significant role in both the quality of the PB fit and the
condensation of the different counterions. Notably, the PB
equation fits are not able to capture the ion distribution
features of the all-atom simulations near the PE, i.e. at distances
close to r0 (see Table II). This result is expected as the PB model,
even with the additional term, is a mean-field model which is
unable to accurately describe ion-specific interactions and the
PE structure at atomistic level. However, the PB solutions match
well the MD simulations data at radial distances r > 1 nm.
Therefore, using the PB fits to extract condensation parameters
rM and xc is well founded as the rM values exceed 1 nm.
Let us next consider the ion and polymer chemistry specific
features in the observed ion condensation that are captured by
the MD simulations, the extent to which the PB equation
solution can reproduce the all-atom MD simulation ion
distribution features, and via that assess the applicability range
of the PB model based on the PE structure. Figures 2-4 show the
MD predicted ion density distribution ρ(r) and snapshots of PE
chain fragments with the counterions situated at positions
corresponding to the first maximum of ρ(r). As obvious, the PE
chemical structure, as well as, for these examined monovalent
ions the counterion effective hydrated size determine the
condensation site and strength. This is both due to charge
distribution in the PE and steric considerations. A comparison
with the PB parameters presented in Table II reveals that the
first peak of ρ(r) correlates well with the effective PE radius r0
but the PE and the ion specific features dictate the finer
characteristics of the ion condensation.
For PGA, Fig. 2c), in the all-atom MD simulations the sodium ion
fits between the PE charge groups. The strongly localized charge
on the PGA monomers, together with the small size of the
hydrated sodium ion, lead to significant ion condensation at the
PE surface. For the larger ions that can be considered to have a
lower surface charge density, such as the here examined K+ and
Cs+, condensation occurs to a lesser degree and the PE effective
radius r0 shifts significantly towards larger distances from the PE
axis. This response is related with the spatial spacing of the
neighbouring PGA groups which introduces size-selectivity to
Journal Name ARTICLE
This journal is © The Royal Society of Chemistry 20xx J. Name., 2013, 00, 1-3 | 7
Please do not adjust margins
Please do not adjust margins
the condensation response in atomistic detail; for a flexible
chain, the size-selectivity is smaller. These charge-charge
correlations in the ion positioning result in the strong deviations
between the PB fitting and the x(r) derived from the all-atom
MD simulations of PGA, especially at distances r < 0.7 nm. In
total, the comparison to the PB model fit reveals that an ion
distribution that has charge-charge correlations, such as the ion
distribution in the close vicinity of a PE with localized charges or
specific condensation sites, cannot be accurately described
using the PB model.
On the other hand, fully charged PSS chains have elongated
shape and the carbon backbone is in all-trans conformation.72
The aromatic ring in the side chain, as well as, the short length
of the monomer unit prevents ion condensation between the
functional groups in the atomistic detail simulations model, see
Fig. 2f). The counterions are located further out around the
sulphate groups which makes the condensation less selective to
the ion type than in the case of PGA. With PSS, the PB model
predicted change in the effective radius r0 corresponding to
different counterions is relatively small. Furthermore,
agreement between the ion fraction obtained from the PB
equation and the MD simulations is better than for the PGA but
inaccuracy of the PB solution persists very near the PE.
Additionally, the counterion condensation of PSS and PGA
correlates with the Hofmeister series84 with Na+ condensing
more strongly than K+ and Cs+.
The ion condensation around the polycations PDA and PLL show
yet different features in the all-atom simulations. PDA has a
longer monomer length than the other PEs examined in this
work: Figure 3c) shows that the counterions of PDA are located
around the isolated charge groups. The ion distribution is much
less sensitive to the counteranion species because of the longer
separation between the PE charge groups and the similar ionic
radii of the counteranions. This leads to the effective radius r0
obtained from the PB model fit shifting very little for the two
counterions. As expected since the assumption of uniform
charge distribution is clearly not met, the PB model fits poorly
close to the PDA backbone. PLL which has long flexible
functional groups provides yet another example: the spacing
and flexibility of the PLL functional groups enables the
counterions to reside between the monomer units analogous to
PGA in the all-atom simulations. However, the small difference
in the examined counteranion ionic radii and the side chain
flexibility result in much smaller selectivity between the ions
than observed with PGA. Also, the agreement with the
Hofmeister series for anions cannot be clearly stated.
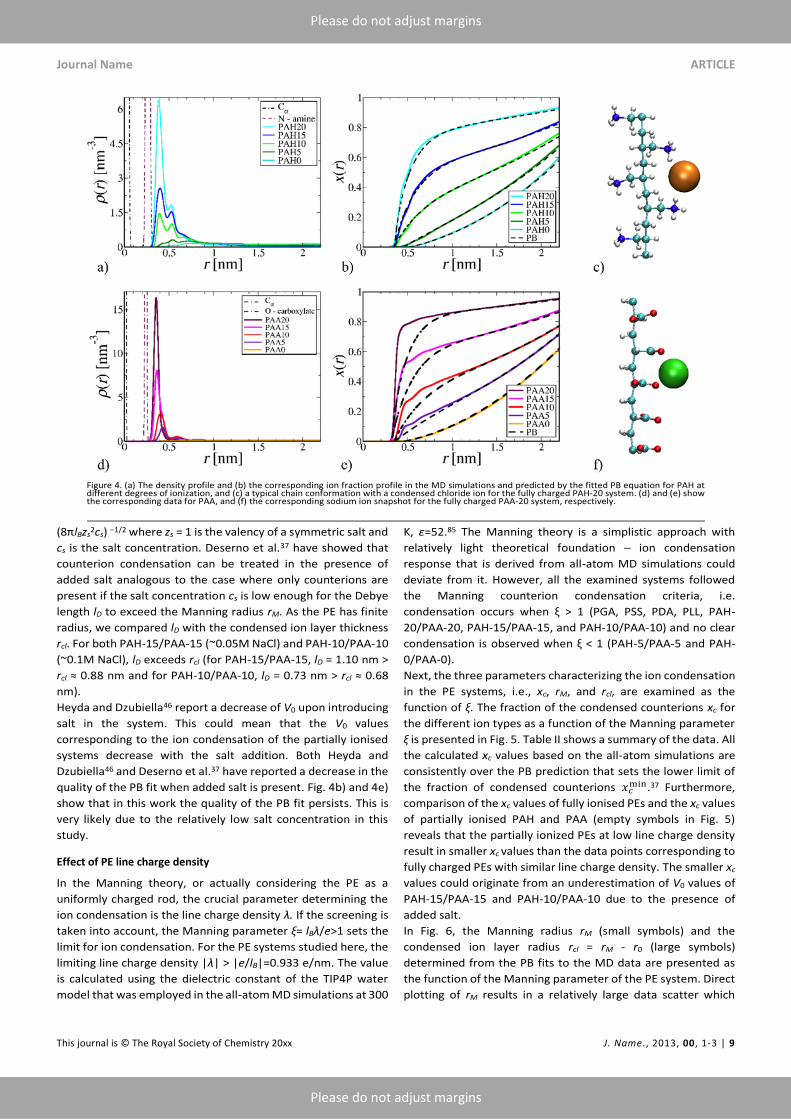
Figs. 4c) and f) present snapshots of fully charged PAA and PAH
chain fragments with the condensed counterions from the all-
atom simulations. Both PEs have small side chains and their
shape is much more cylindrical than the shapes of the other PEs
studied in this work. Their main difference is that PAA has
strongly localized charge groups while the PAH charge is more
spread out. Of these two, PAH satisfies the PB assumptions of a
cylindrical shape and uniform surface charge better. Indeed, the
PB model predicts even the fraction of counterions near the PE
backbone for PAH, see Fig. 4b). For PAA, the agreement
between the MD data and the PB fit is exceptionally bad despite
the cylindrical shape of it, see Fig. 4e). This suggests that the
strong localization of the charges (non-uniform charge
distribution) reduces crucially the ability of the PB equation to
capture the ion distribution. Additionally, similar to PGA, the
PAA charge groups are compensated efficiently by the small
counterions which fit between the charged groups.
The data of Figure 4e) indicates that a very high fraction, almost
80%, of the counterions condense on the fully charged PAA-20
in our all-atom simulations. The PE chains are stretched straight
which could enhance the ion condensation.

PCCP
ARTICLE
This journal is © The Royal Society of Chemistry 20xx J. Name., 2013, 00, 1-3 | 8
Please do not adjust margins
Please do not adjust margins
Table 2. The calculated Poisson-Boltzmann parameters. The table presents the radius of the PB cell R, the Manning parameter ξ, the fraction of condensed ions as predicted by the
PB theory 𝑥𝑐𝑚𝑖𝑛 (the lower limit of the fraction of condensed ions), the effective radius of the PE r0 (PB fitting parameter), the ion-specific interaction V0 (fitting parameter), the
Manning radius rM, the fraction of condensed ions xc, and the radius of the condensed layer rcl. The values in the parentheses correspond to the error estimate of the fitting procedure.
System R [nm] ξ 𝒙𝒄𝒎𝒊𝒏 Ion r0 [nm] V0 [kBT] rM [nm] xc rcl [nm]
PGA
2.52 2.12 0.53
Na+ 0.34 -1.8 1.28 (0.01) 0.78 (0.01) 0.94 (0.01)
K+ 0.46 -1.4 1.39 (0.01) 0.75 (0.01) 0.93 (0.01)
Cs+ 0.60 -1.2 1.52 (0.01) 0.73 (0.01) 0.92 (0.01)
PSS
2.92 2.83 0.65
Na+ 0.66 -2.0 1.70 (0.01) 0.82 (0.01) 1.04 (0.01)
K+ 0.68 -1.5 1.71 (0.01) 0.78 (0.01) 1.03 (0.01)
Cs+ 0.70 -1.2 1.72 (0.01) 0.76 (0.01) 1.02 (0.01)
PDA
1.97 1.29 0.22 Cl- 0.49 -0.9 1.19 (0.04) 0.63 (0.03) 0.70 (0.04)
Br- 0.49 -0.9 1.19 (0.04) 0.63 (0.03) 0.70 (0.04)
PLL
2.50 2.08 0.52 Cl- 0.60 -1.3 1.52 (0.01) 0.74 (0.01) 0.92 (0.01)
Br- 0.63 -1.2 1.55 (0.01) 0.74 (0.01) 0.92 (0.01)
PAH-20 2.85 2.70 0.63 Cl- 0.35 -2.5 1.36 (0.01) 0.83 (0.01) 1.01 (0.01)
PAH-15 2.85 2.02 0.50 Cl- 0.35 -2.0 1.21 (0.01) 0.62 (0.01) 0.86 (0.01)
PAH-10 2.85 1.35 0.26 Cl- 0.35 -1.1 0.99 (0.03) 0.38 (0.02) 0.64 (0.02)
PAH-5 2.85 0.67 - Cl- 0.45 -0.1 -- -- --
PAH-0 2.85 0 - Cl- 0.52 0.0 -- -- --
PAA-20 2.77 2.55 0.61 Na+ 0.32 -3.5 1.34 (0.03) 0.89 (0.01) 1.02 (0.03)
PAA-15 2.77 1.91 0.48 Na+ 0.32 -2.8 1.22 (0.02) 0.69 (0.01) 0.90 (0.02)
PAA-10 2.77 1.27 0.21 Na+ 0.35 -1.4 1.06 (0.02) 0.43 (0.01) 0.71 (0.02)
PAA-5 2.77 0.64 - Na+ 0.35 -0.5 -- -- --
PAA-0 2.77 0 - Na+ 0.47 0.0 -- -- --
To examine whether the stretched, straight PE configuration
influences the condensation here, the corresponding simulation
with a finite length, flexible PAA chain was performed. The
condensation and general behaviour of the sodium ions was
similar for also the flexible PAA chain.
Effect of ionisation degree
To investigate the influence of the PE ionisation degree on the
counterion condensation, PAA and PAH with degrees of
ionization of 75%, 50%, 25%, and 0% were examined in addition
to the fully charged 100% ionized PEs. The all-atom MD
predicted density profiles for the ion condensation around PAA
and PAH at varying degree of ionization are presented in Figs.
4a) and 4d). For both PEs, the major peak in ion density ρ(r) of
the all-atom simulations is located just outside the N+ of PAH or
the carboxylate O− of PAA. The peak is followed by some
oscillations at larger r values. For PAH, the ion distribution peak
is wider than for PAA because PAH amine group charge is more
spread out than the PAA carboxylate group charge. As the
degree of ionization in the PEs decreases, the peak decreases
and the relative amplitude of the oscillations increases. For the
neutral chains PAA-0 and PAH-0 no condensation occurs, as
expected. The ion condensation peaks of the PAH-5, PAA-10,
and PAA-5 systems shift slightly toward larger radial distances
in comparison to the more ionized PEs. The same shift translates
to the effective PE radius in the PB model fits.
Further examination of Table II reveals that the V0 values for the
PAA-20, -15, and -10 are much higher than for the other PEs
with comparable linear charge density. This is associated with
high fraction of condensed counterions that results from the
strongly localized charge on the PAA group and suitable spacing
between the groups. On the other hand, in agreement with the
Manning theory prediction that ξ = lBλ/e > 1 is the condensation
threshold, for the PAH and PAA systems that correspond to ξ <
1, that is, PAA-5, PAH-5, PAA-0, and PAH-0, the PB fittings do
not have an inflection point, see Figs. 4b) and 4e). This means
that the systems do not exhibit by this criterion a clear limit
between condensed and solvated ions; no Manning radius can
be defined.
Due to keeping the counterion concentration constant for each
degree of ionization of PAH and PAA, co-ions were added to
neutralize the partially ionised PE systems (PAH/PAA-15, -10, -5
and -0) in the all-atom simulations. Hence, the partially ionized
PE systems correspond to “added salt” conditions instead of
“counterions only” conditions. This necessitates the
introduction of a new parameter, the Debye length lD =
Journal Name ARTICLE
This journal is © The Royal Society of Chemistry 20xx J. Name., 2013, 00, 1-3 | 9
Please do not adjust margins
Please do not adjust margins
(8πlBzs2cs) −1/2 where zs = 1 is the valency of a symmetric salt and
cs is the salt concentration. Deserno et al.37 have showed that
counterion condensation can be treated in the presence of
added salt analogous to the case where only counterions are
present if the salt concentration cs is low enough for the Debye
length lD to exceed the Manning radius rM. As the PE has finite
radius, we compared lD with the condensed ion layer thickness
rcl. For both PAH-15/PAA-15 (~0.05M NaCl) and PAH-10/PAA-10
(~0.1M NaCl), lD exceeds rcl (for PAH-15/PAA-15, lD = 1.10 nm >
rcl ≈ 0.88 nm and for PAH-10/PAA-10, lD = 0.73 nm > rcl ≈ 0.68
nm).
Heyda and Dzubiella46 report a decrease of V0 upon introducing
salt in the system. This could mean that the V0 values
corresponding to the ion condensation of the partially ionised
systems decrease with the salt addition. Both Heyda and
Dzubiella46 and Deserno et al.37 have reported a decrease in the
quality of the PB fit when added salt is present. Fig. 4b) and 4e)
show that in this work the quality of the PB fit persists. This is
very likely due to the relatively low salt concentration in this
study.
Effect of PE line charge density
In the Manning theory, or actually considering the PE as a
uniformly charged rod, the crucial parameter determining the
ion condensation is the line charge density λ. If the screening is
taken into account, the Manning parameter ξ= lBλ/e>1 sets the
limit for ion condensation. For the PE systems studied here, the
limiting line charge density |λ| > |e/lB|=0.933 e/nm. The value
is calculated using the dielectric constant of the TIP4P water
model that was employed in the all-atom MD simulations at 300
K, ε=52.85 The Manning theory is a simplistic approach with
relatively light theoretical foundation – ion condensation
response that is derived from all-atom MD simulations could
deviate from it. However, all the examined systems followed
the Manning counterion condensation criteria, i.e.
condensation occurs when ξ > 1 (PGA, PSS, PDA, PLL, PAH-
20/PAA-20, PAH-15/PAA-15, and PAH-10/PAA-10) and no clear
condensation is observed when ξ < 1 (PAH-5/PAA-5 and PAH-
0/PAA-0).
Next, the three parameters characterizing the ion condensation
in the PE systems, i.e., xc, rM, and rcl, are examined as the
function of ξ. The fraction of the condensed counterions xc for
the different ion types as a function of the Manning parameter
ξ is presented in Fig. 5. Table II shows a summary of the data. All
the calculated xc values based on the all-atom simulations are
consistently over the PB prediction that sets the lower limit of
the fraction of condensed counterions 𝑥𝑐min.37 Furthermore,
comparison of the xc values of fully ionised PEs and the xc values
of partially ionised PAH and PAA (empty symbols in Fig. 5)
reveals that the partially ionized PEs at low line charge density
result in smaller xc values than the data points corresponding to
fully charged PEs with similar line charge density. The smaller xc
values could originate from an underestimation of V0 values of
PAH-15/PAA-15 and PAH-10/PAA-10 due to the presence of
added salt.
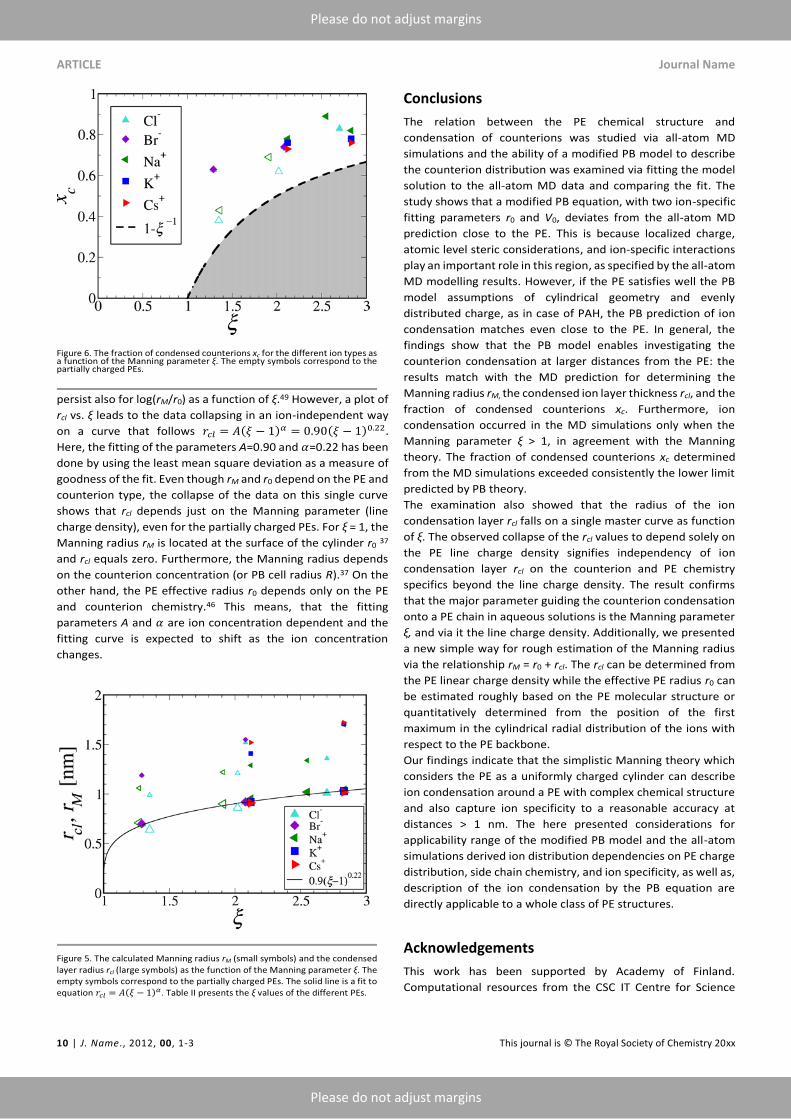
In Fig. 6, the Manning radius rM (small symbols) and the
condensed ion layer radius rcl = rM - r0 (large symbols)
determined from the PB fits to the MD data are presented as
the function of the Manning parameter of the PE system. Direct
plotting of rM results in a relatively large data scatter which
ARTICLE Journal Name
10 | J. Name., 2012, 00, 1-3 This journal is © The Royal Society of Chemistry 20xx
Please do not adjust margins
Please do not adjust margins
persist also for log(rM/r0) as a function of ξ.49 However, a plot of
rcl vs. ξ leads to the data collapsing in an ion-independent way
on a curve that follows 𝑟𝑐𝑙 = 𝐴(𝜉 − 1)𝛼 = 0.90(𝜉 − 1)0.22 .
Here, the fitting of the parameters A=0.90 and 𝛼=0.22 has been
done by using the least mean square deviation as a measure of
goodness of the fit. Even though rM and r0 depend on the PE and
counterion type, the collapse of the data on this single curve
shows that rcl depends just on the Manning parameter (line
charge density), even for the partially charged PEs. For ξ = 1, the
Manning radius rM is located at the surface of the cylinder r0 37
and rcl equals zero. Furthermore, the Manning radius depends
on the counterion concentration (or PB cell radius R).37 On the
other hand, the PE effective radius r0 depends only on the PE
and counterion chemistry.46 This means, that the fitting
parameters A and 𝛼 are ion concentration dependent and the
fitting curve is expected to shift as the ion concentration
changes.
Conclusions
The relation between the PE chemical structure and
condensation of counterions was studied via all-atom MD
simulations and the ability of a modified PB model to describe
the counterion distribution was examined via fitting the model
solution to the all-atom MD data and comparing the fit. The
study shows that a modified PB equation, with two ion-specific
fitting parameters r0 and V0, deviates from the all-atom MD
prediction close to the PE. This is because localized charge,
atomic level steric considerations, and ion-specific interactions
play an important role in this region, as specified by the all-atom
MD modelling results. However, if the PE satisfies well the PB
model assumptions of cylindrical geometry and evenly
distributed charge, as in case of PAH, the PB prediction of ion
condensation matches even close to the PE. In general, the
findings show that the PB model enables investigating the
counterion condensation at larger distances from the PE: the
results match with the MD prediction for determining the
Manning radius rM, the condensed ion layer thickness rcl, and the
fraction of condensed counterions xc. Furthermore, ion
condensation occurred in the MD simulations only when the
Manning parameter ξ > 1, in agreement with the Manning
theory. The fraction of condensed counterions xc determined
from the MD simulations exceeded consistently the lower limit
predicted by PB theory.
The examination also showed that the radius of the ion
condensation layer rcl falls on a single master curve as function
of ξ. The observed collapse of the rcl values to depend solely on
the PE line charge density signifies independency of ion
condensation layer rcl on the counterion and PE chemistry
specifics beyond the line charge density. The result confirms
that the major parameter guiding the counterion condensation
onto a PE chain in aqueous solutions is the Manning parameter
ξ, and via it the line charge density. Additionally, we presented
a new simple way for rough estimation of the Manning radius
via the relationship rM = r0 + rcl. The rcl can be determined from
the PE linear charge density while the effective PE radius r0 can
be estimated roughly based on the PE molecular structure or
quantitatively determined from the position of the first
maximum in the cylindrical radial distribution of the ions with
respect to the PE backbone.
Our findings indicate that the simplistic Manning theory which
considers the PE as a uniformly charged cylinder can describe
ion condensation around a PE with complex chemical structure
and also capture ion specificity to a reasonable accuracy at
distances > 1 nm. The here presented considerations for
applicability range of the modified PB model and the all-atom
simulations derived ion distribution dependencies on PE charge
distribution, side chain chemistry, and ion specificity, as well as,
description of the ion condensation by the PB equation are
directly applicable to a whole class of PE structures.
Acknowledgements
This work has been supported by Academy of Finland.
Computational resources from the CSC IT Centre for Science

Journal Name ARTICLE
This journal is © The Royal Society of Chemistry 20xx J. Name., 2013, 00, 1-3 | 11
Please do not adjust margins
Please do not adjust margins
(Finland) are gratefully acknowledged. The authors thank Dr.
Hanne Antila for useful discussions and providing source code
segments that aided in the work.
References
1 G. Petzold, S. Schwarz, Adv. Polym. Sci., 2014, 256, 25. 2 M. Riera-Torres, C. Gutierrez-Bouzan, M. Crespi, Desalination,
2010, 252, 53. 3 G. Petzold, A. Nebel, H-M. Buchhammer, K. Lunkwitz, Colloid.
Polym. Sci., 1998, 276, 125. 4 D. Li, Y. Yan, H. Wang, Prog. Polym. Sci., 2016, 61, 104. 5 N. Joseph, P. Ahmadiannamini, R. Hoogenboom, I.F.J.
Vankelecom, Polym. Chem., 2014, 5, 1817. 6 M.L. Bruening, D.M. Dotzauer, P. Jain, L. Ouyang, G.L. Baker,
Langmuir, 2008, 24,7663. 7 R.R Costa, M. Alatorre-Meda, J.F. Mano, Biotechnol. Adv.,
2015, 33, 1310. 8 M.A. Cohen Stuart, W.T.S. Huck, J. Genzer, M. Müller, C. Ober,
M. Stamm, G.B. Sukhorukov, I. Szleifer, V.V. Tsukruk, M. Urban, F. Winnik, S. Zauscher, I. Luzinov, S. Minko. Nat. Mater., 2010, 9, 101.
9 Z. Tang, Y. Wang, P. Podsiadlo, N.A. Kotov, Adv. Mater., 2006, 18, 3203.
10 C.E. Mora-Huertas, H. Fessi, A. Elaissari, Int. J. Pharm., 2010, 385, 113
11 P. Lavalle, J.-C. Voegel, D. Vautier, B. Senger, P. Schaaf, V. Ball, Adv. Mater., 2011, 23, 1191.
12 D. Mertz, C. Vogt, J. Hemmerle, J. Mutterer, V. Ball, J.C. Voegel, P. Schaaf, P. Lavalle, Nat. Mater., 2009, 8, 731.
13 T. Kruk, K. Szczepanowicz, D. Kręgiel, L. Szyk-Warszyńska, P. Warszyński, Colloids Surf., B, 2016, 137, 158.
14 H. Shao, R.J. Stewart, Adv. Mat., 2010, 22, 729. 15 J.L. Lutkenhaus, P.T. Hammond, Soft Matter, 2007, 3, 804. 16 K. Sato, S. Takahashi, J. Anzai, Anal. Sci., 2012, 28, 929. 17 A. Pajor-Świerzy, M. Kolasińska-Sojka, P. Warszyński, Surf.
Innovations, 2014, 2, 184. 18 J.M. Silva, R.L. Reis, J.F. Mano, Small, 2016, 12, 4308. 19 R.R. Costa, J.F. Mano, Chem. Soc. Rev., 2014, 43, 3453. 20 H.S. Antila, M. Sammalkorpi, J. Phys. Chem. B, 2014, 118,
3226. 21 J. DeRouchey, R.R. Netz, J.O. Radler, Eur. Phys. J. E, 2005, 16,
17. 22 H. Dautzenberg, J. Kriz, Langmuir, 2003, 19, 5204. 23 D.K. Reid, A. Summers, J. O’Neal, A.V. Kavarthapu, J.L.
Lutkenhaus, Macromolecules, 2016, 49, 5921. 24 E. Guzman, H. Ritacco, J.E.F. Rubio, R.G. Rubio, F. Ortega, Soft
Matter, 2009, 5, 2130. 25 G.M. Liu, S.R. Zou, L. Fu, G.Z. Zhang, J. Phys. Chem. B, 2008,
112, 4167. 26 R. Zhang, Y. Zhang, H.S. Antila, J.L. Lutkenhaus, and M.
Sammalkorpi, J. Phys. Chem. B, 2017, 121, 322. 27 D. McLoughlin, J. McManus, A. Gorelov, K. Dawson, Trends in
Colloid and Interface Science XIV, 2000, 115, 186. 28 A.V. Kabanov, V.A. Kabanov, Bioconjugate Chem., 1995, 6, 7. 29 Y. Zhang, E. Yildirim, H.S. Antila, L.D. Valenzuela, M.
Sammalkorpi, J.L. Lutkenhaus, Soft Matter, 2015, 11, 7392. 30 S. Zhou, B. Chu, Adv. Mater., 2000, 12, 545. 31 K. Hayakawa, J.P. Santerre, J.C.T. Kwak, Macromolecules,
1983, 16, 1642. 32 J.E. Wong, H. Zastrow, W. Jaeger, R. von Klitzing, Langmuir,
2009, 25, 14061. 33 R. Steitz, V. Leiner, R. Siebrecht, R. von Klitzing, Colloids Surf.,
A, 2000, 163, 63. 34 G.S. Manning, J. Chem. Phys., 1969, 51, 924. 35 F. Oosawa, Polyelectrolytes; Dekker: New York, 1971. 36 K.A. Sharp, Biopolymers, 1995, 36, 227.
37 M. Deserno, C. Holm, S. May, Macromolecules, 2000, 33, 199. 38 A. Naji, R.R. Netz, Phys. Rev. E, 2006, 73, 056105. 39 B. O’Shaughnessy, Q. Yang, Phys. Rev. Lett., 2005, 94, 048302. 40 J.M. Schurr, B.S. Fujimoto, J. Phys. Chem. B, 2003, 107, 4451. 41 E. Trizac, G. Téllez, Phys. Rev. Lett., 2006, 96, 038302. 42 M. Deserno, F. Jimenez-Angeles, C. Holm, M. Lozada-Cassou,
J. Phys. Chem. B, 2001, 105, 10983. 43 E. Rajasekaran, B. Jayaram, Biopolymers, 1994, 34, 443. 44 T. Nguyen, I. Rouzina, B. Shklovskii, J. Chem. Phys. 2000, 112,
2562. 45 A. Kundagrami, M. Muthukumar, J. Chem. Phys. 2008, 128,
244901. 46 J. Heyda, J. Dzubiella, Soft Matter, 2012, 8, 9338. 47 M. Boström, D.R.M. Williams, B.W. Ninham, J. Phys. Chem. B,
2002, 106, 7908. 48 H.S. Antila, P.R. Van Tassel, M. Sammalkorpi, J. Phys. Chem. B,
2015, 119, 13218. 49 J.P. Mallarino, G. Téllez, E. Trizac, J. Phys. Chem. B, 2013, 117,
12702. 50 H.S. Antila, P.R. Van Tassel, M. Sammalkorpi, Phys. Rev. E,
2016, 93, 022602. 51 H.S. Antila, M. Härkönen, M. Sammalkorpi, Phys. Chem. Chem.
Phys., 2015, 17, 5279. 52 T.J. Robbins, J.D. Ziebarth, Y. Wang, Biopolymers., 2014 101,
834. 53 A. Savelyev, G.A. Papoian, J. Am. Chem. Soc., 2006, 128,
14506. 54 J. Yoo, A. Aksimentiev, J. Phys. Chem. B, 2012, 116, 12946. 55 J. Dzubiella, J. Am. Chem. Soc., 2008, 130, 14000. 56 J. Heyda, J.C. Vincent, D.J. Tobias, J. Dzubiella, P. Jungwirth, J.
Phys. Chem. B, 2010, 114, 1213. 57 H.J.C. Berendsen, D. van der Spoel, R. van Drunen, Comput.
Phys. Commun., 1995, 91, 43. 58 E. Lindahl, B. Hess, D. van der Spoel, J. Mol. Model., 2001, 7,
306. 59 W.L. Jorgensen, J. Tirado-Rives, J. Am. Chem. Soc., 1988, 110,
1657. 60 W.L. Jorgensen, J. Gao, J. Phys. Chem., 1986, 90, 2174. 61 J. Åqvist, J. Phys. Chem., 1990, 94, 8021. 62 J. Chandrasekhar, D.C. Spellmeyer, W.L. Jorgensen, J. Am.
Chem. Soc., 1984, 106, 903. 63 T.P. Lybrand, I. Ghosh, J.A. McCammon, J. Am. Chem. Soc.,
1985, 107, 7793. 64 W.L. Jorgensen, J.D. Madura, Mol. Phys., 1985, 56, 1381. 65 G. Bussi, D. Donadio, M. Parrinello, J. Chem. Phys., 2007, 126,
014101. 66 M. Parrinello, A. Rahman, J. Appl. Phys., 1981, 52, 7182. 67 U. Essmann, L. Perera, M.L. Berkowitz, T. Darden, H. Lee, L.G.
Pedersen, J. Chem. Phys., 1995, 103, 8577. 68 B. Hess, H. Bekker, H.J.C. Berendsen, J.G.E.M. Fraaije, J.
Comput. Chem., 1997, 18, 1463. 69 S. Miyamoto, P.A. Kollman, J. Comput. Chem., 1992, 13, 952. 70 W. Humphrey, A. Dalke, K. Schulten, J. Mol. Graphics, 1996,
14, 33. 71 Z. Adamczyk, K. Jamrozy, P. Batys, A. Michna, J. Colloid Interf.
Sci., 2014, 435, 182. 72 J.-M.Y. Carrillo, A.V. Dobrynin, J. Phys. Chem. B, 2010, 114,
9391. 73 J.M. Finke, P.A. Jennings, J.C. Lee, J.N. Onuchic, J.R. Winkler,
Biopolymers, 2007, 86, 193. 74 Z. Adamczyk, B. Jachimska, T. Jasiński, P. Warszyński, M.
Wasilewska, Colloids Surf. A, 2009, 343, 96. 75 B. Jachimska, T. Jasiński, P. Warszyński, Z. Adamczyk, Colloids
Surf. A, 2010, 355, 7. 76 J. Yoo, A. Aksimentiev, J. Phys. Chem. Lett., 2012, 3, 45. 77 R.M. Fuoss, A. Katchalsky, S. Lifson, Proc. Natl. Acad. Sci.,
1951, 37, 579. 78 J. Choi, M.F. Rubner, Macromolecules, 2005, 38, 116.

ARTICLE Journal Name
12 | J. Name., 2012, 00, 1-3 This journal is © The Royal Society of Chemistry 20xx
Please do not adjust margins
Please do not adjust margins
79 Y. Duan, C. Wu, S. Chowdhury, M.C. Lee, G. Xiong, W. Zhang, R. Yang, P. Cieplak, R. Luo, T. Lee, J. Caldwell, J. Wang, P. Kollman, J. Comput. Chem., 2003, 24, 1999.
80 L.X. Dang, J. Am. Chem. Soc., 1995, 117, 6954. 81 H.J.C. Berendsen, J.R. Grigera, T.P. Straatsma, J. Phys. Chem.,
1987, 91, 6269. 82 L. Belloni, Colloids Surf., A., 1998, 140, 227. 83 Y. Marcus, Chem. Rev., 1988, 88, 1475. 84 F. Hofmeister, Arch. Exp. Pathol. Pharmacol., 1888, 24, 247. 85 R. Fuentes-Azcatl, J. Alejandre, J. Phys. Chem. B, 2014, 118,
1263.