suarez-martinez, pilar c.; batys, piotr; sammalkorpi
TRANSCRIPT
This is an electronic reprint of the original article.This reprint may differ from the original in pagination and typographic detail.
Powered by TCPDF (www.tcpdf.org)
This material is protected by copyright and other intellectual property rights, and duplication or sale of all or part of any of the repository collections is not permitted, except that material may be duplicated by you for your research use or educational purposes in electronic or print form. You must obtain permission for any other use. Electronic or print copies may not be offered, whether for sale or otherwise to anyone who is not an authorised user.
Suarez-Martinez, Pilar C.; Batys, Piotr; Sammalkorpi, Maria; Lutkenhaus, Jodie L.Time-Temperature and Time-Water Superposition Principles Applied toPoly(allylamine)/Poly(acrylic acid) Complexes
Published in:Macromolecules
DOI:10.1021/acs.macromol.8b02512
Published: 23/04/2019
Document VersionPeer reviewed version
Published under the following license:Unspecified
Please cite the original version:Suarez-Martinez, P. C., Batys, P., Sammalkorpi, M., & Lutkenhaus, J. L. (2019). Time-Temperature and Time-Water Superposition Principles Applied to Poly(allylamine)/Poly(acrylic acid) Complexes. Macromolecules,52(8), 3066-3074. https://doi.org/10.1021/acs.macromol.8b02512
1
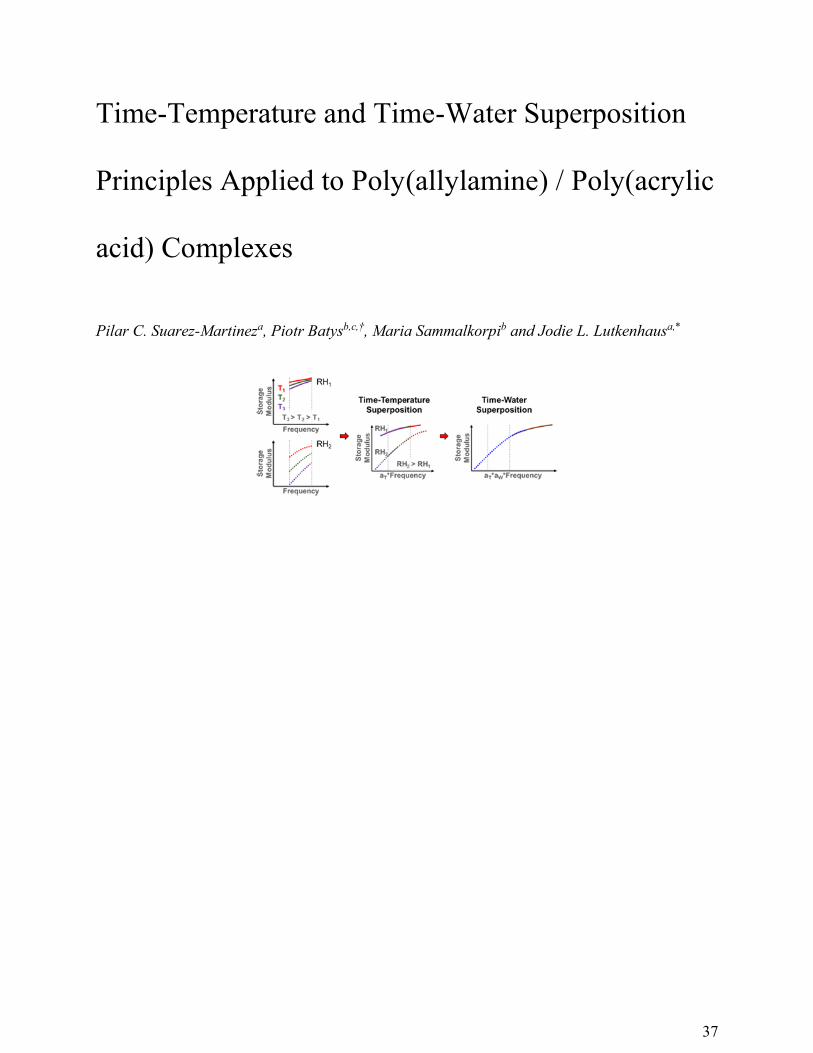
Time-Temperature and Time-Water Superposition Principles Applied to Poly(allylamine) / Poly(acrylic acid) Complexes Pilar C. Suarez-Martineza, Piotr Batysb,c,†, Maria Sammalkorpib and Jodie L. Lutkenhausa,*
aArtie McFerrin Department of Chemical Engineering, Texas A&M University, College Station,
Texas 77843, United States
bDepartment of Chemistry and Materials Science, cDepartment of Bioproducts and Biosystems,
School of Chemical Engineering, Aalto University, P.O. Box 16100, FI-00076 Aalto, Finland
†Jerzy Haber Institute of Catalysis and Surface Chemistry, Polish Academy of Sciences,
Niezapominajek 8, PL-30239 Krakow, Poland
*Corresponding author
E-mail address: [email protected]
Time, temperature, water content, relative humidity, superposition, polyelectrolyte complex,
dynamic mechanical behavior
2
ABSTRACT
The dynamic mechanical and rheological behavior of polyelectrolyte coacervates and complex
precipitates is of interest for many applications ranging from health to personal care. Hydration is
an important factor, but its effect on the dynamic properties of polyelectrolyte complexes (PECs)
is poorly understood. Here, we describe the dynamic behavior of poly(allylamine hydrochloride)
(PAH) and poly(acrylic acid) (PAA) complex precipitates at varying relative humidity values and
temperatures using both dynamic mechanical analysis (DMA) and all-atom molecular dynamics
simulations. To mirror the experimental system via simulation, the water content within the PEC
is measured and used as the parameter of interest, rather than relative humidity. In experimental
DMA, modulus decreases with both increasing water content and temperature. The data are
superimposed into a super-master hydrothermal curve using the time-temperature superposition
principle and the time-water superposition principle for the first time. The temperature-dependent
shift factor (aT) follows an Arrhenius relation, and the water-dependent shift factor (aw) follows a
log-linear relation with water content in the complex. These results suggest that both temperature
and water affect the dynamics of the PEC by similar mechanisms over the range investigated. All-
atom molecular dynamics simulations show that an increase in water content and temperature lead
to similar changes in polyelectrolyte chain mobility with little effect on the number of intrinsic ion
pairs, suggesting the validity of time-water and time-temperature supposition principles.
INTRODUCTION
Polyelectrolyte complexes (PECs) are the product of strong interactions between oppositely
charged macromolecules and the release of entropic counterions in solution.1-22 PEC morphologies
range from solid-like (polyelectrolyte complexes) to liquid-like (polyelectrolyte coacervates),23, 24
and are affected by assembly conditions (e.g., polyelectrolyte concentration, ionic strength and salt
3
type, polyelectrolyte type and molecular weight, etc.), as well as post-treatment conditions.25-27
Consequently, PEC physical properties have proven to be affected by water content, salt, and
pH.28-42 This enables PECs for several applications including humidity sensors,43, 44 adhesives,45
self-healing materials,46-49 and mechanically adaptive materials.50 To date, it is generally accepted
that water content and temperature affect the mechanical properties of PECs.28-34 However, there
is little information regarding the dynamic mechanical behavior of PECs as a function of both
water content and temperature. A fundamental understanding is needed to not only reveal how
polyelectrolyte chains behave dynamically within the complex but also for enabling certain
applications.
PEC structure is generally described by intrinsic and extrinsic ion pairing. 23, 37 Intrinsic ion
pairing is formed by the electrostatic interactions between oppositely charged polymer repeat units,
and extrinsic ion pairing results from interactions of polymer repeat units and counter ions.23 Water
acts as an essential plasticizing agent, relaxing the polymer chains within the PEC. Increasing the
water content in PECs causes an increase in free volume, structural rearrangement, and a decrease
in both the PEC glass transition temperature and modulus.25, 51 Salt facilitates PEC plasticization
by transforming intrinsic ion pairs into extrinsic ion pairs, which promotes the relaxation of
polyelectrolyte chains within the PEC. However, simulations indicate that the plasticizing effect
of salt is influenced by water: salt acts as a plasticizer (weakening ion pairing) or a hardener
(immobilizing the water molecules), depending on the PEC hydration level.51 Thus, salt influences
whether a hydrated PEC is glassy — moduli ~ 109 Pa — or rubbery — moduli ~ 106 Pa.37, 52-54
Similarly, pH can have a strong effect on the number of intrinsic ion pairs by way of controlling a
polyelectrolyte’s charge density.38, 55 Together, water, pH, and salt have been reported to influence
static mechanical properties.24, 25, 32, 37, 40, 51, 55
4
Due to the known effects of water, salt, and pH on the structure and mechanical properties of
PECs, the dynamic mechanical behavior of PECs has been studied through the application of
superposition principles. Superposition principles are a tool used to study physical and mechanical
responses of materials in the time domain (e.g., polymers, polyelectrolyte complexes).40, 56
Specifically, superposition principles are used to analyze frequency-dependent properties such as
the complex modulus. The time-temperature superposition principle (TTSP), for example, relates
the time and temperature response of viscoelastic materials.56 Thus, TTSP is used to either
determine the temperature-dependence of a material’s rheological behavior, or to study a
material’s behavior at a specific temperature over a broader frequency range.56, 57 Consequently,
other superposition principles have been explored to study the dynamic mechanical response of
homopolymers (e.g., nylon) to variables other than temperature, such as: salt,58, 59 pH,40 and
water/humidity.60-62 In the specific case of the dynamic mechanical behavior of hydrated PECs,
equivalent effects between time (frequency), temperature, salt, and pH have been proposed and
studied for immersed PECs and/or PEC coacervates: time-temperature superposition,37 time-salt
superposition,21, 24, 63 time-temperature-salt superposition,37 and time-pH superposition.40 Only
two studies have addressed the application of the time-humidity superposition principle to PECs,
however this was done for ion conductivity.35, 39 Therefore, information is lacking regarding time-
water-temperature superposition for the dynamic mechanical behavior of PECs.
Here, we study the plasticizing effects of water and temperature on the dynamic mechanical
behavior of a PEC made from poly(allylamine hydrochloride) (PAH) and poly(acrylic acid)
(PAA), as well as its mechanical behavior through the application of time-temperature (TTSP) and
time-water (TWSP) superposition principles. PAH/PAA PEC specimens were equilibrated to
specific relative humidity values and tested using a dynamic mechanical analysis (DMA)
5
instrument equipped with a relative humidity accessory. Data collected for the storage modulus
(E’) were used to construct master curves after the application of TTSP and TWSP from which
two horizontal shift factors were assessed: a temperature-dependent shift factor (aT) and a water-
dependent shift factor (aW). Finally, the temperature dependence of aT and the water dependence
of aW were described using an Arrhenius equation and a log-linear equation, respectively. Such
information is relevant to the selection of materials for specific applications in which the material’s
mechanical behavior under the conditions of use (e.g., cyclic loading, temperature, relative
humidity (water content), etc.) are important.
EXPERIMENTAL SECTION
Materials
Poly(acrylic acid) (PAA, Mw 100,000 g-mol-1, 35 wt% aqueous solution) was purchased from
Sigma Aldrich. Poly(allylamine hydrochloride) (PAH, Mw 120,000 – 200,000 g-mol-1, 40 wt%
aqueous solution) was purchased from Polysciences Inc. PAA and PAH were used as received.
Milli-Q water was used for all experiments and solutions preparation.
Preparation of PAH/PAA Polyelectrolyte Complexes
A preparation procedure developed by Zhang et al.38 was followed. 0.1 M solutions of PAH and
PAA were prepared with respect to their repeat unit molar mass. The pH of the polyelectrolyte
solutions was adjusted to pH 7 using NaOH or HCl aqueous solutions. 100 mL of the PAH solution
were quickly added to 100 mL of the PAA solution. The PAH/PAA blend was stirred for 30 min
at 600 rpm. Dialysis of the PAH/PAA PEC mixture was performed using Milli-Q water at pH 7
for 2 days. Dialysis time was determined by measuring the conductivity of the Milli-Q water. The
dialyzed PEC was transferred to Falcon tubes and centrifuged for 10 min at 8500 rpm and 25 oC.
Centrifuged PECs were recovered, cut into small chunks, and allowed to dry at room conditions
6
for at least 12 hours. Once dry, the PEC chunks were ground into a powder. For improved
reproducibility, multiple batches were prepared and then blended all together.
Solid specimens for dynamic mechanical testing and water content determination were prepared
by compression molding according to ASTM D4703-16.64 A stainless steel flash mold with
machined cavities was used, having cavity dimensions of 20 mm length, 6 mm width, and 0.5 mm
depth. 50 ± 1 mg of the powdered PAH/PAA PEC were carefully placed in each machined cavity.
Then, 55 μl of Milli-Q water at pH 7 were added to each cavity. Aluminum foil 1100 was used as
the separating sheet. The mold was placed in a hot press at 100 oF for a total of 14 minutes: 10
minutes without any load, 2 minutes with a 2 ton load, and 2 minutes with a 4 ton load. The PEC
specimens were removed from the mold, placed between two glass slides to keep them flat, and
allowed to dry for ~12 hours at ambient conditions.
Determination of PEC Water Content
Specimens were placed in a homebuilt humidity chamber at the desired RH value and room
temperature. The mass of the hydrated PEC specimen was measured immediately after at least 24
hours of exposure in the RH chamber. The “dry” weight of the specimens was measured after
drying the hydrated PEC specimens for 3 days in a vacuum oven at 30 oC. Longer exposure times
in the humidity chamber did not increase the PEC water content. Therefore, a period of 24 hours
was determined to be sufficient for the PEC specimens to reach the equilibrated water content (see
Table 1).
Dynamic Mechanical Analysis Measurements
Mechanical testing was performed using a TA Q800 dynamic mechanical analyzer with a
relative humidity accessory. A tension clamp configuration was used. PEC specimens were first
equilibrated in the homebuilt humidity chamber for at least 24 hours at the desired RH value before
7
DMA measurements were taken. Multi-strain tests were performed to ensure all measurements
were within the linear viscoelastic regime for each RH value (50, 70, 80, 85, 90 and 95% RH)
(Figure S1). A strain value of 0.01% was chosen for all multi-frequency strain tests.
Multi-frequency strain (frequency sweep) tests were performed at set temperature and relative
humidity values over a 10-1 – 101 Hz frequency range. PEC films were allowed to equilibrate for
30 – 40 min within the relative humidity accessory once the temperature and relative humidity set
points were reached. Three frequency sweeps (~ 6 h) were performed to ensure an equilibrated
response and to eliminate any mechanical history. Data from the third frequency sweep were used
for time-temperature and time-water superposition analysis. Samples were tested in duplicates
(except for 50% RH). A representative data set from each relative humidity-temperature
configuration was chosen for plotting purposes. A new specimen was used for each relative
humidity-temperature configuration.
Multi-frequency strain experiments provided information regarding the PEC mechanical
behavior: storage (E’) and loss (E”) moduli as well as tan delta (E”/E’). A RH range of 50 – 95%
was chosen due to sample and instrument limitations. Samples at 50% RH or less were glassy and
brittle, thus often resulting in sample failure during experimental mounting. Therefore, RH values
below 50% were not explored. The DMA relative humidity accessory presented limitations for RH
and T ranges as well.65 Upper and lower temperature limits were initially determined according to
operating specifications for the DMA relative humidity accessory. Upper temperature limits were
additionally narrowed down according to sample failure (yielding) at specific relative humidity
values (see Table 1).
8
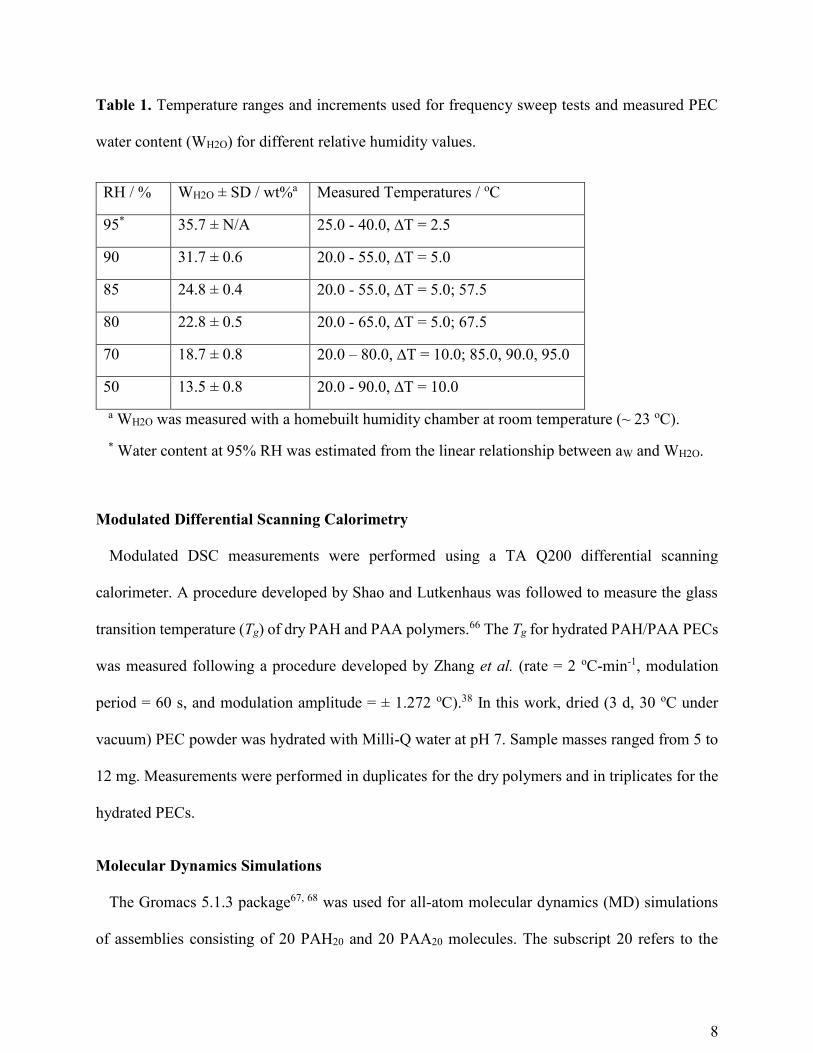
Table 1. Temperature ranges and increments used for frequency sweep tests and measured PEC
water content (WH2O) for different relative humidity values.
RH / % WH2O ± SD / wt%a Measured Temperatures / oC
95* 35.7 ± N/A 25.0 - 40.0, ∆T = 2.5
90 31.7 ± 0.6 20.0 - 55.0, ∆T = 5.0
85 24.8 ± 0.4 20.0 - 55.0, ∆T = 5.0; 57.5
80 22.8 ± 0.5 20.0 - 65.0, ∆T = 5.0; 67.5
70 18.7 ± 0.8 20.0 – 80.0, ∆T = 10.0; 85.0, 90.0, 95.0
50 13.5 ± 0.8 20.0 - 90.0, ∆T = 10.0
a WH2O was measured with a homebuilt humidity chamber at room temperature (~ 23 oC).
* Water content at 95% RH was estimated from the linear relationship between aW and WH2O.
Modulated Differential Scanning Calorimetry
Modulated DSC measurements were performed using a TA Q200 differential scanning
calorimeter. A procedure developed by Shao and Lutkenhaus was followed to measure the glass
transition temperature (Tg) of dry PAH and PAA polymers.66 The Tg for hydrated PAH/PAA PECs
was measured following a procedure developed by Zhang et al. (rate = 2 oC-min-1, modulation
period = 60 s, and modulation amplitude = ± 1.272 oC).38 In this work, dried (3 d, 30 oC under
vacuum) PEC powder was hydrated with Milli-Q water at pH 7. Sample masses ranged from 5 to
12 mg. Measurements were performed in duplicates for the dry polymers and in triplicates for the
hydrated PECs.
Molecular Dynamics Simulations
The Gromacs 5.1.3 package67, 68 was used for all-atom molecular dynamics (MD) simulations
of assemblies consisting of 20 PAH20 and 20 PAA20 molecules. The subscript 20 refers to the
9
number of repeat units in each chain. The OPLS-aa force field69 was used for polyelectrolytes and
TIP4P explicit water model70 for the water. The protonation of PAA and PAH was set so that all
repeat units were fully charged, matching assembly at pH = 7.71 The degrees of ionization of PAH
and PAA within PAH/PAA assembled at pH 7 were estimated as 100% and 93%, respectively.
Three different water concentrations, i.e., 18.7, 24.8, and 31.7 wt%, corresponding to 70, 85, and
90% RH in the experiments, were examined. The chemical structures of PAA and PAH, and
sample simulation snapshots of 20-mer PAH and PAA are presented in Figure S2.
The PME method72 was used for the long-range electrostatics interactions and the Lennard-Jones
potential with a 1.0 nm cut-off for the van der Waals interactions. Long-range dispersion
corrections for energy and pressure were applied. The LINCS73 and SETTLE74 algorithms were
used to constrain the bonds in the polyelectrolytes and in water molecules. A 2 fs time step within
the leap-frog integration scheme was applied, and the trajectories were recorded every 1000 steps.
Temperature was controlled via the V-rescale thermostat75 with coupling constant = 0.1 ps; the
polyelectrolytes and solvent were coupled to separate heat baths. Periodic boundary conditions
were applied in all directions. Pressure was maintained at 1 bar via the Parrinello-Rahman
barostat76 with coupling constant p = 2 ps. The VMD software package was used for
visualizations.77 Initial PEC configurations were generated using PACKMOL78 with a protocol
established in previous work.42, 79 Additional information about the simulation system preparation
and analysis is provided in the Supporting Information.
RESULTS AND DISCUSSION
PEC water content and Tg
In order to understand the effect of water on the dynamic mechanical behavior of PAH/PAA
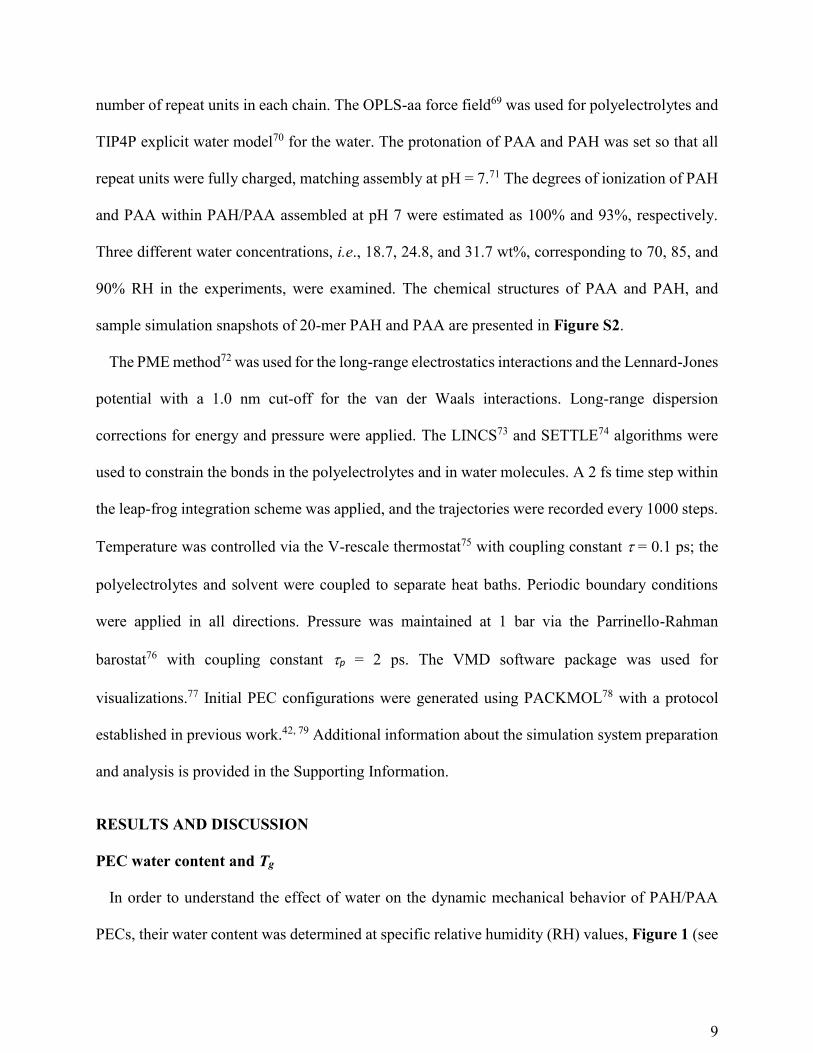
PECs, their water content was determined at specific relative humidity (RH) values, Figure 1 (see
10
Table S1 in Supporting Information for a sample calculation). A linear trend of water content with
RH is observed between 50 and 85% RH. At 90% RH, the PEC absorbs more water from the
environment due to increased rearrangement of the PEC structure with increasing RH.80 This
sudden increase in water content above 85% RH resembles a similar effect observed by Nolte et
al.,80 where polyelectrolyte multilayer (PEM) swelling significantly increased above 90% RH.
Figure S3 illustrates the glass transition temperature (Tg) as a function of water content in the
PAH/PAA PEC. The Tg values measured for the PECs at varying RH values (water content) are in
agreement with previously published Tg values for hydrated PAH/PAA PECs studied by Zhang et
al.38 Tg decreased with increasing water content, which is explained by the plasticizing effect of
water.81
Figure 1. PAH/PAA PEC water content (◊, black) and water mole fraction (□, blue) as a function
of relative humidity at 25 C.
Time-Temperature Superpositioning Using Dynamic Mechanical Analysis
E’ was measured over a 10-1 – 101 Hz frequency range at different temperatures and relative
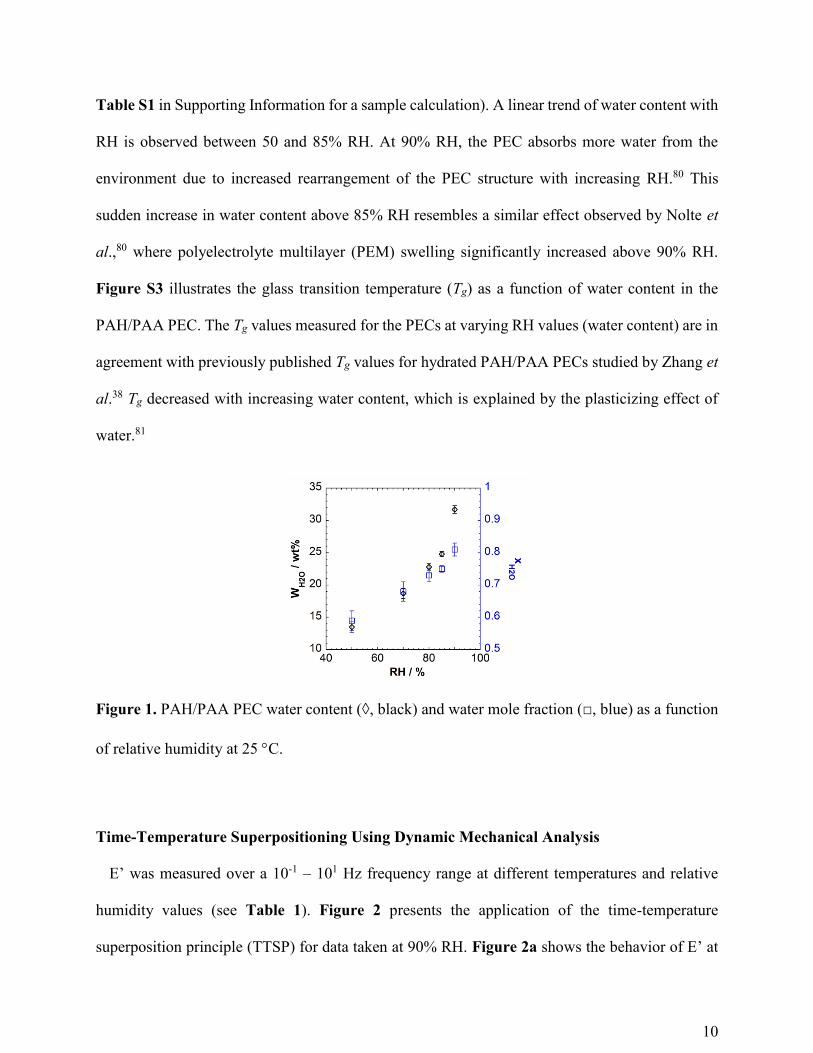
humidity values (see Table 1). Figure 2 presents the application of the time-temperature
superposition principle (TTSP) for data taken at 90% RH. Figure 2a shows the behavior of E’ at
11
different temperatures (20.0 – 55.0, ΔT = 5.0 oC, where ΔT describes the temperature interval) as
a function of frequency and where E’ decreases with increasing temperature and decreasing
frequency. This behavior can be attributed to weakening of the polymer-water hydrogen bonding
network with increasing temperature, followed by polymer chain relaxation.38 Notably, at higher
temperatures and relative humidity the sample yielded due to heating through the glass transition.
Figure 2b shows the master curve obtained after application of the TTSP with an arbitrarily chosen
reference temperature (Tref) of 40 oC, where data in Figure 2a was shifted horizontally along the
frequency axis using a temperature-dependent shift factor, aT.56 Figure 2b shows a broader
frequency range of 10-4 – 106 Hz after the application of the TTSP to data taken in a 10-1 – 101 Hz
frequency range. Therefore, TTSP allows for the study of PAH/PAA PEC mechanical behavior
over a frequency range beyond DMA capabilities (10-2 – 102 Hz).
Figure 2. Application of the time-temperature superposition principle. a) E’ data taken at 90% RH
over a 10-1 – 101 Hz frequency range and a 20.0 – 55.0 oC temperature range. b) Time-temperature
master curve made from experimental data in (a) with Tref = 40 oC. Legend in (b) applies to all
panels. E’ data taken over a 10-1 – 101 Hz frequency range for 50 - 95% RH is shown in Figure
S4. Tan delta data over the same frequency range, for all RH values, is presented in Figure S5.
12
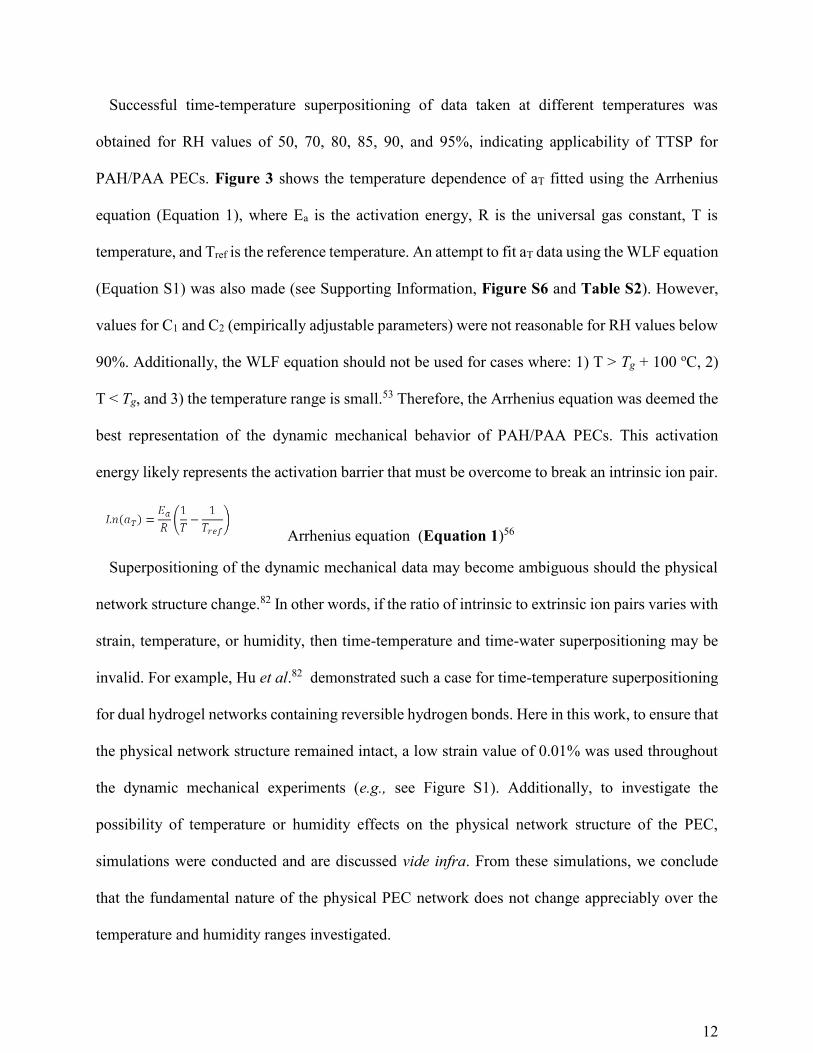
Successful time-temperature superpositioning of data taken at different temperatures was
obtained for RH values of 50, 70, 80, 85, 90, and 95%, indicating applicability of TTSP for
PAH/PAA PECs. Figure 3 shows the temperature dependence of aT fitted using the Arrhenius
equation (Equation 1), where Ea is the activation energy, R is the universal gas constant, T is
temperature, and Tref is the reference temperature. An attempt to fit aT data using the WLF equation
(Equation S1) was also made (see Supporting Information, Figure S6 and Table S2). However,
values for C1 and C2 (empirically adjustable parameters) were not reasonable for RH values below
90%. Additionally, the WLF equation should not be used for cases where: 1) T > Tg + 100 oC, 2)
T < Tg, and 3) the temperature range is small.53 Therefore, the Arrhenius equation was deemed the
best representation of the dynamic mechanical behavior of PAH/PAA PECs. This activation
energy likely represents the activation barrier that must be overcome to break an intrinsic ion pair.
Arrhenius equation (Equation 1)56
Superpositioning of the dynamic mechanical data may become ambiguous should the physical
network structure change.82 In other words, if the ratio of intrinsic to extrinsic ion pairs varies with
strain, temperature, or humidity, then time-temperature and time-water superpositioning may be
invalid. For example, Hu et al.82 demonstrated such a case for time-temperature superpositioning
for dual hydrogel networks containing reversible hydrogen bonds. Here in this work, to ensure that
the physical network structure remained intact, a low strain value of 0.01% was used throughout
the dynamic mechanical experiments (e.g., see Figure S1). Additionally, to investigate the
possibility of temperature or humidity effects on the physical network structure of the PEC,
simulations were conducted and are discussed vide infra. From these simulations, we conclude
that the fundamental nature of the physical PEC network does not change appreciably over the
temperature and humidity ranges investigated.
13
Figure 3. Temperature-dependent shift factors (aT) for different relative humidity values (Tref = 40
oC) and fits using the Arrhenius equation (dashed lines, Equation 1). 95% confidence intervals for
the slope are represented by the shaded areas: 50% RH (blue), 70% RH (red), and 80 – 95% RH
(black). The data sets for 80 – 95% RH are grouped and analyzed together because of their similar
aT trends.
The activation energy in the Arrhenius equation is related to small-scale molecular motions,56
which here likely represent the dynamic relaxation of polyelectrolyte segments facilitated by the
formation and reformation of polycation-polyanion intrinsic ion pairs. An activation energy of 379
± 35 kJ-mol-1 (95% confidence interval) was calculated for RH values between 80 and 95%, which
suggests that aT is independent of relative humidity (water content) within that range. Figure 3 also
shows activation energies of 176 ± 20 kJ-mol-1 and 78 ± 57 kJ-mol-1 for 70% RH and 50% RH,
respectively. These results suggest that, although PAH/PAA PECs at lower humidities have higher
storage moduli, the energy barriers for relaxation are lower. LaPlante and LeeSullivan discussed a
similar observation using an Arrhenius relationship in hydrated epoxy samples, for which water
could have dual stiffening/plasticization effects, depending on water content and the state of the
absorbed water (singly hydrogen bonded vs. multiply hydrogen bonded).83 Table S3 in the
14
Supporting Information presents Ea values for other materials, where a wide range of Ea values is
observed.
From examination of the trends in E’, the glass transition temperature of the PEC was inferred.
The Tg determined using DMA is usually obtained from a) a peak in the loss modulus (which
“more closely denotes the initial drop of E’ from the glassy state into the transition”) or b) a peak
in tan delta.56 Figure S7 presents E’, E’’, and tan delta data as a function of temperature for each
RH value. No peaks in E’’ or tan delta were observed, except for data taken at 90% RH where a
peak in tan delta appeared at a temperature of 50 oC. Therefore, Tg data was taken at the intersection
of two tangents for E’ and tan delta curves to capture the initial drop of E’ (Figure S7), which in
this work is referred as the onset Tg determined by DMA (onset Tg, DMA), Table 2. Onset Tg values
of 80.0, 58.7, 40.0 and, < 20.0 oC were observed for 70, 80, 85, and 90% RH values, respectively.
In general, Tg values determined by MDSC (Tg, MDSC) are in agreement with onset Tg values
determined by DMA (onset Tg, DMA).
15
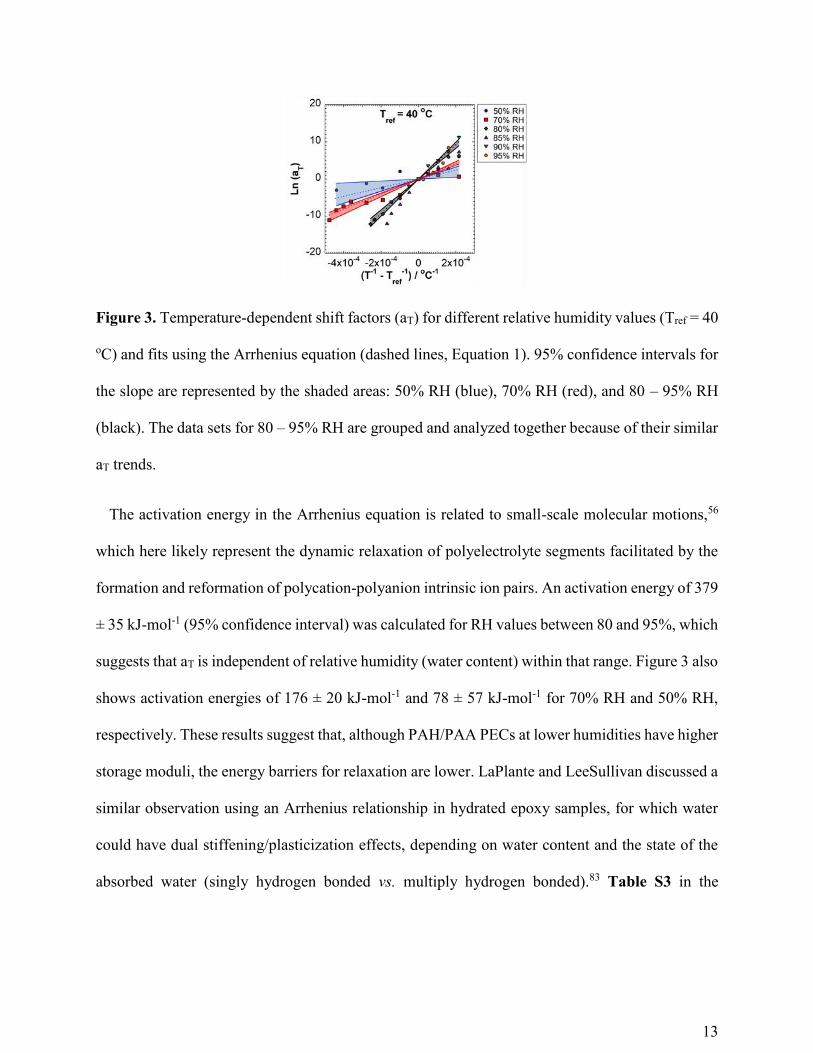
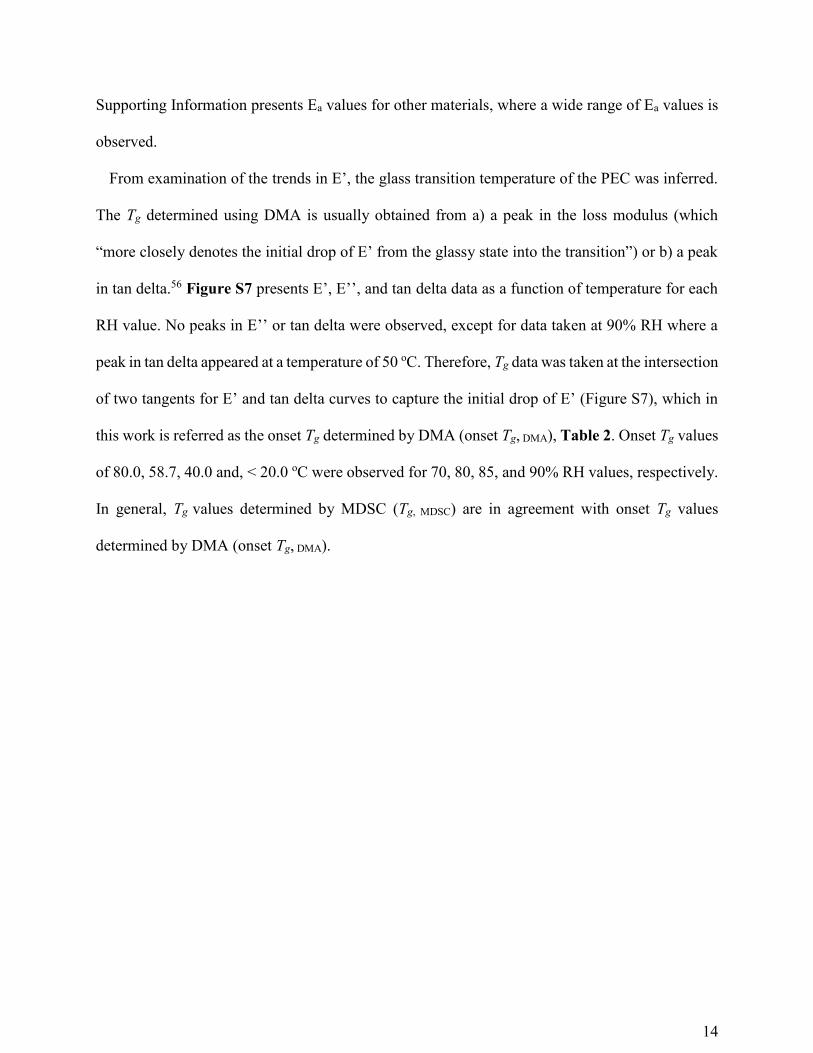
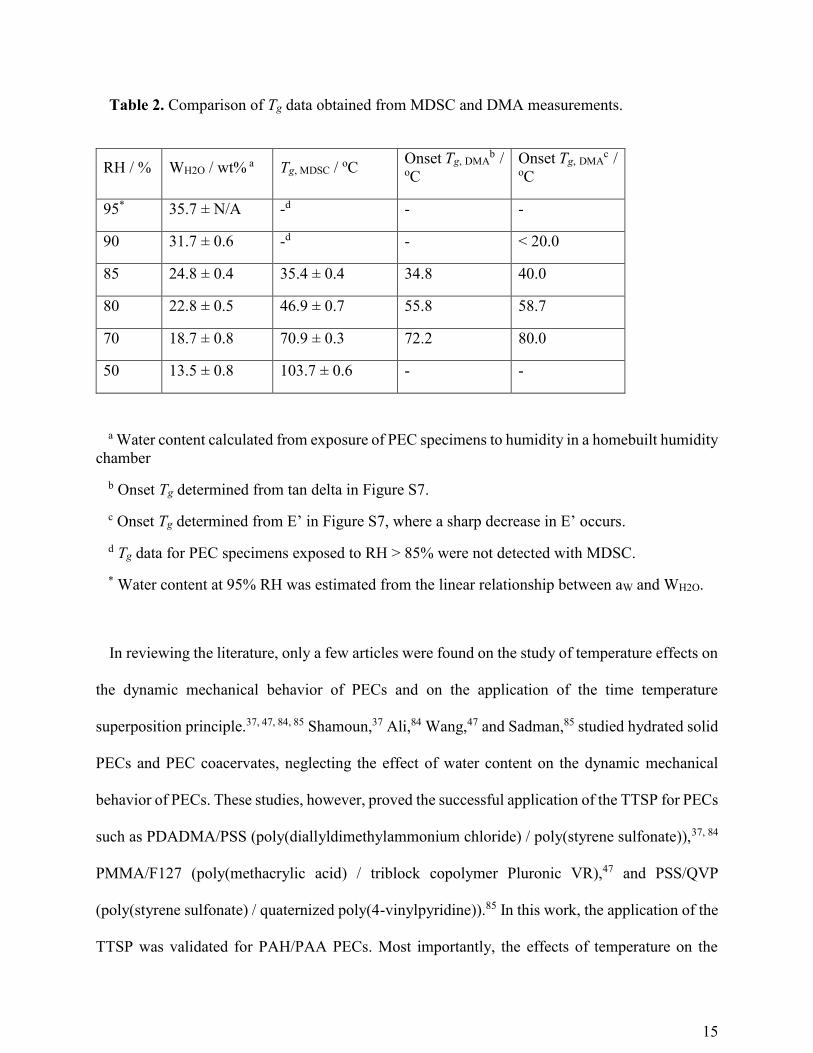
Table 2. Comparison of Tg data obtained from MDSC and DMA measurements.
RH / % WH2O / wt% a Tg, MDSC / oC Onset Tg, DMA
b / oC
Onset Tg, DMAc /
oC
95* 35.7 ± N/A -d - -
90 31.7 ± 0.6 -d - < 20.0
85 24.8 ± 0.4 35.4 ± 0.4 34.8 40.0
80 22.8 ± 0.5 46.9 ± 0.7 55.8 58.7
70 18.7 ± 0.8 70.9 ± 0.3 72.2 80.0
50 13.5 ± 0.8 103.7 ± 0.6 - -
a Water content calculated from exposure of PEC specimens to humidity in a homebuilt humidity
chamber
b Onset Tg determined from tan delta in Figure S7.
c Onset Tg determined from E’ in Figure S7, where a sharp decrease in E’ occurs.
d Tg data for PEC specimens exposed to RH > 85% were not detected with MDSC.
* Water content at 95% RH was estimated from the linear relationship between aW and WH2O.
In reviewing the literature, only a few articles were found on the study of temperature effects on
the dynamic mechanical behavior of PECs and on the application of the time temperature
superposition principle.37, 47, 84, 85 Shamoun,37 Ali,84 Wang,47 and Sadman,85 studied hydrated solid
PECs and PEC coacervates, neglecting the effect of water content on the dynamic mechanical
behavior of PECs. These studies, however, proved the successful application of the TTSP for PECs
such as PDADMA/PSS (poly(diallyldimethylammonium chloride) / poly(styrene sulfonate)),37, 84
PMMA/F127 (poly(methacrylic acid) / triblock copolymer Pluronic VR),47 and PSS/QVP
(poly(styrene sulfonate) / quaternized poly(4-vinylpyridine)).85 In this work, the application of the
TTSP was validated for PAH/PAA PECs. Most importantly, the effects of temperature on the
16
dynamic mechanical behavior of PECs were studied at different PEC hydration levels (13.5 – 35.7
wt%). Thus, providing novel information regarding the plasticizing effect of water when solid-
liked PECs are partially hydrated, emulating real ambient conditions.
Time-Water Superpositioning Using Dynamic Mechanical Analysis
Using the time-temperature master curves for the six relative humidity values investigated (50,
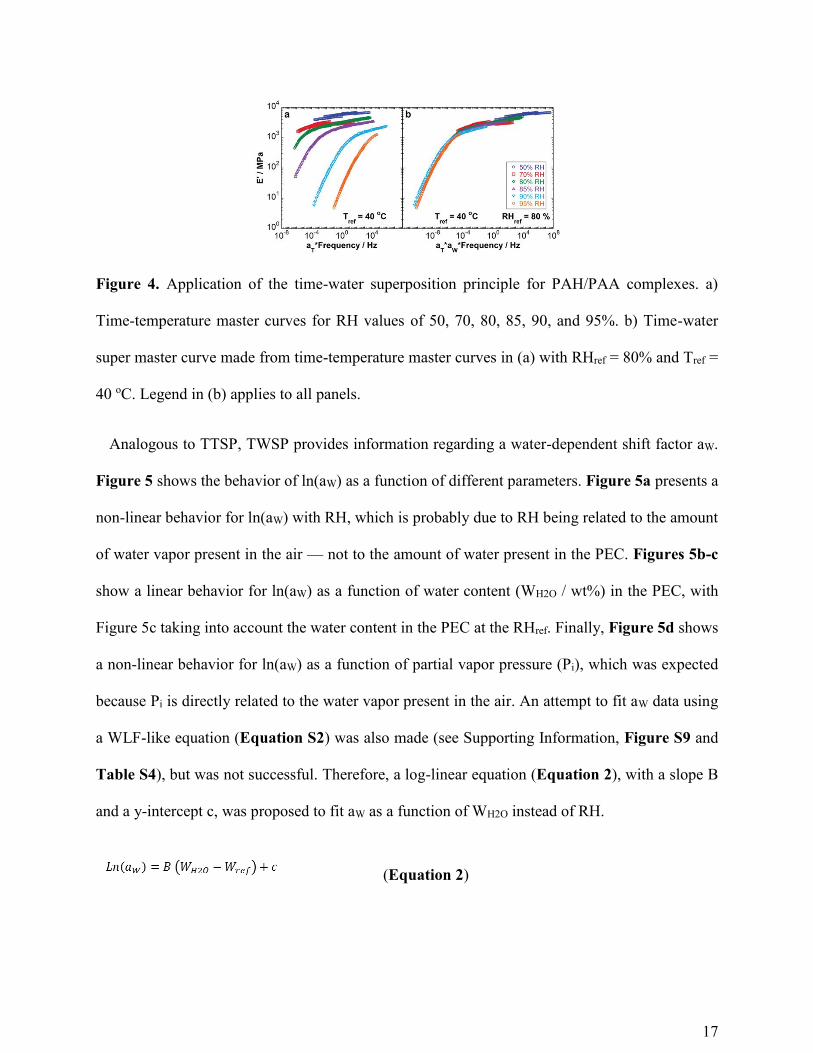
70, 80, 85, 90, and 95%), a time-water superposition principle (TWSP) was applied. Figure 4a
shows the set of time-temperature master curves in one single E’ versus frequency plot, where E’
decreases with increasing relative humidity (increasing water content). This behavior can be
attributed to an increase in free volume with increasing water content and lubrication of the
intrinsic ion pairs, which promotes structural rearrangement within the PEC.25, 51 The time-
temperature master curves were shifted horizontally along the frequency axis as TWSP was
applied for an arbitrarily chosen reference relative humidity (RHref) of 80% (22.8 wt% H2O),
Figure 4b. Due to this additional data shifting, a second shift factor was defined here as the water-
dependent shift factor, aW. The time-water super master curve shown in Figure 4b corresponds to
a doubly shifted hydrothermal master curve, which represents the time dependence of E’ at a single
reference temperature and a single reference relative humidity (water content). Therefore, the
successful construction of the time-water super master curve indicates the applicability of the time-
water superposition principle for PAH/PAA PECs. E’, E’’, and tan delta super master curves, with
Tref = 40 oC and RHref = 80%, are shown in Figure S8a. A relaxation time of about 108 sec was
observed at a crossover frequency of aTawf = 10-8 Hz. This long relaxation time could correspond
to the time required for a sufficient number of intrinsic ion pairs to rearrange, allowing for chain
or segmental relaxation. The possible relevance of a vertical shift factor (b) was explored and
deemed unnecessary, Figure S8b.
17
Figure 4. Application of the time-water superposition principle for PAH/PAA complexes. a)
Time-temperature master curves for RH values of 50, 70, 80, 85, 90, and 95%. b) Time-water
super master curve made from time-temperature master curves in (a) with RHref = 80% and Tref =
40 oC. Legend in (b) applies to all panels.
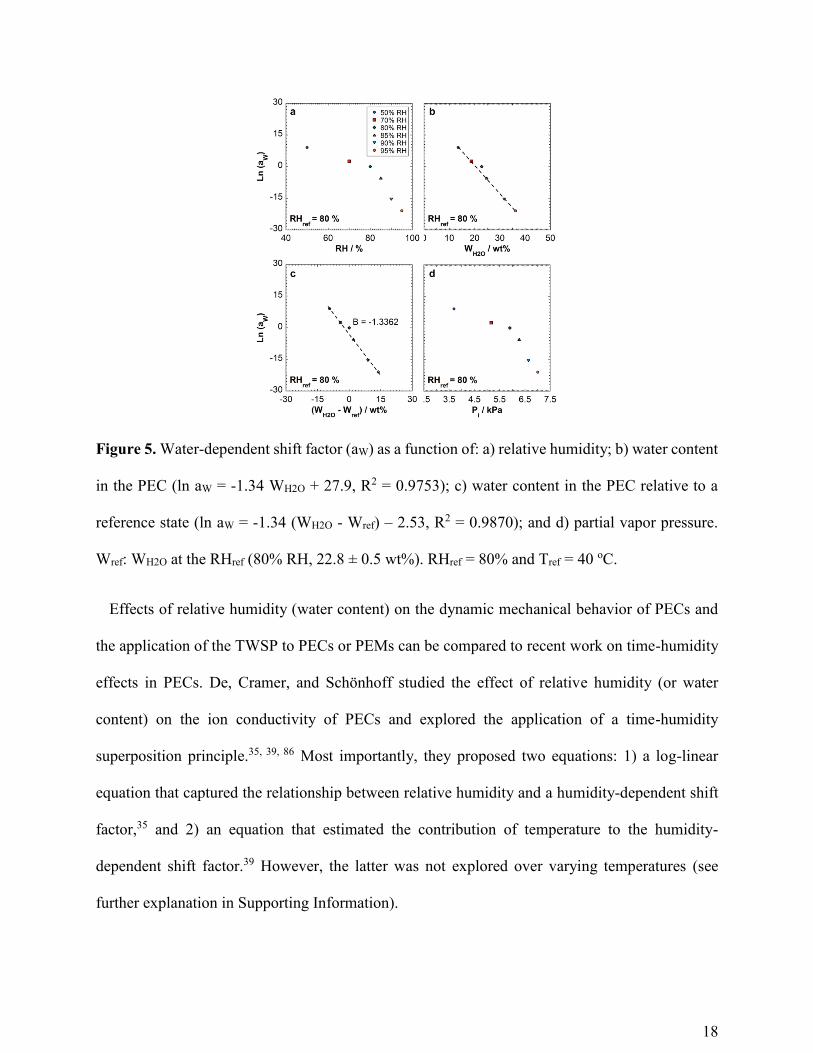
Analogous to TTSP, TWSP provides information regarding a water-dependent shift factor aW.
Figure 5 shows the behavior of ln(aW) as a function of different parameters. Figure 5a presents a
non-linear behavior for ln(aW) with RH, which is probably due to RH being related to the amount
of water vapor present in the air — not to the amount of water present in the PEC. Figures 5b-c
show a linear behavior for ln(aW) as a function of water content (WH2O / wt%) in the PEC, with
Figure 5c taking into account the water content in the PEC at the RHref. Finally, Figure 5d shows
a non-linear behavior for ln(aW) as a function of partial vapor pressure (Pi), which was expected
because Pi is directly related to the water vapor present in the air. An attempt to fit aW data using
a WLF-like equation (Equation S2) was also made (see Supporting Information, Figure S9 and
Table S4), but was not successful. Therefore, a log-linear equation (Equation 2), with a slope B
and a y-intercept c, was proposed to fit aW as a function of WH2O instead of RH.
(Equation 2)
18
Figure 5. Water-dependent shift factor (aW) as a function of: a) relative humidity; b) water content
in the PEC (ln aW = -1.34 WH2O + 27.9, R2 = 0.9753); c) water content in the PEC relative to a
reference state (ln aW = -1.34 (WH2O - Wref) – 2.53, R2 = 0.9870); and d) partial vapor pressure.
Wref: WH2O at the RHref (80% RH, 22.8 ± 0.5 wt%). RHref = 80% and Tref = 40 oC.
Effects of relative humidity (water content) on the dynamic mechanical behavior of PECs and
the application of the TWSP to PECs or PEMs can be compared to recent work on time-humidity
effects in PECs. De, Cramer, and Schönhoff studied the effect of relative humidity (or water
content) on the ion conductivity of PECs and explored the application of a time-humidity
superposition principle.35, 39, 86 Most importantly, they proposed two equations: 1) a log-linear
equation that captured the relationship between relative humidity and a humidity-dependent shift
factor,35 and 2) an equation that estimated the contribution of temperature to the humidity-
dependent shift factor.39 However, the latter was not explored over varying temperatures (see
further explanation in Supporting Information).
19
In this work, the application of the TWSP provided aW values that were fit using a log-linear
equation (Equation 2) equivalent to the equation proposed by De et al.,35 but applied here to the
dynamic mechanical behavior of a PAH/PAA PEC as a function of water content instead of RH.
Additionally, here we propose the shift factor ac to describe the combined effects of TTSP and
TWSP to our experimental data, Equation 3. Ea is the activation energy, R is the universal gas
constant, T is temperature, Tref is the reference temperature chosen during the application of the
TTSP, B and c are the slope and the y-intercept of Equation 2, WH2O is the water content in the
PEC, and Wref is the corresponding water content at the chosen reference relative humidity (RHref)
during the application of the TWSP. Although Equation 3 appears similar to the equation proposed
by Cramer et al.,39 Equation 3 can actually be used to calculate ac in order to predict a hydrothermal
master curve. In this form, it becomes clear that B (which is determined experimentally to be
negative in value) lowers the overall activation energy of the combined relaxation process with
increasing water content.
𝑎𝑐(𝑇,𝑊𝐻2𝑂) = 𝑎𝑇𝑎𝑊 = 𝑒𝑥𝑝 [𝐸𝑎
𝑅(1
𝑇−
1
𝑇𝑟𝑒𝑓) + [𝐵(𝑊𝐻2𝑂 −𝑊𝑟𝑒𝑓) + 𝑐]] (Equation 3)
As mentioned earlier, TTSP or TWSP may be inappropriate if the nature of the network exhibits
large changes over the range of temperatures and humidities investigated. Here, our concern lies
in quantifying whether the mobility of the network changes at the molecular level and whether the
number of intrinsic ion pairs changes over the measurement. Because these factors are
experimentally challenging to access in situ, we turn to molecular dynamics (MD) simulations of
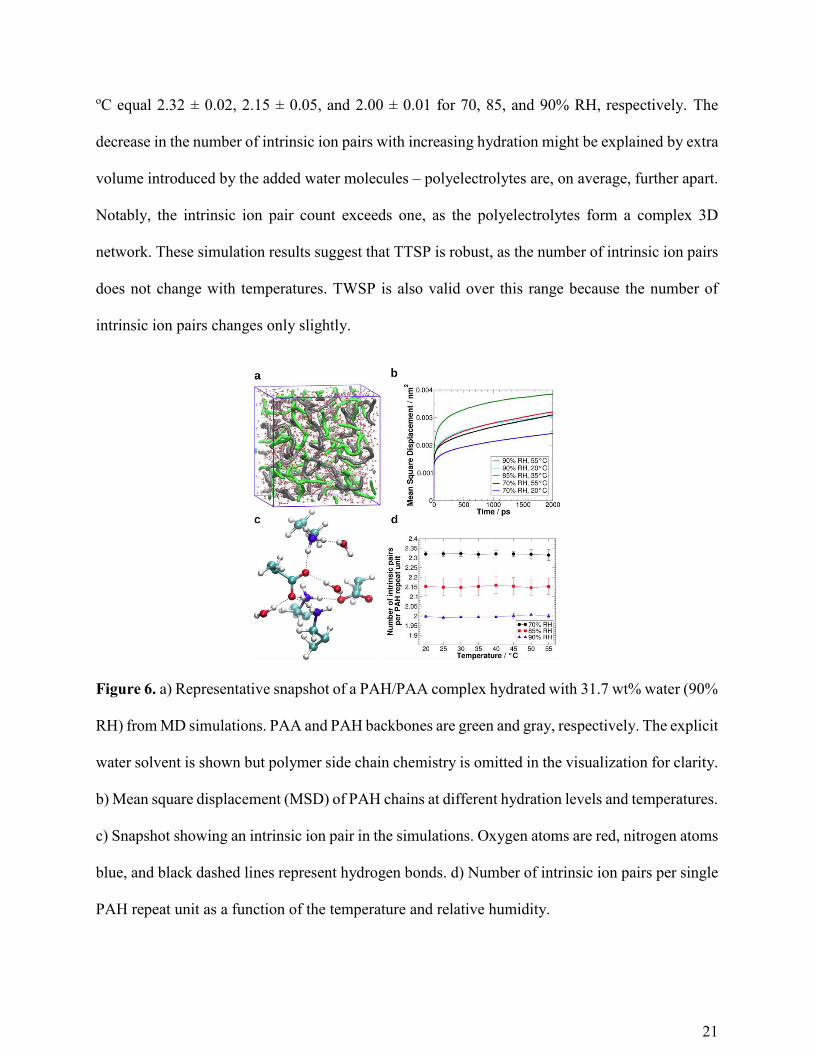
PAH/PAA PECs at corresponding water contents and temperatures. Figure 6a shows a
representative snapshot of the PAH/PAA PEC in the simulations; the polyelectrolytes are
entangled and their distribution, as well as water distribution, is relatively uniform. Figure 6b
shows a set of mean square displacement (MSD) data sets for the PAH chains within the PECs in
20
simulations at different hydration and temperature conditions. Temperature and water content have
very similar effects on the polyelectrolyte chain MSD; consequently, PAH chain mobility is
similar for 70% RH at 55°C, 85% RH at 35°C, and 90% RH at 20°C. For a comparison, MSD for
70% RH at 20°C (blue line) and 90% RH at 55°C (green line) were also included. The same
behavior was observed for PAA chains. The entire range of hydration and temperature MSD results
both for PAA and PAH is provided in Figure S10.
Overall, increasing MSD with increasing hydration and temperature suggests an increase in the
chain mobility. This is supported by a decrease in E’ with both increasing hydration and increasing
temperature as observed in the experimental DMA results. These findings provide an explanation
for why these two factors can be superposed via the hydrogen bond network in the system
presented in Figure 6c (i.e., an intrinsic ion pair site with the closest water molecules around it
and the formed hydrogen bond network). The similar responses of polyelectrolyte chain mobility
to both variables, i.e., hydration and temperature, could be related to the mobility of water
molecules in PECs. For example, we have recently found that water mobility responds similarly
for simulations of PDADMA/PSS complexes.79
The average number of intrinsic ion pairs formed by a single PAH repeat unit was calculated as
a function of the temperature and water content, Figure 6d. The absolute number values of
intrinsic ion pairs might differ slightly in simulations with different force-fields. However, as
shown in reference 87 for ion-PE binding, the qualitative results can be expected to be insensitive
of force-field. The changes in the number of intrinsic ion pairs within the studied temperature
range are systematic, but relatively small in magnitude. For example, at T = 20 oC the average
number of intrinsic ion pairs decreases slightly (from ~2.32 to ~2.00) with increasing hydration
(from 70 to 90% RH). The calculated values for intrinsic ion pairs per PAH repeat unit at T = 20
21
oC equal 2.32 ± 0.02, 2.15 ± 0.05, and 2.00 ± 0.01 for 70, 85, and 90% RH, respectively. The
decrease in the number of intrinsic ion pairs with increasing hydration might be explained by extra
volume introduced by the added water molecules – polyelectrolytes are, on average, further apart.
Notably, the intrinsic ion pair count exceeds one, as the polyelectrolytes form a complex 3D
network. These simulation results suggest that TTSP is robust, as the number of intrinsic ion pairs
does not change with temperatures. TWSP is also valid over this range because the number of
intrinsic ion pairs changes only slightly.
Figure 6. a) Representative snapshot of a PAH/PAA complex hydrated with 31.7 wt% water (90%
RH) from MD simulations. PAA and PAH backbones are green and gray, respectively. The explicit
water solvent is shown but polymer side chain chemistry is omitted in the visualization for clarity.
b) Mean square displacement (MSD) of PAH chains at different hydration levels and temperatures.
c) Snapshot showing an intrinsic ion pair in the simulations. Oxygen atoms are red, nitrogen atoms
blue, and black dashed lines represent hydrogen bonds. d) Number of intrinsic ion pairs per single
PAH repeat unit as a function of the temperature and relative humidity.
22
CONCLUSIONS
Application of superposition principles demonstrated equivalent effects of temperature and
water on the dynamic mechanical behavior of PAH/PAA PECs. Temperature and water content
strongly influenced the storage modulus, where E’ decreased with both increasing temperature and
increasing water content. The temperature-dependent shift factor (aT) followed an Arrhenius
relation, and the water-dependent shift factor (aw) followed a log-linear relation with water content
in the complex. Thus, the degree of plasticization in the PEC is controlled by its water content,
which is determined by the relative humidity.32 Consequently, the designation time-water
superposition principle (TWSP) was deemed more appropriate than the previously used time-
humidity superposition principle (THSP).
This led to the construction of a time–water super master curve (or hydrothermal master curve),
and the proposal of a shift factor that combines the effect of water and temperature, ac. Molecular
simulations indicated the robustness of the application of TTSP and TWSP to the PEC, in that the
mobility was similarly affected by temperature and water and that the number of intrinsic ion pairs
did not change significantly. These results indicate that the rheological behavior of the PAH/PAA
PECs is dominated by water and temperature. To place these findings in the context of our previous
work, it may be suggested that water facilitates polymer relaxation by plasticization and lubrication
at the intrinsic ion pair through a hydrogen bonding mechanism. Looking to the future, we plan to
examine TWSP for other systems and conditions to further examine the significance of the B
parameter from the log-linear aw relation.
23
ASSOCIATED CONTENT
Supporting Information
The Supporting Information is available free of charge on the ACS Publications website.
Supporting Information includes: strain sweeps, simulation system preparation and analysis, glass
transition temperature of PAH/PAA PECs, loss modulus and tan delta data, aT and aW data fitting,
and Ea values for other materials.
AUTHOR INFORMATION
Corresponding Author
E-mail address: [email protected]
Present Addresses
†Jerzy Haber Institute of Catalysis and Surface Chemistry, Polish Academy of Sciences,
Niezapominajek 8, PL-30239 Krakow, Poland
Author Contributions
The manuscript was written through contributions of all authors. All authors have given approval
to the final version of the manuscript.
Funding Sources
This work was supported by the National Science Foundation (Grant No. 1609696) (J.L.L.) and Academy of Finland (Grant. No. 309324) (M.S.). This work was also supported by CSC – IT
Center for Science, Finland, and RAMI – RawMatTERS Finland Infrastructure for
computational resources.
Notes
The authors declare no competing financial interest.

24
ACKNOWLEDGMENT
This work was supported by the National Science Foundation (Grant No. 1609696) (J.L.L.) and Academy of Finland (Grant No. 309324) (M.S.). This work was also supported by CSC – IT
Center for Science, Finland, and RAMI – RawMatTERS Finland Infrastructure for
computational resources.
25
REFERENCES
1. Olek, M.; Ostrander, J.; Jurga, S.; Möhwald, H.; Kotov, N.; Kempa, K.; Giersig, M.
Layer-by-Layer Assembled Composites from Multiwall Carbon Nanotubes with Different
Morphologies. Nano Letters 2004, 4 (10), 1889-1895 DOI: 10.1021/nl048950w.
2. Hyder, M. N.; Lee, S. W.; Cebeci, F. Ç.; Schmidt, D. J.; Shao-Horn, Y.; Hammond, P. T.
Layer-by-Layer Assembled Polyaniline Nanofiber/Multiwall Carbon Nanotube Thin Film
Electrodes for High-Power and High-Energy Storage Applications. ACS Nano 2011, 5 (11),
8552-8561 DOI: 10.1021/nn2029617.
3. Fávero, V. O.; Oliveira, D. A.; Lutkenhaus, J. L.; Siqueira, J. R. Layer-by-layer
nanostructured supercapacitor electrodes consisting of ZnO nanoparticles and multi-walled
carbon nanotubes. Journal of Materials Science 2018, 53 (9), 6719-6728 DOI: 10.1007/s10853-
018-2010-4.
4. Cho, C.; Song, Y.; Allen, R.; Wallace, K. L.; Grunlan, J. C. Stretchable electrically
conductive and high gas barrier nanocomposites. Journal of Materials Chemistry C 2018, 6 (8),
2095-2104 DOI: 10.1039/C7TC05495E.
5. De, S.; Lutkenhaus, J. L. Corrosion behaviour of eco-friendly airbrushed reduced
graphene oxide-poly(vinyl alcohol) coatings. Green Chemistry 2018, 20 (2), 506-514 DOI:
10.1039/C7GC02882B.
6. Jeon, J.-W.; Kwon, S. R.; Lutkenhaus, J. L. Polyaniline nanofiber/electrochemically
reduced graphene oxide layer-by-layer electrodes for electrochemical energy storage. Journal of
Materials Chemistry A 2015, 3 (7), 3757-3767 DOI: 10.1039/C4TA04697H.
26
7. Kwon, S. R.; Harris, J.; Zhou, T.; Loufakis, D.; Boyd, J. G.; Lutkenhaus, J. L.
Mechanically Strong Graphene/Aramid Nanofiber Composite Electrodes for Structural Energy
and Power. ACS Nano 2017, 11 (7), 6682-6690 DOI: 10.1021/acsnano.7b00790.
8. Kwon, S. R.; Elinski, M. B.; Batteas, J. D.; Lutkenhaus, J. L. Robust and Flexible Aramid
Nanofiber/Graphene Layer-by-Layer Electrodes. ACS Applied Materials & Interfaces 2017, 9
(20), 17125-17135 DOI: 10.1021/acsami.7b03449.
9. Kwon, S. R.; Jeon, J.-W.; Lutkenhaus, J. L. Sprayable, paintable layer-by-layer
polyaniline nanofiber/graphene electrodes. RSC Advances 2015, 5 (20), 14994-15001 DOI:
10.1039/C4RA16822D.
10. Suarez-Martinez, P. C.; Robinson, J.; An, H.; Nahas, R. C.; Cinoman, D.; Lutkenhaus, J.
L. Spray-On Polymer–Clay Multilayers as a Superior Anticorrosion Metal Pretreatment.
Macromolecular Materials and Engineering 2017, 302 (6), 1600552-n/a DOI:
10.1002/mame.201600552.
11. Suarez-Martinez, P. C.; Robinson, J.; An, H.; Nahas, R. C.; Cinoman, D.; Lutkenhaus, J.
L. Polymer-clay nanocomposite coatings as efficient, environment-friendly surface pretreatments
for aluminum alloy 2024-T3. Electrochimica Acta 2018, 260, 73-81 DOI:
https://doi.org/10.1016/j.electacta.2017.11.046.
12. Chakraborty, U.; Singha, T.; Chianelli, R. R.; Hansda, C.; Kumar Paul, P. Organic-
inorganic hybrid layer-by-layer electrostatic self-assembled film of cationic dye Methylene Blue
and a clay mineral: Spectroscopic and Atomic Force microscopic investigations. Journal of
Luminescence 2017, 187, 322-332 DOI: https://doi.org/10.1016/j.jlumin.2017.03.039.
27
13. Qiu, X.; Li, Z.; Li, X.; Zhang, Z. Flame retardant coatings prepared using layer by layer
assembly: A review. Chemical Engineering Journal 2018, 334, 108-122 DOI:
https://doi.org/10.1016/j.cej.2017.09.194.
14. Rodrigues, J. R.; Alves, N. M.; Mano, J. F. Nacre-inspired nanocomposites produced
using layer-by-layer assembly: Design strategies and biomedical applications. Materials Science
and Engineering: C 2017, 76, 1263-1273 DOI: https://doi.org/10.1016/j.msec.2017.02.043.
15. Holder, K. M.; Smith, R. J.; Grunlan, J. C. A review of flame retardant nanocoatings
prepared using layer-by-layer assembly of polyelectrolytes. Journal of Materials Science 2017,
52 (22), 12923-12959 DOI: 10.1007/s10853-017-1390-1.
16. Lutkenhaus, J. L.; Olivetti, E. A.; Verploegen, E. A.; Cord, B. M.; Sadoway, D. R.;
Hammond, P. T. Anisotropic Structure and Transport in Self-Assembled Layered Polymer−Clay
Nanocomposites. Langmuir 2007, 23 (16), 8515-8521 DOI: 10.1021/la700432p.
17. Tsurko, E. S.; Feicht, P.; Nehm, F.; Ament, K.; Rosenfeldt, S.; Pietsch, I.; Roschmann,
K.; Kalo, H.; Breu, J. Large Scale Self-Assembly of Smectic Nanocomposite Films by Doctor
Blading versus Spray Coating: Impact of Crystal Quality on Barrier Properties. Macromolecules
2017, 50 (11), 4344-4350 DOI: 10.1021/acs.macromol.7b00701.
18. O’Neal, J. T.; Bolen, M. J.; Dai, E. Y.; Lutkenhaus, J. L. Hydrogen-bonded polymer
nanocomposites containing discrete layers of gold nanoparticles. Journal of Colloid and
Interface Science 2017, 485, 260-268 DOI: https://doi.org/10.1016/j.jcis.2016.09.044.
19. Fu, J.; Wang, Q.; Schlenoff, J. B. Extruded Superparamagnetic Saloplastic
Polyelectrolyte Nanocomposites. ACS Applied Materials & Interfaces 2015, 7 (1), 895-901 DOI:
10.1021/am5074694.
28
20. Eom, T.; Woo, K.; Cho, W.; Heo, J. E.; Jang, D.; Shin, J. I.; Martin, D. C.; Wie, J. J.;
Shim, B. S. Nanoarchitecturing of Natural Melanin Nanospheres by Layer-by-Layer Assembly:
Macroscale Anti-inflammatory Conductive Coatings with Optoelectronic Tunability.
Biomacromolecules 2017, 18 (6), 1908-1917 DOI: 10.1021/acs.biomac.7b00336.
21. Hamad, F. G.; Chen, Q.; Colby, R. H. Linear Viscoelasticity and Swelling of
Polyelectrolyte Complex Coacervates. Macromolecules 2018, 51 (15), 5547-5555 DOI:
10.1021/acs.macromol.8b00401.
22. Michaels, A. S.; Miekka, R. G. Polycation-polyanion complexes: Preparation and
properties of Poly-(vinylbenzyltrimethylammonium) Poly-(styrenesulfonate). The Journal of
Physical Chemistry 1961, 65 (10), 1765-1773 DOI: 10.1021/j100827a020.
23. Porcel, C. H.; Schlenoff, J. B. Compact Polyelectrolyte Complexes: “Saloplastic”
Candidates for Biomaterials. Biomacromolecules 2009, 10 (11), 2968-2975 DOI:
10.1021/bm900373c.
24. Liu, Y.; Momani, B.; Winter, H. H.; Perry, S. L. Rheological characterization of liquid-
to-solid transitions in bulk polyelectrolyte complexes. Soft Matter 2017, DOI:
10.1039/C7SM01285C.
25. Schaaf, P.; Schlenoff, J. B. Saloplastics: Processing Compact Polyelectrolyte Complexes.
Advanced Materials 2015, 27 (15), 2420-2432 DOI: 10.1002/adma.201500176.
26. Meka, V. S.; Sing, M. K. G.; Pichika, M. R.; Nali, S. R.; Kolapalli, V. R. M.;
Kesharwani, P. A comprehensive review on polyelectrolyte complexes. Drug Discovery Today
2017, 22 (11), 1697-1706 DOI: https://doi.org/10.1016/j.drudis.2017.06.008.
27. Richardson, J. J.; Björnmalm, M.; Caruso, F. Technology-driven layer-by-layer assembly
of nanofilms. Science 2015, 348 (6233), DOI: 10.1126/science.aaa2491.
29
28. Mueller, R.; Köhler, K.; Weinkamer, R.; Sukhorukov, G.; Fery, A. Melting of
PDADMAC/PSS Capsules Investigated with AFM Force Spectroscopy. Macromolecules 2005,
38 (23), 9766-9771 DOI: 10.1021/ma0513057.
29. Jaber, J. A.; Schlenoff, J. B. Mechanical Properties of Reversibly Cross-Linked Ultrathin
Polyelectrolyte Complexes. Journal of the American Chemical Society 2006, 128 (9), 2940-2947
DOI: 10.1021/ja055892n.
30. Shamoun, R. F.; Reisch, A.; Schlenoff, J. B. Extruded Saloplastic Polyelectrolyte
Complexes. Advanced Functional Materials 2012, 22 (9), 1923-1931 DOI:
10.1002/adfm.201102787.
31. Nolte, A. J.; Rubner, M. F.; Cohen, R. E. Determining the Young's Modulus of
Polyelectrolyte Multilayer Films via Stress-Induced Mechanical Buckling Instabilities.
Macromolecules 2005, 38 (13), 5367-5370 DOI: 10.1021/ma0507950.
32. Nolte, A. J.; Treat, N. D.; Cohen, R. E.; Rubner, M. F. Effect of Relative Humidity on the
Young’s Modulus of Polyelectrolyte Multilayer Films and Related Nonionic Polymers.
Macromolecules 2008, 41 (15), 5793-5798 DOI: 10.1021/ma800732j.
33. Hariri, H. H.; Lehaf, A. M.; Schlenoff, J. B. Mechanical Properties of Osmotically
Stressed Polyelectrolyte Complexes and Multilayers: Water as a Plasticizer. Macromolecules
2012, 45 (23), 9364-9372 DOI: 10.1021/ma302055m.
34. Toda, M.; Chen, Y.; Nett, S. K.; Itakura, A. N.; Gutmann, J.; Berger, R. Thin
Polyelectrolyte Multilayers Made by Inkjet Printing and Their Characterization by
Nanomechanical Cantilever Sensors. The Journal of Physical Chemistry C 2014, 118 (15), 8071-
8078 DOI: 10.1021/jp501464j.
30
35. De, S.; Cramer, C.; Schönhoff, M. Humidity Dependence of the Ionic Conductivity of
Polyelectrolyte Complexes. Macromolecules 2011, 44 (22), 8936-8943 DOI:
10.1021/ma201949s.
36. Lyu, X.; Clark, B.; Peterson, A. M. Thermal transitions in and structures of dried
polyelectrolytes and polyelectrolyte complexes. Journal of Polymer Science Part B: Polymer
Physics 2017, 55 (8), 684-691 DOI: 10.1002/polb.24319.
37. Shamoun, R. F.; Hariri, H. H.; Ghostine, R. A.; Schlenoff, J. B. Thermal Transformations
in Extruded Saloplastic Polyelectrolyte Complexes. Macromolecules 2012, 45 (24), 9759-9767
DOI: 10.1021/ma302075p.
38. Zhang, Y.; Li, F.; Valenzuela, L. D.; Sammalkorpi, M.; Lutkenhaus, J. L. Effect of Water
on the Thermal Transition Observed in Poly(allylamine hydrochloride)–Poly(acrylic acid)
Complexes. Macromolecules 2016, 49 (19), 7563-7570 DOI: 10.1021/acs.macromol.6b00742.
39. Cramer, C.; De, S.; Schönhoff, M. Time-Humidity-Superposition Principle in Electrical
Conductivity Spectra of Ion-Conducting Polymers. Physical Review Letters 2011, 107 (2),
028301.
40. Tekaat, M.; Butergerds, D.; Schonhoff, M.; Fery, A.; Cramer, C. Scaling properties of the
shear modulus of polyelectrolyte complex coacervates: a time-pH superposition principle.
Physical Chemistry Chemical Physics 2015, 17 (35), 22552-22556 DOI: 10.1039/C5CP02940F.
41. Joshua T. O’Neal, K. G. W., Yanpu Zhang, Ian M. George, and Jodie L. Lutkenhaus.
Comparison of KBr and NaCl effects on the glass transition temperature of hydrated layer-by-
layer assemblies. The Journal of Chemical Physics 2018, 149 (16), 163317 DOI:
10.1063/1.5037491.
31
42. Zhang, Y.; Batys, P.; O’Neal, J. T.; Li, F.; Sammalkorpi, M.; Lutkenhaus, J. L. Molecular
Origin of the Glass Transition in Polyelectrolyte Assemblies. ACS Central Science 2018, 4 (5),
638-644 DOI: 10.1021/acscentsci.8b00137.
43. Zhang, Q.; Smith, J. R.; Saraf, L. V.; Hua, F. Transparent humidity sensor using cross-
linked polyelectrolyte membrane. IEEE Sensors Journal 2009, 9 (7), 854-857 DOI:
10.1109/JSEN.2009.2024055.
44. Su, P.-G.; Cheng, K.-H. Layer-by-layer assembly of mica and polyelectrolyte for use in
low-humidity sensor. Sensors and Actuators B: Chemical 2009, 137 (2), 555-560 DOI:
https://doi.org/10.1016/j.snb.2009.01.053.
45. Zhao, Q.; Lee, D. W.; Ahn, B. K.; Seo, S.; Kaufman, Y.; Israelachvili, Jacob N.; Waite, J.
H. Underwater contact adhesion and microarchitecture in polyelectrolyte complexes actuated by
solvent exchange. Nature Materials 2016, 15, 407 DOI: 10.1038/nmat4539
https://www.nature.com/articles/nmat4539#supplementary-information.
46. Reisch, A.; Roger, E.; Phoeung, T.; Antheaume, C.; Orthlieb, C.; Boulmedais, F.;
Lavalle, P.; Schlenoff, J. B.; Frisch, B.; Schaaf, P. On the Benefits of Rubbing Salt in the Cut:
Self-Healing of Saloplastic PAA/PAH Compact Polyelectrolyte Complexes. Advanced Materials
2014, 26 (16), 2547-2551 DOI: 10.1002/adma.201304991.
47. Wang, Y.; He, J.; Aktas, S.; Sukhishvili, S. A.; Kalyon, D. M. Rheological behavior and
self-healing of hydrogen-bonded complexes of a triblock Pluronic® copolymer with a weak
polyacid. Journal of Rheology 2017, 61 (6), 1103-1119 DOI: 10.1122/1.4997591.
48. Zhang, H.; Wang, C.; Zhu, G.; Zacharia, N. S. Self-Healing of Bulk Polyelectrolyte
Complex Material as a Function of pH and Salt. ACS Applied Materials & Interfaces 2016, 8
(39), 26258-26265 DOI: 10.1021/acsami.6b06776.
32
49. Cuthbert, T. J.; Jadischke, J. J.; de Bruyn, J. R.; Ragogna, P. J.; Gillies, E. R. Self-
Healing Polyphosphonium Ionic Networks. Macromolecules 2017, 50 (14), 5253-5260 DOI:
10.1021/acs.macromol.7b00955.
50. Wang, C.; Duan, Y.; Zacharia, N. S.; Vogt, B. D. A family of mechanically adaptive
supramolecular graphene oxide/poly(ethylenimine) hydrogels from aqueous assembly. Soft
Matter 2017, 13 (6), 1161-1170 DOI: 10.1039/C6SM02439D.
51. Zhang, R.; Zhang, Y.; Antila, H. S.; Lutkenhaus, J. L.; Sammalkorpi, M. Role of Salt and
Water in the Plasticization of PDAC/PSS Polyelectrolyte Assemblies. The Journal of Physical
Chemistry B 2017, 121 (1), 322-333 DOI: 10.1021/acs.jpcb.6b12315.
52. Wang, Q.; Schlenoff, J. B. The Polyelectrolyte Complex/Coacervate Continuum.
Macromolecules 2014, 47 (9), 3108-3116 DOI: 10.1021/ma500500q.
53. Instruments, T., Dynamic Mechanical Analysis: Basic Theory & Applications Training.
TA Instruments: pp 85, 92, 98, 210, 216 - 219.
54. Lutkenhaus, J. L.; Hrabak, K. D.; McEnnis, K.; Hammond, P. T. Elastomeric Flexible
Free-Standing Hydrogen-Bonded Nanoscale Assemblies. Journal of the American Chemical
Society 2005, 127 (49), 17228-17234 DOI: 10.1021/ja053472s.
55. Reisch, A.; Tirado, P.; Roger, E.; Boulmedais, F.; Collin, D.; Voegel, J.-C.; Frisch, B.;
Schaaf, P.; Schlenoff, J. B. Compact Saloplastic Poly(Acrylic Acid)/Poly(Allylamine)
Complexes: Kinetic Control Over Composition, Microstructure, and Mechanical Properties.
Advanced Functional Materials 2013, 23 (6), 673-682 DOI: 10.1002/adfm.201201413.
56. Chartoff, R. P.; Menczel, J. D.; Dillman, S. H., Dynamic Mechanical Analysis (DMA). In
Thermal Analysis of Polymers, John Wiley & Sons, Inc.: 2008; pp 401-409.
33
57. Van Gurp, M.; Palmen, J. Time-temperature superposition for polymeric blends. Rheol.
Bull 1998, 67 (1), 5-8.
58. Spruijt, E.; Cohen Stuart, M. A.; van der Gucht, J. Linear Viscoelasticity of
Polyelectrolyte Complex Coacervates. Macromolecules 2013, 46 (4), 1633-1641 DOI:
10.1021/ma301730n.
59. Spruijt, E.; Sprakel, J.; Lemmers, M.; Stuart, M. A. C.; van der Gucht, J. Relaxation
Dynamics at Different Time Scales in Electrostatic Complexes: Time-Salt Superposition.
Physical Review Letters 2010, 105 (20), 208301.
60. Fabre, V.; Quandalle, G.; Billon, N.; Cantournet, S. Time-Temperature-Water Content
equivalence on dynamic mechanical response of polyamide 6,6. Polymer 2018, 137, 22 - 29
DOI: https://doi.org/10.1016/j.polymer.2017.10.067.
61. Ishisaka, A.; Kawagoe, M. Examination of the time–water content superposition on the
dynamic viscoelasticity of moistened polyamide 6 and epoxy. Journal of Applied Polymer
Science 2004, 93 (2), 560-567 DOI: 10.1002/app.20465.
62. Zhou, S. M.; Tashiro, K.; Ii, T. Confirmation of universality of time–humidity
superposition principle for various water‐absorbable polymers through dynamic viscoelastic
measurements under controlled conditions of relative humidity and temperature. Journal of
Polymer Science Part B: Polymer Physics 2001, 39 (14), 1638-1650 DOI: 10.1002/polb.1135.
63. Marciel, A. B.; Srivastava, S.; Tirrell, M. V. Structure and rheology of polyelectrolyte
complex coacervates. Soft Matter 2018, 14 (13), 2454-2464 DOI: 10.1039/C7SM02041D.
64. ASTM D4703-16 Standard Practice for Compression Molding Thermoplastic Materials
into Test Specimens, Plaques, or Sheets. 2016.
65. Instruments, T. DMA-RH Accessory - Getting Started Guide. 2013, 13.
34
66. Shao, L.; Lutkenhaus, J. L. Thermochemical properties of free-standing electrostatic
layer-by-layer assemblies containing poly(allylamine hydrochloride) and poly(acrylic acid). Soft
Matter 2010, 6 (14), 3363-3369 DOI: 10.1039/C0SM00082E.
67. Lindahl, E.; Hess, B.; van der Spoel, D. GROMACS 3.0: a package for molecular
simulation and trajectory analysis. Molecular modeling annual 2001, 7 (8), 306-317 DOI:
10.1007/s008940100045.
68. Berendsen, H. J. C.; van der Spoel, D.; van Drunen, R. GROMACS: A message-passing
parallel molecular dynamics implementation. Computer Physics Communications 1995, 91 (1),
43-56 DOI: https://doi.org/10.1016/0010-4655(95)00042-E.
69. Jorgensen, W. L.; Tirado-Rives, J. The OPLS [optimized potentials for liquid
simulations] potential functions for proteins, energy minimizations for crystals of cyclic peptides
and crambin. Journal of the American Chemical Society 1988, 110 (6), 1657-1666.
70. Jorgensen, W. L.; Madura, J. D. Temperature and size dependence for Monte Carlo
simulations of TIP4P water. Molecular Physics 1985, 56 (6), 1381-1392 DOI:
10.1080/00268978500103111.
71. Choi, J.; Rubner, M. F. Influence of the Degree of Ionization on Weak Polyelectrolyte
Multilayer Assembly. Macromolecules 2005, 38 (1), 116-124 DOI: 10.1021/ma048596o.
72. Essmann, U.; Perera, L.; Berkowitz, M. L.; Darden, T.; Lee, H.; Pedersen, L. G. A
smooth particle mesh Ewald method. The Journal of Chemical Physics 1995, 103 (19), 8577-
8593 DOI: 10.1063/1.470117.
73. Hess, B.; Bekker, H.; Berendsen, H. J. C.; Fraaije, J. G. E. M. LINCS: A linear constraint
solver for molecular simulations. Journal of Computational Chemistry 1997, 18 (12), 1463-1472
DOI: doi:10.1002/(SICI)1096-987X(199709)18:12<1463::AID-JCC4>3.0.CO;2-H.
35
74. Miyamoto, S.; Kollman, P. A. Settle: An analytical version of the SHAKE and RATTLE
algorithm for rigid water models. Journal of Computational Chemistry 1992, 13 (8), 952-962
DOI: doi:10.1002/jcc.540130805.
75. Bussi, G.; Donadio, D.; Parrinello, M. Canonical sampling through velocity rescaling.
The Journal of Chemical Physics 2007, 126 (1), 014101 DOI: 10.1063/1.2408420.
76. Parrinello, M.; Rahman, A. Polymorphic transitions in single crystals: A new molecular
dynamics method. Journal of Applied Physics 1981, 52 (12), 7182-7190 DOI: 10.1063/1.328693.
77. Humphrey, W.; Dalke, A.; Schulten, K. VMD: Visual molecular dynamics. Journal of
Molecular Graphics 1996, 14 (1), 33-38 DOI: https://doi.org/10.1016/0263-7855(96)00018-5.
78. Martínez, L.; Andrade, R.; Birgin, E. G.; Martínez, J. M. PACKMOL: A package for
building initial configurations for molecular dynamics simulations. Journal of Computational
Chemistry 2009, 30 (13), 2157-2164 DOI: 10.1002/jcc.21224.
79. Batys, P.; Zhang, Y.; Lutkenhaus, J. L.; Sammalkorpi, M. Hydration and Temperature
Response of Water Mobility in Poly(diallyldimethylammonium)–Poly(sodium 4-
styrenesulfonate) Complexes. Macromolecules 2018, 51 (20), 8268-8277 DOI:
10.1021/acs.macromol.8b01441.
80. Secrist, K. E.; Nolte, A. J. Humidity Swelling/Deswelling Hysteresis in a Polyelectrolyte
Multilayer Film. Macromolecules 2011, 44 (8), 2859-2865 DOI: 10.1021/ma101983s.
81. Fujita, H.; Kishimoto, A. Diffusion‐controlled stress relaxation in polymers. II. Stress
relaxation in swollen polymers. Journal of Polymer Science 1958, 28 (118), 547-567 DOI:
10.1002/pol.1958.1202811806.
82. Hu, X.; Zhou, J.; Daniel, W. F. M.; Vatankhah-Varnoosfaderani, M.; Dobrynin, A. V.;
Sheiko, S. S. Dynamics of Dual Networks: Strain Rate and Temperature Effects in Hydrogels
36
with Reversible H-Bonds. Macromolecules 2017, 50 (2), 652-659 DOI:
10.1021/acs.macromol.6b02422.
83. Gabriel, L.; Pearl, L.-S. Moisture effects on FM300 structural film adhesive: Stress
relaxation, fracture toughness, and dynamic mechanical analysis. Journal of Applied Polymer
Science 2005, 95 (5), 1285-1294 DOI: doi:10.1002/app.21353.
84. Ali, S.; Prabhu, V. Relaxation Behavior by Time-Salt and Time-Temperature
Superpositions of Polyelectrolyte Complexes from Coacervate to Precipitate. Gels 2018, 4 (1),
11.
85. Sadman, K.; Wang, Q.; Chen, Y.; Keshavarz, B.; Jiang, Z.; Shull, K. R. Influence of
Hydrophobicity on Polyelectrolyte Complexation. Macromolecules 2017, 50 (23), 9417-9426
DOI: 10.1021/acs.macromol.7b02031.
86. De, S.; Ostendorf, A.; Schönhoff, M.; Cramer, C. Ion Conduction and Its Activation in
Hydrated Solid Polyelectrolyte Complexes. Polymers 2017, 9 (11), DOI:
10.3390/polym9110550.
87. Batys, P.; Luukkonen, S.; Sammalkorpi, M. Ability of the Poisson–Boltzmann equation
to capture molecular dynamics predicted ion distribution around polyelectrolytes. Physical
Chemistry Chemical Physics 2017, 19 (36), 24583-24593 DOI: 10.1039/C7CP02547E.
For Table of Contents use only
37
Time-Temperature and Time-Water Superposition Principles Applied to Poly(allylamine) / Poly(acrylic acid) Complexes Pilar C. Suarez-Martineza, Piotr Batysb,c,†, Maria Sammalkorpib and Jodie L. Lutkenhausa,*