homicide in california 2003 - department of justice · pdf filecjsc home page cjsc...
TRANSCRIPT

HOMICIDE
Bill LoCaliforDivisiBureaCRIMI
ckyer, Attorney General nia Department of Justice
on of California Justice Information Services u of Criminal Information and Analysis NAL JUSTICE STATISTICS CENTER
2003 IN CALIFORNIA
HOMICIDE
Links to:
Preface Crimes Arrests fficers Killed les Appendices
Death Penalties Peace OJustifiable Homicides Data Tab
CJSC Home Page CJSC Publications AG Home Page
Next page -->
HOMICIDE
CALIFORNIA DEPARTMENT OF JUSTICE Bill Lockyer, Attorney General
DIVISION OF CALIFORNIA JUSTICE INFORMATION SERVICES Nick Dedier, Director/CIO
Doug Smith, Deputy Director
BUREAU OF CRIMINAL INFORMATION AND ANALYSIS Jack Scheidegger, Assistant Chief
CRIMINAL JUSTICE STATISTICS CENTER Steve Galeria, Statistical Analysis Center
Debbie McLaughlin, Statistical Data Center
HOMICIDE IN CALIFORNIA, 2003 Adele Spears, Analyst
Rebecca Bowe, Graphics/Internet Tad Davis, Editor
Tricia Clark, Analyst Marie Herbert, Analyst
Debra Callahand, Technician Michael Cereceres, Technician
Roger Decker, Technician Carol Heckle, Technician
Cathy McKee, Technician Penny Miles, Technician
Mayra Morales, Technician Wisdom Ofoe, Technician
Toni Rose, Technician Cynthia Souza, Technician Mimi Stennett, Technician
Robin Tipton, Technician Rebecca Walker, Technician
Carly Wilson, Technician
The role of the Criminal Justice Statistics Center is to:
■ Collect, analyze, and report statistical data which provide valid measures of crime and the criminal justice process.
■ Examine these data on an ongoing basis to better describe crime and the criminal justice system.
■ Promote the responsible presentation and use of crime statistics.
Next page -->
ii HOMICIDE IN CALIFORNIA, 2003

CONTENTS
Narrative Introduction ........................................................................................................................................................ vii Highlights ............................................................................................................................................................ viii Homicide crimes ................................................................................................................................................. 2 Homicide arrests ................................................................................................................................................ 26 Death penalty sentences .................................................................................................................................... 32 Peace officers killed in the line of duty ................................................................................................................ 36 Justifiable homicides ........................................................................................................................................... 40 Appendices
Appendix I - Computational formulas ................................................................................................................ 89 Appendix II - Criminal justice glossary ............................................................................................................. 90
Figures and tables within narrative Homicide crimes, 1952-2003 ............................................................................................................................ 2
Violent crimes, 1994-2003 ................................................................................................................................ 3
Homicide crimes Gender of victim, 1994-2003, rate per 100,000 population ................................................................................ 4 Race/ethnic group of victim, 1994-2003, rate per 100,000 population................................................................ 4 Age of victim, 1994-2003, rate per 100,000 population ..................................................................................... 5 Gender of victim, 2003 ..................................................................................................................................... 6 Gender of victim by percent of total victims and percent of population, 2003..................................................... 6 Race/ethnic group of victim, 2003 .................................................................................................................... 7 Race/ethnic group of victim by percent of total victims and percent of population, 2003 .................................... 7 Age of victim, 2003 .......................................................................................................................................... 8 Age of victim by percent of total victims and percent of population, 2003 .......................................................... 8 Race/ethnic group of victim by gender of victim, 2003 ...................................................................................... 9 Race/ethnic group of victim by age of victim, 2003 ........................................................................................... 9 Relationship of victim to offender, 2003 ............................................................................................................ 10 Selected relationships of victims to offenders, 1994-2003 ................................................................................. 10 Gender of victim by relationship of victim to offender, 2003 ............................................................................... 11 Race/ethnic group of victim by relationship of victim to offender, 2003 .............................................................. 11 Age of victim by relationship of victim to offender, 2003 .................................................................................... 12 County by rate per 100,000 population, 2003 ................................................................................................... 13 Season of incident, 2003 ................................................................................................................................. 14 Season of incident, 1994-2003 ......................................................................................................................... 14 Race/ethnic group of victim by average daily number of incidents on weekdays and weekends, 2003 .............. 15 Age of victim by average daily number of incidents on weekdays and weekends, 2003 .................................... 15 Location of homicide, 2003 .............................................................................................................................. 16 Gender of victim by location of homicide, 2003 ................................................................................................ 16 Race/ethnic group of victim by location of homicide, 2003 ................................................................................ 17 Age of victim by location of homicide, 2003...................................................................................................... 17 Type of weapon used, 2003 ............................................................................................................................. 18 Selected types of weapons used, 1994-2003 ................................................................................................... 18 Gender of victim by type of weapon used, 2003 ............................................................................................... 19 Race/ethnic group of victim by type of weapon used, 2003............................................................................... 19 Age of victim by type of weapon used, 2003 .................................................................................................... 20 Contributing circumstance, 2003 ...................................................................................................................... 21 Selected contributing circumstance, 1994-2003 ............................................................................................... 21 Gender of victim by contributing circumstance, 2003 ....................................................................................... 22
Next page -->

CONTENTS
Race/ethnic group of victim by contributing circumstance, 2003 ..................................................................... 22 Age of victim by contributing circumstance, 2003 ............................................................................................ 23 Clearance rate, 1994-2003 .............................................................................................................................. 23
Homicide arrests Gender of arrestee, 2003 ................................................................................................................................. 26 Population in California by gender, 2003.......................................................................................................... 26 Race/ethnic group of arrestee, 2003 ................................................................................................................ 27 Population in California by race/ethnic group, 2003 ......................................................................................... 27 Age of arrestee, 2003 ...................................................................................................................................... 28 Population in California by age, 2003 ............................................................................................................... 28 Race/ethnic group of arrestee by gender of arrestee, 2003 .............................................................................. 29 Race/ethnic group of arrestee by age of arrestee, 2003 ................................................................................... 29
Death penalty sentences Persons under California sentence of death, 1978-2003 .................................................................................. 33
Peace officers killed in the line of duty Total, 1994-2003 .............................................................................................................................................. 36 Type of weapon used, 2003 ............................................................................................................................. 36 Race/ethnic group of officer by gender of officer, 2003 ..................................................................................... 37 Rate per 100,000 respective population, 1994-2003 ......................................................................................... 37
Justifiable homicides Gender of deceased, 2003 ............................................................................................................................... 40 Race/ethnic group of deceased, 2003 .............................................................................................................. 41 Age of deceased, 2003 .................................................................................................................................... 41 Location of justifiable homicide, 2003 .............................................................................................................. 42 Contributing circumstance, 2003 ..................................................................................................................... 43
Tables Violent crimes, 1994-2003, number, rate per 100,000 population, and percent change .................................... 46
Homicide crimes Gender of victim, 1994-2003, number, percent, and rate per 100,000 population ............................................. 47 Race/ethnic group of victim, 1994-2003, number, percent, and rate per 100,000 population ............................ 48 Age of victim, 1994-2003, number, percent, and rate per 100,000 population .................................................. 49 Gender of victim, 1994-2003 ............................................................................................................................ 50 Race/ethnic group of victim, 1994-2003 ........................................................................................................... 50 Age of victim, 1994-2003 ................................................................................................................................. 51 Race/ethnic group of victim by gender of victim, 2003 ..................................................................................... 51 Race/ethnic group of victim by age of victim, 2003 .......................................................................................... 52 Race/ethnic group of victim by gender and age of victim, 2003 ........................................................................ 53 Relationship of victim to offender, 1994-2003 ................................................................................................... 54 Gender and race/ethnic group of victim by relationship of victim to offender, 2003 ........................................... 55 Age of victim by relationship of victim to offender, 2003 ................................................................................... 56 County, number and rate per 100,000 population, 1994-2003 .......................................................................... 57 Season and month of incident, 1994-2003 ....................................................................................................... 61 Gender and race/ethnic group of victim by day of incident, 2003 ..................................................................... 62 Age of victim by day of incident, 2003 ............................................................................................................. 63 Location of homicide, 1994-2003 ..................................................................................................................... 64 Gender and race/ethnic group of victim by location of homicide, 2003 ............................................................. 65 Age of victim by location of homicide, 2003 ..................................................................................................... 66
Next page -->
iv HOMICIDE IN CALIFORNIA, 2003

Type of weapon used, 1994-2003 .................................................................................................................... 67 Gender and race/ethnic group of victim by type of weapon used, 2003 ............................................................ 68 Age of victim by type of weapon used, 2003 .................................................................................................... 69 Contributing circumstance, 1994-2003............................................................................................................. 70 Gender and race/ethnic group of victim by contributing circumstance, 2003 .................................................... 71 Age of victim by contributing circumstance, 2003 ............................................................................................ 72 Contributing circumstance by relationship of victim to offender, 2003 .............................................................. 73 Clearances, 1994-2003, number reported, number cleared, and clearance rate ............................................... 74
Felony arrests for selected violent offenses, 1994-2003, number, rate per 100,000 population at risk, and percent change ................................................................................................................................................ 75
Homicide arrests Gender of arrestee, 1994-2003 ........................................................................................................................ 76 Race/ethnic group of arrestee, 1994-2003 ....................................................................................................... 76 Age of arrestee, 1994-2003 .............................................................................................................................. 77 Race/ethnic group of arrestee by gender and age of arrestee, 2003 ................................................................ 77 Race/ethnic group of arrestee by gender and age of arrestee, 2003 (additional age breakdowns) .................... 78
Death penalty sentences Persons under California sentence of death, 1978-2003 .................................................................................. 79 Sentencing county by gender, race/ethnic group, and age of persons sentenced to death, 2003 .................... 80
Peace officers killed in the line of duty Homicide crimes and peace officers killed in the line of duty, 1994-2003, number and rate per 100,000 respective population .................................................................................................................................. 81 Contributing circumstance, 2003 ..................................................................................................................... 81
Justifiable homicides Gender, race/ethnic group, and age of deceased, 2003 ................................................................................... 82 Location of justifiable homicide, 2003 .............................................................................................................. 83 Contributing circumstance, 2003 ..................................................................................................................... 84 Type of weapon used, 2003 ............................................................................................................................. 84
Population Population estimates, 1952-2003 .................................................................................................................... 85
Next page -->
CONTENTS
CONTENTS v
INTRODUCTION
Homicide in California, 2003 contains information about the crime of homicide and its victims, demographic data on persons arrested for homicide, and information about the response of the criminal justice system. Information about the death penalty, the number of peace officers killed in the line of duty, and justifiable homicide is also included. Additionally, in response to interest in domestic violence, this year's edition of Homicide in California includes an expanded analysis of domestic violence-related homicide (see Pages 21 through 23).
Information displayed in this publication comes from several databases maintained by the California Department of Justice (DOJ). The primary source of information is the Homicide File, which captures willful and justifiable homicide crime data. Other databases capture information about persons arrested for homicide, death penalty sentences, and peace officers killed in the line of duty. The reader should consider that the type of data collected, and the methods used to collect these data, differ for each data set. Unless otherwise indicated, all calculations are based on the number of known incidents.
To provide the most valid data possible, the disposition section of this report has been removed. In 2001, Criminal Justice Statistics Center (CJSC) staff determined that a number of homicide arrests submitted to the DOJ's Automated Criminal History System (from which adult felony arrest disposition data are extracted) from 1997 to 2001 should have been submitted as arrests for attempted homicide. In addition, some correctly submitted attempted homicide arrests were programmatically treated as homicide arrests. As a result, more homicide arrests were counted during these years than occurred. This caused the percentage of homicide convictions to be too low and the percentage of assault convictions to be too high. (Both percentages were based on the number of adult felony arrests for homicide for which dispositions were received.) Based on CJSC staff findings, the reader is advised against using previously published disposition data from 1997 to 1999. It should be noted that the DOJ has addressed this issue and that the exclusion of disposition data does not affect crime, arrest, death penalty, nor other data included in this or past reports. When homicide disposition data are once again determined to be accurate, they will be included in this publication.
CJSC publications available in either printed or electronic format (via the Attorney General's website) are listed on the inside of the back cover. Customized statistical reports or additional statistical information may be requested by contacting the CJSC at the numbers or addresses provided there.
Next page -->
INTRODUCTION vii

HIGHLIGHTS
HOMICIDE CRIMES (see pages 2-23)
@ From 1994 to 2003, the homicide crime rate decreased 41.7 percent (11.5 to 6.7). From 2002 to 2003, homicide crimes decreased 1.5 percent in rate per 100,000 population (6.8 to 6.7). (Source: Table 1.)
@ From 2002 to 2003, homicide rates decreased for females, Hispanics, and blacks. Hispanics experienced the largest decline in rate (down 4.3 percent). (Sources: Tables 2 and 3.)
@ In 2003, the percentage of white homicide victims who were female was over twice the percentage of Hispanic or black female victims. White victims also tended to be older, Hispanic and black victims, younger. (Sources: Tables 8 and 9.)
@ From 2002 to 2003, the number of homicide victims killed by friends or acquaintances decreased 9.4 percent. The number of victims killed by strangers also decreased (14.0 percent). (Source: Table 11.)
@ In 2003, almost 25 percent of all female homicide victims were killed by their spouses. In contrast, less than 1.5 percent of male victims were killed by theirs. (Source: Table 12.)
@ Of the 35 counties for which 2003 homicide rates were calculated, Los Angeles County experienced the highest rate per 100,000 population (10.5); Marin County experienced the lowest (0.0). (Source: Table 14.)
@ From 1994 to 2003, the average number of homicides committed during the summer exceeded the average number committed during any other season. (Source: Table 15.)
@ On average, 72.3 percent of homicides committed from 1994 to 2003 were committed with firearms. Additionally, the proportionality of firearm and non-firearm weapons usage in homicide crimes during this period remained relatively stable. (Source: Table 21.)
@ In 2003, one-third of homicides were gang-related. (Source: Table 24.)
@ In 2003, the percentage of females killed in domestic violence-related homicides was over 19.5 times that of males (41.0 vs. 2.1 percent). (Source: Table 25.)
@ On average, 56.5 percent of homicides were cleared by an arrest or by "exceptional means" from 1994 to 2003. (Source: Table 28.)
Next page -->
viii HOMICIDE IN CALIFORNIA, 2003

HIGHLIGHTS
HOMICIDE ARRESTS (see pages 26-29)
@ From 1994 to 2003, the homicide arrest rate decreased 45.0 percent (12.0 to 6.6). From 2002 to 2003, homicide arrests decreased 2.9 percent in rate per 100,000 population at risk (6.8 to 6.6). (Source: Table 29.)
@ From 1994 to 2003, the overwhelming majority of homicide arrestees and victims were male. (Sources: Tables 5 and 30.)
@ From 1994 to 2003, the largest percentage of homicide arrestees and victims were Hispanic. (Sources: Tables 6 and 31.)
@ From 1994 to 2003, the largest percentage of homicide arrestees and victims were aged 18-29. (Sources: Tables 7 and 32.)
DEATH PENALTY SENTENCES (see pages 32-33)
@ By the end of 2003, there were 639 persons under sentence of death in California. Of these, 22 were sentenced in 2003. (Source: Table 35.)
PEACE OFFICERS KILLED IN THE LINE OF DUTY (see pages 36-37)
@ Since 1994, there have been 60 peace officers feloniously killed in the line of duty. Six were killed in 2003. (Source: Table N-2.)
@ Between 1994 and 2003, the homicide rate for peace officers killed in the line of duty varied from 2.9 to 16.1 per 100,000 sworn law enforcement personnel. (Source: Table 37.)
To Crimes -->
HIGHLIGHTS ix

HOMICIDE IN CALIFORNIA, 2003
CRIMESCRIMES (part 1)
Next page -->
Links to:
Preface Crimes (part 1) Crimes (part 2) Arrests Death Penalties Peace Officers Killed
Justifiable Homicides Data Tables Appendices
CJSC Home Page CJSC Publications AG Home Page

Table N-1 HOMICIDE CRIMES, 1952-2003 Number and Rate per 100,000 Population
Year(s) Number Rate
2003 ................ 2,402 6.7 2002 ................ 2,392 6.8 2001 ................ 2,201 6.3 2000 ................ 2,074 6.0 1999 ................ 2,006 5.9 1998 ................ 2,170 6.5 1997 ................ 2,579 7.8 1996 ................ 2,910 9.0 1995 ................ 3,530 11.0 1994 ................ 3,699 11.5 1993 ................ 4,095 12.9 1992 ................ 3,920 12.5 1991 ................ 3,876 12.6 1990 ................ 3,562 12.1 1989 ................ 3,159 11.0 1988 ................ 2,947 10.5 1987 ................ 2,929 10.7 1986 ................ 3,030 11.3 1985 ................ 2,781 10.7 1984 ................ 2,724 10.6 1983 ................ 2,640 10.5 1982 ................ 2,778 11.3 1981 ................ 3,140 13.1 1980 ................ 3,405 14.4 1979 ................ 2,941 12.6 1978 ................ 2,601 11.4 1977 ................ 2,481 11.1 1976 ................ 2,214 10.1 1975 ................ 2,196 10.2 1974 ................ 1,970 9.3 1973 ................ 1,862 8.9 1972 ................ 1,789 8.7 1971 ................ 1,633 8.0 1970 ................ 1,355 6.8 1969 ................ 1,376 6.9 1968 ................ 1,171 6.0 1967 ................ 1,051 5.4 1966 ................ 897 4.7 1965 ................ 892 4.8 1964 ................ 758 4.2 1963 ................ 656 3.7 1962 ................ 671 3.9 1961 ................ 609 3.7 1960 ................ 620 3.9 1959 ................ 515 3.4 1958 ................ 547 3.7 1957 ................ 497 3.5 1956 ................ 474 3.5 1955 ................ 417 3.2 1954 ................ 419 3.3 1953 ................ 276 2.3 1952 ................ 279 2.4
CRIMES HOMICIDE CRIMES
Homicide is defined by the FBI's Uniform Crime Reporting (UCR) Program as the “willful (nonnegligent) killing of one human being by another.” The homicide category comprises murder and nonnegligent manslaughter. Attempted murder, justifiable homicide, manslaughter by negligence, and suicide are excluded. Data depicting homicide in California have been collected and published for 52 years.
From 2002 to 2003:
■ The homicide rate per 100,000 population decreased 1.5 percent (6.8 to 6.7).
■ The number of homicides increased 0.4 percent (from 2,392 to 2,402).
Comparing 1994 to 2003:
■ The homicide rate per 100,000 population decreased 41.7 percent (11.5 to 6.7).
■ The number of homicides decreased 35.1 percent (from 3,699 to 2,402).
Comparing 1952 to 2003:
■ The homicide rate per 100,000 population increased 179.2 percent (2.4 to 6.7).
■ The number of homicides increased 760.9 percent (from 279 to 2,402).
@ From 2002 to 2003, the number of homicides increased slightly (0.4 percent). However, due to a larger increase in the number of persons living in California during this period, the homicide rate per 100,000 population decreased slightly (1.5 percent).
2 HOMICIDE IN CALIFORNIA, 2003

60.00.0
Figure 1 VIOLENT CRIMES, 1994-2003 Rate per 100,000 Population
800.0
600.0
400.0
200.0
40.0
20.0
0.0
RA
TE
ROBBERY
AGGRAVATED ASSAULT
FORCIBLE RAPE
HOMICIDE
94 95 96 97 98 99 00 01 02 03 YEAR
Source: Table 1.
There are four offenses classified as violent crimes by the FBI: homicide, forcible rape, robbery, and aggravated assault. For comparison, changes in the rates of the four offenses follow:
From 2002 to 2003:
■ Homicide decreased 1.5 percent (6.8 to 6.7).
■ Forcible rape decreased 4.2 percent (28.8 to 27.6.
■ Robbery decreased 3.6 percent (183.6 to 177.0).
■ Aggravated assault decreased 3.2 percent (370.0 to 358.1).
Comparing 1994 to 2003:
■ Homicide decreased 41.7 percent (11.5 to 6.7).
■ Forcible rape decreased 19.1 percent (34.1 to 27.6).
■ Robbery decreased 49.3 percent (348.9 to 177.0).
■ Aggravated assault decreased 40.1 percent (597.8 to 358.1).
@ On average, the homicide crime rate per 100,000 population accounted for approximately 1 percent of the total violent crime rate from 1994 to 2003. For comparison, the forcible rape crime rate accounted for approximately 4 percent, the robbery crime rate accounted for approxi-mately 32 percent, and the aggravated assault crime rate accounted for approximately 63 percent of the total violent crime rate during the same period.
Next page -->

60.0
40.0
BLACK
WHITE
HISPANIC
RA
TE
20.0
0.0 9594 96 97 9998 00 01 02 03
YEAR
Source: Table 3.
20.0
TOTAL MALE
FEMALE
10.0
0.0 94 95 96 97 98 99 00 01 02 03
YEAR
In 2003,
■ The total homicide rate was 6.7 per 100,000 population.
■ The male homicide rate was 4.5 times that of the female homicide rate (10.8 vs. 2.4).
■ The black homicide rate was almost 12 times thatof whites and over 3 times that of Hispanics (29.8 vs. 2.5 and 9.0, respectively).
CRIMES
Figures 2, 3, and 4 display homicide rates per 100,000 population for victims classified by gender, race/ethnic group, and age.
Figure 2 HOMICIDE CRIMES, 1994-2003 By Gender of Victim Rate per 100,000 Population
30.0
RA
TE
Comparing 1994 to 2003:
■ The male homicide rate decreased 43.2 percent and the female homicide rate decreased 36.8 percent.
■ The white homicide rate decreased 43.2 percent, the Hispanic homicide rate decreased 46.4 percent, and the black homicide rate decreased 39.6 percent.
Source: Table 2.
Figure 3 HOMICIDE CRIMES, 1994-2003 By Race/Ethnic Group of Victim Rate per 100,000 Population
@ Since 1994, homicide rates have declined considerably for both males and females (down 43.2 and 36.8 percent, respectively). Similarly, homicide rates have declined for whites, Hispanics, and blacks (down 43.2, 46.4, and 39.6 percent, respectively).
4 HOMICIDE IN CALIFORNIA, 2003

RA
TE
30.0
20.0
10.0
0.0
30-39
18-29
UNDER 18
40 AND OVER
94 95 96 97 98 99 00 01 02 03 YEAR
Source: Table 4.
Figure 4 HOMICIDE CRIMES, 1994-2003 By Age of Victim Rate per 100,000 Population
In 2003,
■ Persons aged 18-29 had the highest homicide victimization rate (19.2 per 100,000 population).
Comparing 1994 to 2003:
■ The homicide rate decreased 56.6 percent for victims under age 18, 28.9 percent for victims aged 18-29, 38.8 percent for victims aged 30-39, and 37.3 percent for victims aged 40 and over.
@ In 2003, the homicide rate for victims aged 18-29 was over 8 times that of victims under age 18, over 2 times that of victims aged 30-39, and over 5 times that of victims aged 40 and over (19.2 vs. 2.3, 9.0, and 3.7 percent, respectively).
Next page -->
CRIMES 5

50.2% 49.8%
17.9%
MALE FEMALE
Victims Population
Sources: Tables 2 and 5.
CRIMES
In 2003,
■ Males represented 82.1 percent of total homicide victims; they comprised 50.2 percent of the population.
■ Females represented 17.9 percent of total homicide victims; they comprised 49.8 percent of the population.
@ In 2003, the ratio of male to femalepopulation was approximately 1:1. The ratio of male to female homicide victimization was approximately 4:1. These ratios represent a consistent historical trend (see Tables 2 and 5).
Figure 5 HOMICIDE CRIMES, 2003 By Gender of Victim
MALE 82.1%
FEMALE 17.9%
Source: Table 5.
Figure 6 HOMICIDE CRIMES, 2003 Gender of Victim by Percent of Total Victims and Percent of Population
82.1%
6 HOMICIDE IN CALIFORNIA, 2003

44.0%
32.1% 29.8%
18.5% 12.8%
7.7%6.6%
WHITE HISPANIC BLACK OTHER
Victims Population
Sources: Tables 3 and 6.
Figure 7 HOMICIDE CRIMES, 2003 By Race/Ethnic Group of Victim
WHITE 18.5%
BLACK 29.8%
OTHER 7.7%
HISPANIC 44.0%
Source: Table 6.
Figure 8 HOMICIDE CRIMES, 2003 Race/Ethnic Group of Victim by Percent of Total Victims and Percent of Population
48.5%
In 2003,
■ Whites represented 18.5 percent of total homicide victims; they comprised 48.5 percent of the population.
■ Hispanics represented 44.0 percent of total homicide victims; they comprised 32.1 percent of the population.
■ Blacks represented 29.8 percent of total homicide victims; they comprised 6.6 percent of the population.
■ The “other” race/ethnic group category represented 7.7 percent of total homicide victims; they comprised 12.8 percent of the population.
@ In 2003, the percentage of homicide victims who were black was just over 4.5 times larger than their percentage of the population (29.8 percent vs. 6.6 percent). This difference far exceeds the disparities between homicide victims belonging to the other race/ ethnic groups shown and their percentages of the population.
Next page -->
CRIMES 7

46.1% 41.2%
28.2% 23.5%20.4%
15.8% 14.8%10.1%
UNDER 18 18-29 30-39 40 AND OVER
Victims Population
Sources: Tables 4 and 7. Note: Percentages may not add to 100.0 because of rounding.
CRIMES
In 2003,
■ 10.1 percent of total homicide victims were under age 18; this age group comprised 28.2 percent of the population.
■ 46.1 percent of total homicide victims were aged 18-29; this age group comprised 15.8 percent of the population.
■ 20.4 percent of total homicide victims were aged 30-39; this age group comprised 14.8 percent of the population.
■ 23.5 percent of total homicide victims were aged 40 and over; this age group comprised 41.2 percent of the population.
@ In 2003, the percentage of homicide victims aged 18-29 was almost 3 times larger than the percentage of the population aged 18-29 (46.1 percent vs. 15.8 percent).
Figure 9 HOMICIDE CRIMES, 2003 By Age of Victim
UNDER 18
10.1%
30-39 20.4%
40 AND OVER 23.5%
18-29 46.1%
Source: Table 7. Note: Percentages do not add to 100.0 because of rounding.
Figure 10 HOMICIDE CRIMES, 2003 Age of Victim by Percent of Total Victims and Percent of Population
8 HOMICIDE IN CALIFORNIA, 2003
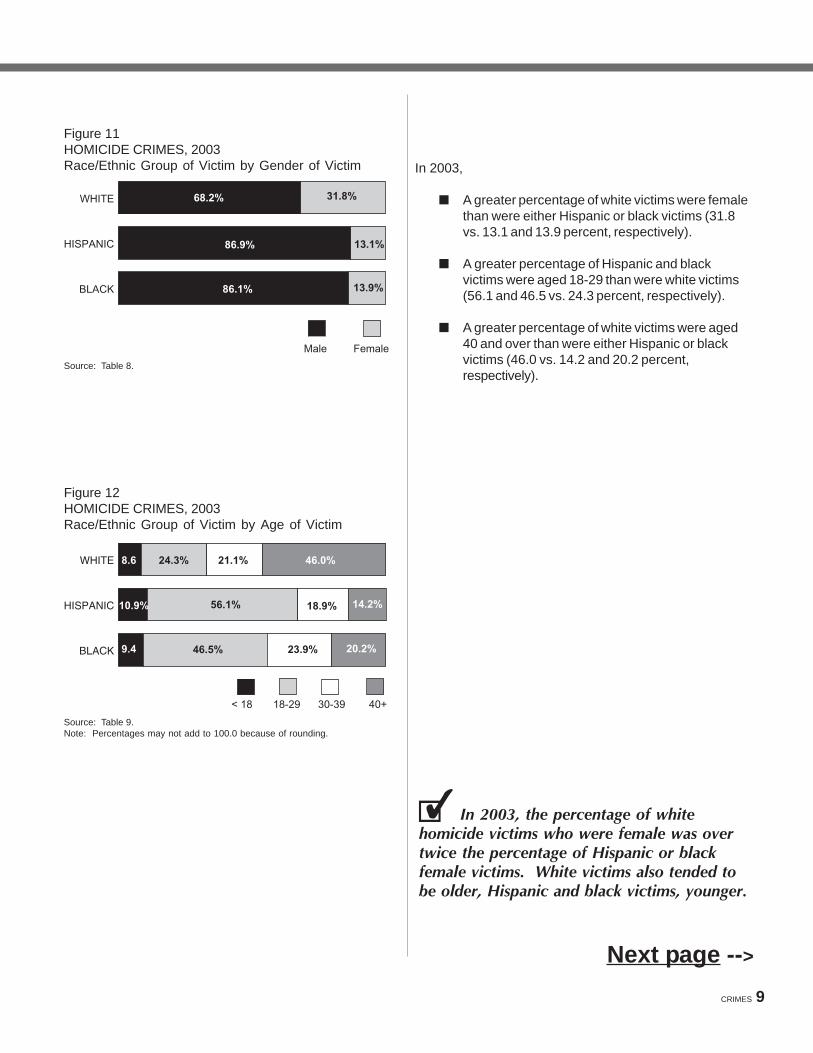
Figure 12 HOMICIDE CRIMES, 2003 Race/Ethnic Group of Victim by Age of Victim
WHITE
HISPANIC
BLACK
8.6 24.3% 21.1% 46.0%
10.9% 56.1% 18.9% 14.2%
9.4 46.5% 23.9% 20.2%
< 18 18-29 30-39 40+
Source: Table 9. Note: Percentages may not add to 100.0 because of rounding.
Figure 11 HOMICIDE CRIMES, 2003 Race/Ethnic Group of Victim by Gender of Victim
WHITE
HISPANIC
BLACK
68.2% 31.8%
86.9% 13.1%
13.9%86.1%
Male Female
Source: Table 8.
In 2003,
■ A greater percentage of white victims were female than were either Hispanic or black victims (31.8 vs. 13.1 and 13.9 percent, respectively).
■ A greater percentage of Hispanic and black victims were aged 18-29 than were white victims (56.1 and 46.5 vs. 24.3 percent, respectively).
■ A greater percentage of white victims were aged 40 and over than were either Hispanic or black victims (46.0 vs. 14.2 and 20.2 percent, respectively).
@ In 2003, the percentage of white homicide victims who were female was over twice the percentage of Hispanic or black female victims. White victims also tended to be older, Hispanic and black victims, younger.
Next page -->
CRIMES 9

CRIMES
When homicides were examined by the relationship of the victim to the offender, it was found that:
In 2003,
■ 46.5 percent of victims were friends or acquaintances of offenders.
7.2 percent of victims were spouses of offenders.
8.1 percent of victims were parents or children of offenders.
4.0 percent of the relationships of victim to offender fell into the “other relative” category.
34.2 percent of victims were strangers to offenders.
■
■
■
■ S
Comparing 1994 to 2003:
■ The proportion of homicides in which victims were friends or acquaintances of offenders decreased from 62.1 percent to 46.5 percent.
■ The proportion of homicides in which victims were strangers to offenders increased from 26.2 percent to 34.2 percent.
@ From 2002 to 2003, the number of homicide victims killed by friends or acquaintances decreased 9.4 percent. The number of victims killed by strangers also decreased (14.0 percent).
Figure 13 HOMICIDE CRIMES, 2003 By Relationship of Victim to Offender
OTHER RELATIVE
4.0%
7.2%
FRIEND, ACQUAINTANCE
46.5%
PARENT, CHILD
STRANGER 34.2%
SPOUSE8.1%
ource: Table 11.
Figure 14 HOMICIDE CRIMES, 1994-2003 By Selected Relationships of Victims to Offenders
0
25
50
75
100
03020100999897969594 YEAR
FRIEND/ACQUAINTANCE
PE
RC
EN
T
STRANGER
Source: Table 11.
10 HOMICIDE IN CALIFORNIA, 2003

52.2% 8.5 3.8%
23.9%11.7WHITE
46.3% 7.07.0 37.4% 2.3%
43.0% 4.3%3.7%
42.4%6.5
HISPANIC
BLACK
Friend, Spouse Parent, Other Strangeracquaintance child relative
Source: Table 12. Note: Percentages may not add to 100.0 because of rounding.
Figure 15 HOMICIDE CRIMES, 2003 Gender of Victim by Relationship of Victim to Offender
47.7% 1.4%
41.9% 3.1%
MALE
5.9%
15.0% 6.9%
10.724.8%42.6%FEMALE
Friend, Spouse Parent, Other Strangeracquaintance child relative
Source: Table 12.
Figure 16 HOMICIDE CRIMES, 2003 Race/Ethnic Group of Victim by Relationship of Victim to Offender
In 2003,
■ A greater percentage of female victims were spouses of offenders (24.8 percent) than were male victims (1.4 percent).
■ A greater percentage of Hispanic and black victims were strangers to offenders than were white victims (37.4 and 42.4 vs. 23.9 percent, respectively).
@ In 2003, almost 25 percent of all female homicide victims were killed by their spouses. In contrast, less than 1.5 percent of male victims were killed by theirs.
Next page -->
CRIMES 11

Figure 17 HOMICIDE CRIMES, 2003 Age of Victim by Relationship of Victim to Offender
UNDER 18
18-29
30-39
40 AND OVER
30.2% 38.4% 5.7%
25.8%
52.0% 3.3% 2.0%
0.8%
41.9%
53.2% 10.6
1.9%
32.1% 2.3%
41.1% 13.3% 9.7 28.6%7.2
Friend, Spouse Parent, Other Strangeracquaintance child relative
Source: Table 13. Note: Percentages may not add to 100.0 because of rounding.
CRIMES
In 2003,
■ The largest percentage of homicide victims under age 18 were parents or children of the offenders (38.4 percent).
■ The largest percentage of homicide victims aged 18-29, 30-39, and 40 and over were friends or aquaintances of the offenders (52.0, 53.2, and 41.1 percent, respectively).
■ A greater percentage of victims aged 40 and over were spouses of the offenders (13.3 percent) than were victims in any other age group shown.
@ In 2003, almost 40 percent of homicide victims under age 18 were parents or children of the offenders. Over 50 percent of homicide victims aged 18-29 and 30-39 were friends or acquaintances of the offenders.
12 HOMICIDE IN CALIFORNIA, 2003

Rates not calculated (see Appendix I)
More -->
Figure 18 HOMICIDE CRIMES, 2003 County by Rate per 100,000 Population
Source: Table 14.
Alameda
10.0 and over
5.0 - 9.9
0.0 - 4.9
Alpine
Amador
Butte
Calave
ras
Colusa
Contra Costa
El Dorado
Fresno
Glenn
Humboldt
Imperial
Inyo
Kern
Kings
Lake
Lassen
Los Angeles
Madera
Marin
Mariposa
Mendocino
Merced
Modoc
Mono
Monterey
Napa
Nevada
Orange
Riverside
Yuba
Placer
Plumas
Sacra-mento
San Benito
San Bernardino
San Diego
San Francisco
San Joaquin
San Luis Obispo
San Mateo
Santa Barbara
Santa Clara
Santa Cruz
Shasta
Sierra
Siskiyou
Solano
Sonoma
Stanislaus
Sutter
Tehama
Trinity
Tulare
Tuolumne
Ventura
Yolo
Del Norte
@Of the 35 counties for which 2003 homicide rates were calculated, Los Angeles County experienced the highest rate per
100,000 population (10.5); Marin County experienced the lowest (0.0).
CRIMES 13
In 2003, 10 of California’s 58 counties exceeded the statewide homicide rate of 6.7 per 100,000 population. When grouped:
■ One county had a homicide rate of 10.0 and over per 100,000 population.
■ Eighteen counties had homicide rates between 5.0 and 9.9 per 100,000 population.
■ Sixteen counties had homicide rates between 0.0 and 4.9 per 100,000 population.
■ Homicide rates were not calculated for the remaining 23 counties with populations of less than 100,000.

CRIMESCRIMES
Links to:
Preface Crimes (part 1) Crimes (part 2) Arrests Death Penalties Peace Officers Killed
Justifiable Homicides Data Tables Appendices
CJSC Home Page CJSC Publications AG Home Page
Next page -->
(part 2)
HOMICIDE IN CALIFORNIA, 2003

CRIMES
When homicides were examined by season of incident, it was found that:
In 2003,
■ The incidents leading to death occurred more often in the summer than in any other season (27.1 percent).
@ From 1994 to 2003, the average number of homicides committed during the summer exceeded the average number committed during any other season. Fall experienced the next highest average, with winter and spring following. (See Table 15.)
Figure 19 HOMICIDE CRIMES, 2003 By Season of Incident
SPRING 23.6%
FALL 25.0%
WINTER 24.3%
SUMMER 27.1%
Source: Table 15.
Figure 20 HOMICIDE CRIMES, 1994-2003 By Season of Incident
0
20
25
30
SUMMER
PE
RC
EN
T
WINTERSPRING
FALL
94 95 96 97 98 99 00 01 02 03 YEAR
Source: Table 15.
14 HOMICIDE IN CALIFORNIA, 2003

Figure 21 HOMICIDE CRIMES, 2003 Race/Ethnic Group of Victim by Average Daily Number of Incidents on Weekdays and Weekends
AV
ER
AG
ED
AIL
Y N
UM
BE
R
5.9
8.2
1.2 1.3
2.4
4.1
1.8
0.5
2.4
0.5
In 2003,
■ An average of 5.9 homicide victims were killed each weekday and 8.2 homicide victims were killed each weekend day.
■ Hispanic victims had the highest average daily number of incidents on both weekdays and weekends (2.4 and 4.1, respectively) of any race/ethnic group shown.
■ Victims aged 18-29 had the highest average daily number of incidents on both weekdays and weekends (2.6 and 4.1, respectively) of any age group shown.
TOTAL WHITE HISPANIC BLACK OTHER
Weekday Weekend
Source: Table 16. Note: Average daily number of incidents may not add to totals because of
rounding.
Figure 22 HOMICIDE CRIMES, 2003 Age of Victim by Average Daily Number of Incidents on Weekdays and Weekends
4.1
0.6 0.8
AV
ER
AG
ED
AIL
Y N
UM
BE
R
2.6
1.6
1.2 1.5
1.7
@In 2003, with the exception of the “other” race/ethnic group category, the highest average daily number of homicide incidents occurred on weekends for whites, Hispanics, blacks, and all age groups shown.
UNDER 18
Source: Table 17.
18-29 30-39 40 AND OVER
Next page -->
CRIMES 15
Weekday Weekend

19.4% 43.1% 37.5%MALE
55.8% 14.0% 30.2%FEMALE
Victim's, shared residence
Street, sidewalk
All other
Source: Table 19.
CRIMES
When homicides were examined by location of incident, it was found that:
In 2003,
■ 25.9 percent of victims were killed at their places of residence.
■ 37.8 percent of homicides occurred on streets or sidewalks.
■ 36.2 percent of homicides occurred in “all other” locations.
■ A greater percentage of males (43.1 percent) were killed on streets or sidewalks than were females (14.0 percent).
■ A greater percentage of females (55.8 percent) were killed at their places of residence than were males (19.4 percent).
@ In 2003, males were more likely to be killed on streets or sidewalks (43.1 percent) than anywhere else.
Figure 23 HOMICIDE CRIMES, 2003 By Location of Homicide
STREET, SIDEWALK 37.8%
ALL OTHER 36.2%
VICTIM'S, SHARED
RESIDENCE 25.9%
Source: Table 19. Note: Percentages do not add to 100.0 because of rounding.
Figure 24 HOMICIDE CRIMES, 2003 Gender of Victim by Location of Homicide
16 HOMICIDE IN CALIFORNIA, 2003

Figure 25 HOMICIDE CRIMES, 2003 Race/Ethnic Group of Victim by Location of Homicide
WHITE
HISPANIC
BLACK
43.0% 18.0% 39.0%
21.8% 42.7% 35.4%
19.1% 49.2% 31.7%
All other
Victim's, Street, shared residence sidewalk
Source: Table 19. Note: Percentages may not add to 100.0 because of rounding.
Figure 26 HOMICIDE CRIMES, 2003 Age of Victim by Location of Homicide
UNDER 18
18-29
30-39
40 AND OVER
38.8% 35.4% 25.8%
15.5% 45.7% 38.7%
24.7% 36.6% 38.7%
42.0% 25.0% 33.0%
Victim's, Street, All shared residence sidewalk other
Source: Table 20. Note: Percentages may not add to 100.0 because of rounding.
In 2003,
■ A greater percentage of whites than Hispanics or blacks were killed at their places of residence (43.0 vs. 21.8 and 19.1 percent, respectively).
■ A greater percentage of Hispanics and blacks were killed on streets or sidewalks than were whites (42.7 and 49.2 vs. 18.0 percent, respectively).
■ A greater percentage of victims aged 18-29 were killed on streets or sidewalks (45.7 percent) than were victims in any other age group shown.
■ A greater percentage of victims aged 40 and over were killed at their places of residence (42.0 percent) than were victims in any other age group shown.
@ Of the locations shown, white victims and victims aged 40 and over were most likely to be killed in their residences. Hispanic and black victims and victims aged 18-29 were most likely to be killed on streets or sidewalks.
Next page -->
CRIMES 17

Figure 27 HOMICIDE CRIMES, 2003 By Type of Weapon Used When homicides were examined by type of weapon
used, it was found that:
In 2003,
■ 72.8 percent resulted from the use of firearms.
■ 65.8 percent resulted from the use of handguns.
■ 7.0 percent resulted from the use of all other types of firearms.
■ 10.8 percent resulted from the use of knives.
■ 5.8 percent resulted from the use of personal weapons (hands, feet, etc.).
■ 4.9 percent resulted from the use of blunt objects (clubs, etc.).
■ 5.6 percent resulted from the use of weapons grouped in the “all other” category.
Comparing 1994 to 2003:
■ The proportion of homicides that resulted from the use of firearms decreased slightly (from 75.8 percent to 72.8 percent).
■ The proportion of homicides that resulted from the use of non-firearms increased (from 24.2 percent to 27.2 percent).
BLUNT
FIREARM 72.8%
PERSONAL WEAPON 5.8%
ALL OTHER 5.6%
KNIFE 10.8%
OBJECT 4.9%
Source: Table 21. Note: Percentages do not add to 100.0 because of rounding.
Figure 28 HOMICIDE CRIMES, 1994-2003 By Selected Types of Weapons Used
100
80
FIREARM
NON-FIREARM
PE
RC
EN
T
60
40
@ On average, 72.3 percent of homicidescommitted from 1994 to 2003 were committed with firearms. Additionally, the proportionality of firearm and non-firearm weapons usage in homicide crimes during this period remained relatively stable.
18 HOMICIDE IN CALIFORNIA, 2003
20
0 94 95 96 97 98 99 00 01 02 03
YEAR
Source: Table 21.
CRIMES

MALE 78.3% 9.2
4.9% 4.3%
FEMALE 47.6% 18.3% 10.0 7.4 16.7%
Firearm Knife Personal Blunt All weapon object other
Source: Table 22.
Source: Table 22. Note: Percentages may not add to 100.0 because of rounding.
Figure 30 HOMICIDE CRIMES, 2003 Race/Ethnic Group of Victim by Type of Weapon Used
WHITE 47.8% 16.2% 14.0% 9.4 12.6%
76.9% 11.2
5.0%
83.9% 6.2
3.5% 3.4%
HISPANIC
4.1%
BLACK
2.5% 3.2%
Firearm Knife Personal Blunt All weapon object other
Figure 29 HOMICIDE CRIMES, 2003 Gender of Victim by Type of Weapon Used
3.3%
In 2003,
■ A greater percentage of males (78.3 percent) were killed with firearms than were females (47.6 percent).
■ A greater percentage of females (35.7 percent) were killed with knives, personal weapons, or blunt objects than were males (18.5 percent).
■ A greater percentage of Hispanics and blacks were killed with firearms than were whites (76.9 and 83.9 vs. 47.8 percent, respectively).
@ In 2003, Hispanics and blacks were far more likely than whites to be killed with firearms than with any other type of weapon (76.9 and 83.9 vs. 47.8 percent, respectively).
Next page -->
CRIMES 19

Figure 31 HOMICIDE CRIMES, 2003 Age of Victim by Type of Weapon Used
UNDER 18
0.9%
61.5%
5.0%
4.6% 12.6%16.3%
18-29 85.5% 8.8
1.5% 3.3%
30-39
4.2% 4.8%
74.0% 4.6%
12.5%
40 AND OVER 51.8% 10.9 8.116.3% 12.9%
Firearm Knife Personal Blunt All weapon object other
Source: Table 23. Note: Percentages may not add to 100.0 because of rounding.
In 2003,
■ A greater percentage of victims aged 18-29 were killed with firearms (85.5 percent) than were victims in any other age group shown.
■ A lower percentage of victims aged 40 and over were killed with firearms (51.8 percent) than were victims in any other age group shown.
@ In 2003, over 85 percent of homicide victims aged 18-29 were killed with firearms.
CRIMES
20 HOMICIDE IN CALIFORNIA, 2003

Figure 32 HOMICIDE CRIMES, 2003 By Contributing Circumstance
RAPE, ROBBERY, BURGLARY
DRUG- 8.1%RELATED
5.2%
ARGUMENT 42.0%
GANG-RELATED 33.6%
ALL OTHER 11.2%
9.4% 32.6%
Domestic All violence- other related arguments
argument Source: Table 24. Note: Percentages do not add to 100.0 because of rounding.
Figure 33 HOMICIDE CRIMES, 1994-2003 By Selected Contributing Circumstance
40
30
20
10
0
Source: Table 24.
GANG-RELATED
DRUG-RELATED
DOMESTIC VIOLENCE-RELATED ARGUMENT
PE
RC
EN
T
94 95 96 97 98 99 00 01 02 03 YEAR
When homicides were examined by contributing circumstance, it was found that:
In 2003,
■ 8.1 percent occurred as a result of a rape, robbery, or burglary.
■ 42.0 percent occurred as a result of an argument.
■ 9.4 percent occurred as a result of a domestic violence-related argument.
■ 32.6 percent occurred as a result of all other types of arguments.
■ 33.6 percent were gang-related.
■ 5.2 percent were drug-related.
■ 11.2 percent occurred as a result of “all other” contributing circumstances.
Comparing 1994 to 2003:
■ The percentage of homicides in which the contributing circumstance was a domestic violence-related argument increased from 7.1 percent to 9.4 percent.
■ The percentage of homicides in which the contributing circumstance was gang-related increased from 27.7 percent to 33.6 percent.
■ The percentage of homicides in which the contributing circumstance was drug-related decreased from 8.1 percent to 5.2 percent.
@ In 2003, one-third of homicides were gang-related.
Next page -->
CRIMES 21

CRIMES
In 2003,
■ A greater percentage of females (41.0 percent) were victims of domestic violence-related homicides than were males (2.1 percent).
■ A greater percentage of males (39.4 percent) were victims of gang-related homicides than were females (8.3 percent).
■ A greater percentage of whites were victims of domestic violence-related homicides than were Hispanics or blacks (17.5 vs. 7.1 and 5.9 percent, respectively).
■ A greater percentage of Hispanics and blacks were victims of gang-related homicides than were whites (41.5 and 44.6 vs. 3.7 percent, respectively).
@ In 2003, the percentage of females killed in domestic violence-related homicides was over 19.5 times that of males (41.0 vs. 2.1 percent). The percentages of Hispanics or blacks killed in gang-related homicides were over 11 times the percentage of whites killed in gang-related incidents (41.5 and 44.6 vs. 3.7 percent, respectively).
Figure 34 HOMICIDE CRIMES, 2003 Gender of Victim by Contributing Circumstance
MALE
FEMALE
8.3 34.8% 5.9%
9.639.4%
5.4% 41.0%
2.1%
20.1%23.1%
2.1%
8.3
Robbery, Domestic All Gang- Drug- All burglary violence- other related related other
related arguments argument
Source: Table 25. Notes: Percentages may not add to 100.0 because of rounding.
Figures 32, 35, and 36 include rape with robbery and burglary. However, for a more relevant comparison between male and female victims, rape is included in the “all other” category in Figure 34. In 2003, 1.9 percent of homicide crimes involving females were rape-related.
Figure 35 HOMICIDE CRIMES, 2003 Race/Ethnic Group of Victim by Contributing Circumstance
WHITE
HISPANIC
BLACK
10.5 47.1% 5.2%
16.0%
3.7%
6.8 30.9% 4.3%
9.541.5%
26.9% 5.8%
10.544.6%
17.5%
7.1
5.9% 6.3
Rape, Domestic All Gang- Drug- All robbery, violence- other related related other burglary related arguments
argument
Source: Table 25. Note: Percentages may not add to 100.0 because of rounding.
22 HOMICIDE IN CALIFORNIA, 2003

Figure 36 HOMICIDE CRIMES, 2003 Age of Victim by Contributing Circumstance
UNDER 5
5-17
18-29
30-39
40 AND OVER
1.4%
16.6%
8.290.4%
2.0%
19.6% 7.4 7.460.8%
26.8% 55.2% 7.8
4.7%
7.9 42.7% 5.329.0%
18.6% 45.6% 7.711.5
2.7%
5.4
15.0%
Rape, robbery, burglary
Domestic violence-related
All other
arguments
Gang-, drug-
related
Child abuse
All other
argument
Source: Table 26. Note: Percentages may not add to 100.0 because of rounding.
Figure 37 HOMICIDE CRIMES CLEARED, 1994-2003 Clearance Rate
80.0
60.0
40.0
20.0
0.0
Source: Table 28. Note: A clearance rate is the percentage of crimes (homicides) reported that
have been cleared. It is calculated by dividing the number of homicides cleared by the number of homicides reported. The result is multiplied by 100. Please see “Appendix II - Criminal Justice Glossary” for a detailed explanation of clearances.
CLE
AR
AN
CE
RA
TE
94 95 96 97 98 99 00 01 02 03 YEAR
In 2003,
■ Most homicide victims under age 5 were killed as a result of child abuse (90.4 percent).
■ The majority of homicide victims aged 5-17 and aged 18-29 were killed as a result of gang- or drug-related activities (60.8 and 55.2 percent, respectively).
■ The majority of homicide victims aged 30-39 and aged 40 and over were killed as a result of domestic violence-related and all other arguments (57.8 and 62.2 percent, respectively).
@ On average, 56.5 percent of homicides were cleared by an arrest or by “exceptional means” from 1994 to 2003.
More -->
CRIMES 23

ARRESTS
Links to:
Preface Crimes Arrests Death Penalties Peace Officers Killed
Justifiable Homicides Data Tables Appendices
CJSC Home Page CJSC Publications AG Home Page
Next page -->
ARRESTS
HOMICIDE IN CALIFORNIA, 2003

ARRESTS
HOMICIDE ARRESTS
Unlike crimes, which are classified by nationwide Uniform Crime Reporting (UCR) standards, arrests are reported by California statute definition of the offense.1
This may cause some differences in the definitions of certain crimes and the reporting of the arrests for those crimes. For instance, the California definition of a homicide arrest includes murder and nonvehicular manslaughter. The federal definition of a homicide crime includes murder and nonnegligent (nonaccidental) manslaughter.
All California law enforcement agencies report arrest and citation information to the California Department of Justice on the “Monthly Arrest and Citation Register,” which lists each arrestee; includes information about age, gender, and race/ethnic group; and specifies the “most serious” arrest offense and law enforcement disposition.
In 2003, of 1,839 arrests for homicide:
■ 88.5 percent (1,627) of arrestees were male.
■ 11.5 percent (212) of arrestees were female.
@ In 2003, nearly 9 out of 10 homicide arrestees were male (88.5 percent).
1 The following penal codes for homicide arrest offenses were valid at the time of the closeout of the 2003 arrest offense code file: 128, 187(a), 189, 192(a), 192(b), 193(a), 193(b), 273ab, 399, and 12310(a).
Figure 38 HOMICIDE ARRESTS, 2003 By Gender of Arrestee
MALE 88.5%
FEMALE 11.5%
Source: Table 30.
Figure 39 POPULATION IN CALIFORNIA, 2003 By Gender
MALE 50.2%
FEMALE 49.8%
Source: Table 2.
26 HOMICIDE IN CALIFORNIA, 2003

Figure 40 HOMICIDE ARRESTS, 2003 By Race/Ethnic Group of Arrestee
WHITE 23.1%
BLACK 24.8%
HISPANIC 44.2%
Figure 41 POPULATION IN CALIFORNIA, 2003 By Race/Ethnic Group
WHITE 48.5%
OTHER 12.8%
HISPANIC 32.1%
OTHER 8.0%
Source: Table 31. Note: Percentages do not add to 100.0 because of rounding.
BLACK 6.6%
Source: Table 3.
In 2003, of 1,839 arrests for homicide:
■ 23.1 percent (424) of arrestees were white.
■ 44.2 percent (812) of arrestees were Hispanic.
■ 24.8 percent (456) of arrestees were black.
■ 8.0 percent (147) of arrestees fell into the “other” race/ethnic group category.
The subjectivity of the classification and labeling process must be considered in the analysis of race/ethnic group data. As commonly used, race refers to large populations which share certain similar physical characteristics such as skin color. Because these physical characteristics can vary greatly within groups as well as between groups, determination of race is frequently, by necessity, subjective. Ethnicity refers to cultural heritage and can cross racial lines. For example, the ethnic designation "Hispanic" includes persons of any race. Most commonly, self-identification of race/ethnicity is used in the classification and labeling process.
@ In 2003, the largest percentage of homicide arrestees were Hispanic (44.2 percent).
Next page -->
ARRESTS 27

ARRESTS
In 2003, of 1,839 arrests for homicide:
■ 9.1 percent (167) of arrestees were under age 18.
58.6 percent (1,077) of arrestees were aged 18-29.
17.7 percent (326) of arrestees were aged 30-39.
14.6 percent (269) of arrestees were aged 40 and over.
■
■
■
@ In 2003, the majority of homicide arrestees were aged 18-29 (58.6 percent).
Figure 42 HOMICIDE ARRESTS, 2003 By Age of Arrestee
UNDER 18 28.2%
30-39 14.8%
40 AND OVER 41.2%
18-29 15.8%
UNDER 18
9.1%
30-39 17.7%
40 AND OVER 14.6%
18-29 58.6%
Figure 43 POPULATION IN CALIFORNIA, 2003 By Age
Source: Table 32.
Source: Table 4.
28 HOMICIDE IN CALIFORNIA, 2003

Figure 44 HOMICIDE ARRESTS, 2003 Race/Ethnic Group of Arrestee by Gender of Arrestee
BLACK
HISPANIC
WHITE
Male Female
79.7% 20.3%
8.791.3%
8.691.4%
Source: Table 33.
Figure 45 HOMICIDE ARRESTS, 2003 Race/Ethnic Group of Arrestee by Age of Arrestee
4.5%
BLACK
HISPANIC
WHITE
< 18 18-29 30-39 40+
8.6
28.8%40.3% 26.4%
67.7% 14.8%
61.0%11.0
8.9
11.416.7%
Source: Table 33. Note: Percentages may not add to 100.0 because of rounding.
In 2003,
■ Homicide arrestees for all three race/ethnic groups shown were predominately male.
■ A greater percentage of white arrestees were female than were Hispanic or black arrestees (20.3 vs. 8.7 and 8.6 percent, respectively).
And,
■ A greater percentage of white arrestees were aged 40 and over than were Hispanic or black arrestees (28.8 vs. 8.9 and 11.4 percent, respectively).
■ Regardless of race/ethnic group, the largest percentage of homicide arrestees fell into the “18-29” age category.
More -->
ARRESTS 29

Justifiable Homicides Data Tables Appendices fficers Killed
Links to:
Preface Crimes Arrests Death Penalties Peace O
CJSC Home Page CJSC Publications AG Home Page
Next page -->
DEATH PENALTYSENTENCES
DEATH PENALTY SENTENCES
HOMICIDE IN CALIFORNIA, 2003

DEATH PENALTIES
DEATH PENALTY SENTENCES
This section contains information about persons sentenced to death in California courts in 2003. Death penalty data were extracted from the 2003 Offender-Based Transaction Statistics system. For detailed information regarding the death penalty and the criteria by which a person can be sentenced to death, refer to California Penal Code sections 190 through 190.9.
32 HOMICIDE IN CALIFORNIA, 2003
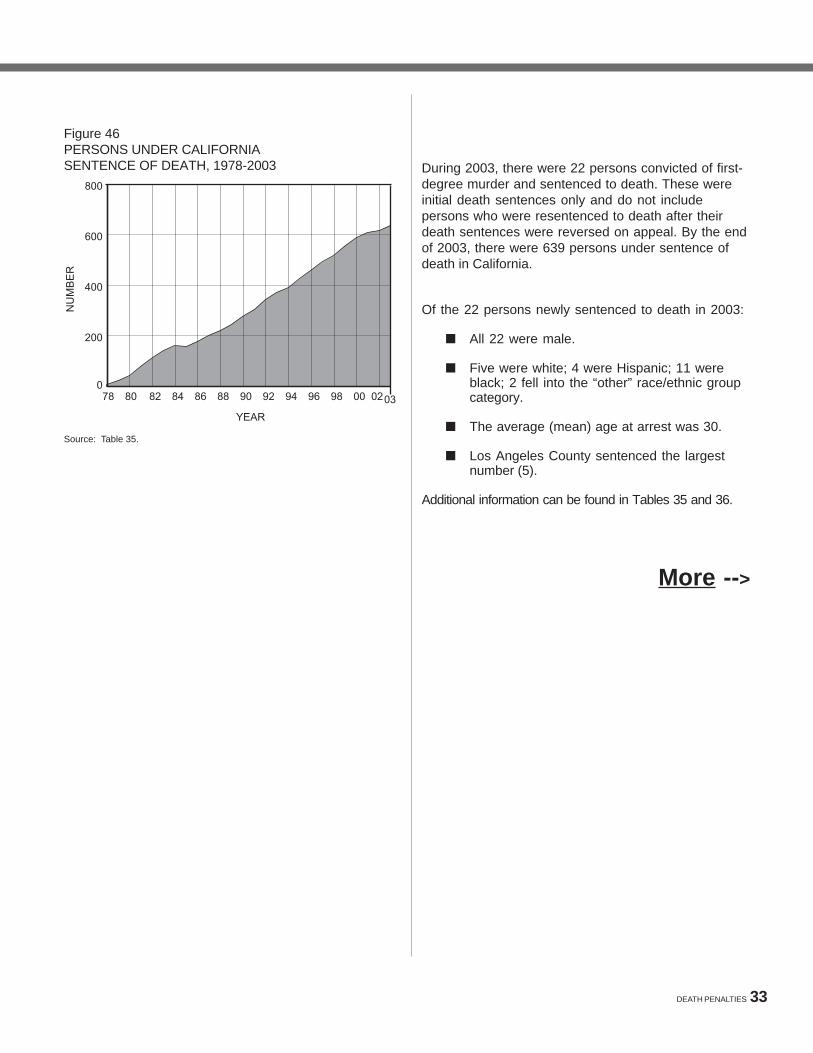
Figure 46 PERSONS UNDER CALIFORNIA SENTENCE OF DEATH, 1978-2003
00 0203 0
200
400
600
800
9896949290888684828078
YEAR
NU
MB
ER
Source: Table 35.
During 2003, there were 22 persons convicted of first-degree murder and sentenced to death. These were initial death sentences only and do not include persons who were resentenced to death after their death sentences were reversed on appeal. By the end of 2003, there were 639 persons under sentence of death in California.
Of the 22 persons newly sentenced to death in 2003:
■ All 22 were male.
■ Five were white; 4 were Hispanic; 11 wereblack; 2 fell into the “other” race/ethnic group category.
■ The average (mean) age at arrest was 30.
■ Los Angeles County sentenced the largestnumber (5).
Additional information can be found in Tables 35 and 36.
More -->
DEATH PENALTIES 33

Links to:
Preface Crimes Arrests Death Penalties Peace Officers Killed
Justifiable Homicides Data Tables Appendices
CJSC Home Page CJSC Publications AG Home Page
Next page -->
PEACE OFFICERSKILLED IN THELINE OF DUTY
PEACE OFFICERS KILLED IN THE LINE OF DUTY
HOMICIDE IN CALIFORNIA, 2003
Number ofNumber of Year(s) officers killedofficers killed
Total .............................. 60
2003 .......................... 6 2002 .......................... 4 2001 .......................... 6 2000 .......................... 2 1999 .......................... 4
1998 .......................... 7 1997 .......................... 7 1996 .......................... 5 1995 .......................... 10 1994 .......................... 9
PEACE OFFICERS KILLED
Type ofweapon used Total Offender’s Officer’s
Total ..................... 6 5 1
Handgun .......... Rifle .................
3 1
3 1
0 0
Police baton .... 1 0 1 Vehicle ............ 1 1 0
PEACE OFFICERS KILLED IN THE LINE OF DUTY
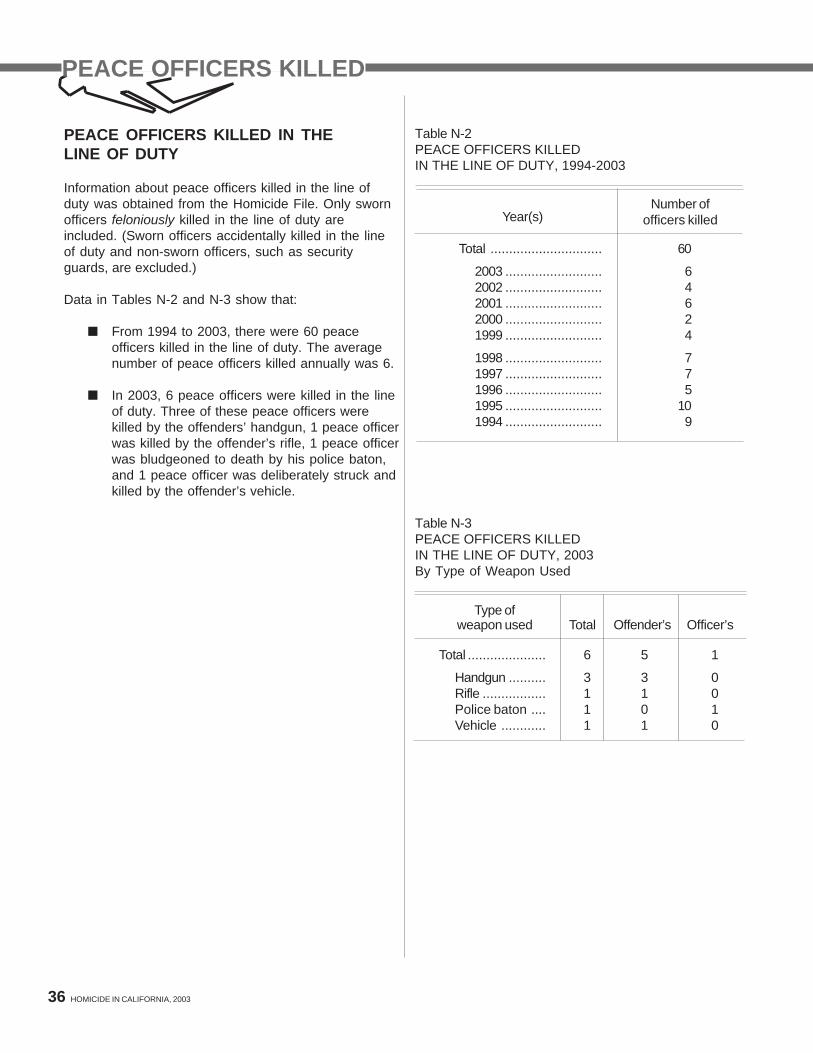
Information about peace officers killed in the line of duty was obtained from the Homicide File. Only sworn officers feloniously killed in the line of duty are included. (Sworn officers accidentally killed in the line of duty and non-sworn officers, such as security guards, are excluded.)
Data in Tables N-2 and N-3 show that:
■ From 1994 to 2003, there were 60 peace officers killed in the line of duty. The average number of peace officers killed annually was 6.
In 2003, 6 peace officers were killed in the line of duty. Three of these peace officers were killed by the offenders’ handgun, 1 peace officerwas killed by the offender’s rifle, 1 peace officerwas bludgeoned to death by his police baton, and 1 peace officer was deliberately struck and killed by the offender’s vehicle.
■
Table N-2 PEACE OFFICERS KILLED IN THE LINE OF DUTY, 1994-2003
Table N-3 PEACE OFFICERS KILLED IN THE LINE OF DUTY, 2003 By Type of Weapon Used
36 HOMICIDE IN CALIFORNIA, 2003
40.0
30.0
20.0
10.0
0.0 GENERAL POPULATION
PEACE OFFICERS
94 95 96 97 98 99 00 01 02 03 YEAR
Source: Table 37.
RA
TE
PE
R 1
00,0
00R
ES
PE
CT
IVE
PO
PU
LAT
ION
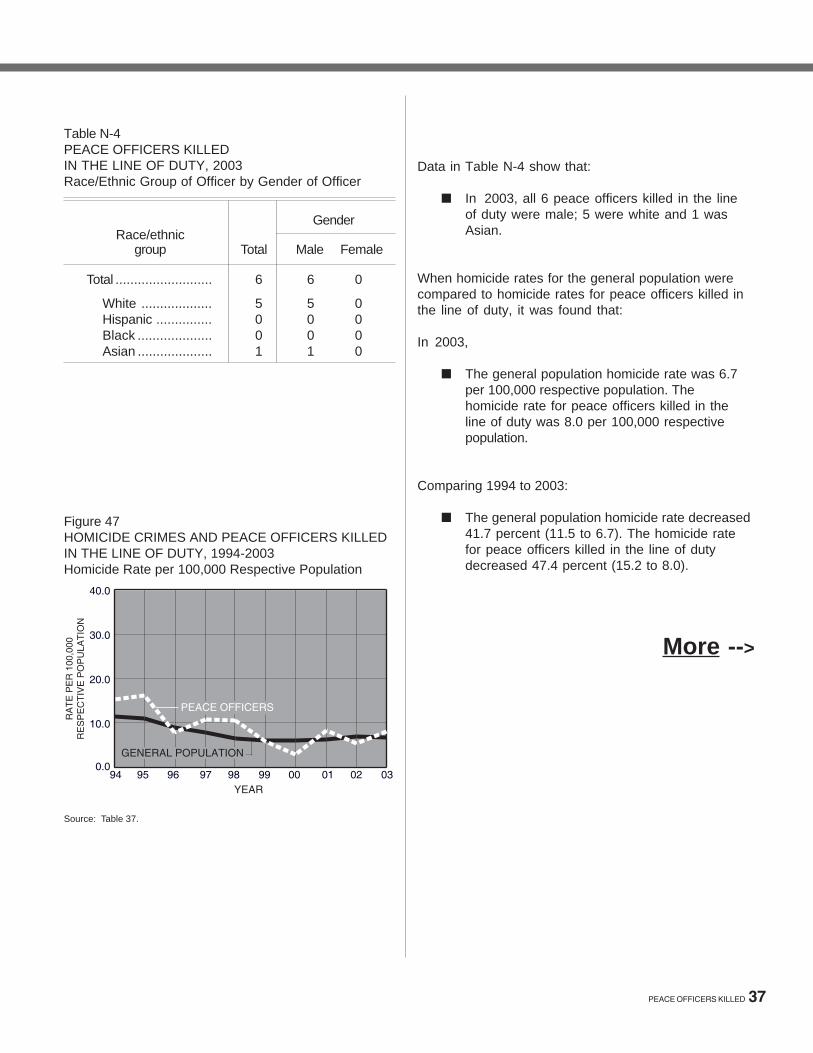
Table N-4 PEACE OFFICERS KILLED IN THE LINE OF DUTY, 2003 Race/Ethnic Group of Officer by Gender of Officer
Figure 47 HOMICIDE CRIMES AND PEACE OFFICERS KILLEDIN THE LINE OF DUTY, 1994-2003 Homicide Rate per 100,000 Respective Population
Race/ethnic group Total
Gender
Male Female
Total .......................... 6 6 0
White ................... 5 5 0 Hispanic ............... 0 0 0 Black .................... 0 0 0 Asian .................... 1 1 0
Data in Table N-4 show that:
■ In 2003, all 6 peace officers killed in the line of duty were male; 5 were white and 1 was Asian.
When homicide rates for the general population were compared to homicide rates for peace officers killed in the line of duty, it was found that:
In 2003,
■ The general population homicide rate was 6.7 per 100,000 respective population. The homicide rate for peace officers killed in the line of duty was 8.0 per 100,000 respective population.
Comparing 1994 to 2003:
■ The general population homicide rate decreased 41.7 percent (11.5 to 6.7). The homicide rate for peace officers killed in the line of duty decreased 47.4 percent (15.2 to 8.0).
More -->
PEACE OFFICERS KILLED 37

Links to:
Preface Crimes Arrests Death Penalties Peace Officers Killed
Justifiable Homicides Data Tables Appendices
CJSC Home Page CJSC Publications AG Home Page
Next page -->
JUSTIFIABLEHOMICIDES
JUSTIFIABLE HOMICIDES
HOMICIDE IN CALIFORNIA, 2003
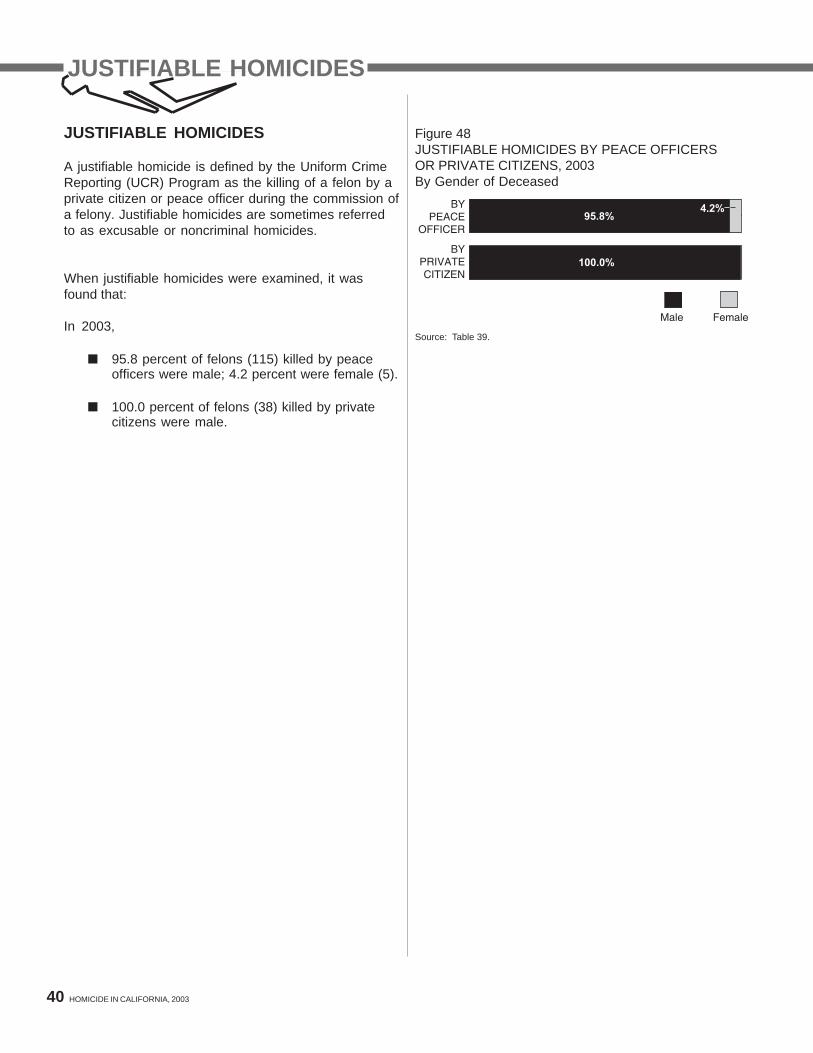
Figure 48 JUSTIFIABLE HOMICIDES BY PEACE OFFICERS OR PRIVATE CITIZENS, 2003 By Gender of Deceased
BPEAC
OFFICE
BPRIVATCITIZE
Source: Table 39.
Y E R
Y E N
95.8%
11.4
4.2%
100.0%
Male Female
JUSTIFIABLE HOMICIDES
JUSTIFIABLE HOMICIDES
A justifiable homicide is defined by the Uniform Crime Reporting (UCR) Program as the killing of a felon by a private citizen or peace officer during the commission of a felony. Justifiable homicides are sometimes referred to as excusable or noncriminal homicides.
When justifiable homicides were examined, it was found that:
In 2003,
■ 95.8 percent of felons (115) killed by peace officers were male; 4.2 percent were female (5).
100.0 percent of felons (38) killed by private citizens were male.
■
40 HOMICIDE IN CALIFORNIA, 2003

Figure 49 JUSTIFIABLE HOMICIDES BY PEACE OFFICERS OR PRIVATE CITIZENS, 2003 By Race/Ethnic Group of Deceased
BY PEACE
OFFICER
BY PRIVATE CITIZEN
35.8% 38.3% 5.0%
20.8%
23.7% 28.9% 39.5% 7.9
White Hispanic Black Other
Source: Table 39. Note: Percentages may not add to 100.0 because of rounding.
Figure 50 JUSTIFIABLE HOMICIDES BY PEACE OFFICERS OR PRIVATE CITIZENS, 2003 By Age of Deceased
BY PEACE
OFFICER
BY PRIVATE CITIZEN
1.7% 43.3% 27.5% 26.7%
0.8%
5.3% 39.5% 34.2% 21.1%
< 18 18-29 30-39 40+ Unknown
Source: Table 39. Note: Percentages may not add to 100.0 because of rounding.
In 2003,
■ 35.8 percent (43) of felons killed by peace officers were white, 38.3 percent (46) were Hispanic, 20.8 percent (25) were black, and 5.0 percent (6) fell into the “other” race/ethnic group category.
23.7 percent (9) of felons killed by private citizens were white, 28.9 percent (11) were Hispanic, 39.5 percent (15) were black, and 7.9 percent (3) fell into the “other” race/ethnic group category.
1.7 percent (2) of felons killed by peace officers were under age 18, 43.3 percent (52) were aged 18-29, 27.5 percent (33) were aged 30-39, 26.7 percent (32) were aged 40 and over, and 0.8 percent (1) fell into the “unknown” age category.
■
■
■ 5.3 percent (2) of felons killed by private citizens were under age 18, 39.5 percent (15) were aged 18-29, 34.2 percent (13) were aged 30-39, and 21.1 percent (8) were aged 40 and over.
Next page -->
JUSTIFIABLE HOMICIDES 41

JUSTIFIABLE HOMICIDES
When justifiable homicides were examined by location, it was found that:
In 2003,
■ Most felons killed by peace officers were killed
Figure 51 JUSTIFIABLE HOMICIDES BY PEACE OFFICERS, 2003 By Location of Justifiable Homicide
FELON'S RESIDENCE
OTHER RESIDENCE
STREET, SIDEWALK
COMMERCIAL ESTABLISHMENT
ALL OTHER
Source: Table 40.
Figure 52 JUSTIFIABLE HOMICIDES BY PRIVATE CITIZENS, 2003 By Location of Justifiable Homicide
19.2%
5.8%
5.0%
14.2%
55.8%
CITIZEN'S, SHARED RESIDENCE
OTHER RESIDENCE
STREET, SIDEWALK
COMMERCIAL ESTABLISHMENT
ALL OTHER
Source: Table 40.
42.1%
13.2%
15.8%
23.7%
5.3%
Note: Percentages do not add to 100.0 because of rounding.
on a street or sidewalk (55.8 percent).
■ The largest percentage of felons killed by private citizens fell into the “citizen’s, shared residence” category (42.1 percent).
42 HOMICIDE IN CALIFORNIA, 2003

.
Figure 53 JUSTIFIABLE HOMICIDES BY PEACE OFFICERS, 2003 By Contributing Circumstance
FELON ATTACKED PEACE OFFICER
FELON KILLED DURING COMMISSION OF CRIME
FELON RESISTED ARREST
ALL OTHER
Source: Table 41.
Figure 54 JUSTIFIABLE HOMICIDES BY PRIVATE CITIZENS, 2003 By Contributing Circumstance
77.5%
20.0%
0.8%
1.7%
FELON ATTACKED CITIZEN
FELON KILLED DURING COMMISSION OF CRIME
Source: Table 41.
36.8%
63.2%
When justifiable homicides were examined by contributing circumstance, it was found that:
In 2003,
■ Most felons killed by peace officers were killed while attacking a peace officer (77.5 percent).
■ Most felons killed by private citizens were killed during the commission of a crime (63.2 percent).
More -->
JUSTIFIABLE HOMICIDES 43

Links to:
Preface Crimes Arrests Death Penalties Peace Officers Killed
Justifiable Homicides Data Tables Appendices
CJSC Home Page CJSC Publications AG Home Page
DATA TABLES
List of Tables -->
DATA TABLES
HOMICIDE IN CALIFORNIA, 2003
CONTENTS
Tables
Violent crimes, 1994-2003, number, rate per 100,000 population, and
percent change............................................................................................... 46
Homicide crimes
Gender of victim, 1994-2003, number, percent, and rate per 100,000
population ............................................................................................... 47
Race/ethnic group of victim, 1994-2003, number, percent, and rate per 100,000 population ................................................................................. 48
Age of victim, 1994-2003, number, percent, and rate per 100,000
population ............................................................................................... 49
Gender of victim, 1994-2003 ......................................................................... 50
Race/ethnic group of victim, 1994-2003 ........................................................ 50
Age of victim, 1994-2003............................................................................... 51
Race/ethnic group of victim by gender of victim, 2003 .................................. 51
Race/ethnic group of victim by age of victim, 2003 ....................................... 52
Race/ethnic group of victim by gender and age of victim, 2003 .................... 53
Relationship of victim to offender, 1994-2003 ............................................... 54
Gender and race/ethnic group of victim by relationship of victim to
offender, 2003 ........................................................................................ 55
Age of victim by relationship of victim to offender, 2003 ............................... 56
County, number and rate per 100,000 population, 1994-2003 ...................... 57
Season and month of incident, 1994-2003 .................................................... 61
Gender and race/ethnic group of victim by day of incident, 2003 .................. 62
Age of victim by day of incident, 2003 ........................................................... 63
Location of homicide, 1994-2003 .................................................................. 64
Gender and race/ethnic group of victim by location of homicide, 2003 ......... 65
Age of victim by location of homicide, 2003 .................................................. 66
Type of weapon used, 1994-2003 ................................................................. 67
Gender and race/ethnic group of victim by type of weapon used, 2003 ........ 68
Age of victim by type of weapon used, 2003 ................................................. 69
CONTENTS
Contributing circumstance, 1994-2003 .......................................................... 70
Gender and race/ethnic group of victim by contributing circumstance, 2003 71
Age of victim by contributing circumstance, 2003 .......................................... 72
Contributing circumstance by relationship of victim to offender, 2003 ........... 73
Clearances, 1994-2003, number reported, number cleared, and
clearance rate ......................................................................................... 74
Felony arrests for selected violent offenses, 1994-2003, number, rate per 100,000 population at risk, and percent change ............................... 75
Homicide arrests Gender of arrestee, 1994-2003 ..................................................................... 76
Race/ethnic group of arrestee, 1994-2003 .................................................... 76
Age of arrestee, 1994-2003 .......................................................................... 77
Race/ethnic group of arrestee by gender and age of arrestee, 2003............ 77
Race/ethnic group of arrestee by gender and age of arrestee, 2003
(additional age breakdowns) ................................................................... 78
Death penalty sentences Persons under California sentence of death, 1978-2003 .............................. 79
Sentencing county by gender, race/ethnic group, and age of persons
sentenced to death, 2003....................................................................... 80
Peace officers killed in the line of duty Homicide crimes and peace officers killed in the line of duty, 1994-2003,
number and rate per 100,000 respective population.............................. 81
Contributing circumstance, 2003 .................................................................... 81
Justifiable homicides Gender, race/ethnic group, and age of deceased, 2003 ............................... 82
Location of justifiable homicide, 2003............................................................ 83
Contributing circumstance, 2003 .................................................................... 84
Type of weapon used, 2003 .......................................................................... 84
Population Population estimates, 1952-2003 .................................................................. 85
ALL TABLES IN ONE FILE FOR EASY PRINTING Appendices -->

Table 1 VIOLENT CRIMES, 1994-2003
Number, Rate per 100,000 Population, and Percent Change
Year(s) Total Homi-cide
Forcible rape Robbery
Aggra- vated
assault Number
2003................. 2002................. 2001................. 2000................. 1999................. 1998................. 1997................. 1996................. 1995................. 1994.................
204,591 207,988 210,510 210,492 207,874 229,766 257,409 274,675 304,998 318,946
2,402 2,392 2,201 2,074 2,006 2,170 2,579 2,910 3,530 3,699
9,918 10,176 9,882 9,785 9,443 9,777
10,182 10,238 10,550 10,960
63,597 64,805 63,299 60,243 60,027 68,752 81,413 94,137
104,581 112,149
128,674 130,615 135,128 138,390 136,398 149,067 163,235 167,390 186,337 192,138
Percent change in number 2002-2003.....… 2001-2002.....… 2000-2001.....… 1999-2000........ 1998-1999........ 1997-1998........ 1996-1997........ 1995-1996........ 1994-1995........ 1994-2003........
-1.6 -1.2 0.0 1.3
-9.5 -10.7 -6.3 -9.9 -4.4
-35.9
0.4 8.7 6.1 3.4
-7.6 -15.9 -11.4 -17.6
-4.6 -35.1
-2.5 3.0 1.0 3.6
-3.4 -4.0 -0.5 -3.0 -3.7 -9.5
-1.9 2.4 5.1 0.4
-12.7 -15.6 -13.5 -10.0
-6.7 -43.3
-1.5 -3.3 -2.4 1.5
-8.5 -8.7 -2.5
-10.2 -3.0
-33.0 Rate per 100,000 population1
2003................. 2002................. 2001................. 2000................. 1999................. 1998................. 1997................. 1996................. 1995................. 1994.................
569.4 589.2 605.6 610.5 610.7 686.0 781.0 848.2 951.2 992.4
6.7 6.8 6.3 6.0 5.9 6.5 7.8 9.0
11.0 11.5
27.6 28.8 28.4 28.4 27.7 29.2 30.9 31.6 32.9 34.1
177.0 183.6 182.1 174.7 176.4 205.3 247.0 290.7 326.2 348.9
358.1 370.0 388.8 401.4 400.7 445.1 495.3 516.9 581.2 597.8
Percent change in rate 2002-2003.....… 2001-2002.....… 2000-2001.....… 1999-2000........ 1998-1999........
1997-1998........ 1996-1997........ 1995-1996........ 1994-1995........ 1994-2003.....…
-3.4 -2.7 -0.8 0.0
-11.0
-12.2 -7.9
-10.8 -4.2
-42.6
-1.5 7.9 5.0 1.7
-9.2
-16.7 -13.3 -18.2 -4.3
-41.7
-4.2 1.4 0.0 2.5
-5.1
-5.5 -2.2 -4.0 -3.5
-19.1
-3.6 0.8 4.2
-1.0 -14.1
-16.9 -15.0 -10.9 -6.5
-49.3
-3.2 -4.8 -3.1 0.2
-10.0
-10.1 -4.2
-11.1 -2.8
-40.1 Note: Rates may not add to total because of rounding. 1 Rates are based on annual population estimates provided by the Demographic Research Unit, California Department of Finance.
46
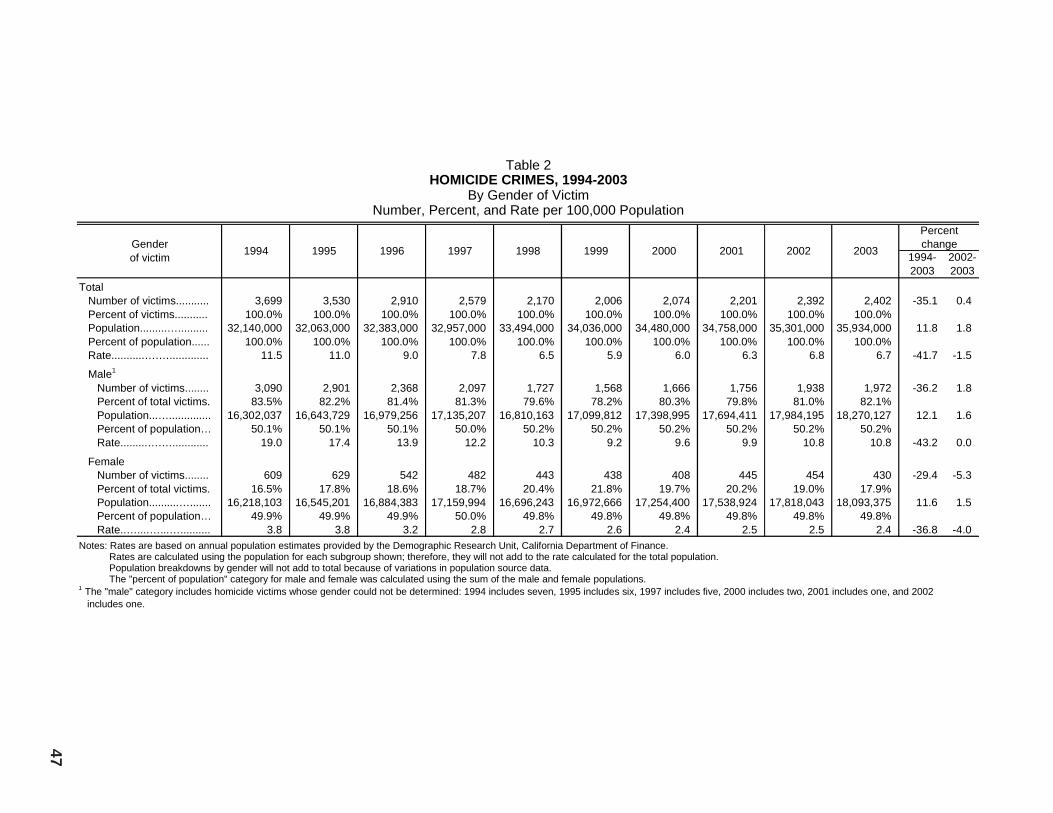
Table 2 HOMICIDE CRIMES, 1994-2003
By Gender of Victim Number, Percent, and Rate per 100,000 Population
Gender of victim 1994 1995 1996 1997 1998 1999 2000 2001 2002 2003
Percent change
1994- 2003
2002- 2003
Total Number of victims........... 3,699 3,530 2,910 2,579 2,170 2,006 2,074 2,201 2,392 2,402 -35.1 0.4 Percent of victims........... 100.0% 100.0% 100.0% 100.0% 100.0% 100.0% 100.0% 100.0% 100.0% 100.0% Population.........….......... 32,140,000 32,063,000 32,383,000 32,957,000 33,494,000 34,036,000 34,480,000 34,758,000 35,301,000 35,934,000 11.8 1.8 Percent of population...... 100.0% 100.0% 100.0% 100.0% 100.0% 100.0% 100.0% 100.0% 100.0% 100.0% Rate...........….….............
Male1
11.5 11.0 9.0 7.8 6.5 5.9 6.0 6.3 6.8 6.7 -41.7 -1.5
Number of victims........ 3,090 2,901 2,368 2,097 1,727 1,568 1,666 1,756 1,938 1,972 -36.2 1.8 Percent of total victims. 83.5% 82.2% 81.4% 81.3% 79.6% 78.2% 80.3% 79.8% 81.0% 82.1% Population...….............. 16,302,037 16,643,729 16,979,256 17,135,207 16,810,163 17,099,812 17,398,995 17,694,411 17,984,195 18,270,127 12.1 1.6 Percent of population… 50.1% 50.1% 50.1% 50.0% 50.2% 50.2% 50.2% 50.2% 50.2% 50.2% Rate.........….…............
Female
19.0 17.4 13.9 12.2 10.3 9.2 9.6 9.9 10.8 10.8 -43.2 0.0
Number of victims........ 609 629 542 482 443 438 408 445 454 430 -29.4 -5.3 Percent of total victims. 16.5% 17.8% 18.6% 18.7% 20.4% 21.8% 19.7% 20.2% 19.0% 17.9% Population..........…....... 16,218,103 16,545,201 16,884,383 17,159,994 16,696,243 16,972,666 17,254,400 17,538,924 17,818,043 18,093,375 11.6 1.5 Percent of population… 49.9% 49.9% 49.9% 50.0% 49.8% 49.8% 49.8% 49.8% 49.8% 49.8% Rate..…....…...….......... 3.8 3.8 3.2 2.8 2.7 2.6 2.4 2.5 2.5 2.4 -36.8 -4.0 Notes: Rates are based on annual population estimates provided by the Demographic Research Unit, California Department of Finance.
Rates are calculated using the population for each subgroup shown; therefore, they will not add to the rate calculated for the total population. Population breakdowns by gender will not add to total because of variations in population source data. The "percent of population" category for male and female was calculated using the sum of the male and female populations.
1 The "male" category includes homicide victims whose gender could not be determined: 1994 includes seven, 1995 includes six, 1997 includes five, 2000 includes two, 2001 includes one, and 2002 includes one.
47

Table 3 HOMICIDE CRIMES, 1994-2003By Race/Ethnic Group of Victim
Number, Percent, and Rate per 100,000 Population
Race/ethnic group of victim 1994 1995 1996 1997 1998 1999 2000 2001 2002 2003
Percent change
1994- 2003
2002-2003
Total Number of victims............ Percent of victims..…....... Population.........…........... Percent of population....... Rate...…....…................... White Number of victims.…..... Percent of total victims.. Population........…......... Percent of population.... Rate.....….......…...........
Hispanic Number of victims…...... Percent of total victims.. Population..........…....... Percent of population.... Rate.....….....….............
Black Number of victims…...... Percent of total victims.. Population..…...…......... Percent of population.... Rate.......…..…..............
Other Number of victims…...... Percent of total victims.. Population.....….…........ Percent of population..... Rate…....…..……...........
Unknown Number of victims..….... Percent of total victims.. Population.....….…........ Percent of population…. Rate........…....….….......
3,699 100.0%
32,140,000 100.0%
11.5
771 20.8%
17,511,489 53.8%
4.4
1,572 42.5%
9,340,495 28.7%
16.8
1,111 30.0%
2,255,738 6.9% 49.3
226 6.1%
3,412,418 10.5%
6.6
19 0.5%
---
3,530 100.0%
32,063,000 100.0%
11.0
726 20.6%
17,593,222 53.0%
4.1
1,615 45.8%
9,764,691 29.4%
16.5
922 26.1%
2,293,634 6.9% 40.2
254 7.2%
3,537,383 10.7%
7.2
13 0.4%
---
2,910 100.0%
32,383,000 100.0%
9.0
617 21.2%
17,787,715 52.5%
3.5
1,291 44.4%
10,114,228 29.9%
12.8
794 27.3%
2,330,391 6.9% 34.1
198 6.8%
3,631,305 10.7%
5.5
10 0.3%
---
2,579 100.0%
32,957,000 100.0%
7.8
547 21.2%
17,849,510 52.0%
3.1
1,154 44.7%
10,421,039 30.4%
11.1
682 26.4%
2,314,836 6.7% 29.5
177 6.9%
3,709,816 10.8%
4.8
19 0.7%
---
2,170 100.0%
33,494,000 100.0%
6.5
523 24.1%
17,258,003 51.5%
3.0
964 44.4%
10,022,551 29.9%
9.6
523 24.1%
2,309,152 6.9% 22.6
147 6.8%
3,916,700 11.7%
3.8
13 0.6%
---
2,006 100.0%
34,036,000 100.0%
5.9
446 22.2%
17,339,690 50.9%
2.6
909 45.3%
10,352,763 30.4%
8.8
488 24.3%
2,320,916 6.8% 21.0
157 7.8%
4,059,109 11.9%
3.9
6 0.3%
---
2,074 100.0%
34,480,000 100.0%
6.0
421 20.3%
17,421,511 50.3%
2.4
933 45.0%
10,688,752 30.8%
8.7
589 28.4%
2,337,935 6.7% 25.2
121 5.8%
4,205,197 12.1%
2.9
10 0.5%
---
2,201 100.0%
34,758,000 100.0%
6.3
442 20.1%
17,503,225 49.7%
2.5
985 44.8%
11,020,710 31.3%
8.9
622 28.3%
2,355,812 6.7% 26.4
145 6.6%
4,353,588 12.4%
3.3
7 0.3%
---
2,392 100.0%
35,301,000 100.0%
6.8
417 17.4%
17,573,850 49.1%
2.4
1,066 44.6%
11,352,852 31.7%
9.4
734 30.7%
2,373,399 6.6% 30.9
166 6.9%
4,502,137 12.6%
3.7
9 0.4%
---
2,402 100.0%
35,934,000 100.0%
6.7
444 18.5%
17,635,296 48.5%
2.5
1,053 43.8%
11,685,915 32.1%
9.0
713 29.7%
2,390,411 6.6% 29.8
185 7.7%
4,651,880 12.8%
4.0
7 0.3%
---
-35.1 0.4
11.8 1.8
-41.7 -1.5
-42.4 6.5
0.7 0.3
-43.2 4.2
-33.0 -1.2
25.1 2.9
-46.4 -4.3
-35.8 -2.9
6.0 0.7
-39.6 -3.6
-18.1 11.4
36.3 3.3
-39.4 8.1
- -
- -
- -Notes: Percentages may not add to 100.0 because of rounding.
Rates are based on annual population estimates provided by the Demographic Research Unit, California Department of Finance. Rates are calculated using the population for each subgroup shown; therefore, they will not add to the rate calculated for the total population. Population breakdowns by race/ethnic group will not add to total because of variations in population source data. Dash indicates that the percent of population and rate for the "unknown" category cannot be calculated because there are no unknown race/ethnic group population data. The "percent of population" category for race/ethnic group was calculated using the sum of the race/ethnic group populations.
48

Table 4 HOMICIDE CRIMES, 1994-2003
By Age of Victim Number, Percent, and Rate per 100,000 Population
Age of victim 1994 1995 1996 1997 1998 1999 2000 2001 2002 2003
Percent change
1994-2003
2002-2003
Total Number of victims.......… Percent of victims........... Population........…........... Percent of population..… Rate...................….….... Under 18
Number of victims........ Percent of total victims. Population....….....….... Percent of population... Rate........….....….........
18-29 Number of victims........ Percent of total victims. Population....….....….... Percent of population... Rate........….....….........
30-39 Number of victims........ Percent of total victims. Population....….....….... Percent of population... Rate........….....….........
40 and over Number of victims........ Percent of total victims. Population....….....….... Percent of population... Rate........….....….........
Unknown Number of victims........ Percent of total victims. Population....….....….... Percent of population... Rate........….....….........
3,699 100.0%
32,140,000 100.0%
11.5
470 12.7%
8,917,191 27.4%
5.3
1,603 43.3%
5,934,537 18.2%
27.0
861 23.3%
5,874,969 18.1%
14.7
698 18.9%
11,793,443 36.3%
5.9
67 1.8%
---
3,530 100.0%
32,063,000 100.0%
11.0
519 14.7%
9,191,662 27.7%
5.6
1,510 42.8%
5,854,943 17.6%
25.8
737 20.9%
5,942,572 17.9%
12.4
719 20.4%
12,199,753 36.8%
5.9
45 1.3%
---
2,910 100.0%
32,383,000 100.0%
9.0
421 14.5%
9,456,115 27.9%
4.5
1,183 40.7%
5,770,311 17.0%
20.5
630 21.6%
5,968,805 17.6%
10.6
636 21.9%
12,668,408 37.4%
5.0
40 1.4%
---
2,579 100.0%
32,957,000 100.0%
7.8
361 14.0%
9,701,218 28.3%
3.7
1,068 41.4%
5,537,727 16.1%
19.3
534 20.7%
5,942,241 17.3%
9.0
580 22.5%
13,114,015 38.2%
4.4
36 1.4%
---
2,170 100.0%
33,494,000 100.0%
6.5
306 14.1%
9,426,168 28.1%
3.2
933 43.0%
5,474,990 16.3%
17.0
428 19.7%
5,654,098 16.9%
7.6
480 22.1%
12,951,150 38.7%
3.7
23 1.1%
---
2,006 100.0%
34,036,000 100.0%
5.9
276 13.8%
9,587,332 28.1%
2.9
840 41.9%
5,511,604 16.2%
15.2
364 18.1%
5,629,424 16.5%
6.5
505 25.2%
13,344,118 39.2%
3.8
21 1.0%
---
2,074 100.0%
34,480,000 100.0%
6.0
246 11.9%
9,770,687 28.2%
2.5
888 42.8%
5,523,472 15.9%
16.1
377 18.2%
5,597,411 16.2%
6.7
534 25.7%
13,761,825 39.7%
3.9
29 1.4%
---
2,201 100.0%
34,758,000 100.0%
6.3
252 11.4%
9,932,913 28.2%
2.5
992 45.1%
5,555,926 15.8%
17.9
426 19.4%
5,535,620 15.7%
7.7
519 23.6%
14,208,876 40.3%
3.7
12 0.5%
---
2,392 100.0%
35,301,000 100.0%
6.8
247 10.3%
10,095,903 28.2%
2.4
1,098 45.9%
6,123,037 17.1%
17.9
449 18.8%
4,994,720 14.0%
9.0
579 24.2%
14,588,578 40.7%
4.0
19 0.8%
---
2,402 100.0%
35,934,000 100.0%
6.7
240 10.0%
10,248,237 28.2%
2.3
1,100 45.8%
5,740,606 15.8%
19.2
486 20.2%
5,384,170 14.8%
9.0
560 23.3%
14,990,489 41.2%
3.7
16 0.7%
---
-35.1 0.4
11.8 1.8
-41.7 -1.5
-48.9 -2.8
14.9 1.5
-56.6 -4.2
-31.4 0.2
-3.3 -6.2
-28.9 7.3
-43.6 8.2
-8.4 7.8
-38.8 0.0
-19.8 -3.3
27.1 2.8
-37.3 -7.5
- -
- -
- -Notes: Percentages may not add to 100.0 because of rounding.
Rates are based on annual population estimates provided by the Demographic Research Unit, California Department of Finance. Rates are calculated using the population for each subgroup shown; therefore, they will not add to the rate calculated for the total population. Population breakdowns by age will not add to total because of variations in population source data. Dash indicates that the percent of population and rate for the "unknown" category cannot be calculated because there are no unknown age population data. The "percent of population" category for age group was calculated using the sum of the age populations. 49

Table 5 HOMICIDE CRIMES, 1994-2003
By Gender of Victim
Year(s) Total Male1 Female
Number Percent Number Percent Number Percent 2003.............. 2,402 100.0 1,972 82.1 430 17.9 2002.............. 2,392 100.0 1,938 81.0 454 19.0 2001.............. 2,201 100.0 1,756 79.8 445 20.2 2000.............. 2,074 100.0 1,666 80.3 408 19.7 1999.............. 2,006 100.0 1,568 78.2 438 21.8 1998.............. 2,170 100.0 1,727 79.6 443 20.4 1997.............. 2,579 100.0 2,097 81.3 482 18.7 1996.............. 2,910 100.0 2,368 81.4 542 18.6 1995.............. 3,530 100.0 2,901 82.2 629 17.8 1994.............. 3,699 100.0 3,090 83.5 609 16.5 1 The "male" category includes homicide victims whose gender could not be determined: 1994
includes seven, 1995 includes six, 1997 includes five, 2000 includes two, 2001 includes one, and 2002 includes one.
Table 6 HOMICIDE CRIMES, 1994-2003 By Race/Ethnic Group of Victim
Total Known race/ethnic group of victim
Year(s) including Unknown Total White Hispanic Black Other unknown Number Percent Number Percent Number Percent Percent Number Number Percent
2003............... 2,402 7 2,395 100.0 444 18.5 1,053 44.0 713 29.8 185 7.7 2002............... 2,392 9 2,383 100.0 417 17.5 1,066 44.7 734 30.8 166 7.0 2001............... 2,201 7 2,194 100.0 442 20.1 985 44.9 622 28.4 145 6.6 2000............... 2,074 10 2,064 100.0 421 20.4 933 45.2 589 28.5 121 5.9 1999............... 2,006 6 2,000 100.0 446 22.3 909 45.5 488 24.4 157 7.9 1998............... 2,170 13 2,157 100.0 523 24.2 964 44.7 523 24.2 147 6.8 1997............... 2,579 19 2,560 100.0 547 21.4 1,154 45.1 682 26.6 177 6.9 1996............... 2,910 10 2,900 100.0 617 21.3 1,291 44.5 794 27.4 198 6.8 1995............... 3,530 13 3,517 100.0 726 20.6 1,615 45.9 922 26.2 254 7.2 1994............... 3,699 19 3,680 100.0 771 21.0 1,572 42.7 1,111 30.2 226 6.1 Note: Percentages may not add to 100.0 because of rounding.
50

Table 7 HOMICIDE CRIMES, 1994-2003
By Age of Victim
Total Known age of victim
Year(s) including Unknown Total Under 18 18-29 30-39 40 and over unknown Number Percent Number Percent Number Percent Number Percent Number Percent
2003...........… 2,402 16 2,386 100.0 240 10.1 1,100 46.1 486 20.4 560 23.5 2002...........… 2,392 19 2,373 100.0 247 10.4 1,098 46.3 449 18.9 579 24.4 2001...........… 2,201 12 2,189 100.0 252 11.5 992 45.3 426 19.5 519 23.7 2000.............. 2,074 29 2,045 100.0 246 12.0 888 43.4 377 18.4 534 26.1 1999.............. 2,006 21 1,985 100.0 276 13.9 840 42.3 364 18.3 505 25.4
1998.............. 2,170 23 2,147 100.0 306 14.3 933 43.5 428 19.9 480 22.4 1997.............. 2,579 36 2,543 100.0 361 14.2 1,068 42.0 534 21.0 580 22.8 1996.............. 2,910 40 2,870 100.0 421 14.7 1,183 41.2 630 22.0 636 22.2 1995.............. 3,530 45 3,485 100.0 519 14.9 1,510 43.3 737 21.1 719 20.6 1994.............. 3,699 67 3,632 100.0 470 12.9 1,603 44.1 861 23.7 698 19.2 Note: Percentages may not add to 100.0 because of rounding.
Table 8 HOMICIDE CRIMES, 2003
Race/Ethnic Group of Victim by Gender of Victim
Gender of victim
Total White Hispanic Black Other Unknown
Number Percent Number Percent Number Percent Number Percent Number Percent Number Percent
Total.............. 2,402 100.0 444 100.0 1,053 100.0 713 100.0 185 100.0 7 100.0 Male...…..... 1,972 82.1 303 68.2 915 86.9 614 86.1 134 72.4 6 - Female…… 430 17.9 141 31.8 138 13.1 99 13.9 51 27.6 1 -
Note: Dash indicates that percent distributions are not calculated when the base number is less than 50.
51

Table 9 HOMICIDE CRIMES, 2003
Race/Ethnic Group of Victim by Age of Victim
Age of victim
Total White Hispanic Black Other Unknown
Number Percent Number Percent Number Percent Number Percent Number Percent Number Percent
Total including unknown.. 2,402 444 1,053 713 185 7 Unknown..…...….......... 16 3 8 1 0 4 Total known…...…....... 2,386 100.0 441 100.0 1,045 100.0 712 100.0 185 100.0 3 100.0
Under 18..….…......... 240 10.1 38 8.6 114 10.9 67 9.4 21 11.4 0 - 18-29.…..........…...... 1,100 46.1 107 24.3 586 56.1 331 46.5 73 39.5 3 - 30-39.….....…........... 486 20.4 93 21.1 197 18.9 170 23.9 26 14.1 0 - 40 and over...…........ 560 23.5 203 46.0 148 14.2 144 20.2 65 35.1 0 -
Notes: Percentages may not add to 100.0 because of rounding. Dash indicates that percent distributions are not calculated when the base number is less than 50.
52

Table 10 HOMICIDE CRIMES, 2003
Race/Ethnic Group of Victim by Gender and Age of Victim Gender and
age of victim
Total White Hispanic Black Other Unknown
Number Percent Number Percent Number Percent Number Percent Number Percent Percent Number
Total.…............... 2,402 100.0 444 100.0 1,053 100.0 713 100.0 185 100.0 7 100.0 Under 18......... 240 10.0 38 8.6 114 10.8 67 9.4 21 11.4 0 - 18-19...…........ 228 9.5 20 4.5 129 12.3 69 9.7 10 5.4 0 - 20-24..…......... 517 21.5 46 10.4 281 26.7 147 20.6 40 21.6 3 - 25-29..…......... 355 14.8 41 9.2 176 16.7 115 16.1 23 12.4 0 - 30-34..…......... 271 11.3 51 11.5 115 10.9 89 12.5 16 8.6 0 - 35-39..…......... 215 9.0 42 9.5 82 7.8 81 11.4 10 5.4 0 - 40-44...…........ 169 7.0 50 11.3 50 4.7 56 7.9 13 7.0 0 - 45-49....…....... 129 5.4 39 8.8 40 3.8 38 5.3 12 6.5 0 - 50-54.....…...... 84 3.5 35 7.9 24 2.3 18 2.5 7 3.8 0 - 55 and over..... 178 7.4 79 17.8 34 3.2 32 4.5 33 17.8 0 - Unknown…...... 16 0.7 3 0.7 8 0.8 1 0.1 0 0.0 4 -
Male......…....... 1,972 100.0 303 100.0 915 100.0 614 100.0 134 100.0 6 100.0 Under 18...... 176 8.9 22 7.3 87 9.5 55 9.0 12 9.0 0 -18-19...…..... 209 10.6 14 4.6 121 13.2 64 10.4 10 7.5 0 -20-24...…..... 467 23.7 38 12.5 260 28.4 133 21.7 34 25.4 2 -25-29...…..... 309 15.7 27 8.9 157 17.2 106 17.3 19 14.2 0 -30-34...…..... 228 11.6 37 12.2 102 11.1 76 12.4 13 9.7 0 -35-39...…..... 172 8.7 30 9.9 69 7.5 69 11.2 4 3.0 0 -40-44...…..... 124 6.3 33 10.9 40 4.4 43 7.0 8 6.0 0 -45-49...…..... 95 4.8 27 8.9 30 3.3 30 4.9 8 6.0 0 -50-54...…..... 61 3.1 24 7.9 18 2.0 14 2.3 5 3.7 0 -55 and over.. 116 5.9 49 16.2 23 2.5 23 3.7 21 15.7 0 -Unknown...... 15 0.8 2 0.7 8 0.9 1 0.2 0 0.0 4 -
Female…........ 430 100.0 141 100.0 138 100.0 99 100.0 51 100.0 1 100.0 Under 18...... 64 14.9 16 11.3 27 19.6 12 12.1 9 17.6 0 -18-19...…..... 19 4.4 6 4.3 8 5.8 5 5.1 0 0.0 0 -20-24...…..... 50 11.6 8 5.7 21 15.2 14 14.1 6 11.8 1 -25-29...…..... 46 10.7 14 9.9 19 13.8 9 9.1 4 7.8 0 -30-34...…..... 43 10.0 14 9.9 13 9.4 13 13.1 3 5.9 0 -35-39...…..... 43 10.0 12 8.5 13 9.4 12 12.1 6 11.8 0 -40-44...…..... 45 10.5 17 12.1 10 7.2 13 13.1 5 9.8 0 -45-49...…..... 34 7.9 12 8.5 10 7.2 8 8.1 4 7.8 0 -50-54...…..... 23 5.3 11 7.8 6 4.3 4 4.0 2 3.9 0 -55 and over.. 62 14.4 30 21.3 11 8.0 9 9.1 12 23.5 0 -Unknown…... 1 0.2 1 0.7 0 0.0 0 0.0 0 0.0 0 -
Notes: Percentages may not add to 100.0 because of rounding. Dash indicates that percent distributions are not calculated when the base number is less than 50. 53
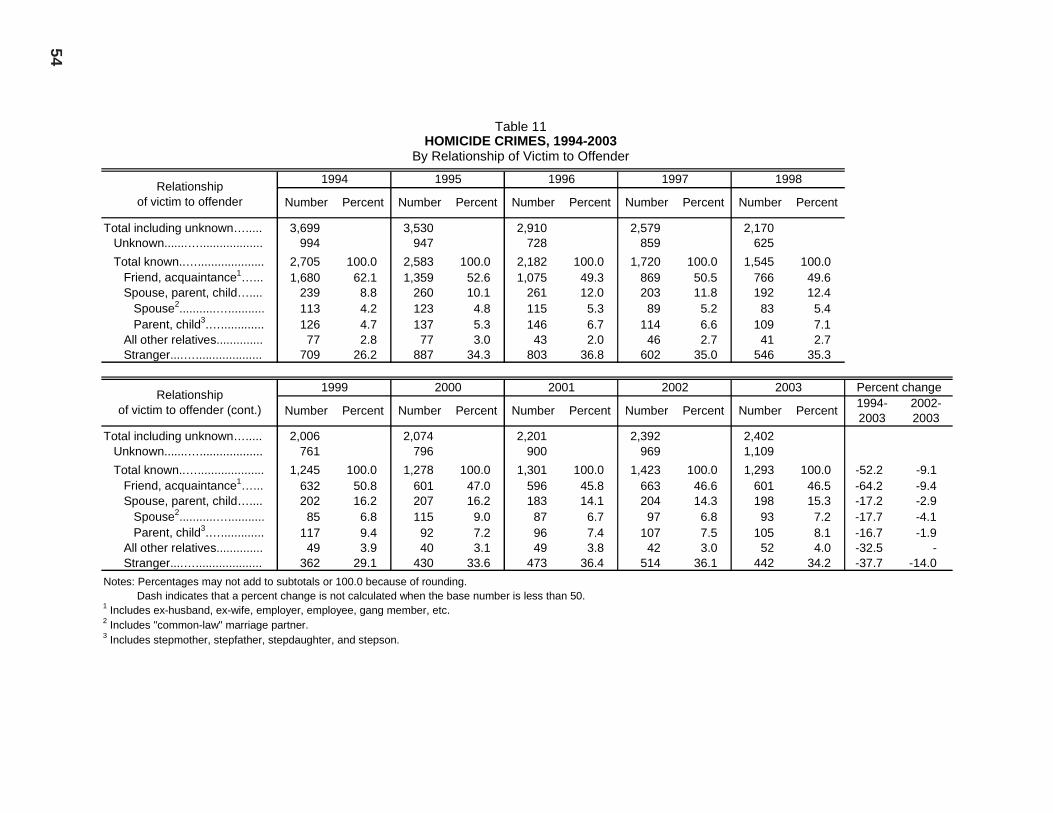
Table 11 HOMICIDE CRIMES, 1994-2003
By Relationship of Victim to Offender
Relationship of victim to offender
1994 1995 1996 1997 1998
Number Percent Number Percent Number Percent Number Percent Number Percent
Total including unknown…..... Unknown.......…................... Total known..….................... Friend, acquaintance1 …... Spouse, parent, child…....
Spouse2 ...........…........... Parent, child3 .….............
All other relatives.............. Stranger....…....................
3,699 994
2,705 1,680
239 113 126 77
709
100.0 62.1 8.8 4.2 4.7 2.8
26.2
3,530 947
2,583 1,359
260 123 137 77
887
100.0 52.6 10.1
4.8 5.3 3.0
34.3
2,910 728
2,182 1,075
261 115 146 43
803
100.0 49.3 12.0
5.3 6.7 2.0
36.8
2,579 859
1,720 869 203
89 114
46 602
100.0 50.5 11.8
5.2 6.6 2.7
35.0
2,170 625
1,545 766 192
83 109
41 546
100.0 49.6 12.4 5.4 7.1 2.7
35.3
Relationship of victim to offender (cont.)
1999 2000 2001 2002 2003 Percent change
Number Percent Number Percent Number Percent Number Percent Number Percent 1994- 2003
2002-2003
Total including unknown…..... 2,006 2,074 2,201 2,392 2,402 Unknown.......…................... 761 796 900 969 1,109 Total known..….................... 1,245 100.0 1,278 100.0 1,301 100.0 1,423 100.0 1,293 100.0 -52.2 -9.1 Friend, acquaintance1 …... 632 50.8 601 47.0 596 45.8 663 46.6 601 46.5 -64.2 -9.4 Spouse, parent, child….... 202 16.2 207 16.2 183 14.1 204 14.3 198 15.3 -17.2 -2.9
Spouse2 ...........…........... 85 6.8 115 9.0 87 6.7 97 6.8 93 7.2 -17.7 -4.1 Parent, child3 .…............. 117 9.4 92 7.2 96 7.4 107 7.5 105 8.1 -16.7 -1.9
All other relatives.............. 49 3.9 40 3.1 49 3.8 42 3.0 52 4.0 -32.5 - Stranger....….................... 362 29.1 430 33.6 473 36.4 514 36.1 442 34.2 -37.7 -14.0 Notes: Percentages may not add to subtotals or 100.0 because of rounding.
Dash indicates that a percent change is not calculated when the base number is less than 50. 1 Includes ex-husband, ex-wife, employer, employee, gang member, etc. 2 Includes "common-law" marriage partner. 3 Includes stepmother, stepfather, stepdaughter, and stepson.
54

Table 12 HOMICIDE CRIMES, 2003
Gender and Race/Ethnic Group of Victim by Relationship of Victim to Offender
Relationship of victim to offender Total
Gender Race/ethnic group
Male Female White Hispanic Black Other Unknown
Number Total including unknown.......... 2,402 1,972 430 444 1,053 713 185 7 Unknown......…...….............. 1,109 998 111 101 537 390 75 6 Total known...…................... 1,293 974 319 343 516 323 110 1
Friend, acquaintance1 ....... 601 465 136 179 239 139 43 1 Spouse, parent, child….... 198 71 127 69 72 33 24 0
Spouse2 ........….............. 93 14 79 29 36 12 16 0 Parent, child3 .…............. 105 57 48 40 36 21 8 0
All other relatives..……..... 52 30 22 13 12 14 13 0 Stranger.......…..…............ 442 408 34 82 193 137 30 0
Percent based on total known Total known...…................... 100.0 100.0 100.0 100.0 100.0 100.0 100.0 100.0
Friend, acquaintance1 ....... 46.5 47.7 42.6 52.2 46.3 43.0 39.1 -Spouse, parent, child….... 15.3 7.3 39.8 20.1 14.0 10.2 21.8 -
Spouse2 ........….............. 7.2 1.4 24.8 8.5 7.0 3.7 14.5 -Parent, child3 …............. 8.1 5.9 15.0 11.7 7.0 6.5 7.3 -
All other relatives..……..... 4.0 3.1 6.9 3.8 2.3 4.3 11.8 -Stranger.......…..…............ 34.2 41.9 10.7 23.9 37.4 42.4 27.3 -
Notes: Percentages may not add to subtotals or 100.0 because of rounding. Dash indicates that percent distributions are not calculated when the base number is less than 50.
1 Includes ex-husband, ex-wife, employer, employee, gang member, etc. 2 Includes "common-law" marriage partner. 3 Includes stepmother, stepfather, stepdaughter, and stepson.
55

Table 13 HOMICIDE CRIMES, 2003
Age of Victim by Relationship of Victim to Offender
Relationship of victim to offender Total
Under 18 18-29 30-39
40 and over Unknown
Number Total including unknown....... Unknown...........................
Total known....................... Friend, acquaintance1 …. Spouse, parent, child….. Spouse2 ....................... Parent, child3 ......…..... All other relatives…........ Stranger..........................
2,402 1,109
1,293 601 198
93 105 52
442
240 81
159 48 61
0 61
9 41
1,100 592
508 264 21 17
4 10
213
486 221
265 141 33 28
5 6
85
560 200
360 148 83 48 35 26
103
16 15
1 0 0 0 0 1 0
Percent based on total known Total known.......................
Friend, acquaintance1 …. Spouse, parent, child….. Spouse2 ....................... Parent, child3 ......…..... All other relatives…........ Stranger..........................
100.0 46.5 15.3
7.2 8.1 4.0
34.2
100.0 30.2 38.4 0.0
38.4 5.7
25.8
100.0 52.0 4.1 3.3 0.8 2.0
41.9
100.0 53.2 12.5 10.6 1.9 2.3
32.1
100.0 41.1 23.1 13.3 9.7 7.2
28.6
100.0 ------
Notes: Percentages may not add to subtotals or 100.0 because of rounding. Dash indicates that percent distributions are not calculated when the base number is less than 50.
1 Includes ex-husband, ex-wife, employer, employee, gang member, etc. 2 Includes "common-law" marriage partner. 3 Includes stepmother, stepfather, stepdaughter, and stepson.
56

Table 14 HOMICIDE CRIMES, 1994-2003
By CountyNumber and Rate per 100,000 Population
County 1994 1995 1996 1997 1998 1999 2000 2001 2002 2003
Number Statewide total.…... 3,699 3,530 2,910 2,579 2,170 2,006 2,074 2,201 2,392 2,402
Alameda....…...... 187 196 142 142 107 85 110 108 144 139 Alpine........…...... 0 0 0 0 0 0 0 0 0 0 Amador............... 0 0 0 0 0 1 1 0 0 0 Butte..…............. 6 5 10 8 6 4 8 11 5 9 Calaveras...….... 4 3 2 2 2 0 4 2 2 2
Colusa................ 0 1 0 2 1 3 4 0 0 0 Contra Costa.….. 120 80 71 63 54 57 56 49 48 74 Del Norte............ 1 0 0 1 0 1 1 1 2 0 El Dorado..…...... 7 4 2 4 7 3 3 5 4 2 Fresno................ 122 105 93 84 57 43 38 61 62 59
Glenn.................. 0 0 1 0 3 1 1 0 0 2 Humboldt............ 7 8 3 8 5 12 4 7 12 8 Imperial............... 6 9 13 5 8 2 4 5 3 12 Inyo.........……..... 0 0 0 1 0 0 1 0 0 2 Kern......….......... 92 71 52 55 55 52 37 39 51 46
Kings.....….......... 7 7 10 5 5 1 3 1 4 5 Lake......….......... 4 5 2 5 6 4 5 1 4 1 Lassen................ 2 4 0 0 1 4 0 0 0 0 Los Angeles….... 1,669 1,682 1,398 1,176 959 891 1,000 1,070 1,162 1,053 Madera.…........... 15 12 11 6 12 6 10 15 6 7
Marin....…........... 2 7 2 1 1 2 5 3 4 0 Mariposa............. 0 1 0 1 1 2 0 0 0 0 Mendocino.......... 6 3 5 7 6 7 5 4 4 9 Merced.…........... 16 11 8 17 17 14 6 5 18 16 Modoc..…........... 0 0 0 0 0 0 0 1 0 0
Mono....…........... 0 0 1 0 0 0 1 0 0 1 Monterey............. 40 26 23 33 27 29 25 26 28 27 Napa....…............ 2 2 0 2 1 2 3 1 2 2 Nevada..….......... 2 1 2 0 3 6 1 6 3 2 Orange.…........... 171 166 111 102 85 92 56 63 77 64
(continued) 57

Table 14 - continued HOMICIDE CRIMES, 1994-2003
By County Number and Rate per 100,000 Population
County 1994 1995 1996 1997 1998 1999 2000 2001 2002 2003
Number Placer..….…........ 8 7 5 3 7 1 5 3 0 10 Plumas…............ 0 1 2 0 1 1 1 1 0 2 Riverside…......... 166 133 111 110 104 89 79 93 111 94 Sacramento…..... 126 103 93 87 73 82 75 78 83 83 San Benito…....... 2 2 0 1 2 1 3 6 1 2
San Bernardino… 243 225 185 146 147 110 145 125 141 163 San Diego….….... 206 198 166 125 87 106 97 92 87 129 San Francisco...... 92 99 82 59 58 64 59 62 68 69 San Joaquin.….... 64 62 66 73 42 39 39 50 59 58 San Luis Obispo.. 9 8 5 5 7 4 3 7 3 7
San Mateo.…....... 26 35 11 28 23 18 10 18 21 20 Santa Barbara….. 11 11 12 10 11 5 10 12 8 4 Santa Clara…...... 56 56 48 62 44 37 34 34 37 48 Santa Cruz…....... 6 8 10 4 9 4 9 13 6 13 Shasta.....…......… 12 8 9 7 7 11 3 5 5 5
Sierra........…........ 0 0 0 0 0 1 0 0 0 1 Siskiyou....…........ 0 5 2 0 3 0 1 1 4 2 Solano….….…..... 44 27 22 12 14 16 21 10 16 20 Sonoma.….......... 18 15 17 13 11 8 11 12 16 12 Stanislaus.…....... 27 32 28 29 25 25 16 34 15 27
Sutter........…....... 3 2 5 4 1 5 2 5 7 3 Tehama..…......... 2 5 3 1 5 1 5 3 2 1 Trinity........…....... 2 1 1 3 0 1 2 0 0 1 Tulare........…...... 42 39 22 29 22 24 17 26 29 30 Tuolumne…........ 3 0 1 0 0 2 2 1 2 4
Ventura..……....... 28 26 33 25 24 19 24 19 21 42 Yolo..........…........ 11 9 7 7 8 6 6 4 5 5 Yuba.........…........ 4 4 2 6 6 2 3 3 0 5
(continued)
58

Table 14 - continued HOMICIDE CRIMES, 1994-2003
By CountyNumber and Rate per 100,000 Population
County 1994 1995 1996 1997 1998 1999 2000 2001 2002 2003
Rate per 100,000 population Statewide total.…... 11.5 11.0 9.0 7.8 6.5 5.9 6.0 6.3 6.8 6.7
Alameda....…...... 13.8 14.5 10.4 10.2 7.5 5.9 7.5 7.3 9.7 9.3 Alpine........…...... - - - - - - - - - - Amador............... - - - - - - - - - - Butte..…............. 2.9 2.5 5.1 4.0 3.0 2.0 3.9 5.3 2.4 4.2 Calaveras...….... - - - - - - - - - -
Colusa................ - - - - - - - - - - Contra Costa.….. 13.7 9.2 8.1 7.0 5.9 6.1 5.8 5.0 4.9 7.4 Del Norte............ - - - - - - - - - - El Dorado..…...... 4.8 2.8 1.4 2.7 4.7 2.0 1.9 3.1 2.4 1.2 Fresno................ 16.1 13.9 12.1 10.8 7.3 5.4 4.7 7.4 7.4 6.9
Glenn.................. - - - - - - - - - - Humboldt............ 5.5 6.4 2.4 6.3 4.0 9.5 3.1 5.5 9.4 6.2 Imperial............... 4.3 6.6 9.2 3.5 5.6 1.4 2.7 3.3 2.0 7.8 Inyo.........……..... - - - - - - - - - - Kern......….......... 14.8 11.5 8.3 8.7 8.6 8.0 5.5 5.7 7.3 6.4
Kings.....….......... 6.1 6.1 8.6 4.2 4.0 0.8 2.2 0.8 3.0 3.6 Lake......….......... - - - - - - - - - - Lassen................ - - - - - - - - - - Los Angeles….... 18.1 18.0 14.9 12.3 9.9 9.1 10.3 11.0 11.7 10.5 Madera.…........... 13.9 11.3 10.0 5.3 10.5 5.1 7.8 11.5 4.6 5.2
Marin....…........... 0.8 2.9 0.8 0.4 0.4 0.8 2.0 1.2 1.6 0.0 Mariposa............. - - - - - - - - - - Mendocino.......... - - - - - - - - - - Merced.…........... 8.0 5.5 4.0 8.4 8.3 6.8 2.8 2.3 8.1 6.9 Modoc..…........... - - - - - - - - - -
Mono....…........... - - - - - - - - - - Monterey............. 10.8 7.2 6.4 8.7 7.0 7.4 6.1 6.4 6.8 6.4 Napa....…............ 1.7 1.7 0.0 1.7 0.8 1.6 2.4 0.8 1.6 1.5 Nevada..….......... - - - - - - - - - - Orange.…........... 6.5 6.3 4.2 3.8 3.1 3.3 1.9 2.2 2.6 2.1
(continued) 59

Table 14 - continued HOMICIDE CRIMES, 1994-2003
By County Number and Rate per 100,000 Population
County 1994 1995 1996 1997 1998 1999 2000 2001 2002 2003
Rate per 100,000 population Placer..….…........ 3.9 3.4 2.4 1.4 3.1 0.4 2.0 1.1 0.0 3.5 Plumas…............ - - - - - - - - - - Riverside…......... 12.0 9.7 8.0 7.7 7.1 5.9 5.0 5.7 6.6 5.3 Sacramento…..... 11.1 9.2 8.2 7.6 6.3 6.8 6.0 6.2 6.4 6.2 San Benito…....... - - - - - - - - - -
San Bernardino… 15.1 14.2 11.6 9.0 8.9 6.6 8.3 7.1 7.8 8.7 San Diego….….... 7.6 7.4 6.2 4.5 3.1 3.7 3.4 3.2 3.0 4.3 San Francisco...... 12.2 13.2 10.7 7.6 7.3 8.0 7.5 7.9 8.6 8.8 San Joaquin.….... 12.2 11.8 12.4 13.5 7.6 6.9 6.8 8.5 9.7 9.3 San Luis Obispo.. 3.8 3.5 2.2 2.1 2.9 1.7 1.2 2.8 1.2 2.7
San Mateo.…....... 3.8 5.1 1.6 3.9 3.2 2.5 1.4 2.5 2.9 2.8 Santa Barbara….. 2.8 2.8 3.0 2.5 2.7 1.2 2.5 3.0 2.0 1.0 Santa Clara…...... 3.5 3.5 2.9 3.7 2.6 2.2 2.0 2.0 2.2 2.8 Santa Cruz…....... 2.5 3.3 4.1 1.6 3.6 1.6 3.5 5.0 2.3 5.0 Shasta.....…......… 7.3 5.0 5.6 4.3 4.2 6.7 1.8 3.0 2.9 2.8
Sierra........…........ - - - - - - - - - - Siskiyou....…........ - - - - - - - - - - Solano….….…..... 11.7 7.3 5.9 3.2 3.6 4.1 5.2 2.5 3.9 4.8 Sonoma.….......... 4.2 3.6 4.0 3.0 2.5 1.8 2.4 2.6 3.4 2.5 Stanislaus.…....... 6.5 7.7 6.7 6.8 5.8 5.7 3.5 7.3 3.1 5.5
Sutter........…....... - - - - - - - - - - Tehama..…......... - - - - - - - - - - Trinity........…....... - - - - - - - - - - Tulare........…...... 11.9 11.1 6.2 8.1 6.1 6.6 4.5 6.9 7.6 7.6 Tuolumne…........ - - - - - - - - - -
Ventura..……....... 3.9 3.6 4.6 3.4 3.3 2.5 3.1 2.5 2.7 5.3 Yolo..........…........ 7.3 6.0 4.6 4.5 5.1 3.8 3.5 2.3 2.8 2.7 Yuba.........…........ - - - - - - - - - -
Notes: Dash indicates that a rate is not computed when a county's population is less than 100,000 in a given year. Rates are based on annual population estimates provided by the Demographic Research Unit, California Department of Finance. Rates are calculated using the population for each county shown; therefore, they will not add to the rate calculated for the state.
60

Table 15 HOMICIDE CRIMES, 1994-2003 By Season and Month of Incident
Season and month of incident 1994 1995 1996 1997 1998 1999 2000 2001 2002 2003
Number Total including unknown... 3,699 3,530 2,910 2,579 2,170 2,006 2,074 2,201 2,392 2,402 Unknown........................ 0 0 0 0 0 0 0 0 0 0
Total known................... 3,699 3,530 2,910 2,579 2,170 2,006 2,074 2,201 2,392 2,402 Spring..............…........ 925 806 682 651 517 451 464 528 582 566 March........…........... 316 272 201 226 197 142 126 159 189 191 April..........…............ 307 255 225 217 156 147 162 176 188 154 May..........…............ 302 279 256 208 164 162 176 193 205 221 Summer...........…........ 942 978 745 678 568 562 597 581 623 652 June.........…............. 307 270 254 212 177 157 205 165 183 197 July.........…............. 305 333 272 232 171 199 185 208 230 233 August....….............. 330 375 219 234 220 206 207 208 210 222 Fall...........…............... 930 956 699 662 522 516 497 613 638 601 September............... 310 326 256 228 159 171 173 221 253 209 October.................... 345 345 212 240 178 174 174 213 181 213 November................ 275 285 231 194 185 171 150 179 204 179 Winter......................... 902 790 784 588 563 477 516 479 549 583 December…............. 293 281 238 194 207 166 210 168 175 210 January.................... 315 279 296 203 199 183 175 171 214 189 February................... 294 230 250 191 157 128 131 140 160 184
Percent based on total known Total known................... 100.0 100.0 100.0 100.0 100.0 100.0 100.0 100.0 100.0 100.0 Spring..............…........ 25.0 22.8 23.4 25.2 23.8 22.5 22.4 24.0 24.3 23.6 March........…........... 8.5 7.7 6.9 8.8 9.1 7.1 6.1 7.2 7.9 8.0 April..........…............ 8.3 7.2 7.7 8.4 7.2 7.3 7.8 8.0 7.9 6.4 May..........…............ 8.2 7.9 8.8 8.1 7.6 8.1 8.5 8.8 8.6 9.2 Summer...........…........ 25.5 27.7 25.6 26.3 26.2 28.0 28.8 26.4 26.0 27.1 June.........…............. 8.3 7.6 8.7 8.2 8.2 7.8 9.9 7.5 7.7 8.2 July.........…............. 8.2 9.4 9.3 9.0 7.9 9.9 8.9 9.5 9.6 9.7 August....….............. 8.9 10.6 7.5 9.1 10.1 10.3 10.0 9.5 8.8 9.2 Fall...........…............... 25.1 27.1 24.0 25.7 24.1 25.7 24.0 27.9 26.7 25.0 September............... 8.4 9.2 8.8 8.8 7.3 8.5 8.3 10.0 10.6 8.7 October.................... 9.3 9.8 7.3 9.3 8.2 8.7 8.4 9.7 7.6 8.9 November................ 7.4 8.1 7.9 7.5 8.5 8.5 7.2 8.1 8.5 7.5 Winter......................... 24.4 22.4 26.9 22.8 25.9 23.8 24.9 21.8 23.0 24.3 December…............. 7.9 8.0 8.2 7.5 9.5 8.3 10.1 7.6 7.3 8.7 January.................... 8.5 7.9 10.2 7.9 9.2 9.1 8.4 7.8 8.9 7.9 February................... 7.9 6.5 8.6 7.4 7.2 6.4 6.3 6.4 6.7 7.7
Note: Percentages may not add to subtotals or 100.0 because of rounding. 61

Table 16 HOMICIDE CRIMES, 2003
Gender and Race/Ethnic Group of Victim by Day of Incident
Day of incident Total
Gender Race/ethnic group
Male Female White Hispanic Black Other Unknown
Number Total including unknown…. 2,402 1,972 430 444 1,053 713 185 7 Unknown......................... 0 0 0 0 0 0 0 0 Total known..................... 2,402 1,972 430 444 1,053 713 185 7
Weekday.....….............. 1,545 1,236 309 311 629 467 131 7 Monday.....…............. 333 271 62 74 133 99 25 2 Tuesday....…............. 318 242 76 63 133 91 31 0 Wednesday…........... 309 242 67 58 123 93 34 1 Thursday...…............ 258 213 45 65 102 77 12 2 Friday.....…................ 327 268 59 51 138 107 29 2 Weekend..…................ 857 736 121 133 424 246 54 0 Saturday.....…........... 415 355 60 76 193 120 26 0 Sunday.......…........... 442 381 61 57 231 126 28 0
Percent based on total known Total known..................... 100.0 100.0 100.0 100.0 100.0 100.0 100.0 100.0
Weekday.....….............. 64.3 62.7 71.9 70.0 59.7 65.5 70.8 - Monday.....…............. 13.9 13.7 14.4 16.7 12.6 13.9 13.5 - Tuesday....…............. 13.2 12.3 17.7 14.2 12.6 12.8 16.8 - Wednesday…........... 12.9 12.3 15.6 13.1 11.7 13.0 18.4 - Thursday...…............ 10.7 10.8 10.5 14.6 9.7 10.8 6.5 - Friday.....…................ 13.6 13.6 13.7 11.5 13.1 15.0 15.7 -Weekend..…................ 35.7 37.3 28.1 30.0 40.3 34.5 29.2 - Saturday.....…........... 17.3 18.0 14.0 17.1 18.3 16.8 14.1 - Sunday.......…........... 18.4 19.3 14.2 12.8 21.9 17.7 15.1 -
Average daily number of incidents1
Weekday......…............. 5.9 4.7 1.2 1.2 2.4 1.8 0.5 0.0 Weekend......…............. 8.2 7.1 1.2 1.3 4.1 2.4 0.5 0.0
Notes: Percentages may not add to subtotals or 100.0 because of rounding. Dash indicates that percent distributions are not calculated when the base number is less than 50. Average daily number of incidents may not add to totals because of rounding.
1 There were 365 days in 2003; 261 weekdays and 104 weekend days. The average daily number of incidents for weekdays was calculated by dividing weekday totals by 261. The average daily number of incidents for weekends was calculated by dividing weekend totals by 104.
62
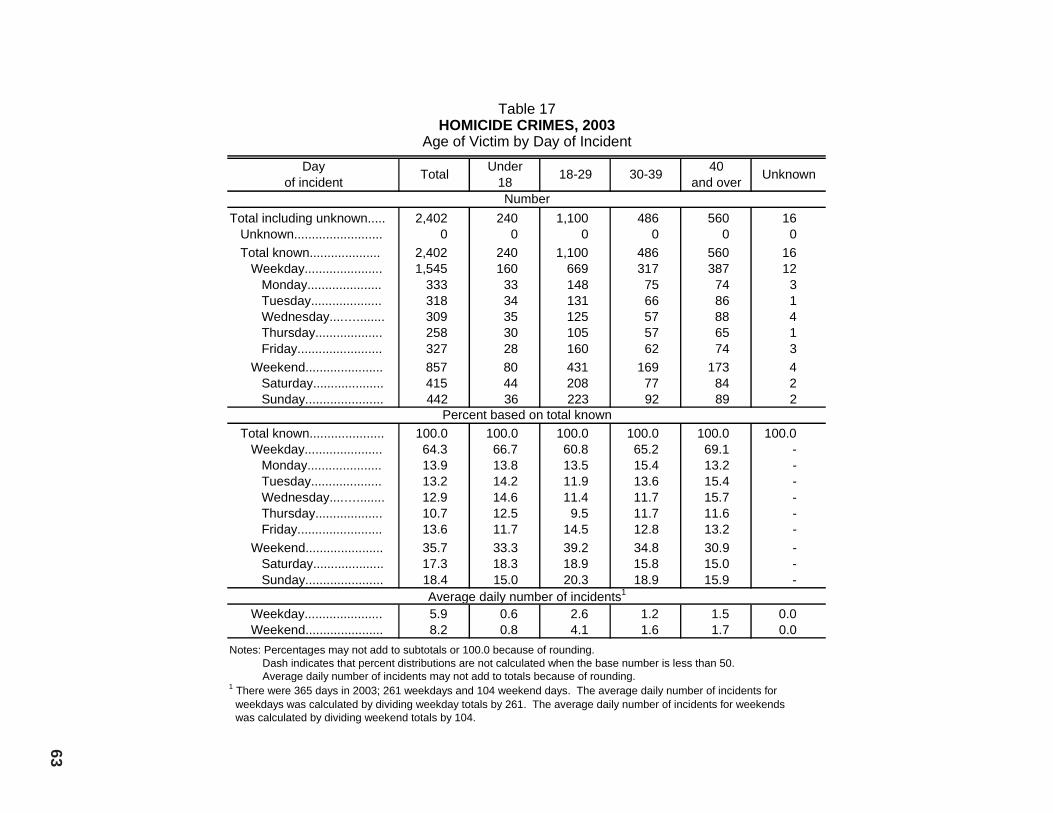
Table 17 HOMICIDE CRIMES, 2003
Age of Victim by Day of Incident Day
of incident Total Under 18 18-29 30-39 40
and over Unknown
Number Total including unknown.....
Unknown......................... Total known.................... Weekday......................
Monday..................... Tuesday.................... Wednesday....…........ Thursday................... Friday........................
Weekend...................... Saturday.................... Sunday......................
2,402 0
2,402 1,545
333 318 309 258 327 857 415 442
240 0
240 160
33 34 35 30 28 80 44 36
1,100 0
1,100 669 148 131 125 105 160 431 208 223
486 0
486 317
75 66 57 57 62
169 77 92
560 0
560 387
74 86 88 65 74
173 84 89
16 0
16 12
3 1 4 1 3 4 2 2
Percent based on total known Total known..................... Weekday......................
Monday..................... Tuesday.................... Wednesday....…........ Thursday................... Friday........................
Weekend...................... Saturday.................... Sunday......................
100.0 64.3 13.9 13.2 12.9 10.7 13.6 35.7 17.3 18.4
100.0 66.7 13.8 14.2 14.6 12.5 11.7 33.3 18.3 15.0
100.0 60.8 13.5 11.9 11.4
9.5 14.5 39.2 18.9 20.3
100.0 65.2 15.4 13.6 11.7 11.7 12.8 34.8 15.8 18.9
100.0 69.1 13.2 15.4 15.7 11.6 13.2 30.9 15.0 15.9
100.0 ---------
Average daily number of incidents1
Weekday...................... Weekend......................
5.9 8.2
0.6 0.8
2.6 4.1
1.2 1.6
1.5 1.7
0.0 0.0
Notes: Percentages may not add to subtotals or 100.0 because of rounding. Dash indicates that percent distributions are not calculated when the base number is less than 50. Average daily number of incidents may not add to totals because of rounding.
1 There were 365 days in 2003; 261 weekdays and 104 weekend days. The average daily number of incidents for weekdays was calculated by dividing weekday totals by 261. The average daily number of incidents for weekends was calculated by dividing weekend totals by 104.
63
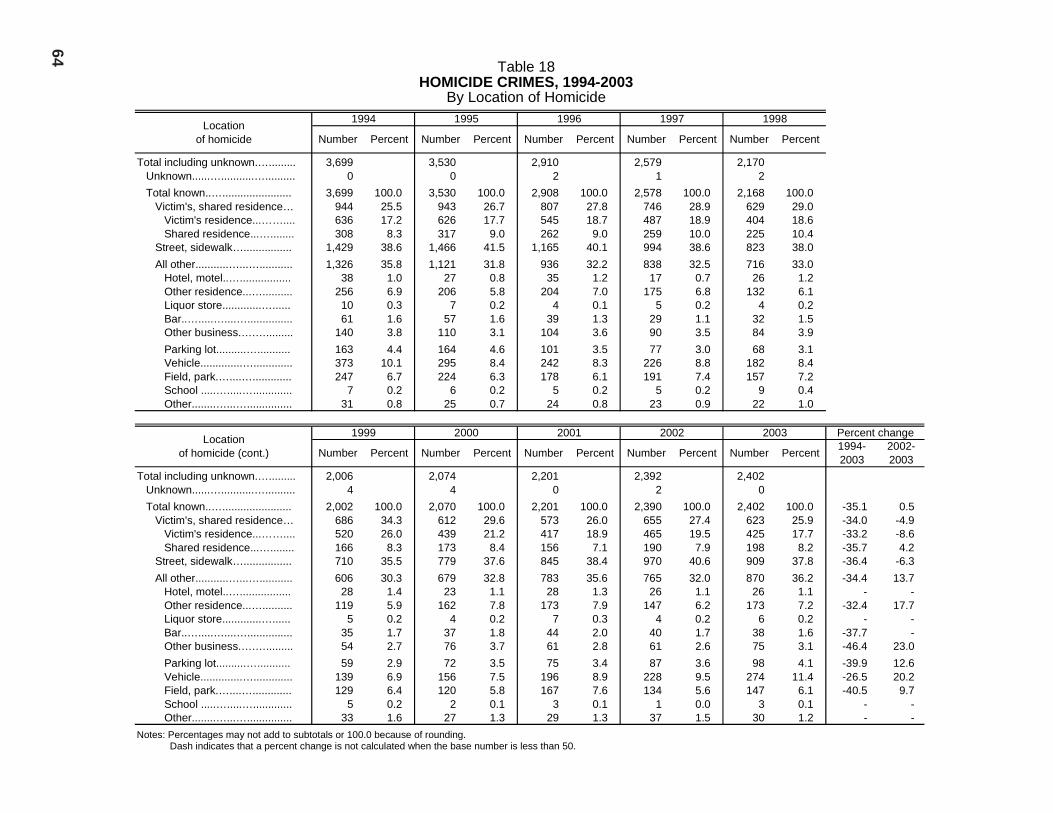
Table 18 HOMICIDE CRIMES, 1994-2003
By Location of Homicide
Location of homicide
1994 1995 1996 1997 1998
Number Percent Number Percent Number Percent Number Percent Number Percent
Total including unknown.…......... 3,699 3,530 2,910 2,579 2,170 Unknown......…...........….......... 0 0 2 1 2 Total known..…....................... 3,699 100.0 3,530 100.0 2,908 100.0 2,578 100.0 2,168 100.0 Victim's, shared residence… 944 25.5 943 26.7 807 27.8 746 28.9 629 29.0 Victim's residence...…….... 636 17.2 626 17.7 545 18.7 487 18.9 404 18.6 Shared residence...…........ 308 8.3 317 9.0 262 9.0 259 10.0 225 10.4 Street, sidewalk…................ 1,429 38.6 1,466 41.5 1,165 40.1 994 38.6 823 38.0 All other...........…...…........... 1,326 35.8 1,121 31.8 936 32.2 838 32.5 716 33.0 Hotel, motel..…................. 38 1.0 27 0.8 35 1.2 17 0.7 26 1.2 Other residence...….......... 256 6.9 206 5.8 204 7.0 175 6.8 132 6.1 Liquor store.............…...... 10 0.3 7 0.2 4 0.1 5 0.2 4 0.2 Bar..….....…....…............... 61 1.6 57 1.6 39 1.3 29 1.1 32 1.5 Other business.….…......... 140 3.8 110 3.1 104 3.6 90 3.5 84 3.9 Parking lot..........…........... 163 4.4 164 4.6 101 3.5 77 3.0 68 3.1 Vehicle..............…............. 373 10.1 295 8.4 242 8.3 226 8.8 182 8.4 Field, park.…....…............. 247 6.7 224 6.3 178 6.1 191 7.4 157 7.2 School .....….....…............. 7 0.2 6 0.2 5 0.2 5 0.2 9 0.4 Other........…...…............... 31 0.8 25 0.7 24 0.8 23 0.9 22 1.0
Location of homicide (cont.)
1999 2000 2001 2002 2003 Percent change
Number Percent Number Percent Percent Number Number Percent Number Percent 1994- 2003
2002- 2003
Total including unknown.…......... 2,006 2,074 2,201 2,392 2,402 Unknown......…...........….......... 4 4 0 2 0 Total known..…....................... 2,002 100.0 2,070 100.0 2,201 100.0 2,390 100.0 2,402 100.0 -35.1 0.5 Victim's, shared residence… 686 34.3 612 29.6 573 26.0 655 27.4 623 25.9 -34.0 -4.9 Victim's residence...…….... 520 26.0 439 21.2 417 18.9 465 19.5 425 17.7 -33.2 -8.6 Shared residence...…........ 166 8.3 173 8.4 156 7.1 190 7.9 198 8.2 -35.7 4.2 Street, sidewalk…................ 710 35.5 779 37.6 845 38.4 970 40.6 909 37.8 -36.4 -6.3 All other...........…...…........... 606 30.3 679 32.8 783 35.6 765 32.0 870 36.2 -34.4 13.7 Hotel, motel..…................. 28 1.4 23 1.1 28 1.3 26 1.1 26 1.1 - - Other residence...….......... 119 5.9 162 7.8 173 7.9 147 6.2 173 7.2 -32.4 17.7 Liquor store.............…...... 5 0.2 4 0.2 7 0.3 4 0.2 6 0.2 - - Bar..….....…....…............... 35 1.7 37 1.8 44 2.0 40 1.7 38 1.6 -37.7 - Other business.….…......... 54 2.7 76 3.7 61 2.8 61 2.6 75 3.1 -46.4 23.0 Parking lot..........…........... 59 2.9 72 3.5 75 3.4 87 3.6 98 4.1 -39.9 12.6 Vehicle..............…............. 139 6.9 156 7.5 196 8.9 228 9.5 274 11.4 -26.5 20.2 Field, park.…....…............. 129 6.4 120 5.8 167 7.6 134 5.6 147 6.1 -40.5 9.7 School .....….....…............. 5 0.2 2 0.1 3 0.1 1 0.0 3 0.1 - - Other........…...…............... 33 1.6 27 1.3 29 1.3 37 1.5 30 1.2 - -Notes: Percentages may not add to subtotals or 100.0 because of rounding.
Dash indicates that a percent change is not calculated when the base number is less than 50.
64

Table 19 HOMICIDE CRIMES, 2003
Gender and Race/Ethnic Group of Victim by Location of Homicide
Location of homicide Total
Gender Race/ethnic group
Male Female White Hispanic Black Other Unknown
Number Total including unknown…......... 2,402 1,972 430 444 1,053 713 185 7 Unknown...........…..…............. 0 0 0 0 0 0 0 0 Total known......…...…............. 2,402 1,972 430 444 1,053 713 185 7
Victim's, shared residence… 623 383 240 191 230 136 66 0 Victim's residence….…..... 425 307 118 125 166 95 39 0 Shared residence.….…..... 198 76 122 66 64 41 27 0
Street, sidewalk......….......... 909 849 60 80 450 351 28 0 All other.................…........... 870 740 130 173 373 226 91 7
Hotel, motel.…..….…........ 26 20 6 10 7 8 1 0 Other residence..…........... 173 143 30 49 75 36 11 2 Liquor store......…...…....... 6 5 1 1 2 2 1 0 Bar.................…....…........ 38 35 3 6 19 5 8 0 Other business...…...…..... 75 64 11 12 32 15 16 0 Parking lot.........….…........ 98 89 9 12 49 29 8 0 Vehicle.....….......….…....... 274 238 36 30 109 107 26 2 Field, park..........….…....... 147 116 31 42 69 20 13 3 School....…............…........ 3 3 0 1 1 1 0 0 Other......…............…........ 30 27 3 10 10 3 7 0
Percent based on total known Total known......…...…............. 100.0 100.0 100.0 100.0 100.0 100.0 100.0 100.0
Victim's, shared residence… 25.9 19.4 55.8 43.0 21.8 19.1 35.7 - Victim's residence….…..... 17.7 15.6 27.4 28.2 15.8 13.3 21.1 - Shared residence.….…..... 8.2 3.9 28.4 14.9 6.1 5.8 14.6 -
Street, sidewalk......….......... 37.8 43.1 14.0 18.0 42.7 49.2 15.1 - All other.................…........... 36.2 37.5 30.2 39.0 35.4 31.7 49.2 -
Hotel, motel.…..….…........ 1.1 1.0 1.4 2.3 0.7 1.1 0.5 - Other residence..…........... 7.2 7.3 7.0 11.0 7.1 5.0 5.9 - Liquor store......…...…....... 0.2 0.3 0.2 0.2 0.2 0.3 0.5 - Bar.................…....…........ 1.6 1.8 0.7 1.4 1.8 0.7 4.3 - Other business...…...…..... 3.1 3.2 2.6 2.7 3.0 2.1 8.6 - Parking lot.........….…........ 4.1 4.5 2.1 2.7 4.7 4.1 4.3 - Vehicle.....….......….…....... 11.4 12.1 8.4 6.8 10.4 15.0 14.1 - Field, park..........….…....... 6.1 5.9 7.2 9.5 6.6 2.8 7.0 - School....…............…........ 0.1 0.2 0.0 0.2 0.1 0.1 0.0 - Other......…............…........ 1.2 1.4 0.7 2.3 0.9 0.4 3.8 -
Notes: Percentages may not add to subtotals or 100.0 because of rounding. Dash indicates that percent distributions are not calculated when the base number is less than 50. 65

Table 20 HOMICIDE CRIMES, 2003
Age of Victim by Location of Homicide Location
of homicide Total Under 18 18-29 30-39 40
and over Unknown
Number Total including unknown…......... 2,402 240 1,100 486 560 16 Unknown..........…...….............. 0 0 0 0 0 0 Total known....…....…............... 2,402 240 1,100 486 560 16
Victim's, shared residence…. 623 93 171 120 235 4 Victim's residence..……..... 425 42 134 85 160 4 Shared residence..……...... 198 51 37 35 75 0
Street, sidewalk.......……....... 909 85 503 178 140 3 All other..................….…....... 870 62 426 188 185 9
Hotel, motel..........….......... 26 1 8 3 14 0 Other residence....……...... 173 16 83 40 34 0 Liquor store..........….......... 6 0 2 2 2 0 Bar..................…..……....... 38 1 17 10 10 0 Other business.....…..…..... 75 1 31 18 25 0 Parking lot............….......... 98 5 51 24 16 2 Vehicle...............…..…....... 274 27 152 49 44 2 Field, park............….......... 147 10 70 34 28 5 School.................……........ 3 0 2 0 1 0 Other..............…...….......... 30 1 10 8 11 0
Percent based on total known Total known....…....…............... 100.0 100.0 100.0 100.0 100.0 100.0
Victim's, shared residence…. 25.9 38.8 15.5 24.7 42.0 -Victim's residence..……..... 17.7 17.5 12.2 17.5 28.6 -Shared residence..……...... 8.2 21.3 3.4 7.2 13.4 -
Street, sidewalk.......……....... 37.8 35.4 45.7 36.6 25.0 -All other..................….…....... 36.2 25.8 38.7 38.7 33.0 -
Hotel, motel..........….......... 1.1 0.4 0.7 0.6 2.5 -Other residence....……...... 7.2 6.7 7.5 8.2 6.1 -Liquor store..........….......... 0.2 0.0 0.2 0.4 0.4 -Bar..................…..……....... 1.6 0.4 1.5 2.1 1.8 -Other business.....…..…..... 3.1 0.4 2.8 3.7 4.5 -Parking lot............….......... 4.1 2.1 4.6 4.9 2.9 -Vehicle...............…..…....... 11.4 11.3 13.8 10.1 7.9 -Field, park............….......... 6.1 4.2 6.4 7.0 5.0 -School.................……........ 0.1 0.0 0.2 0.0 0.2 -Other..............…...….......... 1.2 0.4 0.9 1.6 2.0 -
Notes: Percentages may not add to subtotals or 100.0 because of rounding. Dash indicates that percent distributions are not calculated when the base number is less than 50.
66
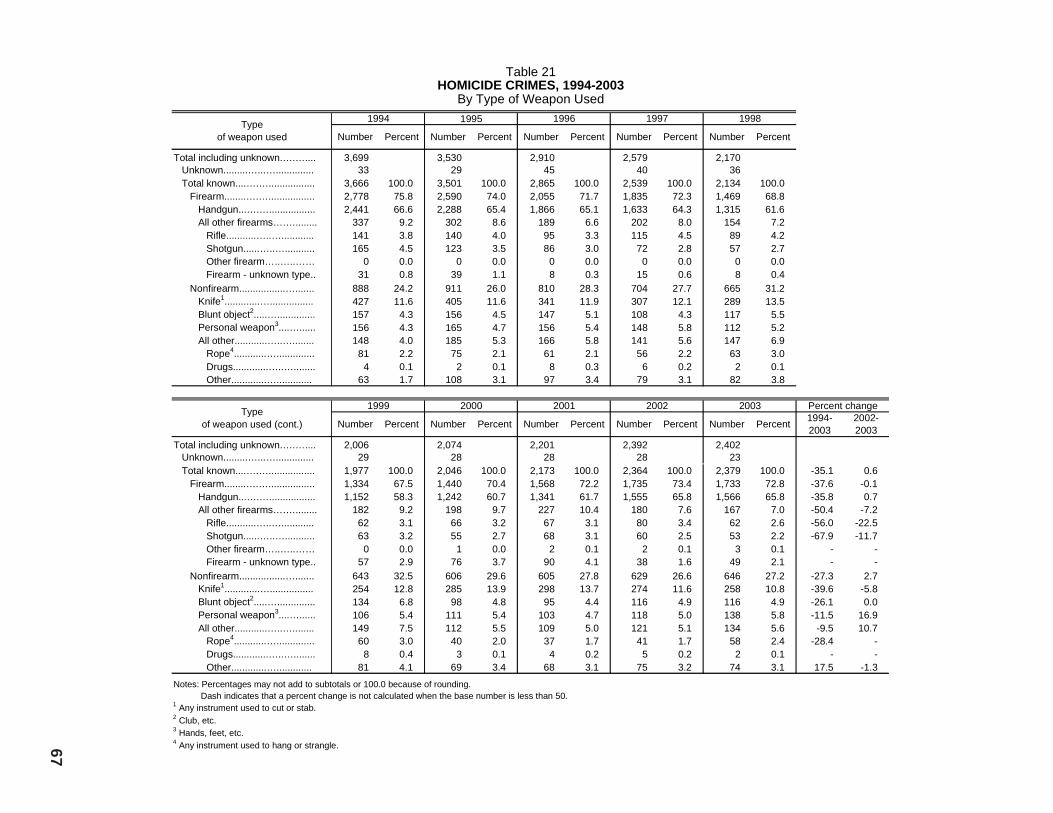
Table 21 HOMICIDE CRIMES, 1994-2003
By Type of Weapon Used
Type of weapon used
1994 1995 1996 1997 1998
Number Percent Number Percent Percent Number Number Percent Number Percent
Total including unknown.….….... 3,699 3,530 2,910 2,579 2,170 Unknown.........…...….............. 33 29 45 40 36 Total known....….…................. 3,666 100.0 3,501 100.0 2,865 100.0 2,539 100.0 2,134 100.0 Firearm........….…................. 2,778 75.8 2,590 74.0 2,055 71.7 1,835 72.3 1,469 68.8
Handgun...….…................. 2,441 66.6 2,288 65.4 1,866 65.1 1,633 64.3 1,315 61.6 All other firearms….…........ 337 9.2 302 8.6 189 6.6 202 8.0 154 7.2 Rifle...........…..…............ 141 3.8 140 4.0 95 3.3 115 4.5 89 4.2 Shotgun......…..…........... 165 4.5 123 3.5 86 3.0 72 2.8 57 2.7 Other firearm…..…..…… 0 0.0 0 0.0 0 0.0 0 0.0 0 0.0 Firearm - unknown type.. 31 0.8 39 1.1 8 0.3 15 0.6 8 0.4
Nonfirearm.................…....... 888 24.2 911 26.0 810 28.3 704 27.7 665 31.2 Knife1 .............…................ 427 11.6 405 11.6 341 11.9 307 12.1 289 13.5 Blunt object2 .....….............. 157 4.3 156 4.5 147 5.1 108 4.3 117 5.5 Personal weapon3 ....…...... 156 4.3 165 4.7 156 5.4 148 5.8 112 5.2 All other............…..…........ 148 4.0 185 5.3 166 5.8 141 5.6 147 6.9 Rope4 ............….............. 81 2.2 75 2.1 61 2.1 56 2.2 63 3.0 Drugs.............…..…........ 4 0.1 2 0.1 8 0.3 6 0.2 2 0.1 Other.............…............. 63 1.7 108 3.1 97 3.4 79 3.1 82 3.8
Type of weapon used (cont.)
1999 2000 2001 2002 2003 Percent change
Number Percent Number Percent Number Percent Number Percent Number Percent 1994-2003
2002- 2003
Total including unknown.….….... 2,006 2,074 2,201 2,392 2,402 Unknown.........…...….............. 29 28 28 28 23 Total known....….…................. 1,977 100.0 2,046 100.0 2,173 100.0 2,364 100.0 2,379 100.0 -35.1 0.6 Firearm........….…................. 1,334 67.5 1,440 70.4 1,568 72.2 1,735 73.4 1,733 72.8 -37.6 -0.1
Handgun...….…................. 1,152 58.3 1,242 60.7 1,341 61.7 1,555 65.8 1,566 65.8 -35.8 0.7 All other firearms….…........ 182 9.2 198 9.7 227 10.4 180 7.6 167 7.0 -50.4 -7.2 Rifle...........…..…............ 62 3.1 66 3.2 67 3.1 80 3.4 62 2.6 -56.0 -22.5 Shotgun......…..…........... 63 3.2 55 2.7 68 3.1 60 2.5 53 2.2 -67.9 -11.7 Other firearm…..…..…… 0 0.0 1 0.0 2 0.1 2 0.1 3 0.1 - - Firearm - unknown type.. 57 2.9 76 3.7 90 4.1 38 1.6 49 2.1 - -
Nonfirearm.................…....... 643 32.5 606 29.6 605 27.8 629 26.6 646 27.2 -27.3 2.7 Knife1 .............…................ 254 12.8 285 13.9 298 13.7 274 11.6 258 10.8 -39.6 -5.8 Blunt object2 .....….............. 134 6.8 98 4.8 95 4.4 116 4.9 116 4.9 -26.1 0.0 Personal weapon3 ....…...... 106 5.4 111 5.4 103 4.7 118 5.0 138 5.8 -11.5 16.9 All other............…..…........ 149 7.5 112 5.5 109 5.0 121 5.1 134 5.6 -9.5 10.7 Rope4 ............….............. 60 3.0 40 2.0 37 1.7 41 1.7 58 2.4 -28.4 - Drugs.............…..…........ 8 0.4 3 0.1 4 0.2 5 0.2 2 0.1 - - Other.............…............. 81 4.1 69 3.4 68 3.1 75 3.2 74 3.1 17.5 -1.3
Notes: Percentages may not add to subtotals or 100.0 because of rounding. Dash indicates that a percent change is not calculated when the base number is less than 50.
1 Any instrument used to cut or stab. 2 Club, etc. 3 Hands, feet, etc. 4 Any instrument used to hang or strangle. 67

Table 22 HOMICIDE CRIMES, 2003
Gender and Race/Ethnic Group of Victim by Type of Weapon Used
Type of weapon used Total
Gender Race/ethnic group
Male Female White Black Other Hispanic Unknown
Number Total including unknown.…......... 2,402 1,972 430 444 1,053 713 185 7 Unknown........…...................... 23 13 10 7 7 3 1 5 Total known....…...................... 2,379 1,959 420 437 1,046 710 184 2
Firearm.......…....................... 1,733 1,533 200 209 804 596 123 1 Handgun..…....................... 1,566 1,388 178 175 735 544 111 1 All other firearms..……....... 167 145 22 34 69 52 12 0
Rifle.......….….................. 62 51 11 11 20 24 7 0 Shotgun....…................... 53 47 6 14 25 11 3 0 Other firearm.................. 3 2 1 1 0 1 1 0 Firearm - unknown type.. 49 45 4 8 24 16 1 0
Nonfirearm....…...….............. 646 426 220 228 242 114 61 1 Knife1 .............…................ 258 181 77 71 117 44 26 0 Blunt object 2 ...…............... 116 85 31 41 37 23 14 1 Personal weapon 3 ...…...... 138 96 42 61 52 18 7 0 All other................…......... 134 64 70 55 36 29 14 0
Rope 4 ................…......... 58 19 39 20 13 18 7 0 Drugs.................…......... 2 0 2 0 1 1 0 0 Other...........…..….......... 74 45 29 35 22 10 7 0
Percent based on total known Total known....…...................... 100.0 100.0 100.0 100.0 100.0 100.0 100.0 100.0
Firearm.......…....................... 72.8 78.3 47.6 47.8 76.9 83.9 66.8 - Handgun..…....................... 65.8 70.9 42.4 40.0 70.3 76.6 60.3 - All other firearms..……....... 7.0 7.4 5.2 7.8 6.6 7.3 6.5 -
Rifle.......….….................. 2.6 2.6 2.6 2.5 1.9 3.4 3.8 - Shotgun....…................... 2.2 2.4 1.4 3.2 2.4 1.5 1.6 - Other firearm.......…........ 0.1 0.1 0.2 0.2 0.0 0.1 0.5 - Firearm - unknown type.. 2.1 2.3 1.0 1.8 2.3 2.3 0.5 -
Nonfirearm....…...….............. 27.2 21.7 52.4 52.2 23.1 16.1 33.2 - Knife1 .............…................ 10.8 9.2 18.3 16.2 11.2 6.2 14.1 - Blunt object 2 ..…................ 4.9 4.3 7.4 9.4 3.5 3.2 7.6 - Personal weapon 3 ....…..... 5.8 4.9 10.0 14.0 5.0 2.5 3.8 - All other................…......... 5.6 3.3 16.7 12.6 3.4 4.1 7.6 -
Rope 4 ................…......... 2.4 1.0 9.3 4.6 1.2 2.5 3.8 - Drugs.................…......... 0.1 0.0 0.5 0.0 0.1 0.1 0.0 - Other............….….......... 3.1 2.3 6.9 8.0 2.1 1.4 3.8 -
Notes: Percentages may not add to subtotals or 100.0 because of rounding. Dash indicates that percent distributions are not calculated when the base number is less than 50. 1 Any instrument used to cut or stab. 2 Club, etc. 3 Hands, feet, etc. 4 Any instrument used to hang or strangle.
68

Table 23 HOMICIDE CRIMES, 2003
Age of Victim by Type of Weapon Used Type
of weapon used Total Under 18 18-29 30-39 40
and over Unknown
Number Total including unknown............. 2,402 240 1,100 486 560 16
Unknown.........…..................... 23 1 9 5 2 6 Total known..........…................ 2,379 239 1,091 481 558 10 Firearm..............…................ 1,733 147 933 356 289 8
Handgun.........…................ 1,566 131 845 328 255 7 All other firearms…............ 167 16 88 28 34 1
Rifle...............…............. 62 6 35 10 11 0 Shotgun..…....…............. 53 4 24 12 13 0 Other firearm.…............. 3 0 1 2 0 0 Firearm - unknown type.. 49 6 28 4 10 1
Nonfirearm...........…............. 646 92 158 125 269 2 Knife 1 .....….….................. 258 11 96 60 91 0 Blunt object 2 ...…............... 116 12 10 20 72 2 Personal weapon 3 .….….... 138 39 16 22 61 0 All other....…......…............ 134 30 36 23 45 0
Rope 4 ......…..….............. 58 5 20 13 20 0 Drugs.......…................... 2 2 0 0 0 0 Other............…............... 74 23 16 10 25 0
Percent based on total known Total known..........…................ 100.0 100.0 100.0 100.0 100.0 100.0 Firearm..............…................ 72.8 61.5 85.5 74.0 51.8 -
Handgun.........…................ 65.8 54.8 77.5 68.2 45.7 - All other firearms…............ 7.0 6.7 8.1 5.8 6.1 -
Rifle...............…............. 2.6 2.5 3.2 2.1 2.0 - Shotgun..…....…............. 2.2 1.7 2.2 2.5 2.3 - Other firearm.…............. 0.1 0.0 0.1 0.4 0.0 - Firearm - unknown type.. 2.1 2.5 2.6 0.8 1.8 -
Nonfirearm...........…............. 27.2 38.5 14.5 26.0 48.2 - Knife 1 .....….….................. 10.8 4.6 8.8 12.5 16.3 - Blunt object 2 ...…............... 4.9 5.0 0.9 4.2 12.9 - Personal weapon 3 .….….... 5.8 16.3 1.5 4.6 10.9 - All other....…......…............ 5.6 12.6 3.3 4.8 8.1 -
Rope 4 ......…..….............. 2.4 2.1 1.8 2.7 3.6 - Drugs.......…................... 0.1 0.8 0.0 0.0 0.0 - Other............…............... 3.1 9.6 1.5 2.1 4.5 -
Notes: Percentages may not add to subtotals or 100.0 because of rounding. Dash indicates that percent distributions are not calculated when the base number is less than 50.
1 Any instrument used to cut or stab. 2 Club, etc. 3 Hands, feet, etc. 4 Any instrument used to hang or strangle. 69

Table 24 HOMICIDE CRIMES, 1994-2003
By Contributing Circumstance
Contributing circumstance
1994 1995 1996 1997 1998
Number Percent Number Percent Percent Number Number Percent Number Percent
Total including unknown…... 3,699 3,530 2,910 2,579 2,170 Unknown........................... 527 595 389 424 336 Total known....................... 3,172 100.0 2,935 100.0 2,521 100.0 2,155 100.0 1,834 100.0
Rape, robbery, burglary. 409 12.9 385 13.1 320 12.7 240 11.1 206 11.2 Rape...............…......... 19 0.6 14 0.5 11 0.4 12 0.6 9 0.5 Robbery....................... 366 11.5 342 11.7 294 11.7 219 10.2 183 10.0 Burglary…................... 24 0.8 29 1.0 15 0.6 9 0.4 14 0.8
Argument......…............... 1,374 43.3 1,207 41.1 1,070 42.4 928 43.1 857 46.7 Domestic violence1 ..... 224 7.1 179 6.1 130 5.2 128 5.9 120 6.5 All other argument...... 1,150 36.3 1,028 35.0 940 37.3 800 37.1 737 40.2
Gang-, drug-related….... 1,137 35.8 1,059 36.1 784 31.1 704 32.7 512 27.9 Gang-related................ 880 27.7 867 29.5 620 24.6 544 25.2 404 22.0 Drug-related................. 257 8.1 192 6.5 164 6.5 160 7.4 108 5.9
All other.............….......... 252 7.9 284 9.7 347 13.8 283 13.1 259 14.1
Contributing circumstance (cont.)
1999 2000 2001 2002 2003 Percent change
Number Percent Number Percent Number Percent Number Percent Number Percent 1994-2003
2002-2003
Total including unknown…... 2,006 2,074 2,201 2,392 2,402 Unknown........................... 304 314 317 370 410 Total known....................... 1,702 100.0 1,760 100.0 1,884 100.0 2,022 100.0 1,992 100.0 -37.2 -1.5
Rape, robbery, burglary. 157 9.2 206 11.7 149 7.9 179 8.9 161 8.1 -60.6 -10.1 Rape...............…......... 16 0.9 8 0.5 12 0.6 8 0.4 7 0.4 - - Robbery....................... 127 7.5 186 10.6 133 7.1 163 8.1 137 6.9 -62.6 -16.0 Burglary…................... 14 0.8 12 0.7 4 0.2 8 0.4 17 0.9 - -
Argument......…............... 710 41.7 726 41.3 793 42.1 779 38.5 836 42.0 -39.2 7.3 Domestic violence1 ..... 128 7.5 147 8.4 176 9.3 181 9.0 187 9.4 -16.5 3.3 All other argument...... 582 34.2 579 32.9 617 32.7 598 29.6 649 32.6 -43.6 8.5
Gang-, drug-related….... 487 28.6 581 33.0 726 38.5 816 40.4 772 38.8 -32.1 -5.4 Gang-related................ 402 23.6 506 28.8 647 34.3 730 36.1 669 33.6 -24.0 -8.4 Drug-related................. 85 5.0 75 4.3 79 4.2 86 4.3 103 5.2 -59.9 19.8
All other.............….......... 348 20.4 247 14.0 216 11.5 248 12.3 223 11.2 -11.5 -10.1 Notes: Percentages may not add to subtotals or 100.0 because of rounding.
Dash indicates that a percent change is not calculated when the base number is less than 50. 1 Data reflect 1) homicides submitted to the CJSC from law enforcement agencies as domestic violence-related, and 2) homicides interpreted by the CJSC as domestic violence-related based on available information, including victim/offender relationship. Recent examination of homicide data indicate that ambiguity in the interpretation of what constitutes a domestic violence-related incident may have resulted in an undercount in this category. Further examination of these data by the CJSC will determine if an undercount has occurred and the extent to which it has occurred.
70

Table 25 HOMICIDE CRIMES, 2003
Gender and Race/Ethnic Group of Victim by Contributing Circumstance
Contributing circumstance Total
Gender Race/ethnic group
Male Female White Hispanic Black Other Unknown
Number Total including unknown.….. 2,402 1,972 430 444 1,053 713 185 7 Unknown.............…............ 410 353 57 62 175 141 28 4 Total known......….............. 1,992 1,619 373 382 878 572 157 3 Rape, robbery, burglary.. 161 134 27 40 60 36 25 0
Rape.......….................. 7 0 7 2 3 2 0 0 Robbery, burglary........ 154 134 20 38 57 34 25 0 Robbery.....…............ 137 121 16 27 54 32 24 0 Burglary.....…............ 17 13 4 11 3 2 1 0
Argument........…............. 836 597 239 247 333 188 68 0 Domestic violence1 …... 187 34 153 67 62 34 24 0
All other argument........ 649 563 86 180 271 154 44 0 Gang-, drug-related.….... 772 733 39 34 402 288 46 2
Gang-related................ 669 638 31 14 364 255 36 0 Drug-related................. 103 95 8 20 38 33 10 2
All other…......….............. 223 155 68 61 83 60 18 1 Percent based on total known
Total known......….............. 100.0 100.0 100.0 100.0 100.0 100.0 100.0 100.0 Rape, robbery, burglary.. 8.1 8.3 7.2 10.5 6.8 6.3 15.9 -
Rape.......….................. 0.4 0.0 1.9 0.5 0.3 0.3 0.0 -Robbery, burglary........ 7.7 8.3 5.4 9.9 6.5 5.9 15.9 - Robbery.....…............ 6.9 7.5 4.3 7.1 6.2 5.6 15.3 - Burglary.....…............ 0.9 0.8 1.1 2.9 0.3 0.3 0.6 -
Argument........…............. 42.0 36.9 64.1 64.7 37.9 32.9 43.3 -Domestic violence1 …... 9.4 2.1 41.0 17.5 7.1 5.9 15.3 -
All other argument........ 32.6 34.8 23.1 47.1 30.9 26.9 28.0 - Gang-, drug-related.….... 38.8 45.3 10.5 8.9 45.8 50.3 29.3 -
Gang-related................ 33.6 39.4 8.3 3.7 41.5 44.6 22.9 -Drug-related................. 5.2 5.9 2.1 5.2 4.3 5.8 6.4 -
All other…......….............. 11.2 9.6 18.2 16.0 9.5 10.5 11.5 -Notes: Percentages may not add to subtotals or 100.0 because of rounding.
Dash indicates that percent distributions are not calculated when the base number is less than 50. 1 Data reflect (1) homicides submitted to the CJSC from law enforcement agencies as domestic violence-related, and (2) homicides
interpreted by the CJSC as domestic violence-related based on available information, including victim/offender relationship. Recent examination of homicide data indicate that ambiguity in the interpretation of what constitutes a domestic violence-related incident may have resulted in an undercount in this category. Further examination of these data by the CJSC will determine if an undercount has occurred and the extent to which it has occurred. 71

Table 26 HOMICIDE CRIMES, 2003
Age of Victim by Contributing Circumstance
Contributing circumstance Total Under 5 5-17 18-29 30-39 40-49 50-59 60-69 70
and over Unknown
Number Total including unknown….... 2,402 75 165 1,100 486 298 136 66 60 16 Unknown.…........................ 410 2 17 164 107 65 23 12 8 12
Total known....................... 1,992 73 148 936 379 233 113 54 52 4 Rape, robbery, burglary.. 161 0 3 44 30 37 21 12 14 0 Rape….........…............ 7 0 1 1 1 3 1 0 0 0 Robbery....................... 137 0 2 38 27 30 16 11 13 0 Burglary....................... 17 0 0 5 2 4 4 1 1 0
Argument..…................... 836 0 33 302 219 141 78 32 30 1 Domestic violence1 …... 187 0 4 51 57 38 20 5 12 0 All other argument....... 649 0 29 251 162 103 58 27 18 1 Gang-, drug-related..…... 772 1 90 517 110 39 7 6 0 2 Gang-related................ 669 1 88 464 85 20 6 3 0 2 Drug-related................. 103 0 2 53 25 19 1 3 0 0 Child abuse...…............... 77 66 11 0 0 0 0 0 0 0 All other….............…....... 146 6 11 73 20 16 7 4 8 1
Percent based on total known Total known....................... 100.0 100.0 100.0 100.0 100.0 100.0 100.0 100.0 100.0 100.0 Rape, robbery, burglary.. 8.1 0.0 2.0 4.7 7.9 15.9 18.6 22.2 26.9 - Rape….........…............ 0.4 0.0 0.7 0.1 0.3 1.3 0.9 0.0 0.0 - Robbery....................... 6.9 0.0 1.4 4.1 7.1 12.9 14.2 20.4 25.0 - Burglary....................... 0.9 0.0 0.0 0.5 0.5 1.7 3.5 1.9 1.9 - Argument..…................... 42.0 0.0 22.3 32.3 57.8 60.5 69.0 59.3 57.7 - Domestic violence1 …... 9.4 0.0 2.7 5.4 15.0 16.3 17.7 9.3 23.1 - All other argument....... 32.6 0.0 19.6 26.8 42.7 44.2 51.3 50.0 34.6 - Gang-, drug-related..…... 38.8 1.4 60.8 55.2 29.0 16.7 6.2 11.1 0.0 - Gang-related................ 33.6 1.4 59.5 49.6 22.4 8.6 5.3 5.6 0.0 - Drug-related................. 5.2 0.0 1.4 5.7 6.6 8.2 0.9 5.6 0.0 - Child abuse...…............... 3.9 90.4 7.4 - - - - - - - All other….............…....... 7.3 8.2 7.4 7.8 5.3 6.9 6.2 7.4 15.4 -Notes: Percentages may not add to subtotals or 100.0 because of rounding.
Dash indicates that data are not applicable or that percent distributions are not calculated when the base number is less than 50. 1 Data reflect 1) homicides submitted to the CJSC from law enforcement agencies as domestic violence-related, and 2) homicides interpreted by the CJSC as domestic violence-related based on available information, including victim/offender relationship. Recent examination of homicide data indicate that ambiguity in the interpretation of what constitutes a domestic violence-related incident may have resulted in an undercount in this category. Further examination of these data by the CJSC will determine if an undercount has occurred and the extent to which it has occurred.
72

Table 27 HOMICIDE CRIMES, 2003
Contributing Circumstance by Relationship of Victim to Offender
Relationship of victim to offender Total Rape Robbery,
burglary Argument1 Gang-, drug-
related
Child abuse
All other Unknown
Number Total including unknown…..... Unknown..…..............…...... Total known.…..........…......
Friend, acquaintance2 ….. Spouse3 ......…................. Parent, child4 …...……..... All other relatives….…..... Stranger...........…............
2,402 1,109 1,293
601 93
105 52
442
7 2 5 1 0 0 1 3
154 73 81 20 0 1 1
59
836 130 706 364
93 36 36
177
772 460 312 170
0 1 1
140
77 5
72 10 0
57 4 1
146 69 77 24
0 7 7
39
410 370
40 12 0 3 2
23 Percent based on total known
Total known.…..........…...... Friend, acquaintance2 ….. Spouse3 ......…................. Parent, child4 …...….….... All other relatives….…..... Stranger...........…............
100.0 46.5 7.2 8.1 4.0
34.2
100.0 -----
100.0 24.7 0.0 1.2 1.2
72.8
100.0 51.6 13.2 5.1 5.1
25.1
100.0 54.5 0.0 0.3 0.3
44.9
100.0 13.9 0.0
79.2 5.6 1.4
100.0 31.2
0.0 9.1 9.1
50.6
100.0 -----
Notes: Percentages may not add to 100.0 because of rounding. Dash indicates that percent distributions are not calculated when the base number is less than 50.
1 Includes domestic violence. 2 Includes ex-husband, ex-wife, employer, employee, gang member, etc. 3 Includes "common-law" marriage partner. 4 Includes stepmother, stepfather, stepdaughter, and stepson.
73

Table 28 HOMICIDE CRIMES CLEARED, 1994-2003
Number Reported, Number Cleared, and Clearance Rate
Year(s) Number of homicides reported
Number of homicides
cleared
Clearance rate1
2003..............… 2,402 1,323 55.1 2002..............… 2,392 1,362 56.9 2001..............… 2,201 1,091 49.6 2000..............… 2,074 1,082 52.2 1999................. 2,006 1,200 59.8 1998................. 2,170 1,369 63.1 1997................. 2,579 1,489 57.7 1996................. 2,910 1,743 59.9 1995................. 3,530 1,916 54.3 1994................. 3,699 2,091 56.5 1 A clearance rate is the percentage of crimes (homicides) reported that
have been cleared. It is calculated by dividing the number of homicides cleared by the number of homicides reported. The result is multiplied by 100. Please see "Appendix II - Criminal Justice Glossary" for a detailed explanation of clearances.
74

Table 29 FELONY ARRESTS FOR
SELECTED VIOLENT OFFENSES, 1994-2003 Number, Rate per 100,000 Population at Risk, and Percent Change
Year(s) Total Homi- cide
Forcible rape Robbery Assault
Number 2003.................... 2002.................... 2001.................... 2000.................... 1999.................... 1998.................... 1997.................... 1996.................... 1995a ................... 1994....................
129,522 130,295 134,398 130,259 134,319 142,498 153,279 149,795 155,053 151,906
1,839 1,864 1,754 1,627 1,770 2,117 2,212 2,535 2,821 2,963
2,456 2,549 2,730 2,702 2,887 3,032 3,108 3,202 3,199 3,305
17,501 16,957 17,167 17,122 18,753 21,507 23,824 26,014 27,641 27,984
107,726 108,925 112,747 108,808 110,909 115,842 124,135 118,044 121,392 117,654
Percent change in number 2002 to 2003....... 2001 to 2002....... 2000 to 2001....... 1999 to 2000....... 1998 to 1999....... 1997 to 1998....... 1996 to 1997....... 1995 to 1996....... 1994 to 1995....... 1994 to 2003.......
-0.6 -3.1 3.2
-3.0 -5.7 -7.0 2.3
-3.4 2.1
-14.7
-1.3 6.3 7.8
-8.1 -16.4 -4.3
-12.7 -10.1 -4.8
-37.9
-3.6 -6.6 1.0
-6.4 -4.8 -2.4 -2.9 0.1
-3.2 -25.7
3.2 -1.2 0.3
-8.7 -12.8 -9.7 -8.4 -5.9 -1.2
-37.5
-1.1 -3.4 3.6
-1.9 -4.3 -6.7 5.2
-2.8 3.2
-8.4 Rate per 100,000 population at risk1
2003.................... 2002.................... 2001.................... 2000.................... 1999.................... 1998.................... 1997.................... 1996.................... 1995.................... 1994....................
465.6 477.2 502.5 497.1 522.4 564.1 595.0 586.2 617.2 614.9
6.6 6.8 6.6 6.2 6.9 8.4 8.6 9.9
11.2 12.0
8.8 9.3
10.2 10.3 11.2 12.0 12.1 12.5 12.7 13.4
62.9 62.1 64.2 65.3 72.9 85.1 92.5
101.8 110.0 113.3
387.3 399.0 421.6 415.2 431.4 458.5 481.9 461.9 483.2 476.3
Percent change in rate 2002 to 2003....... 2001 to 2002....... 2000 to 2001....... 1999 to 2000....... 1998 to 1999....... 1997 to 1998....... 1996 to 1997.......
1994 to 1995....... 1994 to 2003.......
1995 to 1996.......
-2.4 -5.0 1.1
-4.8 -7.4 -5.2 1.5
-5.0 0.4
-24.3
-2.9 3.0 6.5
-10.1 -17.9 -2.3
-13.1 -11.6
-6.7 -45.0
-5.4 -8.8 -1.0 -8.0 -6.7 -0.8 -3.2 -1.6 -5.2
-34.3
1.3 -3.3 -1.7
-10.4 -14.3 -8.0 -9.1 -7.5 -2.9
-44.5
-2.9 -5.4 1.5
-3.8 -5.9 -4.9 4.3
-4.4 1.4
-18.7 Notes: Rates may not add to total because of rounding.
Rates are based on annual population estimates provided by the Demographic Research Unit, California Department of Finance.
a Includes estimated annual data for the Bakersfield Police Department and the Oakland Police Department.
1 Rates are based on the total population at risk (10-69 years of age).
75

Table 30 HOMICIDE ARRESTS, 1994-2003
By Gender of Arrestee
Year(s) Total Male Female
Number Percent Number Percent Number Percent 2003............. 1,839 100.0 1,627 88.5 212 11.5 2002............. 1,864 100.0 1,655 88.8 209 11.2 2001............. 1,754 100.0 1,537 87.6 217 12.4 2000............. 1,627 100.0 1,426 87.6 201 12.4 1999............. 1,770 100.0 1,579 89.2 191 10.8
1998............. 2,117 100.0 1,870 88.3 247 11.7 1997............. 2,212 100.0 1,990 90.0 222 10.0 1996............. 2,535 100.0 2,286 90.2 249 9.8 1995a ............ 2,821 100.0 2,564 90.9 257 9.1 1994............. 2,963 100.0 2,709 91.4 254 8.6 a Includes estimated annual data for the Bakersfield Police Department and the Oakland
Police Department.
Table 31 HOMICIDE ARRESTS, 1994-2003 By Race/Ethnic Group of Arrestee
Year(s) Total White Hispanic Black Other
Number Percent Number Percent Number Percent Number Percent Number Percent 2003.............. 2002.............. 2001.............. 2000.............. 1999.............. 1998.............. 1997.............. 1996.............. 1995a ............. 1994..............
1,839 100.0 1,864 100.0 1,754 100.0 1,627 100.0 1,770 100.0 2,117 100.0 2,212 100.0 2,535 100.0 2,821 100.0 2,963 100.0
424 23.1 349 18.7 400 22.8 374 23.0 382 21.6 484 22.9 447 20.2 537 21.2 580 20.6 675 22.8
812 44.2 897 48.1 832 47.4 698 42.9 845 47.7 987 46.6
1,017 46.0 1,110 43.8 1,284 45.5 1,175 39.7
456 24.8 455 24.4 406 23.1 397 24.4 417 23.6 470 22.2 586 26.5 663 26.2 743 26.3 850 28.7
147 8.0 163 8.7 116 6.6 158 9.7 126 7.1 176 8.3 162 7.3 225 8.9 214 7.6 263 8.9
Note: Percentages may not add to 100.0 because of rounding. a Includes estimated annual data for the Bakersfield Police Department and the Oakland Police Department.
76

Table 32 HOMICIDE ARRESTS, 1994-2003
By Age of Arrestee
Year(s) Total Under 18 18-29 30-39 40 and over
Number Percent Number Percent Number Percent Number Percent Number Percent 2003.............. 2002.............. 2001.............. 2000.............. 1999.............. 1998.............. 1997.............. 1996.............. 1995a ............. 1994..............
1,839 100.0 1,864 100.0 1,754 100.0 1,627 100.0 1,770 100.0 2,117 100.0 2,212 100.0 2,535 100.0 2,821 100.0 2,963 100.0
167 9.1 215 11.5 194 11.1 160 9.8 182 10.3 308 14.5 353 16.0 389 15.3 521 18.5 542 18.3
1,077 58.6 1,097 58.9 1,011 57.6
913 56.1 1,037 58.6 1,244 58.8 1,267 57.3 1,430 56.4 1,570 55.7 1,625 54.8
326 17.7 293 15.7 291 16.6 299 18.4 317 17.9 302 14.3 326 14.7 427 16.8 462 16.4 483 16.3
269 14.6 259 13.9 258 14.7 255 15.7 234 13.2 263 12.4 266 12.0 289 11.4 268 9.5 313 10.6
Note: Percentages may not add to 100.0 because of rounding. a Includes estimated annual data for the Bakersfield Police Department and the Oakland Police Department.
Table 33 HOMICIDE ARRESTS, 2003
Race/Ethnic Group of Arrestee by Gender and Age of Arrestee
Gender and age of arrestee
Total White Hispanic Black Other Number Percent Number Percent Number Percent Number Percent Number Percent
Total Total..................... 1,839 100.0 424 100.0 812 100.0 456 100.0 147 100.0
Gender Male.................. Female....…......
1,627 88.5 212 11.5
338 79.7 86 20.3
741 91.3 71 8.7
417 91.4 39 8.6
131 89.1 16 10.9
Age Under 18........... 18-29.....…........ 30-39.....…........ 40 and over.......
167 9.1 1,077 58.6
326 17.7 269 14.6
19 4.5 171 40.3 112 26.4 122 28.8
70 8.6 550 67.7 120 14.8
72 8.9
50 11.0 278 61.0
76 16.7 52 11.4
28 19.0 78 53.1 18 12.2 23 15.6
Note: Percentages may not add to 100.0 because of rounding.
77

Table 34 HOMICIDE ARRESTS, 2003
Race/Ethnic Group of Arrestee by Gender and Age of Arrestee
Gender and age of arrestee
Total White Hispanic Black Other Number Percent Number Percent Number Percent Number Percent Number Percent
Total.................... 1,839 100.0 424 100.0 812 100.0 456 100.0 147 100.0 Under 18..…..... 167 9.1 19 4.5 70 8.6 50 11.0 28 19.0 18-19................ 281 15.3 33 7.8 144 17.7 77 16.9 27 18.4 20-24................ 505 27.5 87 20.5 261 32.1 123 27.0 34 23.1 25-29................ 291 15.8 51 12.0 145 17.9 78 17.1 17 11.6 30-34................ 176 9.6 52 12.3 73 9.0 41 9.0 10 6.8 35-39................ 150 8.2 60 14.2 47 5.8 35 7.7 8 5.4 40-44................ 94 5.1 39 9.2 27 3.3 18 3.9 10 6.8 45-49................ 69 3.8 24 5.7 24 3.0 18 3.9 3 2.0 50-54................ 42 2.3 19 4.5 12 1.5 8 1.8 3 2.0 55 and over…... 64 3.5 40 9.4 9 1.1 8 1.8 7 4.8 Male........…...... 1,627 100.0 338 100.0 741 100.0 417 100.0 131 100.0
Under 18..….. 148 9.1 13 3.8 63 8.5 47 11.3 25 19.1 18-19............. 259 15.9 30 8.9 132 17.8 73 17.5 24 18.3 20-24............. 465 28.6 70 20.7 246 33.2 116 27.8 33 25.2 25-29............. 256 15.7 36 10.7 132 17.8 73 17.5 15 11.5 30-34............. 153 9.4 44 13.0 66 8.9 34 8.2 9 6.9 35-39............. 124 7.6 44 13.0 41 5.5 32 7.7 7 5.3 40-44............. 68 4.2 31 9.2 19 2.6 11 2.6 7 5.3 45-49............. 65 4.0 21 6.2 24 3.2 17 4.1 3 2.3 50-54............. 37 2.3 17 5.0 10 1.3 7 1.7 3 2.3 55 and over… 52 3.2 32 9.5 8 1.1 7 1.7 5 3.8
Female..…........ 212 100.0 86 100.0 71 100.0 39 100.0 16 100.0 Under 18........ 19 9.0 6 7.0 7 9.9 3 - 3 -18-19............. 22 10.4 3 3.5 12 16.9 4 - 3 -20-24............. 40 18.9 17 19.8 15 21.1 7 - 1 -25-29............. 35 16.5 15 17.4 13 18.3 5 - 2 -30-34............. 23 10.8 8 9.3 7 9.9 7 - 1 -35-39............. 26 12.3 16 18.6 6 8.5 3 - 1 -40-44............. 26 12.3 8 9.3 8 11.3 7 - 3 -45-49............. 4 1.9 3 3.5 0 0.0 1 - 0 -50-54............. 5 2.4 2 2.3 2 2.8 1 - 0 -55 and over… 12 5.7 8 9.3 1 1.4 1 - 2 -
Notes: Percentages may not add to 100.0 because of rounding. Dash indicates that percent distributions are not calculated when the base number is less than 50.
78

Table 35 PERSONS UNDER CALIFORNIA
SENTENCE OF DEATH, 1978-2003
Year(s) Initial sentences
Total persons under
sentence of death1,2
2003.…….............. 22 639 2002.…….............. 17 618 2001..……............. 25 610 2000..……............. 33 589 1999..……............. 42 558 1998..……............. 32 518 1997...……............ 40 493 1996..……............. 40 461 1995...……............ 38 426 1994.…….............. 21 391 1993.…….............. 34 374 1992....……........... 40 345 1991.......……........ 26 305 1990...……............ 33 279 1989....……........... 33 247 1988……............... 34 223 1987……............... 25 203 1986……............... 21 179 1985.…….............. 16 159 1984.…….............. 27 161 1983.…….............. 35 143 1982.…….............. 39 113 1981.…….............. 39 80 1980……............... 23 42 1979……............... 20 25 1978……............... 7 7 Source: California Appellate Project. 1 Total persons under sentence of death on December 31 of each year. Persons with multiple California death sentences are counted once.
2 The increase in the total number of persons under sentence of death from year-to-year will not equal the number of initial sentences reported each year. This is because, in addition to initial sentences, persons may be resentenced to death, no longer under sentence of death because of execution or death by other causes, removed pending retrial, resentenced to a penalty less than death, or freed.
79

Table 36 PERSONS SENTENCED TO DEATH, 2003
Sentencing County by Gender, Race/Ethnic Group, and Age
Sentencing county Total
Gender Race/ethnic group Age at arrest
Female Male Other White Hispanic Black Under 20 20-24 30-34 25-29 35-39 40 and
over Total.….................. Alameda............. Contra Costa...… Los Angeles….... Merced……........ Orange....…........
Riverside..…....... San Bernardino.. San Diego…....... San Joaquin....... Santa Barbara….
Ventura….....……
22 1 1 5 1 2
3 3 2 1 1
2
22 0 1 0 1 0 5 0 1 0 2 0
3 0 3 0 2 0 1 0 1 0
2 0
5 4 11 2 0 0 1 0 1 0 0 0 0 1 3 1 1 0 0 0 0 1 0 1
0 0 3 0 0 1 2 0 1 0 1 0 0 0 1 0 1 0 0 0
1 1 0 0
2 1 0 1 0 0
0 0 0 0 0
0
5 0 0 2 0 1
0 1 0 0 1
0
5 4 0 0 0 0 2 0 0 0 0 0
1 1 2 0 0 1 0 0 0 0
0 2
2 0 0 0 1 0
1 0 0 0 0
0
4 0 1 0 0 1
0 0 1 1 0
0 Note: This table does not include persons resentenced to death after their death sentence was reversed on appeal.
80

Table 37 HOMICIDE CRIMES AND PEACE OFFICERS KILLED IN THE LINE OF DUTY, 1994-2003
Number and Rate per 100,000 Respective Population
Year(s) California Homicides Sworn law enforcement personnel2 Rate Number
Peace officers killed in the line of duty
population Number1 Rate
2003.............. 35,934,000 2,402 6.7 75,336 6 8.0 2002.............. 35,301,000 2,392 6.8 75,612 4 5.3 2001.............. 34,758,000 2,201 6.3 72,119 6 8.3 2000.............. 34,480,000 2,074 6.0 69,029 2 2.9 1999.............. 34,036,000 2,006 5.9 69,363 4 5.8 1998.............. 33,494,000 2,170 6.5 67,035 7 10.4 1997.............. 32,957,000 2,579 7.8 65,416 7 10.7 1996.............. 32,383,000 2,910 9.0 64,008 5 7.8 1995.............. 32,063,000 3,530 11.0 62,150 10 16.1 1994.............. 32,140,000 3,699 11.5 59,340 9 15.2 Note: Homicide rates are based on annual population estimates provided by the Demographic Research
Unit, California Department of Finance. 1 Includes peace officers feloniously killed in the line of duty. 2 Personnel in the Department of Justice and other state regulatory agencies are not included.
Table 38 PEACE OFFICERS KILLED IN THE LINE OF DUTY, 2003
By Contributing Circumstance
Contributing circumstance Number Percent
Total..............…....................…........…...........
Aiding another officer during traffic stop (vehicle occupants were suspected gang members)………..….……..…………
Attempted arrest…………...….…….…….… Domestic disturbance call….……….…...…. Investigation (murder)………………..….….. Investigation (trespassing)….……....…...…. Routine traffic stop……….…….......…….….
6
1 1
1
1
1 1
100.0
------
Note: Dash indicates that percent distributions are not calculated when the base number is less than 50.
81
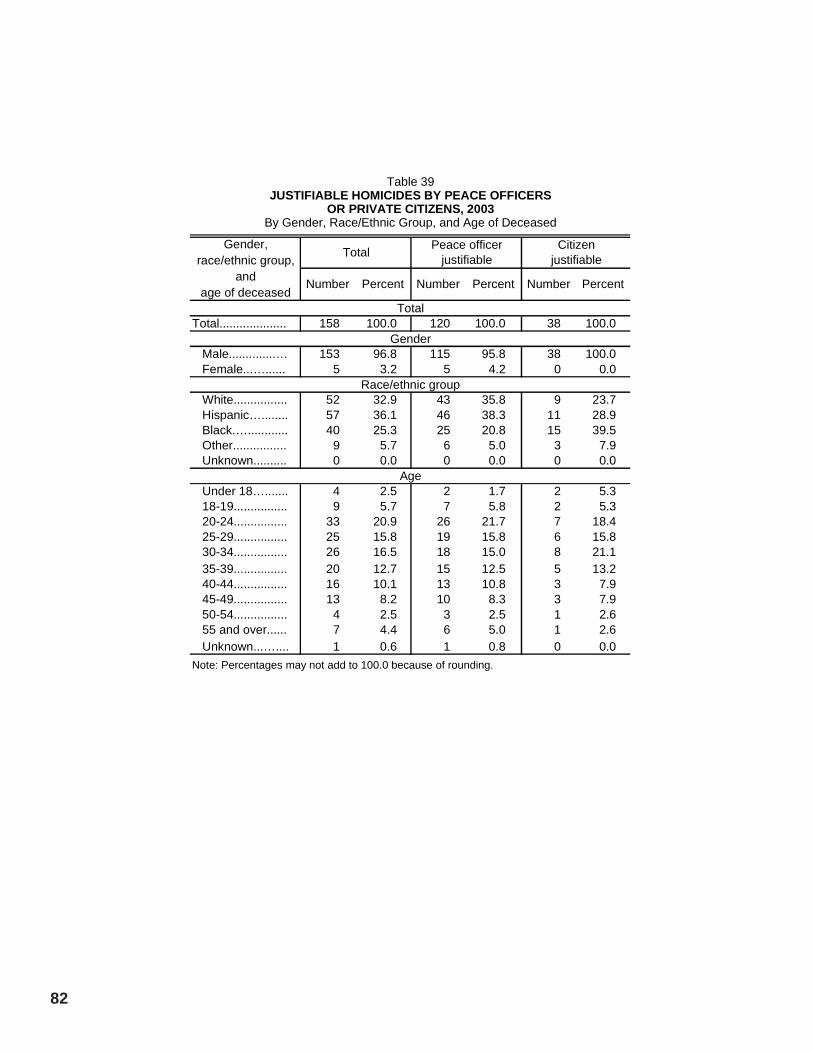
Table 39 JUSTIFIABLE HOMICIDES BY PEACE OFFICERS
OR PRIVATE CITIZENS, 2003 By Gender, Race/Ethnic Group, and Age of Deceased
Gender, race/ethnic group, Total Peace officer
justifiable Citizen
justifiable and
age of deceased Number Percent Number Percent Number Percent
Total Total.................... 158 100.0 120 100.0 38 100.0
Gender Male..............… 153 96.8 115 95.8 38 100.0 Female...…...... 5 3.2 5 4.2 0 0.0
Race/ethnic group White................ 52 32.9 43 35.8 9 23.7 Hispanic…........ 57 36.1 46 38.3 11 28.9 Black.…............ 40 25.3 25 20.8 15 39.5 Other................ 9 5.7 6 5.0 3 7.9 Unknown.......... 0 0.0 0 0.0 0 0.0
Age Under 18…....... 4 2.5 2 1.7 2 5.3 18-19................ 9 5.7 7 5.8 2 5.3 20-24................ 33 20.9 26 21.7 7 18.4 25-29................ 25 15.8 19 15.8 6 15.8 30-34................ 26 16.5 18 15.0 8 21.1 35-39................ 20 12.7 15 12.5 5 13.2 40-44................ 16 10.1 13 10.8 3 7.9 45-49................ 13 8.2 10 8.3 3 7.9 50-54................ 4 2.5 3 2.5 1 2.6 55 and over...... 7 4.4 6 5.0 1 2.6 Unknown...….... 1 0.6 1 0.8 0 0.0 Note: Percentages may not add to 100.0 because of rounding.
82

Location of justifiable homicide Number Percent
Total Total....................……............... 158
Table 40 JUSTIFIABLE HOMICIDES BY PEACE OFFICERS
OR PRIVATE CITIZENS, 2003 By Location of Justifiable Homicide
Peace officer justifiable Total.....….........……............... 120 100.0
Felon's residence……......... 23 19.2 Other residence.…..…......... 7 5.8 Street, sidewalk.….............. 67 55.8 Commercial establishment.. 6 5.0 Hotel, motel.….................. 1 0.8 Liquor store.….................. 0 0.0 Bar.....….....…................... 1 0.8 Other business....….......... 4 3.3 All other...........…...……....... 17 14.2 Parking lot......…............... 3 2.5 Vehicle..........….…............ 6 5.0 Field, park......……............ 5 4.2 Other.............……............. 3 2.5
Citizen justifiable Total........….…......…............... 38 100.0
Citizen's, shared residence.. 16 42.1 Citizen's residence.…....… 15 39.5 Shared residence.……...... 1 2.6 Other residence.……..…..… 5 13.2 Felon's residence……....... 3 7.9 Other residence....…........ 2 5.3 Street, sidewalk.......…......... 6 15.8 Commercial establishment.. 9 23.7 Hotel, motel.….................. 0 0.0 Liquor store.….................. 1 2.6 Bar.....…...…….................. 0 0.0 Other business...…........... 8 21.1 All other........….....…........... 2 5.3 Parking lot..…...…............. 0 0.0 Vehicle...........……............ 2 5.3 Field, park..….....…........... 0 0.0 Other.......…...……............ 0 0.0
Note: Percentages may not add to subtotals or 100.0 because of rounding.
83

Table 41 JUSTIFIABLE HOMICIDES BY PEACE OFFICERS
OR PRIVATE CITIZENS, 2003 By Contributing Circumstance
Contributing circumstance Number Percent
Total Total.....................………............................... 158
Peace officer justifiable Total...................…………..........…...…....... 120 100.0
Felon attacked peace officer..…..…......... 93 77.5 Felon killed during commission of crime.. 24 20.0 Felon resisted arrest…………..….……… 1 0.8 All other…………………..…….………….. 2 1.7 Felon attacked another peace officer… 2 1.7 Felon attacked citizen……..…..………. 0 0.0 Felon attempted flight……..….…..……. 0 0.0
Citizen justifiable Total...........................…….......……............ 38 100.0
Felon attacked citizen...……....…............. 14 36.8 Felon killed during commission of crime.. 24 63.2
Table 42 JUSTIFIABLE HOMICIDES BY PEACE OFFICERS
OR PRIVATE CITIZENS, 2003 By Type of Weapon Used
Type of
Total Peace officer justifiable
Citizen justifiable
weapon used Number Percent Number Percent Number Percent
Total.........……........….......... Firearm..….........................
Handgun...........….......... Rifle.......…....….............. Shotgun........….............. Other firearm…………… Firearm - unknown type..
Nonfirearm..…................... Knife1 .....…..................... Blunt object2 .….....…...... Other…....…...…….........
158 100.0 152 96.2 139 88.0
5 3.2 4 2.5 1 0.6 3 1.9 6 3.8 3 1.9 2 1.3 1 0.6
120 100.0 119 99.2 110 91.7
4 3.3 2 1.7 1 0.8 2 1.7 1 0.8 0 0.0 1 0.8 0 0.0
38 100.0 33 86.8 29 76.3 1 2.6 2 5.3 0 0.0 1 2.6 5 13.2 3 7.9 1 2.6 1 2.6
Note: Percentages may not add to subtotals because of rounding. 1 Any instrument used to cut or stab. 2 Club, etc.
84

Table 43 POPULATION ESTIMATES, 1952-2003
Year(s) Total population
Population at risk Total1 Adult2 Juvenile3
2003................ 35,934,000 27,815,344 23,295,523 4,519,821 2002................ 35,301,000 27,302,433 22,927,383 4,375,050 2001................ 34,758,000 26,745,137 22,555,739 4,189,398 2000................ 34,480,000 26,203,950 22,198,297 4,005,653 1999................ 34,036,000 25,711,892 21,855,190 3,856,702 1998................ 33,494,000 25,263,064 21,498,170 3,764,894 1997................ 32,957,000 25,760,375 21,934,916 3,825,459 1996................ 32,383,000 25,554,242 21,825,735 3,728,507 1995................ 32,063,000 25,122,782 21,505,839 3,616,943 1994................ 32,140,000 24,703,379 21,193,571 3,509,808 1993................ 31,742,000 24,334,534 20,923,632 3,410,902 1992................ 31,300,000 23,975,578 20,661,120 3,314,458 1991................ 30,646,000 23,585,168 20,356,984 3,228,184 1990................ 29,557,836 23,178,961 20,027,633 3,151,328 1989................ 28,771,207 22,524,392 19,451,763 3,072,629 1988................ 28,060,746 21,969,953 18,885,349 3,084,604 1987................ 27,388,477 21,483,563 18,378,758 3,104,805 1986................ 26,741,621 21,009,362 17,903,122 3,106,240 1985................ 26,112,632 20,563,314 17,468,941 3,094,373 1984................ 25,587,254 20,167,923 17,083,479 3,084,444 1983................ 25,075,581 19,860,746 16,763,095 3,097,651 1982................ 24,546,566 19,510,945 16,415,571 3,095,374 1981................ 24,038,711 19,172,812 16,082,355 3,090,457 1980................ 23,668,145 18,824,197 15,778,999 3,045,198 1979................ 23,255,000 18,371,691 15,323,376 3,048,315 1978................ 22,839,000 18,012,901 14,916,032 3,096,869 1977................ 22,350,000 17,619,453 14,470,680 3,148,773 1976................ 21,935,000 17,269,884 14,080,872 3,189,012 1975................ 21,537,000 16,914,556 13,694,793 3,219,763 1974................ 21,173,000 16,563,671 13,339,906 3,223,765 1973................ 20,868,000 16,237,031 13,031,007 3,206,024 1972................ 20,585,000 15,926,249 12,758,809 3,167,440 1971................ 20,346,000 15,657,238 12,542,795 3,114,443 1970................ 20,039,000 15,378,312 12,339,580 3,038,732 1969................ 19,856,000 14,697,200 11,657,600 3,039,600 1968................ 19,554,000 14,379,400 11,403,700 2,975,700 1967................ 19,478,000 14,065,700 11,159,800 2,905,900 1966................ 19,132,000 13,696,700 10,872,500 2,824,200 1965................ 18,756,000 13,377,400 10,620,600 2,756,800 1964................ 18,234,000 12,981,700 10,311,100 2,670,600 1963................ 17,675,000 12,564,600 10,047,700 2,516,900 1962................ 17,044,000 12,099,200 9,740,000 2,359,200 1961................ 16,445,000 11,697,900 9,469,100 2,228,800 1960................ 15,860,000 11,314,900 9,203,300 2,111,600 1959................ 15,280,000 - - -1958................ 14,752,000 - - -1957................ 14,190,000 - - -1956................ 13,600,000 - - -1955................ 13,035,000 - - -1954................ 12,595,000 - - -1953................ 12,101,000 - - -1952................ 11,638,000 - - -Source: Population estimates were provided by the Demographic Research Unit,
California Department of Finance. Note: Population data by age are not available prior to 1960. 1 Total population at risk, 10-69 years of age. 2 Adult population at risk, 18-69 years of age. 3 Juvenile population at risk, 10-17 years of age.
85

APPENDICES
Links to:
Preface Crimes Arrests Death Penalties Peace Officers Killed
Justifiable Homicides Data Tables Appendices
CJSC Home Page CJSC Publications AG Home Page
Next page -->
APPENDICES
HOMICIDE IN CALIFORNIA, 2003


APPENDIX I
COMPUTATIONAL FORMULAS
ARREST RATE - An arrest rate describes the number of arrests made by law enforcement agencies per 100,000 total population or per 100,000 population considered to be at risk for arrest. Regardless of the population used, both rates are calculated in the same manner. An arrest rate is calculated by dividing the number of reported arrests by the respective population; the result is multiplied by 100,000. For example, in 2003 there were 1,839 homicide arrests. The total population was 35,934,000 and the total population at risk (10-69 years of age) was 27,815,344.
1,839 = 0.000051177 x 100,000 = 5.1 per 100,000 population35,934,000
1,839 = 0.000066114 x 100,000 = 6.6 per 100,000 population at risk27,815,344
CLEARANCE RATE - A clearance rate is the percentage of crimes reported that have been cleared. A clearance rate is calculated by dividing the number of crimes cleared by the number of crimes reported; the result is multiplied by 100. For example, in 2003 there were 1,323 homicides cleared and 2,402 homicides reported. This equals a homicide clearance rate of 55.1 percent.
1,323 = 0.550791007 x 100 = 55.1 percent2,402
CRIME RATE - A crime rate describes the number of crimes reported to law enforcement agencies per 100,000 total population. A crime rate is calculated by dividing the number of reported crimes by the total population; the result is multiplied by 100,000. For example, in 2003 there were 2,402 homicides in California and the population was 35,934,000. This equals a homicide crime rate of 6.7 per 100,000 general population.
2,402 = 0.000066844 x 100,000 = 6.7 per 100,000 population35,934,000
PERCENT CHANGE - A percent change describes a change in number or rate from one year to another. A percent change is calculated by subtracting base-year data from current-year data; the result is divided by base-year data and multiplied by 100. For example, in 2003 the homicide crime rate was 6.7. In 1994 the homicide crime rate was 11.5. The percent change in rate from 1994 to 2003 is a 41.7 percent decrease.
6.7 - 11.5 = -0.417391304 x 100 = -41.7 percent11.5
POPULATION AT RISK - Arrest section data tables include three comparison populations: total (10-69 years of age), adult (18-69 years of age), and juvenile (10-17 years of age).
Notes: When a series of rates are calculated using different populations, the rate calculated for the total will not be equal to the sum of the rates calculated for each subtotal. For example, the total arrest rate (calculated using the total at-risk population) will not equal the sum of the adult arrest rate (calculated using the adult at-risk population) and the juvenile arrest rate (calculated using the juvenile at-risk population).
Calculating rates for counties of less than 100,000 will generate an inflated rate when compared to counties with populations of 100,000 or more; therefore, rates are not calculated for counties with populations of less than 100,000.
Next page -->
APPENDICES 89

APPENDIX II CRIMINAL JUSTICE GLOSSARY
ACQUITTAL: a judgment of a court, based either on the verdict of a jury or a judicial officer, that the defendant is not guilty of the offense(s) for which he/ she was tried.
ADULT: a person 18 years of age or older.
AGGRAVATED ASSAULT: an unlawful attack or attempted attack by one person upon another for the purpose of inflicting severe or aggravated bodily injury. This type of assault usually is accompanied by the use of a weapon or by means likely to produce death or great bodily harm (UCR definition).
APPEAL: a petition initiated by a defendant for a rehearing in an appellate court regarding a previous sentence or motion.
ARREST: ". . . taking a person into custody, in a case and in the manner authorized by law. An arrest may be made by a peace officer or by a private person" (834 PC).
ARREST RATE: the number of arrests per 100,000 population. See "Computational Formulas" (preceding page) for further explanation.
CALIFORNIA DEPARTMENT OF THE YOUTH AUTHORITY (CYA): the state agency which has jurisdiction over and maintains institutions as correctional schools for the reception of wards of the juvenile court and other persons committed from trial courts.
CLEARANCE: an offense is "cleared by arrest" or solved, for crime reporting purposes, when at least one person is arrested, charged with the commission of an offense, and turned over to a court for prosecution. Although no physical arrest is made, a clearance by arrest can be claimed when an offender is a person under 18 years of age and is cited to appear in juvenile court or before other juvenile authorities. An offense can also be "cleared exceptionally" for crime reporting purposes when an investigation has definitely established the identity of an offender; there is enough information to support an arrest; and the exact location of an offender is known but, for some reason, law enforcement cannot take the offender into custody.
CLEARANCE RATE: the percentage of crimes reported that have been cleared.
COMBINED CASES: cases rejected by the prosecutor in favor of other counts/cases.
COMPLAINT: a verified written accusation, filed by a prosecuting attorney with a local criminal court, which charges one or more persons with the commission of one or more offenses.
CONVICTION: a judgment, based either on the verdict of a jury or a judicial officer or on the guilty plea of the defendant, that the defendant is guilty.
COURT: an agency of the judicial branch of government, authorized or established by statute or constitution, having one or more judicial officers on its staff. A court has the authority to decide upon controversies in law and disputed matters of fact brought before it. Because of court consolidation we no longer distinguish between lower court and superior court.
CRIME: ". . . an act committed or omitted in violation of a law forbidding or commanding it. . ." (15 PC).
CRIME RATE: the number of reported crimes per 100,000 general population. See "Computational Formulas" (preceding page) for further explanation.
CYA: see "California Department of the Youth Authority."
DISMISSAL: a decision by a judicial officer to terminate a case without a determination of guilt or innocence.
DISPOSITION - COURT: an action taken as the result of an appearance in court by a defendant. Examples are: adults - dismissed, acquitted, or convicted; juveniles - dismissed, transferred, or remanded to adult court.
DISPOSITION - LAW ENFORCEMENT: an action taken as the result of an arrest. Examples of police dispositions are: adults - released by law enforcement, referred to another jurisdiction, or a misdemeanor or felony complaint sought; juveniles -handled within the department, referred to another agency, or referred to the probation department or juvenile court.
DISPOSITION - PROSECUTOR: an action taken as the result of a complaint requested by an arresting agency. Dispositions include granting a misdemeanor or a felony complaint or denying a complaint for reasons such as lack of sufficient evidence or complainant refuses to testify.
DIVERSION: a disposition of a criminal defendant either before adjudication or following adjudication, but prior to sentencing, in which the court directs the defendant to participate in a work, educational, or rehabilitative program.
90 HOMICIDE IN CALIFORNIA, 2003

DIVERSION DISMISSED: the successful completion of a diversion program.
EXCEPTIONAL MEANS: an offense can also be "cleared exceptionally" for crime reporting purposes when an investigation has definitely established the identity of an offender; there is enough information to support an arrest; and the exact location of an offender is known but, for some reason, law enforcement cannot take the offender into custody.
FELON: one who has committed a felony.
FELONY: a crime which is punishable by death or by imprisonment in a state prison (17 & 18 PC).
FILING: a document filed with the court clerk or county clerk by a prosecuting attorney alleging that a person committed or attempted to commit a crime.
FORCIBLE RAPE: the carnal knowledge of a female forcibly and against her will. Assaults or attempts to commit rape by force or threat of force are included (UCR definition).
HOMICIDE: the willful (nonnegligent) killing of one human being by another. Murder and nonnegligent manslaughter are included (UCR definition).
JAIL: a county or city facility for incarceration of sentenced and unsentenced persons.
JUVENILE: a person under the age of 18.
MISDEMEANOR: a crime punishable by imprisonment in a county jail for up to one year.
MONTHLY ARREST AND CITATION REGISTER (MACR): a reporting system used to collect information on adult and juvenile arrests and citations by police and sheriffs' departments. This register contains data on arrest offenses, arrestee characteristics (age, gender, and race/ethnic group), and law enforcement dispositions.
OFFENDER-BASED TRANSACTION STATISTICS (OBTS): a system designed to collect statistical information on the various processes within the criminal justice system that occur between the point of the felony arrest of an adult and the point of final disposition.
OFFENSE: the charged offense is the crime for which the defendant was arrested or filed on by the district attorney. The convicted offense is the offense the defendant was convicted of or pled guilty to in court.
PC (PENAL CODE): the California Penal Code contains statutes that define criminal offenses and specify corresponding punishments. Criminal justice system mandates and procedures are also included.
POPULATION AT RISK: that portion of the total population who, because of like characteristics to the specific study group, are considered "at risk." For example, if one were studying juvenile arrestees, all persons between 10 and 17 years of age would constitute the at-risk population.
PRISON: a state correctional facility where persons are confined following conviction for a felony offense.
PROBATION: a judicial requirement that a person fulfill certain conditions of behavior in lieu of a sentence to confinement. See "Straight Probation."
PROBATION WITH JAIL: a type of disposition given upon conviction which imposes a jail term as a condition of probation.
RATE: a comparison of a number of events to a population.
REMAND: to send back (a case) to another court for further action.
ROBBERY: the taking or attempting to take anything of value from the care, custody, or control of a person or persons by force or threat of force or violence and/or by creating fear in the victim (UCR definition).
SENTENCE: the penalty imposed by a court upon a convicted person.
STRAIGHT PROBATION: probation granted to adults without condition or stipulation that the defendant serve time in jail as a condition of probation.
UNIFORM CRIME REPORTING (UCR): a federal reporting system which compiles crime data based on information submitted by law enforcement agencies throughout the nation. In California, the Department of Justice administers and forwards these law enforcement data to the federal program.
VIOLENT CRIMES: crimes committed against people. This category includes homicide, forcible rape, robbery, and aggravated assault.
YOUTH AUTHORITY: see "California Department of the Youth Authority."
Next page --> APPENDICES 91

Share With Your Colleagues
We encourage you to reproduce this document, share it with your colleagues, and reprint it in your newsletter or journal. However, if you reprint, please cite DOJ/CJSC and appropriate authors found on the title page. We are also interested in how you received a copy of this publication, how you intend to use the information contained within, and how DOJ/CJSC materials meet your individual or agency needs. Please direct your comments or questions to:
California Department of Justice Criminal Justice Statistics Center
Special Requests Unit P.O. Box 903427
Sacramento, CA 94203-4270 Phone: (916) 227-3509
Fax: (916) 227-0427 E-mail: [email protected]
Internet: http://ag.ca.gov/cjsc
Links to:
Preface Crimes Arrests Death Penalties Peace Officers Killed
Justifiable Homicides Data Tables Appendices
CJSC Home Page CJSC Publications AG Home Page