honda final project presentation
TRANSCRIPT
HONDA- Races Ahead in the “CITY”
Group Nine Sec- ADr. Daman Walia ( 13/09)
Koustubha Bhutra ( 25/09)Ashank Mathur ( 29/09)
Abhinaw Shrivastava ( 67/09)Harsh Khemka (117/09)Sunanda Mitra (149/09)
To analyze the reasons for the success of Honda City
To analyze the strengths and weaknesses of Honda City
To make commercials for Honda City based on its
strengths
1. Objectives
1. Industry Overview2. Changing Trends in the Industry3. Macro Influences on the Industry4. Drivers of Growth5. Market Analysis6. Company Analysis- HONDA7. Market Research Methodology8. Macro and Micro Influences9. SWOT Analysis and Commercials
Flow of Presentation
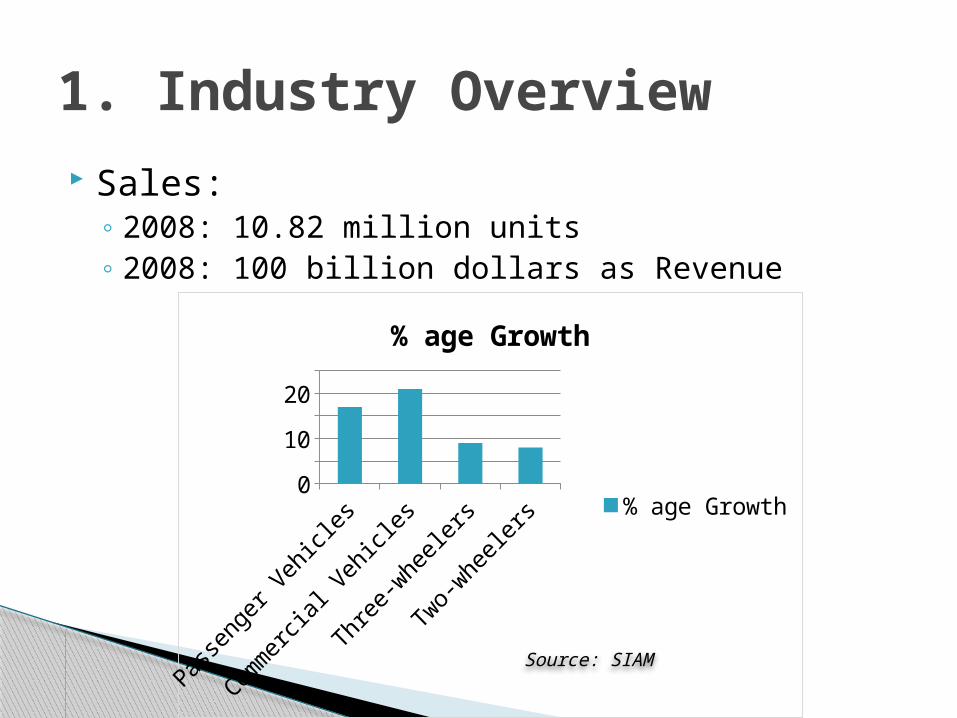
Sales:◦ 2008: 10.82 million units◦ 2008: 100 billion dollars as Revenue
1. Industry Overview
Pass
enge
r Veh
icle
s
Comm
ercial
Veh
icle
s
Thre
e-whe
eler
s
Two-
whe
eler
s0
10
20
% age Growth
% age Growth
Source: SIAM
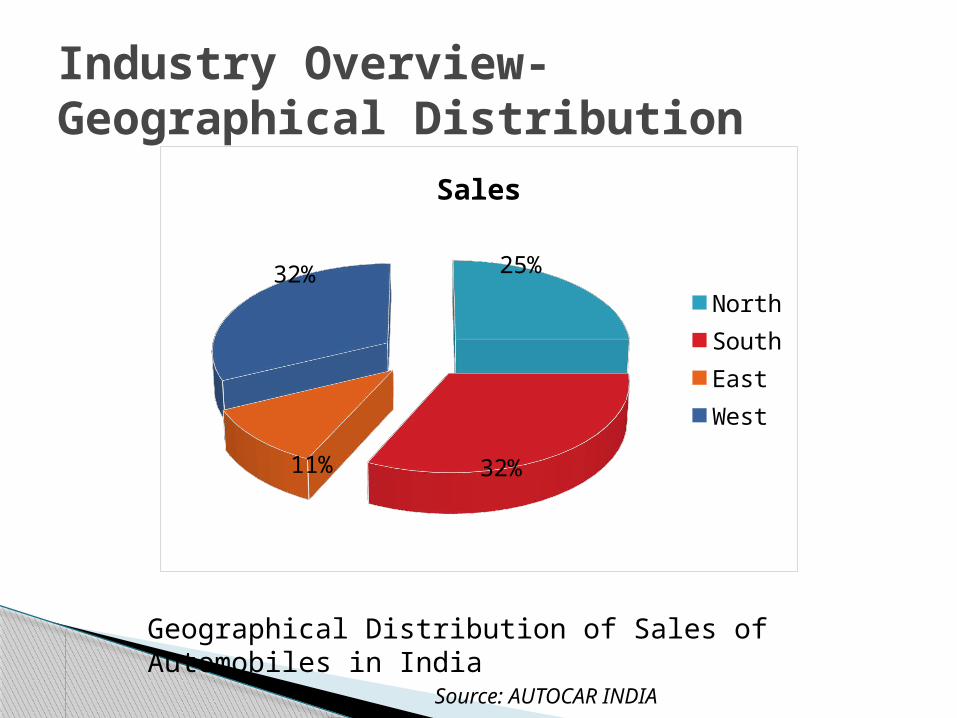
Geographical Distribution of Sales of Automobiles in India
Source: AUTOCAR INDIA
Industry Overview- Geographical Distribution
25%
32%11%
32%
Sales
NorthSouthEastWest
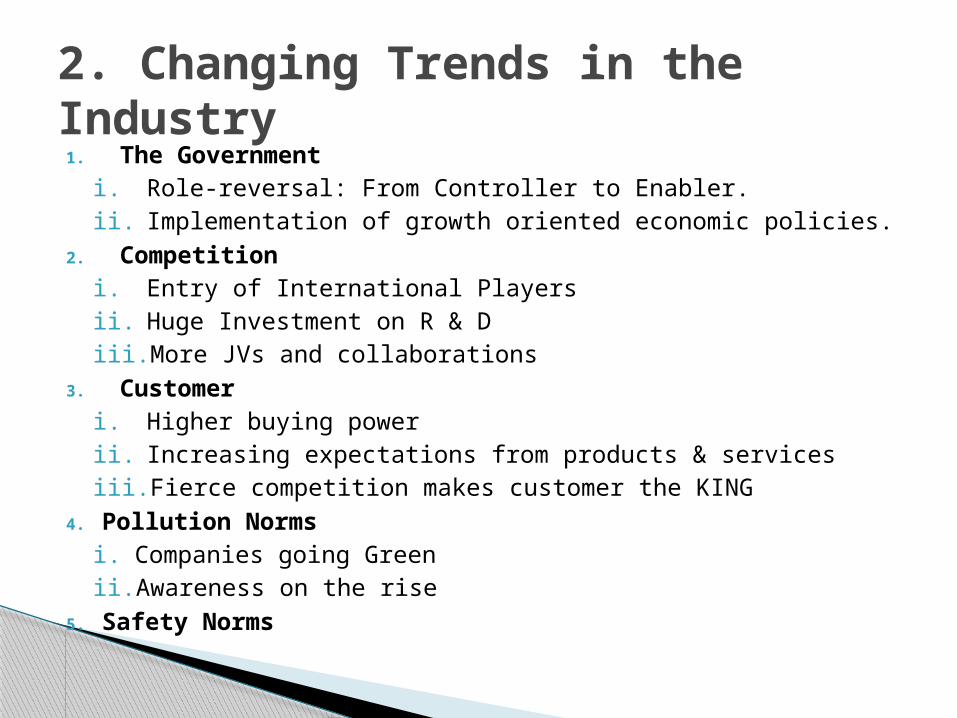
1. The Governmenti. Role-reversal: From Controller to Enabler.ii. Implementation of growth oriented economic policies.
2. Competitioni. Entry of International Playersii. Huge Investment on R & Diii. More JVs and collaborations
3. Customeri. Higher buying powerii. Increasing expectations from products & servicesiii. Fierce competition makes customer the KING
4. Pollution Normsi. Companies going Greenii. Awareness on the rise
5. Safety Norms
2. Changing Trends in the Industry
3. Macro Influences on the Industry
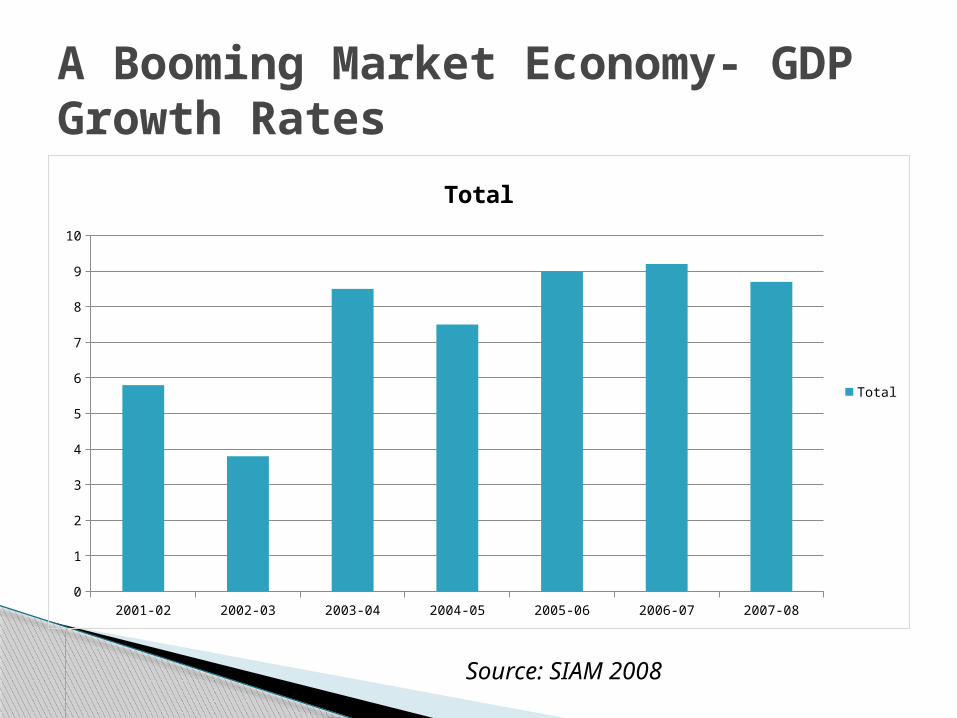
2001-02 2002-03 2003-04 2004-05 2005-06 2006-07 2007-080
1
2
3
4
5
6
7
8
9
10
Total
Total
A Booming Market Economy- GDP Growth Rates
Source: SIAM 2008
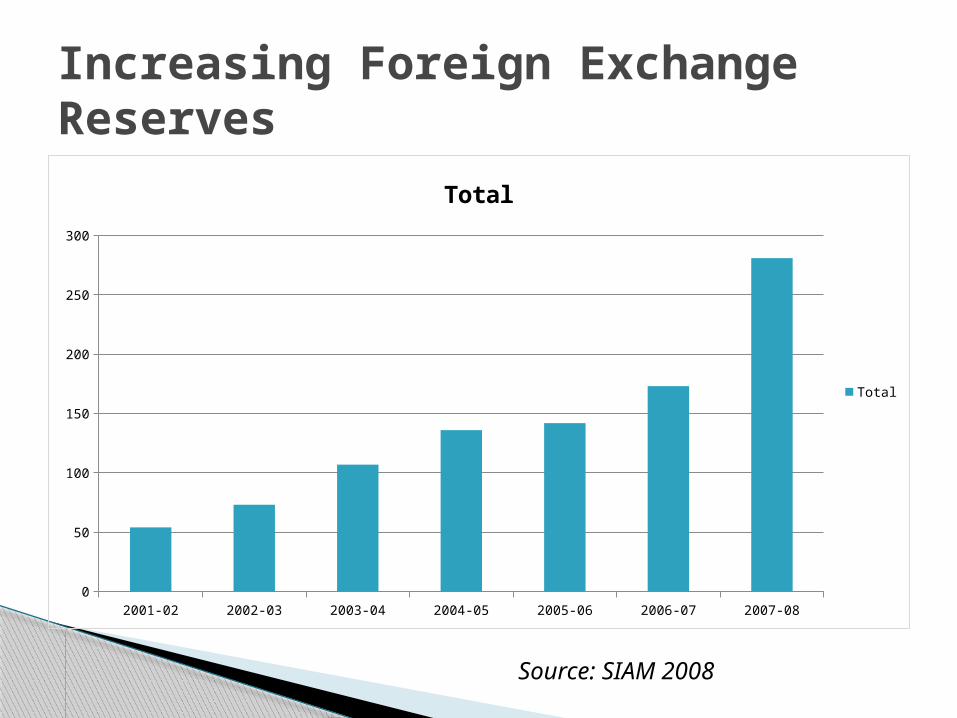
2001-02 2002-03 2003-04 2004-05 2005-06 2006-07 2007-080
50
100
150
200
250
300
Total
Total
Increasing Foreign Exchange Reserves
Source: SIAM 2008
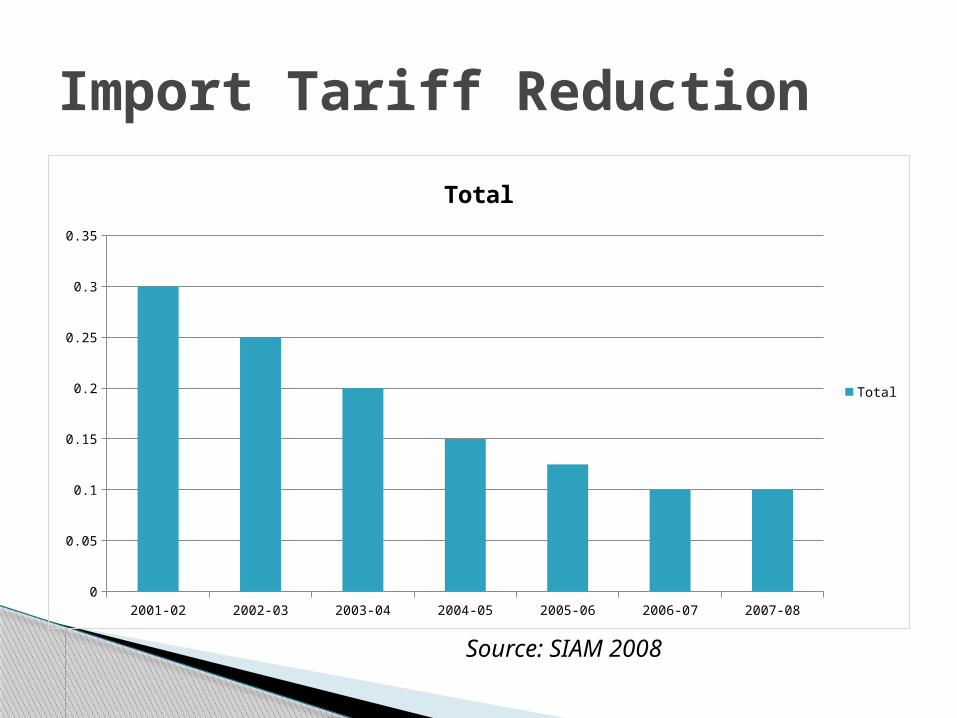
2001-02 2002-03 2003-04 2004-05 2005-06 2006-07 2007-080
0.05
0.1
0.15
0.2
0.25
0.3
0.35
Total
Total
Import Tariff Reduction
Source: SIAM 2008
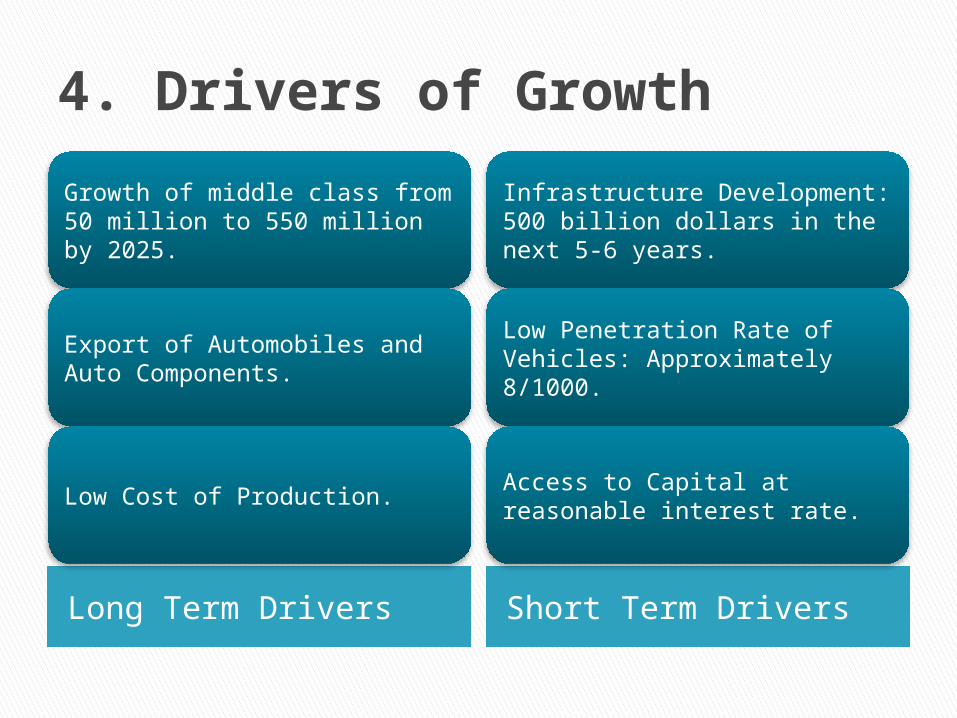
4. Drivers of Growth
Long Term Drivers Short Term Drivers
Growth of middle class from 50 million to 550 million by 2025.
Export of Automobiles and Auto Components.
Low Cost of Production.
Infrastructure Development: 500 billion dollars in the next 5-6 years.
Low Penetration Rate of Vehicles: Approximately 8/1000.
Access to Capital at reasonable interest rate.
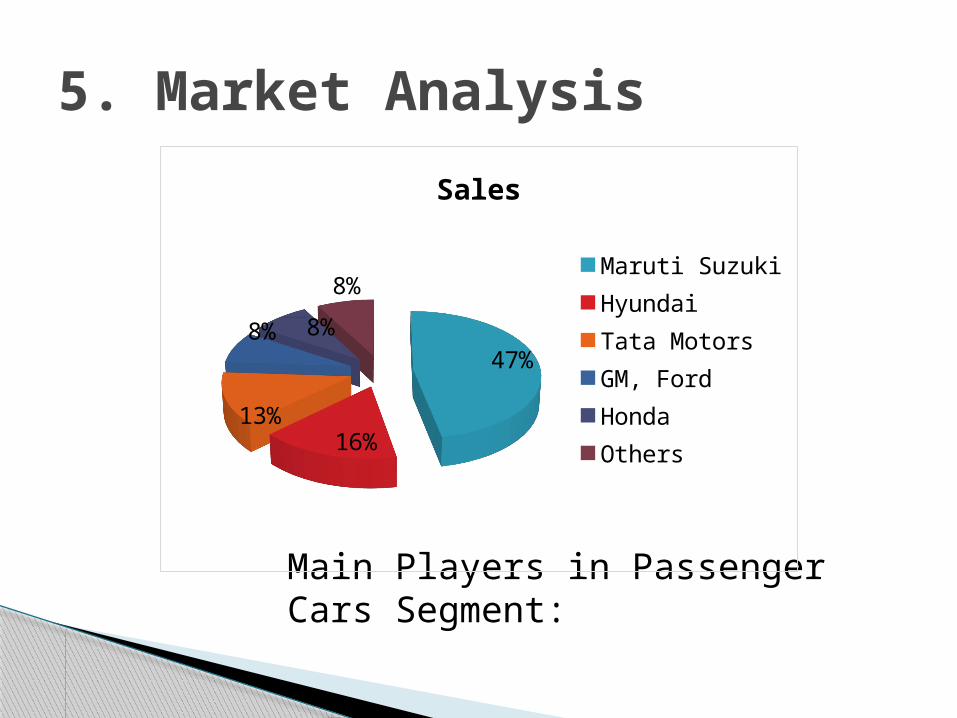
Main Players in Passenger Cars Segment:
5. Market Analysis
47%
16%13%
8%
8%
8%
Sales
Maruti SuzukiHyundaiTata MotorsGM, FordHondaOthers
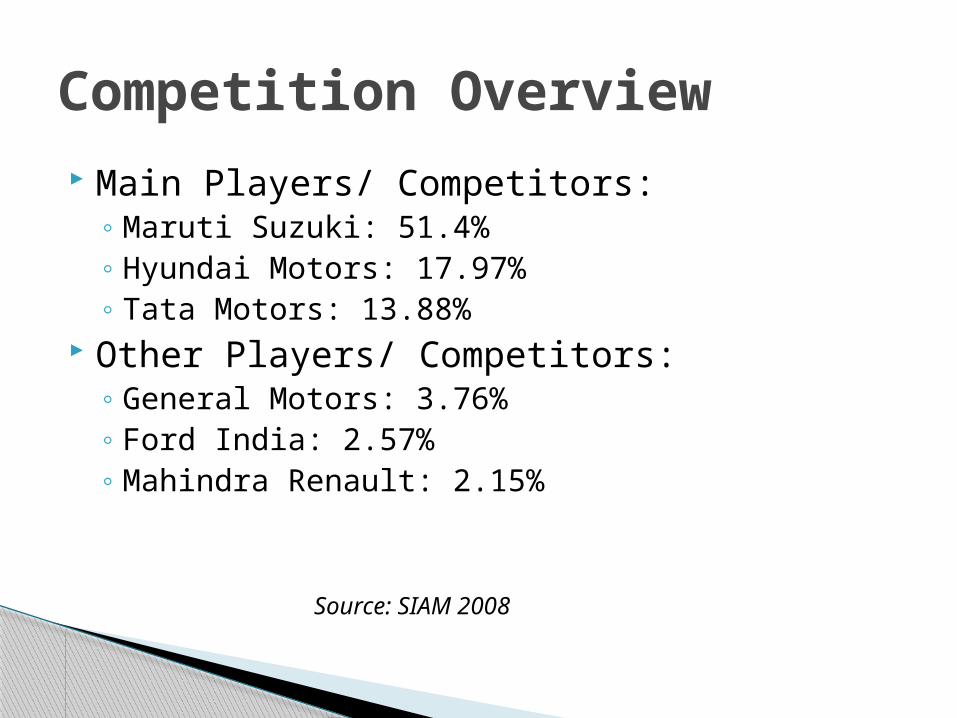
Main Players/ Competitors:◦ Maruti Suzuki: 51.4%◦ Hyundai Motors: 17.97%◦ Tata Motors: 13.88%
Other Players/ Competitors:◦ General Motors: 3.76%◦ Ford India: 2.57%◦ Mahindra Renault: 2.15%
Source: SIAM 2008
Competition Overview
6. Company AnalysisHONDA
Honda started in 1930’s Established as a company on 24th
September, 1948 Headquarters: Tokyo, Japan Founder: Soichiro Honda CEO India: Masahiro Takedagawa 1981: First Honda City
Introduction
Incorporated in India in December, 1995 Joint Venture- Honda Motor Co. Ltd. & Japan
and Siel Ltd. Honda City introduced in India in 1997 Other passenger cars include Civic, Accord,
Jazz and CRV
Honda in India
We see “The Power of Dreams” as a way of thinking that guides us and pushes us forward. The strength of our company comes from this philosophy- which is based on the visionary principles of our founder, Soichiro Honda.
We see the world not as it is, but as it could be. We see the world through the eyes of the dreamers, because we are a company founded by a dreamer. And we are a company built on dreams.
Mission Statement
Accord and CRV: Elite Class
Civic, City and Jazz: Upper Middle Class
Honda has always targeted the elite and the upper middle class groups.
Market Segmentation
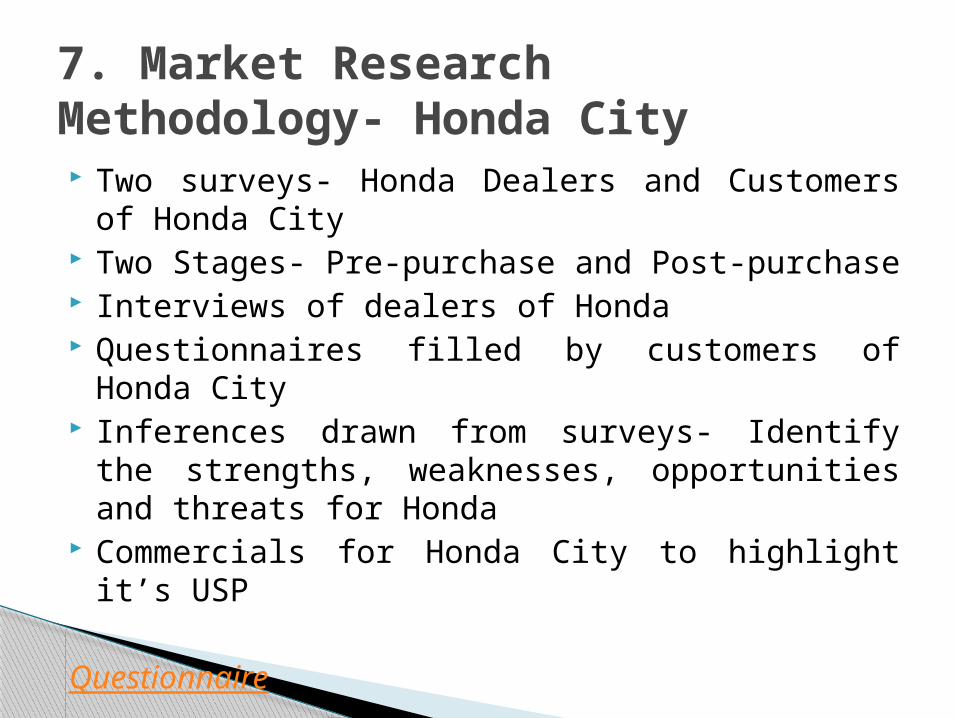
Two surveys- Honda Dealers and Customers of Honda City
Two Stages- Pre-purchase and Post-purchase Interviews of dealers of Honda Questionnaires filled by customers of Honda City Inferences drawn from surveys- Identify the
strengths, weaknesses, opportunities and threats for Honda
Commercials for Honda City to highlight it’s USP
Questionnaire
7. Market Research Methodology- Honda City
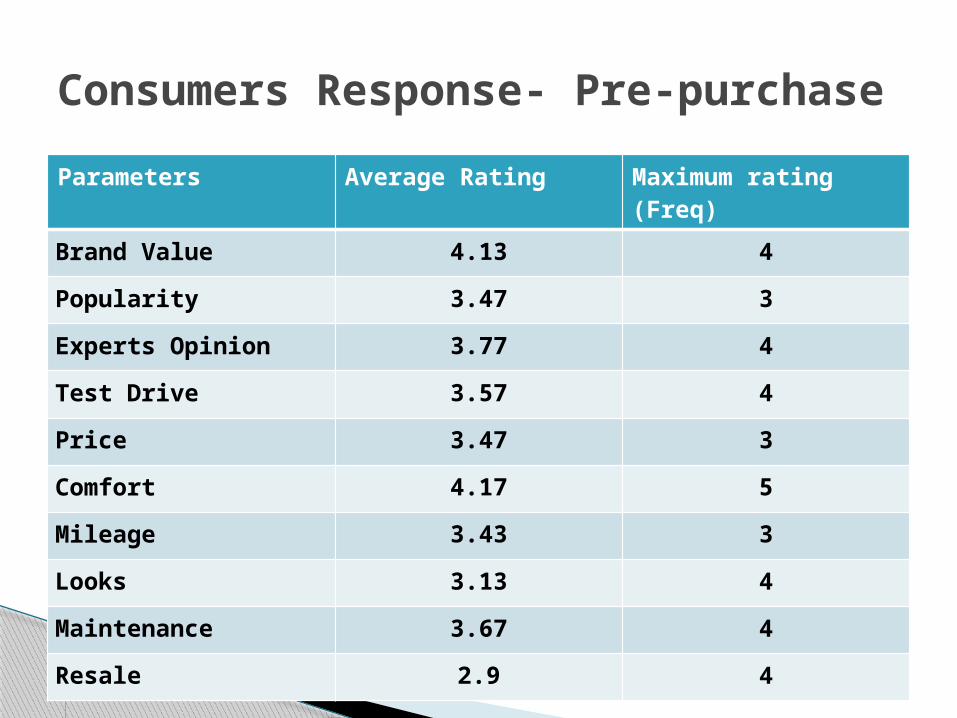
Parameters Average Rating Maximum rating (Freq)
Brand Value 4.13 4
Popularity 3.47 3
Experts Opinion 3.77 4
Test Drive 3.57 4
Price 3.47 3
Comfort 4.17 5
Mileage 3.43 3
Looks 3.13 4
Maintenance 3.67 4
Resale 2.9 4
Consumers Response- Pre-purchase
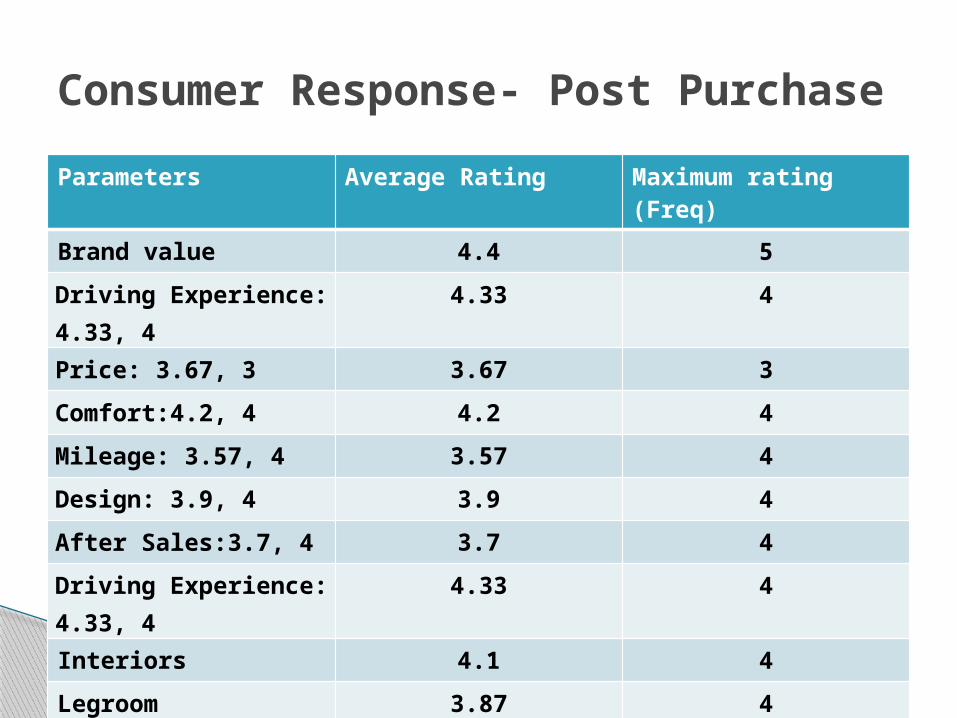
Parameters Average Rating Maximum rating (Freq)
Brand value 4.4 5
Driving Experience: 4.33, 4 4.33 4
Price: 3.67, 3 3.67 3
Comfort:4.2, 4 4.2 4
Mileage: 3.57, 4 3.57 4
Design: 3.9, 4 3.9 4
After Sales:3.7, 4 3.7 4
Driving Experience: 4.33, 4 4.33 4
Interiors 4.1 4
Legroom 3.87 4
Value For Money 4.07 4
Consumer Response- Post Purchase
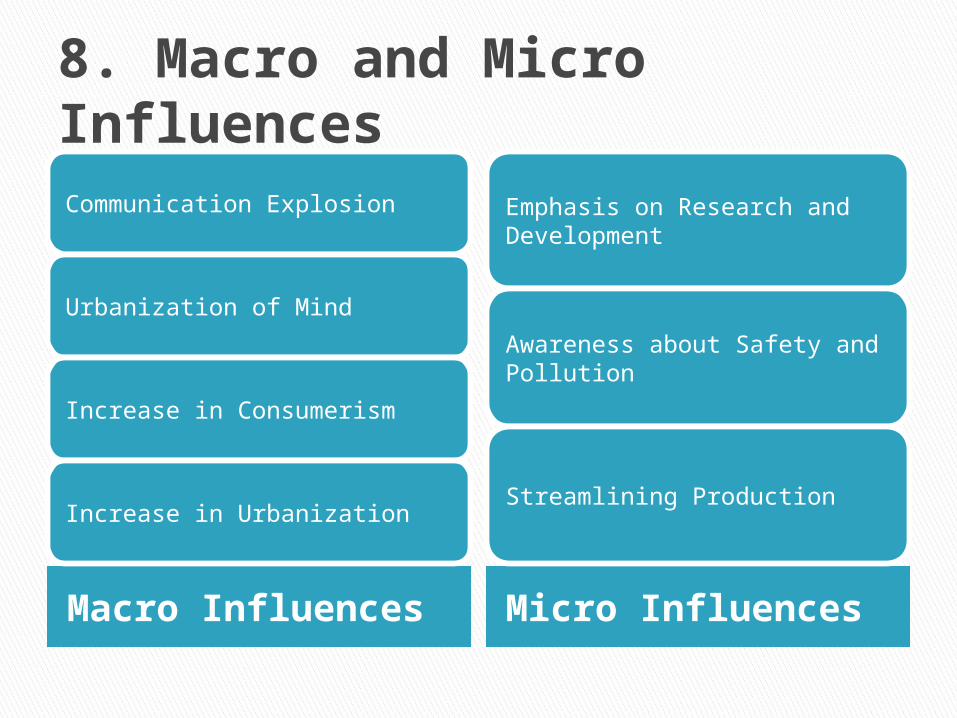
8. Macro and Micro Influences
Macro Influences Micro Influences
Communication Explosion
Urbanization of Mind
Increase in Consumerism
Increase in Urbanization
Emphasis on Research and Development
Awareness about Safety and Pollution
Streamlining Production
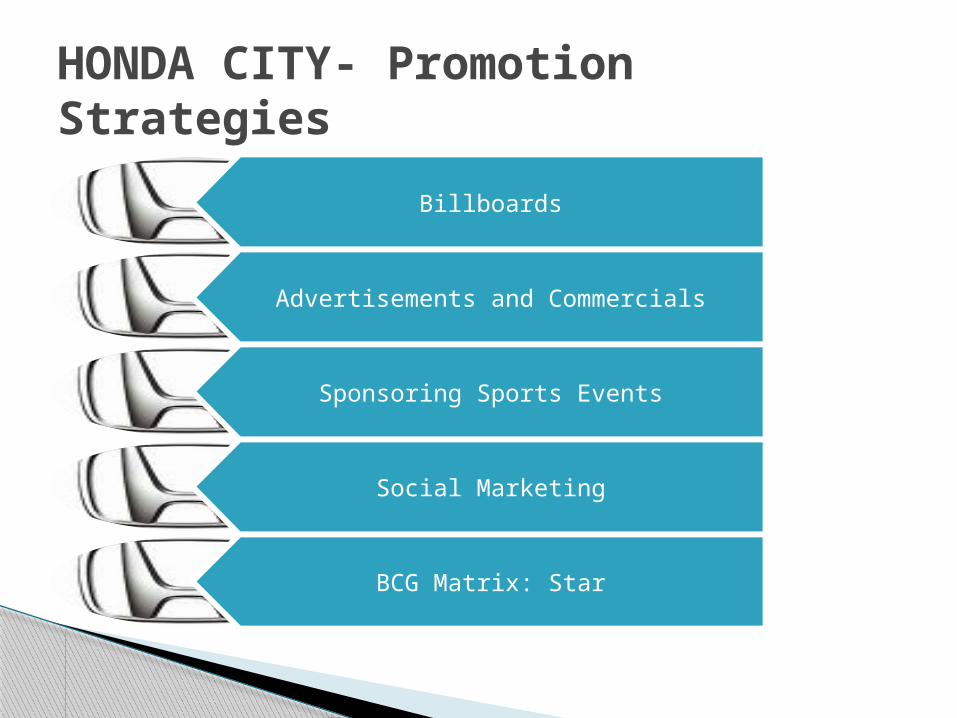
Billboards
Advertisements and Commercials
Sponsoring Sports Events
Social Marketing
BCG Matrix: Star
HONDA CITY- Promotion Strategies
9. SWOT Analysis and Commercials
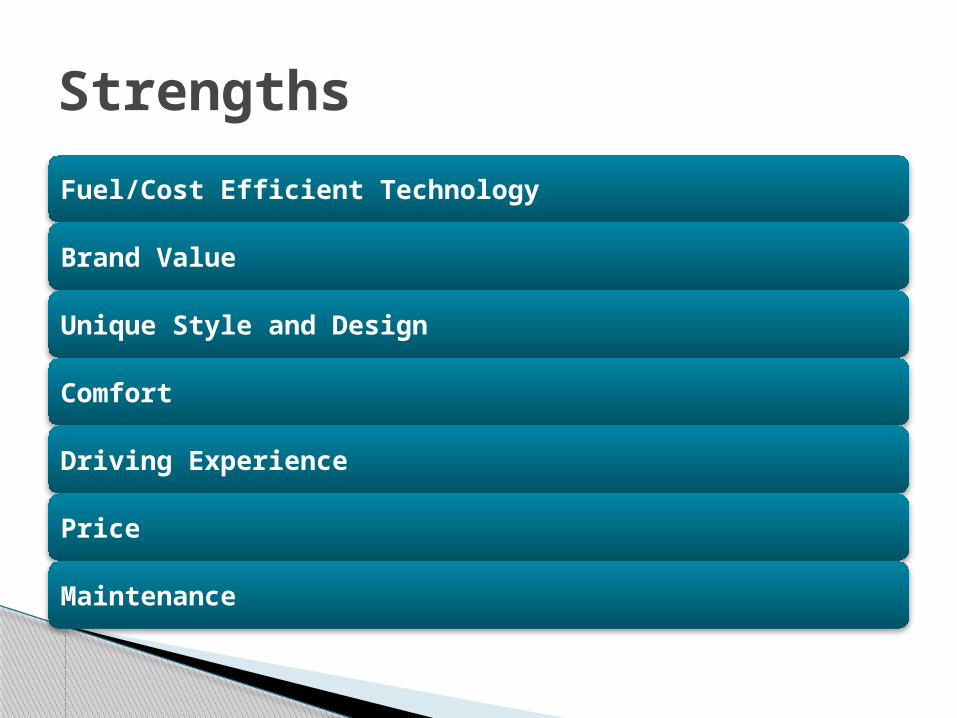
Fuel/Cost Efficient Technology
Brand Value
Unique Style and Design
Comfort
Driving Experience
Price
Maintenance
Strengths
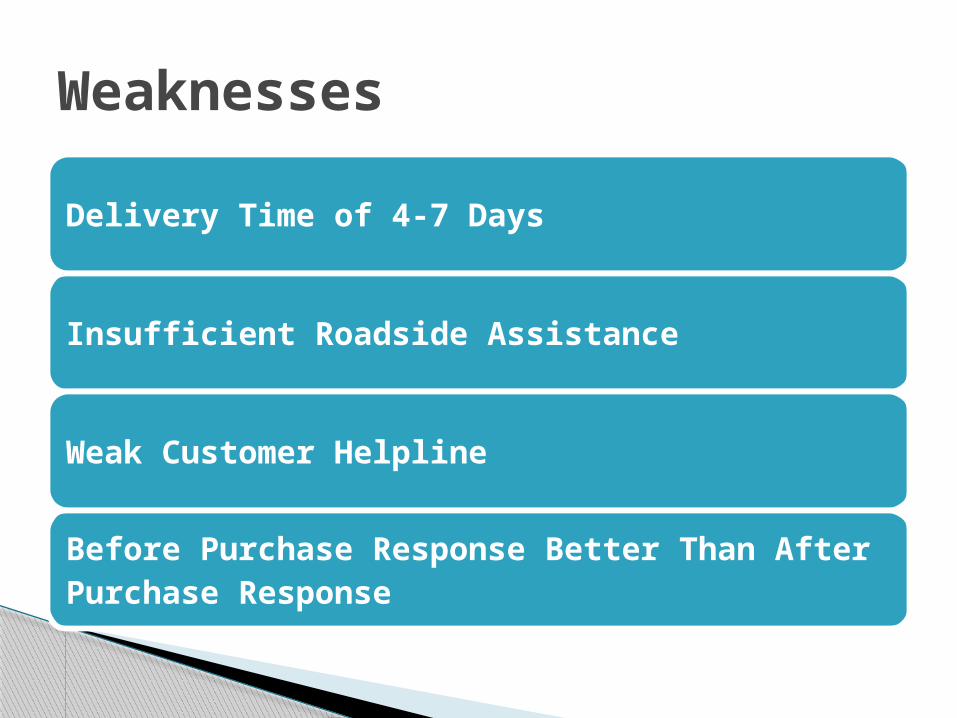
Delivery Time of 4-7 Days
Insufficient Roadside Assistance
Weak Customer Helpline
Before Purchase Response Better Than After Purchase Response
Weaknesses
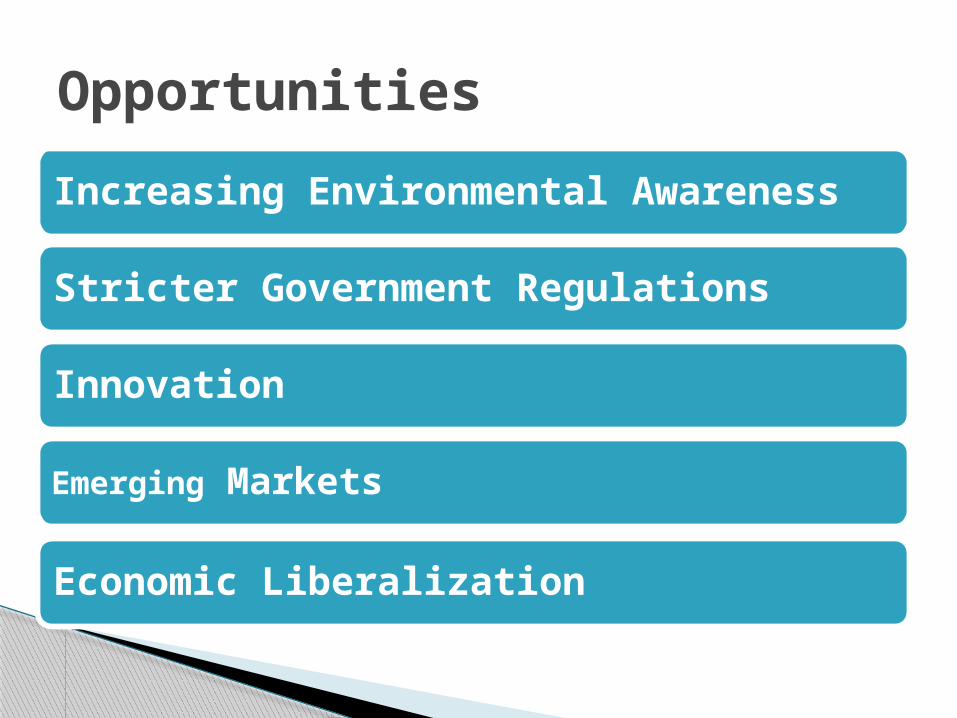
Increasing Environmental Awareness
Stricter Government Regulations
Innovation
Emerging Markets
Economic Liberalization
Opportunities
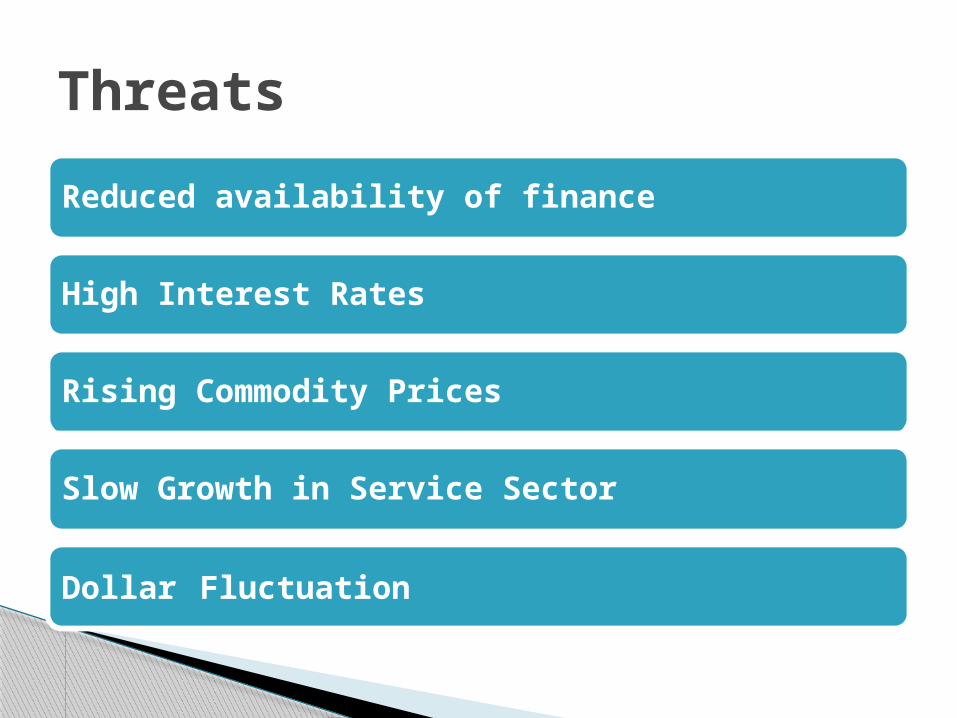
Reduced availability of finance
High Interest Rates
Rising Commodity Prices
Slow Growth in Service Sector
Dollar Fluctuation
Threats
Advertisement 1: Advertisement 2: Advertisement 3:
Commercials

THANK YOU