hong leong investment bank berhad · hong leong investment bank berhad company no: 10209-w...
TRANSCRIPT
HONG LEONG INVESTMENT BANK BERHAD Company no: 10209-W
(Incorporated in Malaysia)
BASEL II PILLAR 3 DISCLOSURES
FOR THE FINANCIAL PERIOD ENDED 30 JUNE 2015

HONG LEONG INVESTMENT BANK BERHAD Company no: 10209-W
(Incorporated in Malaysia)
BASEL II PILLAR 3 DISCLOSURES
FOR THE FINANCIAL PRIOD ENDED 30 JUNE 2015
Content Page
INTRODUCTION 1
SCOPE OF APPLICATION 1
CAPITAL STRUCTURE AND ADEQUACY 1 - 7
RISK MANAGEMENT 8 - 39
EQUITY EXPOSURES IN BANKING BOOK 40
INTEREST RATE RISK/RATE OF RETURN RISK IN BANKING BOOK 41
HONG LEONG INVESTMENT BANK BERHAD
Company no: 10209-W
(Incorporated in Malaysia)
BASEL II PILLAR 3 DISCLOSURES FOR THE FINANCIAL PERIOD ENDED 30 JUNE 2015
1. INTRODUCTION
2. SCOPE OF APPLICATION
3. CAPITAL STRUCTURE AND ADEQUACY
The capital adequacy ratios of the Group consist of capital base and risk-weighted assets derived from consolidated balances
of the Bank and its subsidiary companies.
The capital adequacy ratios of the Bank and the Group are computed in accordance with BNM's revised RWCAF - Basel II.
The Bank and the Group have adopted the Standardised Approach for Credit Risk and Market Risk, and the Basic Indicator
Approach for Operational Risk.
The Group’s capital requirements are generally based on the principles of consolidation adopted in the preparation of its
annual financial statements, as discussed in Note 2A to the Financial Statements for financial year ended 30 June 2014, and
differs from that used for regulatory capital purposes.
During the course of the year, the Bank and its subsidiaries did not experience any restrictions or other major impediments
on transfer of funds or regulatory capital within the Group.
The capital adequacy ratios of Hong Leong Investment Bank Berhad ("HLIBB" or "the Bank") and its subsidiaries ("the
Group") are computed in accordance with the Bank Negara Malaysia's ("BNM") revised Risk-Weighted Capital Adequacy
Framework ("RWCAF") - Basel II effective from 1 January 2008.
The Group places great importance to Basel II and view Basel II as a group-wide initiative that will ensure that the Group
continues to meet international best practices for the credit, market and operational risk management practices. By adopting
Basel II, the Group will be able to enhance and embed sound risk management practices within the Group and be equipped
with the right risk management discipline, practices, processes and systems.
The following information concerning the Group's risk exposures, risk management practices and capital adequacy is
disclosed as accompanying information to the annual report and does not form part of the audited accounts.
The Group monitors the capital adequacy position of the Bank and its subsidiaries to ensure compliance with requirements of
BNM and to take prompt actions to address projected capital deficiency. The capital position is reviewed on a monthly basis
by undertaking stress tests and taking into account the levels and trend of material risks. The sufficiency of capital is
assessed against the various risks in the balance sheet as well as future capital requirements based on the Group’s expansion
plans.
The Group has also formalised an overall capital management framework, which seeks to ensure that there is an adequate
balance between Tier I and Tier II capital. The Group is also following very closely the global developments on capital
management.
The following table sets forth details on the capital resources, capital adequacy ratios and risk-weighted assets for the Group
and the Bank as at 30 June 2015. BNM's revised RWCAF - Basel II sets out the minimum capital adequacy ratios for the
banking institutions and the methodology for calculating these ratios. As at 30 June 2015, the Group's and the Bank's Tier I
and the total capital adequacy ratios were higher than BNM's minimum requirements.
1

HONG LEONG INVESTMENT BANK BERHAD
Company no: 10209-W
(Incorporated in Malaysia)
BASEL II PILLAR 3 DISCLOSURES FOR THE FINANCIAL PERIOD ENDED 30 JUNE 2015
3. CAPITAL STRUCTURE AND ADEQUACY (CONTINUED)
(a)
30 June 2015
The capital adequacy ratios of the Group and the Bank are as follows:
The Group The Bank
Before deducting proposed dividends:
Common equity tier 1 ("CET1") ratio 23.695% 23.683%
Tier I capital ratio 23.695% 23.683%
Total capital ratio 27.380% 27.355%
After deducting proposed dividends:
CET I capital ratio 20.847% 20.832%
Tier I capital ratio 20.847% 20.832%
Total capital ratio 24.532% 24.504%
The components of CET1, Tier 1 and total capital of the Bank are as follows:
The Group The Bank
RM'000 RM'000
CET1 capital
Paid-up ordinary share capital 165,000 165,000
Share premium 87,950 87,950
Retained profits 23,040 22,742
Other reserves 198,645 198,645
Less: goodwill and intangible assets (32,535) (32,535)
Less: deferred tax assets (95,002) (95,002)
Less: 55% of cumulative gains of financial instruments available-for-sale (978) (1,132)
Total CET1 capital 346,120 345,668
Tier 1 capital 346,120 345,668
Tier-2 capital
Redeemable preference shares (“RPS”) - -
Subordinated notes
Collective assessment allowance (1)
3,825 3,825
and regulatory reserve (2)
50,000 50,000
Regulatory adjustments:
- Investment in subsidiaries - (230)
Total Tier 2 capital 53,825 53,595
Total capital 399,945 399,263
Note:(1)
(2)Includes the qualifying regulatory reserve for non-impaired loans and advances of RM3,031,000 (2014: RM Nil).
Breakdown of risk-weighted assets in the various risk weights:
The Group The Bank
RM'000 RM'000
Credit risk 678,755 678,033
Market risk 483,713 483,713
Operational risk 298,237 297,840
1,460,705 1,459,586
Excludes collective assessment allowance attributable to loans and advances classified as impaired.
The capital adequacy ratios of the Group and the Bank are analysed as follows:
2

HONG LEONG INVESTMENT BANK BERHAD
Company no: 10209-W
(Incorporated in Malaysia)
BASEL II PILLAR 3 DISCLOSURES FOR THE FINANCIAL PERIOD ENDED 30 JUNE 2015
3. CAPITAL STRUCTURE AND ADEQUACY (CONTINUED)
(a)
30 June 2014
The capital adequacy ratios of the Group and the Bank are as follows:
The Group The Bank
Before deducting proposed dividends:
Common equity tier 1 ("CET1") ratio 20.128% 20.108%
Tier I capital ratio 20.128% 20.108%
Total capital ratio 20.296% 20.259%
After deducting proposed dividends:
CET I capital ratio 16.422% 16.401%
Tier I capital ratio 16.422% 16.401%
Total capital ratio 16.590% 16.552%
The components of CET1, Tier 1 and total capital of the Bank are as follows:
The Group The Bank
RM'000 RM'000
CET1 capital
Paid-up ordinary share capital 165,000 165,000
Share premium 87,950 87,950
Retained profits 39,244 38,903
Other reserves 179,789 179,789
Less: goodwill and intangible assets (29,978) (29,978)
Less: deferred tax assets (103,671) (103,671)
Less: 55% of cumulative gains of financial instruments available-for-sale - (77)
Total CET1 capital 338,334 337,916
Tier 1 capital 338,334 337,916
Tier-2 capital
Redeemable preference shares (“RPS”) 1,631 1,631
Collective assessment allowance (1)
and regulatory reserve (2)
1,204 1,204
Regulatory adjustments:
- Investment in subsidiaries - (306)
Total Tier 2 capital 2,835 2,529
Total capital 341,169 340,445
Note:(1)
(2)Includes the qualifying regulatory reserve for non-impaired loans and advances of RM3,031,000 (2014: RM Nil).
Breakdown of risk-weighted assets in the various risk weights:
The Group The Bank
RM'000 RM'000
Credit risk 896,229 896,087
Market risk 571,557 571,557
Operational risk 213,166 212,853
1,680,952 1,680,497
Excludes collective assessment allowance attributable to loans and advances classified as impaired.
The capital adequacy ratios of the Group and the Bank are analysed as follows (continued):
3

HONG LEONG INVESTMENT BANK BERHAD
Company no: 10209-W
(Incorporated in Malaysia)
BASEL II PILLAR 3 DISCLOSURES FOR THE FINANCIAL PERIOD ENDED 30 JUNE 2015
3. CAPITAL STRUCTURE AND ADEQUACY (CONTINUED)
(b)
Risk-
The Group Gross Net Weighted Capital
30 June 2015 Exposures Exposures Assets Requirements
Exposure Class RM'000 RM'000 RM'000 RM'000
(i) Credit Risk
On-Balance Sheet Exposures:
Sovereigns & Central Banks 645,153 645,153 - -
Public Sector Entities 6 6 1 -
Banks, Development Financial
Institutions ("DFI") & Multilateral
Development Banks ("MDBs") 607,963 607,963 187,694 15,016
Insurance Companies, Securities Firms
& Fund Managers - - - -
Corporates 960,351 782,023 416,007 33,281
Residential Mortgages 625 625 625 50
Other Assets 213,394 213,394 25,415 2,033
Equity Exposures 245 245 245 20
Total On-Balance Sheet Exposures 2,427,737 2,249,409 629,987 50,400
Off-Balance Sheet Exposures:
Credit-related Off-Balance Sheet Exposures 10,250 10,250 4,650 372
Derivative Financial Instruments 171,308 171,308 44,118 3,529
Total Off-Balance Sheet Exposures 181,558 181,558 48,768 3,901
Total On and Off-Balance Sheet Exposures 2,609,295 2,430,967 678,755 54,301
(ii) Large Exposure Risk Requirement - - - -
(iii) Market Risk Long Position Short Position
Interest Rate Risk 7,587,122 6,672,989 431,166 34,493
Equity Risk 21,759 43,640 3,491
Foreign Exchange Risk 729 4,635 4,635 371
Options Risk 3,097 4,273 342
7,612,707 6,677,624 483,713 38,697
(iv) Operational Risk 298,237 23,859
Total RWA and Capital Requirements 1,460,705 116,857
The breakdown of risk-weighted assets ("RWA") by exposure is as follows:
4

HONG LEONG INVESTMENT BANK BERHAD
Company no: 10209-W
(Incorporated in Malaysia)
BASEL II PILLAR 3 DISCLOSURES FOR THE FINANCIAL PERIOD ENDED 30 JUNE 2015
3. CAPITAL STRUCTURE AND ADEQUACY (CONTINUED)
(b)
Risk-
The Group Gross Net Weighted Capital
30 June 2014 Exposures Exposures Assets Requirements
Exposure Class RM'000 RM'000 RM'000 RM'000
(i) Credit Risk
On-Balance Sheet Exposures:
Sovereigns & Central Banks 628,630 628,630 - -
Public Sector Entities 7 7 1 -
Banks, Development Financial
Institutions ("DFI") & Multilateral
Development Banks ("MDBs") 1,233,617 1,233,617 327,532 26,203
Insurance Companies, Securities Firms
& Fund Managers - - - -
Corporates 887,514 596,130 317,583 25,407
Residential Mortgages 1,258 1,258 1,258 101
Other Assets 335,838 335,838 50,435 4,035
Equity Exposures 245 245 245 20
Total On-Balance Sheet Exposures 3,087,109 2,795,725 697,054 55,766
Off-Balance Sheet Exposures:
Credit-related Off-Balance Sheet Exposures 192,639 192,639 176,139 14,091
Derivative Financial Instruments 92,620 92,620 23,036 1,843
Total Off-Balance Sheet Exposures 285,259 285,259 199,175 15,934
Total On and Off-Balance Sheet Exposures 3,372,368 3,080,984 896,229 71,700
(ii) Large Exposure Risk Requirement - - - -
(iii) Market Risk Long Position Short Position
Interest Rate Risk 5,337,113 4,462,345 262,369 20,989
Equity Risk 8,360 - 16,725 1,338
Foreign Exchange Risk 16,430 16,276 16,000 1,280
Options Risk 195,414 - 276,463 22,117
5,557,317 4,478,621 571,557 45,724
(iv) Operational Risk 213,166 17,053
Total RWA and Capital Requirements 1,680,952 134,477
The breakdown of risk-weighted assets ("RWA") by exposure is as follows (continued):
5

HONG LEONG INVESTMENT BANK BERHAD
Company no: 10209-W
(Incorporated in Malaysia)
BASEL II PILLAR 3 DISCLOSURES FOR THE FINANCIAL PERIOD ENDED 30 JUNE 2015
3. CAPITAL STRUCTURE AND ADEQUACY (CONTINUED)
(b)
Risk-
The Bank Gross Net Weighted Capital
30 June 2015 Exposures Exposures Assets Requirements
Exposure Class RM'000 RM'000 RM'000 RM'000
(i) Credit Risk
On-Balance Sheet Exposures:
Sovereigns & Central Banks 645,153 645,153 - -
Public Sector Entities - - - -
Banks, DFI & MDBs 605,560 605,560 187,213 14,977
Insurance Companies, Securities Firms
& Fund Managers - - - -
Corporates 960,111 781,783 415,767 33,261
Residential Mortgages 625 625 625 50
Other Assets 213,394 213,394 25,415 2,033
Equity Exposures 245 245 245 20
Total On-Balance Sheet Exposures 2,425,088 2,246,760 629,265 50,341
Off-Balance Sheet Exposures:
Credit-related Off-Balance Sheet Exposures 10,250 10,250 4,650 372
Derivative Financial Instruments 171,308 171,308 44,118 3,529
Total Off-Balance Sheet Exposures 181,558 181,558 48,768 3,901
Total On and Off-Balance Sheet Exposures 2,606,646 2,428,318 678,033 54,242
(ii) Large Exposure Risk Requirement
(iii) Market Risk Long Position Short Position
Interest Rate Risk 7,587,122 6,672,989 431,166 34,493
Equity Risk 21,759 43,640 3,491
Foreign Exchange Risk 729 4,635 4,635 371
Options Risk 3,097 4,273 342
7,612,707 6,677,624 483,713 38,697
(iv) Operational Risk 297,840 23,827
Total RWA and Capital Requirements 1,459,586 116,766
The breakdown of risk-weighted assets ("RWA") by exposure is as follows (continued):
6

HONG LEONG INVESTMENT BANK BERHAD
Company no: 10209-W
(Incorporated in Malaysia)
BASEL II PILLAR 3 DISCLOSURES FOR THE FINANCIAL PERIOD ENDED 30 JUNE 2015
3. CAPITAL STRUCTURE AND ADEQUACY (CONTINUED)
(b)
Risk-
The Bank Gross Net Weighted Capital
30 June 2014 Exposures Exposures Assets Requirements
Exposure Class RM'000 RM'000 RM'000 RM'000
(i) Credit Risk
On-Balance Sheet Exposures:
Sovereigns & Central Banks 628,630 628,630 - -
Public Sector Entities - - - -
Banks, DFI & MDBs 1,232,915 1,232,915 327,392 26,191
Insurance Companies, Securities Firms
& Fund Managers - - - -
Corporates 887,514 596,130 317,582 25,407
Residential Mortgages 1,258 1,258 1,258 101
Other Assets 335,838 335,838 50,435 4,035
Equity Exposures 245 245 245 20
Total On-Balance Sheet Exposures 3,086,400 2,795,016 696,912 55,754
Off-Balance Sheet Exposures:
Credit-related Off-Balance Sheet Exposures 192,639 192,639 176,139 14,091
Derivative Financial Instruments 92,620 92,620 23,036 1,843
Total Off-Balance Sheet Exposures 285,259 285,259 199,175 15,934
Total On and Off-Balance Sheet Exposures 3,371,659 3,080,275 896,087 71,688
(ii) Large Exposure Risk Requirement - - - -
(iii) Market Risk Long Position Short Position
Interest Rate Risk 5,337,113 4,462,345 262,369 20,989
Equity Risk 8,360 - 16,725 1,338
Foreign Exchange Risk 16,430 16,276 16,000 1,280
Options Risk 195,414 - 276,463 22,117
5,557,317 4,478,621 571,557 45,724
(iv) Operational Risk 212,853 17,028
Total RWA and Capital Requirements 1,680,497 134,440
The breakdown of risk-weighted assets ("RWA") by exposure is as follows (continued):
7

HONG LEONG INVESTMENT BANK BERHAD
Company no: 10209-W
(Incorporated in Malaysia)
BASEL II PILLAR 3 DISCLOSURES FOR THE FINANCIAL PERIOD ENDED 30 JUNE 2015
4. RISK MANAGEMENT
(i) A structured risk governance model, incorporating strong Board and senior management oversight.
(ii) Sound capital management processes.
(iii) Comprehensive assessment of material risks.
(iv) A rigorous system of check and balance reviews.
(v) Regular monitoring and reporting.
(vi) Independent reviews by the internal and external auditors.
(i) Board, Audit and Risk Management Committee ("BARMC").
(ii) Assets and Liabilities Management Committee ("ALMCO").
(iii) Management Credit and Underwriting Committee ("MCUC").
The BARMC is responsible for the following:
(i)
(ii)
(iii)
(iv)
Reviewing and recommending risk management strategies, policies and risk tolerance for the Board’s
approval.
Reviewing and assessing adequacy of risk management policies and framework in identifying,
measuring, monitoring and controlling risk and the extent to which these are operating effectively.
Ensuring infrastructure, resources and systems are in place for risk management i.e. ensuring that the
staff responsible for implementing risk management systems perform those duties independently of
risk taking activities.
Reviewing management’s periodic reports on risk exposure, risk portfolio composition and risk
management activities.
Overview
The Group believes that an integrated risk management framework is key to ensuring the overall financial
soundness and stability of the Group’s business operations. Key components of our enterprise wide risk
management framework include:
Risk governance structure
The Board has overall responsibility for providing leadership, overseeing risk appetite and ensuring that a
robust risk and compliance culture prevails. The Board is assisted by the following Board and management
committees:
The Risk Management Department is responsible for assisting the BARMC, ALMCO, MCUC and the
Board in ensuring that the risk management activities are carried out as per their directives. Amongst
others, Risk Management Department is responsible for setting the risk management framework and
developing tools and methodologies for the identification, measurement, monitoring, control and valuation
of risks. The Risk Management Department consists of three main units namely Market and Liquidity Risk,
Operational Risk and Credit Risk Management.
8

HONG LEONG INVESTMENT BANK BERHAD
Company no: 10209-W
(Incorporated in Malaysia)
BASEL II PILLAR 3 DISCLOSURES FOR THE FINANCIAL PERIOD ENDED 30 JUNE 2015
4. RISK MANAGEMENT (continued)
Risk governance structure (continued)
(i)
(ii)
(iii)
(iv)
Eight broad principles of risk management
(i) Align risk appetite and strategy
(ii) Link growth, risk and return
(iii) Enhance risk response decisions
(iv) Minimise operational surprises and losses
(v) Identify and manage cross-risks
(vi) Provide integrated responses to multiple risks
Performing independent reviews to assess the risk grading system and the credit process.
Forming independent opinions on risk controls being formulated by the Risk Management
Department.
Ensuring that the risk policies prepared by the Risk Management Department are enforced through its
regular audit cycle.
Performing independent reviews to assess the risk control environment developed by the Risk
Management Department.
The Group Internal Audit function complements the Risk Management Department in the management of
risk by:
The Group strives to identify and select among alternative risk responses - risk avoidance, reduction,
sharing and acceptance based on generally accepted practices and methodologies.
Business processes carry many inherent risks and the Group continually finds solutions for managing
the risks.
Risk appetite is the degree of risk that the Group is willing to accept in pursuit of its goals. Risk
appetite is set first in evaluating strategic alternatives, then in setting objectives aligned with the
selected strategy and in developing mechanisms to manage the related risks.
Framework provides an enhanced ability to identify and assess risks and establish acceptable levels
of risk relative to growth and return objectives.
The Group continually enhances its capability to identify potential events, assess risk and establish
responses, thereby reducing the occurrence of surprises and related costs or losses.
Every product faces a myriad of risks. The Group not only manages the individual risks, but also
manages interrelated impacts.
9

HONG LEONG INVESTMENT BANK BERHAD
Company no: 10209-W
(Incorporated in Malaysia)
BASEL II PILLAR 3 DISCLOSURES FOR THE FINANCIAL PERIOD ENDED 30 JUNE 2015
4. RISK MANAGEMENT (continued)
Eight broad principles of risk management (continued)
(vii) Seize opportunities
(viii) Rationalise capital
Risk management framework
Risk management culture
The risk management culture of the Group encompasses the following:
(i) Developing strategies
(ii) Adopting skills
The capabilities and resources required for implementing the risk management function.
(iii) Cultivating shared values
More robust information on total risk allows the Group to more effectively assess overall capital
needs and improve capital allocation.
the risks.
The Group considers potential events, using risk management as offensive initiatives rather than just
risks (defensive), and by considering a full range of events, the Group gains an understanding of how
certain events represent opportunities.
Documentation that is approved by the Board which expresses the Group’s risk management
strategies and appetite.
The Group’s risk management framework outlines the overall structure, aspirations, values and risk
management strategies, and is a structured approach in balancing risks and returns.
Appropriate methodologies and measures have been developed in our risk management approaches to
manage uncertainties such that the deviations from the intended strategic objectives are monitored and kept
within tolerable levels.
The universal risk management culture that the Group expects and promotes throughout the business
units.
10

HONG LEONG INVESTMENT BANK BERHAD
Company no: 10209-W
(Incorporated in Malaysia)
BASEL II PILLAR 3 DISCLOSURES FOR THE FINANCIAL PERIOD ENDED 30 JUNE 2015
4. RISK MANAGEMENT (continued)
Risk management approach
The risk management approach is summarised as follows:
(i) Strategy
(ii) Policy
Risks are addressed using specific risk policies.
(iii) Tools
(iv) Communication
Risks are adequately communicated across the Group in a timely manner.
(v) Implementation
(vi) Maintenance
Risk management process
The risk management approaches are based on four simple processes:
(i) Identify what, why and how risks can arise:
• Nature of risk.
• Circumstances.
• Causes.
• Potential contributing factors.
Risks and returns are identified and managed by respective accountable business, support and
operating units.
Risk management policies are integrated with business and strategies, in line with Board approved
risk appetite.
Risks are measured and assessed using clearly defined models, methodologies and benchmarking.
Risk management policies are clearly and formally documented, with a review in place to respond to
changes in operating environment.
11

HONG LEONG INVESTMENT BANK BERHAD
Company no: 10209-W
(Incorporated in Malaysia)
BASEL II PILLAR 3 DISCLOSURES FOR THE FINANCIAL PERIOD ENDED 30 JUNE 2015
4. RISK MANAGEMENT (continued)
Risk management process (continued)
(ii) Analyse and evaluate risks:
• Analyse and measure risk exposures using impact and probability analysis.
• Establish priorities using risk matrix.
• Compare risk exposures with Group’s risk appetite.
(iii) Measures to control or mitigate the identified risks:
• Measures to mitigate the identified risks or risk controls.
• Action plans to either prevent or mitigate the risks.
(iv) Monitor and review the performance of the risk management process:
• Review effectiveness of mitigating measures or controls.
• Tracking of incidences and losses.
• Review feedback from internal reports and take appropriate action.
12

HONG LEONG INVESTMENT BANK BERHAD
Company no: 10209-W
(Incorporated in Malaysia)
BASEL II PILLAR 3 DISCLOSURES FOR THE FINANCIAL PERIOD ENDED 30 JUNE 2015
4. RISK MANAGEMENT (CONTINUED)
(A) Credit risk
(i) Identification
•
(ii) Assessment/Measurement
•
(iii) Control/Mitigation
•
•
•
(iv) Monitoring/Review
•
•
Credit risk arises as a result of customers or counterparties not being able to or willing to fulfill their
financial and contractual obligations as and when they fall due. These obligations arise from lending, trade
finance and other activities undertaken by the Group.
The primary objective of the credit risk management framework is to ensure that exposure to credit risk is
kept within the Group’s financial capacity to withstand potential future losses. Lending activities are guided
by internal credit policies and guidelines that are approved by the Board. These policies were reviewed and
further enhanced during the year.
Credit portfolio management strategies and significant exposures are reviewed by the Board. These
portfolio management strategies are designed to achieve a desired ideal portfolio risk tolerance level and
sector distribution. This includes minimum credit rating targets for new credit facilities.
The Group’s credit approving process encompasses pre-approval evaluation, approval and post-approval
evaluation. While the business units are responsible for credit origination, the credit approving function
rests mainly with the MCUC.
Credit risk is also identified as part of the new product sign-off process to ensure that new products prior to
marketing are acceptable from a credit risk management perspective.
The Group also believes that authority limits for credit approvals should be directly related to the risk levels
of the borrower and the transaction. In this respect, a Delegated Authority Limit structure had been
implemented.
Credit Risk Management Process
Risk assessment on the potential impact of internal and external factors on transactions and
positions.
Analysis/review on loan exposures, asset quality evaluation, and movement of impaired loans and
advances.
Internal credit rating systems to evaluate customer’s credit worthiness.
Credit risk management policies and guidelines on credit rating, collateral and loan recovery.
Exposure limits based on credit worthiness level for corporate groups, and prudent thresholds by
economic sectors.
Monitoring the benchmark return to consider the risk taken.
Reporting on exposures against approved credit limits.
13

HONG LEONG INVESTMENT BANK BERHAD
Company no: 10209-W
(Incorporated in Malaysia)
BASEL II PILLAR 3 DISCLOSURES FOR THE FINANCIAL PERIOD ENDED 30 JUNE 2015
4. RISK MANAGEMENT (CONTINUED)
(A) Credit risk (continued)
Gross credit exposure
(i)
The Group and the Bank Malaysia
Other
countries Total
RM'000 RM'000 RM'000
30 June 2015
On-Balance Sheet Exposures
Financial assets held-for-trading * 851,559 47,730 899,289
Financial investments available-for-sale * 641,927 157,025 798,952
Financial investments held-to-maturity 186,044 194,212 380,256
Derivatives financial assets 42,075 984 43,059
Loans and advances 325,983 - 325,983
Clients' and brokers' balances 188,838 - 188,838
Total On-Balance Sheet Exposures 2,236,426 399,951 2,636,377
Off-Balance Sheet Exposures
Credit-related exposures 12,500 - 12,500
Derivative financial instruments 173,643 2,063 175,706
186,143 2,063 188,206
Total On and Off-Balance Sheet
Exposures 2,422,569 402,014 2,824,583
* Excludes equity securities
The table below sets out the breakdown of gross credit exposures by geographical distribution as
follows:
Credit quality of loans and advances
A loan is defined as "past due" when the counterparty has failed to make a principal or interest payment
when contractually due. Late processing and other administrative delays on the side of the borrower can
lead to a financial asset being past due but not impaired. Therefore, loans advances and financing less
than 90 days past due are not usually considered impaired, unless other information is available to
indicate the contrary.
A loan or a group of loans is deems to be impaired if, and only if, there is objective evidence of
impairment as a result of one or more events that has occurred after the initial recognition of the asset (an
incurred 'loss event') and that loss event (or events) has an impact on the estimated future cash flows of
the financial asset or the group of financial assets that can be reliably estimated.
For description of approaches adopted by the Group and the Bank for the determination of individual and
collective assessment impairment allowances, refer to Note 2O(a) to the audited financial statements for
financial year ended 30 June 2015.
14

HONG LEONG INVESTMENT BANK BERHAD
Company no: 10209-W
(Incorporated in Malaysia)
BASEL II PILLAR 3 DISCLOSURES FOR THE FINANCIAL PERIOD ENDED 30 JUNE 2015
4. RISK MANAGEMENT (CONTINUED)
(A) Credit risk (continued)
Gross credit exposure (continued)
(i)
The Group and the Bank Malaysia
Other
countries Total
RM'000 RM'000 RM'000
30 June 2014
On-Balance Sheet Exposures
Financial assets held-for-trading * 826,127 33,777 859,904
Financial investments available-for-sale * 604,301 32,039 636,340
Financial investments held-to-maturity 212,793 145,620 358,413
Derivatives financial assets 40,514 437 40,951
Loans and advances 431,414 - 431,414
Clients' and brokers' balances 284,378 - 284,378
Total On-Balance Sheet Exposures 2,399,527 211,874 2,611,400
Off-Balance Sheet Exposures
Credit-related exposures 192,639 - 192,639
Derivative financial instruments 90,567 2,053 92,620
283,206 2,053 285,259
Total On and Off-Balance Sheet
Exposures 2,682,733 213,927 2,896,659
* Excludes equity securities
The table below sets out the breakdown of gross credit exposures by geographical distribution as
follows (continued):
15

HONG LEONG INVESTMENT BANK BERHAD
Company no: 10209-W
(Incorporated in Malaysia)
BASEL II PILLAR 3 DISCLOSURES FOR THE FINANCIAL PERIOD ENDED 30 JUNE 2015
4. RISK MANAGEMENT (CONTINUED)
(A) Credit risk (continued)
Gross credit exposure (continued)
(ii)
The Group and the Bank
Financial
assets held-
for-trading
Financial
investments
available-for-
sale
Financial
investments
held-to-
maturity
Derivative
financial
assets
Loans and
advances
Clients' and
brokers'
balances
On-balance
sheet total
Credit-
related
Exposures
Derivative
Financial
Instruments
Total off-
balance
sheet credit
risk
exposures
Total on and
off-balance
sheet credit
risk exposures
30 June 2015 RM'000 RM'000 RM'000 RM'000 RM'000 RM'000 RM'000 RM'000 RM'000 RM'000 RM'000
Agriculture - - - - - - - - - - -
Mining and quarrying - - - - - - - - - - -
Manufacturing - - - - - - - - - - -
Electricity, gas and water - 40,141 - - - - 40,141 - - - 40,141
Construction 87,611 - - - 25,284 - 112,895 7,000 - 7,000 119,895
Wholesale and retail - 5,048 - - - - 5,048 - - - 5,048
Transport, storage and
communications - - - - - - - - - - -
Finance, insurance, real estate
and business services 811,678 753,763 380,256 43,059 165,468 - 2,154,224 5,500 175,706 181,206 2,335,430
Government and government
agencies - - - - - - - - - - -
Household - - - - 134,048 - 134,048 - - - 134,048
Purchase of securities - - - - - 188,838 188,838 - - - 188,838
Others - - - - 1,183 - 1,183 - - - 1,183
899,289 798,952 380,256 43,059 325,983 188,838 2,636,377 12,500 175,706 188,206 2,824,583
The table below sets out the breakdown of gross credit exposures by sector as follows:
16

HONG LEONG INVESTMENT BANK BERHAD
Company no: 10209-W
(Incorporated in Malaysia)
BASEL II PILLAR 3 DISCLOSURES FOR THE FINANCIAL PERIOD ENDED 30 JUNE 2015
4. RISK MANAGEMENT (CONTINUED)
(A) Credit risk (continued)
Gross credit exposure (continued)
(ii)
The Group and the Bank
Financial
assets held-
for-trading
Financial
investments
available-for-
sale
Financial
investments
held-to-
maturity
Derivative
financial
assets
Loans and
advances
Clients' and
brokers'
balances
On-balance
sheet total
Credit-
related
Exposures
Derivative
Financial
Instruments
Total off-
balance
sheet credit
risk
exposures
Total on and
off-balance
sheet credit
risk exposures
30 June 2014 RM'000 RM'000 RM'000 RM'000 RM'000 RM'000 RM'000 RM'000 RM'000 RM'000 RM'000
Agriculture - 24,871 10,035 - - - 34,906 - - - 34,906
Mining and quarrying - - - - - - - - - - -
Manufacturing - - 5,055 - 30,005 - 35,060 - - - 35,060
Electricity, gas and water - - - - 27,480 - 27,480 70,000 - 70,000 97,480
Construction 35,218 15,128 - - 17,082 - 67,428 37,129 - 37,129 104,557
Wholesale and retail 19,419 29,938 15,261 - - - 64,618 - - - 64,618
Transport, storage and
communications - 12,394 - - - - 12,394 - - - 12,394
Finance, insurance, real estate -
and business services 779,861 384,098 251,229 40,951 120,515 - 1,576,654 85,499 92,620 178,119 1,754,773
Government and government
agencies - 169,911 76,833 - - - 246,744 - - - 246,744
Household - - - - 232,775 - 232,775 - - - 232,775
Purchase of securities - - - - - 284,378 284,378 - - - 284,378
Others 25,406 - - - 3,557 - 28,963 11 - 11 28,974
859,904 636,340 358,413 40,951 431,414 284,378 2,611,400 192,639 92,620 285,259 2,896,659
The table below sets out the breakdown of gross credit exposures by sector as follows:
17
HONG LEONG INVESTMENT BANK BERHAD
Company no: 10209-W
(Incorporated in Malaysia)
BASEL II PILLAR 3 DISCLOSURES FOR THE FINANCIAL PERIOD ENDED 30 JUNE 2015
4. RISK MANAGEMENT (CONTINUED)
(A) Credit risk (continued)
Gross credit exposure
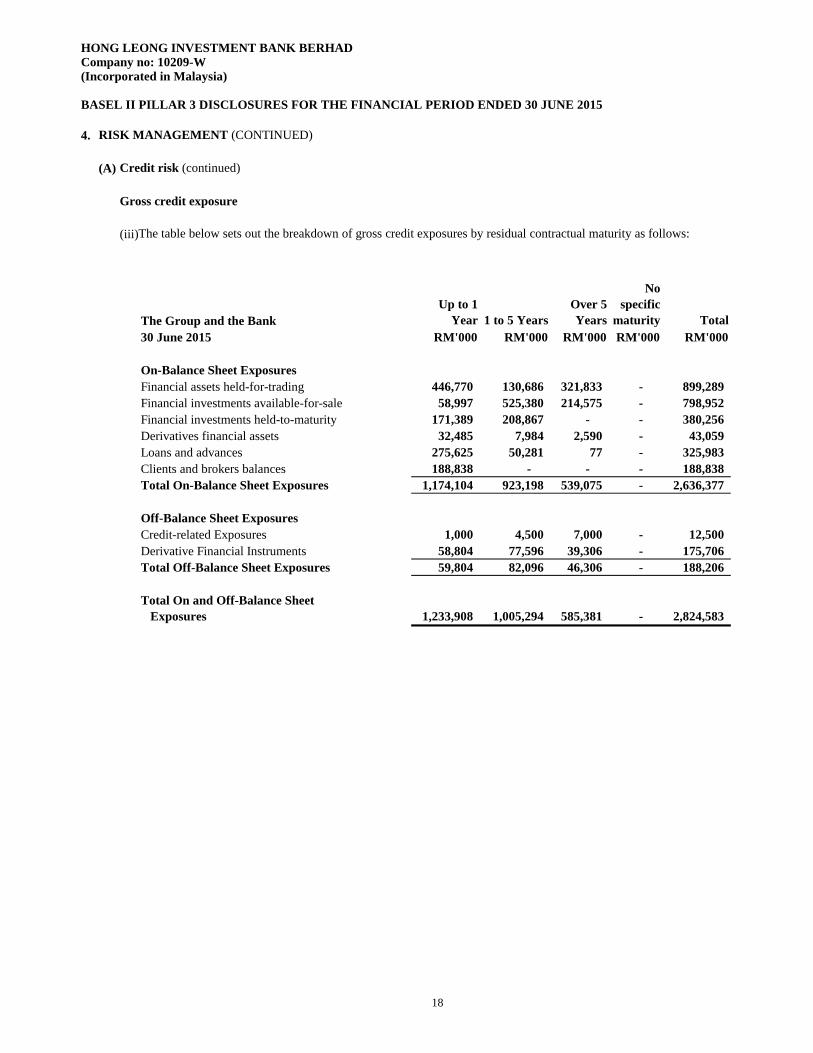
(iii)
The Group and the Bank
Up to 1
Year 1 to 5 Years
Over 5
Years
No
specific
maturity Total
30 June 2015 RM'000 RM'000 RM'000 RM'000 RM'000
On-Balance Sheet Exposures
Financial assets held-for-trading 446,770 130,686 321,833 - 899,289
Financial investments available-for-sale 58,997 525,380 214,575 - 798,952
Financial investments held-to-maturity 171,389 208,867 - - 380,256
Derivatives financial assets 32,485 7,984 2,590 - 43,059
Loans and advances 275,625 50,281 77 - 325,983
Clients and brokers balances 188,838 - - - 188,838
Total On-Balance Sheet Exposures 1,174,104 923,198 539,075 - 2,636,377
Off-Balance Sheet Exposures
Credit-related Exposures 1,000 4,500 7,000 - 12,500
Derivative Financial Instruments 58,804 77,596 39,306 - 175,706
Total Off-Balance Sheet Exposures 59,804 82,096 46,306 - 188,206
Total On and Off-Balance Sheet
Exposures 1,233,908 1,005,294 585,381 - 2,824,583
The table below sets out the breakdown of gross credit exposures by residual contractual maturity as follows:
18

HONG LEONG INVESTMENT BANK BERHAD
Company no: 10209-W
(Incorporated in Malaysia)
BASEL II PILLAR 3 DISCLOSURES FOR THE FINANCIAL PERIOD ENDED 30 JUNE 2015
4. RISK MANAGEMENT (CONTINUED)
(A) Credit risk (continued)
Gross credit exposure
(iii)
The Group and the Bank
Up to 1
Year 1 to 5 Years
Over 5
Years
No
specific
maturity Total
30 June 2014 RM'000 RM'000 RM'000 RM'000 RM'000
On-Balance Sheet Exposures
Financial assets held-for-trading 720,067 49,597 90,240 - 859,904
Financial investments available-for-sale 240,707 385,497 10,136 - 636,340
Financial investments held-to-maturity 76,906 281,507 - - 358,413
Derivatives financial assets 27,113 13,838 - - 40,951
Loans and advances 364,104 67,227 83 - 431,414
Clients and brokers balances 284,378 - - - 284,378
Total On-Balance Sheet Exposures 1,713,275 797,666 100,459 - 2,611,400
Off-Balance Sheet Exposures
Credit-related Exposures 104,583 4,931 83,125 - 192,639
Derivative Financial Instruments 33,180 59,440 - - 92,620
Total Off-Balance Sheet Exposures 137,763 64,371 83,125 - 285,259
Total On and Off-Balance Sheet
Exposures 1,851,038 862,037 183,584 - 2,896,659
The table below sets out the breakdown of gross credit exposures by residual contractual maturity as follows:
19

HONG LEONG INVESTMENT BANK BERHAD
Company no: 10209-W
(Incorporated in Malaysia)
BASEL II PILLAR 3 DISCLOSURES FOR THE FINANCIAL PERIOD ENDED 30 JUNE 2015
4. RISK MANAGEMENT (CONTINUED)
(A) Credit risk (continued)
Loans and advances
(i)
The Group and the Bank
Past due
loans and
advances
Impaired
Loans and
advances
Individual
assessment
allowance
Collective
assessment
allowance
Write-back of
individual
assessment
allowance
during the
year
Write offs
during the
year
30 June 2015 RM'000 RM'000 RM'000 RM'000 RM'000 RM'000
Agriculture - - - - - -
Electricity, gas and water - - - - - -
Mining and quarrying - - - - - -
Manufacturing - - - - - -
Construction - - - (87) - -
Finance, insurance, real estate and
business services - - - (599) - -
Household - - - - - -
Purchase of securities - - - (107) - -
Transport, storage and communications - - - - - -
Wholesale and retail - - - - - -
Others - 622 (111) (98) 83 -
Total - 622 (111) (891) 83 -
The table below sets out the breakdown by sector the amount of past due loans and advances, impaired loans and advances, individual assessment
allowance, collective assessment allowance, charges for individual assessment allowance during the financial year and write-offs during the
financial year as follows:
20

HONG LEONG INVESTMENT BANK BERHAD
Company no: 10209-W
(Incorporated in Malaysia)
BASEL II PILLAR 3 DISCLOSURES FOR THE FINANCIAL PERIOD ENDED 30 JUNE 2015
4. RISK MANAGEMENT (CONTINUED)
(A) Credit risk (continued)
Loans and advances
(i)
The Group and the Bank
Past due
loans and
advances
Impaired
Loans and
advances
Individual
assessment
allowance
Collective
assessment
allowance
Write-back of
individual
assessment
allowance
during the
year
Write offs
during the
year
30 June 2014 RM'000 RM'000 RM'000 RM'000 RM'000 RM'000
Agriculture - - - - - -
Electricity, gas and water - - - (24) - -
Mining and quarrying - - - - - -
Manufacturing - - - (82) - -
Construction - - - (63) - -
Finance, insurance, real estate and
business services - - - (398) - -
Household - - - - - -
Purchase of securities - - - (630) - -
Transport, storage and communications - - - - - -
Wholesale and retail - - - - - -
Others - 853 (194) (110) - -
Total - 853 (194) (1,307) - -
Note: Refer to Note 9 to the financial statement for financial year ended 30 June 2013 for "movement in individual assessment allowance and
collective assessment allowance" during the year for the Group and the Bank.
The table below sets out the breakdown by sector the amount of past due loans and advances, impaired loans and advances, individual assessment
allowance, collective assessment allowance, charges for individual assessment allowance during the financial year and write-offs during the
financial year as follows (continued):
21

HONG LEONG INVESTMENT BANK BERHAD
Company no: 10209-W
(Incorporated in Malaysia)
BASEL II PILLAR 3 DISCLOSURES FOR THE FINANCIAL PERIOD ENDED 30 JUNE 2015
4. RISK MANAGEMENT (CONTINUED)
(A) Credit risk (continued)
Loans and advances (continued)
(ii)
The Group and the Bank
Past due loans
and advances
Impaired
Loans and
advances
Individual
assessment
allowance
Collective
assessment
allowance
30 June 2015 RM'000 RM'000 RM'000 RM'000
Malaysia - 622 (111) (891)
The Group and the Bank
Past due loans
and advances
Impaired
Loans and
advances
Individual
assessment
allowance
Collective
assessment
allowance
30 Jun 2014 RM'000 RM'000 RM'000 RM'000
Malaysia - 853 (194) (1,307)
The table below sets out the breakdown by geographical areas the amount of past due loans and advances, impaired loans and advances, individual
assessment allowance and collective assessment allowance as follows:
22

HONG LEONG INVESTMENT BANK BERHAD
Company no: 10209-W
(Incorporated in Malaysia)
BASEL II PILLAR 3 DISCLOSURES FOR THE FINANCIAL PERIOD ENDED 30 JUNE 2015
4. RISK MANAGEMENT (CONTINUED)
(A) Credit risk (continued)
Credit risk exposure by risk weight
Risk Weights
Sovereigns/
Central
Banks
Public
Sector
Entities
Banks, DFIs
and MDBs
Insurance
Companies,
Securities
Firms & Fund
Managers Corporates
Residential
Mortgages
Other
Assets
Equity
Exposures
Total
Exposures after
Netting &
Credit Risk
Mitigation
Total Risk-
Weighted
Assets
RM'000 RM'000 RM'000 RM'000 RM'000 RM'000 RM'000 RM'000 RM'000 RM'000
The Group
30 June 2015
0% 645,153 - - - - - 187,277 - 832,430 -
20% - 6 543,444 - 408,315 - 878 - 952,643 190,529
50% - - 225,406 - 110,298 - - - 335,704 167,852
100% - - - - 263,710 625 25,239 245 289,819 289,819
150% - - - - 20,370 - - - 20,370 30,555
Total 645,153 6 768,850 - 802,693 625 213,394 245 2,430,966 678,755
Risk-Weighted Assets by Exposures - 1 221,392 - 431,077 625 25,415 245 678,755
Average Risk Weights 0.0% 16.7% 28.8% 0.0% 53.7% 100.0% 11.9% 100.0% 27.9%
Deduction from Capital Base - - - - - - - - -
The breakdown of credit risk exposures by risk weight is as follows:
23
HONG LEONG INVESTMENT BANK BERHAD
Company no: 10209-W
(Incorporated in Malaysia)
BASEL II PILLAR 3 DISCLOSURES FOR THE FINANCIAL PERIOD ENDED 30 JUNE 2015
4. RISK MANAGEMENT (CONTINUED)
(A) Credit risk (continued)
Credit risk exposure by risk weight (continued)
Risk Weights
Sovereigns/
Central
Banks
Public
Sector
Entities
Banks, DFIs
and MDBs
Insurance
Companies,
Securities
Firms & Fund
Managers Corporates
Residential
Mortgages
Other
Assets
Equity
Exposures
Total
Exposures after
Netting &
Credit Risk
Mitigation
Total Risk-
Weighted
Assets
RM'000 RM'000 RM'000 RM'000 RM'000 RM'000 RM'000 RM'000 RM'000 RM'000
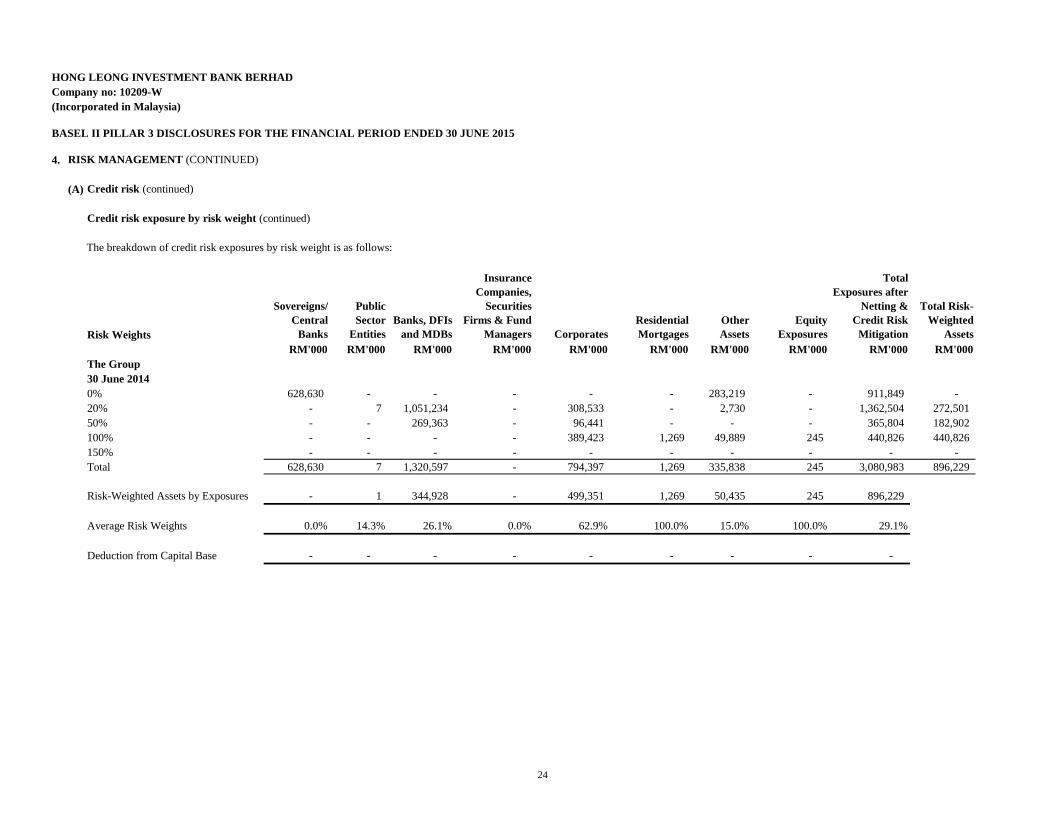
The Group
30 June 2014
0% 628,630 - - - - - 283,219 - 911,849 -
20% - 7 1,051,234 - 308,533 - 2,730 - 1,362,504 272,501
50% - - 269,363 - 96,441 - - - 365,804 182,902
100% - - - - 389,423 1,269 49,889 245 440,826 440,826
150% - - - - - - - - - -
Total 628,630 7 1,320,597 - 794,397 1,269 335,838 245 3,080,983 896,229
Risk-Weighted Assets by Exposures - 1 344,928 - 499,351 1,269 50,435 245 896,229
Average Risk Weights 0.0% 14.3% 26.1% 0.0% 62.9% 100.0% 15.0% 100.0% 29.1%
Deduction from Capital Base - - - - - - - - -
The breakdown of credit risk exposures by risk weight is as follows:
24

HONG LEONG INVESTMENT BANK BERHAD
Company no: 10209-W
(Incorporated in Malaysia)
BASEL II PILLAR 3 DISCLOSURES FOR THE FINANCIAL PERIOD ENDED 30 JUNE 2015
4. RISK MANAGEMENT (CONTINUED)
(A) Credit risk (continued)
Credit risk exposure by risk weight
Risk Weights
Sovereigns/
Central
Banks
Public
Sector
Entities
Banks, DFIs
and MDBs
Insurance
Companies,
Securities
Firms & Fund
Managers Corporates
Residential
Mortgages
Other
Assets
Equity
Exposures
Total
Exposures after
Netting &
Credit Risk
Mitigation
Total Risk-
Weighted
Assets
RM'000 RM'000 RM'000 RM'000 RM'000 RM'000 RM'000 RM'000 RM'000 RM'000
The Bank
30 June 2015
0% 645,153 - - - - - 187,277 - 832,430 -
20% - - 541,042 - 408,315 - 878 - 950,235 190,047
50% - - 225,406 - 110,298 - - - 335,704 167,852
100% - - - - 263,470 625 25,239 245 289,579 289,579
150% - - - - 20,370 - - - 20,370 30,555
Total 645,153 - 766,448 - 802,453 625 213,394 245 2,428,318 678,033
Risk-Weighted Assets by Exposures - - 220,911 - 430,837 625 25,415 245 678,033
Average Risk Weights 0.0% 0.0% 28.8% 0.0% 53.7% 100.0% 11.9% 100.0% 27.9%
Deduction from Capital Base - - - - - - - - -
The breakdown of credit risk exposures by risk weight is as follows:
25

HONG LEONG INVESTMENT BANK BERHAD
Company no: 10209-W
(Incorporated in Malaysia)
BASEL II PILLAR 3 DISCLOSURES FOR THE FINANCIAL PERIOD ENDED 30 JUNE 2015
4. RISK MANAGEMENT (CONTINUED)
(A) Credit risk (continued)
Credit risk exposure by risk weight
Risk Weights
Sovereigns/
Central
Banks
Public
Sector
Entities
Banks, DFIs
and MDBs
Insurance
Companies,
Securities
Firms & Fund
Managers Corporates
Residential
Mortgages
Other
Assets
Equity
Exposures
Total
Exposures after
Netting &
Credit Risk
Mitigation
Total Risk-
Weighted
Assets
RM'000 RM'000 RM'000 RM'000 RM'000 RM'000 RM'000 RM'000 RM'000 RM'000
The Bank
30 June 2014
0% 628,630 - - - - - 283,219 - 911,849 -
20% - - 1,050,533 - 308,533 - 2,730 - 1,361,796 272,359
50% - - 269,363 - 96,441 - - - 365,804 182,902
100% - - - - 389,423 1,269 49,889 245 440,826 440,826
150% - - - - - - - - - -
Total 628,630 - 1,319,896 - 794,397 1,269 335,838 245 3,080,275 896,087
Risk-Weighted Assets by Exposures - - 344,788 - 499,350 1,269 50,435 245 896,087
Average Risk Weights 0.0% 0.0% 26.1% 0.0% 62.9% 100.0% 15.0% 100.0% 29.1%
Deduction from Capital Base - - - - - - - - -
The breakdown of credit risk exposures by risk weight is as follows:
26

HONG LEONG INVESTMENT BANK BERHAD
Company no: 10209-W
(Incorporated in Malaysia)
BASEL II PILLAR 3 DISCLOSURES FOR THE FINANCIAL PERIOD ENDED 30 JUNE 2015
4. RISK MANAGEMENT (CONTINUED)
(A) Credit risk (continued)
Rated exposures according to ratings by External Credit Assessment Institutions ("ECAIs")
Under Basel II, credit risk for the Group is computed using the Standardised Approach.
External credit assessments (or external ratings) on the customer (the issuer) or specific securities issued
by the issuer (the issue) form as a basis for the determination of risk weights under the Standardised
Approach for exposures to sovereigns, central banks, public sector entities, banking institutions,
corporates as well as certain other specific portfolios.
The approved External Credit Assessment Institutions (“ECAI”) ratings and the prescribed risk weights
on the above stated asset classes are used in the computation of regulatory capital. An exposure would be
deemed to have an external rating if the issuer or the issue has a rating provided by an ECAI. In cases
where an exposure does not have an issuer or issue rating, the exposure shall be deemed unrated and
shall be accorded a risk weight appropriate for unrated exposures in their respective exposure category.
The ECAI used by the Group are Fitch Ratings ("Fitch"), Moody’s Investors Service ("Moody's"),
Standard & Poor’s ("S&P"), Malaysia Rating Corporation Berhad ("MARC") and Rating Agency
Malaysia ("RAM"). ECAI ratings are mapped to a common credit quality grade as prescribed by BNM.
27

HONG LEONG INVESTMENT BANK BERHAD
Company no: 10209-W
(Incorporated in Malaysia)
BASEL II PILLAR 3 DISCLOSURES FOR THE FINANCIAL PERIOD ENDED 30 JUNE 2015
4. RISK MANAGEMENT (CONTINUED)
(A) Credit risk (continued)
Rated exposures according to ratings by External Credit Assessment Institutions ("ECAIs")
(i)
Moodys Aaa to Aa3 A1 to A3 Baa1 to Ba3 B1 to C Unrated
S&P AAA to AA- A+ to A- BBB+ to BB- B+ to D Unrated
Fitch AAA to AA- A+ to A- BBB+ to BB- B+ to D Unrated
RAM AAA to AA3 A1 to A3 BBB1 to BB3 B to D Unrated
MARC AAA to AA- A+ to A- BBB+ to BB- B+ to D Unrated
The Group and the Bank
Rating &
Investment Inc AAA to AA- A+ to A- BBB+ to BB- B+ to D Unrated
RM'000 RM'000 RM'000 RM'000 RM'000
30 June 2015
On and Off-Balance Sheet Exposures
Public Sector Entities - - - - 6
Insurance Cos, Securities Firms & Fund Managers - - - - -
Corporates 401,316 110,298 97,267 20,370 173,202
401,316 110,298 97,267 20,370 173,208
30 June 2014
On and Off-Balance Sheet Exposures
Public Sector Entities - - - - 7
Insurance Cos, Securities Firms & Fund Managers - - - - -
Corporates 287,910 96,438 71,532 124 338,393
287,910 96,438 71,532 124 338,400
The following tables summarise the rated exposures according to ratings ECAIs as follows:
Ratings of Corporate by Approved ECAIs
28

HONG LEONG INVESTMENT BANK BERHAD
Company no: 10209-W
(Incorporated in Malaysia)
BASEL II PILLAR 3 DISCLOSURES FOR THE FINANCIAL PERIOD ENDED 30 JUNE 2015
4. RISK MANAGEMENT (CONTINUED)
(A) Credit risk (continued)
Rated exposures according to ratings by External Credit Assessment Institutions ("ECAIs") (continued)
(ii)
Moodys P-1 P-2 P-3 Others Unrated
S&P A-1 A-2 A-3 Others Unrated
Fitch F1+, F1 F2 F3 B to D Unrated
RAM P-1 P-2 P-3 NP Unrated
MARC MARC-1 MARC-2 MARC-3 MARC-4 Unrated
The Group and the Bank
Rating &
Investment Inc a-1+, a-1 a-2 a-3 b, c Unrated
RM'000 RM'000 RM'000 RM'000 RM'000
30 June 2015
On and Off-Balance Sheet Exposures
Banks, MDBs and FDIs 376,960 - - - 10
30 June 2014
On and Off-Balance Sheet Exposures
Banks, MDBs and FDIs 1,007,606 - - - -
Short term Ratings of Banking Institutions and Corporate by Approved ECAIs
29

HONG LEONG INVESTMENT BANK BERHAD
Company no: 10209-W
(Incorporated in Malaysia)
BASEL II PILLAR 3 DISCLOSURES FOR THE FINANCIAL PERIOD ENDED 30 JUNE 2015
4. RISK MANAGEMENT (CONTINUED)
(A) Credit risk (continued)
Rated exposures according to ratings by External Credit Assessment Institutions ("ECAIs") (continued)
(iii)
Moodys Aaa to Aa3 A1 to A3 Baa1 to Baa3 Ba1 to B3 Caa1 to C Unrated
S&P AAA to AA- A+ to A- BBB+ to BBB- BB+ to B- CCC+ to D Unrated
Fitch AAA to AA- A+ to A- BBB+ to BBB- BB+ to B- CCC+ to D Unrated
The Group and the Bank
Rating &
Investment Inc AAA to AA- A+ to A- BBB+ to BBB- BB+ to B- CCC+ to C Unrated
RM'000 RM'000 RM'000 RM'000 RM'000 RM'000
30 June 2015
On and Off-Balance Sheet Exposures
Sovereigns and Central Banks - - - - - 645,153
30 June 2014
On and Off-Balance Sheet Exposures
Sovereigns and Central Banks - - - - - 628,630
Ratings of Sovereigns and Central Banks by Approved ECAIs
30

HONG LEONG INVESTMENT BANK BERHAD
Company no: 10209-W
(Incorporated in Malaysia)
BASEL II PILLAR 3 DISCLOSURES FOR THE FINANCIAL PERIOD ENDED 30 JUNE 2015
4. RISK MANAGEMENT (CONTINUED)
(A) Credit risk (continued)
Rated exposures according to ratings by External Credit Assessment Institutions ("ECAIs") (continued)
(iv)
Moodys Aaa to Aa3 A1 to A3 Baa1 to Baa3 Ba1 to B3 Caa1 to C Unrated
S&P AAA to AA- A+ to A- BBB+ to BBB- BB+ to B- CCC+ to D Unrated
Fitch AAA to AA- A+ to A- BBB+ to BBB- BB+ to B- CCC+ to D Unrated
RAM AAA to AA3 A1 to A3 BBB+ to BBB3 BB1 to B3 C1 to D Unrated
MARC AAA to AA- A+ to A- BBB+ to BBB- BB+ to B- C+ to D Unrated
The Group and the Bank
Rating &
Investment Inc AAA to AA- A+ to A- BBB+ to BBB- BB+ to B- CCC+ to C Unrated
RM'000 RM'000 RM'000 RM'000 RM'000 RM'000
30 June 2015
On and Off-Balance Sheet Exposures
Banks, MDBs and FDIs 166,480 23,926 201,473 - - -
30 June 2014
On and Off-Balance Sheet Exposures
Banks, MDBs and FDIs 162,100 51,540 99,351 - - -
Ratings of Banking Institutions by Approved ECAIs
31

HONG LEONG INVESTMENT BANK BERHAD
Company no: 10209-W
(Incorporated in Malaysia)
BASEL II PILLAR 3 DISCLOSURES FOR THE FINANCIAL PERIOD ENDED 30 JUNE 2015
4. RISK MANAGEMENT (CONTINUED)
(A) Credit risk (continued)
Credit Risk Mitigation ("CRM")
The Group
Exposures
before CRM
Exposures
covered by
eligible
financial
collateral
Exposures
before CRM
Exposures
covered by
eligible
financial
collateral
RM'000 RM'000 RM'000 RM'000
On-Balance Sheet Exposures
Sovereigns/Central Banks 645,153 - 628,630 -
Public Sector Entities 6 - 7 -
Banks, DFIs and MDBs 607,963 - 1,233,617 -
Insurance Companies, Securities Firms &
Fund Managers - - - -
Corporates 960,351 178,328 887,514 291,384
Residential Mortgages 625 - 1,258 -
Other Assets 213,394 - 335,838 -
Equity Exposures 245 - 245 -
Total On-Balance Sheet Exposures 2,427,737 178,328 3,087,109 291,384
Off-Balance Sheet Exposures
Credit-related Exposures 10,250 - 192,639 -
Derivative Financial Instruments 171,308 - 92,620 -
Other Treasury-related Exposures - - - -
Total Off-Balance Sheet Exposures 181,558 - 285,259 -
Total On and Off-Balance Sheet
Exposures 2,609,295 178,328 3,372,368 291,384
30 June 2015 30 June 2014
The following tables resent the credit exposures covered by eligible financial collateral and financial
guarantees as defined under the Standardised Approach for the Group. Eligible financial collateral consists
primarily of securities from listed exchange. The Group does not have any credit exposure which is
reduced through the application of other eligible collateral.
The Group's and the Bank’s credit principle is principally granting credit facilities on the basis of the
borrower’s credit standing, repayment and debt servicing ability. Where possible, collateral is taken to
mitigate and reduce any credit risk for the particular credit facility extended. The value of the collateral is
monitored periodically and where applicable, a revised valuation may be requested from the borrower.
The main types of collateral accepted are cash, marketable securities and securities from listed exchange.
There are policies and processes in place to monitor collateral concentration. For credit risk mitigation
("CRM") purposes, only collateral or guarantees that are legally enforceable are taken into account. The
credit exposures are computed on a net basis only when there is a legally enforceable netting arrangements
for loans and deposits. The Group and the Bank use the Comprehensive Approach for computation of the
adjusted exposures.
32

HONG LEONG INVESTMENT BANK BERHAD
Company no: 10209-W
(Incorporated in Malaysia)
BASEL II PILLAR 3 DISCLOSURES FOR THE FINANCIAL PERIOD ENDED 30 JUNE 2015
4. RISK MANAGEMENT (CONTINUED)
(A) Credit risk (continued)
Credit Risk Mitigation (continued)
The Bank
Exposures
before CRM
Exposures
covered by
eligible
financial
collateral
Exposures
before CRM
Exposures
covered by
eligible
financial
collateral
RM'000 RM'000 RM'000 RM'000
On-Balance Sheet Exposures
Sovereigns/Central Banks 645,153 - 628,630 -
Public Sector Entities - - - -
Banks, DFIs and MDBs 605,560 - 1,232,915 -
Insurance Companies, Securities Firms &
Fund Managers - - - -
Corporates 960,111 178,328 887,514 291,384
Residential Mortgages 625 - 1,258 -
Other Assets 213,394 - 335,838 -
Equity Exposures 245 - 245 -
Total On-Balance Sheet Exposures 2,425,088 178,328 3,086,400 291,384
Off-Balance Sheet Exposures
Credit-related Exposures 10,250 - 192,639 -
Derivative Financial Instruments 171,308 - 92,620 -
Total Off-Balance Sheet Exposures 181,558 - 285,259 -
Total On and Off-Balance Sheet
Exposures 2,606,646 178,328 3,371,659 291,384
30 June 2015 30 June 2014
The following tables resent the credit exposures covered by eligible financial collateral and financial
guarantees as defined under the Standardised Approach for the Group. Eligible financial collateral consists
primarily of securities from listed exchange. The Group does not have any credit exposure which is
reduced through the application of other eligible collateral.
33

HONG LEONG INVESTMENT BANK BERHAD
Company no: 10209-W
(Incorporated in Malaysia)
BASEL II PILLAR 3 DISCLOSURES FOR THE FINANCIAL PERIOD ENDED 30 JUNE 2015
4. RISK MANAGEMENT (CONTINUED)
(A) Credit risk (continued)
Off-Balance Sheet exposures and counterparty credit risk
Credit limits are established to ensure that the Group and the Bank are not duly exposed to unnecessary credit
risk with parties who are unable to meet or honour their financial obligations with the Group and the Bank.
The counterparty limits for the Group and the Bank are established by taking into consideration the tenor of the
obligation, rating assignment of the counterparty, counterparty’s shareholder’s funds, the Group's and the
Bank’s shareholder’s funds.
The credit exposure limit for derivative transactions is calculated based on the standardised approach by
applying a specific percentage of risk factor i.e. the potential loss of the contract value to the counterparty limit
for the Group and the Bank, which in general is a fraction of the derivative contract or notional amount used to
express the volume of instruments.
Nature of commitments and contingencies
Obligations under underwriting agreements arise from underwriting agreements relating to the issuance of
equity and debts securities, where the Group and the Bank are obliged to subscribe for or purchase the
securities in the event the securities are not taken up when issued.
Irrevocable commitments to extend credit include all obligations on the part of the Group and the Bank to
provide funding facilities or the undrawn portion of an approved credit facilities to customers.
Forward foreign exchange contracts are agreements to buy or sell fixed amounts of currency at agreed rates of
exchange on a specified future date.
Interest rate swaps involve the exchange of interest obligations with a counterparty for a specified period
without the exchange of the underlying principal.
34

HONG LEONG INVESTMENT BANK BERHAD
Company no: 10209-W
(Incorporated in Malaysia)
BASEL II PILLAR 3 DISCLOSURES FOR THE FINANCIAL PERIOD ENDED 30 JUNE 2015
4. RISK MANAGEMENT (CONTINUED)
(A) Credit risk (continued)
Off-Balance Sheet exposures and counterparty credit risk (continued)
The Group and the Bank
Principal
Amount
Positive Fair
Value of
Derivative
Contracts
Credit
Equivalent
Amount
Risk-
Weighted
Assets
RM'000 RM'000 RM'000 RM'000
30 June 2015
Derivative financial instruments
Interest rate related contracts:
- One year or less 1,555,070 3,115 7,448 1,490
- Over one year to five years 2,617,698 4,887 69,096 17,767
- Over five years 525,000 2,590 39,306 7,861
Foreign exchange related contracts
- One year or less 1,971,194 29,370 51,356 12,898
Equity related contracts:
- One year or less - - - -
- Over one year to five years 8,500 3,097 4,102 4,102
6,677,462 43,059 171,308 44,118
Commitments
Direct Credit Substitutes 8,000 - 8,000 2,400
Obligations under underwriting agreement - - - -
Other commitments, such as formal standby
facilities and credit lines
- maturity less than one year 1,781 - 890 890
- maturity more than one year 2,719 - 1,360 1,360
Any commitment that are unconditionally
cancelled at any time by the Bank
without prior notice
- maturity less than one year 722,877 - - -
735,377 - 10,250 4,650
Total Off-Balance Sheet Exposures 7,412,839 43,059 181,558 48,768
The off-balance sheet exposures and their related counterparty credit risk of the Group and the Bank are as
follows:
35

HONG LEONG INVESTMENT BANK BERHAD
Company no: 10209-W
(Incorporated in Malaysia)
BASEL II PILLAR 3 DISCLOSURES FOR THE FINANCIAL PERIOD ENDED 30 JUNE 2015
4. RISK MANAGEMENT (CONTINUED)
(A) Credit risk (continued)
Off-Balance Sheet exposures and counterparty credit risk (continued)
The Group and the Bank
Principal
Amount
Positive Fair
Value of
Derivative
Contracts
Credit
Equivalent
Amount
Risk-
Weighted
Assets
RM'000 RM'000 RM'000 RM'000
30 June 2014
Derivative financial instruments
Interest rate related contracts:
- One year or less 724,036 466 2,353 471
- Over one year to five years 2,246,000 9,987 59,441 15,704
- Over five years - - - -
Foreign exchange related contracts
- One year or less 1,537,568 9,238 30,827 6,861
Equity related contracts:
- One year or less 1,429 17,410 17,495 17,495
- Over one year to five years 11,500 3,850 4,931 4,931
4,520,533 40,951 115,047 45,462
Commitments
Direct Credit Substitutes 20,625 - 20,625 4,126
Obligations under underwriting agreement 299,154 - 149,576 149,576
Other commitments, such as formal standby
facilities and credit lines
- maturity less than one year 23 - 11 11
- maturity more than one year - - - -
Any commitment that are unconditionally
cancelled at any time by the Bank
without prior notice
- maturity less than one year 627,233 - - -
947,035 - 170,212 153,713
Total Off-Balance Sheet Exposures 5,467,568 40,951 285,259 199,175
The off-balance sheet exposures and their related counterparty credit risk of the Group and the Bank are as
follows (continued):
36

HONG LEONG INVESTMENT BANK BERHAD
Company no: 10209-W
(Incorporated in Malaysia)
BASEL II PILLAR 3 DISCLOSURES FOR THE FINANCIAL PERIOD ENDED 30 JUNE 2015
4. RISK MANAGEMENT (CONTINUED)
(B) Market risk
Market Risk Management Process
(i) Identification
•
•
(ii) Assessment/Measurement
• Sensitivity.
• Value-at-Risk.
• Stress test.
Market risk is defined as the risk of potential losses in earnings arising from changes in interest rates,
foreign exchange rates, credit spreads, equity prices and commodity prices. This change can affect the
value of financial instruments and may also affect proprietary trading revenues.
The main objectives of Market Risk Management is to ensure that losses from market risk can be
promptly addressed without incurring a potential loss that is beyond the Group’s and the Bank risk
appetite.
Management of market risk
The ALMCO is the management level committee which supports the BARMC in the oversight of
market and liquidity risk. The ALMCO is chaired by the Chief Executive Officer ("CEO") and includes
senior representatives from both business and support units. It is primarily responsible for the
development, implementation and review of frameworks, broad strategies and policies for managing
the Group’s and the Bank's balance sheet, funding management, market risk and liquidity risk.
The Risk Management Department is responsible for the development, implementation and
maintenance of consistent policies and methodologies to identify, measure, monitor, control and report
market risk and liquidity risk.
Market risk is inherent in the ordinary course of the Group’s and the Bank's business and is prevalent
especially in treasury activities of the Group and the Bank. The Group and the Bank broadly classify
their financial instruments as Held-for-Trading ("HFT"), Available-for-Sale ("AFS") and Held-to-
Maturity ("HTM") securities. The major differences between the classifications are the accounting
treatment and intention of acquiring the financial instruments.
Identify market risks within existing and new products. Review market-related information e.g. market trends, economic data.
37

HONG LEONG INVESTMENT BANK BERHAD
Company no: 10209-W
(Incorporated in Malaysia)
BASEL II PILLAR 3 DISCLOSURES FOR THE FINANCIAL PERIOD ENDED 30 JUNE 2015
4. RISK MANAGEMENT (CONTINUED)
(B) Market risk (continued)
Market Risk Management Process (continued)
(iii) Control/Mitigation
• Establish market risk limits.
•
(iv) Monitoring/Review
• Monitoring of limits.
• Periodical review and reporting.
Regulatory Capital Requirements
The Group and the Bank
Long
Position
Short
Position
Risk-
Weighted
Assets
Minimum
Capital
Requirement
at 8%
RM'000 RM'000 RM'000 RM'000
30 June 2015
Interest Rate Risk 7,587,122 6,672,989 431,166 34,493
Equity Risk 21,759 43,640 3,491
Foreign Currency Risk 729 4,635 4,635 371
Option Risk 3,097 4,273 342
7,612,707 6,677,624 483,713 38,697
30 June 2014
Interest Rate Risk 5,337,113 4,462,345 262,369 20,989
Equity Risk 8,360 - 16,725 1,338
Foreign Currency Risk 16,430 16,276 16,000 1,280
Option Risk 195,414 - 276,475 22,117
5,557,317 4,478,621 571,570 45,724
Limits are set with reference to business profitability, budgets and aligned with the risk
appetite approved by the Board.
The following tables present the minimum regulatory capital requirement on market risk.
38

HONG LEONG INVESTMENT BANK BERHAD
Company no: 10209-W
(Incorporated in Malaysia)
BASEL II PILLAR 3 DISCLOSURES FOR THE FINANCIAL PERIOD ENDED 30 JUNE 2015
4. RISK MANAGEMENT (CONTINUED)
(C) Operational risk
Operational risk is the risk of loss resulting from inadequate or failed internal processes, people and
systems or from external events. This definition includes legal risk, but excludes strategic and
reputational risks.
An Operational Risk Management Framework, approved by the HLIBB's Board, has been implemented
across the Group to all business and support units. The Framework consists of operational risk’s tools
including loss event data reporting, control self-assessment and key risk indicators, to assist these units
to identify, assess, monitor and control their operational risks. The information is channeled to the Risk
Management Department to facilitate risk analysis, monitoring and reporting.
Related policies and procedures are in place to provide guidance to risk taking units in the areas of
developing new products and services and outsourcing of operational functions.
A Business Continuity Framework has been developed to ensure business sustainability in event of
business disruptions.
The Risk Management Department oversees the Group’s operational risk management infrastructure,
including the Framework, policies, processes, information, methodologies and systems. The Risk
Management Department performs regular reviews of the operational risk profiles of the Group, and
recommends related operational risk policies to be endorsed and approved at management and Board
level.
39

HONG LEONG INVESTMENT BANK BERHAD
Company no: 10209-W
(Incorporated in Malaysia)
BASEL II PILLAR 3 DISCLOSURES FOR THE FINANCIAL PERIOD ENDED 30 JUNE 2015
5. EQUITY EXPOSURES IN BANKING BOOK
The Group and the Bank
Exposures
subject to
risk-
weighting
Risk
weights
Exposures
subject to risk-
weighting
Risk
weights
RM'000 % RM'000 %
Financial investments available-for-sale
Unquoted equity securities 245 100 245 100
Gain and Loss on Equity Exposures in Banking Book
30 June 2015
30 June
2014
RM'000 RM'000
Realised gains/losses recognised in the income statements - -
Unrealised gain recognised in revaluation reserve
- Unquoted equity securities - -
30 June 2015 30 June 2014
The following table summarises the Group and the Bank's equity exposures in the banking book.
The tables below present the gains and losses on equity exposure in the banking book.
The Group's and the Bank's banking book's equity investments consist of equity holdings in organisations
which are set up for specific socio-economic reasons (i.e. equity interest in Cagamas, MEPS, RAM, IBBM
and CGC) and equity holdings and equity instruments received as a result of loan/financing restructuring or
loan/financing conversion.
The Group's and the Bank's banking book's equity investments are classified and measured in accordance
with FRS 139 and are categorised as financial investments available-for-sale. Refer to Note 2D to the audited
financial statements for financial year ended 30 June 2015 for the accounting policies of the Group and the
Bank.
40

HONG LEONG INVESTMENT BANK BERHAD
Company no: 10209-W
(Incorporated in Malaysia)
BASEL II PILLAR 3 DISCLOSURES FOR THE FINANCIAL PERIOD ENDED 30 JUNE 2015
6. INTEREST RATE RISK/RATE OF RETURN RISK IN BANKING BOOK
- 100 bps + 100 bps - 100 bps + 100 bps
Type of currency
RM'000 RM'000 RM'000 RM'000
Ringgit Malaysia 24,237 (24,237) 17,880 (17,880)
US Dollar 7,639 (7,639) 3,834 (3,834)
31,876 (31,876) 21,714 (21,714)
Increase/(Decrease) in
Economic Value
Increase/(Decrease) in
Economic Value
Impact on Position as at
30 June 2014
Impact on Position as at
30 June 2015
The following tables present the projected Group's sensitivity to a 100 basis point parallel shock to interest
rates across all maturities applied on the Group's interest sensitivity gap as at reporting date.
To evaluate the potential impact of interest/profit rate risk in the Banking Book, the Group and the Bank
consider the effect on their underlying economic value.
The economic perspective provides a measurement of the underlying value of the Group's and the Bank's
current position and seeks to evaluate the sensitivity of that value to changes in interest/profit rates. This
perspective will allow the Group and the Bank to evaluate the changes in economic value of assets,
liabilities, and off-balance sheet instruments against the movement in interest/profit rate. The economic
values of these instruments are equivalent to the instruments' present value of future cash flows.
By analyzing the impact of interest/profit rate changes on the value of all future cash flows, the economic
perspective can provide a more comprehensive measurement of interest/profit rate risk. The future cash
flow projections used to estimate the economic exposure provides a pro forma estimate of the future
income generated by its current position. In general, the measurement of present value of the instrument
will be able to give an overview of the Group's and the Bank's economic value of equity (“EVE”) over a
longer time period.
The increase or decline in economic value for upward and downward rate shocks which are consistent with
shocks applied in the Group's and the Bank's stress test for measuring IRR/RORR in the banking book are
as follows:
41