hopewell regional alternative 4a-1 light phase 2 … of subsurface exploration ... hopewell regional...
TRANSCRIPT

REPORT OF SUBSURFACE EXPLORATION AND
GEOTECHNICAL ENGINEERING SERVICES
Hopewell Regional Alternative 4A-1 Light Phase 2 PER (Primary Site)
Hopewell, Virginia
G E T Project No: WM13-136G October 15, 2013
Prepared for:
HDR Engineering, Inc. 5700 Lake Wright Drive Twin Oaks 1, Suite 300 Norfolk, Virginia 23502
1592-E Penniman Road, Williamsburg, VA 23185
Phone 757-564-6452 ♦ Fax 757-564-6453 ♦ www.getsolutionsinc.com

October 15, 2013Rev 10/23/2013
TO: HDR Engineering, Inc.5700 Lake Wright Drive, Suite 300Norfolk, VA 23502
Attn: Mr. William S. M’Coy, P.E.
RE: Report of Subsurface Exploration and Geotechnical Engineering ServicesHopewell Regional Alternative 4A-1 Light Phase 2 PER (Primary Site)Hopewell, VirginiaG E T Project No: WM13-136G
Dear Mr. M’Coy:
In compliance with your instructions, we have completed our Subsurface Exploration andGeotechnical Engineering Services for the above referenced project. The results of thisstudy, together with our recommendations, are presented in this report.
Often, because of design and construction details that occur on a project, questions ariseconcerning subsurface conditions. G E T Solutions, Inc. would be pleased to continue itsrole as Geotechnical Engineer during the project implementation.
Thank you for the opportunity to work with you on this project. We trust that the informationcontained herein meets your immediate need, and should you have any questions or if wecould be of further assistance, please do not hesitate to contact us.
Respectfully Submitted,G E T Solutions, Inc.
Joseph R. Robinson, P.E.Project EngineerVA Lic. #050157
Bruce R. Spiro, P.E.Principal EngineerVA Lic. # 015791
Copies: (1) Client
1592-E Penniman Road · Williamsburg, VA 23185 · Phone: (757)-564-6452 · Fax: (757)[email protected]
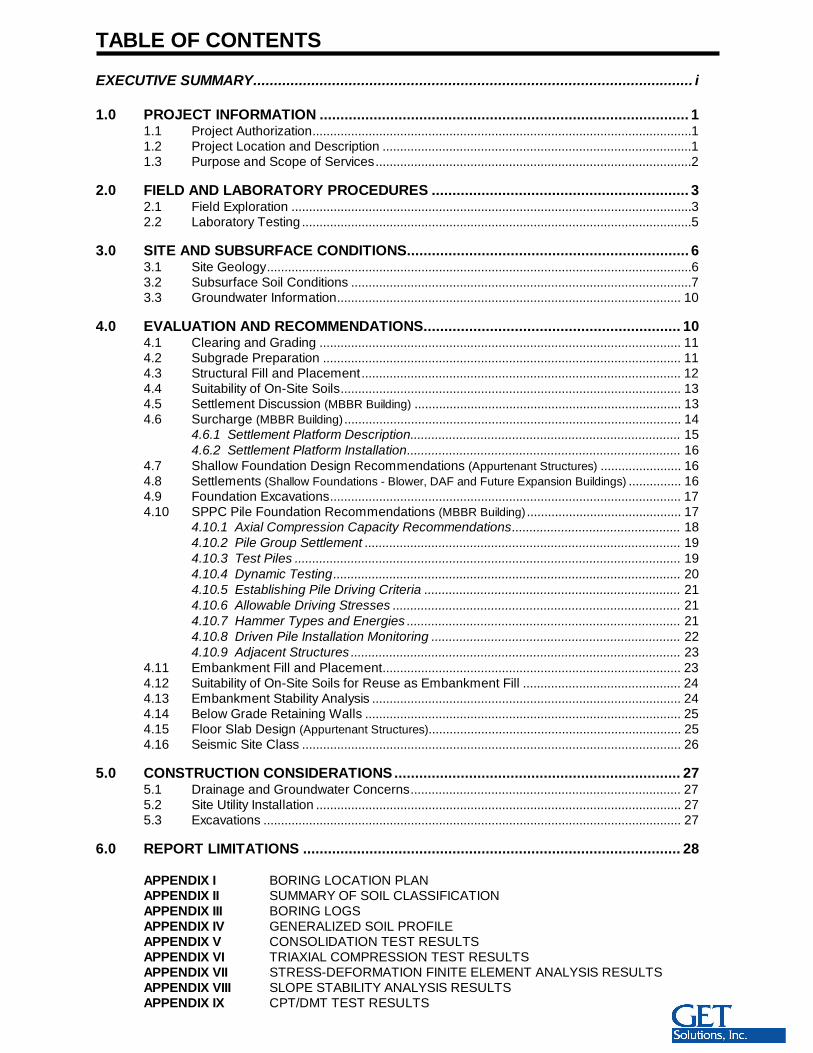
TABLE OF CONTENTS
EXECUTIVE SUMMARY.......................................................................................................... i
1.0 PROJECT INFORMATION ......................................................................................... 11.1 Project Authorization............................................................................................................11.2 Project Location and Description ........................................................................................11.3 Purpose and Scope of Services..........................................................................................2
2.0 FIELD AND LABORATORY PROCEDURES .............................................................. 32.1 Field Exploration ..................................................................................................................32.2 Laboratory Testing ...............................................................................................................5
3.0 SITE AND SUBSURFACE CONDITIONS.................................................................... 63.1 Site Geology.........................................................................................................................63.2 Subsurface Soil Conditions .................................................................................................73.3 Groundwater Information.................................................................................................. 10
4.0 EVALUATION AND RECOMMENDATIONS.............................................................. 104.1 Clearing and Grading ....................................................................................................... 114.2 Subgrade Preparation ...................................................................................................... 114.3 Structural Fill and Placement........................................................................................... 124.4 Suitability of On-Site Soils................................................................................................. 134.5 Settlement Discussion (MBBR Building) ............................................................................ 134.6 Surcharge (MBBR Building) ................................................................................................ 14
4.6.1 Settlement Platform Description............................................................................. 154.6.2 Settlement Platform Installation.............................................................................. 16
4.7 Shallow Foundation Design Recommendations (Appurtenant Structures) ....................... 164.8 Settlements (Shallow Foundations - Blower, DAF and Future Expansion Buildings) ............... 164.9 Foundation Excavations.................................................................................................... 174.10 SPPC Pile Foundation Recommendations (MBBR Building) ............................................ 17
4.10.1 Axial Compression Capacity Recommendations................................................ 184.10.2 Pile Group Settlement .......................................................................................... 194.10.3 Test Piles .............................................................................................................. 194.10.4 Dynamic Testing................................................................................................... 204.10.5 Establishing Pile Driving Criteria ......................................................................... 214.10.6 Allowable Driving Stresses .................................................................................. 214.10.7 Hammer Types and Energies .............................................................................. 214.10.8 Driven Pile Installation Monitoring ....................................................................... 224.10.9 Adjacent Structures .............................................................................................. 23
4.11 Embankment Fill and Placement..................................................................................... 234.12 Suitability of On-Site Soils for Reuse as Embankment Fill ............................................. 244.13 Embankment Stability Analysis ........................................................................................ 244.14 Below Grade Retaining Walls .......................................................................................... 254.15 Floor Slab Design (Appurtenant Structures)........................................................................ 254.16 Seismic Site Class ............................................................................................................ 26
5.0 CONSTRUCTION CONSIDERATIONS..................................................................... 275.1 Drainage and Groundwater Concerns............................................................................. 275.2 Site Utility Installation ........................................................................................................ 275.3 Excavations ....................................................................................................................... 27
6.0 REPORT LIMITATIONS ........................................................................................... 28
APPENDIX I BORING LOCATION PLANAPPENDIX II SUMMARY OF SOIL CLASSIFICATIONAPPENDIX III BORING LOGSAPPENDIX IV GENERALIZED SOIL PROFILEAPPENDIX V CONSOLIDATION TEST RESULTSAPPENDIX VI TRIAXIAL COMPRESSION TEST RESULTSAPPENDIX VII STRESS-DEFORMATION FINITE ELEMENT ANALYSIS RESULTSAPPENDIX VIII SLOPE STABILITY ANALYSIS RESULTSAPPENDIX IX CPT/DMT TEST RESULTS

Report of Subsurface Exploration and Geotechnical Engineering Services October 15, 2013Hopewell Regional Alternative 4A-1 Light Phase 2 PER (Primary Site) rev 10/23/2013Hopewell, VirginiaG E T Project No: WM13-136G
i
EXECUTIVE SUMMARY
The project site is located at the Hopewell Wastewater Treatment plant which is situatedeast of Hummel Ross Road and southwest of the James River in the City of Hopewell,Virginia. The construction at this site is expected to consist of expanding the existingwastewater treatment facility to include a MBBR system which will consist of the MBBRBuilding and associated support structures. The construction at this site is alsoexpected to include the construction of new utility alignments along with otherassociated infrastructure components.
Our field exploration program included seven (7) 25 to 65-foot deep StandardPenetration Test (SPT) borings drilled by G E T Solutions, Inc. within the footprint ofthe proposed structures. In addition, two (2) 45 to 55-foot deep Cone Penetration Test(CPT) soundings and two (2) 45 to 55-foot deep Dilatometer soundings were performedwithin the footprint of the proposed MBBR structure. In depth descriptions of the naturalsubsurface soil conditions encountered at this site are included in Section 3.2 in thebody of the report.
The initial groundwater table was measured to occur at depths ranging from 13 to 23feet below current grades (2 to 13 feet MSL) at the boring locations. The discrepancybetween the measured groundwater elevations is likely the result of varying siteelevations at the boring locations, and potential perched conditions.
The following evaluations and recommendations were developed based on our fieldexploration and laboratory-testing program:
§ Field testing program during construction to include subgrade proofrolling,compaction testing, and foundation excavation observations for bearing capacityverification.
§ An estimated cut of 6 to 12 inches in depth will be required to remove existing topsoilmaterials; however, based on our experience with similar site conditions (woodedareas) this average initial cut to remove organic laden soils could extend to 18inches or more. In addition, this cut is expected to extend deeper in isolated areas toremove deeper deposits of unsuitable soils.
§ Some subgrade improvements should be anticipated within the construction areas(undercutting and backfilling with select fill) as a result of potentiallyunsuitable/unstable cohesive subgrade soils.
§ Due to the presence of compressible soft Clay soils, minor settlements areanticipated as a result of the fill and structural loading conditions. Accordingly, theMBBR Building footprint can be surcharged with up to 20 feet of fill (41 feet MSL). Itis estimated that the surcharge load should remain in place for about 2 to 3 monthsto sufficiently consolidate the compressible Clay layer.

Report of Subsurface Exploration and Geotechnical Engineering Services October 15, 2013Hopewell Regional Alternative 4A-1 Light Phase 2 PER (Primary Site) rev 10/23/2013Hopewell, VirginiaG E T Project No: WM13-136G
ii
§ Shallow foundations designed using a net allowable bearing capacity of 2,000 psf(24-inch embedment, 24-inch width).
§ Estimated post-construction total and differential settlements up to 1.5-inches and¾-inch, respectively within the MBBR structure’s footprint, unless a Surchargeprogram is implemented as discussed herein.
§ Estimated post-construction total and differential settlements up to 1-inch and ½-inch, respectively within the Blower building, DAF building, Future Expansion andSH Tank building footprints.
§ Deep foundation design comprised of driven, SPPC piles can be implemented tosupport the MBBR Building’s foundations and slabs should the estimatedsettlements associated with shallow foundation construction be consideredunacceptable. Design capacities are presented below.
Pile Type Embedment Depth(1)
(ft.)Allowable
Compression Capacity(tons)
Pre-Augering Depth(ft)
12” SPPC 55-60 80-100 5-10(1) Below the base of slab elevation of 21 feet MSL.(2) Lateral capacity is based on one-half of the lateral load that produces a 1-inch lateral displacement (free-head
condition). Batter piles would enhance lateral capacity.
§ On the basis of the results of the soil test borings drilled at this site (65 feetmaximum explored depth) and our experience in the project area, it is our opinionthat this site should be considered a Site Class “D” in accordance with Table 20.3-1Site Classification of the ASCE 7-10 Minimum Design Loads for Buildings and OtherStructures, Chapter 20 (referenced in the 2012 IBC).
This summary briefly discusses some of the major topics mentioned in the attachedreport. Accordingly, this report should be read in its entirety to thoroughly evaluate thecontents.

Report of Subsurface Exploration and Geotechnical Engineering Services October 15, 2013Hopewell Regional Alternative 4A-1 Light Phase 2 PER (Primary Site) rev 10/23/2013Hopewell, VirginiaG E T Project No: WM13-136G
1
1.0 PROJECT INFORMATION
1.1 Project Authorization
G E T Solutions, Inc. has completed our subsurface exploration and geotechnicalengineering services for the proposed Hopewell Regional Alternative 4A-1 Light Phase 2PER (Primary Site) project located in Hopewell, Virginia. Authorization to proceed with theservices was provided in the form of an executed geotechnical sub-consultant agreement,dated July 18, 2013, signed by Mr. William S. M’Coy, P.E. with HDR Engineering, Inc.
1.2 Project Location and Description
The project site is located at the Hopewell Wastewater Treatment plant which is situatedeast of Hummel Ross Road and southwest of the James River in the City of Hopewell,Virginia. Specifically, the project site lies to the east of the existing Clarifier Bed structuresand west of the James River. This site is currently moderately to heavily wooded andgenerally slopes upward from the perimeter of the existing Clarifier Bed structures to thecentral portion of the MBBR Building and then downward to the river with elevationsranging from approximately 20 to 35 feet (MSL) within the proposed structures’ footprints.
The construction at this site is expected to consist of expanding the existing wastewatertreatment facility to include a MBBR system which will consist of the MBBR Building andassociated support structures. The proposed expansions will consist of four (4) newstructures to the east of the existing Clarifier Bed structures. The main structure will consistof a roughly 3-story MBBR Building (FFE = 23 feet MSL and top of tank elevation = 51 feetMSL), approximately 37,500-square feet in plan area (150’ x 250’). This structure isexpected to be supported over a shallow or deep (SPPC piles) foundation system (to bedetermined by the client based on acceptable settlement levels). This structure is expectedto be of reinforced concrete/steel frame construction with a first floor slab approximately 2feet thick supported on grade or pile foundations. The maximum loaded contact pressureof the Tank is expected to be on the order of 1,560 psf. The existing site grades within theMBBR building footprint range from approximately 20 to 35 feet MSL with a proposedbottom of slab elevation of 21 feet MSL. As such, cuts of up to 14 feet are expected withinthe western, northern and central portion of the structure’s footprint while fills of up to 1foot are expected within the eastern portion of the structure’s footprint. A slopedembankment fill section, approximately 10 to 15 feet in depth, will be required along aportion of the existing slope in order to provide access around the eastern portion of theMBBR Building. It is anticipated that this embankment fill will be constructed on a minimum3H:1V grade.

Report of Subsurface Exploration and Geotechnical Engineering Services October 15, 2013Hopewell Regional Alternative 4A-1 Light Phase 2 PER (Primary Site) rev 10/23/2013Hopewell, VirginiaG E T Project No: WM13-136G
2
In addition to the main structure, three (3) complimentary structures will be constructed atthis site as well along with a future expansion area located to the northwest. Thesestructures will consist of a Blower building, a DAF building and a SH Tank Building. Thesestructures are expected to be roughly one to two stories in height with footprints muchsmaller than the MBBR structure. The structural elements of these buildings were notknown at the time of this reporting; however, they are expected to be of typical CMU/steelframe construction with first floor slabs supported on grade. In addition, the structuralloading characteristics are expected to be negligible in relation to the MBBR structure. Assuch, shallow foundation support is expected to be suitable for these structures. Theconstruction at this site is also expected to include the construction of new utilityalignments along with other associated infrastructure components.
It is noted that the MBBR structure’s footprint was originally planned to be larger in planarea with a higher finished floor elevation and lower distributed contact pressure. However,preliminary calculations of the magnitude of calculated post-construction settlements wereconsidered unacceptable. Subsequently, the structure’s footprint was reduced and theproposed finished floor elevation lowered in order to decrease these expected settlements.At the time of the building re-configuration, additional field services were performed torefine the engineering assessment.
In addition to the subsurface exploration performed at this site, further subsurfaceexploration was also performed at an alternate site to the north. The data collected fromthese exploration points (SPT Borings F-8, F-9 and F-10; Cone Penetration Test CPT-3and Dilatometer Test DMT-3) is not included in the scope of this report; however, theresults of these explorations are included in their respective appendices (Appendix III andIX).
If any of the noted information is incorrect or has changed, please inform G E TSolutions, Inc. so that we may amend the recommendations presented in this report,if appropriate.
1.3 Purpose and Scope of Services
The purpose of this study was to obtain information on the general subsurface conditionsat the proposed project site. The subsurface conditions encountered were then evaluatedwith respect to the available project characteristics. In this regard, engineeringassessments for the following items were formulated:
1. General assessment of the soils revealed by the borings performed at theproposed development.
2. General location and description of potentially deleterious materialencountered in the borings that may interfere with construction progress orstructure performance, including existing fills or surficial/subsurfaceorganics.
Report of Subsurface Exploration and Geotechnical Engineering Services October 15, 2013Hopewell Regional Alternative 4A-1 Light Phase 2 PER (Primary Site) rev 10/23/2013Hopewell, VirginiaG E T Project No: WM13-136G
3
3. Soil subgrade preparation, including stripping, grading and compaction.Engineering criteria for placement and compaction of approved structural fillmaterial.
4. Construction considerations for fill placement, subgrade preparation, andfoundation excavations.
5. Evaluation of the on-site soils for re-use as structural fill.
6. Ground improvement (surcharge) recommendations to provide satisfactorysoils for slab-on-grade and shallow foundation construction.
7. Feasibility of utilizing a shallow foundation system for support of theproposed structures. Design parameters required for the foundation systems,including foundation sizes, allowable bearing pressures, foundation levelsand expected total and differential settlements.
8. Feasibility of utilizing an alternative deep foundation system consisting ofdriven concrete piles for support of the proposed MBBR structure. Designparameters required for the deep foundation system including pile types, pilelengths, allowable capacities, expected total and differential settlements, andpile installation and testing criteria.
9. Slope stability analysis for the embankment slopes.
10. Design parameters for the below grade retaining walls.
11. Seismic site class determination in accordance with the 2012 InternationalBuilding Code.
The scope of services did not include an environmental assessment for determining thepresence or absence of wetlands or hazardous or toxic material in the soil, bedrock,surface water, groundwater or air, on or below or around this site. Prior to development ofthis site, an environmental assessment is advisable.
2.0 FIELD AND LABORATORY PROCEDURES
2.1 Field Exploration
In order to explore the general subsurface soil types and to aid in developing associatedfoundation design parameters, seven (7) 25 to 65-foot deep Standard Penetration Test(SPT) borings (designated as M-1 through M-4, B-5, D-6 and F-7) were drilled within theproposed structures’ footprints. It is noted that a SPT boring was not performed within theSH Tank Building’s footprint. In addition, the SPT borings were performed during the firstphase of our exploration to evaluate the initial MBBR Building layout along with the

Report of Subsurface Exploration and Geotechnical Engineering Services October 15, 2013Hopewell Regional Alternative 4A-1 Light Phase 2 PER (Primary Site) rev 10/23/2013Hopewell, VirginiaG E T Project No: WM13-136G
4
associated support structures. Specific information regarding the SPT boring depths,elevations and locations is tabulated below in Table I.
Table I - SPT Boring Schedule
BoringNo.
BoringDepth(Feet)
BoringElevation
(MSL)
AssociatedStructure
M-1 65 30 MBBR BuildingM-2 40 27 MBBR BuildingM-3 50 20 MBBR BuildingM-4 30 15 MBBR BuildingB-5 50 31 Blower BuildingD-6 25 35 DAF BuildingF-7 25 31 Future Expansion
The SPT borings were performed with the use of rotary wash “mud” drilling procedures ingeneral accordance with ASTM D 1586. The tests were performed continuously from theexisting ground surface to a depth of 12-feet, and at 5-foot intervals thereafter. The soilsamples were obtained with a standard 1.4” I.D., 2” O.D., 30” long split-spoon sampler.The sampler was driven with blows of a 140 lb. hammer falling 30 inches, using anautomatic hammer. The number of blows required to drive the sampler each 6-inchincrement of penetration was recorded and is shown on the boring logs. The sum of thesecond and third penetration increments is termed the SPT N-value (uncorrected forautomatic hammer). A representative portion of each disturbed split-spoon sample wascollected with each SPT, placed in a glass jar, sealed, labeled, and returned to ourlaboratory for review. Two (2) thin-walled tube samples were obtained from the very soft tosoft CLAY stratum, by hydraulically pressing a 3-inch outside diameter Shelby tube into thesoils. Specifically, the tube samples were obtained at the location of borings M-2 and M-3at depths ranging from 28 to 35 feet below the existing site grades. The tubes were sealedto prevent moisture loss and returned to the laboratory for extraction, classification andconsolidation testing.
In conjunction with a reconfiguration of the MBBR Building layout due to the previouslymentioned unacceptable estimated settlement levels, a second phase of subsurfaceexploration was deemed necessary. Subsequently, a Cone Penetration rig was mobilizedto the project site to perform two (2) 45 to 55-foot deep Cone Penetration Test (CPT)soundings (designated as CPT-1 and CPT-2) and two (2) 45 to 55-foot deep Dilatometersoundings (designated as DMT-1 and DMT-2). Dissipation testing was performed at thelocation of CPT-2 at a depth of 33 feet below existing site grades. The results of the CPTand Dilatometer testing are presented in Appendix IX.
The SPT, CPT and DMT boring locations were established and staked in the field by arepresentative of G E T Solutions, Inc. The approximate boring locations are shown onthe attached “Boring Location Plan” (Appendix I), which was reproduced based on the siteplan provided by the client. Please note: based on limited information made available by

Report of Subsurface Exploration and Geotechnical Engineering Services October 15, 2013Hopewell Regional Alternative 4A-1 Light Phase 2 PER (Primary Site) rev 10/23/2013Hopewell, VirginiaG E T Project No: WM13-136G
5
the Client, the ground surface elevations shown on the Boring Logs and utilized throughoutour evaluations are estimated values rather than specific spot elevations. Once a surveyis obtained establishing the Boring elevations with certainty, we request the opportunity toreview the information as related to our analyses to ensure the continuing applicability ofthe recommendations made herein.
2.2 Laboratory Testing
Representative portions of all soil samples collected during drilling were sealed in glassjars, labeled and transferred to our laboratory for classification and analysis. The soilclassification was performed by a Geotechnical Engineer in accordance with ASTM D2488.A summary of the soil classification system is provided in Appendix II.
Eighteen (18) representative soil samples were selected and subjected to laboratorytesting, which included natural moisture, -#200 sieve wash and Atterberg Limit testing andanalysis, in order to corroborate the visual classification. These test results are provided inthe table (Table II) below and are presented on the “Boring Log” sheets (Appendix III),included with this report.
Table II - Laboratory Test Results
BoringNo.
Depth*(Feet)
NaturalMoisture (%)
% Passing#200
Atterberg Limits(LL/PL/PI)
USCSClassification
M-1 23-25 24 89 43/17/26 CLM-1 33-35 22 8 Not Tested SP-SMM-1 43-45 29 60 34/21/13 CLM-2 18-20 2 9 Not Tested SP-SMM-2 23-25 25 10 Not Tested SP-SM
M-2** 33-35 35 59 33/16/17 CLM-3 13-15 13 7 Not Tested SP-SMM-3 18-20 16 74 21/16/5 CLM-3 23-25 18 18 Not Tested SM
M-3** 28-30 49 99 63/27/36 CHM-4 4-6 14 58 29/21/8 CLM-4 8-10 7 12 Not Tested SP-SMM-4 13-15 17 12 Not Tested SP-SMM-4 18-20 42 99 59/24/35 CHB-5 18-20 24 95 52/23/29 CHB-5 38-40 50 99 52/26/26 CHD-6 10-12 29 98 58/28/30 CHF-7 18-20 2 7 Not Tested SP-SM
*Depth below existing grades.**Shelby Tube Sample

Report of Subsurface Exploration and Geotechnical Engineering Services October 15, 2013Hopewell Regional Alternative 4A-1 Light Phase 2 PER (Primary Site) rev 10/23/2013Hopewell, VirginiaG E T Project No: WM13-136G
6
Two (2) one-dimensional consolidation tests were performed on specimens from theShelby tube samples obtained at the location of borings M-2 and M-3 at depths of 33 to 35and 28 to 30 feet below the existing site grades, respectively. The consolidation tests wereperformed at our Virginia Beach laboratory in general accordance with ASTM D 2435. Arepresentative specimen from each of the Shelby tubes was also subjected to naturalmoisture content, Atterberg Limits, and -#200 sieve testing. A summary of theconsolidation test results are provided below in Table III and the comprehensive resultsare provided in Appendix V.
Table III - Consolidation Test Results
BoringNo.
Depth(ft)
NaturalMoisture
(%)
OverburdenPressure
(tsf)
Pre consolidationPressurePc (tsf)
Cc Cr eo
M-2* 34 35.0 1.74 - - - -
M-3 29 48.6 1.30 2.30 0.71 0.10 1.435* Test results are not considered representative of the subsurface soil conditions encountered across the site.
One (1) thin walled tube soil sample was selected and subjected to unconsolidated-undrained triaxial compression (ASTM D 2850) testing and analysis. A summary of thetriaxial compression test results are provided below (Table IV) and the comprehensivetriaxial compression test results are provided in Appendix VI.
Table IV - Unconsolidated-Undrained Triaxial Compressive Strength Test Results
BoringNo.
Depth*(ft)
USCSClassification
Cohesion c(lbs/ft²)
M-3 28-30 CH 458*Depth below existing grade.
3.0 SITE AND SUBSURFACE CONDITIONS
3.1 Site Geology
The project site lies within a major physiographic province called the Atlantic Coastal Plain.Numerous transgressions and regressions of the Atlantic Ocean have deposited marine,lagoonal, and fluvial (stream lain) sediments. The regional geology is very complex, andgenerally consists of interbedded layers of varying mixtures of sands, silts and clays.Based on our review of existing geologic and soil boring data, the geologic stratigraphyencountered in our subsurface explorations generally consisted of marine deposited sandsand clays.
Report of Subsurface Exploration and Geotechnical Engineering Services October 15, 2013Hopewell Regional Alternative 4A-1 Light Phase 2 PER (Primary Site) rev 10/23/2013Hopewell, VirginiaG E T Project No: WM13-136G
7
3.2 Subsurface Soil Conditions
The results of our soil test borings indicated the presence of approximately 1 to 4 inches oftopsoil material at the boring locations. The topsoil material thickness is expected tovarying at other locations throughout the site. It is noted that the topsoil thicknessesincluded on the boring logs and noted above are not expected to be indicative of thethicknesses that will be encountered across the site as the boring locations were partiallycleared for accessibility prior to drilling. Underlying the surficial materials and extending tothe boring termination depths ranging from 25 to 65 feet below existing site grades, thenatural subsurface soils were generally arranged into four stratums. It is noted that thedeeper strata were not encountered at the boring locations drilled to shallower depths.
Blower Building (B-5):
The initial soil layer extended beneath the surficial materials to a depth of 10 feet belowthe existing site grades. The recovered soils were comprised of SILT (ML) with varyingamounts of Clay and Sand and lean to fat CLAY (CL, CH) with varying amounts of Silt andSand. The Standard Penetration Test (SPT) Results, N-values, recorded within thecohesive soils of this layer ranged from 8 to 36 blows-per-foot, indicating a medium stiff tohard consistency. Deposits of fine organics (grass roots) were sampled within the upper 2feet of this stratum.
The second soil layer extended beneath the initial soil layer to a depth of 14 feet below theexisting site grades. The recovered soils were classified as SAND (SM) with varyingamounts of Silt and Clay. The N-values recorded within the granular soils of this layerranged from 9 to 12 blows-per-foot, indicating a loose to medium dense relative density.
The third soil layer extended beneath the second soil layer to a depth of 24.5 feet belowexisting grades. The recovered soils were comprised of fat CLAY (CH) with varyingamounts of Silt and Sand. The N-values recorded within the cohesive soils of this layerranged from 9 to 17 blows-per-foot, indicating a stiff to very stiff consistency.
The final soil layer extended beneath the third soil layer to the boring termination depth of50 feet below existing site grades. The recovered soils were comprised of SAND (SM, SP-SM) with varying amounts of Silt, Clay and marine shell fragments. The N-values recordedwithin the granular soils of this layer ranged from 11 to 18 blows-per-foot, indicating amedium dense relative density. A deposit of very soft, fat CLAY (CH) with varying amountsof Silt and Sand was sampled at depths ranging from 38 to 43 feet below the existing sitegrades.
Report of Subsurface Exploration and Geotechnical Engineering Services October 15, 2013Hopewell Regional Alternative 4A-1 Light Phase 2 PER (Primary Site) rev 10/23/2013Hopewell, VirginiaG E T Project No: WM13-136G
8
DAF Building (D-6):
The initial soil layer extended beneath the surficial materials to a depth of 4 feet below theexisting site grades. The recovered soils were comprised of lean CLAY (CL) with varyingamounts of Silt and Sand. The N-values recorded within the cohesive soils of this layerranged from 7 to 11 blows-per-foot, indicating a medium stiff to stiff consistency. Depositsof fine organics (grass roots) were sampled within the upper 2 feet of this stratum.
The second soil layer extended beneath the initial soil layer to a depth of 8 feet below theexisting site grades. The recovered soils were classified as SAND (SC) with varyingamounts of Silt and Clay. The N-values recorded within the granular soils of this layerranged from 15 to 20 blows-per-foot, indicating a medium dense relative density.
The third soil layer extended beneath the second soil layer to a depth of 14 feet belowexisting grades. The recovered soils were comprised of fat CLAY (CH) with varyingamounts of Silt and Sand. The N-values recorded within the cohesive soils of this layerranged from 17 to 20 blows-per-foot, indicating a very stiff consistency.
The final soil layer extended beneath the third soil layer to the boring termination depth of25 feet below existing site grades. The recovered soils were comprised of SAND (SM, SP-SM) with varying amounts of Silt and Clay. The N-values recorded within the granular soilsof this layer ranged from 11 to 20 blows-per-foot, indicating a medium dense relativedensity.
Future Expansion (F-7):
The initial soil layer extended beneath the surficial materials to a depth of 10 feet belowthe existing site grades. The recovered soils were comprised of lean to fat CLAY (CL, CH)with varying amounts of Silt and Sand. The N-values recorded within the cohesive soils ofthis layer ranged from 7 to 33 blows-per-foot, indicating a medium stiff to hard consistency. Deposits of fine organics (grass roots) were sampled within the upper 2 feet of thisstratum.
The second soil layer extended beneath the initial soil layer to a depth of 23 feet below theexisting site grades. The recovered soils were classified as SAND (SM, SP-SM) withvarying amounts of Silt and Clay. The N-values recorded within the granular soils of thislayer ranged from 10 to 16 blows-per-foot, indicating a loose to medium dense relativedensity.
The final soil layer extended beneath the second soil layer to the boring termination depthof 25 feet below existing site grades. The recovered soils were comprised of fat CLAY(CH) with varying amounts of Silt and Sand. The N-value recorded within the cohesivesoils of this layer was 14 blows-per-foot, indicating a stiff consistency.
Report of Subsurface Exploration and Geotechnical Engineering Services October 15, 2013Hopewell Regional Alternative 4A-1 Light Phase 2 PER (Primary Site) rev 10/23/2013Hopewell, VirginiaG E T Project No: WM13-136G
9
MBBR Building (M-1 through M-4):
The initial soil layer extended beneath the surficial materials to depths ranging from 7.5 to28 feet below the existing site grades. The recovered soils were comprised of SILT (ML)with varying amounts of Clay and Sand and lean to fat CLAY (CL, CH) with varyingamounts of Silt and Sand. The N-values recorded within the cohesive soils of this layerranged from 5 to 46 blows-per-foot, indicating a medium stiff to hard consistency. Depositsof medium dense SAND (SM) were sampled at depths ranging from 2 to 13 feet below theexisting site grades at boring locations M-1, M-2 and M-3. Deposits of fine organics (grassroots) and wood fragments were sampled at the boring locations within the upper 2 feet ofthis stratum.
The second soil layer extended beneath the initial soil layer to depths ranging from 18 to38 feet below the existing site grades. The recovered soils were classified as SAND (SM,SP-SM) with varying amounts of Silt and Clay. The N-values recorded within the granularsoils of this layer ranged from 5 to 24 blows-per-foot, indicating a loose to medium denserelative density. A deposit of very stiff, Silty CLAY (CL-ML) with varying amounts of Silt andSand was sampled within this stratum at depths ranging from 18 to 23 feet below theexisting site grades at boring location M-3.
The third soil layer extended beneath the second soil layer to depths ranging from 24 to 48feet below existing grades. The recovered soils were comprised of lean to fat CLAY (CL,CH) with varying amounts of Silt and Sand. The N-values recorded within the cohesivesoils of this layer ranged from Weight-of-Hammer (WOH) to 6 blows-per-foot, indicating avery soft to medium stiff consistency.
The final soil layer extended beneath the third soil layer to the boring termination depths of30, 40, 50 and 65 feet below existing site grades. The recovered soils were comprised ofSAND (SM, SP-SM) with varying amounts of Silt, Clay and marine shell fragments. The N-values recorded within the granular soils of this layer ranged from 10 to 43 blows-per-foot,indicating a loose to dense relative density. A deposit of medium stiff, fat CLAY (CH) wassampled at depths ranging from 53 to 58 feet below the existing site grades at boringlocation M-1.
The subsurface description is of a generalized nature provided to highlight the major soilstrata encountered. The records of the subsurface exploration are included on the “BoringLog” sheets (Appendix III), in the “Generalized Soil Profile” (Appendix IV) and on the“CPT/DMT Test Results” sheets (Appendix IX), which should be reviewed for specificinformation as to the individual borings. The stratifications shown on the records of thesubsurface exploration represent the conditions only at the actual boring locations.Variations may occur and should be expected between boring locations. The stratificationsrepresent the approximate boundary between subsurface materials and the transition maybe gradual or occur between sample intervals. It is noted that the topsoil designationreferences the presence of surficial organic laden soil, and does not represent anyparticular quality specification. This material is to be tested for approval prior to use.

Report of Subsurface Exploration and Geotechnical Engineering Services October 15, 2013Hopewell Regional Alternative 4A-1 Light Phase 2 PER (Primary Site) rev 10/23/2013Hopewell, VirginiaG E T Project No: WM13-136G
10
3.3 Groundwater Information
The groundwater level was recorded at the boring locations and as observed through thewetness of the recovered soil samples during the drilling operations. The initialgroundwater table was measured to occur at depths ranging from 13 to 23 feet belowcurrent grades (2 to 13 feet MSL) at the boring locations. The discrepancy between themeasured groundwater elevations is likely the result of varying site elevations at the boringlocations, and potential perched conditions. The groundwater level was not encountered atthe location of boring F-7 to the depth explored. The boreholes were backfilled uponcompletion for safety considerations. As such, the reported groundwater levels may not beindicative of the static groundwater level.
As subsurface soils begin to dry moisture moves upwards through the soil profile by meansof capillary action. Based on the subsurface soil composition (soils containing more than30% of fines by weight), these initial groundwater readings (based on the relative wetnessof the soils) could be in part attributed to the capillary action of the soils. As such, if thestatic groundwater elevation is critical to the design of the proposed structures and siteinfrastructure it is recommended to install temporary groundwater monitoring wells tosubstantiate these initial readings.
Groundwater conditions will vary with environmental variations and seasonal conditions,such as the frequency and magnitude of rainfall patterns, as well as man-made influences,such as existing swales, drainage ponds, underdrains and areas of covered soil (pavedparking lots, sidewalks, etc.). Seasonal groundwater fluctuations of ± 2 feet are common inthe project’s area; however, greater fluctuations have been documented. We recommendthat the contractor determine the actual groundwater levels at the time of the constructionto determine groundwater impact on the construction procedures.
4.0 EVALUATIONS AND RECOMMENDATIONS
Our recommendations are based on the previously discussed project information, ourinterpretation of the soil test borings and laboratory data, and our observations during oursite reconnaissance. If the proposed construction should vary from what was described, werequest the opportunity to review our recommendations and make any necessary changes.
The anticipated loads associated with the MBBR Building are expected to result in a stressincrease within the very soft to medium stiff CLAY (CL, CH) stratum. This stress increase isexpected to induce consolidation settlements that will occur over a longer time span thantypical post construction settlements based on short-term elastic compression. The totalestimated settlements reported herein are anticipated to occur as approximately 70% to75% short-term compression (during construction to within approximately 3 months of fullservice load application) and approximately 25% to 30% longer term consolidationoccurring within approximately 1 to 1.5 years of completion.

Report of Subsurface Exploration and Geotechnical Engineering Services October 15, 2013Hopewell Regional Alternative 4A-1 Light Phase 2 PER (Primary Site) rev 10/23/2013Hopewell, VirginiaG E T Project No: WM13-136G
11
4.1 Clearing and Grading
The proposed construction area should be cleared by means of removing the topsoilmaterial, trees, associated root mat and any other unsuitable materials. It is estimated thata cut of up to 6 to 12 inches in depth will be required to remove the topsoil and root matmaterial. As such, based on our experience with similar site conditions (wooded areas) thisinitial cut to remove organic laden soils could extend to 18 inches or more. This cut isexpected to extend deeper in isolated areas to remove deeper deposits of organic soils, orunsuitable soils, which become evident during the clearing particularly in the woodedareas of the project site. It is recommended that the clearing operations extend laterally atleast 5 feet beyond the perimeter of the proposed construction areas.
Following the initial clearing, the resulting exposed subgrade will generally be comprisedof lean CLAY (CL) containing an appreciable amount of fines (Silt and Clay). Accordingly,combinations of excess surface moisture from precipitation ponding on the site and theconstruction traffic, including heavy compaction equipment, may create pumping andgeneral deterioration of the bearing capabilities of the surface soils. Therefore,undercutting to remove loose/soft soils in isolated areas should be expected. The extent ofthe undercut will be determined in the field during construction based on the outcome ofthe field testing procedures (subgrade proofroll). In this regard, and in order to reduceundercutting, care should be exercised during the grading and construction operations atthe site.
Inherently wet subgrade soils combined with potential poor site drainage make this siteparticularly susceptible to subgrade deterioration. Thus, grading operations at this site willbe more economical if performed during the drier months of the year (historically Aprilthrough November). This should minimize these potential problems, although they may notbe eliminated. If grading is attempted during the winter months, undercutting of wet soilsshould be anticipated. However, during the drier months of the year, wet soils could bedried by disking or other drying procedures to achieve moisture contents necessary toachieve adequate degrees of compaction.
Similar projects have required significant improvements to stabilize or bridge unstablesubgrade soils, which tend to deteriorate when exposed to construction traffic andmoisture. The subgrade improvements typically consist of additional cuts of up to 1-footand replacement with structural fill to improve poor subgrade soil conditions. The project’sbudget should include an allowance for subgrade improvements (undercut and backfill withstructural fill or aggregate base particularly in the pavement areas).
4.2 Subgrade Preparation
Following the clearing operation, the exposed subgrade soils should be densified with alarge static drum roller. After the subgrade soils have been densified, they should beevaluated by G E T Solutions, Inc. for stability. Accordingly, the subgrade soils should beproofrolled to check for pockets of loose material hidden beneath a crust of better soil.

Report of Subsurface Exploration and Geotechnical Engineering Services October 15, 2013Hopewell Regional Alternative 4A-1 Light Phase 2 PER (Primary Site) rev 10/23/2013Hopewell, VirginiaG E T Project No: WM13-136G
12
Several passes should be made by a large rubber-tired roller or loaded dump truck overthe construction areas, with the successive passes aligned perpendicularly. The number ofpasses will be determined in the field by the Geotechnical Engineer depending on the soilsconditions. Any pumping and unstable areas observed during proofrolling (beyond theinitial cut) should be undercut and/or stabilized at the directions of the GeotechnicalEngineer. The project’s budget should include an allowance for subgrade improvements(undercut and backfill with structural fill).
4.3 Structural Fill and Placement
Following the approval of the natural subgrade soils by the Geotechnical Engineer, theplacement of the fill required to establish the design grades may begin. Any material to beused for structural fill should be evaluated and tested by G E T Solutions, Inc. prior toplacement to determine if they are suitable for the intended use. Suitable structural fillmaterial should consist of sand or gravel containing less than 25% by weight of fines (SP,SM, SW, GP, GW), having a liquid limit less than 20 and plastic limit less than 6, andshould be free of rubble, organics, clay, debris and other unsuitable material.
The subsurface soils encountered at the boring locations do not appear to meet the criteriarecommended in this report for reuse as structural fill, but may be used as fill within greenareas or as surcharge fill. Further classification testing (natural moisture content,gradation analysis, and Proctor testing) should be performed in the field duringconstruction to evaluate the suitability of excavated soils for reuse as fill within buildingand pavement areas.
All structural fill should be compacted to a dry density of at least 95 percent of theStandard Proctor maximum dry density (ASTM D698). In general, the compaction shouldbe accomplished by placing the fill in maximum 10-inch loose lifts and mechanicallycompacting each lift to at least the specified minimum dry density. A representative ofG E T Solutions, Inc. should perform field density tests on each lift as necessary toassure that adequate compaction is achieved.
Backfill material in utility trenches within the construction areas should consist of structuralfill (as previously above), and should be compacted to at least 95 percent of ASTM D698.This fill should be placed in 4 to 6 inch loose lifts when hand compaction equipment isused.
Care should be used when operating the compactors near existing structures to avoidtransmission of the vibrations that could cause settlement damage or disturb occupants. Inthis regard, it is recommended that the vibratory roller remain at least 25 feet away fromexisting structures; these areas should be compacted with small, hand-operatedcompaction equipment.
Report of Subsurface Exploration and Geotechnical Engineering Services October 15, 2013Hopewell Regional Alternative 4A-1 Light Phase 2 PER (Primary Site) rev 10/23/2013Hopewell, VirginiaG E T Project No: WM13-136G
13
4.4 Suitability of On-site Soils
Based on the laboratory testing program and visual classifications, the shallow subsurfaceSILT (ML), CLAY (CL, CH) and SAND (SC, SM) soils encountered at the boring locations,do not appear to meet the criteria recommended in this report (Section 4.3) for reuse asstructural fill. As such, it will likely be necessary to import structural fill to expedite theutility backfilling. Further classification testing (natural moisture content, gradationanalysis, and Proctor testing) should be performed in the field during construction toevaluate the suitability of excavated soils for reuse as backfill within building and utilityareas.
4.5 Settlement Discussion (MBBR Building)
As previously mentioned, the expected fill and structural loading conditions (foundationsand slab) associated with the proposed MBBR structure are expected to result in a netstress increase within the soft to medium stiff CLAY (CL, CH) stratum (elevation rangingfrom -3 to -18 feet MSL, with a typical thickness of 5 to 10 feet), which is expected toinduce consolidation settlements. The magnitude and duration of the settlementassociated with these loading conditions is important to planning the construction. Weevaluated settlement under conditions of maximum loading across what is consideredamong the least favorable Tank profiles.
We selected a maximum floor distributed loading of 1,560 psf along with a maximum fillheight of 1 foot under the structure (along with adjacent embankment construction) andevaluated them with the appropriate subsurface information from the Soil Test Borings, In-Situ Testing (CPT/DMT) and laboratory testing. Based on the consolidation test results,the compressible soils located at the location of boring M-3 were consideredrepresentative of subsurface conditions where the settlement would be the greatest andthe time to substantial completion of settlement would be the longest. The magnitude andduration of the settlement at locations with smaller loads are expected to be less than thevalues calculated for these locations. The subsurface soil parameters used during ouranalysis of this section were estimated by using the SPT boring data, the results oflaboratory classification and consolidation testing, In-Situ Testing (CPT/DMT), and ourexperience with sites in the vicinity of the project.
For evaluation of settlement potential, we utilized the GeoStudio software programSIGMA/W™ for finite element modeling and analysis of applied stress and resultingdeformation. Based on our analysis, a maximum total settlement magnitude ranging fromabout 1.75 to 2.5 inches is expected to occur within the subsurface soils as a result of thestructural loads and fill required to achieve the design grade elevations. The totalestimated settlements reported herein are anticipated to occur as approximately 70% to75% short term compression (during construction to within approximately 3 months of fullservice load application) and approximately 25% to 30% longer term consolidationoccurring within approximately 1 to 1.5 years of completion.
Report of Subsurface Exploration and Geotechnical Engineering Services October 15, 2013Hopewell Regional Alternative 4A-1 Light Phase 2 PER (Primary Site) rev 10/23/2013Hopewell, VirginiaG E T Project No: WM13-136G
14
It is estimated that, with proper site preparation, the maximum resulting post constructiontotal settlement of the proposed Tank structure should be up to approximately 1.75 to 2.5inches. The maximum differential settlement magnitude is expected to be less than about¾-inch within an approximate 50 foot span across the structure width. A depiction of theanticipated settlement profile is included with the comprehensive Finite Element Analysis -Stress Deformation (Appendix VII). The settlements were estimated on the basis of theresults of the field penetration tests and consolidation testing. Careful field control willcontribute substantially towards minimizing the settlements.
These settlement magnitudes are based on the provided structural characteristics(maximum floor loading of 1,560 psf, site grading as indicated and maximum 1 footof fill expected to achieve the finished floor elevation. If any of the this informationis incorrect or has changed, G E T Solutions, Inc. must be notified so that we mayamend the recommendations presented in this report, if appropriate.
4.6 Surcharge (MBBR Building)
Should the estimated settlements associated with shallow foundation construction providedin Section 4.5 be considered unacceptable; ground improvements by means ofsurcharging portions of the building area can be implemented. Surcharging is a processwhere a temporary weight is placed on the construction area so that the subsurface soilscan settle (consolidate) prior to the foundation construction. It is well suited for clayey orother low permeability soils that require long periods of time to compress.
It is noted that cuts are expected in the western and northern portions of the buildingfootprint and these areas (existing elevation of approximately 28 feet MSL or higher) willnot require surcharge. The cut soils from these areas can be placed on the southeasternportion of the building footprint (fill areas) as part of the surcharge program.
It is recommended to surcharge the building area with 15 to 20 feet of fill (in addition to thestructural fill needed to achieve the design grade elevations), bringing the top of thesurcharge to an elevation of 36 to 41 feet MSL. The upper crest of the surcharge soil (edgeof the top of the fill) should extend to at least the design edge of the building, then slopingat an approximate angle of 2H:1V. The surcharge soil should have a minimum in-place drydensity of at least 115 pcf. It is estimated that the surcharge load, applied to an elevationof approximately 41 feet MSL, should remain in place for about 2 months to sufficientlyconsolidate the compressible Clay layer, with the objective in mind to reduce the remaininglong-term settlement to be experienced by the structure to less than approximately 0.5 to0.75 inch. The surcharge height can be modified to accommodate different constructionschedules (i.e. lesser surcharge height resulting in longer surcharge time and vice versa).Table V on the following page illustrates Recommended Surcharge Heights, SurchargeDuration, Short-term (surcharge period) Minimum Slope Stability Safety Factor, TotalSettlement, Surcharge Period Settlement and Resulting Post-Construction Settlement forselected options:

Report of Subsurface Exploration and Geotechnical Engineering Services October 15, 2013Hopewell Regional Alternative 4A-1 Light Phase 2 PER (Primary Site) rev 10/23/2013Hopewell, VirginiaG E T Project No: WM13-136G
15
Table V – Surcharge Program Variables
SurchargeHeight
RecommendedSurchargeDuration
Short-Term SlopeStability Safety
Factor
TotalEstimatedSettlement
SurchargePeriod
Settlement
Post-ConstructionSettlement
(ft) (in) (in) (in)--- --- --- 1.75 – 2.5 --- 1.75 – 2.520 2 mo. 1.26 2.0 – 2.5 1.5 – 2.0 0.5015 3 mo. 1.46 1.75 – 2.5 1.75 – 2.0 0.50
In order to accurately determine when the surcharge load can be removed, it isrecommended to install six (6) settlement platforms. The settlement platforms should beplaced directly on the subgrade following the clearing procedures. Then, following theinstallation of the settlement platforms, elevations must be obtained (zero/baselinereadings) prior to the placement of any fill material. It is recommended to install thebuilding pad structural fill material to the finish floor elevation, with each lift compacted toat least 95% of ASTM D698. Then the contractor can proceed with the surchargeplacement.
During the surcharge placement activities, elevation readings should be obtained daily.Following the completion of the permanent fill and surcharge placement, the readingsshould be obtained twice a week. The settlement platform readings should be performed tothe nearest .001 foot and should be provided to the structural and the geotechnicalengineer for their analyses. All readings should be performed under the direction of alicensed surveyor. Once the consolidation of the Clay material is determined to besubstantially complete, the surcharge soil can be removed at the direction of thegeotechnical engineer.
4.6.1 Settlement Platform Description
Settlement platforms are surface displacement reference platforms placed on the preparedground surface at predetermined locations typically prior to select fill and surcharge fillplacement. Settlement platforms shall consist of 3-foot square plates to which risers areattached. The risers are extended as the fill is placed. Settlement platforms are monitoredby optical survey methods to determine vertical displacements occurring during and afterthe surcharge soil layer construction.
The base plate should be made from 1/8-inch thick steel plate conforming to therequirements of ASTM A 36. The inner riser pipe should be 1 ½-inch diameter steel pipeconforming to the requirements of ASTM A 53, welded and of standard weight. The casingshould consist of 3-inch diameter PVC pipe. The maximum length of the riser pipe andcasing sections should be limited to 5 feet. Centralizing spacers should also be provided tomaintain the alignment of the exterior casing.
Report of Subsurface Exploration and Geotechnical Engineering Services October 15, 2013Hopewell Regional Alternative 4A-1 Light Phase 2 PER (Primary Site) rev 10/23/2013Hopewell, VirginiaG E T Project No: WM13-136G
16
4.6.2 Settlement Platform Installation
The settlement platforms should be installed on a 4-inch thick sand base on the existingground surface. The riser pipe should be marked in 1-foot increments and labeled at 5-footincrements to indicate the distance above the platform extending up through the fill. Thesand base should be tamped to provide a firm, level, and unyielding bearing surface forthe base plate. The original ground surface must be stripped of all vegetation prior toplacement of the sand base. Spacers should be provided between the riser pipe and thecasing at a minimum of 3-foot intervals to ensure concentricity. A container, approximately2.5 feet in diameter and 3 feet high, with both ends open, should be placed around theinitial length of casing pipe. This container should be backfilled with tamped clean sand orfine gravel to support the pipe in a vertical position during the fill placement until the fill iscarried above the platform.
The casing pipe should be marked by flags to clearly show its location and to warnequipment operators and others of its location. The contractor should maintain the flagsduring the entire length of the contract and replace those flags that are missing. At no timeshould the settlement platform risers extend higher than 5 feet above the fill surfaceelevation.
4.7 Shallow Foundation Design Recommendations (Appurtenant Structures)
Provided that the construction procedures are properly performed, the proposed structurecan be supported by shallow spread footings bearing upon firm natural soil or wellcompacted structural fill material. The footings can be designed using a net allowable soilpressure of 2,000 pounds per square foot (psf). In using net pressures, the weight of thefootings and backfill over the footings, including the weight of the floor slab, need not beconsidered. Hence, only loads applied at or above the finished floor need to be used fordimensioning the footings. In order to develop the recommended bearing capacity of2,000 pounds per square foot (psf), the base of the footings should have an embedment ofat least 24 inches beneath finished grades and wall footings should have a minimum widthof 24 inches. In addition, isolated square column footings are recommended to be aminimum of 3 feet by 3 feet in area for bearing capacity consideration. The recommended24-inch footing embedment is considered sufficient to provide adequate cover against frostpenetration to the bearing soils.
4.8 Settlements (Shallow Foundations - Blower, DAF, Future Expansion and SH Tank Buildings)
It is estimated that, with proper site preparation, the maximum resulting post constructiontotal settlement of the proposed buildings’ foundations should be up to 1 inch. Themaximum differential settlement magnitude is expected to be less than ½ -inch betweenadjacent footings (wall footings and column footings of widely varying loading conditions).The settlements were estimated on the basis of the results of the field penetration tests.Careful field control will contribute substantially towards minimizing the settlements.
Report of Subsurface Exploration and Geotechnical Engineering Services October 15, 2013Hopewell Regional Alternative 4A-1 Light Phase 2 PER (Primary Site) rev 10/23/2013Hopewell, VirginiaG E T Project No: WM13-136G
17
4.9 Foundation Excavations
In preparation for shallow foundation support, the footing excavations should extend intofirm natural soil or well-compacted structural fill. All foundation excavations should beobserved by G E T Solutions, Inc. At that time, the Geotechnical Engineer should alsoexplore the extent of excessively loose, soft, or otherwise unsuitable material within theexposed excavations. Also, at the time of footing observations, the Geotechnical Engineermay find it necessary to make hand auger borings or use a hand penetration device in thebases of the foundation excavations.
If pockets of unsuitable soils requiring undercut are encountered in the footingexcavations, the proposed footing elevation should be re-established by means ofbackfilling with “flowable fill” or a suitable structural fill material compacted to a dry densityof at least 98 percent of the Standard Proctor maximum dry density (ASTM D 698), asdescribed in Section 4.3 of this report, prior to concrete placement. This constructionprocedure will provide for a net allowable bearing capacity of 2,000 psf.
Immediately prior to reinforcing steel placement, it is suggested that the bearing surfacesof all footing and floor slab areas be compacted using hand operated mechanical tampers,to a dry density of at least 95% of the Standard Proctor maximum dry density (ASTM D698) as tested to a depth of 12 inches, for bearing capacity considerations. In this manner,any localized areas, which have been loosened by excavation operations, should beadequately recompacted. The compaction testing in the base of the footings may bewaived by the Geotechnical Engineer, where firm bearing soils are observed during thefooting inspections.
Soils exposed in the bases of all satisfactory foundation excavations should be protectedagainst any detrimental change in condition such as from physical disturbance, rain orfrost. Surface run-off water should be drained away from the excavations and not beallowed to pond. If possible, all footing concrete should be placed the same day theexcavation is made. If this is not possible, the footing excavations should be adequatelyprotected.
4.10 SPPC Pile Foundation Recommendations (MBBR Building)
Should the estimated settlements associated with shallow foundation construction providedin Section 4.5 be considered unacceptable and the surcharge program described inSection 4.6 be deemed undesirable, the proposed structure’s foundations and slabs canbe supported by a deep foundation system. The deep foundation system should becomprised of driven SPPC (square pre-cast pre-stressed concrete) piles. The followingsections describe the pile capacity analyses and provide our recommendations for staticaxial compressive pile capacities, pile testing program, and pile construction criteria. Inaddition, we have provided estimates of potential settlement.
Report of Subsurface Exploration and Geotechnical Engineering Services October 15, 2013Hopewell Regional Alternative 4A-1 Light Phase 2 PER (Primary Site) rev 10/23/2013Hopewell, VirginiaG E T Project No: WM13-136G
18
4.10.1 Axial Compression Capacity Recommendations
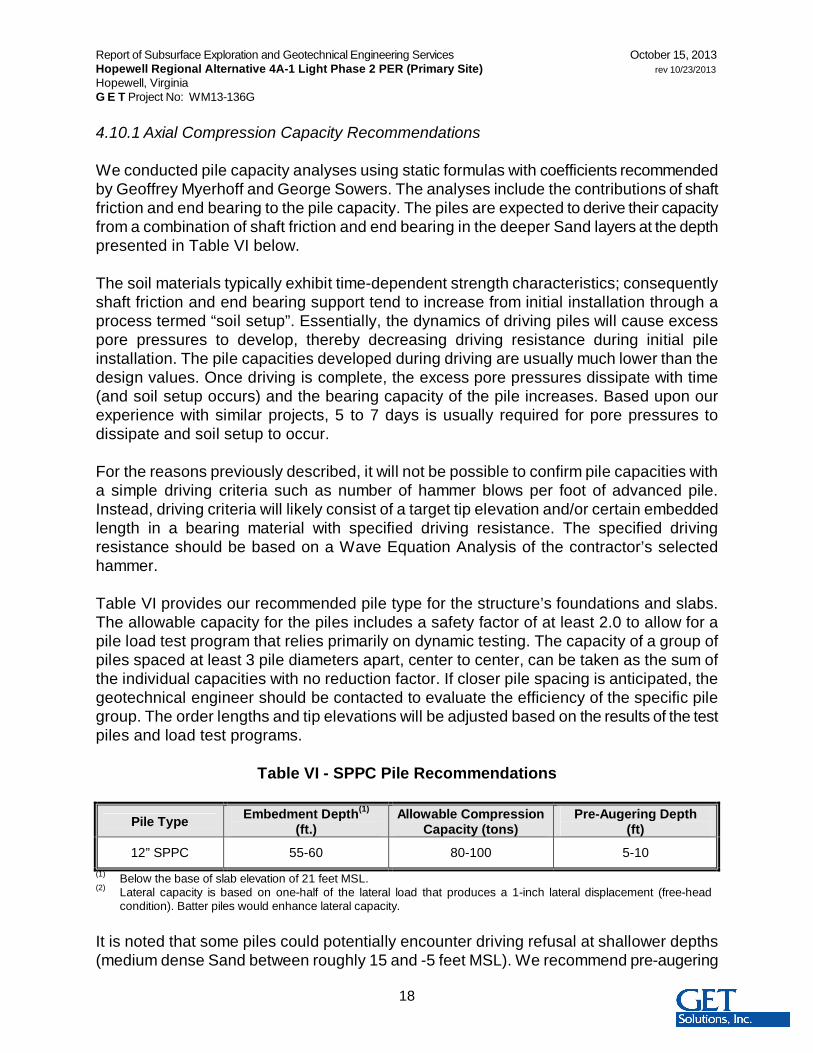
We conducted pile capacity analyses using static formulas with coefficients recommendedby Geoffrey Myerhoff and George Sowers. The analyses include the contributions of shaftfriction and end bearing to the pile capacity. The piles are expected to derive their capacityfrom a combination of shaft friction and end bearing in the deeper Sand layers at the depthpresented in Table VI below.
The soil materials typically exhibit time-dependent strength characteristics; consequentlyshaft friction and end bearing support tend to increase from initial installation through aprocess termed “soil setup”. Essentially, the dynamics of driving piles will cause excesspore pressures to develop, thereby decreasing driving resistance during initial pileinstallation. The pile capacities developed during driving are usually much lower than thedesign values. Once driving is complete, the excess pore pressures dissipate with time(and soil setup occurs) and the bearing capacity of the pile increases. Based upon ourexperience with similar projects, 5 to 7 days is usually required for pore pressures todissipate and soil setup to occur.
For the reasons previously described, it will not be possible to confirm pile capacities witha simple driving criteria such as number of hammer blows per foot of advanced pile.Instead, driving criteria will likely consist of a target tip elevation and/or certain embeddedlength in a bearing material with specified driving resistance. The specified drivingresistance should be based on a Wave Equation Analysis of the contractor’s selectedhammer.
Table VI provides our recommended pile type for the structure’s foundations and slabs.The allowable capacity for the piles includes a safety factor of at least 2.0 to allow for apile load test program that relies primarily on dynamic testing. The capacity of a group ofpiles spaced at least 3 pile diameters apart, center to center, can be taken as the sum ofthe individual capacities with no reduction factor. If closer pile spacing is anticipated, thegeotechnical engineer should be contacted to evaluate the efficiency of the specific pilegroup. The order lengths and tip elevations will be adjusted based on the results of the testpiles and load test programs.
Table VI - SPPC Pile Recommendations
Pile Type Embedment Depth(1)
(ft.)Allowable Compression
Capacity (tons)Pre-Augering Depth
(ft)
12” SPPC 55-60 80-100 5-10(1) Below the base of slab elevation of 21 feet MSL.(2) Lateral capacity is based on one-half of the lateral load that produces a 1-inch lateral displacement (free-head
condition). Batter piles would enhance lateral capacity.
It is noted that some piles could potentially encounter driving refusal at shallower depths(medium dense Sand between roughly 15 and -5 feet MSL). We recommend pre-augering

Report of Subsurface Exploration and Geotechnical Engineering Services October 15, 2013Hopewell Regional Alternative 4A-1 Light Phase 2 PER (Primary Site) rev 10/23/2013Hopewell, VirginiaG E T Project No: WM13-136G
19
the pile locations prior to driving to the depth (below grade) shown in the table above. Thisis necessary to help in minimizing the effects of vibrations from the driving effort onadjacent buildings and to reduce the potential for pile breakage. Following the pre-augering, the piles should be installed and advanced by driving with an impact hammer totheir design tip elevations. If for some reason during construction, pile driving “capacity” isencountered before the piles reach their design tip elevations, the Geotechnical Engineershould be retained to review driving records and field reports to determine whether the pilecan adequately support the design loads. If the pile driving hammer is not properlymatched to the pile type, size and subsurface conditions, it may reach practical refusalbefore the pile reaches the design tip elevation, or the required capacity.
4.10.2 Pile Group Settlement
Based on the results of load tests performed on piles driven in similar soils conditions, it isanticipated that the total butt settlements (including elastic shortening) will not exceedabout ½-inch, which is the settlement necessary to mobilize the soil/pile capacity incombination with the pile group settlements due to the stress increase in the underlyingsoils.
4.10.3 Test Piles
We recommend that a test pile program be implemented for the purpose of assisting in thedevelopment of tip elevations and to confirm that the contractor’s equipment andinstallation methods are acceptable. The test program should involve at least ten (10) testpiles to provide an indication of various driving and/or installation conditions. The test pilelocations should be established by the Geotechnical Engineer based on the structuralcharacteristics. It is important to note the relationship between the required testing and ourdesign assumptions. We chose safety factors based upon the recommended pile testingprogram. We expect that the pile testing program will include primarily dynamic evaluationwith a Pile Driving Analyzer (PDA).
The piles should be driven using the drive system submitted by the contractor andapproved by the geotechnical engineer. Test pile lengths should be at least ten feet longerthan anticipated production pile lengths (i.e. 65-70 feet) to ensure that the requiredcapacity is developed, to allow for refinement of estimated capacities, and for dynamic andstatic testing reasons.
The indicator piles installed during the Test Pile Program, which satisfy the geotechnicalengineer’s requirements for proper installation, may also be used as permanent productionpiles.
The contractor should include in his equipment submittal a Wave Equation Analysis (usingGRLWEAPTM software) modeling the behavior of the test piles during driving, or what istermed a “Drivability Study.” The primary intent of the Wave Equation Analysis is toestimate the feasibility of the contractor’s proposed pile driving system with respect to

Report of Subsurface Exploration and Geotechnical Engineering Services October 15, 2013Hopewell Regional Alternative 4A-1 Light Phase 2 PER (Primary Site) rev 10/23/2013Hopewell, VirginiaG E T Project No: WM13-136G
20
installing the piles. Since the results of the Wave Equation Analyses are dependent on thechosen hammer, the pile type and length, and the subsurface conditions, it is likely that atleast one Wave Equation Analysis per hammer will be required.
Pile driving equipment should not be mobilized for the test piles until the Wave EquationAnalyses have been submitted and approved by the geotechnical engineer. If thecontractor’s proposed pile driving system is rejected, subsequent submittals of alternativedrive systems should also include appropriate Wave Equation Analyses that are subject tothe approval of the geotechnical engineer. The Wave Equation Analyses are also used toestimate:
§ Compressive and tensile stresses experienced by the modeled pile during driving§ The total number of blows required to install the pile§ Driving resistance (in terms of blows per foot) within the various soil strata the pile
is embedded in§ Driving time
The results of the WEAP analyses are highly dependent on the many input parametersrelated to the soil conditions, static pile capacity estimates, as well as specificcharacteristics associated with different makes and models of pile driving hammers.
4.10.4 Dynamic Testing
Dynamic testing was developed as a method of improving upon the reliability of the waveequation and other dynamic predictions by physically measuring the acceleration andstrain of a pile during driving. The use of dynamic pile testing has permitted the possibilityof checking the driving stresses in the pile and the hammer performance during piledriving. It is also possible to estimate the static capacity of the pile based upon the strainand acceleration measurements taken during pile driving.
The test pile installation should be monitored by the Geotechnical Engineer using the PDA,an electronic device that records driving stresses and pile/soil interactions, among otherthings. The PDA results will confirm that the pile driving system (hammer type/energy,cushion type/ thickness, etc.) can successfully install the piles without over stressing themin compression or tension. It is essential the test pile re-strikes be monitored with thePDA.
No sooner than 7 days after installation, all of the test piles should be re-struck while beingmonitored with the PDA. This test establishes the “static capacity” of the pile. The initialhammer blow during re-strike activities is critical to the quality of dynamic data with respectto capacity interpretation. The contractor should make every effort to insure an initial high-energy blow of the hammer. After several blows during re-strike activities, pore pressuresincrease, soil setup diminishes, and ultimately pile capacities (as recorded by the PDA)decrease. Loss of estimated static capacity following repeated hammer blows is the reasonthe initial blows are critical.
Report of Subsurface Exploration and Geotechnical Engineering Services October 15, 2013Hopewell Regional Alternative 4A-1 Light Phase 2 PER (Primary Site) rev 10/23/2013Hopewell, VirginiaG E T Project No: WM13-136G
21
The dynamic data recorded by the PDA during restrike testing should be further refined byusing CAPWAP® analysis. CAPWAP® analysis, not the initial assessment of capacitydetermined by the PDA, should be the basis of static pile capacity estimates.Interpretation of CAPWAP® data, in the context of the soils subsurface conditions andprevious static pile capacity estimates, should allow the Geotechnical Engineer to estimateultimate pile capacities and recommend appropriate production pile lengths.
Our previous experience with the PDA indicates that a significant cost savings may berealized if the PDA is properly utilized to monitor the installation of test piles, confirm pilecapacity in production installations, and monitor potentially damaging stresses duringdriving. The use of the PDA permits the confirmation of allowable compression and upliftcapacities and pile integrity on several piles for a cost similar to or less than that of asingle full-scale static load test. We recommended the owner retain the services of theGeotechnical Engineer to perform the dynamic testing, not the installation contractor, toavoid possible conflicts of interest.
4.10.5 Establishing Pile Driving Criteria
Prior to driving production piles, the geotechnical engineer should establish the criteria forpile installation. The criteria will be based on the data collected during monitoring of thetest pile installation and the subsequent re-striking. The intent of establishing drivingcriteria is to facilitate installation of the production piles without damage and to provide ameans of establishing when piles have achieved the design capacities. The driving criteriamay include: hammer type, hammer energy, ram weight, pile cushion and thickness,hammer cushion type and thickness, required tip elevations and driving resistancenecessary to achieve capacities, and possibly pre-drilling recommendations (if the test pileresults warrant the need).
4.10.6 Allowable Driving Stresses
Guidelines from the Pre-stressed Concrete Institute (PCI), American Society of CivilEngineers (ASCE), and the Association of State Highway Transportation Officials(AASHTO) indicate that maximum compressive stresses, imposed on driven precastconcrete piles during installation, should be less than the following equation: 0.85 x f’c(concrete compressive strength, psi) - fpe (effective pre-stressing after losses fromrelaxation). The three groups differ on the maximum tensile stresses. PCI recommends 6x square root of f‘c + fpe ; ASHTO and ASCE recommend 3 x square root f’c + fpe. Werecommend using the consensus value for the maximum compressive stress, and theASCE/AASHTO recommended value for the maximum tensile stress.
4.10.7 Hammer Types and Energies
In comparing hammers of equal energy, the Prestressed Concrete Institute (PCI) statesthat hammers with heavier rams and lower impact velocities are less likely to causedamaging stresses in concrete piles. Hammers with proportionally higher ram weights and

Report of Subsurface Exploration and Geotechnical Engineering Services October 15, 2013Hopewell Regional Alternative 4A-1 Light Phase 2 PER (Primary Site) rev 10/23/2013Hopewell, VirginiaG E T Project No: WM13-136G
22
short stroke heights (low impact velocities) are usually air, steam and hydraulic driven, andnot diesel fueled. It has been our experience that air, steam and hydraulic hammers aremore appropriate for the installation of precast concrete piles than similarly sized (in termsof energy) diesel hammers. We recommend that the contractor use an air, steam orhydraulic driven hammer whose ram weight is roughly equal to 0.5 to 1.0 times the weightof the pile itself. The actual determination of an acceptable ram weight should bedetermined through the results of the Test Pile Program. If the contractor elects to use adiesel hammer, we recommend a critical, detailed review of the contractor’s WaveEquation Analysis prior to driving the test piles.
4.10.8 Driven Pile Installation Monitoring
The geotechnical engineer should observe the installation of the test pile and allproduction piles. The purpose of the geotechnical engineer’s observations is to determineif production installations are being performed in accordance with the previously derivedPile Driving Criteria. Continuous driving and installation records should be maintained forall driven piles. Production piles should be driven utilizing the approved systemestablished as a result of the Test Program.
The field duties of the geotechnical engineer (or a qualified engineer’s representative)should include the following:
· Being knowledgeable of the subsurface conditions at the site and the project-specific Pile Driving Criteria.
· Being aware of aspects of the installation including type of pile driving equipmentand pile installation tolerances.
· Keeping an accurate record of pile installation and driving procedures.
· Documenting that the piles are installed to the proper depth indicative of theintended bearing stratum. Also documenting that appropriate pile splicingtechniques are used, if necessary.
· Recording the number of hammer blows for each foot of driving.
· Generally confirming that the pile driving equipment is operating as anticipated.
· Record the energy rating of the hammer.
· Informing the geotechnical engineer of any unusual subsurface conditions or drivingconditions.
· Notifying the owner and structural engineer when unanticipated difficulties orconditions are encountered.
Report of Subsurface Exploration and Geotechnical Engineering Services October 15, 2013Hopewell Regional Alternative 4A-1 Light Phase 2 PER (Primary Site) rev 10/23/2013Hopewell, VirginiaG E T Project No: WM13-136G
23
· Confirming from visual appearance that the piles are not damaged duringinstallation and observing the piles prior to installation for defective workmanship.The geotechnical engineer should review all driving records prior to pile capconstruction.
4.10.9 Adjacent Structures
When considering the suitability of a driven pile foundation, consideration should be givento the integrity of nearby structures. Due to the large amount of energy required to installdriven deep foundations, vibrations of considerable magnitude are generated. Thesevibrations may affect nearby structures. These structures can, due to their proximity, bedetrimentally affected by the construction unless proper protection measures are taken. Inaddition, experience has shown that these construction features will often lead to theconclusion that damage to adjacent property has taken place, even though none hasoccurred. It is therefore recommended that a thorough survey of the adjacent property bemade prior to starting construction. This will help to better evaluate real claims and refutegroundless nuisance claims. The survey should include, but not be limited to, the following:
1. Visually inspect adjacent structures, noting and measuring all cracks andother signs of distress. Take photographs as needed.
2. Visually inspect adjacent pavements, noting and measuring any significantcracks, depressions, etc. Take photographs as needed.
3. Establish several benchmarks along foundation walls on adjacent structures.Both vertical and horizontal control should be employed.
4. Determine if equipment in any adjacent building is sensitive to vibration, andif so, establish proper control and monitoring system.
4.11 Embankment Fill and Placement
Following the clearing operation, the placement of the fill required to establish the designgrades may begin. The embankments shall be constructed in accordance with Section 303of the 2007 VDOT Road and Bridge Specifications. Fill material shall conform to therequirements of AASHTO Standard M57. As such, fill materials classified as A-1, A-2-4, A-2-5 or A-3 can be used for embankment fill. Accordingly, suitable embankment fill materialmay consist of sand or gravel containing less than 35% by weight of fines (SP, SM, SC,SW, GP, GW), having a liquid limit less than 40 and Plastic Index (PI) less than 10, andshould be free of rubble, organics, clay, debris and other unsuitable material. Any materialto be used for embankment fill should be evaluated and tested by G E T Solutions, Inc.prior to placement to determine if they are suitable for the intended use.
All embankment fill should be tested in accordance with Section 303 of the 2007 VDOTRoad and Bridge Specifications and Section 314.01 of the VDOT Materials Division MOI,as stipulated in the Special Provisions for “Density Control of Embankments and Backfill”.

Report of Subsurface Exploration and Geotechnical Engineering Services October 15, 2013Hopewell Regional Alternative 4A-1 Light Phase 2 PER (Primary Site) rev 10/23/2013Hopewell, VirginiaG E T Project No: WM13-136G
24
The moisture content of the select fill should be within +/- 2% of the optimum moisturecontent at the time of placement. In general, the compaction should be accomplished byplacing the fill in maximum 8-inch loose lifts and mechanically compacting each lift to aminimum of 95% of the Standard Proctor maximum dry density. A qualified inspectorshould perform field density tests in accordance with Section 314.01 of the VDOTMaterials Division MOI to assure that adequate compaction is achieved. Care should beused when operating the compactors near existing structures to avoid transmission of thevibrations that could cause settlement damage or disturb occupants. In this regard, it isrecommended that the vibratory roller remain at least 25 feet away from existing structures(to include the existing water lines located adjacent to the west abutment); these areasshould be compacted with small, hand-operated compaction equipment.
4.12 Suitability of On-site Soils for Reuse as Embankment Fill
Based on the boring information it appears that the shallow subsurface SAND (SC, SM)soils located in the cut areas will be suitable for reuse. It is noted that these suitablematerials are typically located beneath a CLAY (CL, CH) and SILT (ML) cap with varyingthicknesses. As such, care should be taken during excavation in order to segregate thesuitable soils from the unsuitable soils (soils containing more than 35% by weight of fines)to prevent contamination. Soils located below the water table will be wet at the time ofexcavation and will need to dry prior to placement. Typical drying methods includestockpiling or placing the wet materials in thin lifts prior to compaction. The goal of thesemethods is to dry the soil to within +/- 2% of their optimum moisture at the time ofcompaction.
4.13 Embankment Stability Analysis
The stability analyses for the sloped embankments were conducted using the GeoStudiosoftware program SLOPE/W™ for limit-equilibrium modeling and analysis of SlopeStability. Circular and directional block potential failure surfaces were evaluated usingnumerous methods of analysis including Bishop, Spencer and Morgenstern-Price. The soilparameters used were estimated from the SPT boring data, the results of laboratoryclassification and strength testing, In-Situ Testing (CPT/DMT), and from our experiencewith typical materials for other projects. Stability analyses were performed on theembankment slopes at 3H:1V. Our slope stability analyses indicated that the slopedembankments will maintain a suitable performance when constructed at 3H:1V or flatter. Asummary of the slope stability analyses is tabulated below (Table VII). The comprehensiveslope stability analysis reports are provided in Appendix VIII.
Table VII - Summary of Slope Stability Analyses
Maximum Fill Height(ft)
Slope Dimensions(H:V)
Minimum Morgenstern-Price Factor of Safety
10-15 3:1 1.91
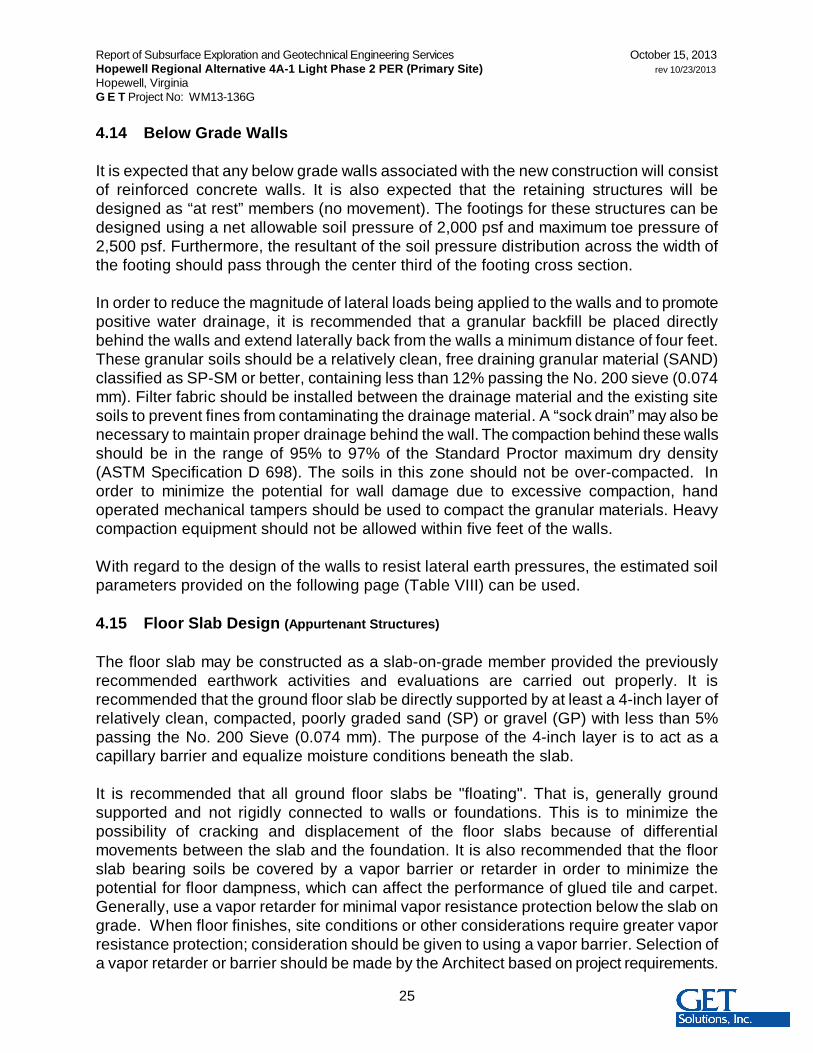
Report of Subsurface Exploration and Geotechnical Engineering Services October 15, 2013Hopewell Regional Alternative 4A-1 Light Phase 2 PER (Primary Site) rev 10/23/2013Hopewell, VirginiaG E T Project No: WM13-136G
25
4.14 Below Grade Walls
It is expected that any below grade walls associated with the new construction will consistof reinforced concrete walls. It is also expected that the retaining structures will bedesigned as “at rest” members (no movement). The footings for these structures can bedesigned using a net allowable soil pressure of 2,000 psf and maximum toe pressure of2,500 psf. Furthermore, the resultant of the soil pressure distribution across the width ofthe footing should pass through the center third of the footing cross section.
In order to reduce the magnitude of lateral loads being applied to the walls and to promotepositive water drainage, it is recommended that a granular backfill be placed directlybehind the walls and extend laterally back from the walls a minimum distance of four feet.These granular soils should be a relatively clean, free draining granular material (SAND)classified as SP-SM or better, containing less than 12% passing the No. 200 sieve (0.074mm). Filter fabric should be installed between the drainage material and the existing sitesoils to prevent fines from contaminating the drainage material. A “sock drain” may also benecessary to maintain proper drainage behind the wall. The compaction behind these wallsshould be in the range of 95% to 97% of the Standard Proctor maximum dry density(ASTM Specification D 698). The soils in this zone should not be over-compacted. Inorder to minimize the potential for wall damage due to excessive compaction, handoperated mechanical tampers should be used to compact the granular materials. Heavycompaction equipment should not be allowed within five feet of the walls.
With regard to the design of the walls to resist lateral earth pressures, the estimated soilparameters provided on the following page (Table VIII) can be used.
4.15 Floor Slab Design (Appurtenant Structures)
The floor slab may be constructed as a slab-on-grade member provided the previouslyrecommended earthwork activities and evaluations are carried out properly. It isrecommended that the ground floor slab be directly supported by at least a 4-inch layer ofrelatively clean, compacted, poorly graded sand (SP) or gravel (GP) with less than 5%passing the No. 200 Sieve (0.074 mm). The purpose of the 4-inch layer is to act as acapillary barrier and equalize moisture conditions beneath the slab.
It is recommended that all ground floor slabs be "floating". That is, generally groundsupported and not rigidly connected to walls or foundations. This is to minimize thepossibility of cracking and displacement of the floor slabs because of differentialmovements between the slab and the foundation. It is also recommended that the floorslab bearing soils be covered by a vapor barrier or retarder in order to minimize thepotential for floor dampness, which can affect the performance of glued tile and carpet.Generally, use a vapor retarder for minimal vapor resistance protection below the slab ongrade. When floor finishes, site conditions or other considerations require greater vaporresistance protection; consideration should be given to using a vapor barrier. Selection ofa vapor retarder or barrier should be made by the Architect based on project requirements.

Report of Subsurface Exploration and Geotechnical Engineering Services October 15, 2013Hopewell Regional Alternative 4A-1 Light Phase 2 PER (Primary Site) rev 10/23/2013Hopewell, VirginiaG E T Project No: WM13-136G
26
Table VIII - Below Grade Soil Parameters (Borings M-1 through M-3)
Soil Type Structural Fill(SM, SP-SM, SP)
CLAY(CL, CH)
SAND(SM, SP, SP-SM)
CLAY(CL, CH)
SAND(SM, SP, SP-SM)
Average SPT N-Value - 18 17 7 19
Depth (feet) - 0 to7.5-8
7.5-8to
18-28
18-28to
24-33
24-33to
30-50
Elevation (feet MSL) -15 to 20
-7.5 to 12
7.5 to 12-
-3 to -8
-3 to -8-
-9 to -13
-9 to -13-
-15 to -30Total Moist Unit Weight
(pcf) 115 115 125 105 115
Total Saturated Unit Weight(pcf) 125 125 135 117 135
Total Buoyant Unit Weight(pcf) 63 63 73 55 73
Friction Angle (f)degrees 34 0 38 0 36
Cohesion (c)pcf 0 2500 0 1000 0
Active Soil Pressure, Ka 0.28 0.84 0.24 0.82 0.26At-Rest Soil Pressure, Ko 0.44 1.1 0.38 1.0 0.41Passive Soil Pressure, Kp 3.5 1.2 4.2 1.2 3.8
Seismic Active LateralEarth Pressure*Kae (uniform)
0.43 0.99 0.39 0.97 0.41
Seismic Passive LateralEarth Pressure*Kae (uniform)
3.925 1.625 4.625 1.625 4.225
Modulus of SubgradeReaction (pci)(1) 130 105 - - -
*Estimated Values - Values will vary depending upon design acceleration events and type of construction.(1) – Shallow influence, small-strain behavior
4.16 Seismic Evaluation
On the basis of the results of the soil test borings drilled at this site (65 feet maximumexplored depth) and our experience in the project area, it is our opinion that this site shouldbe considered a Site Class “D” in accordance with Table 20.3-1 Site Classification of theASCE 7-10 Minimum Design Loads for Buildings and Other Structures, Chapter 20(referenced in the 2012 IBC). However, the seismic evaluation requires soils informationassociated with the upper 100 feet. If the site classification is critical to the structural designit will be necessary to perform a 100-foot deep CPT boring with shear wave velocity testingto substantiate the site classification.

Report of Subsurface Exploration and Geotechnical Engineering Services October 15, 2013Hopewell Regional Alternative 4A-1 Light Phase 2 PER (Primary Site) rev 10/23/2013Hopewell, VirginiaG E T Project No: WM13-136G
27
5.0 CONSTRUCTION CONSIDERATIONS
5.1 Drainage and Groundwater Concerns
It is expected that dewatering may be required for excavations that extend near or belowthe existing groundwater table. Dewatering above the groundwater level could probablybe accomplished by pumping from sumps. Dewatering at depths below the groundwaterlevel may require well pointing.
It would be advantageous to construct all fills early in the construction. If this is notaccomplished, disturbance of the existing site drainage could result in collection of surfacewater in some areas, thus rendering these areas wet and very loose. Temporary drainageditches should be employed by the contractor to accentuate drainage during construction.
5.2 Site Utility Installation
The base of the utility trenches should be observed by a qualified inspector prior to thepipe and structure placement to verify the suitability of the bearing soils. Based on theresults of our field exploration program it is expected that the utilities and structureslocated at depths greater than 2 to 13 feet MSL will bear in the wet, loose/softgranular/cohesive soils. In these instances the bearing soils will likely require somestabilization to provide suitable bedding. This stabilization is typically accomplished byproviding additional VDOT No. 57 stone bedding (typically 12 to 24 inches). In addition,depending on the depth of the utility trench excavation, some means of dewatering may berequired to facilitate the utility installation and associated backfilling.
The resulting excavations should be backfilled with structural fill, as described in Section4.3 of this report. The subsurface soils encountered at the boring locations did not appearto meet the criteria recommended in this report for reuse as structural fill. As such,imported fill may be required to backfill utility excavations within the building areas.
5.3 Excavations
In Federal Register, Volume 54, No. 209 (October, 1989), the United States Department ofLabor, Occupational Safety and Health Administration (OSHA) amended its “ConstructionStandards for Excavations, 29 CFR, part 1926, Subpart P”. This document was issued tobetter insure the safety of workmen entering trenches or excavations. It is mandated bythis federal regulation that all excavations, whether they be utility trenches, basementexcavation or footing excavations, be constructed in accordance with the new (OSHA)guidelines. It is our understanding that these regulations are being strictly enforced and ifthey are not closely followed, the owner and the contractor could be liable for substantialpenalties.
The contractor is solely responsible for designing and constructing stable, temporaryexcavations and should shore, slope, or bench the sides of the excavations as required tomaintain stability of both the excavation sides and bottom. The contractor’s responsibleperson, as defined in 29 CFR Part 1926, should evaluate the soil exposed in the

Report of Subsurface Exploration and Geotechnical Engineering Services October 15, 2013Hopewell Regional Alternative 4A-1 Light Phase 2 PER (Primary Site) rev 10/23/2013Hopewell, VirginiaG E T Project No: WM13-136G
28
excavations as part of the contractor’s safety procedures. In no case should slope height,slope inclination, or excavation depth, including utility trench excavation depth, exceedthose specified in local, state, and federal safety regulations.
We are providing this information solely as a service to our client. G E T Solutions, Inc. isnot assuming responsibility for construction site safety or the contractor’s activities; suchresponsibility is not being implied and should not be inferred.
6.0 REPORT LIMITATIONS
The recommendations submitted are based on the available soil information obtained byG E T Solutions, Inc. and the information supplied by the client and their consultants forthe proposed project. If there are any revisions to the plans for this project or if deviationsfrom the subsurface conditions noted in this report are encountered during construction,G E T Solutions, Inc. should be notified immediately to determine if changes in thefoundation recommendations are required. If G E T Solutions, Inc. is not retained toperform these functions, G E T Solutions, Inc. can not be responsible for the impact ofthose conditions on the geotechnical recommendations for the project.
The Geotechnical Engineer warrants that the findings, recommendations, specifications orprofessional advice contained herein have been made in accordance with generallyaccepted professional geotechnical engineering practices in the local area. No otherwarranties are implied or expressed.
After the plans and specifications are more complete the Geotechnical Engineer should beprovided the opportunity to review the final design plans and specifications to assure ourengineering recommendations have been properly incorporated into the designdocuments, in order that the earthwork and foundation recommendations may be properlyinterpreted and implemented. At that time, it may be necessary to submit supplementaryrecommendations. This report has been prepared for the exclusive use of HDREngineering, Inc. and their consultants for the specific application to the proposedHopewell Regional Alternative 4A-1 Light Phase 2 PER project in Hopewell, Virginia.

APPENDICES
I BORING LOCATION PLAN
II SUMMARY OF SOIL CLASSIFICATION
III BORING LOGS
IV GENERALIZED SOIL PROFILE
V CONSOLIDATION TEST RESULTS
VI TRIAXIAL COMPRESSION TEST RESULTS
VII STRESS-DEFORMATION FINITE ELEMENT ANALYSIS RESULTS
VIII SLOPE STABILITY ANALYSIS RESULTS
IX CPT/DMT TEST RESULTS

APPENDIX I
BORING LOCATION PLAN

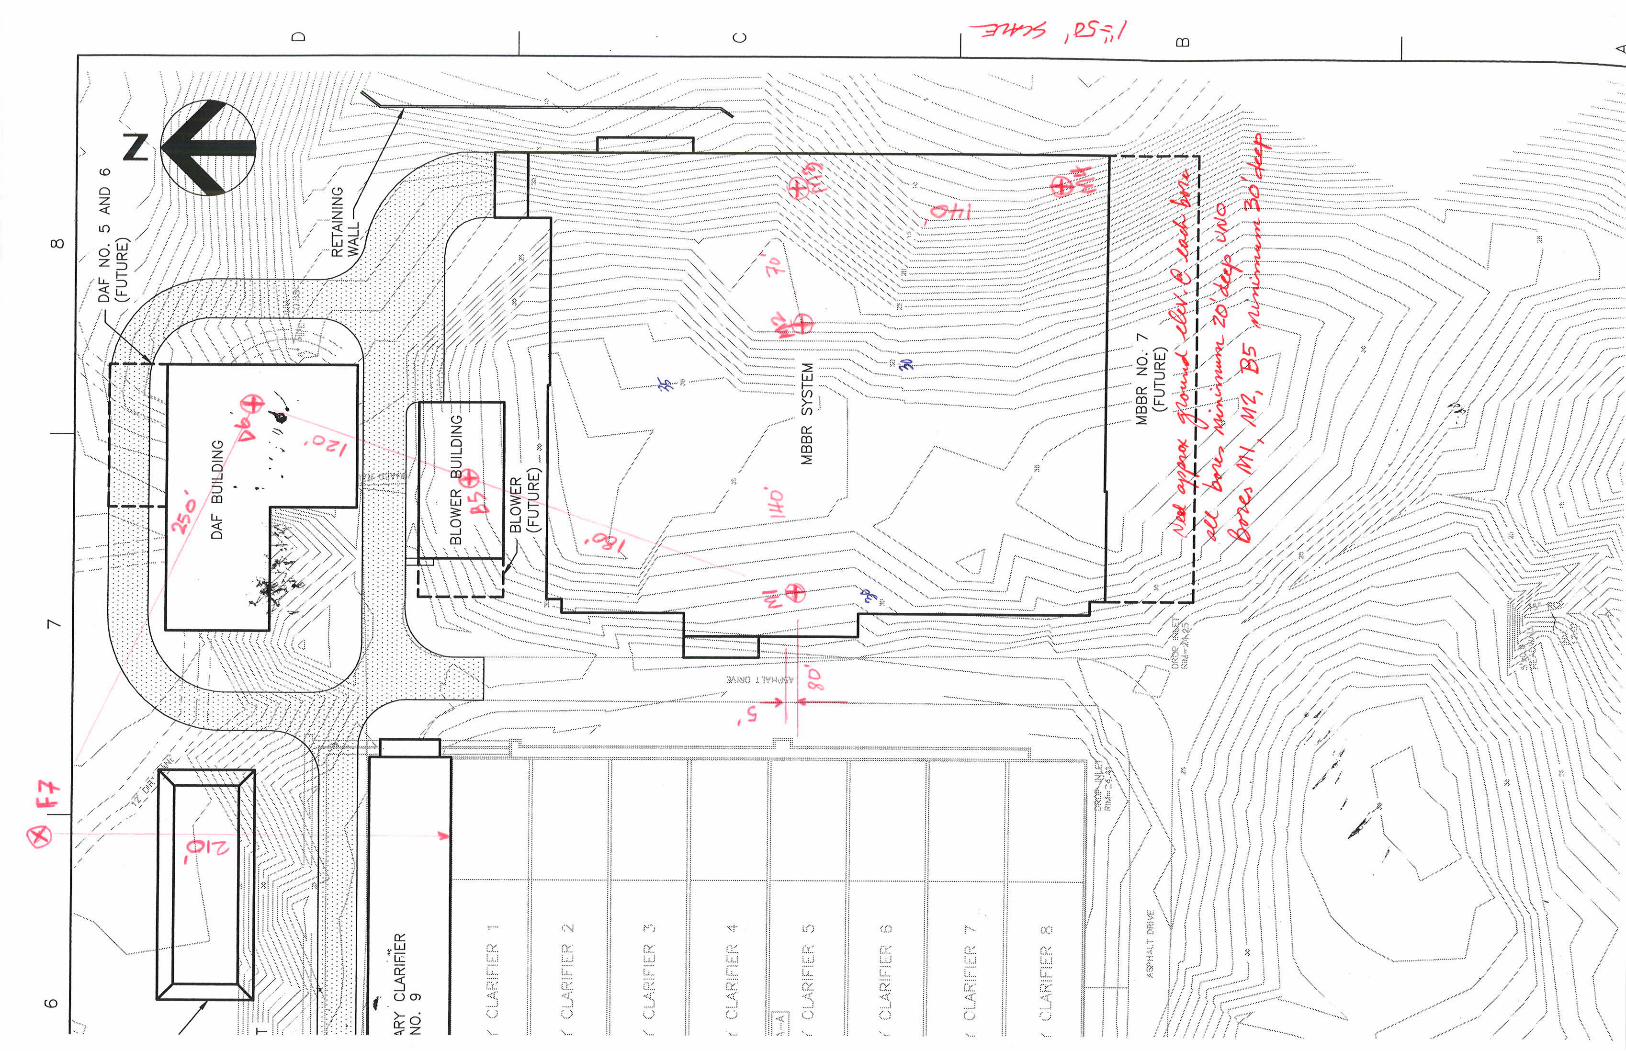

APPENDIX II
SUMMARY OF SOIL CLASSIFICATION
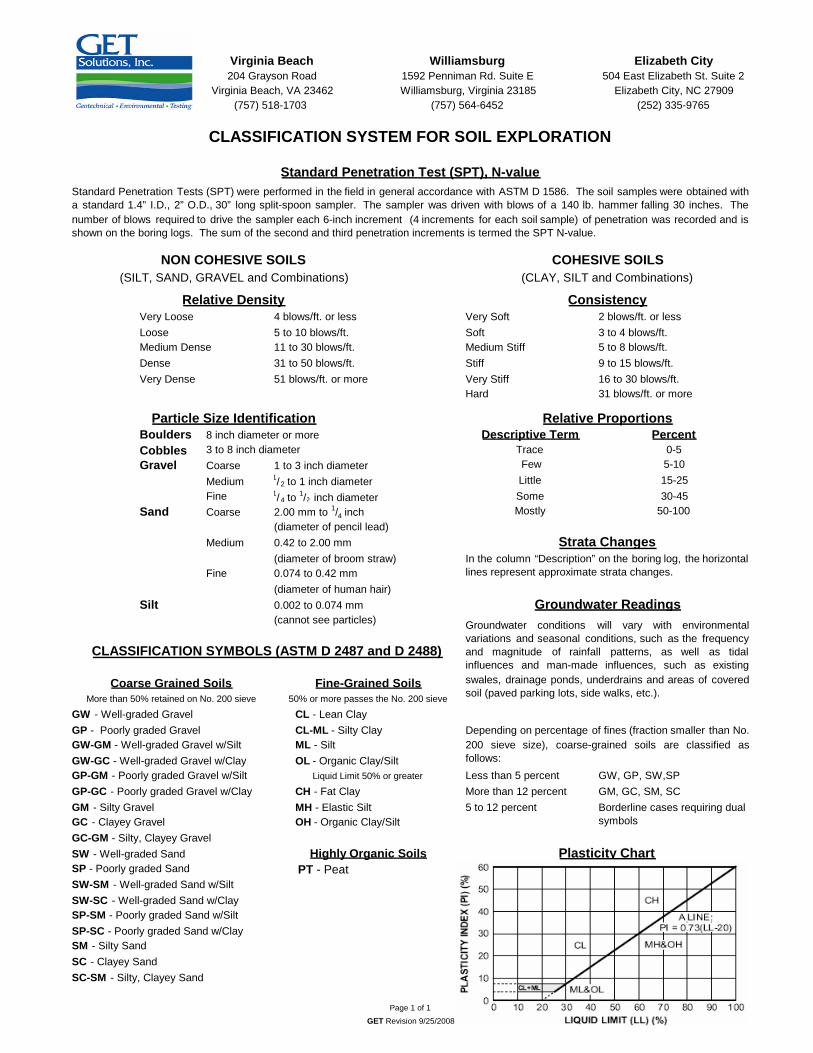
Very Loose 4 blows/ft. or less Very Soft 2 blows/ft. or lessLoose 5 to 10 blows/ft. Soft 3 to 4 blows/ft.Medium Dense 11 to 30 blows/ft. Medium Stiff 5 to 8 blows/ft.Dense 31 to 50 blows/ft. Stiff 9 to 15 blows/ft.Very Dense 51 blows/ft. or more Very Stiff 16 to 30 blows/ft.
Hard 31 blows/ft. or more
Boulders 8 inch diameter or moreCobbles 3 to 8 inch diameterGravel Coarse 1 to 3 inch diameter
Medium 1/2 to 1 inch diameterFine 1/4 to 1/2 inch diameter
Sand Coarse 2.00 mm to 1/4 inch(diameter of pencil lead)
Medium 0.42 to 2.00 mm(diameter of broom straw)
Fine 0.074 to 0.42 mm(diameter of human hair)
Silt 0.002 to 0.074 mm(cannot see particles)
GW - Well-graded Gravel CL - Lean ClayGP - Poorly graded Gravel CL-ML - Silty ClayGW-GM - Well-graded Gravel w/Silt ML - SiltGW-GC - Well-graded Gravel w/Clay OL - Organic Clay/SiltGP-GM - Poorly graded Gravel w/Silt Less than 5 percent GW, GP, SW,SPGP-GC - Poorly graded Gravel w/Clay CH - Fat Clay More than 12 percent GM, GC, SM, SCGM - Silty Gravel MH - Elastic Silt 5 to 12 percentGC - Clayey Gravel OH - Organic Clay/SiltGC-GM - Silty, Clayey GravelSW - Well-graded SandSP - Poorly graded Sand PT - PeatSW-SM - Well-graded Sand w/SiltSW-SC - Well-graded Sand w/ClaySP-SM - Poorly graded Sand w/SiltSP-SC - Poorly graded Sand w/ClaySM - Silty SandSC - Clayey SandSC-SM - Silty, Clayey Sand
CLASSIFICATION SYMBOLS (ASTM D 2487 and D 2488)
More than 50% retained on No. 200 sieve
Groundwater conditions will vary with environmentalvariations and seasonal conditions, such as the frequencyand magnitude of rainfall patterns, as well as tidalinfluences and man-made influences, such as existingswales, drainage ponds, underdrains and areas of coveredsoil (paved parking lots, side walks, etc.).
50-100
Depending on percentage of fines (fraction smaller than No.200 sieve size), coarse-grained soils are classified asfollows:
Borderline cases requiring dualsymbols
Plasticity Chart
Strata ChangesIn the column “Description” on the boring log, the horizontallines represent approximate strata changes.
Groundwater Readings
Relative ProportionsDescriptive Term Percent
15-2530-45
FewLittleSomeMostly
0-55-10
Virginia Beach204 Grayson Road
Virginia Beach, VA 23462(757) 518-1703 (757) 564-6452
Elizabeth City504 East Elizabeth St. Suite 2
Elizabeth City, NC 27909(252) 335-9765
Williamsburg1592 Penniman Rd. Suite EWilliamsburg, Virginia 23185
CLASSIFICATION SYSTEM FOR SOIL EXPLORATION
Standard Penetration Test (SPT), N-value
Relative Density
NON COHESIVE SOILS(SILT, SAND, GRAVEL and Combinations)
Standard Penetration Tests (SPT) were performed in the field in general accordance with ASTM D 1586. The soil samples were obtained witha standard 1.4” I.D., 2” O.D., 30” long split-spoon sampler. The sampler was driven with blows of a 140 lb. hammer falling 30 inches. Thenumber of blows required to drive the sampler each 6-inch increment (4 increments for each soil sample) of penetration was recorded and isshown on the boring logs. The sum of the second and third penetration increments is termed the SPT N-value.
COHESIVE SOILS(CLAY, SILT and Combinations)
Particle Size Identification
Consistency
Page 1 of 1
GET Revision 9/25/2008
Coarse Grained Soils Fine-Grained Soils
Highly Organic Soils
50% or more passes the No. 200 sieve
Liquid Limit 50% or greater
Trace

APPENDIX III
BORING LOGS
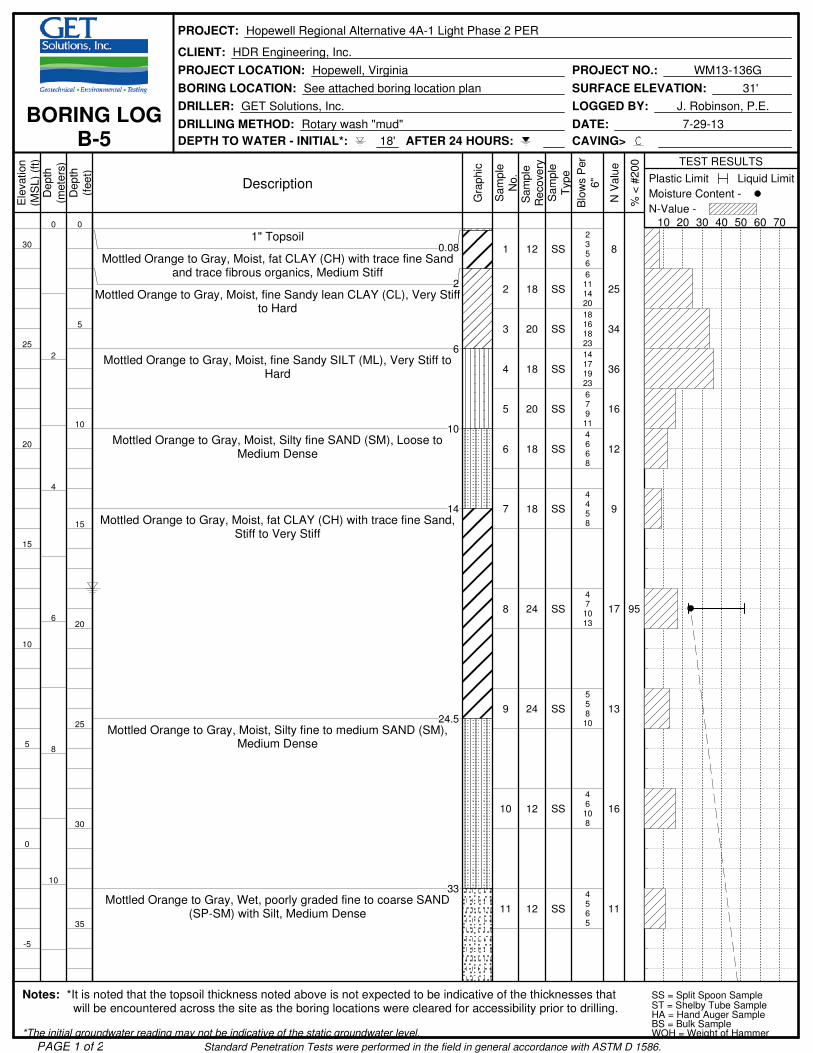
30
25
20
15
10
5
0
-5
0
2
4
6
8
10
0
5
10
15
20
25
30
35
1" Topsoil0.08
Mottled Orange to Gray, Moist, fat CLAY (CH) with trace fine Sandand trace fibrous organics, Medium Stiff
2Mottled Orange to Gray, Moist, fine Sandy lean CLAY (CL), Very Stiff
to Hard
6Mottled Orange to Gray, Moist, fine Sandy SILT (ML), Very Stiff to
Hard
10Mottled Orange to Gray, Moist, Silty fine SAND (SM), Loose to
Medium Dense
14Mottled Orange to Gray, Moist, fat CLAY (CH) with trace fine Sand,
Stiff to Very Stiff
24.5Mottled Orange to Gray, Moist, Silty fine to medium SAND (SM),
Medium Dense
33Mottled Orange to Gray, Wet, poorly graded fine to coarse SAND
(SP-SM) with Silt, Medium Dense
1
2
3
4
5
6
7
8
9
10
11
12
18
20
18
20
18
18
24
24
12
12
SS
SS
SS
SS
SS
SS
SS
SS
SS
SS
SS
2356
6111420
18161823
14171923
67911
4668
4458
471013
55810
46108
4565
8
25
34
36
16
12
9
17
13
16
11
95
PROJECT: Hopewell Regional Alternative 4A-1 Light Phase 2 PER
CLIENT: HDR Engineering, Inc.
PROJECT LOCATION: Hopewell, Virginia PROJECT NO.: WM13-136G
BORING LOCATION: See attached boring location plan SURFACE ELEVATION: 31'
BORING LOG
B-5
DRILLER: GET Solutions, Inc. LOGGED BY: J. Robinson, P.E.
DRILLING METHOD: Rotary wash "mud" DATE: 7-29-13
DEPTH TO WATER - INITIAL*: 18' AFTER 24 HOURS: CAVING>
Notes: *It is noted that the topsoil thickness noted above is not expected to be indicative of the thicknesses that will be encountered across the site as the boring locations were cleared for accessibility prior to drilling.
SS = Split Spoon SampleST = Shelby Tube SampleHA = Hand Auger SampleBS = Bulk Sample
*The initial groundwater reading may not be indicative of the static groundwater level. WOH = Weight of Hammer
Ele
vation
(MS
L)
(ft)
Depth
(mete
rs)
Depth
(feet)
Description
Gra
phic
Sam
ple
No.
Sam
ple
Recovery
Sam
ple
Type
Blo
ws P
er
6"
N V
alu
e
% <
#200 TEST RESULTS
10 20 30 40 50 60 70
N-Value -
Moisture Content -
Plastic Limit Liquid Limit
Standard Penetration Tests were performed in the field in general accordance with ASTM D 1586.PAGE 1 of 2
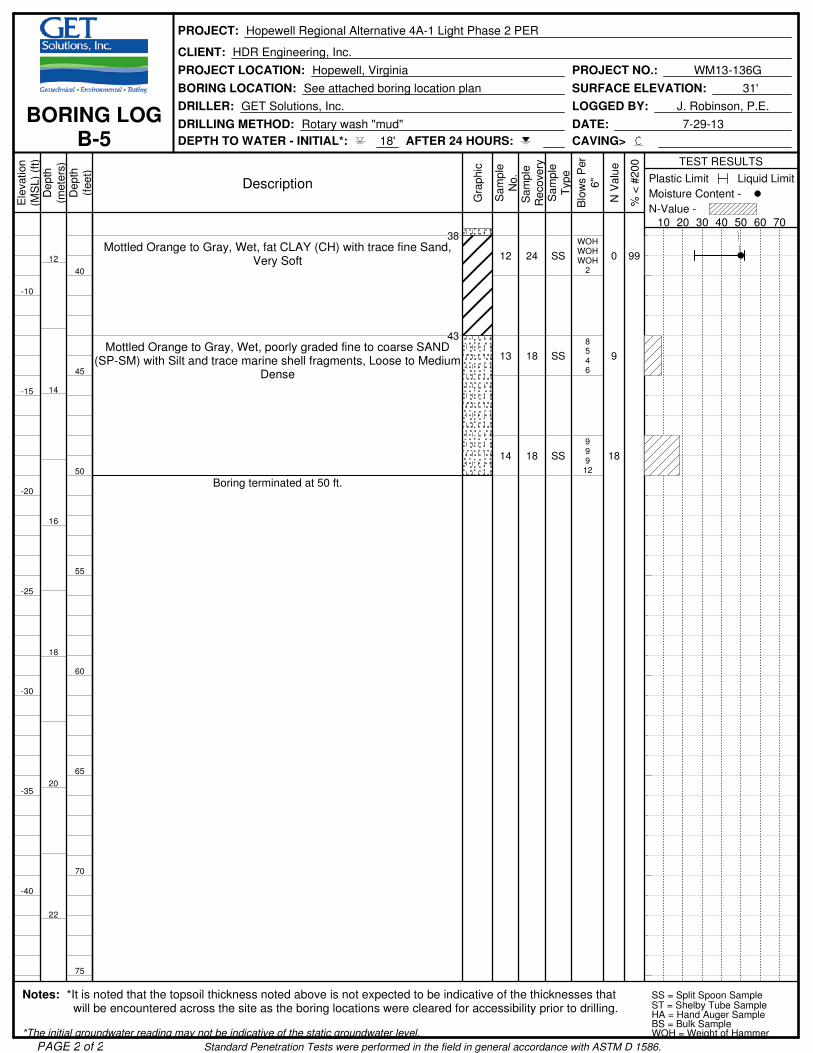
-10
-15
-20
-25
-30
-35
-40
12
14
16
18
20
22
40
45
50
55
60
65
70
75
38Mottled Orange to Gray, Wet, fat CLAY (CH) with trace fine Sand,
Very Soft
43Mottled Orange to Gray, Wet, poorly graded fine to coarse SAND
(SP-SM) with Silt and trace marine shell fragments, Loose to MediumDense
Boring terminated at 50 ft.
12
13
14
24
18
18
SS
SS
SS
WOHWOHWOH
2
8546
99912
0
9
18
99
PROJECT: Hopewell Regional Alternative 4A-1 Light Phase 2 PER
CLIENT: HDR Engineering, Inc.
PROJECT LOCATION: Hopewell, Virginia PROJECT NO.: WM13-136G
BORING LOCATION: See attached boring location plan SURFACE ELEVATION: 31'
BORING LOG
B-5
DRILLER: GET Solutions, Inc. LOGGED BY: J. Robinson, P.E.
DRILLING METHOD: Rotary wash "mud" DATE: 7-29-13
DEPTH TO WATER - INITIAL*: 18' AFTER 24 HOURS: CAVING>
Notes: *It is noted that the topsoil thickness noted above is not expected to be indicative of the thicknesses that will be encountered across the site as the boring locations were cleared for accessibility prior to drilling.
SS = Split Spoon SampleST = Shelby Tube SampleHA = Hand Auger SampleBS = Bulk Sample
*The initial groundwater reading may not be indicative of the static groundwater level. WOH = Weight of Hammer
Ele
vation
(MS
L)
(ft)
Depth
(mete
rs)
Depth
(feet)
Description
Gra
phic
Sam
ple
No.
Sam
ple
Recovery
Sam
ple
Type
Blo
ws P
er
6"
N V
alu
e
% <
#200 TEST RESULTS
10 20 30 40 50 60 70
N-Value -
Moisture Content -
Plastic Limit Liquid Limit
Standard Penetration Tests were performed in the field in general accordance with ASTM D 1586.PAGE 2 of 2

35
30
25
20
15
10
5
0
0
2
4
6
8
10
0
5
10
15
20
25
30
35
3" Topsoil0.25
Mottled Orange to Gray, Moist, lean CLAY (CL) with trace to little fineSand, Medium Stiff to Stiff
4Mottled Orange to Gray, Moist, Clayey fine to medium SAND (SC),
Medium Dense
8Mottled Orange to Gray, Moist, fat CLAY (CH) with trace fine Sand,
Very Stiff
14Mottled Orange to Gray, Moist, Silty fine SAND (SM), Medium Dense
23Mottled Orange to Gray, Wet, poorly graded fine to coarse SAND
(SP-SM) with Silt, Medium Dense
Boring terminated at 25 ft.
1
2
3
4
5
6
7
8
9
18
20
20
24
24
24
24
24
12
SS
SS
SS
SS
SS
SS
SS
SS
SS
3433
4566
7787
891110
371114
461114
691114
55810
6566
7
11
15
20
18
17
20
13
11
98
PROJECT: Hopewell Regional Alternative 4A-1 Light Phase 2 PER
CLIENT: HDR Engineering, Inc.
PROJECT LOCATION: Hopewell, Virginia PROJECT NO.: WM13-136G
BORING LOCATION: See attached boring location plan SURFACE ELEVATION: 35'
BORING LOG
D-6
DRILLER: GET Solutions, Inc. LOGGED BY: J. Robinson, P.E.
DRILLING METHOD: Rotary wash "mud" DATE: 7-29-13
DEPTH TO WATER - INITIAL*: 23' AFTER 24 HOURS: CAVING>
Notes: *It is noted that the topsoil thickness noted above is not expected to be indicative of the thicknesses that will be encountered across the site as the boring locations were cleared for accessibility prior to drilling.
SS = Split Spoon SampleST = Shelby Tube SampleHA = Hand Auger SampleBS = Bulk Sample
*The initial groundwater reading may not be indicative of the static groundwater level. WOH = Weight of Hammer
Ele
vation
(MS
L)
(ft)
Depth
(mete
rs)
Depth
(feet)
Description
Gra
phic
Sam
ple
No.
Sam
ple
Recovery
Sam
ple
Type
Blo
ws P
er
6"
N V
alu
e
% <
#200 TEST RESULTS
10 20 30 40 50 60 70
N-Value -
Moisture Content -
Plastic Limit Liquid Limit
Standard Penetration Tests were performed in the field in general accordance with ASTM D 1586.PAGE 1 of 1

30
25
20
15
10
5
0
-5
0
2
4
6
8
10
0
5
10
15
20
25
30
35
1" Topsoil0.08
Mottled Orange to Gray, Moist, lean CLAY (CL) with trace fine Sand,Medium Stiff
2Mottled Orange to Gray, Moist, fat CLAY (CH) with trace fine Sand,
Stiff to Hard
10Mottled Orange to Gray, Moist, poorly graded fine SAND (SP-SM)
with Silt, Loose
13Mottled Orange to Gray, Moist, Silty fine to medium SAND (SM),
Medium Dense
23Mottled Orange to Gray, Moist, fat CLAY (CH) with trace fine Sand,
Stiff
Boring terminated at 25 ft.
1
2
3
4
5
6
7
8
9
18
12
15
12
24
24
24
18
24
SS
SS
SS
SS
SS
SS
SS
SS
SS
2345
67810
10121515
13161720
581113
3467
46710
6889
56810
7
15
27
33
19
10
13
16
14
7
PROJECT: Hopewell Regional Alternative 4A-1 Light Phase 2 PER
CLIENT: HDR Engineering, Inc.
PROJECT LOCATION: Hopewell, Virginia PROJECT NO.: WM13-136G
BORING LOCATION: See attached boring location plan SURFACE ELEVATION: 31'
BORING LOG
F-7
DRILLER: GET Solutions, Inc. LOGGED BY: J. Robinson, P.E.
DRILLING METHOD: Rotary wash "mud" DATE: 7-29-13
DEPTH TO WATER - INITIAL*: N/A AFTER 24 HOURS: CAVING>
Notes: *It is noted that the topsoil thickness noted above is not expected to be indicative of the thicknesses that will be encountered across the site as the boring locations were cleared for accessibility prior to drilling.
SS = Split Spoon SampleST = Shelby Tube SampleHA = Hand Auger SampleBS = Bulk Sample
*The initial groundwater reading may not be indicative of the static groundwater level. WOH = Weight of Hammer
Ele
vation
(MS
L)
(ft)
Depth
(mete
rs)
Depth
(feet)
Description
Gra
phic
Sam
ple
No.
Sam
ple
Recovery
Sam
ple
Type
Blo
ws P
er
6"
N V
alu
e
% <
#200 TEST RESULTS
10 20 30 40 50 60 70
N-Value -
Moisture Content -
Plastic Limit Liquid Limit
Standard Penetration Tests were performed in the field in general accordance with ASTM D 1586.PAGE 1 of 1
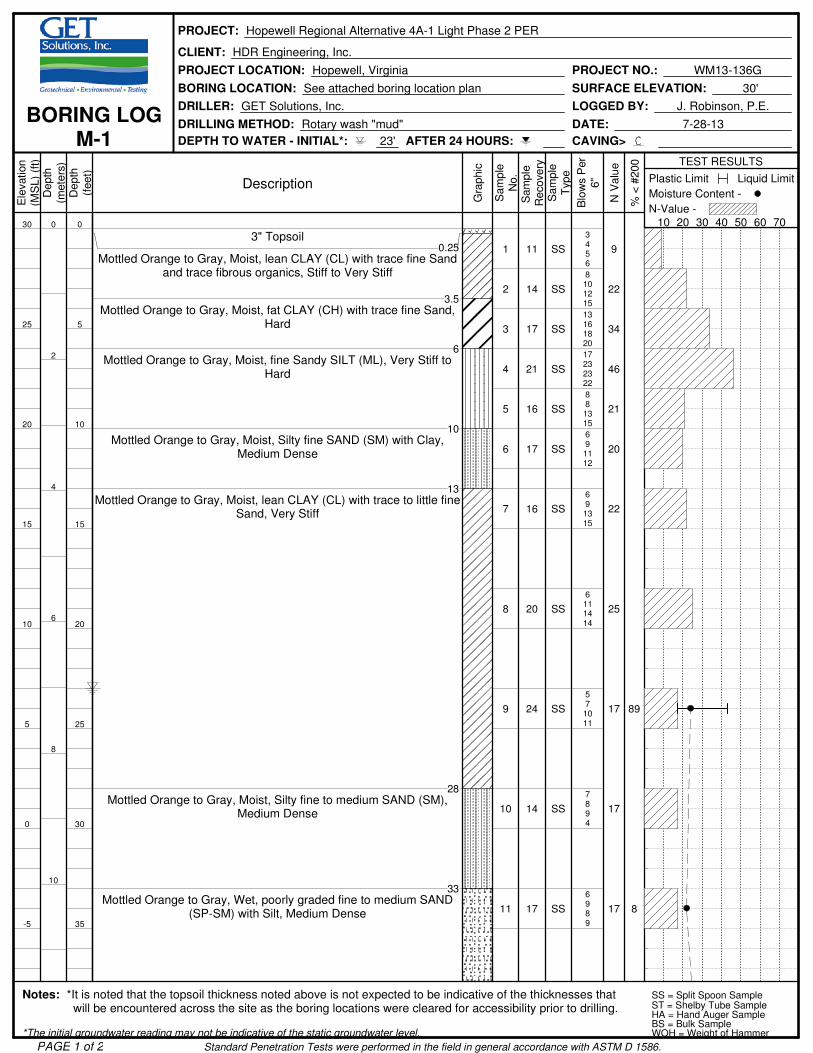
30
25
20
15
10
5
0
-5
0
2
4
6
8
10
0
5
10
15
20
25
30
35
3" Topsoil0.25
Mottled Orange to Gray, Moist, lean CLAY (CL) with trace fine Sandand trace fibrous organics, Stiff to Very Stiff
3.5Mottled Orange to Gray, Moist, fat CLAY (CH) with trace fine Sand,
Hard
6Mottled Orange to Gray, Moist, fine Sandy SILT (ML), Very Stiff to
Hard
10Mottled Orange to Gray, Moist, Silty fine SAND (SM) with Clay,
Medium Dense
13Mottled Orange to Gray, Moist, lean CLAY (CL) with trace to little fine
Sand, Very Stiff
28Mottled Orange to Gray, Moist, Silty fine to medium SAND (SM),
Medium Dense
33Mottled Orange to Gray, Wet, poorly graded fine to medium SAND
(SP-SM) with Silt, Medium Dense
1
2
3
4
5
6
7
8
9
10
11
11
14
17
21
16
17
16
20
24
14
17
SS
SS
SS
SS
SS
SS
SS
SS
SS
SS
SS
3456
8101215
13161820
17232322
881315
691112
691315
6111414
571011
7894
6989
9
22
34
46
21
20
22
25
17
17
17
89
8
PROJECT: Hopewell Regional Alternative 4A-1 Light Phase 2 PER
CLIENT: HDR Engineering, Inc.
PROJECT LOCATION: Hopewell, Virginia PROJECT NO.: WM13-136G
BORING LOCATION: See attached boring location plan SURFACE ELEVATION: 30'
BORING LOG
M-1
DRILLER: GET Solutions, Inc. LOGGED BY: J. Robinson, P.E.
DRILLING METHOD: Rotary wash "mud" DATE: 7-28-13
DEPTH TO WATER - INITIAL*: 23' AFTER 24 HOURS: CAVING>
Notes: *It is noted that the topsoil thickness noted above is not expected to be indicative of the thicknesses that will be encountered across the site as the boring locations were cleared for accessibility prior to drilling.
SS = Split Spoon SampleST = Shelby Tube SampleHA = Hand Auger SampleBS = Bulk Sample
*The initial groundwater reading may not be indicative of the static groundwater level. WOH = Weight of Hammer
Ele
vation
(MS
L)
(ft)
Depth
(mete
rs)
Depth
(feet)
Description
Gra
phic
Sam
ple
No.
Sam
ple
Recovery
Sam
ple
Type
Blo
ws P
er
6"
N V
alu
e
% <
#200 TEST RESULTS
10 20 30 40 50 60 70
N-Value -
Moisture Content -
Plastic Limit Liquid Limit
Standard Penetration Tests were performed in the field in general accordance with ASTM D 1586.PAGE 1 of 2

-10
-15
-20
-25
-30
-35
-40
-45
12
14
16
18
20
22
40
45
50
55
60
65
70
75
38Mottled Orange to Gray, Wet, fine Sandy lean CLAY (CL), Very Soft
to Soft
48Mottled Orange to Gray, Wet, Silty fine to SAND (SM), Medium
Dense
53Mottled Orange to Gray, Wet, fat CLAY (CH) with trace fine Sand,
Medium Stiff
58Mottled Orange to Gray, Wet, poorly graded fine to coarse SAND
(SP-SM) with Silt, Loose
63Greenish Gray, Wet, Silty fine to medium SAND (SM) with trace Clay,
trace marine shell fragments and cemented Sand, Dense
Boring terminated at 65 ft.
12
13
14
15
16
17
24
24
20
24
9
24
SS
SS
SS
SS
SS
SS
WOHWOHWOH
1
WOHWOH
33
34910
4343
3555
19232014
0
3
13
7
10
43
60
PROJECT: Hopewell Regional Alternative 4A-1 Light Phase 2 PER
CLIENT: HDR Engineering, Inc.
PROJECT LOCATION: Hopewell, Virginia PROJECT NO.: WM13-136G
BORING LOCATION: See attached boring location plan SURFACE ELEVATION: 30'
BORING LOG
M-1
DRILLER: GET Solutions, Inc. LOGGED BY: J. Robinson, P.E.
DRILLING METHOD: Rotary wash "mud" DATE: 7-28-13
DEPTH TO WATER - INITIAL*: 23' AFTER 24 HOURS: CAVING>
Notes: *It is noted that the topsoil thickness noted above is not expected to be indicative of the thicknesses that will be encountered across the site as the boring locations were cleared for accessibility prior to drilling.
SS = Split Spoon SampleST = Shelby Tube SampleHA = Hand Auger SampleBS = Bulk Sample
*The initial groundwater reading may not be indicative of the static groundwater level. WOH = Weight of Hammer
Ele
vation
(MS
L)
(ft)
Depth
(mete
rs)
Depth
(feet)
Description
Gra
phic
Sam
ple
No.
Sam
ple
Recovery
Sam
ple
Type
Blo
ws P
er
6"
N V
alu
e
% <
#200 TEST RESULTS
10 20 30 40 50 60 70
N-Value -
Moisture Content -
Plastic Limit Liquid Limit
Standard Penetration Tests were performed in the field in general accordance with ASTM D 1586.PAGE 2 of 2

25
20
15
10
5
0
-5
-10
0
2
4
6
8
10
0
5
10
15
20
25
30
35
3" Topsoil0.25
Mottled Orange to Gray, Moist, lean CLAY (CL) with trace fine Sand,Medium Stiff to Stiff
3Mottled Orange to Gray, Moist, Silty fine to medium SAND (SM),
Medium Dense
5Mottled Orange to Gray, Moist, fat CLAY (CH) with trace fine Sand,
Very Stiff
14Mottled Orange to Gray, Moist to Wet, poorly graded fine to coarse
SAND (SP-SM) with Silt, Loose to Medium Dense
33Mottled Orange to Gray, Wet, fat CLAY (CH) with trace fine Sand,
Very Soft
1
2
3
4
5
6
7
8
9
10
11
14
20
17
19
24
17
20
14
11
4
24
SS
SS
SS
SS
SS
SS
SS
SS
SS
SS
SS
2233
4577
57911
9111415
681011
661212
891112
7101010
4333
5322
1112
5
12
16
25
18
18
20
20
6
5
2
9
10
59
PROJECT: Hopewell Regional Alternative 4A-1 Light Phase 2 PER
CLIENT: HDR Engineering, Inc.
PROJECT LOCATION: Hopewell, Virginia PROJECT NO.: WM13-136G
BORING LOCATION: See attached boring location plan SURFACE ELEVATION: 27'
BORING LOG
M-2
DRILLER: GET Solutions, Inc. LOGGED BY: J. Robinson, P.E.
DRILLING METHOD: Rotary wash "mud" DATE: 7-28-13
DEPTH TO WATER - INITIAL*: 23' AFTER 24 HOURS: CAVING>
Notes: *It is noted that the topsoil thickness noted above is not expected to be indicative of the thicknesses that will be encountered across the site as the boring locations were cleared for accessibility prior to drilling.
SS = Split Spoon SampleST = Shelby Tube SampleHA = Hand Auger SampleBS = Bulk Sample
*The initial groundwater reading may not be indicative of the static groundwater level. WOH = Weight of Hammer
Ele
vation
(MS
L)
(ft)
Depth
(mete
rs)
Depth
(feet)
Description
Gra
phic
Sam
ple
No.
Sam
ple
Recovery
Sam
ple
Type
Blo
ws P
er
6"
N V
alu
e
% <
#200 TEST RESULTS
10 20 30 40 50 60 70
N-Value -
Moisture Content -
Plastic Limit Liquid Limit
Standard Penetration Tests were performed in the field in general accordance with ASTM D 1586.PAGE 1 of 2

-15
-20
-25
-30
-35
-40
-45
12
14
16
18
20
22
40
45
50
55
60
65
70
75
38Mottled Orange to Gray, Wet, poorly graded fine to coarse SAND
(SP-SM) with Silt, Medium Dense
Boring terminated at 40 ft.
12 24 SS
481010
18
PROJECT: Hopewell Regional Alternative 4A-1 Light Phase 2 PER
CLIENT: HDR Engineering, Inc.
PROJECT LOCATION: Hopewell, Virginia PROJECT NO.: WM13-136G
BORING LOCATION: See attached boring location plan SURFACE ELEVATION: 27'
BORING LOG
M-2
DRILLER: GET Solutions, Inc. LOGGED BY: J. Robinson, P.E.
DRILLING METHOD: Rotary wash "mud" DATE: 7-28-13
DEPTH TO WATER - INITIAL*: 23' AFTER 24 HOURS: CAVING>
Notes: *It is noted that the topsoil thickness noted above is not expected to be indicative of the thicknesses that will be encountered across the site as the boring locations were cleared for accessibility prior to drilling.
SS = Split Spoon SampleST = Shelby Tube SampleHA = Hand Auger SampleBS = Bulk Sample
*The initial groundwater reading may not be indicative of the static groundwater level. WOH = Weight of Hammer
Ele
vation
(MS
L)
(ft)
Depth
(mete
rs)
Depth
(feet)
Description
Gra
phic
Sam
ple
No.
Sam
ple
Recovery
Sam
ple
Type
Blo
ws P
er
6"
N V
alu
e
% <
#200 TEST RESULTS
10 20 30 40 50 60 70
N-Value -
Moisture Content -
Plastic Limit Liquid Limit
Standard Penetration Tests were performed in the field in general accordance with ASTM D 1586.PAGE 2 of 2

20
15
10
5
0
-5
-10
-15
0
2
4
6
8
10
0
5
10
15
20
25
30
35
4" Topsoil0.33
Mottled Orange to Gray, Moist, fine Sandy lean CLAY (CL) with tracefibrous organics and trace wood fragements, Stiff
2Mottled Orange to Gray, Moist, Silty fine to medium SAND (SM),
Medium Dense4
Mottled Orange to Gray, Moist, fat CLAY (CH) with trace fine Sand,Very Stiff to Hard
8Mottled Orange to Gray, Moist, poorly graded fine to medium SAND
(SP-SM) with Silt, Medium Dense
18Mottled Orange to Gray, Moist, fine Sandy Silty CLAY (CL-ML), Very
Stiff
23Mottled Orange to Gray, Wet, Silty fine to medium SAND (SM),
Medium Dense
28Mottled Orange to Gray, Wet, fat CLAY (CH) with trace fine Sand,
Soft
33Mottled Orange to Gray, Wet, poorly graded fine to coarse SAND
(SP-SM) with Silt, Medium Dense
1
2
3
4
5
6
7
8
9
10
11
17
20
22
17
24
17
14
15
14
24
17
SS
SS
SS
SS
SS
SS
SS
SS
SS
SS
SS
2468
67911
10111416
13141719
9101112
991111
7767
8101317
10111314
1122
99107
10
16
25
31
21
20
13
23
24
3
19
7
74
18
99
PROJECT: Hopewell Regional Alternative 4A-1 Light Phase 2 PER
CLIENT: HDR Engineering, Inc.
PROJECT LOCATION: Hopewell, Virginia PROJECT NO.: WM13-136G
BORING LOCATION: See attached boring location plan SURFACE ELEVATION: 20'
BORING LOG
M-3
DRILLER: GET Solutions, Inc. LOGGED BY: J. Robinson, P.E.
DRILLING METHOD: Rotary wash "mud" DATE: 7-28-13
DEPTH TO WATER - INITIAL*: 18' AFTER 24 HOURS: CAVING>
Notes: *It is noted that the topsoil thickness noted above is not expected to be indicative of the thicknesses that will be encountered across the site as the boring locations were cleared for accessibility prior to drilling.
SS = Split Spoon SampleST = Shelby Tube SampleHA = Hand Auger SampleBS = Bulk Sample
*The initial groundwater reading may not be indicative of the static groundwater level. WOH = Weight of Hammer
Ele
vation
(MS
L)
(ft)
Depth
(mete
rs)
Depth
(feet)
Description
Gra
phic
Sam
ple
No.
Sam
ple
Recovery
Sam
ple
Type
Blo
ws P
er
6"
N V
alu
e
% <
#200 TEST RESULTS
10 20 30 40 50 60 70
N-Value -
Moisture Content -
Plastic Limit Liquid Limit
Standard Penetration Tests were performed in the field in general accordance with ASTM D 1586.PAGE 1 of 2

-20
-25
-30
-35
-40
-45
-50
-55
12
14
16
18
20
22
40
45
50
55
60
65
70
75
Mottled Orange to Gray, Wet, poorly graded fine to coarse SAND(SP-SM) with Silt, Medium Dense
Boring terminated at 50 ft.
12
13
14
12
14
18
SS
SS
SS
4688
7121820
1191012
14
30
19
PROJECT: Hopewell Regional Alternative 4A-1 Light Phase 2 PER
CLIENT: HDR Engineering, Inc.
PROJECT LOCATION: Hopewell, Virginia PROJECT NO.: WM13-136G
BORING LOCATION: See attached boring location plan SURFACE ELEVATION: 20'
BORING LOG
M-3
DRILLER: GET Solutions, Inc. LOGGED BY: J. Robinson, P.E.
DRILLING METHOD: Rotary wash "mud" DATE: 7-28-13
DEPTH TO WATER - INITIAL*: 18' AFTER 24 HOURS: CAVING>
Notes: *It is noted that the topsoil thickness noted above is not expected to be indicative of the thicknesses that will be encountered across the site as the boring locations were cleared for accessibility prior to drilling.
SS = Split Spoon SampleST = Shelby Tube SampleHA = Hand Auger SampleBS = Bulk Sample
*The initial groundwater reading may not be indicative of the static groundwater level. WOH = Weight of Hammer
Ele
vation
(MS
L)
(ft)
Depth
(mete
rs)
Depth
(feet)
Description
Gra
phic
Sam
ple
No.
Sam
ple
Recovery
Sam
ple
Type
Blo
ws P
er
6"
N V
alu
e
% <
#200 TEST RESULTS
10 20 30 40 50 60 70
N-Value -
Moisture Content -
Plastic Limit Liquid Limit
Standard Penetration Tests were performed in the field in general accordance with ASTM D 1586.PAGE 2 of 2
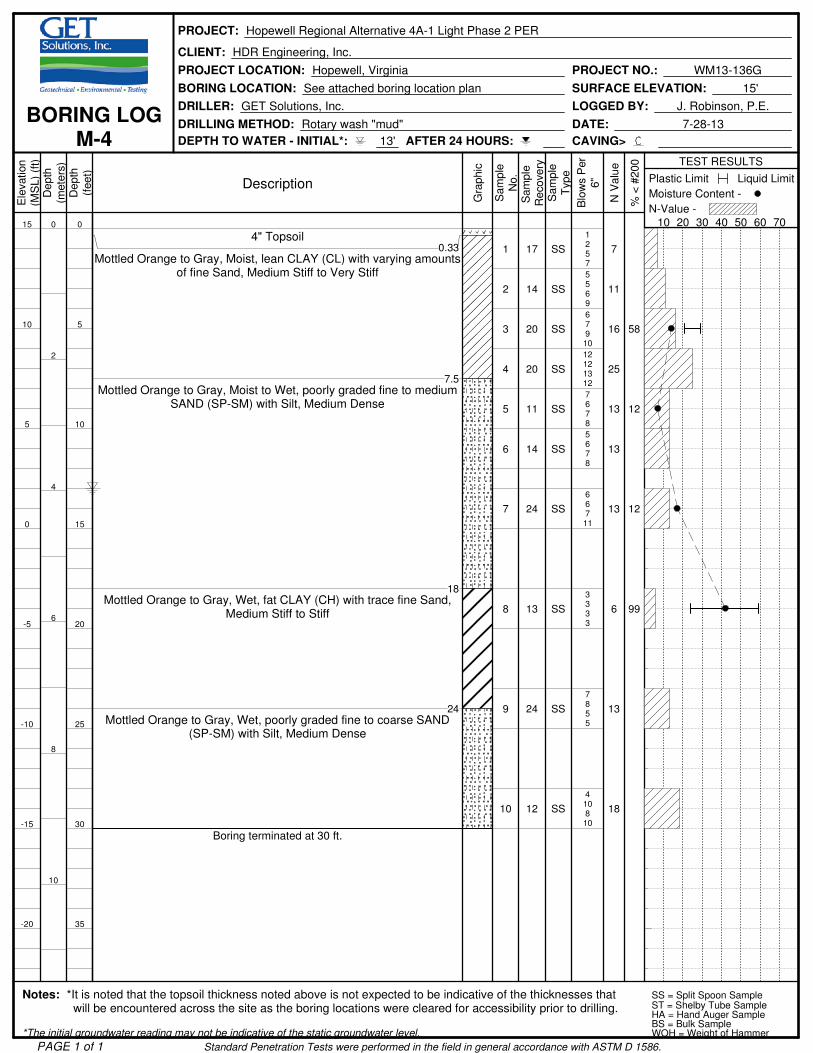
15
10
5
0
-5
-10
-15
-20
0
2
4
6
8
10
0
5
10
15
20
25
30
35
4" Topsoil0.33
Mottled Orange to Gray, Moist, lean CLAY (CL) with varying amountsof fine Sand, Medium Stiff to Very Stiff
7.5Mottled Orange to Gray, Moist to Wet, poorly graded fine to medium
SAND (SP-SM) with Silt, Medium Dense
18Mottled Orange to Gray, Wet, fat CLAY (CH) with trace fine Sand,
Medium Stiff to Stiff
24Mottled Orange to Gray, Wet, poorly graded fine to coarse SAND
(SP-SM) with Silt, Medium Dense
Boring terminated at 30 ft.
1
2
3
4
5
6
7
8
9
10
17
14
20
20
11
14
24
13
24
12
SS
SS
SS
SS
SS
SS
SS
SS
SS
SS
1257
5569
67910
12121312
7678
5678
66711
3333
7855
410810
7
11
16
25
13
13
13
6
13
18
58
12
12
99
PROJECT: Hopewell Regional Alternative 4A-1 Light Phase 2 PER
CLIENT: HDR Engineering, Inc.
PROJECT LOCATION: Hopewell, Virginia PROJECT NO.: WM13-136G
BORING LOCATION: See attached boring location plan SURFACE ELEVATION: 15'
BORING LOG
M-4
DRILLER: GET Solutions, Inc. LOGGED BY: J. Robinson, P.E.
DRILLING METHOD: Rotary wash "mud" DATE: 7-28-13
DEPTH TO WATER - INITIAL*: 13' AFTER 24 HOURS: CAVING>
Notes: *It is noted that the topsoil thickness noted above is not expected to be indicative of the thicknesses that will be encountered across the site as the boring locations were cleared for accessibility prior to drilling.
SS = Split Spoon SampleST = Shelby Tube SampleHA = Hand Auger SampleBS = Bulk Sample
*The initial groundwater reading may not be indicative of the static groundwater level. WOH = Weight of Hammer
Ele
vation
(MS
L)
(ft)
Depth
(mete
rs)
Depth
(feet)
Description
Gra
phic
Sam
ple
No.
Sam
ple
Recovery
Sam
ple
Type
Blo
ws P
er
6"
N V
alu
e
% <
#200 TEST RESULTS
10 20 30 40 50 60 70
N-Value -
Moisture Content -
Plastic Limit Liquid Limit
Standard Penetration Tests were performed in the field in general accordance with ASTM D 1586.PAGE 1 of 1

0
2
4
6
8
10
0
5
10
15
20
25
30
35
7" Topsoil0.58
Mottled Orange to Gray, Moist, Clayey fine SAND (SC), Very Loose2
Mottled Orange to Gray, Moist, Silty fine to medium SAND (SM),Loose to Medium Dense
6Mottled Orange to Gray, Moist, Clayey fine to medium SAND (SC),
Medium Dense
8Mottled Orange to Gray, Moist, fat CLAY (CH) with trace to little fine
Sand, Stiff to Very Stiff
18Gray, Moist to Wet, Silty fine to coarse SAND (SM) with trace fine
Gravel, Medium Dense
28Mottled Orange to Gray, Wet, fat CLAY (CH) with trace fine Sand,
Very Soft
33Mottled Orange to Gray, Wet, Silty fine to medium SAND (SM),
Medium Dense
1
2
3
4
5
6
7
8
9
10
11
18
18
20
18
24
24
24
24
12
24
24
SS
SS
SS
SS
SS
SS
SS
SS
SS
SS
SS
1224
3454
4567
671011
671211
8101015
3589
9101112
9121716
WOH111
3664
4
9
11
17
19
20
13
21
29
2
12
23
PROJECT: Hopewell Regional Alternative 4A-1 Light Phase 2 PER
CLIENT: HDR Engineering, Inc.
PROJECT LOCATION: Hopewell, Virginia PROJECT NO.: WM13-136G
BORING LOCATION: See attached boring location plan SURFACE ELEVATION:
BORING LOG
F-8
DRILLER: GET Solutions, Inc. LOGGED BY: J. Robinson, P.E.
DRILLING METHOD: Rotary wash "mud" DATE: 9-6-13
DEPTH TO WATER - INITIAL*: 23' AFTER 24 HOURS: CAVING>
Notes: *It is noted that the topsoil thickness noted above is not expected to be indicative of the thicknesses that will be encountered across the site as the boring locations were cleared for accessibility prior to drilling.
SS = Split Spoon SampleST = Shelby Tube SampleHA = Hand Auger SampleBS = Bulk Sample
*The initial groundwater reading may not be indicative of the static groundwater level. WOH = Weight of Hammer
Ele
vation
(MS
L)
(ft)
Depth
(mete
rs)
Depth
(feet)
Description
Gra
phic
Sam
ple
No.
Sam
ple
Recovery
Sam
ple
Type
Blo
ws P
er
6"
N V
alu
e
% <
#200 TEST RESULTS
10 20 30 40 50 60 70
N-Value -
Moisture Content -
Plastic Limit Liquid Limit
Standard Penetration Tests were performed in the field in general accordance with ASTM D 1586.PAGE 1 of 2
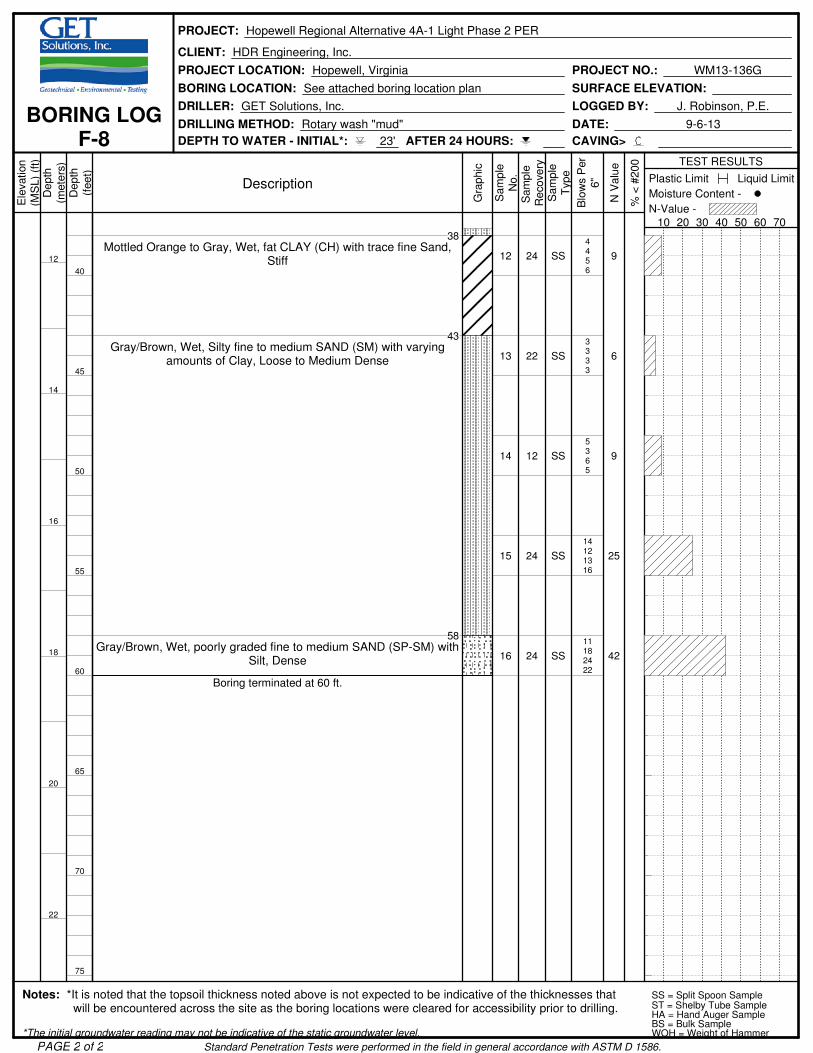
12
14
16
18
20
22
40
45
50
55
60
65
70
75
38Mottled Orange to Gray, Wet, fat CLAY (CH) with trace fine Sand,
Stiff
43Gray/Brown, Wet, Silty fine to medium SAND (SM) with varying
amounts of Clay, Loose to Medium Dense
58Gray/Brown, Wet, poorly graded fine to medium SAND (SP-SM) with
Silt, Dense
Boring terminated at 60 ft.
12
13
14
15
16
24
22
12
24
24
SS
SS
SS
SS
SS
4456
3333
5365
14121316
11182422
9
6
9
25
42
PROJECT: Hopewell Regional Alternative 4A-1 Light Phase 2 PER
CLIENT: HDR Engineering, Inc.
PROJECT LOCATION: Hopewell, Virginia PROJECT NO.: WM13-136G
BORING LOCATION: See attached boring location plan SURFACE ELEVATION:
BORING LOG
F-8
DRILLER: GET Solutions, Inc. LOGGED BY: J. Robinson, P.E.
DRILLING METHOD: Rotary wash "mud" DATE: 9-6-13
DEPTH TO WATER - INITIAL*: 23' AFTER 24 HOURS: CAVING>
Notes: *It is noted that the topsoil thickness noted above is not expected to be indicative of the thicknesses that will be encountered across the site as the boring locations were cleared for accessibility prior to drilling.
SS = Split Spoon SampleST = Shelby Tube SampleHA = Hand Auger SampleBS = Bulk Sample
*The initial groundwater reading may not be indicative of the static groundwater level. WOH = Weight of Hammer
Ele
vation
(MS
L)
(ft)
Depth
(mete
rs)
Depth
(feet)
Description
Gra
phic
Sam
ple
No.
Sam
ple
Recovery
Sam
ple
Type
Blo
ws P
er
6"
N V
alu
e
% <
#200 TEST RESULTS
10 20 30 40 50 60 70
N-Value -
Moisture Content -
Plastic Limit Liquid Limit
Standard Penetration Tests were performed in the field in general accordance with ASTM D 1586.PAGE 2 of 2
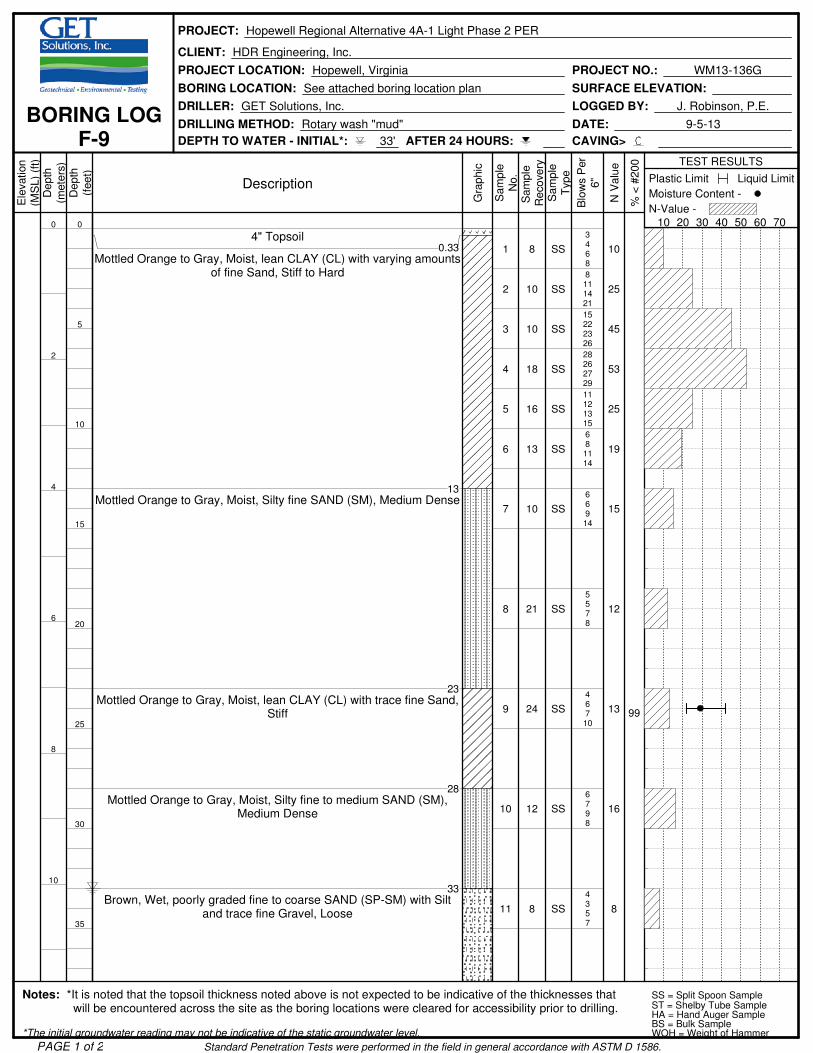
0
2
4
6
8
10
0
5
10
15
20
25
30
35
4" Topsoil0.33
Mottled Orange to Gray, Moist, lean CLAY (CL) with varying amountsof fine Sand, Stiff to Hard
13Mottled Orange to Gray, Moist, Silty fine SAND (SM), Medium Dense
23Mottled Orange to Gray, Moist, lean CLAY (CL) with trace fine Sand,
Stiff
28Mottled Orange to Gray, Moist, Silty fine to medium SAND (SM),
Medium Dense
33Brown, Wet, poorly graded fine to coarse SAND (SP-SM) with Silt
and trace fine Gravel, Loose
1
2
3
4
5
6
7
8
9
10
11
8
10
10
18
16
13
10
21
24
12
8
SS
SS
SS
SS
SS
SS
SS
SS
SS
SS
SS
3468
8111421
15222326
28262729
11121315
681114
66914
5578
46710
6798
4357
10
25
45
53
25
19
15
12
13
16
8
99
PROJECT: Hopewell Regional Alternative 4A-1 Light Phase 2 PER
CLIENT: HDR Engineering, Inc.
PROJECT LOCATION: Hopewell, Virginia PROJECT NO.: WM13-136G
BORING LOCATION: See attached boring location plan SURFACE ELEVATION:
BORING LOG
F-9
DRILLER: GET Solutions, Inc. LOGGED BY: J. Robinson, P.E.
DRILLING METHOD: Rotary wash "mud" DATE: 9-5-13
DEPTH TO WATER - INITIAL*: 33' AFTER 24 HOURS: CAVING>
Notes: *It is noted that the topsoil thickness noted above is not expected to be indicative of the thicknesses that will be encountered across the site as the boring locations were cleared for accessibility prior to drilling.
SS = Split Spoon SampleST = Shelby Tube SampleHA = Hand Auger SampleBS = Bulk Sample
*The initial groundwater reading may not be indicative of the static groundwater level. WOH = Weight of Hammer
Ele
vation
(MS
L)
(ft)
Depth
(mete
rs)
Depth
(feet)
Description
Gra
phic
Sam
ple
No.
Sam
ple
Recovery
Sam
ple
Type
Blo
ws P
er
6"
N V
alu
e
% <
#200 TEST RESULTS
10 20 30 40 50 60 70
N-Value -
Moisture Content -
Plastic Limit Liquid Limit
Standard Penetration Tests were performed in the field in general accordance with ASTM D 1586.PAGE 1 of 2
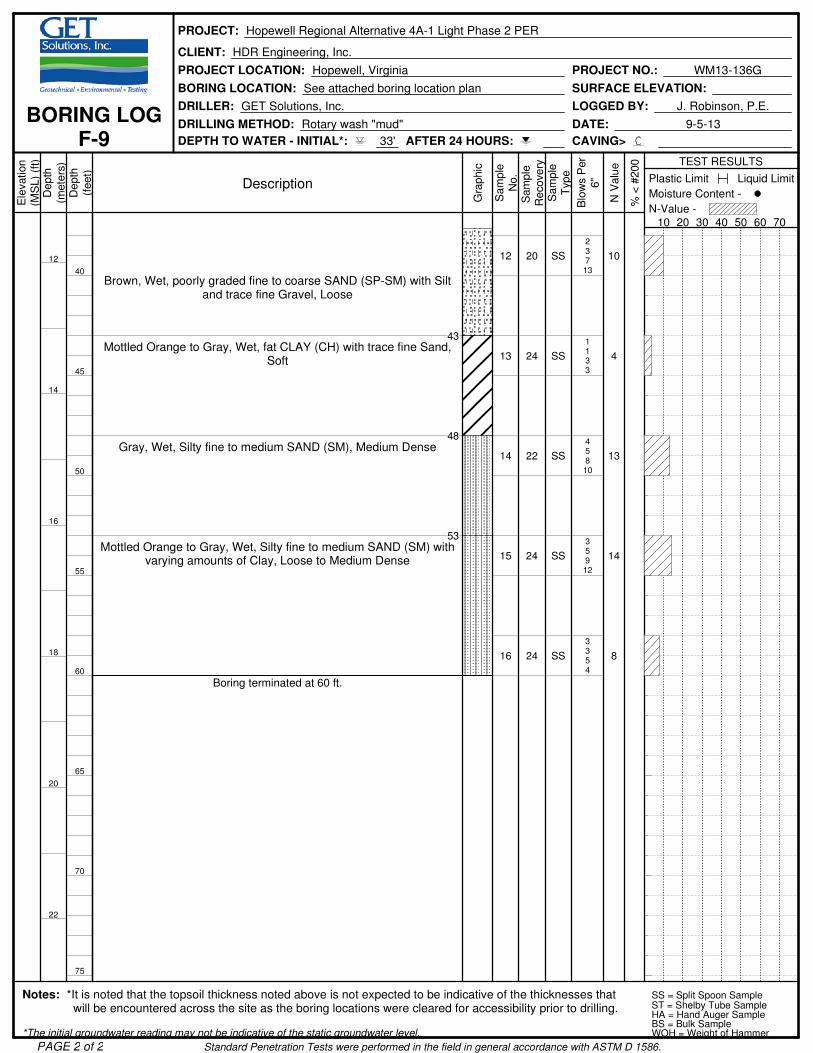
12
14
16
18
20
22
40
45
50
55
60
65
70
75
Brown, Wet, poorly graded fine to coarse SAND (SP-SM) with Siltand trace fine Gravel, Loose
43Mottled Orange to Gray, Wet, fat CLAY (CH) with trace fine Sand,
Soft
48Gray, Wet, Silty fine to medium SAND (SM), Medium Dense
53Mottled Orange to Gray, Wet, Silty fine to medium SAND (SM) with
varying amounts of Clay, Loose to Medium Dense
Boring terminated at 60 ft.
12
13
14
15
16
20
24
22
24
24
SS
SS
SS
SS
SS
23713
1133
45810
35912
3354
10
4
13
14
8
PROJECT: Hopewell Regional Alternative 4A-1 Light Phase 2 PER
CLIENT: HDR Engineering, Inc.
PROJECT LOCATION: Hopewell, Virginia PROJECT NO.: WM13-136G
BORING LOCATION: See attached boring location plan SURFACE ELEVATION:
BORING LOG
F-9
DRILLER: GET Solutions, Inc. LOGGED BY: J. Robinson, P.E.
DRILLING METHOD: Rotary wash "mud" DATE: 9-5-13
DEPTH TO WATER - INITIAL*: 33' AFTER 24 HOURS: CAVING>
Notes: *It is noted that the topsoil thickness noted above is not expected to be indicative of the thicknesses that will be encountered across the site as the boring locations were cleared for accessibility prior to drilling.
SS = Split Spoon SampleST = Shelby Tube SampleHA = Hand Auger SampleBS = Bulk Sample
*The initial groundwater reading may not be indicative of the static groundwater level. WOH = Weight of Hammer
Ele
vation
(MS
L)
(ft)
Depth
(mete
rs)
Depth
(feet)
Description
Gra
phic
Sam
ple
No.
Sam
ple
Recovery
Sam
ple
Type
Blo
ws P
er
6"
N V
alu
e
% <
#200 TEST RESULTS
10 20 30 40 50 60 70
N-Value -
Moisture Content -
Plastic Limit Liquid Limit
Standard Penetration Tests were performed in the field in general accordance with ASTM D 1586.PAGE 2 of 2

0
2
4
6
8
10
0
5
10
15
20
25
30
35
7" Topsoil0.58
Mottled Orange to Gray, Moist, lean CLAY (CL) with varying amountsof fine Sand, Medium Stiff to Very Stiff
10Mottled Orange to Gray, Moist, Clayey fine SAND (SC), Medium
Dense
13Mottled Orange to Gray, Moist, Silty fine SAND (SM), Medium Dense
18Mottled Orange to Gray, Moist, fat CLAY (CH) with trace fine Sand,
Stiff to Very Stiff
33Mottled Orange to Gray, Moist to Wet, Silty fine to medium SAND
(SM) with Clay lenses, Medium Dense
1
2
3
4
5
6
7
8
9
10
11
14
12
10
19
24
18
12
24
24
24
18
SS
SS
SS
SS
SS
SS
SS
SS
SS
SS
SS
2234
68811
8101215
15151518
581215
691213
8101217
571014
571013
34811
691413
5
16
22
30
20
21
22
17
17
12
23
PROJECT: Hopewell Regional Alternative 4A-1 Light Phase 2 PER
CLIENT: HDR Engineering, Inc.
PROJECT LOCATION: Hopewell, Virginia PROJECT NO.: WM13-136G
BORING LOCATION: See attached boring location plan SURFACE ELEVATION:
BORING LOG
F-10
DRILLER: GET Solutions, Inc. LOGGED BY: J. Robinson, P.E.
DRILLING METHOD: Rotary wash "mud" DATE: 9-5-13
DEPTH TO WATER - INITIAL*: 38' AFTER 24 HOURS: CAVING>
Notes: *It is noted that the topsoil thickness noted above is not expected to be indicative of the thicknesses that will be encountered across the site as the boring locations were cleared for accessibility prior to drilling.
SS = Split Spoon SampleST = Shelby Tube SampleHA = Hand Auger SampleBS = Bulk Sample
*The initial groundwater reading may not be indicative of the static groundwater level. WOH = Weight of Hammer
Ele
vation
(MS
L)
(ft)
Depth
(mete
rs)
Depth
(feet)
Description
Gra
phic
Sam
ple
No.
Sam
ple
Recovery
Sam
ple
Type
Blo
ws P
er
6"
N V
alu
e
% <
#200 TEST RESULTS
10 20 30 40 50 60 70
N-Value -
Moisture Content -
Plastic Limit Liquid Limit
Standard Penetration Tests were performed in the field in general accordance with ASTM D 1586.PAGE 1 of 2

12
14
16
18
20
22
40
45
50
55
60
65
70
75
Mottled Orange to Gray, Moist to Wet, Silty fine to medium SAND(SM) with Clay lenses, Medium Dense
43Mottled Orange to Gray, Wet, fat CLAY (CH) with trace fine Sand and
trace fibrous organics, Medium Stiff to Stiff
54Mottled Orange to Gray, Wet, poorly graded fine to coarse SAND
(SP-SM) with Silt, Medium Dense
Boring terminated at 60 ft.
12
13
14
15
16
16
24
24
24
22
SS
SS
SS
SS
SS
47910
1256
2335
271214
10121414
16
7
6
19
26
PROJECT: Hopewell Regional Alternative 4A-1 Light Phase 2 PER
CLIENT: HDR Engineering, Inc.
PROJECT LOCATION: Hopewell, Virginia PROJECT NO.: WM13-136G
BORING LOCATION: See attached boring location plan SURFACE ELEVATION:
BORING LOG
F-10
DRILLER: GET Solutions, Inc. LOGGED BY: J. Robinson, P.E.
DRILLING METHOD: Rotary wash "mud" DATE: 9-5-13
DEPTH TO WATER - INITIAL*: 38' AFTER 24 HOURS: CAVING>
Notes: *It is noted that the topsoil thickness noted above is not expected to be indicative of the thicknesses that will be encountered across the site as the boring locations were cleared for accessibility prior to drilling.
SS = Split Spoon SampleST = Shelby Tube SampleHA = Hand Auger SampleBS = Bulk Sample
*The initial groundwater reading may not be indicative of the static groundwater level. WOH = Weight of Hammer
Ele
vation
(MS
L)
(ft)
Depth
(mete
rs)
Depth
(feet)
Description
Gra
phic
Sam
ple
No.
Sam
ple
Recovery
Sam
ple
Type
Blo
ws P
er
6"
N V
alu
e
% <
#200 TEST RESULTS
10 20 30 40 50 60 70
N-Value -
Moisture Content -
Plastic Limit Liquid Limit
Standard Penetration Tests were performed in the field in general accordance with ASTM D 1586.PAGE 2 of 2

APPENDIX IV
GENERALIZED SOIL PROFILE

B-52 35 6
6 1114 20
18 1618 23
14 1719 23
6 79 11
4 66 8
4 45 8
4 710 13
5 58 10
4 610 8
4 56 5
WOHWOHWOH2
NM=24LL=52
NM=50LL=52
D-63 43 3
4 56 6
7 78 7
8 911 10
3 711 14
4 611 14
6 911 14
5 58 10
6 56 6
NM=29LL=58
F-72 34 5
6 78 10
10 1215 15
13 1617 20
5 811 13
3 46 7
4 67 10
6 88 9
5 68 10
NM=2
M-13 45 6
8 1012 15
13 1618 20
17 2323 22
8 813 15
6 911 12
6 913 15
6 1114 14
5 710 11
7 89 4
6 98 9
WOHWOH
NM=24LL=43
NM=22
35
30
25
20
15
10
5
0
-5
Ele
vat
ion i
n F
eet
35
30
25
20
15
10
5
0
-5
Elev
ation in
Feet
GET Solutions, Inc.
LOG OF BORINGSHopewell Regional Alternative 4A-1 Light Phase 2 PER
Topsoil
Fat Clay
Lean Clay
Silt
Silty Sand
Poorly graded Sand
with Silt
Clayey Sand

M-22 23 3
4 57 7
5 79 11
9 1114 15
6 810 11
6 612 12
8 911 12
7 1010 10
4 33 3
5 32 2
1 11 2
NM=2
NM=25
NM=35LL=33
M-32 46 8
6 79 11
10 1114 16
13 1417 19
9 1011 12
9 911 11
7 76 7
8 1013 17
10 1113 14
1 12 2
NM=13
NM=16LL=21
NM=18
NM=41LL=63
M-41 25 7
5 56 9
6 79 10
12 1213 12
7 67 8
5 67 8
6 67 11
3 33 3
7 85 5
NM=14LL=29
NM=7
NM=17
NM=42LL=59
35
30
25
20
15
10
5
0
-5
Ele
vat
ion i
n F
eet
35
30
25
20
15
10
5
0
-5
Elev
ation in
Feet
GET Solutions, Inc.
LOG OF BORINGSHopewell Regional Alternative 4A-1 Light Phase 2 PER
Topsoil
Fat Clay
Lean Clay
Silt
Silty Sand
Poorly graded Sand
with Silt
Clayey Sand
Silty Clay
APPENDIX V
CONSOLIDATION TEST RESULTS
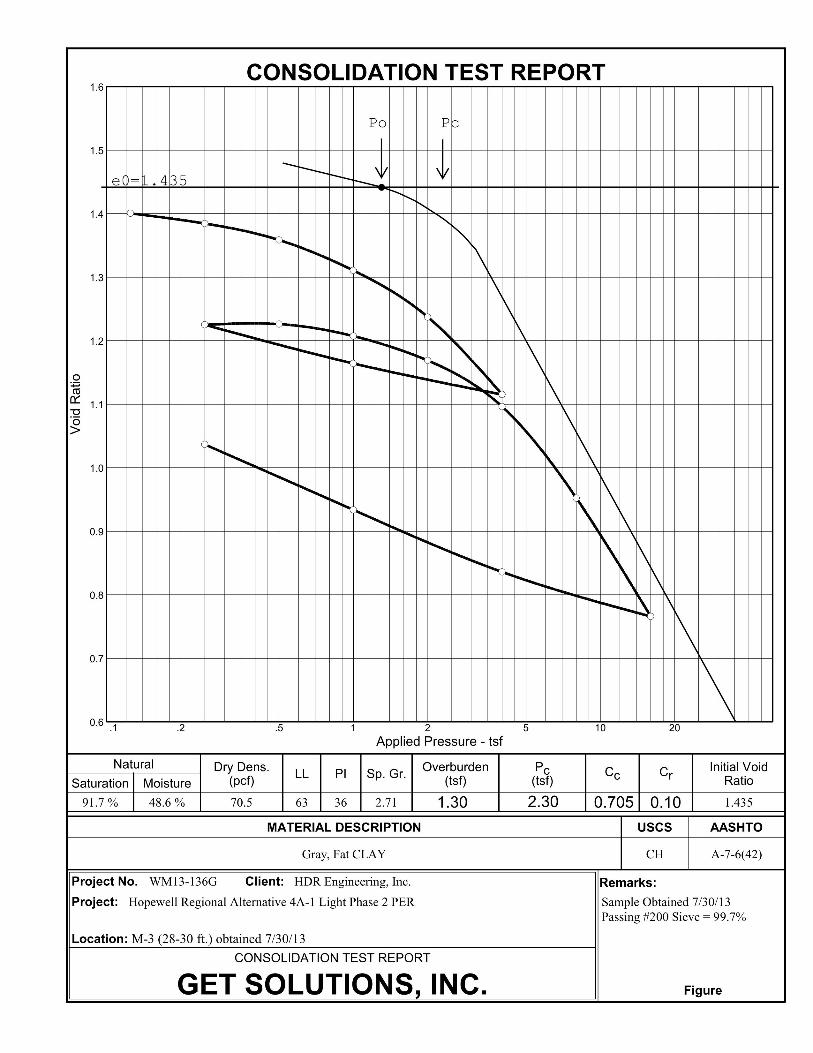

=
=D100
=
=D0
Load=
Load No.=
Project:Project No.:
Dial Reading vs. Time
C = 0.000
Cv @ T50
1.27 ft.2/day
T50
D50
Location: M-3 (28-30 ft.) obtained 7/30/13
0.38 min.
0.98662
0.98742
0.98823
0.13 tsf
1
Hopewell Regional Alternative 4A-1 Light Phase 2 PERWM13-136G
Dia
l Rea
ding
(in
.)
Elapsed Time (min.).1 .2 .5 1 2 5 10 20 50 100 200.98564
.98589
.98614
.98639
.98664
.98689
.98714
.98739
.98764
.98789
.98814
FigureGET Solutions, Inc.
C = 0.000
Cv @ T50
0.09 ft.2/day
=T50
=D100
=D50
=D0
Load=
Load No.=
Location: M-3 (28-30 ft.) obtained 7/30/13
5.34 min.
0.97930
0.98107
0.98285
0.25 tsf
2
Dia
l Rea
ding
(in
.)
Elapsed Time (min.).1 .2 .5 1 2 5 10 20 50 100 200.9788
.9793
.9798
.9803
.9808
.9813
.9818
.9823
.9828
.9833
.9838

=
=D100
=
=D0
Load=
Load No.=
Project:Project No.:
Dial Reading vs. Time
C = 0.003
Cv @ T50
0.05 ft.2/day
T50
D50
Location: M-3 (28-30 ft.) obtained 7/30/13
8.76 min.
0.96869
0.97206
0.97542
0.50 tsf
3
Hopewell Regional Alternative 4A-1 Light Phase 2 PERWM13-136G
Dia
l Rea
ding
(in
.)
Elapsed Time (min.).1 .2 .5 1 2 5 10 20 50 100 200.967
.968
.969
.970
.971
.972
.973
.974
.975
.976
.977
FigureGET Solutions, Inc.
C = 0.000
Cv @ T50
0.04 ft.2/day
=T50
=D100
=D50
=D0
Load=
Load No.=
Location: M-3 (28-30 ft.) obtained 7/30/13
11.19 min.
0.94904
0.95604
0.96303
1.00 tsf
4
Dia
l Rea
ding
(in
.)
Elapsed Time (min.).1 .2 .5 1 2 5 10 20 50 100 200.946
.948
.950
.952
.954
.956
.958
.960
.962
.964
.966

=
=D100
=
=D0
Load=
Load No.=
Project:Project No.:
Dial Reading vs. Time
C = 0.000
Cv @ T50
0.03 ft.2/day
T50
D50
Location: M-3 (28-30 ft.) obtained 7/30/13
12.25 min.
0.91905
0.93068
0.94232
2.00 tsf
5
Hopewell Regional Alternative 4A-1 Light Phase 2 PERWM13-136G
Dia
l Rea
ding
(in
.)
Elapsed Time (min.).1 .2 .5 1 2 5 10 20 50 100 200.915
.918
.921
.924
.927
.930
.933
.936
.939
.942
.945
FigureGET Solutions, Inc.
C = 0.000
Cv @ T50
0.03 ft.2/day
=T50
=D100
=D50
=D0
Load=
Load No.=
Location: M-3 (28-30 ft.) obtained 7/30/13
15.26 min.
0.86865
0.88858
0.90852
4.00 tsf
6
Dia
l Rea
ding
(in
.)
Elapsed Time (min.).1 .2 .5 1 2 5 10 20 50 100 200.863
.868
.873
.878
.883
.888
.893
.898
.903
.908
.913

=
=D100
=
=D0
Load=
Load No.=
Project:Project No.:
Dial Reading vs. Time
C = 0.000
Cv @ T50
0.04 ft.2/day
T50
D50
Location: M-3 (28-30 ft.) obtained 7/30/13
8.91 min.
0.88912
0.88085
0.87258
1.00 tsf
7
Hopewell Regional Alternative 4A-1 Light Phase 2 PERWM13-136G
Dia
l Rea
ding
(in
.)
Elapsed Time (min.).1 .2 .5 1 2 5 10 20 50 100 200
.871
.873
.875
.877
.879
.881
.883
.885
.887
.889
.891
FigureGET Solutions, Inc.
C = 0.001
Cv @ T50
0.02 ft.2/day
=T50
=D100
=D50
=D0
Load=
Load No.=
Location: M-3 (28-30 ft.) obtained 7/30/13
20.12 min.
0.91347
0.90168
0.88989
0.25 tsf
8
Dia
l Rea
ding
(in
.)
Elapsed Time (min.).1 .2 .5 1 2 5 10 20 50 100 200
.888
.891
.894
.897
.900
.903
.906
.909
.912
.915
.918

=
=D100
=
=D0
Load=
Load No.=
Project:Project No.:
Dial Reading vs. Time
C = 0.000
Cv @ T50
0.12 ft.2/day
T50
D50
Location: M-3 (28-30 ft.) obtained 7/30/13
3.51 min.
0.91422
0.91425
0.91429
0.50 tsf
9
Hopewell Regional Alternative 4A-1 Light Phase 2 PERWM13-136G
Dia
l Rea
ding
(in
.)
Elapsed Time (min.).1 .2 .5 1 2 5 10 20 50 100 200.91419
.91420
.91421
.91422
.91423
.91424
.91425
.91426
.91427
.91428
.91429
FigureGET Solutions, Inc.
C = 0.000
Cv @ T50
0.04 ft.2/day
=T50
=D100
=D50
=D0
Load=
Load No.=
Location: M-3 (28-30 ft.) obtained 7/30/13
10.17 min.
0.90651
0.90980
0.91309
1.00 tsf
10
Dia
l Rea
ding
(in
.)
Elapsed Time (min.).1 .2 .5 1 2 5 10 20 50 100 200.904
.905
.906
.907
.908
.909
.910
.911
.912
.913
.914

=
=D100
=
=D0
Load=
Load No.=
Project:Project No.:
Dial Reading vs. Time
Cv @ T50
0.04 ft.2/day
T50
D50
Location: M-3 (28-30 ft.) obtained 7/30/13
9.33 min.
0.89051
0.89751
0.90450
2.00 tsf
11
Hopewell Regional Alternative 4A-1 Light Phase 2 PERWM13-136G
Dia
l Rea
ding
(in
.)
Elapsed Time (min.).1 .2 .5 1 2 5 10 20 50 100 200.886
.888
.890
.892
.894
.896
.898
.900
.902
.904
.906
FigureGET Solutions, Inc.
C = 0.002
Cv @ T50
0.04 ft.2/day
=T50
=D100
=D50
=D0
Load=
Load No.=
Location: M-3 (28-30 ft.) obtained 7/30/13
9.58 min.
0.86148
0.87232
0.88316
4.00 tsf
12
Dia
l Rea
ding
(in
.)
Elapsed Time (min.).1 .2 .5 1 2 5 10 20 50 100 200 500.857
.860
.863
.866
.869
.872
.875
.878
.881
.884
.887
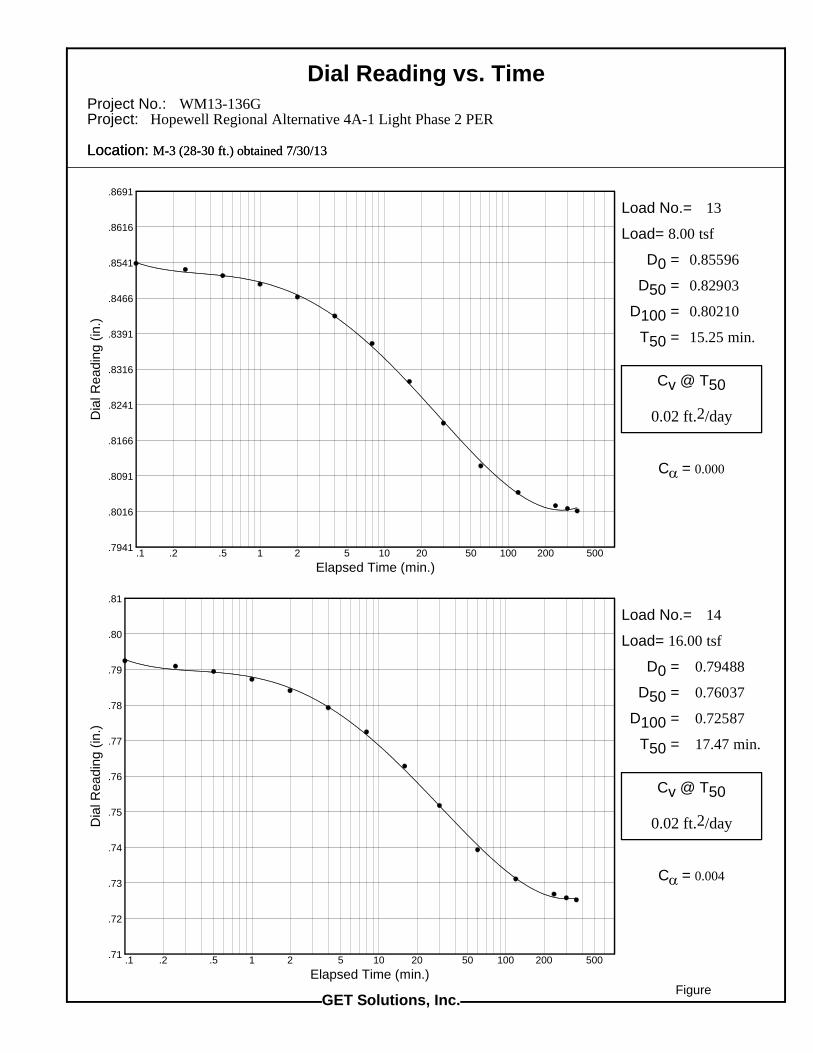
=
=D100
=
=D0
Load=
Load No.=
Project:Project No.:
Dial Reading vs. Time
C = 0.000
Cv @ T50
0.02 ft.2/day
T50
D50
Location: M-3 (28-30 ft.) obtained 7/30/13
15.25 min.
0.80210
0.82903
0.85596
8.00 tsf
13
Hopewell Regional Alternative 4A-1 Light Phase 2 PERWM13-136G
Dia
l Rea
ding
(in
.)
Elapsed Time (min.).1 .2 .5 1 2 5 10 20 50 100 200 500.7941
.8016
.8091
.8166
.8241
.8316
.8391
.8466
.8541
.8616
.8691
FigureGET Solutions, Inc.
C = 0.004
Cv @ T50
0.02 ft.2/day
=T50
=D100
=D50
=D0
Load=
Load No.=
Location: M-3 (28-30 ft.) obtained 7/30/13
17.47 min.
0.72587
0.76037
0.79488
16.00 tsf
14
Dia
l Rea
ding
(in
.)
Elapsed Time (min.).1 .2 .5 1 2 5 10 20 50 100 200 500.71
.72
.73
.74
.75
.76
.77
.78
.79
.80
.81
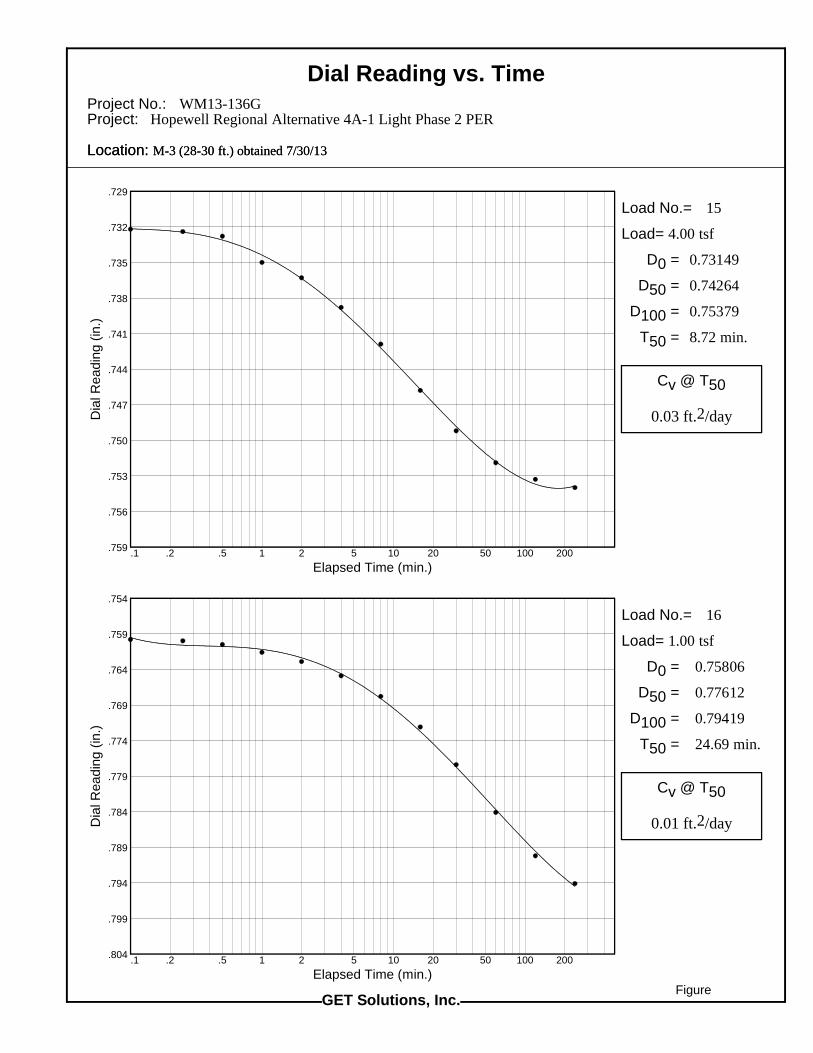
=
=D100
=
=D0
Load=
Load No.=
Project:Project No.:
Dial Reading vs. Time
Cv @ T50
0.03 ft.2/day
T50
D50
Location: M-3 (28-30 ft.) obtained 7/30/13
8.72 min.
0.75379
0.74264
0.73149
4.00 tsf
15
Hopewell Regional Alternative 4A-1 Light Phase 2 PERWM13-136G
Dia
l Rea
ding
(in
.)
Elapsed Time (min.).1 .2 .5 1 2 5 10 20 50 100 200
.729
.732
.735
.738
.741
.744
.747
.750
.753
.756
.759
FigureGET Solutions, Inc.
Cv @ T50
0.01 ft.2/day
=T50
=D100
=D50
=D0
Load=
Load No.=
Location: M-3 (28-30 ft.) obtained 7/30/13
24.69 min.
0.79419
0.77612
0.75806
1.00 tsf
16
Dia
l Rea
ding
(in
.)
Elapsed Time (min.).1 .2 .5 1 2 5 10 20 50 100 200
.754
.759
.764
.769
.774
.779
.784
.789
.794
.799
.804
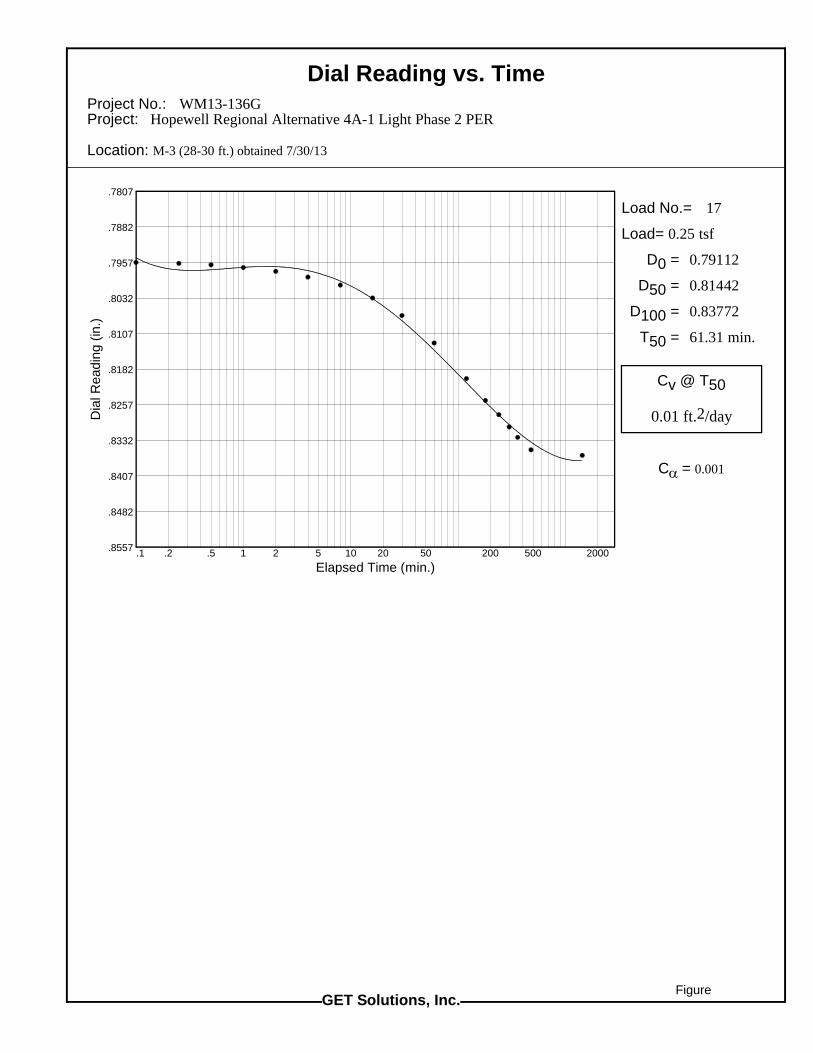
=
=D100
=
=D0
Load=
Load No.=
Project:Project No.:
Dial Reading vs. Time
C = 0.001
Cv @ T50
0.01 ft.2/day
T50
D50
Location: M-3 (28-30 ft.) obtained 7/30/13
61.31 min.
0.83772
0.81442
0.79112
0.25 tsf
17
Hopewell Regional Alternative 4A-1 Light Phase 2 PERWM13-136G
Dia
l Rea
ding
(in
.)
Elapsed Time (min.).1 .2 .5 1 2 5 10 20 50 200 500 2000
.7807
.7882
.7957
.8032
.8107
.8182
.8257
.8332
.8407
.8482
.8557
FigureGET Solutions, Inc.

APPENDIX VI
TRIAXIAL COMPRESSION TEST RESULTS
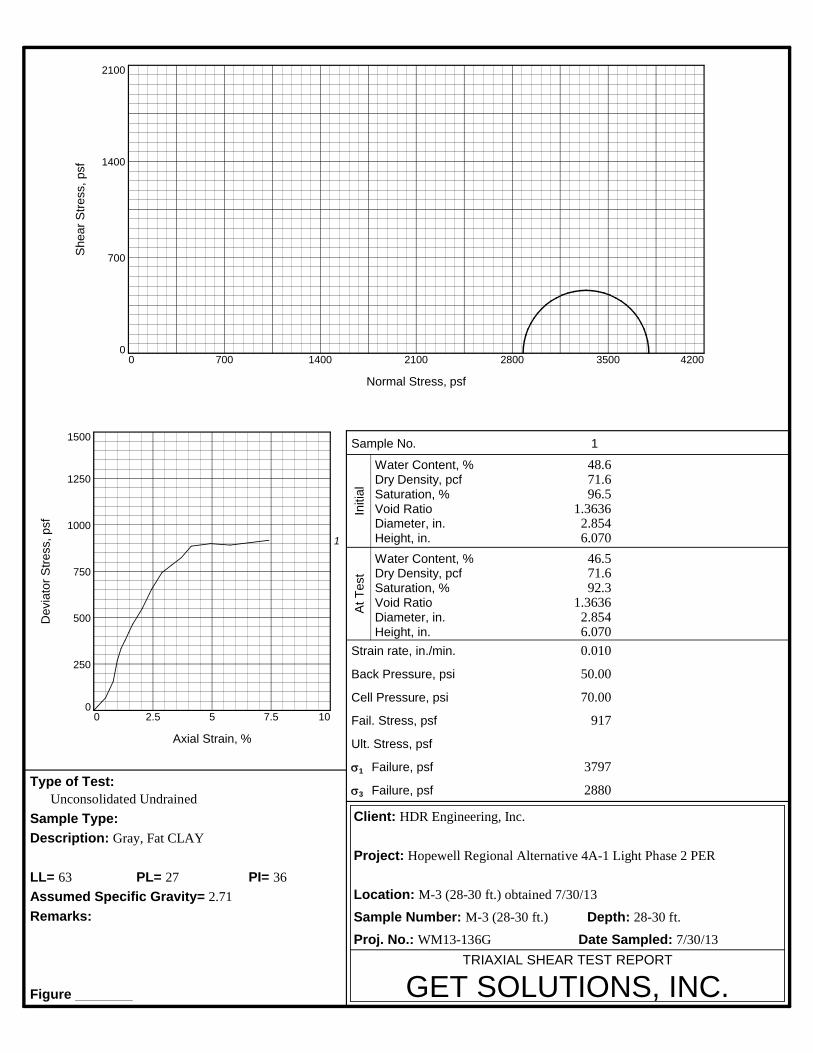
TRIAXIAL SHEAR TEST REPORT
GET SOLUTIONS, INC.
Client: HDR Engineering, Inc.
Project: Hopewell Regional Alternative 4A-1 Light Phase 2 PER
Location: M-3 (28-30 ft.) obtained 7/30/13
Sample Number: M-3 (28-30 ft.) Depth: 28-30 ft.
Proj. No.: WM13-136G Date Sampled: 7/30/13
Type of Test: Unconsolidated Undrained
Sample Type:
Description: Gray, Fat CLAY
LL= 63 PI= 36PL= 27
Assumed Specific Gravity= 2.71
Remarks:
Figure
Sample No.
Water Content, %Dry Density, pcfSaturation, %Void RatioDiameter, in.Height, in.
Water Content, %Dry Density, pcfSaturation, %Void RatioDiameter, in.Height, in.
Strain rate, in./min.
Back Pressure, psi
Cell Pressure, psi
Fail. Stress, psf
Ult. Stress, psf
1 Failure, psf
3 Failure, psf
Initi
alA
t T
est
1
48.671.696.5
1.36362.8546.070
46.571.692.3
1.36362.8546.070
0.010
50.00
70.00
917
2880
3797
Dev
iato
r S
tres
s, p
sf
0
250
500
750
1000
1250
1500
Axial Strain, %
0 2.5 5 7.5 10
1
She
ar S
tres
s, p
sf
0
700
1400
2100
Normal Stress, psf
0 700 1400 2100 2800 3500 4200

Client: HDR Engineering, Inc.
Project: Hopewell Regional Alternative 4A-1 Light Phase 2 PER
Location: M-3 (28-30 ft.) obtained 7/30/13 Depth: 28-30 ft. Sample Number: M-3 (28-30 ft.)
Project No.: WM13-136G Figure GET Solutions, Inc.
q, p
sf
0
600
1200
1800
p, psfStress Paths: o indicates peak + indicates end
0 600 1200 1800 2400 3000 3600
Peak StrengthTotal
a==
tan =
458 psf
0.0 deg
0.00
Dev
iato
r S
tres
sps
f
0
250
500
750
1000
1250
0% 4% 8%
1
Dev
iato
r S
tres
sps
f
0
250
500
750
1000
1250
0% 4% 8%
3
Dev
iato
r S
tres
sps
f
0
250
500
750
1000
1250
0% 4% 8%
2
Dev
iato
r S
tres
sps
f
0
250
500
750
1000
1250
0% 4% 8%
4

APPENDIX VII
STRESS-DEFORMATION FINITE ELEMENT ANALYSIS RESULTS

Shallow Stiff Sandy CLAY (CL)
Silty SAND (SM)Soft Silty CLAY (CH)
Dense Silty SAND (SM)
Lower CLAY (CL)
Existing Subsurface Profile
-30 20 70 120 170 220 270 320 370-80
-70
-60
-50
-40
-30
-20
-10
0
10
20
30
40

-0.16 -0.14-0.12
-0.08
-0.06
0
Shallow Stiff Sandy CLAY (CL)
Silty SAND (SM)Soft Silty CLAY (CH)
Dense Silty SAND (SM)
Lower CLAY (CL)
Loaded Tank Deformation Profile
Structural FIll
-30 20 70 120 170 220 270 320 370-80
-70
-60
-50
-40
-30
-20
-10
0
10
20
30
40

Loaded Tank DeformationReport generated using GeoStudio 2012. Copyright © 1991-2013 GEO-SLOPE International Ltd.
File InformationTitle: Hopewell - East AlignmentCreated By: Bruce SpiroLast Edited By: Bruce SpiroRevision Number: 192File Version: 8.2Tool Version: 8.12.2.7663Date: 10/23/2013Time: 4:00:47 PMFile Name: Hopewell - East.gszDirectory: C:\Users\bspiro\Documents\Hopewell\Analysis\East\Last Solved Date: 10/23/2013Last Solved Time: 4:01:47 PM
Project SettingsLength(L) Units: feetTime(t) Units: SecondsForce(F) Units: lbfPressure(p) Units: psfStrength Units: psfStiffness Units: psfUnit Weight of Water: 62.4 pcfAir Pressure: 101.33 psfView: 2DElement Thickness: 1
Analysis SettingsLoaded Tank Deformation
Description: Tank at Elev 21Kind: SIGMA/WParent: Earthwork Phase (Initial)Method: Load/DeformationSettings
Initial Stress: Parent AnalysisInitial PWP: Water TableExclude cumulative values: No
ControlApply Body Force in All Steps: No
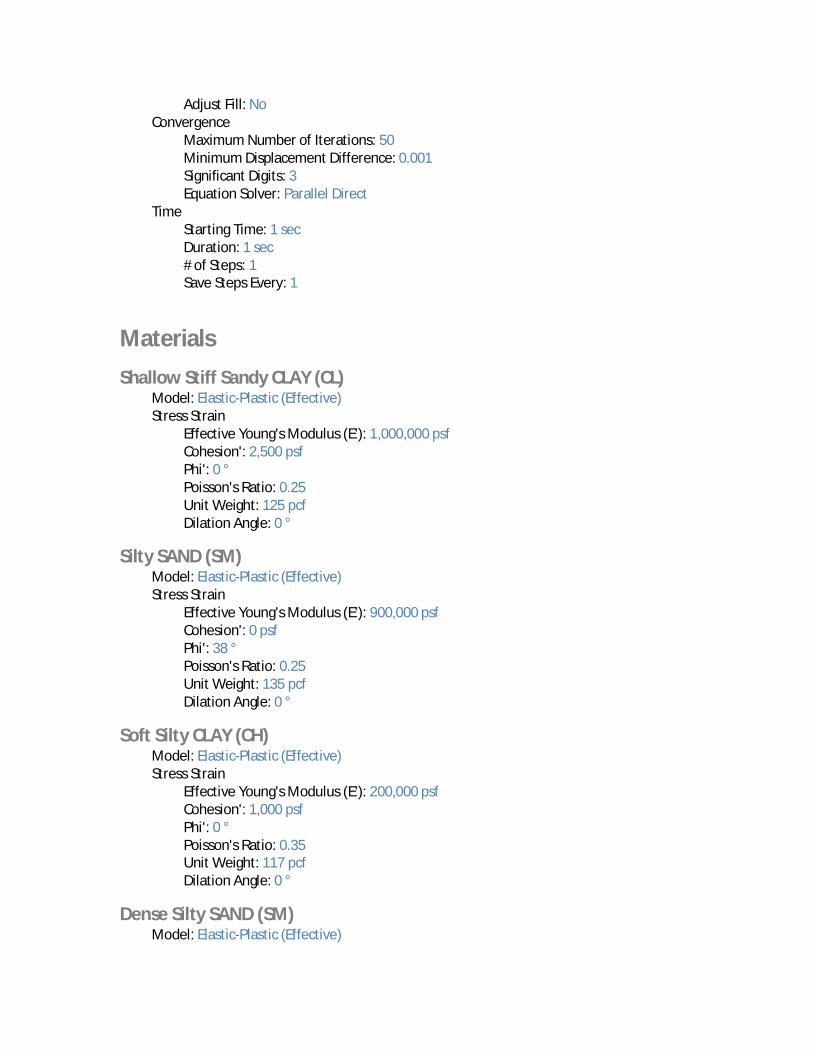
Adjust Fill: NoConvergence
Maximum Number of Iterations: 50Minimum Displacement Difference: 0.001Significant Digits: 3Equation Solver: Parallel Direct
TimeStarting Time: 1 secDuration: 1 sec# of Steps: 1Save Steps Every: 1
MaterialsShallow Stiff Sandy CLAY (CL)
Model: Elastic-Plastic (Effective)Stress Strain
Effective Young's Modulus (E'): 1,000,000 psfCohesion': 2,500 psfPhi': 0 °Poisson's Ratio: 0.25Unit Weight: 125 pcfDilation Angle: 0 °
Silty SAND (SM)Model: Elastic-Plastic (Effective)Stress Strain
Effective Young's Modulus (E'): 900,000 psfCohesion': 0 psfPhi': 38 °Poisson's Ratio: 0.25Unit Weight: 135 pcfDilation Angle: 0 °
Soft Silty CLAY (CH)Model: Elastic-Plastic (Effective)Stress Strain
Effective Young's Modulus (E'): 200,000 psfCohesion': 1,000 psfPhi': 0 °Poisson's Ratio: 0.35Unit Weight: 117 pcfDilation Angle: 0 °
Dense Silty SAND (SM)Model: Elastic-Plastic (Effective)

Stress StrainEffective Young's Modulus (E'): 1,300,000 psfCohesion': 0 psfPhi': 36 °Poisson's Ratio: 0.25Unit Weight: 135 pcfDilation Angle: 0 °
Concrete TankModel: Linear Elastic (Effective)Stress Strain
Effective Young's Modulus (E'): 5.8e+008 psfUnit Weight: 150 pcfPoisson's Ratio: 0.15
Structural FillModel: Elastic-Plastic (Effective)Stress Strain
Effective Young's Modulus (E'): 800,000 psfCohesion': 0 psfPhi': 34 °Poisson's Ratio: 0.25Unit Weight: 125 pcfDilation Angle: 0 °
Lower CLAY (CL)Model: Elastic-Plastic (Effective)Stress Strain
Effective Young's Modulus (E'): 800,000 psfCohesion': 2,000 psfPhi': 0 °Poisson's Ratio: 0.3Unit Weight: 120 pcfDilation Angle: 0 °
Boundary ConditionsFixed X
X: X-Displacement 0
Fixed X/YX: X-Displacement 0Y: Y-Displacement 0
Tank Load 2X: X-Stress 0

Y: Y-Stress -1560
Initial Water TablesInitial Water Table 1
Max. negative head: 0Coordinates
Coordinate 1: (-20, 5) ftCoordinate 2: (360, 0) ft
PointsX (ft) Y (ft)
Point 1 140 17
Point 2 22 23
Point 3 148 23
Point 4 22 30.5
Point 5 22 21
Point 6 158 21
Point 7 160 21
Point 8 160 25
Point 9 158 25
Point 10 20 2
Point 11 20 -8
Point 12 20 -18
Point 13 20 -23
Point 14 20 -28
Point 15 -20 -8
Point 16 -20 -18
Point 17 -20 -23
Point 18 -20 -28
Point 19 140 -5
Point 20 165 25
Point 21 231 3
Point 22 205 5
Point 23 160 20
Point 24 156 21

Point 25 158 23
Point 26 20 30
Point 27 22 36
Point 28 20 36
Point 29 160 36
Point 30 158 36
Point 31 140 -14
Point 32 360 -5
Point 33 360 -14
Point 34 -20 2
Point 35 -20 25
Point 36 0 25
Point 37 20 21
Point 38 40 35
Point 39 100 35
Point 40 100 -23
Point 41 165 18
Point 42 360 0
Point 43 360 -70
Point 44 -20 -70
Point 45 72 21
Point 46 76 23
Point 47 102 36
Point 48 112 41
Point 49 160 41
Point 50 177 21
LinesStart Point End Point Stress/Strain Boundary
Line 1 39 3
Line 2 2 4
Line 3 26 4
Line 4 2 5
Line 5 5 37
Line 6 37 26

Line 7 3 24
Line 8 3 25 Tank Load 2
Line 9 25 6
Line 10 6 24
Line 11 25 9
Line 12 9 30
Line 13 30 29
Line 14 29 8
Line 15 8 7
Line 16 7 6
Line 17 35 36
Line 18 36 26
Line 19 24 23
Line 20 23 41
Line 21 41 1
Line 22 1 10
Line 23 10 34
Line 24 34 35 Fixed X
Line 25 8 20
Line 26 21 22
Line 27 22 41
Line 28 21 42
Line 29 42 32 Fixed X
Line 30 32 19
Line 31 19 11
Line 32 11 15
Line 33 15 34 Fixed X
Line 34 16 15 Fixed X
Line 35 32 33 Fixed X
Line 36 33 31
Line 37 31 12
Line 38 12 16
Line 39 17 13
Line 40 13 40
Line 41 40 14
Line 42 14 18

Line 43 18 17 Fixed X
Line 44 33 43 Fixed X
Line 45 43 44 Fixed X/Y
Line 46 44 18 Fixed X
Line 47 17 16 Fixed X
Line 48 28 27
Line 49 27 4
Line 50 26 28
Line 51 24 45
Line 52 45 5
Line 53 39 47
Line 54 47 30
Line 55 21 29
Line 56 47 48
Line 57 48 49
Line 58 49 21
Line 59 2 46 Tank Load 2
Line 60 46 45
Line 61 3 46 Tank Load 2
Line 62 39 46
Line 63 4 38
Line 64 38 39
Line 65 20 50
Line 66 50 21
Line 67 50 7
RegionsMaterial Points Area (ft²)
Region 1 Concrete Tank 26,4,2,5,37 18.5
Region 2 Concrete Tank 3,25,6,24 12
Region 3 Concrete Tank 6,25,9,30,29,8,7 30
Region 4 Shallow Stiff Sandy CLAY (CL) 35,36,26,37,5,45,24,23,41,1,10,34 2,425.5
Region 5 Silty SAND (SM) 34,10,1,41,22,21,42,32,19,11,15 4,615
Region 6 Soft Silty CLAY (CH) 16,15,11,19,32,33,31,12 3,520
Region 7 Lower CLAY (CL) 17,13,40,14,18 400
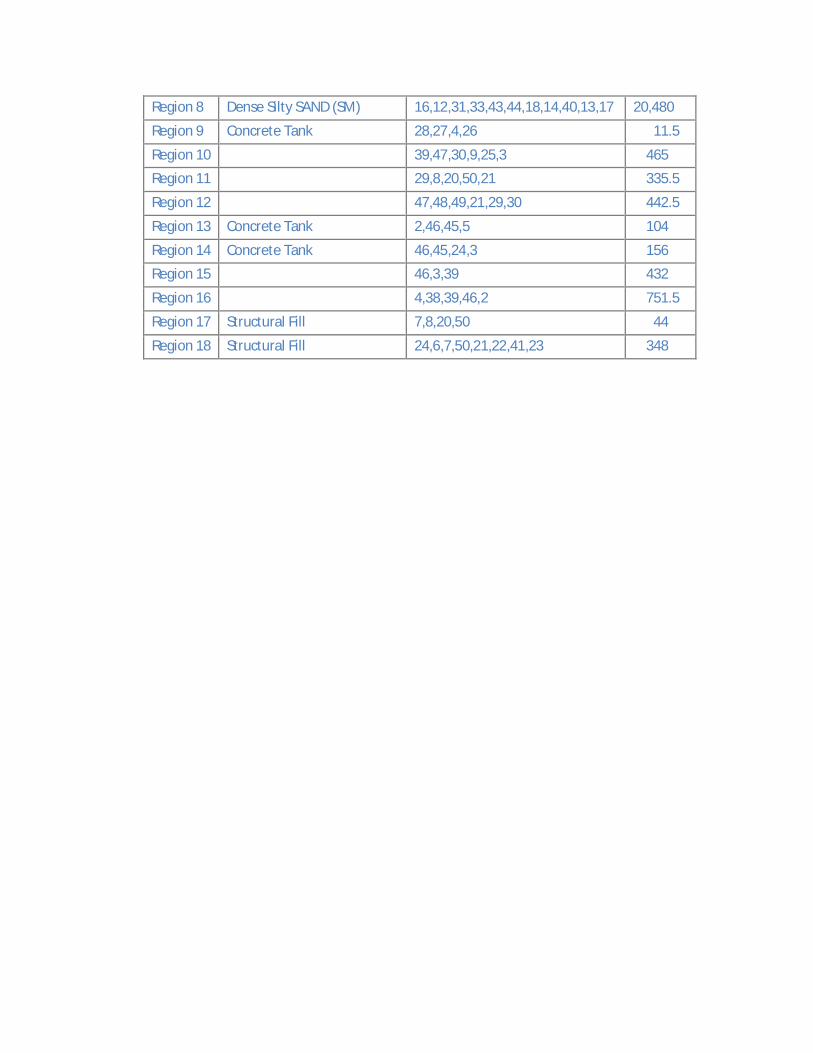
Region 8 Dense Silty SAND (SM) 16,12,31,33,43,44,18,14,40,13,17 20,480
Region 9 Concrete Tank 28,27,4,26 11.5
Region 10 39,47,30,9,25,3 465
Region 11 29,8,20,50,21 335.5
Region 12 47,48,49,21,29,30 442.5
Region 13 Concrete Tank 2,46,45,5 104
Region 14 Concrete Tank 46,45,24,3 156
Region 15 46,3,39 432
Region 16 4,38,39,46,2 751.5
Region 17 Structural Fill 7,8,20,50 44
Region 18 Structural Fill 24,6,7,50,21,22,41,23 348
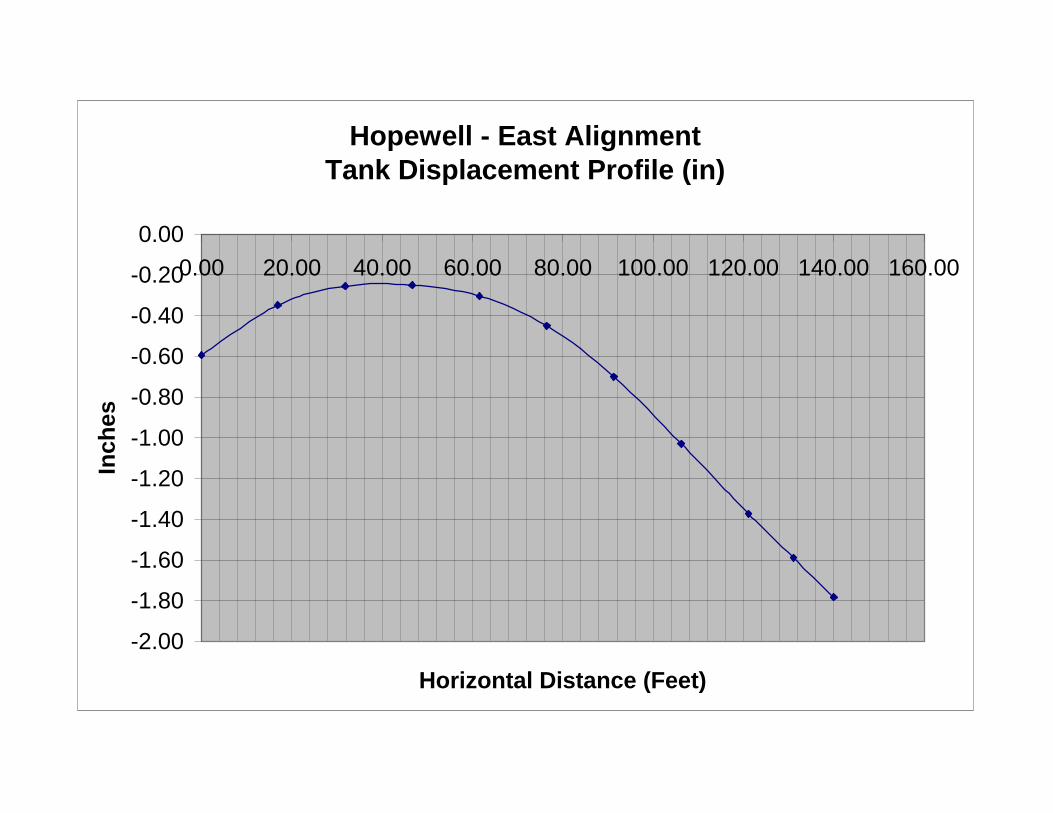
Hopewell - East AlignmentTank Displacement Profile (in)
-2.00
-1.80
-1.60
-1.40
-1.20
-1.00
-0.80
-0.60
-0.40
-0.20
0.000.00 20.00 40.00 60.00 80.00 100.00 120.00 140.00 160.00
Horizontal Distance (Feet)
Inch
es
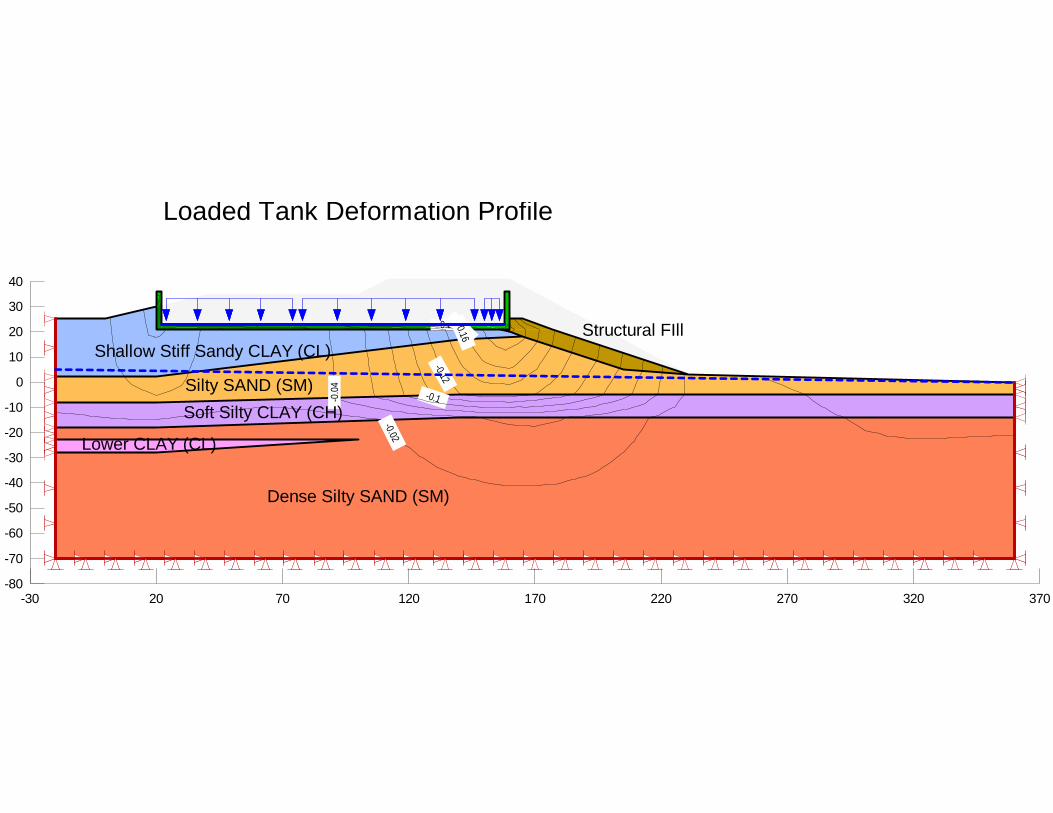
-0.2-0.18
-0.16
-0.12
-0.1-0.0
4
-0.02
Shallow Stiff Sandy CLAY (CL)
Silty SAND (SM)Soft Silty CLAY (CH)
Dense Silty SAND (SM)
Lower CLAY (CL)
Loaded Tank Deformation Profile
Structural FIll
-30 20 70 120 170 220 270 320 370-80
-70
-60
-50
-40
-30
-20
-10
0
10
20
30
40

Loaded Tank DeformationReport generated using GeoStudio 2012. Copyright © 1991-2013 GEO-SLOPE International Ltd.
File InformationTitle: Hopewell - East AlignmentCreated By: Bruce SpiroLast Edited By: Bruce SpiroRevision Number: 190File Version: 8.2Tool Version: 8.12.2.7663Date: 10/23/2013Time: 4:37:00 PMFile Name: Hopewell - East 2.gszDirectory: C:\Users\bspiro\Documents\Hopewell\Analysis\East\Last Solved Date: 10/23/2013Last Solved Time: 4:37:57 PM
Project SettingsLength(L) Units: feetTime(t) Units: SecondsForce(F) Units: lbfPressure(p) Units: psfStrength Units: psfStiffness Units: psfUnit Weight of Water: 62.4 pcfAir Pressure: 101.33 psfView: 2DElement Thickness: 1
Analysis SettingsLoaded Tank Deformation
Description: Tank at Elev 21Kind: SIGMA/WParent: Earthwork Phase (Initial)Method: Load/DeformationSettings
Initial Stress: Parent AnalysisInitial PWP: Water TableExclude cumulative values: No
ControlApply Body Force in All Steps: No

Adjust Fill: NoConvergence
Maximum Number of Iterations: 50Minimum Displacement Difference: 0.001Significant Digits: 3Equation Solver: Parallel Direct
TimeStarting Time: 1 secDuration: 1 sec# of Steps: 1Save Steps Every: 1
MaterialsShallow Stiff Sandy CLAY (CL)
Model: Elastic-Plastic (Effective)Stress Strain
Effective Young's Modulus (E'): 900,000 psfCohesion': 2,500 psfPhi': 0 °Poisson's Ratio: 0.25Unit Weight: 125 pcfDilation Angle: 0 °
Silty SAND (SM)Model: Elastic-Plastic (Effective)Stress Strain
Effective Young's Modulus (E'): 800,000 psfCohesion': 0 psfPhi': 38 °Poisson's Ratio: 0.25Unit Weight: 135 pcfDilation Angle: 0 °
Soft Silty CLAY (CH)Model: Elastic-Plastic (Effective)Stress Strain
Effective Young's Modulus (E'): 107,500 psfCohesion': 1,000 psfPhi': 0 °Poisson's Ratio: 0.35Unit Weight: 117 pcfDilation Angle: 0 °
Dense Silty SAND (SM)Model: Elastic-Plastic (Effective)

Stress StrainEffective Young's Modulus (E'): 1,300,000 psfCohesion': 0 psfPhi': 36 °Poisson's Ratio: 0.25Unit Weight: 135 pcfDilation Angle: 0 °
Concrete TankModel: Linear Elastic (Effective)Stress Strain
Effective Young's Modulus (E'): 5.8e+008 psfUnit Weight: 150 pcfPoisson's Ratio: 0.15
Structural FillModel: Elastic-Plastic (Effective)Stress Strain
Effective Young's Modulus (E'): 800,000 psfCohesion': 0 psfPhi': 34 °Poisson's Ratio: 0.25Unit Weight: 125 pcfDilation Angle: 0 °
Lower CLAY (CL)Model: Elastic-Plastic (Effective)Stress Strain
Effective Young's Modulus (E'): 800,000 psfCohesion': 2,000 psfPhi': 0 °Poisson's Ratio: 0.3Unit Weight: 120 pcfDilation Angle: 0 °
Boundary ConditionsFixed X
X: X-Displacement 0
Fixed X/YX: X-Displacement 0Y: Y-Displacement 0
Tank Load 2X: X-Stress 0
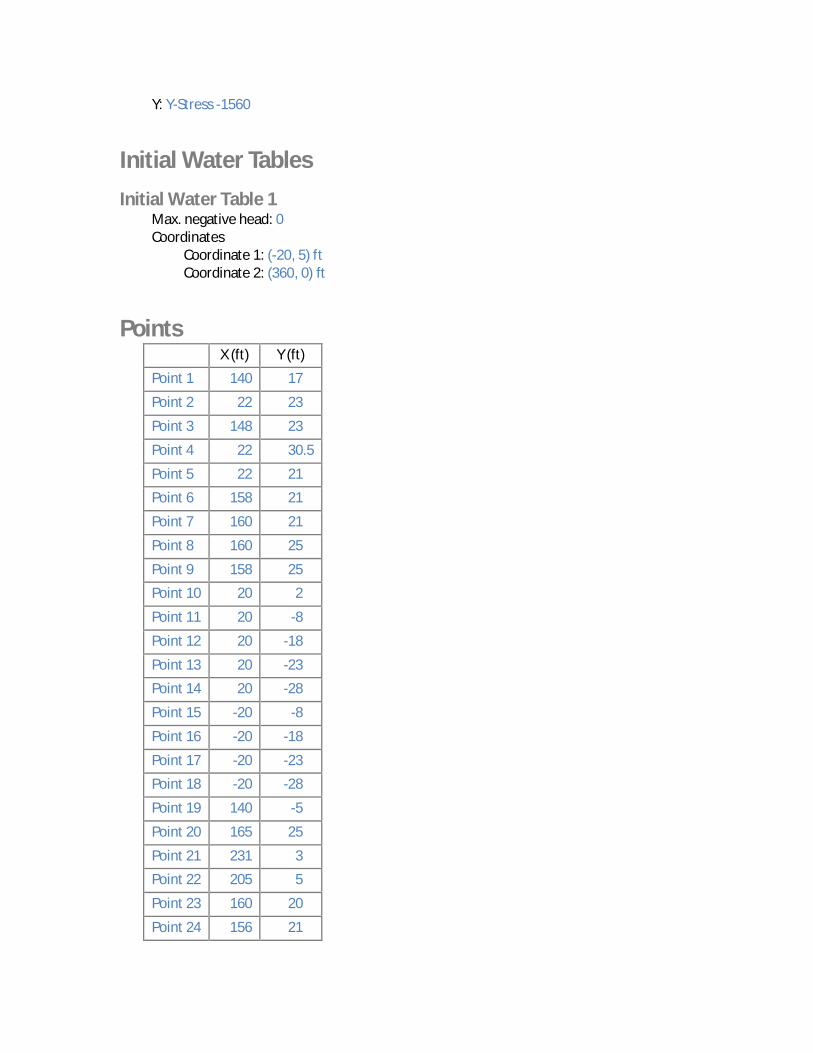
Y: Y-Stress -1560
Initial Water TablesInitial Water Table 1
Max. negative head: 0Coordinates
Coordinate 1: (-20, 5) ftCoordinate 2: (360, 0) ft
PointsX (ft) Y (ft)
Point 1 140 17
Point 2 22 23
Point 3 148 23
Point 4 22 30.5
Point 5 22 21
Point 6 158 21
Point 7 160 21
Point 8 160 25
Point 9 158 25
Point 10 20 2
Point 11 20 -8
Point 12 20 -18
Point 13 20 -23
Point 14 20 -28
Point 15 -20 -8
Point 16 -20 -18
Point 17 -20 -23
Point 18 -20 -28
Point 19 140 -5
Point 20 165 25
Point 21 231 3
Point 22 205 5
Point 23 160 20
Point 24 156 21
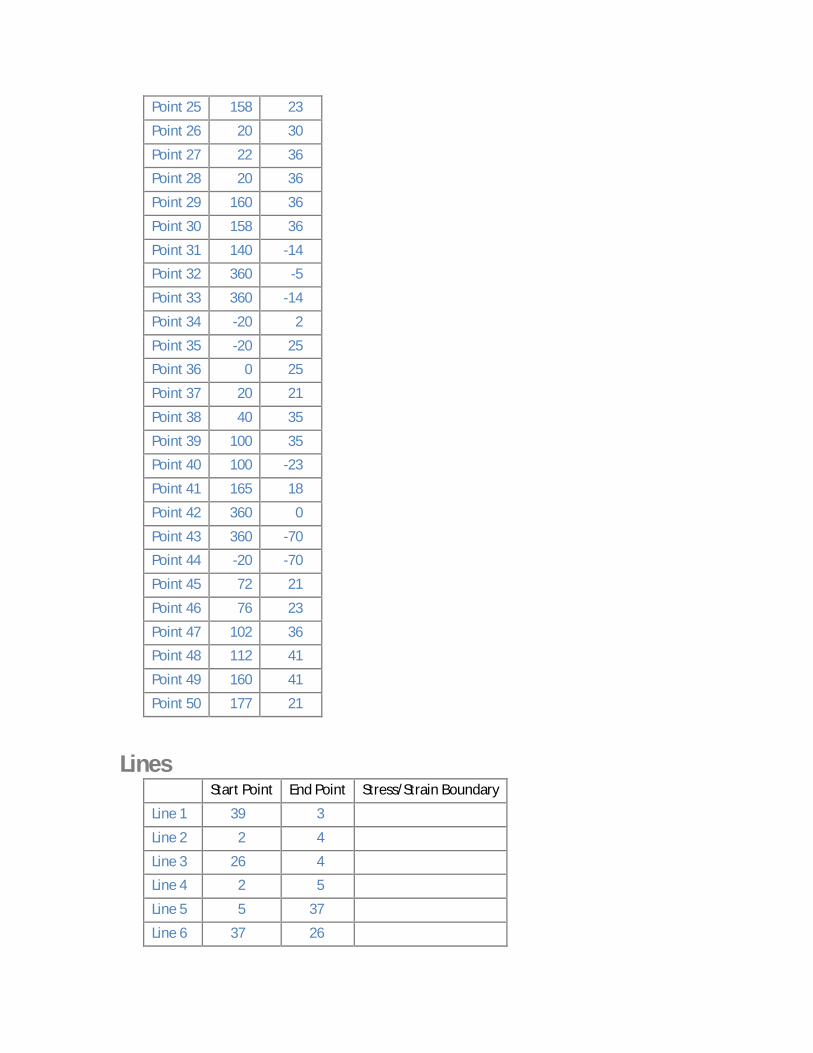
Point 25 158 23
Point 26 20 30
Point 27 22 36
Point 28 20 36
Point 29 160 36
Point 30 158 36
Point 31 140 -14
Point 32 360 -5
Point 33 360 -14
Point 34 -20 2
Point 35 -20 25
Point 36 0 25
Point 37 20 21
Point 38 40 35
Point 39 100 35
Point 40 100 -23
Point 41 165 18
Point 42 360 0
Point 43 360 -70
Point 44 -20 -70
Point 45 72 21
Point 46 76 23
Point 47 102 36
Point 48 112 41
Point 49 160 41
Point 50 177 21
LinesStart Point End Point Stress/Strain Boundary
Line 1 39 3
Line 2 2 4
Line 3 26 4
Line 4 2 5
Line 5 5 37
Line 6 37 26
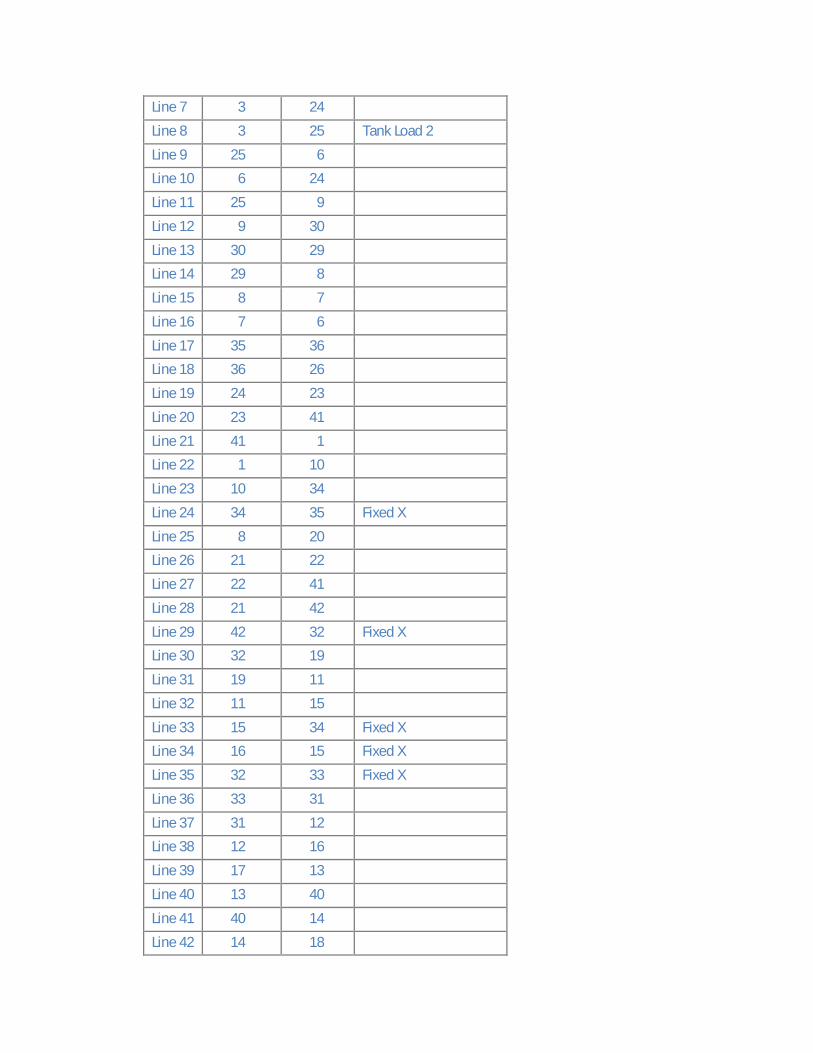
Line 7 3 24
Line 8 3 25 Tank Load 2
Line 9 25 6
Line 10 6 24
Line 11 25 9
Line 12 9 30
Line 13 30 29
Line 14 29 8
Line 15 8 7
Line 16 7 6
Line 17 35 36
Line 18 36 26
Line 19 24 23
Line 20 23 41
Line 21 41 1
Line 22 1 10
Line 23 10 34
Line 24 34 35 Fixed X
Line 25 8 20
Line 26 21 22
Line 27 22 41
Line 28 21 42
Line 29 42 32 Fixed X
Line 30 32 19
Line 31 19 11
Line 32 11 15
Line 33 15 34 Fixed X
Line 34 16 15 Fixed X
Line 35 32 33 Fixed X
Line 36 33 31
Line 37 31 12
Line 38 12 16
Line 39 17 13
Line 40 13 40
Line 41 40 14
Line 42 14 18

Line 43 18 17 Fixed X
Line 44 33 43 Fixed X
Line 45 43 44 Fixed X/Y
Line 46 44 18 Fixed X
Line 47 17 16 Fixed X
Line 48 28 27
Line 49 27 4
Line 50 26 28
Line 51 24 45
Line 52 45 5
Line 53 39 47
Line 54 47 30
Line 55 21 29
Line 56 47 48
Line 57 48 49
Line 58 49 21
Line 59 2 46 Tank Load 2
Line 60 46 45
Line 61 3 46 Tank Load 2
Line 62 39 46
Line 63 4 38
Line 64 38 39
Line 65 20 50
Line 66 50 21
Line 67 50 7
RegionsMaterial Points Area (ft²)
Region 1 Concrete Tank 26,4,2,5,37 18.5
Region 2 Concrete Tank 3,25,6,24 12
Region 3 Concrete Tank 6,25,9,30,29,8,7 30
Region 4 Shallow Stiff Sandy CLAY (CL) 35,36,26,37,5,45,24,23,41,1,10,34 2,425.5
Region 5 Silty SAND (SM) 34,10,1,41,22,21,42,32,19,11,15 4,615
Region 6 Soft Silty CLAY (CH) 16,15,11,19,32,33,31,12 3,520
Region 7 Lower CLAY (CL) 17,13,40,14,18 400

Region 8 Dense Silty SAND (SM) 16,12,31,33,43,44,18,14,40,13,17 20,480
Region 9 Concrete Tank 28,27,4,26 11.5
Region 10 39,47,30,9,25,3 465
Region 11 29,8,20,50,21 335.5
Region 12 47,48,49,21,29,30 442.5
Region 13 Concrete Tank 2,46,45,5 104
Region 14 Concrete Tank 46,45,24,3 156
Region 15 46,3,39 432
Region 16 4,38,39,46,2 751.5
Region 17 Structural Fill 7,8,20,50 44
Region 18 Structural Fill 24,6,7,50,21,22,41,23 348
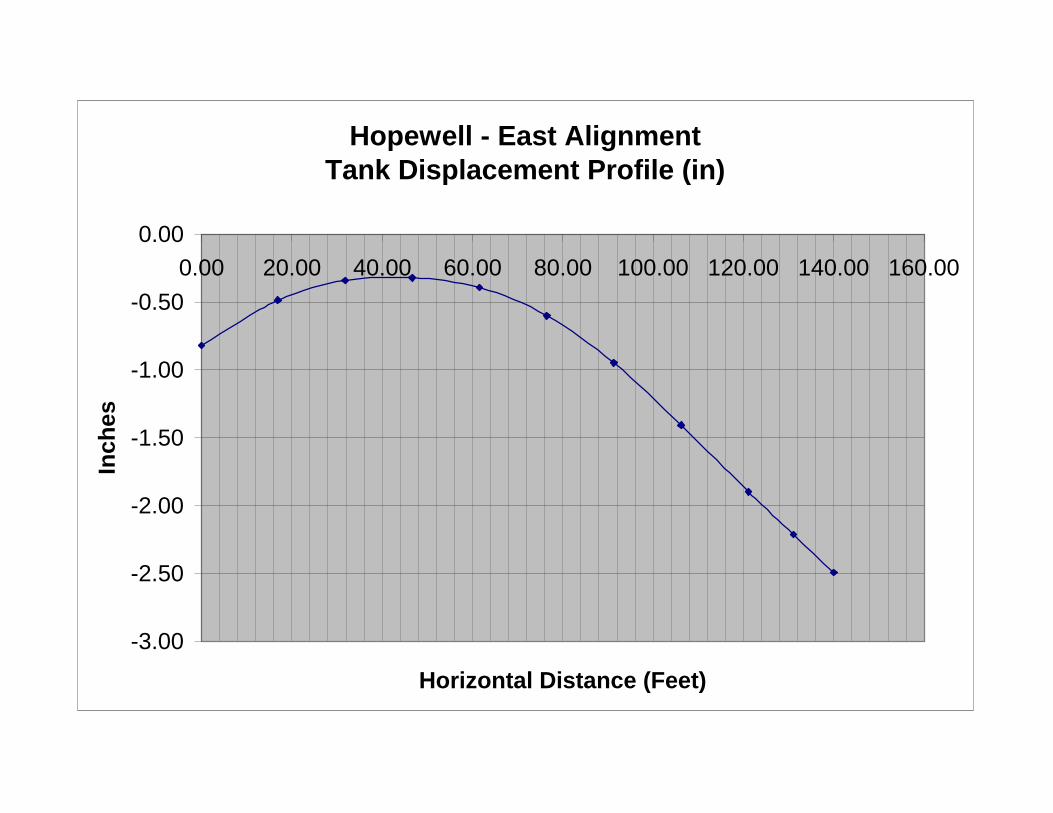
Hopewell - East AlignmentTank Displacement Profile (in)
-3.00
-2.50
-2.00
-1.50
-1.00
-0.50
0.000.00 20.00 40.00 60.00 80.00 100.00 120.00 140.00 160.00
Horizontal Distance (Feet)
Inch
es

APPENDIX VIII
SLOPE STABILITY ANALYSIS RESULTS

Shallow Stiff Sandy CLAY (CL)
Silty SAND (SM)Soft Silty CLAY (CH)
Dense Silty SAND (SM)
Lower CLAY (CL)
Existing Subsurface Profile
-30 20 70 120 170 220 270 320 370-80
-70
-60
-50
-40
-30
-20
-10
0
10
20
30
40

1.978
Safety Map
1.978 - 2.0282.028 - 2.0782.078 - 2.1282.128 - 2.1782.178 - 2.228
Shallow Stiff Sandy CLAY (CL)
Silty SAND (SM)Soft Silty CLAY (CH)
Dense Silty SAND (SM)
Lower CLAY (CL)
Slope Stability AnalysisLoaded Tank Profile
-30 20 70 120 170 220 270 320 370-80
-70
-60
-50
-40
-30
-20
-10
0
10
20
30
40

Loaded Tank Slope Stability (Grid)Report generated using GeoStudio 2012. Copyright © 1991-2013 GEO-SLOPE International Ltd.
File InformationTitle: Hopewell - East AlignmentCreated By: Bruce SpiroLast Edited By: Bruce SpiroRevision Number: 192File Version: 8.2Tool Version: 8.12.2.7663Date: 10/23/2013Time: 4:00:47 PMFile Name: Hopewell - East.gszDirectory: C:\Users\bspiro\Documents\Hopewell\Analysis\East\Last Solved Date: 10/23/2013Last Solved Time: 4:01:06 PM
Project SettingsLength(L) Units: feetTime(t) Units: SecondsForce(F) Units: lbfPressure(p) Units: psfStrength Units: psfUnit Weight of Water: 62.4 pcfView: 2DElement Thickness: 1
Analysis SettingsLoaded Tank Slope Stability (Grid)
Description: Tank at Elev 21Kind: SLOPE/WParent: Loaded Tank DeformationMethod: Morgenstern-PriceSettings
Side FunctionInterslice force function option: Half-Sine
LambdaLambda 1: -1Lambda 2: -0.8Lambda 3: -0.6Lambda 4: -0.4
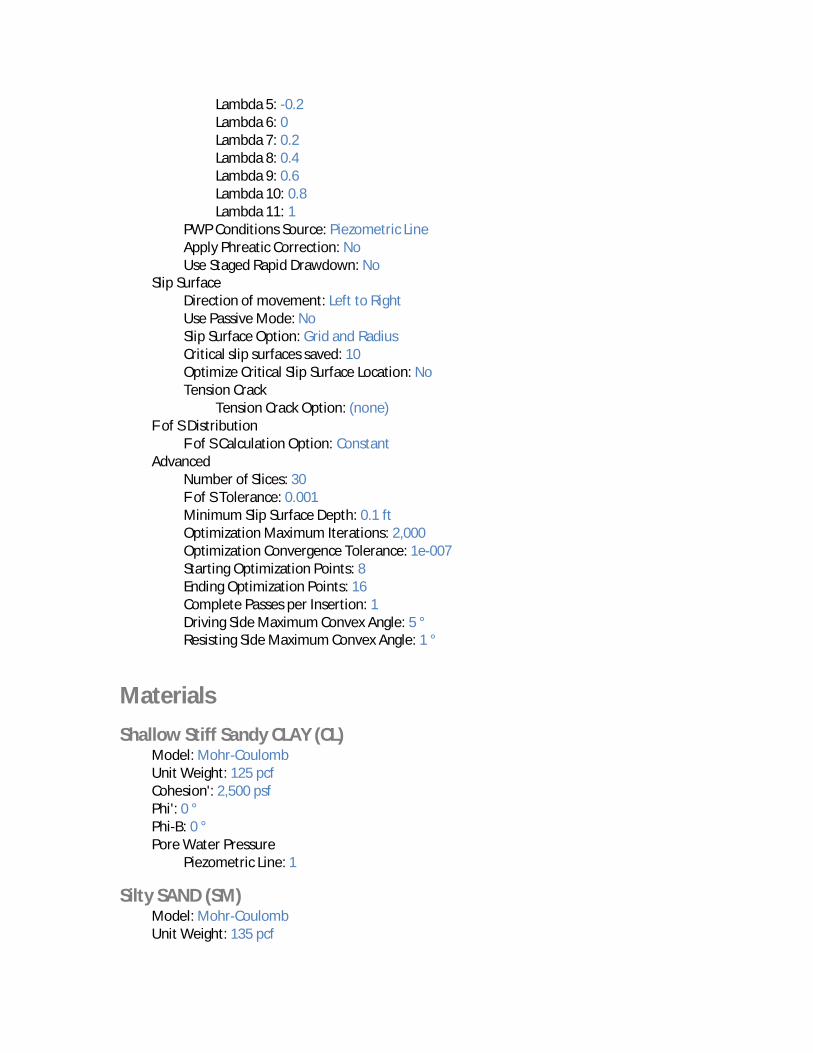
Lambda 5: -0.2Lambda 6: 0Lambda 7: 0.2Lambda 8: 0.4Lambda 9: 0.6Lambda 10: 0.8Lambda 11: 1
PWP Conditions Source: Piezometric LineApply Phreatic Correction: NoUse Staged Rapid Drawdown: No
Slip SurfaceDirection of movement: Left to RightUse Passive Mode: NoSlip Surface Option: Grid and RadiusCritical slip surfaces saved: 10Optimize Critical Slip Surface Location: NoTension Crack
Tension Crack Option: (none)F of S Distribution
F of S Calculation Option: ConstantAdvanced
Number of Slices: 30F of S Tolerance: 0.001Minimum Slip Surface Depth: 0.1 ftOptimization Maximum Iterations: 2,000Optimization Convergence Tolerance: 1e-007Starting Optimization Points: 8Ending Optimization Points: 16Complete Passes per Insertion: 1Driving Side Maximum Convex Angle: 5 °Resisting Side Maximum Convex Angle: 1 °
MaterialsShallow Stiff Sandy CLAY (CL)
Model: Mohr-CoulombUnit Weight: 125 pcfCohesion': 2,500 psfPhi': 0 °Phi-B: 0 °Pore Water Pressure
Piezometric Line: 1
Silty SAND (SM)Model: Mohr-CoulombUnit Weight: 135 pcf
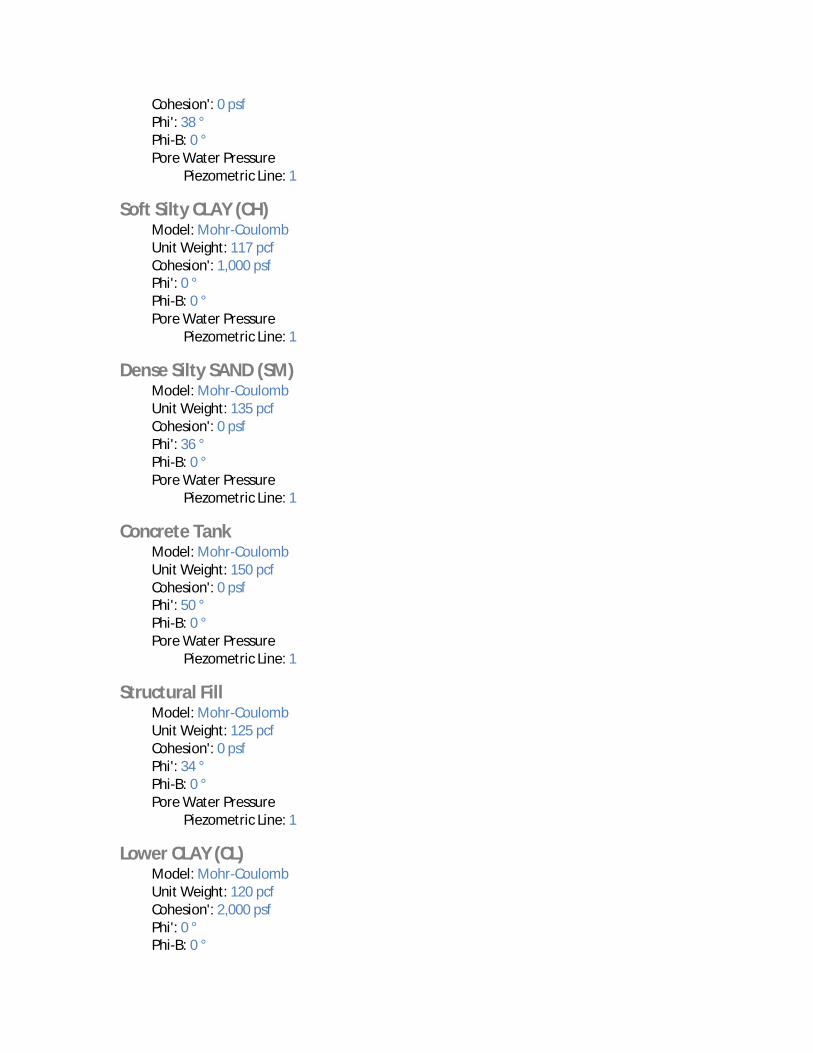
Cohesion': 0 psfPhi': 38 °Phi-B: 0 °Pore Water Pressure
Piezometric Line: 1
Soft Silty CLAY (CH)Model: Mohr-CoulombUnit Weight: 117 pcfCohesion': 1,000 psfPhi': 0 °Phi-B: 0 °Pore Water Pressure
Piezometric Line: 1
Dense Silty SAND (SM)Model: Mohr-CoulombUnit Weight: 135 pcfCohesion': 0 psfPhi': 36 °Phi-B: 0 °Pore Water Pressure
Piezometric Line: 1
Concrete TankModel: Mohr-CoulombUnit Weight: 150 pcfCohesion': 0 psfPhi': 50 °Phi-B: 0 °Pore Water Pressure
Piezometric Line: 1
Structural FillModel: Mohr-CoulombUnit Weight: 125 pcfCohesion': 0 psfPhi': 34 °Phi-B: 0 °Pore Water Pressure
Piezometric Line: 1
Lower CLAY (CL)Model: Mohr-CoulombUnit Weight: 120 pcfCohesion': 2,000 psfPhi': 0 °Phi-B: 0 °

Pore Water PressurePiezometric Line: 1
Slip Surface GridUpper Left: (162, 82) ftLower Left: (166, 37) ftLower Right: (220, 36) ftGrid Horizontal Increment: 10Grid Vertical Increment: 10Left Projection Angle: 0 °Right Projection Angle: 0 °
Slip Surface RadiusUpper Left Coordinate: (143, 19) ftUpper Right Coordinate: (226, 1) ftLower Left Coordinate: (143, -22) ftLower Right Coordinate: (223, -31) ftNumber of Increments: 20Left Projection: NoLeft Projection Angle: 135 °Right Projection: NoRight Projection Angle: 45 °
Slip Surface LimitsLeft Coordinate: (-20, 25) ftRight Coordinate: (360, 0) ft
Piezometric LinesPiezometric Line 1
Coordinates
X (ft) Y (ft)
Coordinate 1 -20 5
Coordinate 2 360 0
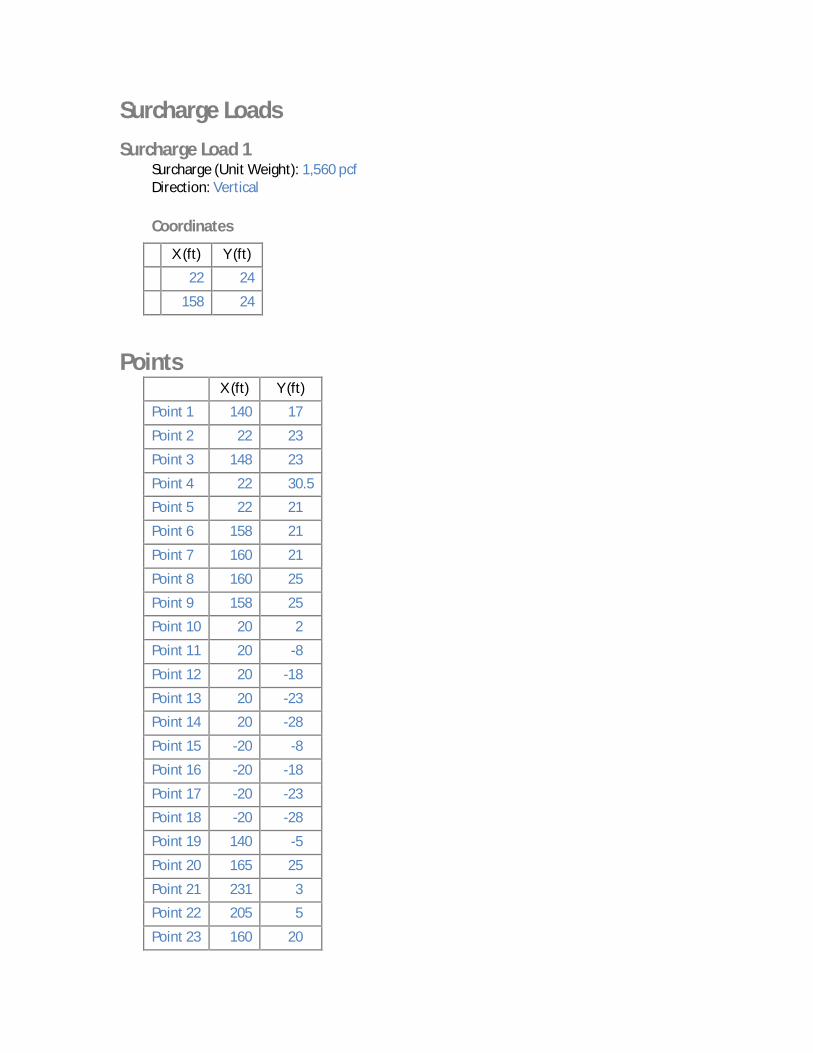
Surcharge LoadsSurcharge Load 1
Surcharge (Unit Weight): 1,560 pcfDirection: Vertical
Coordinates
X (ft) Y (ft)
22 24
158 24
PointsX (ft) Y (ft)
Point 1 140 17
Point 2 22 23
Point 3 148 23
Point 4 22 30.5
Point 5 22 21
Point 6 158 21
Point 7 160 21
Point 8 160 25
Point 9 158 25
Point 10 20 2
Point 11 20 -8
Point 12 20 -18
Point 13 20 -23
Point 14 20 -28
Point 15 -20 -8
Point 16 -20 -18
Point 17 -20 -23
Point 18 -20 -28
Point 19 140 -5
Point 20 165 25
Point 21 231 3
Point 22 205 5
Point 23 160 20
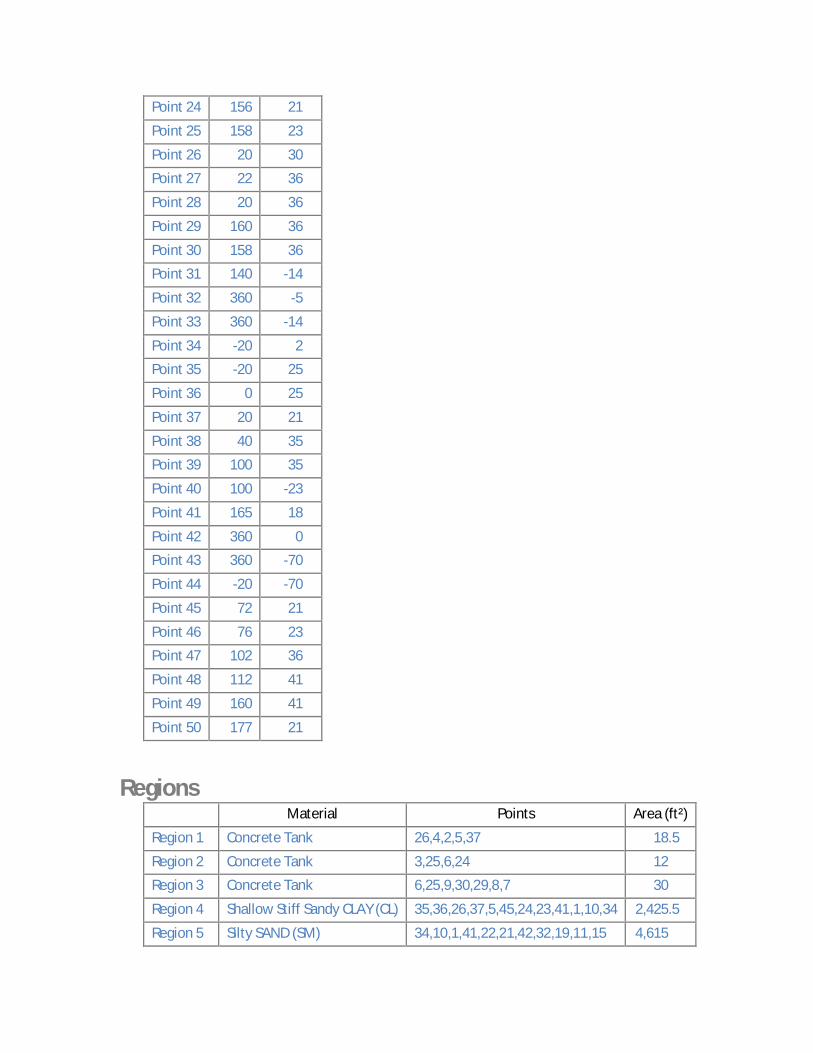
Point 24 156 21
Point 25 158 23
Point 26 20 30
Point 27 22 36
Point 28 20 36
Point 29 160 36
Point 30 158 36
Point 31 140 -14
Point 32 360 -5
Point 33 360 -14
Point 34 -20 2
Point 35 -20 25
Point 36 0 25
Point 37 20 21
Point 38 40 35
Point 39 100 35
Point 40 100 -23
Point 41 165 18
Point 42 360 0
Point 43 360 -70
Point 44 -20 -70
Point 45 72 21
Point 46 76 23
Point 47 102 36
Point 48 112 41
Point 49 160 41
Point 50 177 21
RegionsMaterial Points Area (ft²)
Region 1 Concrete Tank 26,4,2,5,37 18.5
Region 2 Concrete Tank 3,25,6,24 12
Region 3 Concrete Tank 6,25,9,30,29,8,7 30
Region 4 Shallow Stiff Sandy CLAY (CL) 35,36,26,37,5,45,24,23,41,1,10,34 2,425.5
Region 5 Silty SAND (SM) 34,10,1,41,22,21,42,32,19,11,15 4,615

Region 6 Soft Silty CLAY (CH) 16,15,11,19,32,33,31,12 3,520
Region 7 Lower CLAY (CL) 17,13,40,14,18 400
Region 8 Dense Silty SAND (SM) 16,12,31,33,43,44,18,14,40,13,17 20,480
Region 9 Concrete Tank 28,27,4,26 11.5
Region 10 39,47,30,9,25,3 465
Region 11 29,8,20,50,21 335.5
Region 12 47,48,49,21,29,30 442.5
Region 13 Concrete Tank 2,46,45,5 104
Region 14 Concrete Tank 46,45,24,3 156
Region 15 46,3,39 432
Region 16 4,38,39,46,2 751.5
Region 17 Structural Fill 7,8,20,50 44
Region 18 Structural Fill 24,6,7,50,21,22,41,23 348
Current Slip SurfaceSlip Surface: 1,274F of S: 1.978Volume: 2,454.661 ft³Weight: 319,909.81 lbsResisting Moment: 12,304,755 lbs-ftActivating Moment: 6,218,965.7 lbs-ftResisting Force: 139,829.16 lbsActivating Force: 70,774.633 lbsF of S Rank: 1Exit: (237.68906, 2.8444405) ftEntry: (127.46013, 23) ftRadius: 73.029548 ftCenter: (191, 59) ft
Slip Slices
X (ft) Y (ft) PWP (psf)Base
NormalStress (psf)
FrictionalStrength
(psf)
CohesiveStrength
(psf)
Slice1
128.04788 22 -1,182.3551 842.2335 1,003.7348 0
Slice2
130.30494 18.498391 -965.70788 291.46116 0 2,500
Slice3
133.98069 13.483297 -655.784 1,856.6426 1,450.5682 0

Slice4
137.99356 8.8491312 -369.90682 2,365.4681 1,848.1062 0
Slice5
142.1594 4.7831804 -119.61186 2,848.6433 2,225.6041 0
Slice6
146.1594 1.4049124 87.907854 3,302.0143 2,511.1352 0
Slice7
149.95613 -1.3582611 257.21257 3,718.6454 2,704.3677 0
Slice8
153.95613 -3.8922873 412.05159 4,127.2452 2,902.6273 0
Slice9
157 -5.6222724 517.50348 4,811.798 0 1,000
Slice10
159 -6.6359445 579.11452 5,316.6179 0 1,000
Slice11
162.5 -8.1840026 672.83966 3,887.6209 0 1,000
Slice12
167 -9.9407727 778.76737 4,075.6538 0 1,000
Slice13
171 -11.206768 854.48128 4,123.1018 0 1,000
Slice14
175 -12.225789 914.78399 4,148.8329 0 1,000
Slice15
178.98713 -13.006578 960.23154 4,151.3867 0 1,000
Slice16
182.96138 -13.558241 991.39228 4,128.7939 0 1,000
Slice17
186.93564 -13.889196 1,008.7808 4,078.6104 0 1,000
Slice18
191 -14 1,012.3579 3,995.5282 0 1,000
Slice19
195.06436 -13.889196 1,002.1067 3,878.2473 0 1,000
Slice20
199.03862 -13.558241 978.19203 3,726.7578 0 1,000
Slice21
203.01287 -13.006578 940.50514 3,536.7486 0 1,000
Slice22
206.76462 -12.284818 892.38698 3,325.6425 0 1,000

Slice23
210.29387 -11.411034 834.96513 3,097.2913 0 1,000
Slice24
213.82312 -10.34673 765.65485 2,835.831 0 1,000
Slice25
217.35237 -9.0829436 683.8969 2,541.4543 0 1,000
Slice26
220.88162 -7.608283 588.98038 2,214.9389 0 1,000
Slice27
224.41086 -5.9083213 480.00507 1,857.6336 0 1,000
Slice28
228.58774 -3.5504292 329.44316 1,285.7762 747.16929 0
Slice29
233.59367 -0.23587231 118.50468 577.73834 358.79266 0
Slice30
236.9382 2.2367772 -38.534684 125.4991 98.05064 0

1.905
Safety Map
1.905 - 1.9551.955 - 2.0052.005 - 2.0552.055 - 2.1052.105 - 2.155
Shallow Stiff Sandy CLAY (CL)
Silty SAND (SM)Soft Silty CLAY (CH)
Dense Silty SAND (SM)
Lower CLAY (CL)
Slope Stability AnalysisLoaded Tank Profile
-30 20 70 120 170 220 270 320 370-80
-70
-60
-50
-40
-30
-20
-10
0
10
20
30
40

1.262
Safety Map
1.262 - 1.3121.312 - 1.3621.362 - 1.4121.412 - 1.4621.462 - 1.512
Shallow Stiff Sandy CLAY (CL)
Silty SAND (SM)Soft Silty CLAY (CH)
Dense Silty SAND (SM)
Lower CLAY (CL)
Slope Stability AnalysisSurcharge - 20 ft
-30 20 70 120 170 220 270 320 370-80
-70
-60
-50
-40
-30
-20
-10
0
10
20
30
40

1.577
Safety Map
1.577 - 1.6271.627 - 1.6771.677 - 1.7271.727 - 1.7771.777 - 1.827
Shallow Stiff Sandy CLAY (CL)
Silty SAND (SM)Soft Silty CLAY (CH)
Dense Silty SAND (SM)
Lower CLAY (CL)
Slope Stability AnalysisSurcharge - 20 ft
-30 20 70 120 170 220 270 320 370-80
-70
-60
-50
-40
-30
-20
-10
0
10
20
30
40

APPENDIX IX
CPT/DMT TEST RESULTS

ConeTec Inc. Geotechnical and Environmental Site Investigation Contractors
606-S Roxbury Industrial Center, Charles City, VA 23030 Tel: (804) 966-5696 Fax: (804) 966-5697
E-mail: [email protected] Website: www.conetec.com
Richmond Vancouver New Jersey Salt Lake City Edmonton 13-54061
September 11, 2013
Mr. Joe Robinson, P.E.
GET Solutions, Inc.
1592 E. Penniman Road
Williamsburg, VA 23185
Dear Mr. Robinson, Re: CPTu and DMT Testing Hopewell Regional Treatment Facility; Hopewell, VA
We are pleased to enclose our data submission for the CPTu and DMT testing that ConeTec performed for you at the above referenced site on September 5
th and 6
th, 2013.
Three cone penetration tests (CPTu) were completed to depths ranging from approximately 45 feet to 60 feet beneath the existing ground surface. Prior to advancing the cone penetrometer, the soundings were hand augered to a depth of approximately 5 feet. The zero depth refers to the top of the ground surface. A compression model electronic piezo cone penetrometer, with a 15 cm
2 tip and a 225 cm
2 friction sleeve,
was used. The cone is designed with an equal end area friction sleeve and a tip end area ratio of 0.80. At the beginning of the sounding, the cone was outfitted with a vacuum-saturated, six millimeter-thick, porous plastic pore pressure element that is located immediately behind the tip (the U2 location). The cone was advanced using a 20-ton track-mounted cone penetration rig. As the cone was advanced into the ground, tip resistance (qc), sleeve friction (fs) and dynamic pore water pressure (U) were recorded every five centimeters (approximately every two inches) and are included in the attached file. A tabular output of this data and summary of engineering parameters, is included in the .xls files. In addition to the CPT tests, three dilatometer tests (DMT) were completed to depths ranging from approximately 45 feet to 55 feet beneath the existing ground surface. Again, prior to advancing the DMT we hand augered to a depth of approximately 5 feet. The zero depth refers to the top of the ground surface. The dilatometers were advanced using a 20-ton, track-mounted rig. At approximately 1 foot intervals, the penetration was halted and the A and B pressure measurements were taken. At select depths, the C readings were measured. The A pressure measurement is defined as the amount of pressure applied to inflate the membrane to be flush with the plane of the dilatometer blade (A-position). The B pressure measurement is defined as the amount of pressure applied to inflate the membrane to extend 1.1 mm beyond the plane of the dilatometer blade. The C reading is defined as the pressure recorded when the membrane returns to the A-position. Upon completion of the DMT’s we taped the holes in an effort to determine the ground water table. The soundings collapsed shallow and were dry. For the empirical correlation calculations, we assumed the water table based on the CPT soundings that were completed nearby the DMT soundings. Enclosed are tabular and graphical output of the measurements taken in the field and estimated geotechnical parameters based on empirical correlations. The estimated geotechnical parameters are provided only as a first estimation. It is the project engineer’s responsibility to use the measurements taken in the field to calculate the desired parameters based on correlations proven by his/her own experience. No warranty, expressed or implied, is made to the accuracy of these estimated geotechnical

2
parameters. Refer to the Interpretation Methods section of the report for a more detailed explanation of empirical correlations. Thank you very much for using ConeTec. It was a pleasure working with you and your staff and we look forward to working with you again in the future. If you have any questions or require additional information, please do not hesitate to contact us. Best regards,
Alan Sweeney ConeTec, Inc.

Hopewell Regional Treatment FacilitySeptember 5th and 6th, 2013
13-54061
Table 1: Sounding Information TableTest Type Sounding Number Filename Depth (ft) Estimated GWT (ft) Comments
CPTu CPT-1 13-54061_CP01 60.0 31
CPTu CPT-2 13-54061_CP02 45.9 15
CPTu CPT-3 13-54061_CP03 55.8 28
DMT DMT-1 DMT-1 55.0 31*
DMT DMT-2 DMT-2 45.0 15*
DMT DMT-3 DMT-3 55.0 28*
*Note: the estimated gwt for the DMT soundings is based on the adjacent CPT Soundings.

CPTu Plots

0 50 100 150 200 250
0
10
20
30
40
50
60
70
qt (tsf)
De
pth
(fe
et)
0.0 2.5 5.0
fs (tsf)
0.0 2.0 4.0 6.0
Rf (%)
0 100 200 3000
u (ft)
0 3 6 9
SBTn
GETJob No: 13-54061
Date: 09:05:13 09:46
Site: Hopewell Regional Treatment Facility
Sounding: CPT-1
Cone: 367:T1500F15U500
Max Depth: 18.300 m / 60.04 ftDepth Inc: 0.050 m / 0.164 ftAvg Int: Every Point
File: 13-54061_CP01.CORUnit Wt: SBT Chart Soil Zones
SBT: Lunne, Robertson and Powell, 1997Coords: N: 37.29518 E: -77.25478 Page No: 1 of 1
Undefined
Sands
Stiff Sand to Clayey Sand
Stiff Sand to Clayey Sand
Very Stiff Fine Grained
Silt MixturesSilt Mixtures
Silt Mixtures
Clays
Silt Mixtures
Clays
Clays
Silt Mixtures
Sand MixturesSands
Sands
SandsSand MixturesSandsSand MixturesSilt MixturesSand Mixtures
Clays
Silt Mixtures
Sensitive, Fine Grained
Silt Mixtures
Sands
Sand MixturesSandsSilt MixturesSilt Mixtures
Clays
Silt MixturesSilt MixturesSilt MixturesSand Mixtures
HAND AUGER HAND AUGER HAND AUGER HAND AUGER

0 50 100 150 200 250
0
10
20
30
40
50
60
70
qt (tsf)
De
pth
(fe
et)
0.0 2.5 5.0
fs (tsf)
0.0 2.0 4.0 6.0
Rf (%)
0 100 200 3000
u (ft)
0 3 6 9
SBTn
GETJob No: 13-54061
Date: 09:05:13 13:26
Site: Hopewell Regional Treatment Facility
Sounding: CPT-2
Cone: 367:T1500F15U500
Max Depth: 14.000 m / 45.93 ftDepth Inc: 0.050 m / 0.164 ftAvg Int: Every Point
File: 13-54061_CP02.CORUnit Wt: SBT Chart Soil Zones
SBT: Lunne, Robertson and Powell, 1997Coords: N: 37.29514 E: -77.25420 Page No: 1 of 1
Undefined
Sands
Sand Mixtures
Sands
Undefined
Sands
Undefined
Sands
Sand Mixtures
Clays
Sand MixturesSand MixturesSand MixturesClays
ClaysSilt MixturesSandsSand Mixtures
Sands
Sand MixturesUndefined
HAND AUGER HAND AUGER HAND AUGER HAND AUGER

0 50 100 150 200 250
0
10
20
30
40
50
60
70
qt (tsf)
De
pth
(fe
et)
0.0 2.5 5.0
fs (tsf)
0.0 2.0 4.0 6.0
Rf (%)
0 100 200 3000
u (ft)
0 3 6 9
SBTn
GETJob No: 13-54061
Date: 09:05:13 11:50
Site: Hopewell Regional Treatment Facility
Sounding: CPT-3
Cone: 367:T1500F15U500
Max Depth: 17.000 m / 55.77 ftDepth Inc: 0.050 m / 0.164 ftAvg Int: Every Point
File: 13-54061_CP03.CORUnit Wt: SBT Chart Soil Zones
SBT: Lunne, Robertson and Powell, 1997Coords: N: 37.29578 E: -77.25437 Page No: 1 of 1
Undefined
Silt MixturesSand MixturesSandsSand MixturesSands
Sands
Gravelly Sand to SandSand MixturesSand MixturesSilt Mixtures
ClaysClaysSilt MixturesClaysClays
Silt Mixtures
SandsSand MixturesSand Mixtures
Sand Mixtures
Sand Mixtures
UndefinedUndefinedSandsUndefinedSandsClaysClays
Sensitive, Fine Grained
ClaysClaysSand Mixtures
Sand MixturesClaysClaysSilt Mixtures
Clays
Sand MixturesUndefined
Sands
Undefined
HAND AUGER HAND AUGER HAND AUGER HAND AUGER

Dilatometer TestData
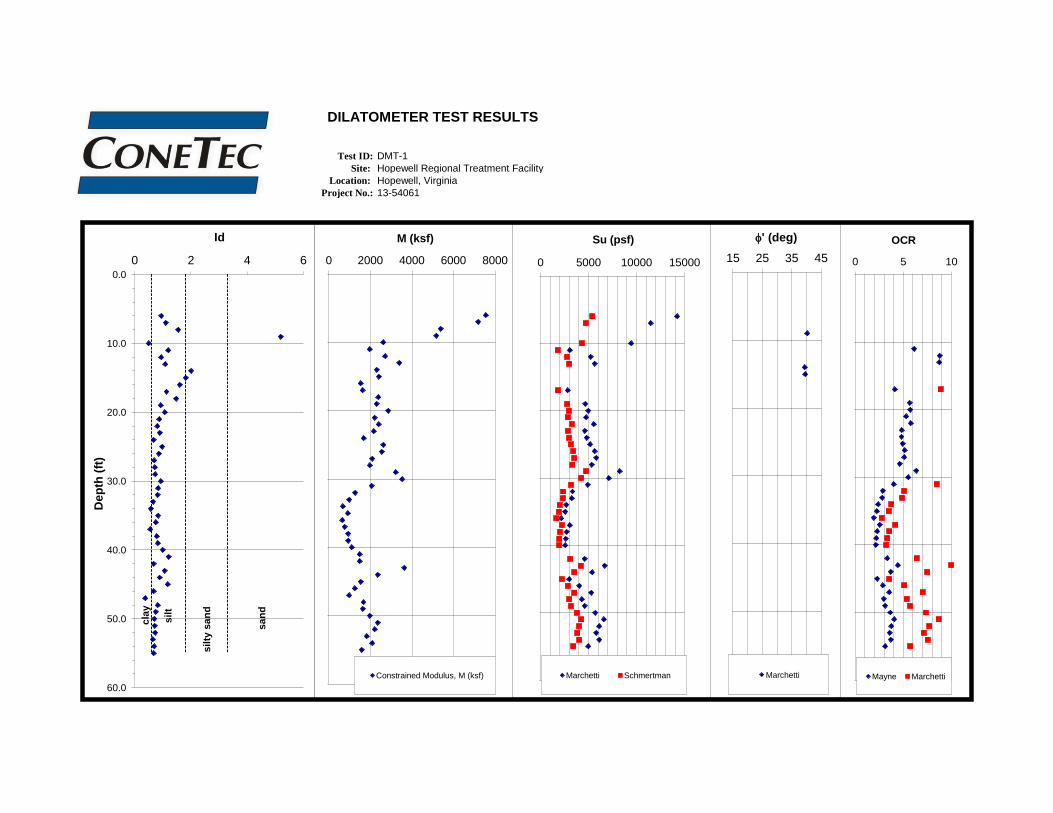
DILATOMETER TEST RESULTS
Test ID: DMT-1
Site: Hopewell Regional Treatment Facility
Location: Hopewell, Virginia
Project No.: 13-54061
0.0
10.0
20.0
30.0
40.0
50.0
60.0
0 2 4 6
Dep
th (
ft)
Id
0 2000 4000 6000 8000
M (ksf)
Constrained Modulus, M (ksf)
0 5 10
OCR
Mayne Marchetti
0 5000 10000 15000
Su (psf)
Marchetti Schmertman
15 25 35 45
f' (deg)
Marchetti
cla
y
silty
san
d
silt
san
d

DILATOMETER TEST RESULTS
Test ID: DMT-1
Site: Hopewell Regional Treatment Facility
Location: Hopewell, Virginia
Project No.: 13-54061
0.0
10.0
20.0
30.0
40.0
50.0
60.0
0 2 4 6
Dep
th (
ft)
Id
0 20 40 60
po and p1 (bar)
po
p1
0 50 100
Horizontal Stress Index, KD
0 500 1000 1500
ED (Bar)
cla
y
silty
san
d
silt
san
d

Job No: 13-54061 Membrane 1 Membrane 2 Membrane 31
Depth Below Existing Ground Surface
Job Name: Hopewell Regional Treatment FacilityDA = 0.225 0 02
Mayne, 1995
Job Location: Hopewell, Virginia DB = 0.975 0 03
Marchetti,1980
Date: 9/6/13 Zm= 0 bar Latitude: 37.295214
Marchetti, 1997
Sounding No: DMT-1 Longitude: -77.254635
Campanella and Robertson, 1991
Ground Water Depth (ft): 316
Marchetti,19807
Schmertman, 1981
Depth1
A B C po p1 p2 uo gT svo svo' EDf'
4ED su
6su
7M
(ft) (bar) (bar) (bar) (bar) (bar) (bar) (psf) (pcf) (psf) (psf) Id KD (bar) KoOCR
2OCR
3(deg) RM (ksf) (psf) (psf) (ksf)
6.0 26.8 51.2 25.9 50.225 0 137 824 824 0.94 65.5 845 5.3 33.4 231.3 4.28 1765 14218 5402 7556
7.0 23.4 48.2 22.4 47.225 0 137 961 961 1.10 48.8 860 4.5 24.8 146.0 4.00 1796 11460 4688 7185
8.0 14.8 36.6 0 14.0 35.625 0 132 1093 1093 1.55 26.7 751 3.43 1568 5379
9.0 6.75 35.6 5.6 34.625 0 128 1221 1221 5.19 9.6 1007 40.3 2.46 2104 5178
10.0 20.8 31.6 20.5 30.625 0 130 1351 1351 0.49 31.8 350 3.6 16.2 74.7 3.59 731 9422 4291 2625
11.0 8.75 19.6 8.5 18.625 0 124 1476 1476 1.19 12.0 352 2.1 6.1 16.4 2.67 734 3055 1774 1964
12.0 13.6 26.6 0 13.2 25.625 0 128 1604 1604 0.94 17.2 430 2.6 8.8 28.8 3.02 898 5209 2764 2707
13.0 14.8 30.8 14.3 29.825 0 130 1734 1734 1.09 17.2 539 2.5 8.8 28.7 3.01 1126 5620 2983 3394
14.0 7.45 22 7.0 21.025 0 125 1860 1860 2.00 7.9 486 39.4 2.28 1016 2313
15.0 8.35 23.2 7.9 22.225 0 126 1986 1986 1.82 8.3 497 39.6 2.32 1039 2414
16.0 6.65 17.6 0 6.4 16.625 0 123 2108 2108 1.60 6.3 355 2.06 742 1529
17.0 8.9 19.4 8.7 18.425 0 124 2233 2233 1.13 8.1 339 1.6 4.1 8.9 2.29 708 2823 1809 1622
18.0 10 24.6 9.6 23.625 0 127 2360 2360 1.47 8.5 488 2.34 1020 2384
19.0 13.6 26.4 13.2 25.425 0 128 2488 2488 0.92 11.1 423 2.0 5.7 14.5 2.60 883 4672 2766 2295
20.0 14.6 30.2 0 14.1 29.225 0 130 2618 2618 1.07 11.3 525 2.0 5.7 14.8 2.61 1096 4991 2946 2862
21.0 14 26.6 13.7 25.625 0 128 2747 2747 0.88 10.4 415 1.9 5.3 13.1 2.54 867 4735 2852 2200
22.0 16 29.2 15.6 28.225 0 130 2876 2876 0.81 11.3 437 2.0 5.8 15.0 2.62 913 5540 3263 2392
23.0 14 26.8 13.6 25.825 0 129 3005 3005 0.89 9.5 423 1.8 4.8 11.3 2.45 883 4626 2850 2160
24.0 14.4 24.6 14.2 23.625 0 127 3132 3132 0.67 9.5 328 1.8 4.8 11.3 2.44 685 4802 2961 1673
25.0 15.6 30.8 1.35 15.1 29.825 1.58 0 130 3262 3262 0.97 9.7 510 1.8 4.9 11.7 2.47 1065 5154 3159 2629
26.0 16.8 31.4 16.4 30.425 0 131 3393 3393 0.86 10.1 488 1.8 5.1 12.4 2.51 1020 5628 3416 2556
27.0 17.2 29.4 16.9 28.425 0 130 3522 3522 0.68 10.0 401 1.8 5.1 12.3 2.50 837 5798 3524 2093
28.0 16.2 28.2 5.75 15.9 27.225 5.98 0 129 3651 3651 0.71 9.1 393 1.7 4.6 10.6 2.40 822 5328 3318 1974
29.0 23.2 40 22.6 39.025 0 134 3785 3785 0.72 12.5 568 2.1 6.4 17.4 2.71 1187 8225 4729 3218
30.0 21 40.2 20.3 39.225 0 134 3919 3919 0.93 10.8 656 1.9 5.5 13.9 2.58 1370 7123 4245 3528
31.0 15.6 28.8 15.2 27.825 0 129 4048 4048 0.83 7.9 437 1.6 4.0 8.4 2.26 913 4924 3180 2060
32.0 11.4 21.2 0 11.2 20.225 62 125 4174 4111 0.81 5.7 313 1.3 2.9 5.1 1.93 654 3329 2332 1261
33.0 11.2 19.2 11.1 18.225 125 124 4298 4173 0.65 5.5 248 1.2 2.8 4.9 1.89 517 3265 2303 979
34.0 9.6 16 9.6 15.025 187 121 4419 4232 0.58 4.7 189 1.1 2.4 3.8 1.72 396 2692 1979 681
35.0 9.4 17.8 9.3 16.825 250 123 4542 4292 0.83 4.5 262 1.1 2.3 3.5 1.68 548 2566 1910 922
36.0 8.15 15 0 8.1 14.025 312 121 4662 4350 0.75 3.8 206 1.0 1.9 2.7 1.52 430 2144 1659 654
37.0 10.8 17.6 10.7 16.625 374 122 4785 4410 0.56 5.0 204 1.2 2.5 4.2 1.79 426 3053 2207 763
38.0 10 18.4 9.9 17.425 437 123 4908 4471 0.78 4.5 262 1.1 2.3 3.6 1.69 548 2718 2017 928
39.0 9.8 18.4 9.7 17.425 499 123 5031 4532 0.83 4.3 270 1.0 2.2 3.3 1.66 563 2625 1967 933
40.0 9.8 19.8 4.2 9.6 18.825 4.43 562 124 5156 4594 0.99 4.2 321 1.0 2.2 3.2 1.64 670 2582 1946 1099
41.0 10.6 23.2 10.3 22.225 624 126 5282 4658 1.20 4.5 415 1.70 867 1479
42.0 15.4 26 15.2 25.025 686 128 5410 4723 0.67 6.6 342 1.4 3.3 6.4 2.07 715 4583 3097 1480
43.0 21.2 42.6 20.4 41.625 749 135 5545 4796 1.06 8.7 736 1.7 4.4 10.0 2.37 1537 6661 4189 3636
44.0 17.8 33.2 0 17.3 32.225 811 131 5676 4865 0.88 7.3 517 1.5 3.7 7.5 2.18 1081 5369 3535 2354
45.0 11.4 24.4 11.0 23.425 874 127 5803 4929 1.17 4.5 430 1.1 2.3 3.5 1.71 898 2987 2217 1536
46.0 14.2 24 14.0 23.025 936 127 5929 4993 0.67 5.7 313 1.3 2.9 5.1 1.92 654 4038 2829 1257
47.0 17.4 24.6 17.3 23.625 998 126 6055 5057 0.37 7.0 219 1.5 3.5 7.0 2.13 457 5286 3519 972
48.0 15.2 27.6 1.25 14.9 26.625 1.48 1061 129 6184 5123 0.82 5.9 408 1.3 3.0 5.3 1.96 852 4314 2999 1669
49.0 16 28 15.7 27.025 1123 129 6312 5189 0.75 6.1 393 1.3 3.1 5.7 2.00 822 4598 3164 1642
50.0 19 32.2 18.6 31.225 1186 131 6443 5257 0.70 7.2 437 1.5 3.7 7.3 2.16 913 5709 3771 1974
51.0 21.4 36.2 20.9 35.225 1248 132 6575 5327 0.70 8.0 496 1.6 4.1 8.7 2.27 1035 6606 4250 2349
52.0 20.2 34.6 0.75 19.8 33.625 0.98 1310 132 6706 5396 0.72 7.4 481 1.5 3.8 7.7 2.19 1004 6099 3997 2205
53.0 19.4 31.8 19.1 30.825 1373 130 6837 5464 0.64 7.0 408 1.5 3.6 7.1 2.14 852 5792 3845 1824
54.0 20.4 34.2 20.0 33.225 1435 131 6968 5533 0.69 7.3 459 1.5 3.7 7.5 2.18 959 6129 4033 2088
55.0 17.4 29 0 17.1 28.025 1498 129 7097 5599 0.67 6.1 379 1.3 3.1 5.7 2.00 791 4978 3423 1581
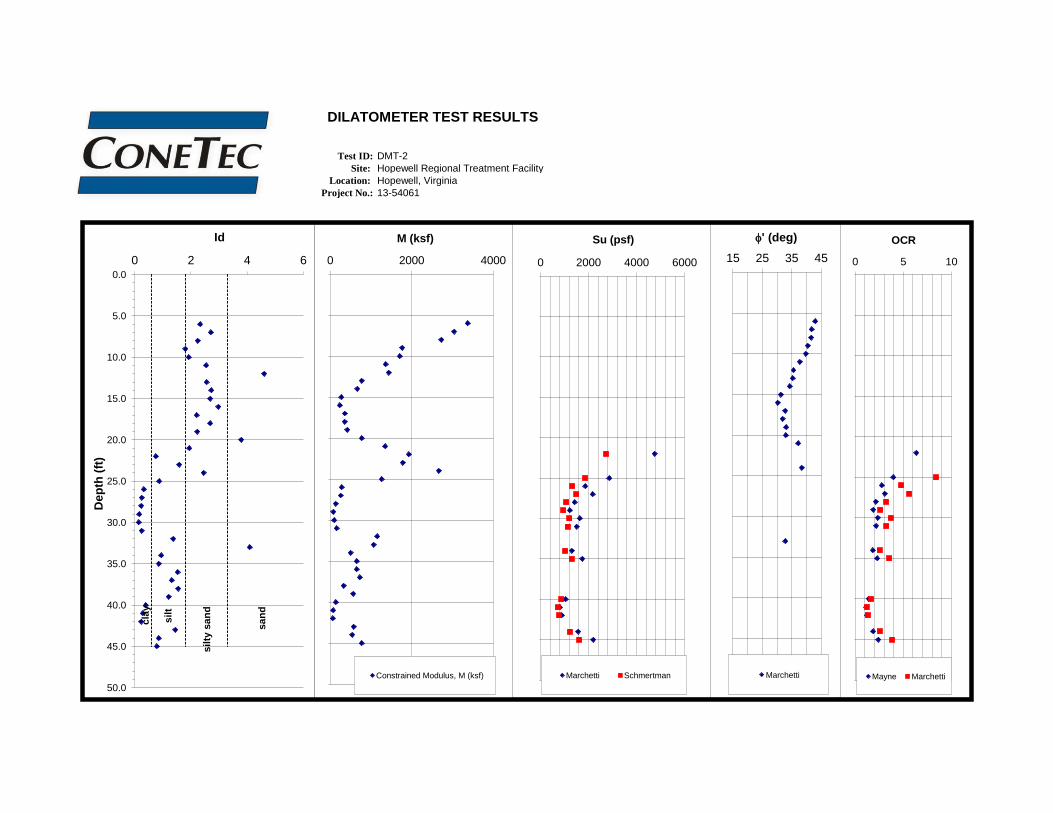
DILATOMETER TEST RESULTS
Test ID: DMT-2
Site: Hopewell Regional Treatment Facility
Location: Hopewell, Virginia
Project No.: 13-54061
0.0
5.0
10.0
15.0
20.0
25.0
30.0
35.0
40.0
45.0
50.0
0 2 4 6
Dep
th (
ft)
Id
0 2000 4000
M (ksf)
Constrained Modulus, M (ksf)
0 5 10
OCR
Mayne Marchetti
0 2000 4000 6000
Su (psf)
Marchetti Schmertman
15 25 35 45
f' (deg)
Marchetti
cla
y
silty
san
d
silt
san
d

DILATOMETER TEST RESULTS
Test ID: DMT-2
Site: Hopewell Regional Treatment Facility
Location: Hopewell, Virginia
Project No.: 13-54061
0.0
5.0
10.0
15.0
20.0
25.0
30.0
35.0
40.0
45.0
50.0
0 2 4 6
Dep
th (
ft)
Id
0 10 20 30
po and p1 (bar)
po
p1
0 10 20
Horizontal Stress Index, KD
0 500 1000
ED (Bar)
cla
y
silty
san
d
silt
san
d

Job No: 13-54061 Membrane 1 Membrane 2 Membrane 31
Depth Below Existing Ground Surface
Job Name: Hopewell Regional Treatment FacilityDA = 0.15 0 02
Mayne, 1995
Job Location: Hopewell, Virginia DB = 1.1 0 03
Marchetti,1980
Date: 9/6/13 Zm= 0 bar Latitude: 37.295194
Marchetti, 1997
Sounding No: DMT-2 Longitude: -77.253805
Campanella and Robertson, 1991
Ground Water Depth (ft): 156
Marchetti,19807
Schmertman, 1981
Depth1
A B C po p1 p2 uo gT svo svo' EDf'
4ED su
6su
7M
(ft) (bar) (bar) (bar) (bar) (bar) (bar) (psf) (pcf) (psf) (psf) Id KD (bar) KoOCR
2OCR
3(deg) RM (ksf) (psf) (psf) (ksf)
6.0 7.1 22.8 6.5 21.7 0 125 751 751 2.32 18.1 526 43.1 3.06 1100 3369
7.0 6.15 21.8 5.6 20.7 0 124 876 876 2.71 13.3 525 41.8 2.77 1096 3036
8.0 6.65 21 0 6.1 19.9 0 124 1000 1000 2.24 12.8 477 41.6 2.74 997 2728
9.0 5.7 16.2 5.4 15.1 0 121 1121 1121 1.80 10.0 337 40.5 2.50 704 1762
10.0 5.5 16.2 5.2 15.1 0 121 1242 1242 1.92 8.7 344 39.9 2.37 719 1704
11.0 4 14.2 3.7 13.1 0 119 1361 1361 2.54 5.7 326 37.8 1.99 681 1357
12.0 3.05 15.8 0 2.6 14.7 0 118 1479 1479 4.60 3.7 419 35.6 1.64 875 1433
13.0 2.85 10.6 2.7 9.5 0 115 1594 1594 2.55 3.5 237 35.3 1.56 495 771
14.0 2.55 10 2.4 8.9 0 114 1709 1709 2.72 2.9 226 34.3 1.41 472 665
15.0 1.55 6.65 1.5 5.55 0 109 1817 1817 2.68 1.7 140 31.4 0.94 293 276
16.0 1.35 6.25 0 1.3 5.15 62 108 1925 1863 2.98 1.4 133 30.3 0.85 278 236
17.0 2.15 7.65 2.1 6.55 125 111 2036 1912 2.20 2.2 155 32.8 1.11 323 360
18.0 1.95 7.75 1.9 6.65 187 111 2147 1960 2.68 1.9 166 31.9 1.02 346 354
19.0 2.45 8.45 2.4 7.35 250 112 2259 2010 2.22 2.3 173 33.1 1.16 361 420
20.0 2.7 12.2 0 2.4 11.1 312 116 2375 2063 3.79 2.3 301 33.0 1.23 628 772
21.0 5.65 16.4 5.3 15.3 374 121 2496 2122 1.94 5.1 346 37.2 1.86 723 1346
22.0 13.6 24.2 13.3 23.1 437 127 2623 2186 0.75 12.5 341 2.1 6.4 17.4 2.71 711 4748 2730 1928
23.0 7.95 20.2 7.6 19.1 499 124 2747 2248 1.58 6.8 401 2.13 837 1781
24.0 8.1 26 0.25 7.4 24.9 0.40 562 127 2874 2312 2.45 6.5 607 38.4 2.10 1267 2666
25.0 9.4 18 9.2 16.9 624 123 2997 2373 0.87 7.8 268 1.6 4.0 8.4 2.25 559 2870 1855 1260
26.0 6.6 9.8 6.7 8.7 686 113 3110 2423 0.32 5.4 71 1.2 2.8 4.8 1.88 148 1867 1321 279
27.0 7.45 10.4 7.5 9.3 749 113 3223 2474 0.25 6.0 62 1.3 3.1 5.6 1.98 129 2167 1495 257
28.0 5.4 7.75 1.95 5.5 6.65 2.10 811 109 3332 2520 0.23 4.2 40 1.0 2.2 3.2 1.62 84 1415 1067 135
29.0 4.85 6.8 5.0 5.7 874 106 3437 2564 0.16 3.7 26 0.9 1.9 2.6 1.48 53 1219 950 79
30.0 6.1 8.1 6.2 7 936 107 3545 2609 0.14 4.6 27 1.1 2.3 3.7 1.71 57 1632 1204 97
31.0 5.8 8.3 5.9 7.2 998 110 3654 2656 0.24 4.3 46 1.0 2.2 3.2 1.62 95 1501 1130 154
32.0 7.2 16.8 0 6.9 15.7 1061 122 3776 2715 1.36 4.9 304 1.81 635 1152
33.0 3.95 16.8 3.5 15.7 1123 119 3895 2772 4.08 2.2 423 32.9 1.20 883 1062
34.0 5.55 11.2 5.5 10.1 1186 116 4012 2826 0.94 3.6 160 0.9 1.8 2.5 1.48 335 1310 1026 497
35.0 6.9 13.2 6.8 12.1 1248 118 4130 2882 0.86 4.5 184 1.1 2.3 3.5 1.69 384 1744 1295 651
36.0 5.1 12.6 0 4.9 11.5 1310 118 4248 2937 1.52 3.1 228 1.36 476 646
37.0 5.95 13.6 5.8 12.5 1373 119 4366 2994 1.31 3.6 233 1.49 487 727
38.0 3.75 9.4 3.7 8.3 1435 113 4480 3045 1.54 2.1 160 0.97 335 326
39.0 5.55 12.2 5.4 11.1 1498 117 4597 3100 1.20 3.2 197 1.37 411 563
40.0 4.85 7.65 2.15 4.9 6.55 2.30 1560 110 4707 3147 0.39 2.8 56 0.7 1.4 1.7 1.18 118 1041 872 140
41.0 4.1 6.3 4.2 5.2 1622 106 4813 3190 0.29 2.2 35 0.6 1.1 1.2 0.97 72 810 715 70
42.0 4.4 6.45 4.5 5.35 1685 105 4918 3233 0.23 2.4 29 0.6 1.2 1.3 1.03 61 890 773 63
43.0 5.35 12.6 5.2 11.5 1747 117 5035 3288 1.44 2.8 219 1.26 457 573
44.0 6.8 12.8 6.7 11.7 1810 118 5153 3344 0.85 3.7 173 0.9 1.9 2.6 1.48 361 1561 1221 536
45.0 8.75 15.8 1.9 8.6 14.7 2.05 1872 121 5274 3402 0.79 4.7 211 1.1 2.4 3.8 1.74 441 2198 1611 769

DILATOMETER TEST RESULTS
Test ID: DMT-3
Site: Hopewell Regional Treatment Facility
Location: Hopewell, Virginia
Project No.: 13-54061
0.0
10.0
20.0
30.0
40.0
50.0
60.0
0 2 4 6
Dep
th (
ft)
Id
0 2000 4000 6000
M (ksf)
Constrained Modulus, M (ksf)
0 5 10
OCR
Mayne Marchetti
0 2000 4000 6000
Su (psf)
Marchetti Schmertman
15 25 35 45
f' (deg)
Marchetti
cla
y
silty
san
d
silt
san
d
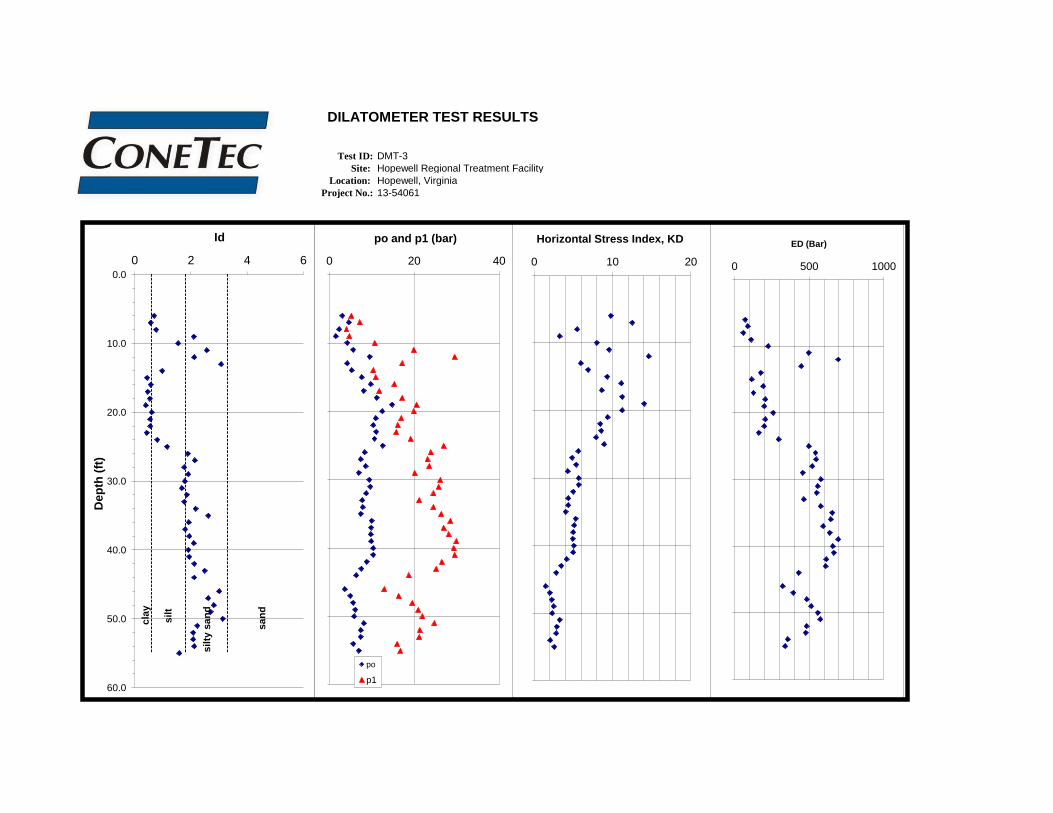
DILATOMETER TEST RESULTS
Test ID: DMT-3
Site: Hopewell Regional Treatment Facility
Location: Hopewell, Virginia
Project No.: 13-54061
0.0
10.0
20.0
30.0
40.0
50.0
60.0
0 2 4 6
Dep
th (
ft)
Id
0 20 40
po and p1 (bar)
po
p1
0 10 20
Horizontal Stress Index, KD
0 500 1000
ED (Bar)
cla
y
silty
san
d
silt
san
d

Job No: 13-54061 Membrane 1 Membrane 2 Membrane 31
Depth Below Existing Ground Surface
Job Name: Hopewell Regional Treatment FacilityDA = 0.225 0 02
Mayne, 1995
Job Location: Hopewell, Virginia DB = 0.875 0 03
Marchetti,1980
Date: 9/6/13 Zm= 0 bar Latitude: 37.295994
Marchetti, 1997
Sounding No: DMT-3 Longitude: -77.254395
Campanella and Robertson, 1991
Ground Water Depth (ft): 286
Marchetti,19807
Schmertman, 1981
Depth1
A B C po p1 p2 uo gT svo svo' EDf'
4ED su
6su
7M
(ft) (bar) (bar) (bar) (bar) (bar) (bar) (psf) (pcf) (psf) (psf) Id KD (bar) KoOCR
2OCR
3(deg) RM (ksf) (psf) (psf) (ksf)
6.0 2.95 6.05 3.1 5.175 0 109 655 655 0.68 9.8 73 1.8 5.0 11.9 2.48 152 1051 642 377
7.0 4.5 8.05 4.6 7.175 0 113 768 768 0.56 12.5 89 2.1 6.4 17.5 2.71 186 1672 961 506
8.0 2.15 4.9 2.3 4.025 0 107 875 875 0.76 5.5 60 1.2 2.8 4.8 1.89 126 677 479 237
9.0 1.45 5.6 1.5 4.725 0 108 982 982 2.10 3.2 111 34.9 1.45 232 338
10.0 4.3 11.6 0 4.2 10.725 0 117 1100 1100 1.54 8.0 226 2.29 472 1078
11.0 6.05 20.8 5.6 19.925 0 124 1224 1224 2.56 9.5 497 40.3 2.46 1039 2553
12.0 10.2 30.4 9.5 29.525 0 129 1353 1353 2.12 14.6 696 42.2 2.86 1453 4156
13.0 4.6 18 4.2 17.125 0 122 1475 1475 3.07 6.0 448 38.1 2.05 936 1920
14.0 5.25 11.2 5.2 10.325 0 117 1592 1592 0.97 6.9 177 1.4 3.5 6.8 2.12 369 1636 1093 784
15.0 7.55 11.8 0.9 7.6 10.925 1.13 0 117 1709 1709 0.43 9.3 115 1.8 4.7 11.0 2.43 240 2571 1591 582
16.0 9.8 16.2 9.8 15.325 0 122 1830 1830 0.57 11.1 193 2.0 5.7 14.6 2.60 403 3444 2038 1049
17.0 8 12.6 8.1 11.725 0 118 1948 1948 0.46 8.6 128 1.7 4.4 9.8 2.35 266 2665 1681 626
18.0 11.2 18 11.1 17.125 0 123 2071 2071 0.54 11.2 208 2.0 5.7 14.8 2.61 434 3940 2327 1132
19.0 14.8 21.4 14.8 20.525 0 124 2195 2195 0.39 14.0 200 2.3 7.1 20.9 2.82 419 5515 3081 1181
20.0 12.6 20.8 1.95 12.5 19.925 2.18 0 125 2320 2320 0.60 11.2 259 2.0 5.7 14.7 2.61 540 4410 2604 1410
21.0 11 17.8 10.9 16.925 0 123 2443 2443 0.55 9.4 208 1.8 4.8 11.1 2.43 434 3696 2285 1055
22.0 10.4 17 10.4 16.125 0 122 2565 2565 0.56 8.4 200 1.7 4.3 9.4 2.32 419 3407 2162 973
23.0 11 16.6 11.0 15.725 0 121 2686 2686 0.43 8.6 164 1.7 4.4 9.6 2.34 342 3634 2297 801
24.0 10.8 20 10.6 19.125 0 125 2811 2811 0.80 7.9 295 1.6 4.0 8.5 2.26 616 3439 2218 1393
25.0 13 27.8 0 12.5 26.925 0 129 2940 2940 1.15 8.9 499 1.7 4.5 10.3 2.39 1043 4185 2619 2487
26.0 8.8 24.8 8.3 23.925 0 127 3067 3067 1.89 5.6 543 37.8 1.96 1134 2223
27.0 7.9 24 7.4 23.125 0 126 3193 3193 2.14 4.8 547 37.0 1.83 1141 2084
28.0 9 24.4 8.5 23.525 0 127 3320 3320 1.76 5.4 521 1.91 1088 2075
29.0 7.35 21 6.9 20.125 62 125 3444 3382 1.90 4.3 457 36.4 1.70 955 1624
30.0 10 27 0 9.4 26.125 125 128 3572 3448 1.78 5.7 579 1.96 1210 2375
31.0 10.2 26.6 9.7 25.725 187 128 3700 3513 1.68 5.7 557 1.96 1164 2284
32.0 9.2 25.4 8.7 24.525 250 127 3828 3578 1.85 5.0 550 37.2 1.84 1149 2119
33.0 8.15 22 7.7 21.125 312 125 3953 3641 1.76 4.4 465 1.71 970 1660
34.0 8.45 25.4 7.9 24.525 374 127 4080 3705 2.16 4.3 577 36.5 1.73 1206 2086
35.0 8.1 27.2 0 7.4 26.325 437 127 4207 3770 2.62 4.0 656 36.0 1.68 1370 2302
36.0 10.6 29.4 9.9 28.525 499 129 4336 3837 1.92 5.3 645 37.5 1.90 1347 2559
37.0 10.4 27.8 9.8 26.925 562 128 4465 3903 1.79 5.1 594 1.86 1240 2311
38.0 10.4 29 9.8 28.125 624 129 4593 3969 1.94 5.0 638 37.2 1.85 1332 2457
39.0 10.6 30.8 9.9 29.925 686 129 4723 4036 2.10 4.9 696 37.1 1.85 1453 2683
40.0 11 30.2 10.3 29.325 749 129 4852 4103 1.91 5.1 659 37.2 1.86 1377 2564
41.0 11 30.4 0 10.3 29.525 811 129 4981 4170 1.94 5.0 667 37.1 1.84 1393 2568
42.0 9.4 27.4 8.8 26.525 874 128 5109 4236 2.12 4.1 616 36.2 1.68 1286 2160
43.0 8.15 26 7.5 25.125 936 127 5236 4300 2.48 3.4 610 35.2 1.54 1275 1960
44.0 6.7 19.6 6.3 18.725 998 123 5359 4361 2.12 2.8 430 34.1 1.32 898 1188
45.0 1061 130 5489 4428
46.0 3.85 13.8 0 3.6 12.925 1123 118 5607 4484 3.00 1.4 322 30.3 0.85 673 572
47.0 5.25 17.2 4.9 16.325 1186 121 5728 4542 2.61 2.0 395 32.2 1.06 826 879
48.0 6 20.4 5.6 19.525 1248 123 5851 4603 2.81 2.3 485 32.9 1.19 1012 1201
49.0 6.6 21.8 6.1 20.925 1310 124 5975 4664 2.70 2.5 514 33.4 1.25 1073 1345
50.0 6.35 22.8 0 5.8 21.925 1373 124 6099 4726 3.13 2.3 559 32.9 1.21 1168 1418
51.0 8.7 25.6 8.1 24.725 1435 127 6226 4790 2.23 3.2 576 34.9 1.47 1202 1763
52.0 7.85 22.2 7.4 21.325 1498 125 6350 4853 2.08 2.9 483 34.3 1.34 1008 1356
53.0 7.8 22 7.4 21.125 1560 125 6475 4915 2.08 2.8 477 34.1 1.32 997 1318
54.0 5.9 16.8 5.6 15.925 1622 121 6596 4974 2.12 2.0 357 32.3 1.03 746 767
55.0 7.2 17.6 0 7.0 16.725 1685 122 6718 5033 1.59 2.6 339 1.19 708 841
Invalid Test

Pore PressureDissipation Test
Data

Hopewell Regional Treatment FacilitySeptember 5th and 6th, 2013
13-54061
Table 2: Pore Pressure Dissipation Test Summary Table
Sounding Depth (ft) Duration (sec) ch (cm2/min)** Comments
CPT-1 15.1 1460 0.59
**Using Ir = 100
Degree of
Consolidation Modified Time Factors, T*
20% 0.038
30% 0.078
where: 40% 0.142
a= cone radius 50% 0.245
Ir= rigidity index 60% 0.439
T*= modified time factor for given consolidation 70% 0.804
t*= time of given consolidation 80% 1.60
*
2*
t
IaTc
r
h
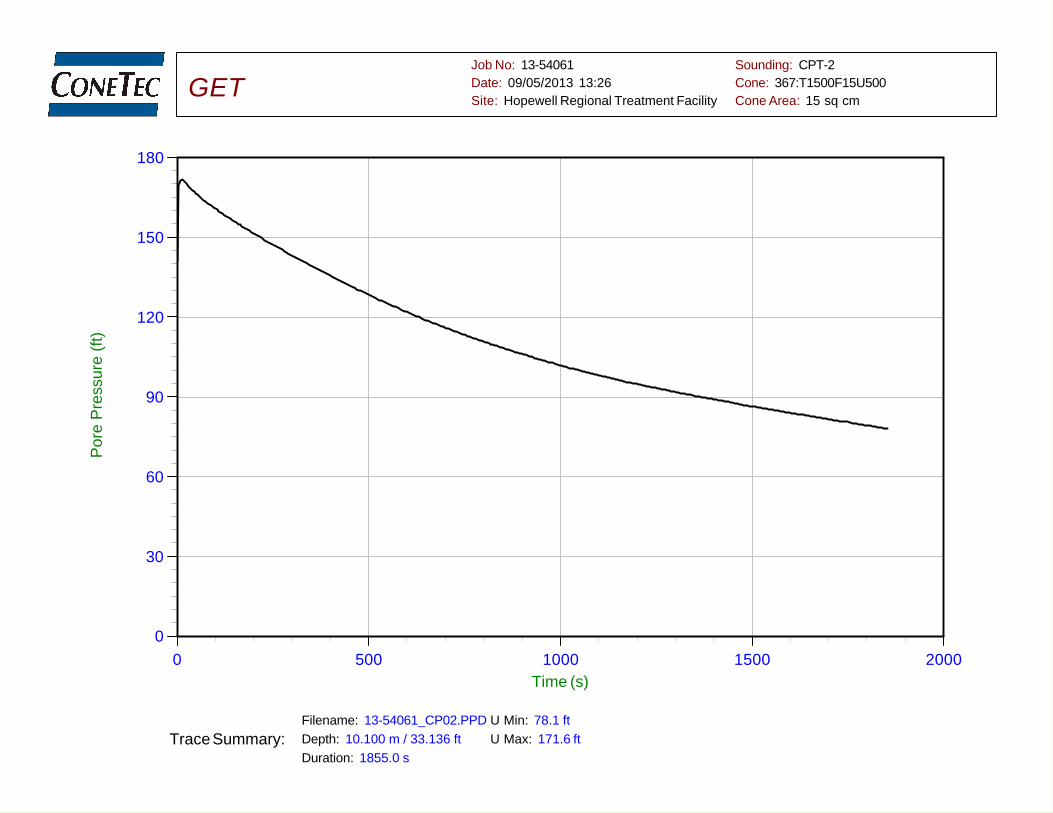
0 500 1000 1500 2000
0
30
60
90
120
150
180
Time (s)
Pore
Pre
ssure
(ft
)GET
Job No: 13-54061
Date: 09/05/2013 13:26
Site: Hopewell Regional Treatment Facility
Sounding: CPT-2
Cone: 367:T1500F15U500
Cone Area: 15 sq cm
Trace Summary: Filename: 13-54061_CP02.PPD
Depth: 10.100 m / 33.136 ft
Duration: 1855.0 s
U Min: 78.1 ft
U Max: 171.6 ft

InterpretationMethods
CONETEC INTERPRETATION METHODS
A Detailed Description of the Methods Used in ConeTec’s CPT Interpretation and Plotting Software
Revision SZW-Rev 05B
Revised April 25, 2013
Prepared by Jim Greig
ConeTec Environmental and Geotechnical Site Investigation Contractors
ConeTec Interpretations as of April 25, 2013 ConeTec’s interpretation routine provides a tabular output of geotechnical parameters based on current published CPT correlations and is subject to change to reflect the current state of practice. The interpreted values are not considered valid for all soil types. The interpretations are presented only as a guide for geotechnical use and should be carefully scrutinized for consideration in any geotechnical design. Reference to current literature is strongly recommended. ConeTec does not warranty the correctness or the applicability of any of the geotechnical parameters interpreted by the program and does not assume liability for any use of the results in any design or review. Representative hand calculations should be made for any parameter that is critical for design purposes. The end user of the interpreted output should also be fully aware of the techniques and the limitations of any method used in this program. The purpose of this document is to inform the user as to which methods were used and what the appropriate papers and/or publications are for further reference. The CPT interpretations are based on values of tip, sleeve friction and pore pressure averaged over a user specified interval (e.g. 0.20m). Note that qt is the tip resistance corrected for pore pressure effects and qc is the recorded tip resistance. Since all ConeTec cones have equal end area friction sleeves, pore pressure corrections to sleeve friction, fs, are not required. The tip correction is: qt = qc + (1-a) • u2
where: qt is the corrected tip resistance qc is the recorded tip resistance u2 is the recorded dynamic pore pressure behind the tip (u2 position) a is the Net Area Ratio for the cone (typically 0.80 for ConeTec cones)
The total stress calculations are based on soil unit weights that have been assigned to the Soil Behavior Type zones, from a user defined unit weight profile or by using a single value throughout the profile. Effective vertical overburden stresses are calculated based on a hydrostatic distribution of equilibrium pore pressures below the water table or from a user defined equilibrium pore pressure profile (this can be obtained from CPT dissipation tests). For over water projects the effects of the column of water have been taken into account as has the appropriate unit weight of water. How this is done depends on where the instruments were zeroed (i.e. on deck or at mud line). Details regarding the interpretation methods for all of the interpreted parameters are provided in Table 1. The appropriate references cited in Table 1 are listed in Table 2. Where methods are based on charts or techniques that are too complex to describe in this summary the user should refer to the cited material. The Soil Behavior Type classification charts (normalized and non-normalized) shown in Figures 1 and 2 are based on the charts developed by Dr. Robertson and Dr. Campanella at the University of British Columbia. These charts appear in many publications, most notably: Robertson, Campanella, Gillespie and Greig (1986); Robertson (1990) and Lunne, Robertson and Powell (1997). The Bq classification charts shown in Figures 3a and 3b are based on those described in Robertson (1990) and Lunne, Robertson and Powell (1997). The Jefferies and Davies SBT chart shown in Figure 3c is based on that discussed in Jefferies and Davies, 1993. Where the results of a calculation/interpretation are declared ‘invalid’ the value will be represented by the text strings “-9999” or “-9999.0”. In some cases the value 0 will be used. Invalid results will occur because of (and not limited to) one or a combination of:
1. Invalid or undefined CPT data (e.g. drilled out section or data gap).
2. Where the interpretation method is inappropriate, for example, drained parameters in an undrained material (and vice versa).

CPT Interpretation Methods Page 2/9
3. Where interpretation input values are beyond the range of the referenced charts or specified limitations of the interpretation method.
4. Where pre-requisite or intermediate interpretation calculations are invalid.
The parameters selected for output from the program are often specific to a particular project. As such, not all of the interpreted parameters listed in Table 1 may be included in the output files delivered with this report. The output files are provided in Microsoft Excel XLS format. The ConeTec software has several options for output depending on the number or types of interpreted parameters desired. Each output file will be named using the original COR file basename followed by a three or four letter indicator of the interpretation set selected (e.g. BSC, TBL, NLI or IFI) and possibly followed by an operator selected suffix identifying the characteristics of the particular interpretation run.
Table 1 CPT Interpretation Methods
Interpreted Parameter Description Equation Ref
Depth
Mid Layer Depth (where interpretations are done at each point then Mid Layer Depth = Recorded Depth)
Depth (Layer Top) + Depth (Layer Bottom) / 2.0
Elevation Elevation of Mid Layer based on sounding collar elevation supplied by client Elevation = Collar Elevation - Depth
Avgqc Averaged recorded tip value (qc) ∑=
=n
icq
nAvgqc
1
1
n=1 when interpretations are done at each point
Avgqt Averaged corrected tip (qt) where: uaqq ct •−+= )1( ∑
=
=n
itq
nAvgqt
1
1
n=1 when interpretations are done at each point
Avgfs Averaged sleeve friction (fs) ∑=
=n
ifs
nAvgfs
1
1
n=1 when interpretations are done at each point
AvgRf
Averaged friction ratio (Rf) where friction ratio is defined as:
qtfsRf •= %100
AvgqtAvgfsAvgRf ⋅= %100
n=1 when interpretations are done at each point
Avgu Averaged dynamic pore pressure (u) ∑=
=n
iiun
Avgu1
1
n=1 when interpretations are done at each point
AvgRes Averaged Resistivity (this data is not always available since it is a specialized test requiring an additional module)
∑=
=n
iiYRESISTIVITn
Avgu1
1
n=1 when interpretations are done at each point
AvgUVIF Averaged UVIF ultra-violet induced fluorescence (this data is not always available since it is a specialized test requiring an additional module)
∑=
=n
iiUVIFn
Avgu1
1
n=1 when interpretations are done at each point
AvgTemp Averaged Temperature (this data is not always available since it is a specialized test)
∑=
=n
iiETEMPERATURn
Avgu1
1
n=1 when interpretations are done at each point
ConeTec Interpretation Methods SZW-Rev 05B Revised 2013-04-25

CPT Interpretation Methods Page 3/9 Interpreted Parameter Description Equation Ref
AvgGamma Averaged Gamma Counts (this data is not always available since it is a specialized test requiring an additional module)
∑=
=n
iiGAMMAn
Avgu1
1
n=1 when interpretations are done at each point
SBT Soil Behavior Type as defined by Robertson and Campanella See Figure 1 2, 5
U.Wt.
Unit Weight of soil determined from one of the following user selectable options: 1) uniform value 2) value assigned to each SBT zone 3) user supplied unit weight profile
See references 5
T. Stress
σv
Total vertical overburden stress at Mid Layer Depth. A layer is defined as the averaging interval specified by the user. For data interpreted at each point the Mid Layer Depth is the same as the recorded depth.
hi
n
ii
TStress ∑=
=1γ
where γI is layer unit weight hi is layer thickness
E. Stress
σv’
Effective vertical overburden stress at Mid Layer Depth
Estress = Tstress - ueq
Ueq
Equilibrium pore pressure determined from one of the following user selectable options: 1) hydrostatic from water table depth 2) user supplied profile
For hydrostatic option: ( )wtweq DDu −⋅= γ
where ueq is equilibrium pore pressure γw is unit weight of water D is the current depth Dwt is the depth to the water table
Cn SPT N60 overburden correction factor Cn=(σv’)-0.5 where σv’ is in tsf 0.5 < Cn < 2.0
N60 SPT N value at 60% energy calculated from qt/N ratios assigned to each SBT zone. This method has abrupt N value changes at zone boundaries.
See Figure 1 4, 5
(N1)60 SPT N60 value corrected for overburden pressure (N1)60 = Cn • N60 4
N60Ic SPT N60 values based on the Ic parameter (qt/pa)/ N60 = 8.5 (1 – Ic/4.6) 5
(N1)60Ic SPT N60 value corrected for overburden pressure (using N60 Ic). User has 2 options.
1) (N1)60Ic= Cn • (N60 Ic) 2) qc1n/ (N1)60Ic = 8.5 (1 – Ic/4.6)
4 5
(N1)60csIc Clean sand equivalent SPT (N1)60Ic. User has 3 options.
1) (N1)60csIc = α + β((N1)60Ic) 2) (N1)60csIc = KSPT * ((N1)60Ic) 3) qc1ncs)/ (N1)60csIc = 8.5 (1 – Ic/4.6) FC ≤ 5%: α = 0, β=1.0 FC ≥ 35% α = 5.0, β=1.2 5% < FC < 35% α = exp[1.76 – (190/FC2)] β = [0.99 + (FC1.5/1000)]
10 10 5
Su Undrained shear strength based on qt Su factor Nkt is user selectable N kt
vqtSu σ−=
1, 5
Su Undrained shear strength based on pore pressure Su factor NΔu is user selectable N u
equuSu
∆
−= 2
1, 5
k Coefficient of permeability (assigned to each SBT zone) 5
ConeTec Interpretation Methods SZW-Rev 05B Revised 2013-04-25

CPT Interpretation Methods Page 4/9 Interpreted Parameter Description Equation Ref
Bq Pore pressure parameter
σ vqtuBq−∆
=
where:
equuu −=∆
and u = dynamic pore pressure ueq = equilibrium pore pressure
1, 5
Qt
Normalized qt for Soil Behavior Type classification as defined by Robertson, 1990 '
v
vqtQt
σσ−=
2, 5
Fr
Normalized Friction Ratio for Soil Behavior Type classification as defined by Robertson, 1990 σ vqt
fsFr−
⋅= %100
2, 5
Net qt Net tip resistance σ vqt −
qe Effective tip resistance 2uqt −
qeNorm Normalized effective tip resistance '2
v
uqt
σ
−
SBTn Normalized Soil Behavior Type as defined by Robertson and Campanella See Figure 2 2, 5
SBT-BQ Non-normalized Soil Behavior type based on the Bq parameter See Figure 3 2, 5
SBT-BQn Normalized Soil Behavior based on the Bq parameter See Figure 3 2, 5
SBT-JandD Soil Behaviour Type as defined by Jeffries and Davies See Figure 3 7
SBT-BQn Normalized Soil Behavior base on the Bq parameter See Figure 3 2, 5
Ic Soil index for estimating grain characteristics
Ic = [(3.47 – log10Q)2 + (log10 Fr + 1.22)2 ]0.5 Where:
n
v
a
a
v PP
qtQ
−= '
2 σσ
And Fr is in percent Pa = atmospheric pressure Pa2 = atmospheric pressure n varies from 0.5 to 1.0 and is selected in an iterative manner based on the resulting Ic
3, 8
FC Apparent fines content (%)
FC=1.75(Ic3.25) - 3.7 FC=100 for Ic > 3.5 FC=0 for Ic < 1.26 FC = 5% if 1.64 < Ic < 2.6 AND Fr<0.5
3
Ic Zone This parameter is the Soil Behavior Type zone based on the Ic parameter (valid for zones 2 through 7 on SBTn chart)
Ic < 1.31 Zone = 7 1.31 < Ic < 2.05 Zone = 6 2.05 < Ic < 2.60 Zone = 5 2.60 < Ic < 2.95 Zone = 4 2.95 < Ic < 3.60 Zone = 3 Ic > 3.60 Zone = 2
3
PHI φ
Friction Angle determined from one of the following user selectable options:
a) Campanella and Robertson b) Durgunoglu and Mitchel c) Janbu d) Kulhawy and Mayne
See reference
5 5 5 11
ConeTec Interpretation Methods SZW-Rev 05B Revised 2013-04-25

CPT Interpretation Methods Page 5/9 Interpreted Parameter Description Equation Ref
Dr
Relative Density determined from one of the following user selectable options:
a) Ticino Sand b) Hokksund Sand c) Schmertmann 1976 d) Jamiolkowski - All Sands
See reference 5
OCR Over Consolidation Ratio
a) Based on Schmertmann’s method involving a plot of Su/σv’ /( Su/σv’)NC and OCR where the Su/p’ ratio for NC clay is user selectable
9
State Parameter
The state parameter is used to describe whether a soil is contractive (SP is positive) or dilative (SP is negative) at large strains based on the work by Been and Jefferies
See reference 8, 6, 5
Es/qt Intermediate parameter for calculating Young’s Modulus, E, in sands. It is the Y axis of the reference chart. Based on Figure 5.59 in the reference 5
Young’s Modulus E
Young’s Modulus based on the work done in Italy. There are three types of sands considered in this technique. The user selects the appropriate type for the site from: a) OC Sands b) Aged NC Sands c) Recent NC Sands Each sand type has a family of curves that depend on mean normal stress. The program calculates mean normal stress and linearly interpolates between the two extremes provided in the Es/qt chart.
Mean normal stress is evaluated from: ( )3''''
31 σσσσ hhvm
++=
where σv’= vertical effective stress σh’= horizontal effective stress and σh = Ko • σv
’ with Ko assumed to be 0.5
5
qc1
qt normalized for overburden stress used for seismic analysis
qc1 = qt • (Pa/σv’)0.5
where: Pa = atm. Pressure qt is in MPa
3
qc1n
qc1 in dimensionless form used for seismic analysis qc1n = (qc1 / Pa)(Pa/σv’)n
where: Pa = atm. Pressure and n ranges from 0.5 to 1.0 based on Ic.
3
KSPT Equivalent clean sand factor for (N1)60 KSPT = 1 + ((0.75/30) • (FC – 5)) 10
KCPT Equivalent clean sand correction for qc1N Kcpt = 1.0 for Ic ≤ 1.64 Kcpt = f(Ic) for Ic > 1.64 (see reference)
10
qc1ncs Clean sand equivalent qc1n qc1ncs = qc1n • Kcpt 3
CRR Cyclic Resistance Ratio (for Magnitude 7.5)
qc1ncs < 50: CRR7.5 = 0.833 [(qc1ncs/1000] + 0.05 50 ≤ qc1ncs < 160: CRR7.5 = 93 [(qc1ncs/1000]3 + 0.08
10
ConeTec Interpretation Methods SZW-Rev 05B Revised 2013-04-25
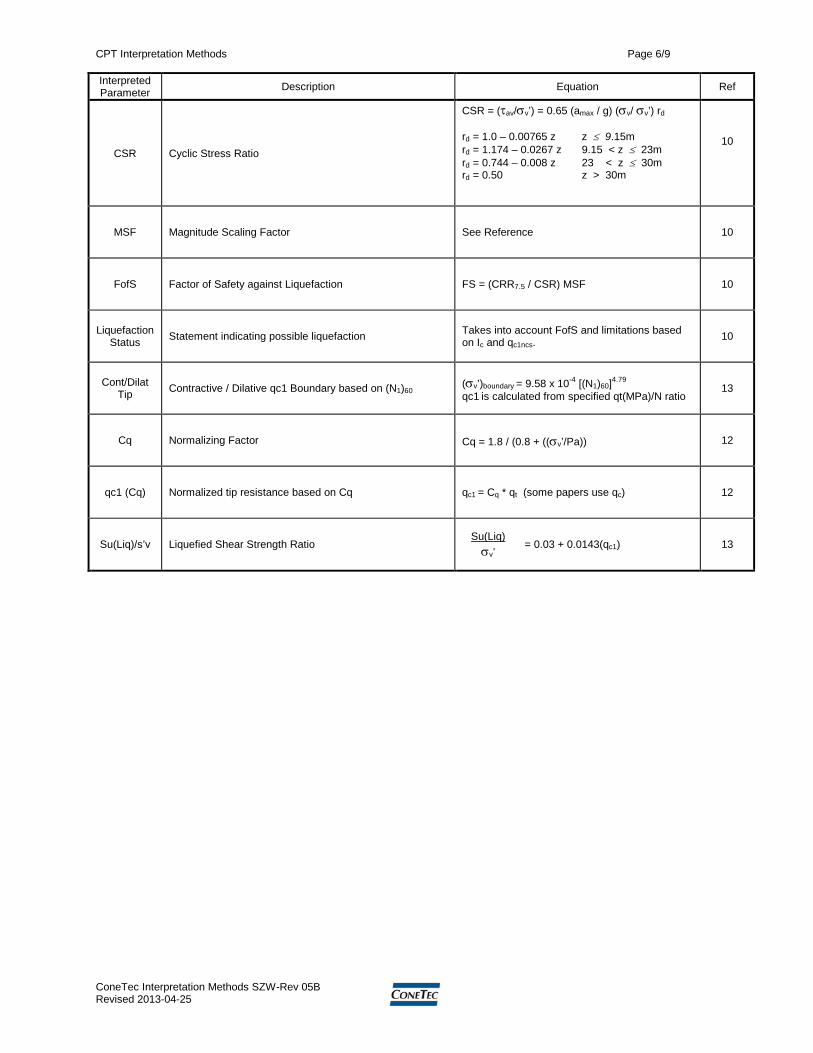
CPT Interpretation Methods Page 6/9 Interpreted Parameter Description Equation Ref
CSR Cyclic Stress Ratio
CSR = (τav/σv’) = 0.65 (amax / g) (σv/ σv’) rd rd = 1.0 – 0.00765 z z ≤ 9.15m rd = 1.174 – 0.0267 z 9.15 < z ≤ 23m rd = 0.744 – 0.008 z 23 < z ≤ 30m rd = 0.50 z > 30m
10
MSF Magnitude Scaling Factor See Reference 10
FofS Factor of Safety against Liquefaction FS = (CRR7.5 / CSR) MSF 10
Liquefaction Status Statement indicating possible liquefaction Takes into account FofS and limitations based
on Ic and qc1ncs. 10
Cont/Dilat Tip Contractive / Dilative qc1 Boundary based on (N1)60 (σv’)boundary = 9.58 x 10⁻⁴ [(N1)60]4.79
qc1 is calculated from specified qt(MPa)/N ratio 13
Cq Normalizing Factor Cq = 1.8 / (0.8 + ((σv’/Pa)) 12
qc1 (Cq) Normalized tip resistance based on Cq qc1 = Cq * qt (some papers use qc) 12
Su(Liq)/s’v Liquefied Shear Strength Ratio Su(Liq)
= 0.03 + 0.0143(qc1) σv’
13
ConeTec Interpretation Methods SZW-Rev 05B Revised 2013-04-25

CPT Interpretation Methods Page 7/9
Friction Ratio (%), Rf
Con
e Be
arin
g (b
ar),
qt1000
10
10 1 2 3 4 5 6 7 8
100
3
1
45
67
89
10 1211
2
Zone qt / N Soil Behavior Type 1 2 3 4 5 6 7 8 9101112
sensitive fine grainedorganic material
claysilty clay to clay
clayey silt to silty claysandy silt to clayey siltsilty sand to sandy silt
sand to silty sandsand
gravelly sand to sandvery stiff fine grained *sand to clayey sand *
* overconsolidated or cemented
2111.522.5345612
Figure 1 Non-Normalized Behavior Type Classification Chart
Nor
mal
ized
Con
e R
esis
tanc
eq
- t
voσσ
' vo
0.11
100
10
1000
1 10
Normalized Friction Ratio
1
23
4
5
6
7 8
9
fs x 100%q -t voσ
Zone Normalized Soil Behavior Type 1 2 3 4 5 6 7 8 9
sensitive fine grainedorganic materialclay to silty clay
clayey silt to silty claysilty sand to sandy silt
clean sands to silty sandsgravelly sand to sand
very stiff sand to clayey sandvery stiff fine grained
Figure 2 Normalized Behavior Type Classification Chart
ConeTec Interpretation Methods SZW-Rev 05B Revised 2013-04-25
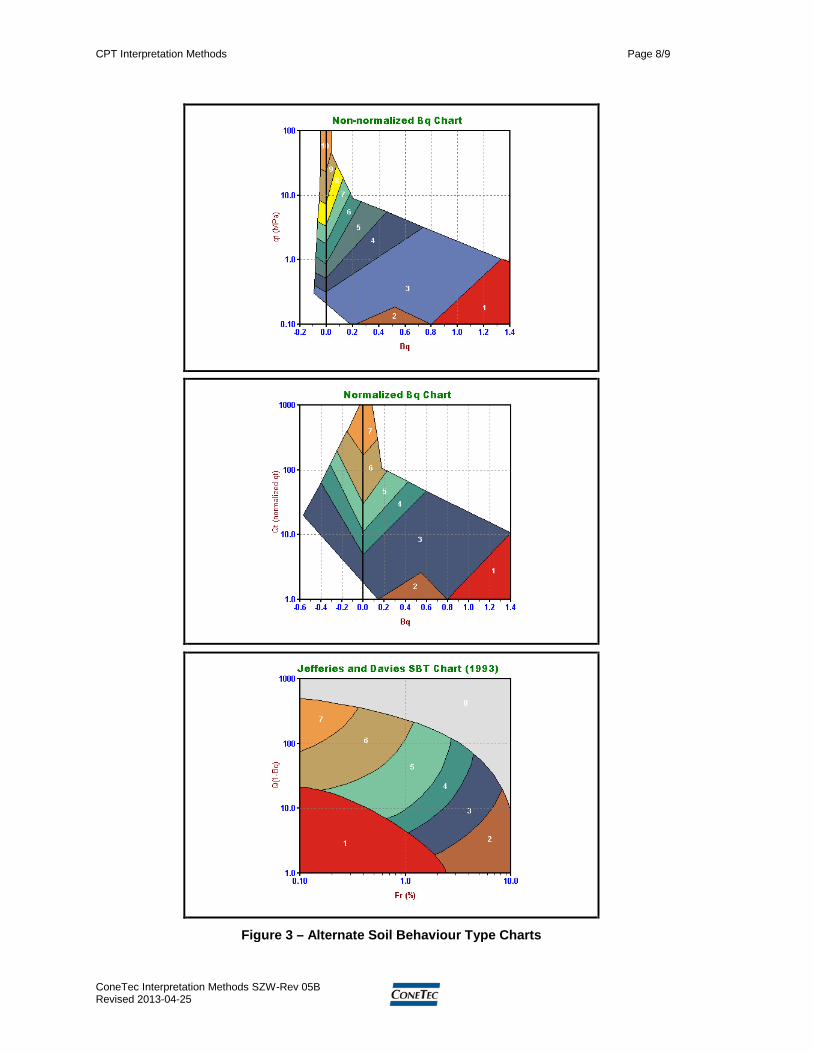
CPT Interpretation Methods Page 8/9
Figure 3 – Alternate Soil Behaviour Type Charts
ConeTec Interpretation Methods SZW-Rev 05B Revised 2013-04-25

CPT Interpretation Methods Page 9/9
Table 2 References
No. References
1 Robertson, P.K., Campanella, R.G., Gillespie, D. and Greig, J., 1986, “Use of Piezometer Cone Data”, Proceedings of InSitu 86, ASCE Specialty Conference, Blacksburg, Virginia.
2 Robertson, P.K., 1990, “Soil Classification Using the Cone Penetration Test”, Canadian Geotechnical Journal, Volume 27.
3 Robertson, P.K. and Fear, C.E., 1998, “Evaluating cyclic liquefaction potential using the cone penetration test”, Canadian Geotechnical Journal, 35: 442-459.
4 Robertson, P.K. and Wride, C.E., 1998, “Cyclic Liquefaction and its Evaluation Based on SPT and CPT”, NCEER Workshop Paper, January 22, 1997
5 Lunne, T., Robertson, P.K. and Powell, J. J. M., 1997, “ Cone Penetration Testing in Geotechnical Practice,” Blackie Academic and Professional.
6 Plewes, H.D., Davies, M.P. and Jefferies, M.G., 1992, “CPT Based Screening Procedure for
Evaluating Liquefaction Susceptibility”, 45th Canadian Geotechnical Conference, Toronto, Ontario, October 1992.
7 Jefferies, M.G. and Davies, M.P., 1993. “Use of CPTu to Estimate equivalent N60”, Geotechnical Testing Journal, 16(4): 458-467.
8 Been, K. and Jefferies, M.P., 1985, “A state parameter for sands”, Geotechnique, 35(2), 99-112.
9 Schmertmann, 1977, “Guidelines for Cone Penetration Test Performance and Design”, Federal Highway Administration Report FHWA-TS-78-209, U.S. Department of Transportation
10
Proceedings of theNCEER Workshop on Evaluation of Liquefaction Resistance of Soils, Salt LakeCity, 1996. Chaired by Leslie Youd. 11
11 Kulhawy, F.H. and Mayne, P.W. ,1990, “Manual on Estimating Soil Properties for Foundation Design,
Report No. EL-6800”, Electric Power Research Institute, Palo Alto, CA, August 1990, 306 p.
12 Olson, S.M. and Stark, T.D., 2002, “Liquefied strength ratio from liquefied flow filaure case histories”,
Canadian Geotechnical Journal, 39: 951-966.
13 Oslon, Scott M. and Stark, Timothy D., 2003, “Yield Strength Ratio and Liquefaction Analysis of
Slopes and Embankments”, Journal of Geotechnical and Geoenvironmental Engineering, ASCE, August 2003.
ConeTec Interpretation Methods SZW-Rev 05B Revised 2013-04-25

ConeTec Inc.Geotechnical and Environmental Site Investigation Contractors
Vancouver New Jersey Salt Lake City Richmond, VA
BZBAZAp MM 05.005.10
BZBp M 1
AZCp M 2
Dilatometer (DMT) Data Reduction Correlations
Corrected First Reading
Corrected Second Reading
Corrected Third Reading
Material Indexoo
oD up
ppI
1
Marchetti, 1997
Horizontal Stress Index 'vo
ooD
upK
Dilatometer Modulus )(7.34 1 oD ppE
Coeff. Earth Pressure In Situ 6.0
5.1
47.0
D
o
KK
Overconsolidation Ratio 56.15.0 DKOCR Undrained Shear
Strength25.1' )5.0(22.0 Dvou Kc
Friction Angle DD KK 2log1.2log6.1428
Vertical Drained Constrained Modulus
DMDMT ERM If ID ≤ 0.6 RM = 0.14 + 2.36logKD
If ID ≥ 3 RM = 0.5 + 2logKD
If 0.6 <ID < 3 RM = RM,o + (2.5 - RM,o)logKDwhere RM,o = 0.14 + 0.15(ID – 0.6)
If KD > 10 RM = 0.32 + 2.18logKD
If RM < 0.85 set RM = 0.85
Preconsol. Stress p’ = 0.509 (po – uo) Mayne, 1995
Total Unit Weight 05.0
1.0
12.1
D
a
D
w
T Ip
EMayne, et. al., 2002
Undrained Shear Strength 10
oou
ups
Schmertmann, 1991
Definitions
A Reading: Quantification of resistance imparted by membrane to travel from the membrane’s natural position to the A-position.
B Reading: Quantification of resistance imparted by membrane to travel from the membrane’s natural position to the B-position
A Position: Membrane just above feeler on sensing disk. Approximately flush with blade.
B Position: Membrane extended 1.1 mm into surrounding soil.
A Reading: Inflation pressure (reported in bar) required to expand membrane to A-position

2
B Reading: Inflation pressure (reported in bar) required to expand membrane to B-position.
C Reading: Deflation pressure (reported in bar) recorded when membrane is slowly deflated and returns to A- position.
ZM: Zero gage reading. Reading of pressure gage when system is vented to atmosphere.
References
Marchetti S. (1997). "The Flat Dilatometer: Design Applications". Third Geotechnical Engineering Conference, Cairo University.Keynote lecture, 26 pp, Jan. 1997.
Campanella, R.G., and Robertson, P.K. (1991). Use and interpretation of a research dilatometer. Canadian Geotechnical Journal, 28: 113-126.
Mayne, P.W. (1995) CPT determinations of overconsolidation ratio and lateral stresses in clean quartz sands, Proceedings, International Symposium on Cone Penetration Testing (CPT '95), Vol. 2, Swedish Geotechnical Society Report No. 3:95, Linkoping, pp. 215-220.
Mayne, P.W., Christopher, B., Berg, R., and DeJong, J. (2002). Subsurface Investigations - Geotechnical Site Characterization. Publication No. FHWA-NHI-01-031, National Highway Institute, Federal Highway Administration, Washington, D.C., 301 pages.
Schmertmann, J.H. (1991) Editor. GPE DMT Digest 12, December 1991 Issue. GPE Inc. Publication. 20 pages.