horng-chyi horngstatistics ii_five19 inference for the difference in means -two normal distributions...
Post on 22-Dec-2015
216 views
TRANSCRIPT
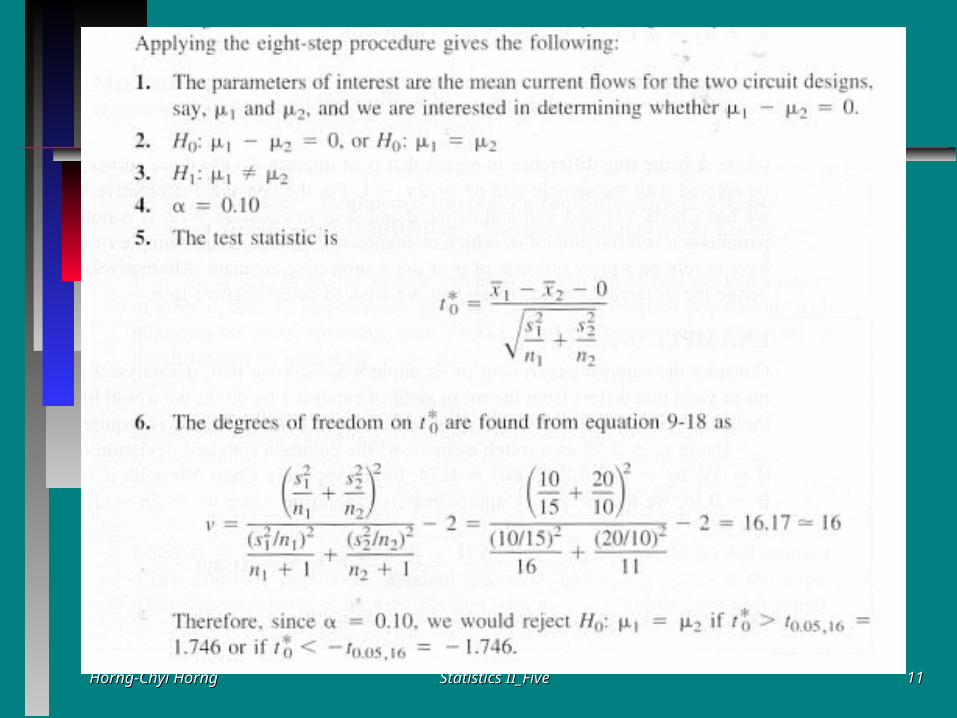
Horng-Chyi HorngHorng-Chyi Horng Statistics II_FiveStatistics II_Five 11
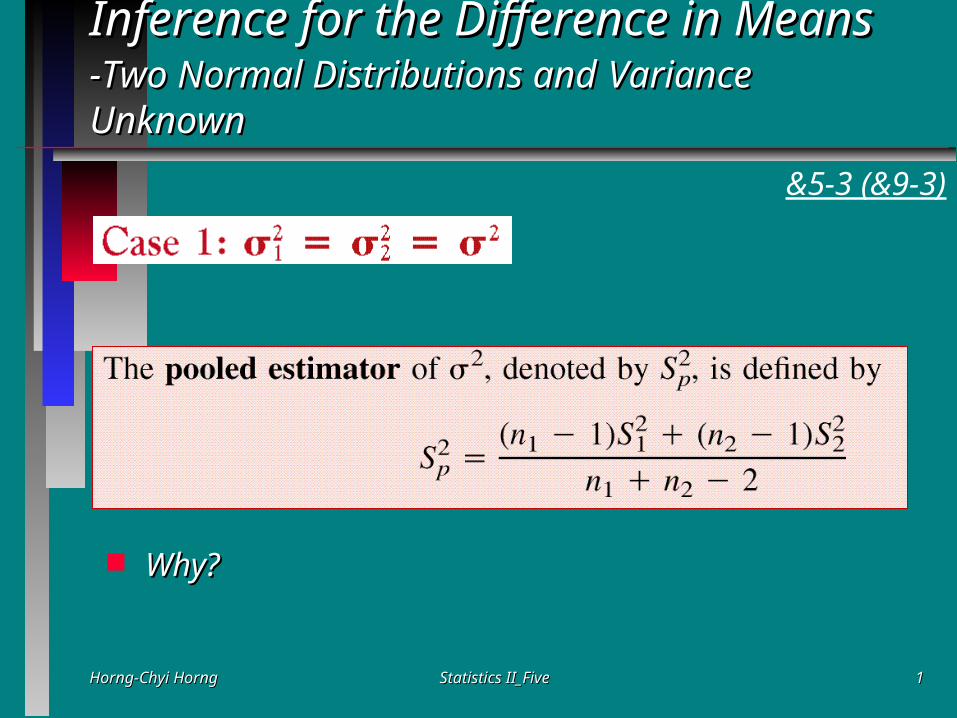
Inference for the Difference in MeansInference for the Difference in Means-Two Normal Distributions and-Two Normal Distributions and Variance UnknownVariance Unknown
&5-3 (&9-3)
Why? Why?

Horng-Chyi HorngHorng-Chyi Horng Statistics II_FiveStatistics II_Five 22
2
11
2
,
.2
1
21
222
211
21
1
222
1
211
2
2
2222
2111
21
nn
SnSn
nn
XXXX
S
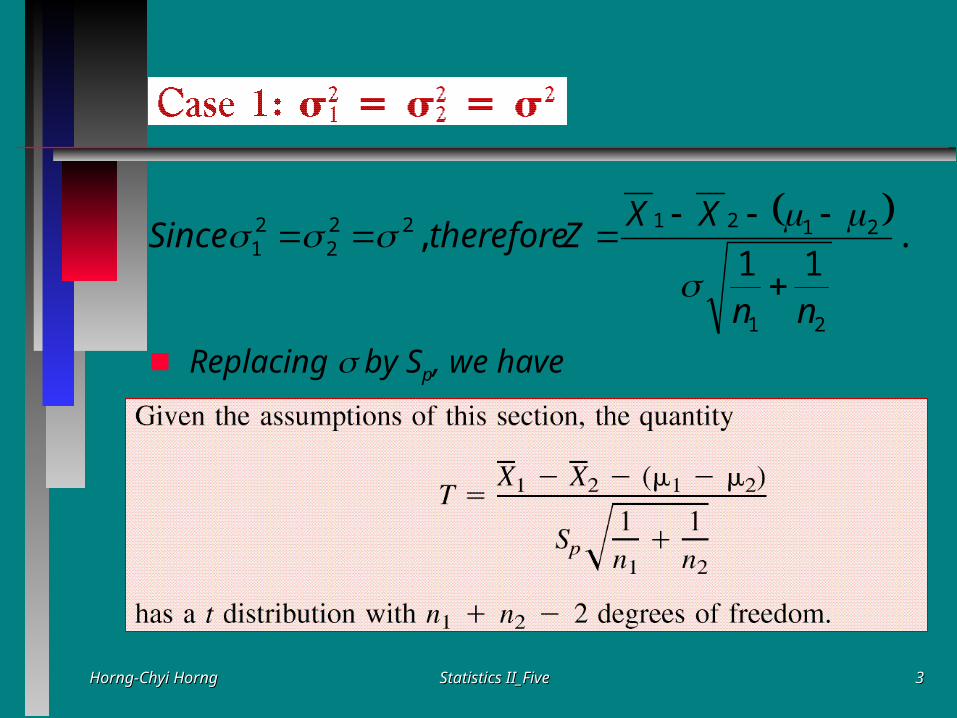
is for σestimationtheTherefore
and SXion with nd populatrom samples fand n
, and SXion with st populatrom samples fWe have n
n
jj
n
ii
p
Horng-Chyi HorngHorng-Chyi Horng Statistics II_FiveStatistics II_Five 33
Replacing by Sp, we have
.
11 ,
21
2121222
21
nn
XXZthereforeSince
Horng-Chyi HorngHorng-Chyi Horng Statistics II_FiveStatistics II_Five 44

Horng-Chyi HorngHorng-Chyi Horng Statistics II_FiveStatistics II_Five 55
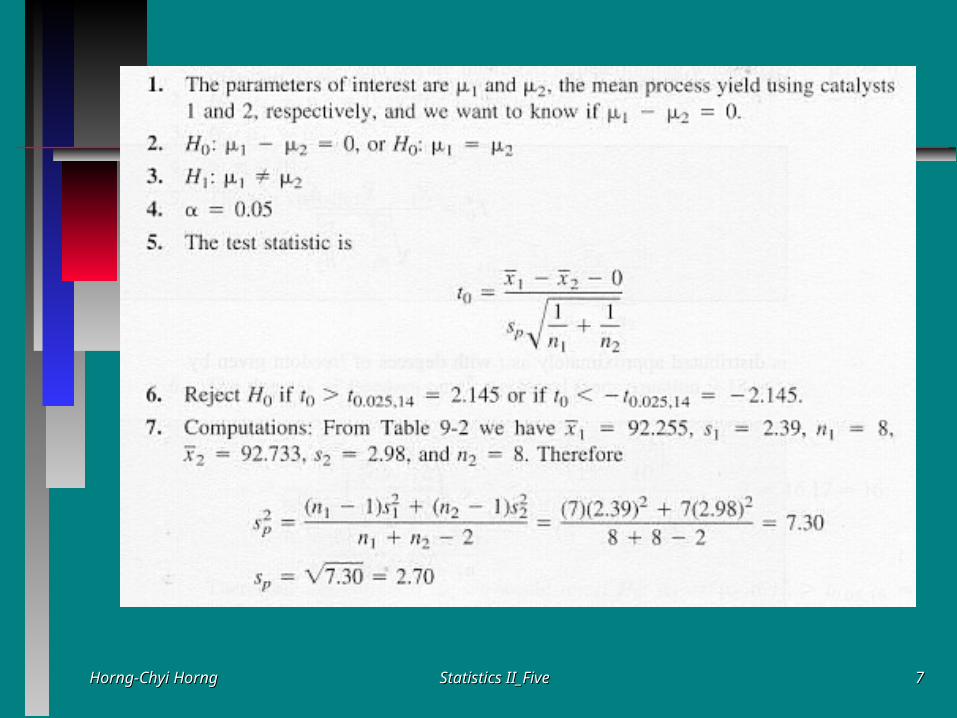
Example 9-5Example 9-5
Two catalysts are being analyzed to determine Two catalysts are being analyzed to determine how they affect the mean yield of a chemical how they affect the mean yield of a chemical process. Specially, catalyst 1 is currently in use, process. Specially, catalyst 1 is currently in use, but catalyst 2 is acceptable. Since catalyst 2 is but catalyst 2 is acceptable. Since catalyst 2 is cheaper, it should be adopted, providing it does cheaper, it should be adopted, providing it does not change the process yield. A test is run in the not change the process yield. A test is run in the pilot plant and results in the data shown in Table pilot plant and results in the data shown in Table 9-2. Is there any difference between the mean 9-2. Is there any difference between the mean yields? Use yields? Use = 0.05 and assume equal = 0.05 and assume equal variances.variances.

Horng-Chyi HorngHorng-Chyi Horng Statistics II_FiveStatistics II_Five 66
Table 9-2 Catalyst Yield Data, Example 9-5Table 9-2 Catalyst Yield Data, Example 9-5
Horng-Chyi HorngHorng-Chyi Horng Statistics II_FiveStatistics II_Five 77

Horng-Chyi HorngHorng-Chyi Horng Statistics II_FiveStatistics II_Five 88

Horng-Chyi HorngHorng-Chyi Horng Statistics II_FiveStatistics II_Five 99
have, we still and S with S and σplacing σ 22
21
22
21Re
is distributed approximately as t with degrees of freedom given by

Horng-Chyi HorngHorng-Chyi Horng Statistics II_FiveStatistics II_Five 1010
Horng-Chyi HorngHorng-Chyi Horng Statistics II_FiveStatistics II_Five 1111

Horng-Chyi HorngHorng-Chyi Horng Statistics II_FiveStatistics II_Five 1212

Horng-Chyi HorngHorng-Chyi Horng Statistics II_FiveStatistics II_Five 1313
C.I. on the Difference in MeansC.I. on the Difference in Means

Horng-Chyi HorngHorng-Chyi Horng Statistics II_FiveStatistics II_Five 1414
C.I. on the Difference in MeansC.I. on the Difference in Means

Horng-Chyi HorngHorng-Chyi Horng Statistics II_FiveStatistics II_Five 1515

Horng-Chyi HorngHorng-Chyi Horng Statistics II_FiveStatistics II_Five 1616

Horng-Chyi HorngHorng-Chyi Horng Statistics II_FiveStatistics II_Five 1717
Paired t-TestPaired t-Test
When the observations on the two populations of interest aWhen the observations on the two populations of interest are collected in re collected in pairspairs..
Let (XLet (X1111, X, X2121), (X), (X1212, X, X2222), …, (X), …, (X1n1n, X, X2n2n) be a set of n paired o) be a set of n paired o
bservations, in which Xbservations, in which X1j1j~(~(11, , 1122) and X) and X2j2j~(~(22, , 22
22) and D) and Djj
= X= X1j1j – X – X2j2j, j = 1, 2, …, n. Then, to test H, j = 1, 2, …, n. Then, to test H00: : 11= = 22 is the s is the s
ame as performing a one-sample t-test Hame as performing a one-sample t-test H00: : D D = 0 since= 0 since
D D = E(X= E(X11-X-X22) = E(X) = E(X11)-E(X)-E(X22) = ) = 1 1 - - 22
&5-4 (&9-4)

Horng-Chyi HorngHorng-Chyi Horng Statistics II_FiveStatistics II_Five 1818

Horng-Chyi HorngHorng-Chyi Horng Statistics II_FiveStatistics II_Five 1919
Example 9-9 An article in the Journal of Strain Analysis Example 9-9 An article in the Journal of Strain Analysis compares several methods for predicting the shear strength for steel compares several methods for predicting the shear strength for steel plate girders. Data for two of these methods are shown in Table plate girders. Data for two of these methods are shown in Table below. We wish to determine whether there is any difference between below. We wish to determine whether there is any difference between the two methods.the two methods.

Horng-Chyi HorngHorng-Chyi Horng Statistics II_FiveStatistics II_Five 2020
Horng-Chyi HorngHorng-Chyi Horng Statistics II_FiveStatistics II_Five 2121
Paired Vs. UnpairedPaired Vs. Unpaired
• If the experimental units are relatively homogeneous (small ) and the correlation within pairs is small, the gain in precision attributable to pairing will be offset by the loss of degrees of freedom, so an independent-sample experiment should be used.
• If the experimental units are relatively heterogeneous (large ) and there is large positive correlation within pairs, the paired experiment should be used. Typically, this case occurs when the experimental units are the same for both treatments; as in Example 9-9, the same girders were used to test the two methods.

Horng-Chyi HorngHorng-Chyi Horng Statistics II_FiveStatistics II_Five 2222
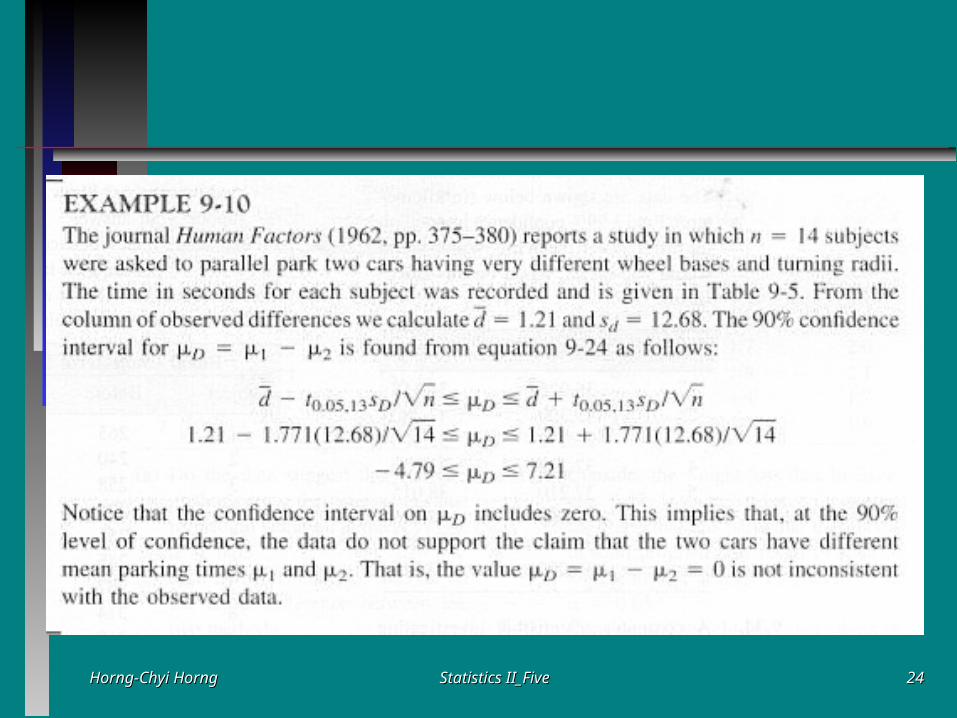
A Confidence Interval for A Confidence Interval for DD

Horng-Chyi HorngHorng-Chyi Horng Statistics II_FiveStatistics II_Five 2323
Table 9-5 Table 9-5 Time in Seconds to Parallel Park Two AutomobilesTime in Seconds to Parallel Park Two Automobiles
Horng-Chyi HorngHorng-Chyi Horng Statistics II_FiveStatistics II_Five 2424