hospital performance monitoring and improvement manual · performance improvement process to...
TRANSCRIPT
Federal Democratic Republic of Ethiopia
Ministry of Health
Hospital Performance Monitoring and
Improvement Manual
Medical Services Directorate
Ethiopian Hospital Management Initiative
July 2011

This publication was made possible by grant number 1U2GPS00284 from the
US Center for Disease Control
Federal Hospital Performance Monitoring and Improvement Manual – July 2011 1
Table of Contents
Page
Abbreviations
Glossary
5
7
Section 1
1.1
1.2
1.3
Introduction
Purpose of this Manual
Background
Development of the Manual
11
11
11
12
Section 2 Practical Tools for Performance Improvement 13
Section 3 A Framework for Hospital Performance Monitoring and
Improvement
23
Section 4
4.1
4.2
4.3
4.4
4.4.1
4.4.2
4.5
4.5.1
4.5.2
4.6
4.6.1
4.6.2
Hospital Key Performance Indicators (KPIs)
What are Key Performance Indicators?
KPIs for Ethiopian hospitals
Relationship to HMIS
Collecting hospital KPI data
KPI data owners
KPI focal person
Reporting hospital KPI Data
Analysis and reporting at hospital level
Analysis and reporting at regional level
How should KPIs be used?
Use of KPIs by hospital management and staff
Use of KPIs by hospital governing boards
27
27
28
30
30
30
31
34
34
34
35
35
36
Federal Hospital Performance Monitoring and Improvement Manual – July 2011 2
4.6.3
4.6.4
4.7
4.8
Use of KPIs by Regional Health Bureaus
Use of KPIs by FMOH
KPI data elements
Detailed guide to each KPI
37
38
38
40
Section 5
5.1
5.2
5.3
5.4
5.4.1
5.4.2
5.5
5.5.1
5.5.2
5.5.3
5.5.4
5.6
Hospital Supportive Supervision Site Visits
Purpose of hospital supportive supervision site visits
Overview of the site visit process
Selection of the site visit team
Pre-visit preparation for a site visit
Preparation by the site visit team
Preparation by the hospital
Conducting the site visit
Opening meeting
Information gathering
Collation of evidence
Closing meeting
Post visit follow up
81
81
81
83
83
84
86
86
86
86
86
87
87
Section 6
6.1
6.2
6.3
6.4
6.5
6.6
6.7
Regional Review Meetings
Purpose
Frequency of meetings
Length of meetings
Participants
Pre-meeting preparation
Conducting the meeting
Post meeting follow up
89
89
89
89
89
90
90
90
Federal Hospital Performance Monitoring and Improvement Manual – July 2011 3
Section 7
7.1
7.2
7.3
7.4
7.5
7.6
7.7
FMOH and RHB Review Meetings
Purpose
Frequency of meetings
Length of meetings
Participants
Pre-meeting preparation
Conducting the meeting
Post meeting follow up
91
91
91
91
91
92
92
92
Appendices:
Appendix 1 User Guide: Hospital KPI Database 93
Appendix 2
Appendix 3
User Guide: Hospital EHRIG Database
User Guide: Regional KPI Database
101
105
Appendix 4 User Guide: Regional EHRIG Database 109
Appendix 5
Appendix 6
Appendix 7
Appendix 8
Hospital Key Performance Indicator Definitions and Calculations
Assessment Tool for Operational Standards of EHRIG
Survey Protocol: Outpatient Waiting Time to Treatment
Survey Protocol: Emergency Patients Triaged Within 5 min of Arrival
115
165
189
193
Appendix 9 Pressure Ulcer Report Form 197
Appendix 10 Surgical Site Infection Report Form 199
Appendix 11 Audit Protocol: Completeness of Inpatient Medical Records 201
Appendix 12 Survey Protocol: Patient Satisfaction 203
Appendix 13 User Guide: O-PAHC and I-PAHC Database and Analytical Tool 213
Appendix 14 Template for Site Visit Briefing Document 223
Appendix 15
Appendix 16
Template for Site Visit Report
Template for Hospital Response to Site Visit Report
225
227
Federal Hospital Performance Monitoring and Improvement Manual – July 2011 4
List of Tables
Table 1 Key Elements of the Hospital Performance Monitoring Framework 24
Table 2 KPIs and KPI data owners 32
Table 3 KPI Data Elements 38
List of Figures
Figure 1
Figure 2
Figure 3
Figure 4
Figure 5
Figure 6
Figure 7
Figure 8
Figure 9
Figure 10
Figure 11
Common Mistakes and Suggestions for Problem Statements
Relating the Problem Statement, Objective and Target
Sample Fishbone Diagram
Sample Flow Chart
Sample Histogram
Sample Options Appraisals
Sample Gantt Chart
Framework for Hospital Performance Monitoring and Improvement
Driving with the bonnet up!
Overview of the Supportive Supervision Site Visit Process
Sample Site Visit Schedule
14
15
16
17
18
19
21
25
27
82
85
Federal Hospital Performance Monitoring and Improvement Manual – July 2011 5
Abbreviations
ANC Antenatal Care
ART Antiretroviral Therapy
ALOS Average Length of Stay
BOR Bed Occupancy Rate
BPR Business Process Reengineering
CEO Chief Executive Officer
CHAI Clinton Health Access Initiative
CRCPTs Curative and Rehabilitative Core Process Teams
DOTS Directly Observed Therapy (Short Course)
EHRIG Ethiopian Hospital Reform Implementation Guidelines
EHMI Ethiopian Hospital Management Initiative
EPI Expanded Program on Immunization
FMOH Federal Ministry of Health
FTE Full time equivalent
HMIS Health Management Information System
HCFR Healthcare Finance Reform
H-CAHPS Hospital Consumer Assessment of Health Providers and Systems
HR Human Resources
HSDP Health Sector Development Plan
I-PAHC Inpatient Assessment of Health Care
KPI Key Performance Indicator
MHA Masters in Hospital and Healthcare Administration
MCH Maternal and Child Health
MSD Medical Services Directorate (FMOH)
NHS National Health Service (UK)
NGO Non Governmental Organization
Federal Hospital Performance Monitoring and Improvement Manual – July 2011 6
OPD Outpatient Department
O-PAHC Outpatient Assessment of Health Care
PNC Post Natal Care
RHB Regional Health Bureau
SMT Senior Management Team (Hospitals)
SEHC Satisfaction of Employees in Health Care
TB Tuberculosis
VCT Voluntary Counseling and Testing
Federal Hospital Performance Monitoring and Improvement Manual – July 2011 7
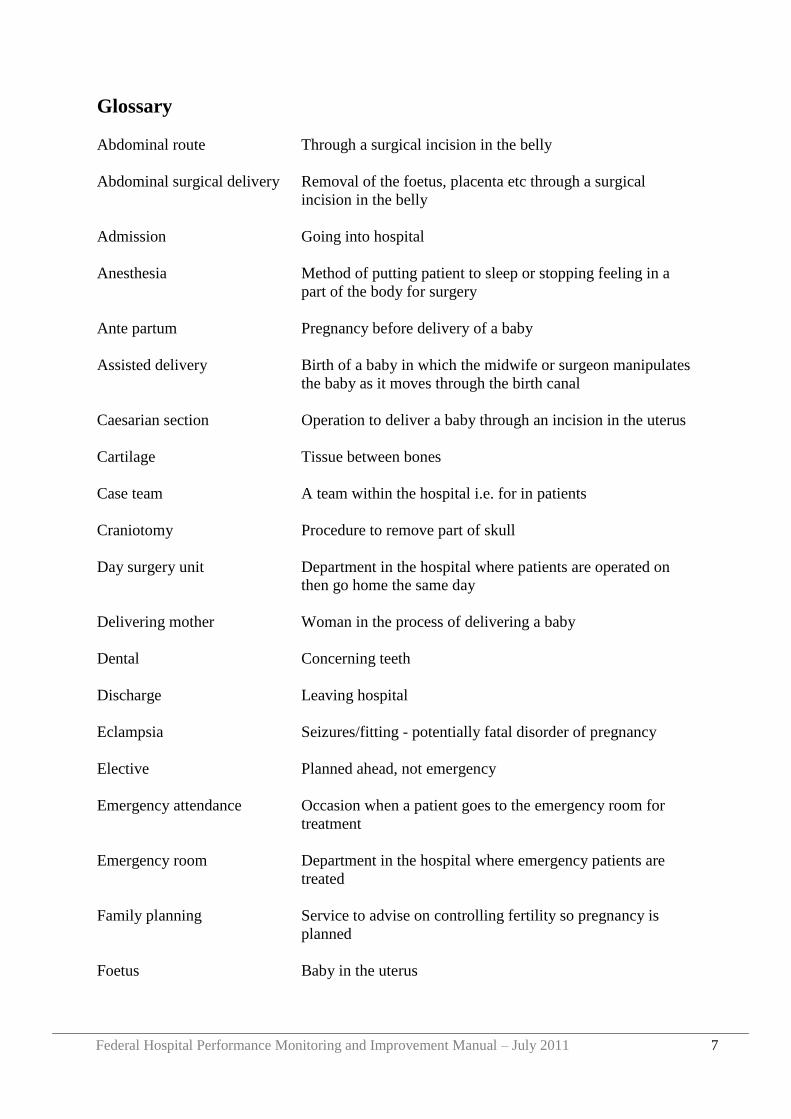
Glossary
Abdominal route Through a surgical incision in the belly
Abdominal surgical delivery Removal of the foetus, placenta etc through a surgical
incision in the belly
Admission Going into hospital
Anesthesia Method of putting patient to sleep or stopping feeling in a
part of the body for surgery
Ante partum Pregnancy before delivery of a baby
Assisted delivery Birth of a baby in which the midwife or surgeon manipulates
the baby as it moves through the birth canal
Caesarian section Operation to deliver a baby through an incision in the uterus
Cartilage Tissue between bones
Case team A team within the hospital i.e. for in patients
Craniotomy Procedure to remove part of skull
Day surgery unit Department in the hospital where patients are operated on
then go home the same day
Delivering mother Woman in the process of delivering a baby
Dental Concerning teeth
Discharge Leaving hospital
Eclampsia Seizures/fitting - potentially fatal disorder of pregnancy
Elective Planned ahead, not emergency
Emergency attendance Occasion when a patient goes to the emergency room for
treatment
Emergency room Department in the hospital where emergency patients are
treated
Family planning Service to advise on controlling fertility so pregnancy is
planned
Foetus Baby in the uterus
Federal Hospital Performance Monitoring and Improvement Manual – July 2011 8
Forceps delivery
Delivery of a baby using forceps to pull the baby out
Gestational age Age of the baby in the womb during pregnancy, i.e. how far
on in pregnancy
Gynecology Medical specialty concerned with areas of women's health
such as fertility, pregnancy, continence
Haemorrhage Bleeding
Hospital performance
monitoring framework
Ethiopian system for monitoring the performance of health
facilities
In patient Patient staying in the hospital
Incision Cut in the skin by a surgeon
Infection prevention
processes
Procedures like regular hand washing and sterilization of
instruments which stop the spread of infections
Instrumental delivery See assisted delivery
Intensive care unit Department in the hospital for acutely ill patients with higher
levels of medical and nursing care
Intra partum During delivery of a baby
Key performance indicator An agreed measure that all facilities collect in the same way
Labouring mother Woman in labor
Live birth Baby who is born alive
Maternity Concerning pregnancy and childbirth
Medical record Papers that document the care and treatment a patient
received
Morbidity Illness or disability
Mortality Death
Neonatal Concerning newborn babies
Ophthalmology Medical specialty for eye diseases
Out patient Patient visiting the hospital for treatment
Performance improvement Process to improve the organization‟s performance
Federal Hospital Performance Monitoring and Improvement Manual – July 2011 9
Postpartum A description of the mother after delivery of a baby
Pressure ulcer Skin breakdown because of continued pressure
Private wing Part of the hospital where patients pay for all services they
receive
Psychiatry Medical specialty for mental health
Purulent With pus, infected
Referral Recommendation that a patient attend another hospital or
clinic
Sacrum Bottom of the back above the buttocks
Stillbirth Baby who is born dead
Subcutaneous tissue Tissue under the skin
Supportive supervision site
visit
A visit by the RHB and partners to the hospital to review
performance
Surgical delivery Baby delivered by an operation
Surgical site infection Infection at the place on the body where a surgical incision
was made
Triage A process of sorting patients into priority groups for
treatment according to need
Uterus Womb
Vacuum delivery Delivery of a baby using a suction instrument to pull the
baby out
Vaginal delivery Baby delivered normally
Well baby clinic Clinic to checks on babies' development
Wound Area of damaged skin for example from an injury or surgery
Wound dehiscence An area of a wound which is not healing and has come apart
or broken down

Federal Hospital Performance Monitoring and Improvement Manual – July 2011 10
Federal Hospital Performance Monitoring and Improvement Manual – July 2011 11
Section 1 Introduction
1.1 Purpose of this Manual
This manual has been developed to help hospital senior management teams (SMTs),
Governing Boards (GBs) and higher health offices to monitor hospital performance, focusing
on a core set of Key Performance Indicators (KPIs) to ensure the effectiveness, efficiency and
quality of services provided. The manual sets out a framework for hospital performance
monitoring using the KPIs, and outlines how the framework has been developed and why
performance monitoring using a core set of KPIs is important at all levels. The manual
provides detailed guidance to ensure that hospitals collect and analyze accurate KPI data and
provides guidance on performance improvement methods that will assist hospital
management and staff to act upon the findings of the KPIs. The manual also provides
guidance for the Federal Ministry of Health (FMOH) and Regional Health Bureaus (RHBs)
to receive, review and analyze KPI information, and to conduct site visits and facilitate
review meetings that aim to strengthen hospital performance.
Please note: The indicators and guidance outlined in this document do not remove the
responsibility of hospitals for implementing the routine reporting, review and monitoring
processes of the Health Management Information System (HMIS). The guidance in this
document is complementary to HMIS, and HMIS processes should still be established in all
hospitals.
1.2 Background
The FMOH and RHBs are leading a sector wide reform to strengthen and improve health
services in Ethiopia. Hospitals are central to these reform efforts and a number of recent
initiatives have specifically sought to improve hospital performance. Such initiatives include
Health Care Finance Reform (HCFR), Business Process Re-engineering (BPR), Health
Management Information System (HMIS), and the Ethiopian Hospital Reform
Implementation Guidelines (EHRIG), among others.
Hospital Governing Boards have been established and Chief Executive Officers (CEOs) have
been appointed to the majority of hospitals, thereby increasing the autonomy of hospitals.
Through BPR „Curative and Rehabilitative Core Process Teams‟ have been established
within RHBs. The main role of the CRCPTs is to oversee health service delivery within
hospitals and health centers. Similarly the Medical Services Directorate (MSD) has been
established within the FMOH to oversee the performance of Federal Hospitals and to support
RHBs in their efforts to improve hospital and health centre performance in each Region.
To achieve their functions, these stakeholders (Governing Boards, CRCPTs and MSD)
require accurate and timely information about hospital performance to ensure that
expectations are being met and to take timely action to address any problems identified.
Federal Hospital Performance Monitoring and Improvement Manual – July 2011 12
Additionally, hospitals would benefit from experience sharing and the identification and
dissemination of best practice.
Nationwide, hospital performance monitoring has been conducted by RHBs using different
methodologies. Some regions have established hospital performance indicators, in some
regions supportive supervision has been conducted and some regions have established regular
hospital review meetings. However, there has been no systematic effort to share performance
monitoring experience between regions and the efforts of stakeholders (e.g. MSD staff,
CRCPTs, hospital staff and partners) are poorly coordinated.
This Manual sets out a Framework for Hospital Performance Monitoring and Improvement
focused on a core set of KPIs that seeks to address the above needs and challenges. The
Manual outlines processes by which hospitals, FMOH and RHBs can collaborate to
strengthen hospital performance monitoring, thus maximizing resources and preventing
duplication of efforts.
1.3 Development of the Manual
The Framework and KPIs presented in this Manual were first drafted by MSD and presented
to representatives from all Regional CRCPTs (with the exception of Afar Region) for
discussion and review at a two-day workshop held in Addis Ababa in September 2010.
During the workshop participants split into small groups for critical review and discussion on
the proposed Framework and KPIs. Following feedback, the Framework and KPIs were
revised and presented once again to meeting participants. All participants accepted the
revised Framework and KPIs, and agreed that each Region would subsequently work towards
implementation of this Performance Monitoring Framework and KPIs, with the support of
MSD and relevant partners as required.
Additionally, field visits were conducted by CRCPT, MSD and Clinton Health Access
Initiative (CHAI) staff to 9 hospitals in 4 Regions. During the field visits the definitions,
inclusion and exclusion criteria and data sources for each KPI were critically reviewed and
training needs ascertained.
Following agreement on the Performance Monitoring Framework and KPIs, MSD and the
CRCPT of RHBs developed this Manual with the technical assistance of CHAI.
Federal Hospital Performance Monitoring and Improvement Manual – July 2011 13
Section 2 Practical tools for Performance Improvement
Common tools for performance improvement include both problem solving and change
management. Although there are many approaches to both problem solving and change
management, some common elements are apparent. These can be summarized in the „8 Step
Scientific Method of Problem Solving‟ which is described below.
Step 1 Define the problem,
Step 2 Set the overall objective,
Step 3 Conduct a root cause analysis,
Step 4 Generate alternative interventions,
Step 5 Perform comparative analyses of alternatives,
Step 6 Select the best intervention and address its limitations,
Step 7 Develop an implementation plan and implement, and
Step 8 Develop an evaluation plan and evaluate.
To successfully move from one step to the next, leaders can rely on a number of useful
management tools including:
Root cause analysis, including fishbone diagramming, flow charting, and histograms,
Options appraisal using evaluative criteria, and
Gantt chart.
Each step, together with the associated management tools, is described in detail below.
Step 1: Define the problem
The first step to solving a problem is to define the problem (the „problem statement‟) in a
way that allows us to find solutions. Defining the problem requires analysis of the current
situation and how it differs from the desired situation. To devise a good problem statement
the following should be considered:
1. Focus on a single problem: The challenges that leaders face are complex, but it is
important to identify one single problem to work on, rather than getting lost in a tangle of
multiple problems.
Federal Hospital Performance Monitoring and Improvement Manual – July 2011 14
2. Address problems that are feasibly solved: Selecting a problem that is impossible to
solve will result in frustration and no clear progress.
3. Keep it short: Simply state, “The problem is…” Long, complex problem statements can
be confusing and may result in a lack of a shared understanding of the problem.
4. Find statements that are shared widely by key constituents: In order to gain support for
your solutions, key players must all believe that this problem exists and is important.
5. Do NOT include solutions themselves: This first step simply states the problem.
Subsequent steps focus on identifying solutions. Good leaders often may have a solution
in mind, but a clear strategy starts with the problem, and next focuses on generating
multiple solutions.
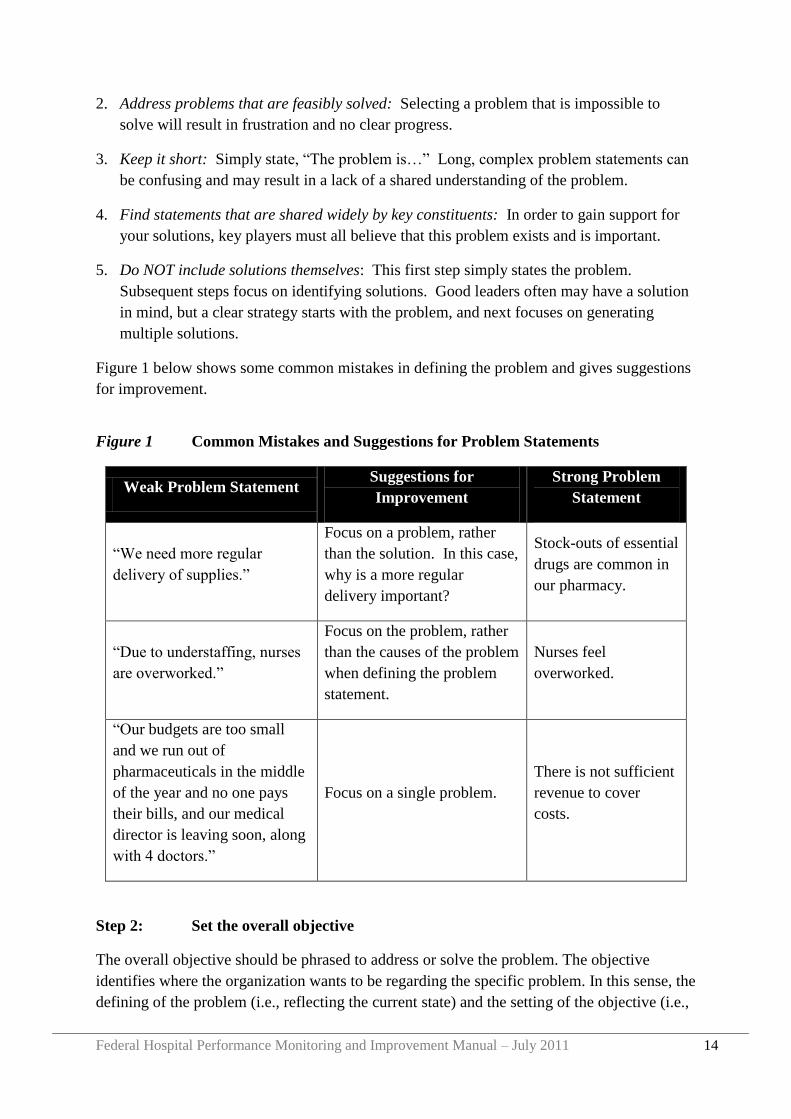
Figure 1 below shows some common mistakes in defining the problem and gives suggestions
for improvement.
Figure 1 Common Mistakes and Suggestions for Problem Statements
Weak Problem Statement Suggestions for
Improvement
Strong Problem
Statement
“We need more regular
delivery of supplies.”
Focus on a problem, rather
than the solution. In this case,
why is a more regular
delivery important?
Stock-outs of essential
drugs are common in
our pharmacy.
“Due to understaffing, nurses
are overworked.”
Focus on the problem, rather
than the causes of the problem
when defining the problem
statement.
Nurses feel
overworked.
“Our budgets are too small
and we run out of
pharmaceuticals in the middle
of the year and no one pays
their bills, and our medical
director is leaving soon, along
with 4 doctors.”
Focus on a single problem.
There is not sufficient
revenue to cover
costs.
Step 2: Set the overall objective
The overall objective should be phrased to address or solve the problem. The objective
identifies where the organization wants to be regarding the specific problem. In this sense, the
defining of the problem (i.e., reflecting the current state) and the setting of the objective (i.e.,
Federal Hospital Performance Monitoring and Improvement Manual – July 2011 15
the desired state) is a central part of strategic management. The objective is the goal that your
team will focus all of its efforts toward achieving, so it is important that it is clearly defined.
Good overall objectives address the problem you have defined in the problem statement and
have measurable targets.
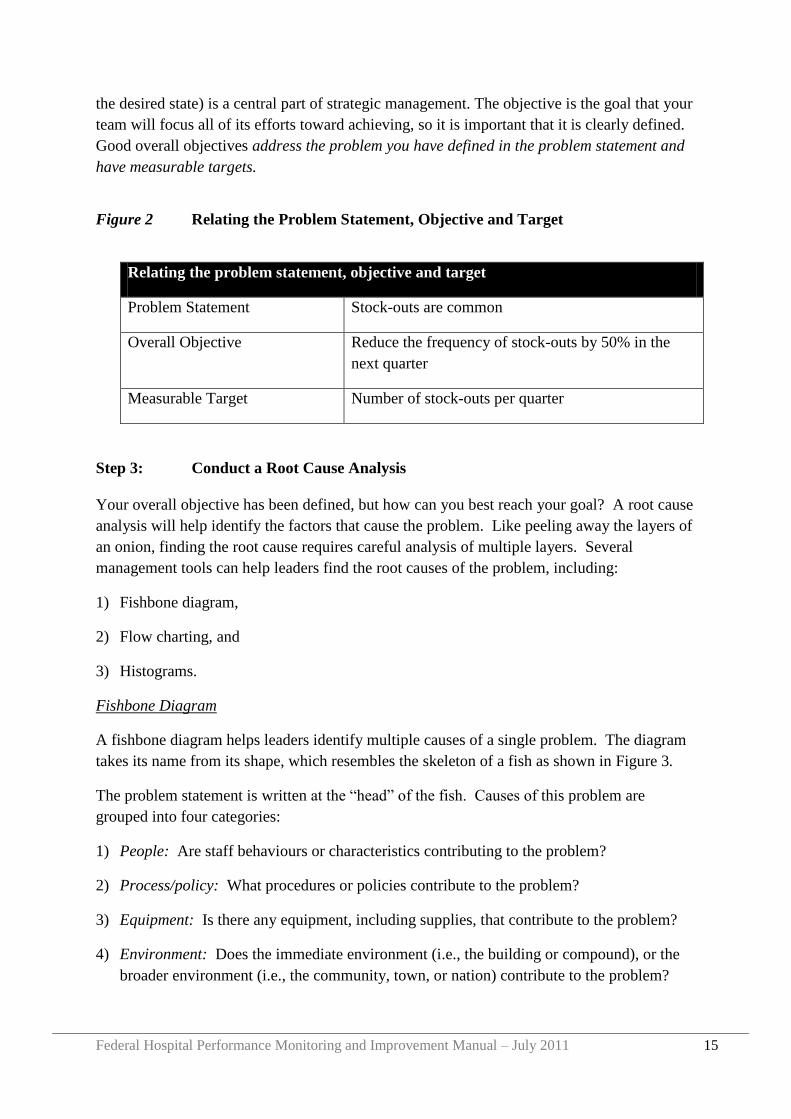
Figure 2 Relating the Problem Statement, Objective and Target
Relating the problem statement, objective and target
Problem Statement Stock-outs are common
Overall Objective Reduce the frequency of stock-outs by 50% in the
next quarter
Measurable Target Number of stock-outs per quarter
Step 3: Conduct a Root Cause Analysis
Your overall objective has been defined, but how can you best reach your goal? A root cause
analysis will help identify the factors that cause the problem. Like peeling away the layers of
an onion, finding the root cause requires careful analysis of multiple layers. Several
management tools can help leaders find the root causes of the problem, including:
1) Fishbone diagram,
2) Flow charting, and
3) Histograms.
Fishbone Diagram
A fishbone diagram helps leaders identify multiple causes of a single problem. The diagram
takes its name from its shape, which resembles the skeleton of a fish as shown in Figure 3.
The problem statement is written at the “head” of the fish. Causes of this problem are
grouped into four categories:
1) People: Are staff behaviours or characteristics contributing to the problem?
2) Process/policy: What procedures or policies contribute to the problem?
3) Equipment: Is there any equipment, including supplies, that contribute to the problem?
4) Environment: Does the immediate environment (i.e., the building or compound), or the
broader environment (i.e., the community, town, or nation) contribute to the problem?
Federal Hospital Performance Monitoring and Improvement Manual – July 2011 16
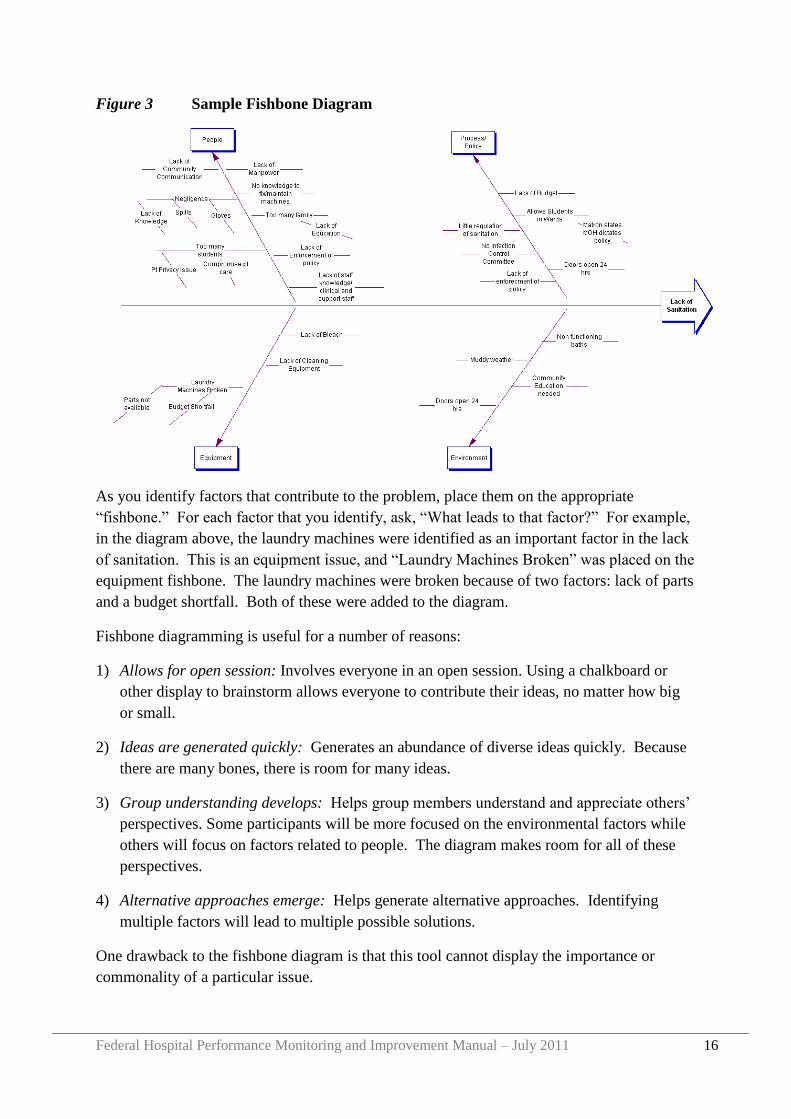
Figure 3 Sample Fishbone Diagram
As you identify factors that contribute to the problem, place them on the appropriate
“fishbone.” For each factor that you identify, ask, “What leads to that factor?” For example,
in the diagram above, the laundry machines were identified as an important factor in the lack
of sanitation. This is an equipment issue, and “Laundry Machines Broken” was placed on the
equipment fishbone. The laundry machines were broken because of two factors: lack of parts
and a budget shortfall. Both of these were added to the diagram.
Fishbone diagramming is useful for a number of reasons:
1) Allows for open session: Involves everyone in an open session. Using a chalkboard or
other display to brainstorm allows everyone to contribute their ideas, no matter how big
or small.
2) Ideas are generated quickly: Generates an abundance of diverse ideas quickly. Because
there are many bones, there is room for many ideas.
3) Group understanding develops: Helps group members understand and appreciate others‟
perspectives. Some participants will be more focused on the environmental factors while
others will focus on factors related to people. The diagram makes room for all of these
perspectives.
4) Alternative approaches emerge: Helps generate alternative approaches. Identifying
multiple factors will lead to multiple possible solutions.
One drawback to the fishbone diagram is that this tool cannot display the importance or
commonality of a particular issue.
Federal Hospital Performance Monitoring and Improvement Manual – July 2011 17
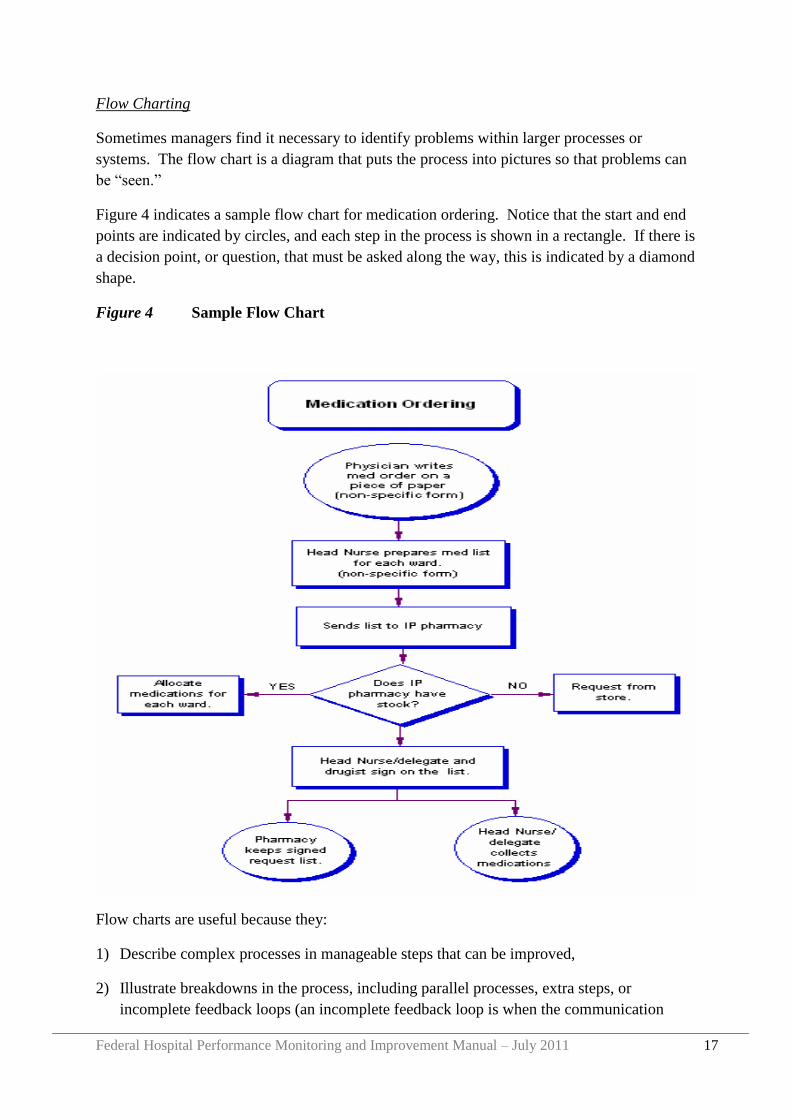
Flow Charting
Sometimes managers find it necessary to identify problems within larger processes or
systems. The flow chart is a diagram that puts the process into pictures so that problems can
be “seen.”
Figure 4 indicates a sample flow chart for medication ordering. Notice that the start and end
points are indicated by circles, and each step in the process is shown in a rectangle. If there is
a decision point, or question, that must be asked along the way, this is indicated by a diamond
shape.
Figure 4 Sample Flow Chart
Flow charts are useful because they:
1) Describe complex processes in manageable steps that can be improved,
2) Illustrate breakdowns in the process, including parallel processes, extra steps, or
incomplete feedback loops (an incomplete feedback loop is when the communication
Federal Hospital Performance Monitoring and Improvement Manual – July 2011 18
loop is not “closed,” i.e., the conversation ends without a clear assignment of action steps
for specific people to accomplish in a specific time period),
3) Show how one‟s own actions influence “downstream” events,
4) Foster a team that “owns” the whole process, not simply individuals focused only on
fragments, and
5) Help generate alternative approaches.
While a flow chart is useful for identifying breakdowns in the process, this tool does not tell
how often breakdowns occur.
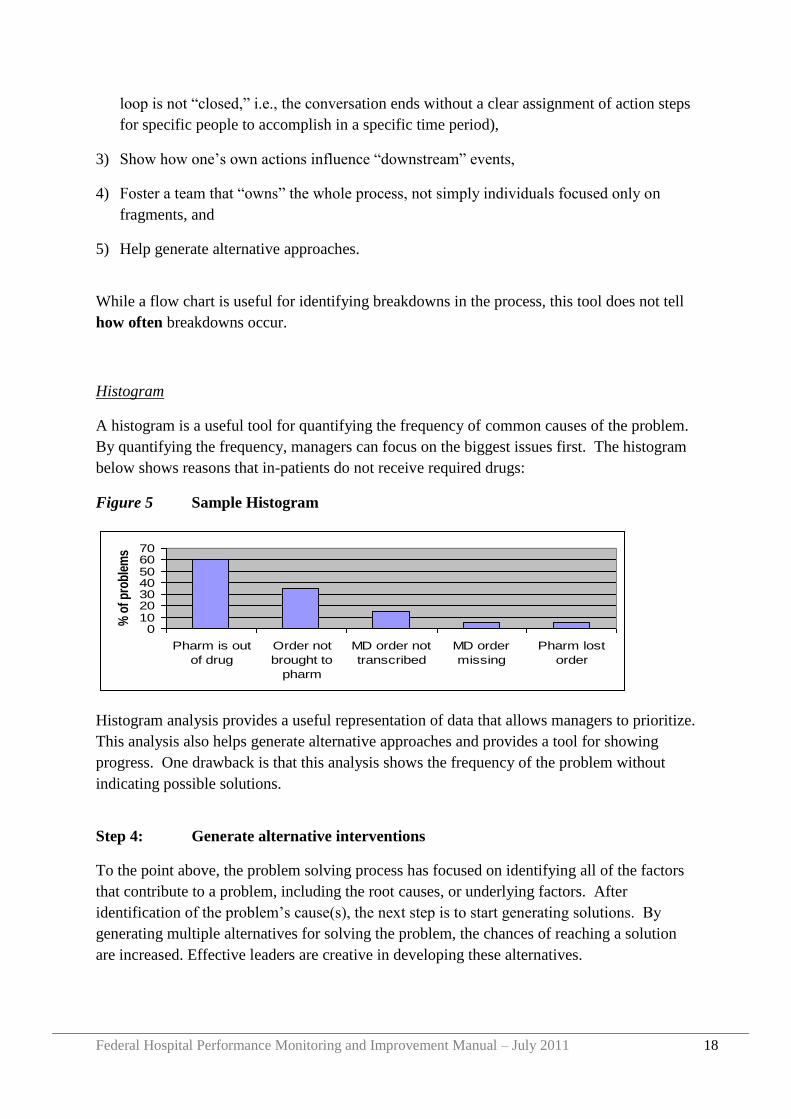
Histogram
A histogram is a useful tool for quantifying the frequency of common causes of the problem.
By quantifying the frequency, managers can focus on the biggest issues first. The histogram
below shows reasons that in-patients do not receive required drugs:
Figure 5 Sample Histogram
Histogram analysis provides a useful representation of data that allows managers to prioritize.
This analysis also helps generate alternative approaches and provides a tool for showing
progress. One drawback is that this analysis shows the frequency of the problem without
indicating possible solutions.
Step 4: Generate alternative interventions
To the point above, the problem solving process has focused on identifying all of the factors
that contribute to a problem, including the root causes, or underlying factors. After
identification of the problem‟s cause(s), the next step is to start generating solutions. By
generating multiple alternatives for solving the problem, the chances of reaching a solution
are increased. Effective leaders are creative in developing these alternatives.
010203040506070
Pharm is out
of drug
Order not
brought to
pharm
MD order not
transcribed
MD order
missing
Pharm lost
order
% o
f p
rob
lem
s
Federal Hospital Performance Monitoring and Improvement Manual – July 2011 19
Good alternatives are:
Clearly described,
Comprehensive, but not too many (try to identify 2 to 4 solutions),
Feasible to implement, and
Mutually exclusive, so you can compare and choose one of the options:
o Do A and do not do B,
o Do B and do not do A, or
o Do both A and B
Step 5: Perform comparative analysis of alternatives
When a few alternative interventions have been generated, the most promising intervention
must be identified. Comparing these alternatives can be challenging, as some members of the
group may prefer one alternative, while other members may champion a different alternative.
An Options Appraisal allows for a side-by-side comparison of the strategic alternatives using
evaluative criteria to select the best option. Consider the following options for addressing
low productivity:
Problem Productivity is inadequate
Option 1 Increase staffing
Option 2 Increase pay among existing staff
Option 3 Increase supervision of existing staff
In order to compare these 3 options, the group must agree on a set of evaluative criteria.
Evaluative criteria are factors that are important to the group and the organization. For
example, they may include effect of the problem, expense, political feasibility, or time to
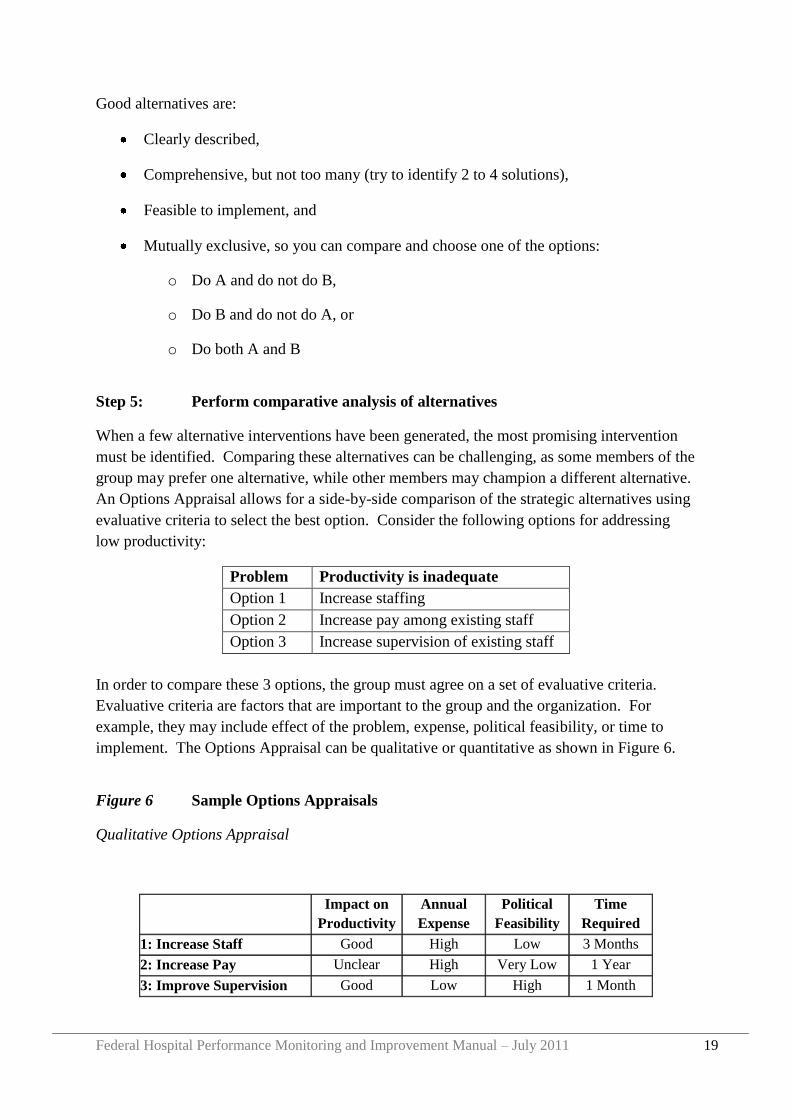
implement. The Options Appraisal can be qualitative or quantitative as shown in Figure 6.
Figure 6 Sample Options Appraisals
Qualitative Options Appraisal
Impact on
Productivity
Annual
Expense
Political
Feasibility
Time
Required
1: Increase Staff Good High Low 3 Months
2: Increase Pay Unclear High Very Low 1 Year
3: Improve Supervision Good Low High 1 Month
Federal Hospital Performance Monitoring and Improvement Manual – July 2011 20
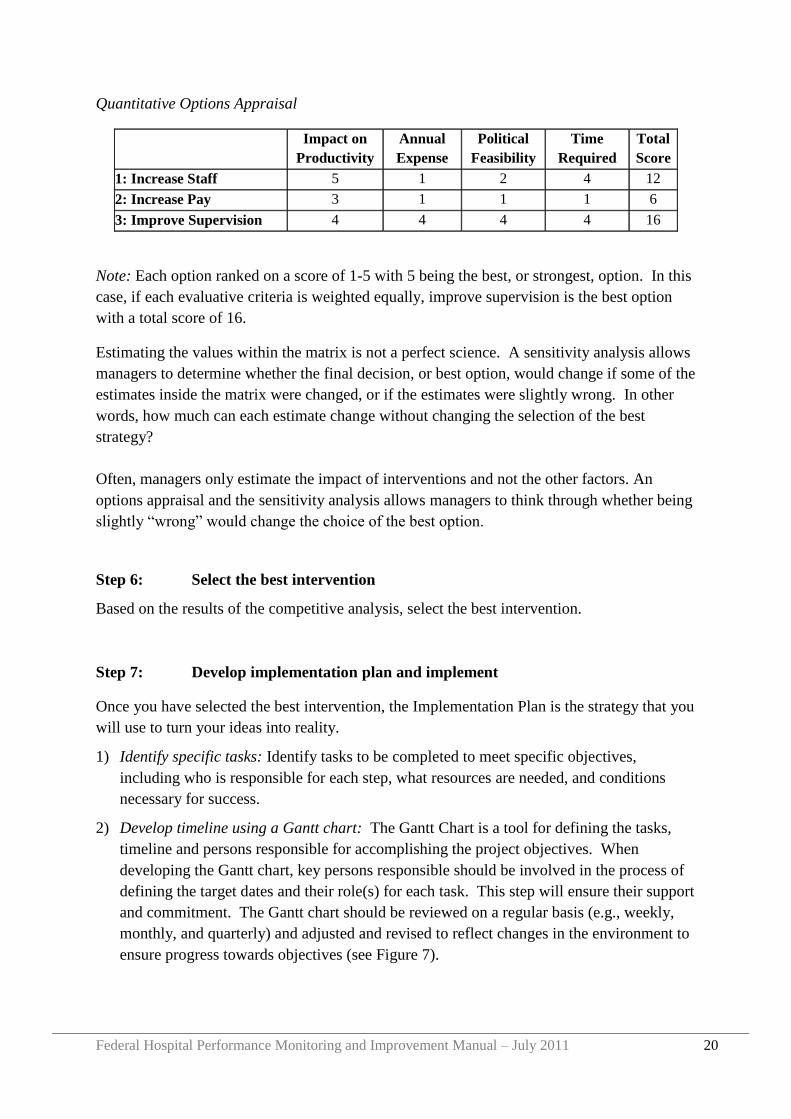
Quantitative Options Appraisal
Impact on
Productivity
Annual
Expense
Political
Feasibility
Time
Required
Total
Score
1: Increase Staff 5 1 2 4 12
2: Increase Pay 3 1 1 1 6
3: Improve Supervision 4 4 4 4 16
Note: Each option ranked on a score of 1-5 with 5 being the best, or strongest, option. In this
case, if each evaluative criteria is weighted equally, improve supervision is the best option
with a total score of 16.
Estimating the values within the matrix is not a perfect science. A sensitivity analysis allows
managers to determine whether the final decision, or best option, would change if some of the
estimates inside the matrix were changed, or if the estimates were slightly wrong. In other
words, how much can each estimate change without changing the selection of the best
strategy?
Often, managers only estimate the impact of interventions and not the other factors. An
options appraisal and the sensitivity analysis allows managers to think through whether being
slightly “wrong” would change the choice of the best option.
Step 6: Select the best intervention
Based on the results of the competitive analysis, select the best intervention.
Step 7: Develop implementation plan and implement
Once you have selected the best intervention, the Implementation Plan is the strategy that you
will use to turn your ideas into reality.
1) Identify specific tasks: Identify tasks to be completed to meet specific objectives,
including who is responsible for each step, what resources are needed, and conditions
necessary for success.
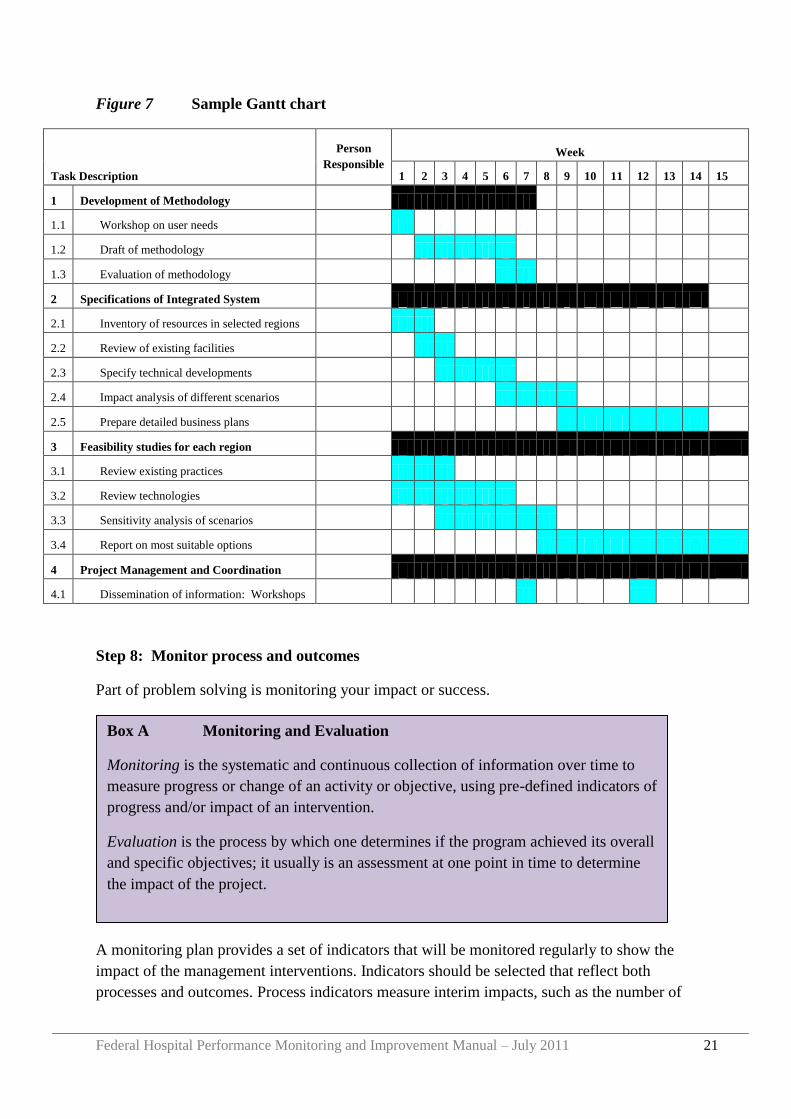
2) Develop timeline using a Gantt chart: The Gantt Chart is a tool for defining the tasks,
timeline and persons responsible for accomplishing the project objectives. When
developing the Gantt chart, key persons responsible should be involved in the process of
defining the target dates and their role(s) for each task. This step will ensure their support
and commitment. The Gantt chart should be reviewed on a regular basis (e.g., weekly,
monthly, and quarterly) and adjusted and revised to reflect changes in the environment to
ensure progress towards objectives (see Figure 7).
Federal Hospital Performance Monitoring and Improvement Manual – July 2011 21
Figure 7 Sample Gantt chart
Task Description
Person
Responsible
Week
1 2 3 4 5 6 7 8 9 10 11 12 13 14 15
1 Development of Methodology
1.1 Workshop on user needs
1.2 Draft of methodology
1.3 Evaluation of methodology
2 Specifications of Integrated System
2.1 Inventory of resources in selected regions
2.2 Review of existing facilities
2.3 Specify technical developments
2.4 Impact analysis of different scenarios
2.5 Prepare detailed business plans
3 Feasibility studies for each region
3.1 Review existing practices
3.2 Review technologies
3.3 Sensitivity analysis of scenarios
3.4 Report on most suitable options
4 Project Management and Coordination
4.1 Dissemination of information: Workshops
Step 8: Monitor process and outcomes
Part of problem solving is monitoring your impact or success.
A monitoring plan provides a set of indicators that will be monitored regularly to show the
impact of the management interventions. Indicators should be selected that reflect both
processes and outcomes. Process indicators measure interim impacts, such as the number of
Box A Monitoring and Evaluation
Monitoring is the systematic and continuous collection of information over time to
measure progress or change of an activity or objective, using pre-defined indicators of
progress and/or impact of an intervention.
Evaluation is the process by which one determines if the program achieved its overall
and specific objectives; it usually is an assessment at one point in time to determine
the impact of the project.
Federal Hospital Performance Monitoring and Improvement Manual – July 2011 22
staff trained or the percent of drugs properly unpacked and put away properly. Outcome
indicators measure the ultimate objectives such as patient waiting time or stock outs or
patient satisfaction. A good evaluation system has both types of indicators. In addition, the
system should identify how each indicator will be measured, and ideally, what the target is
for performance (i.e., waiting time will be less than one hour for 90 percent of patients;
satisfaction scores will increase by 25%, etc.
The management team can use information generated from monitoring and evaluation to
assess if interventions are working as expected and identify where further work is needed to
improve performance in desired areas.
Federal Hospital Performance Monitoring and Improvement Manual – July 2011 23
Section 3 A Framework for Hospital Performance Monitoring
and Improvement
What is Hospital Performance Monitoring and Improvement?
Hospital performance monitoring and improvement is a process by which hospitals are
supported and held accountable for providing effective, efficient and quality health services.
Specific aims of hospital performance monitoring and improvement include:
To ensure the provision of effective, efficient and quality health care by all Ethiopian
public hospitals
To strengthen the performance of hospitals in relation to HSDP IV goals and objectives,
including specific hospital reform programs
To provide stakeholders, including the public and Government Offices, with information
about the availability and the quality of hospital care;
To identify and disseminate best practice; and
To identify areas for further improvements within hospitals where targeted support, by
the RHB, MSD or other partners is necessary.
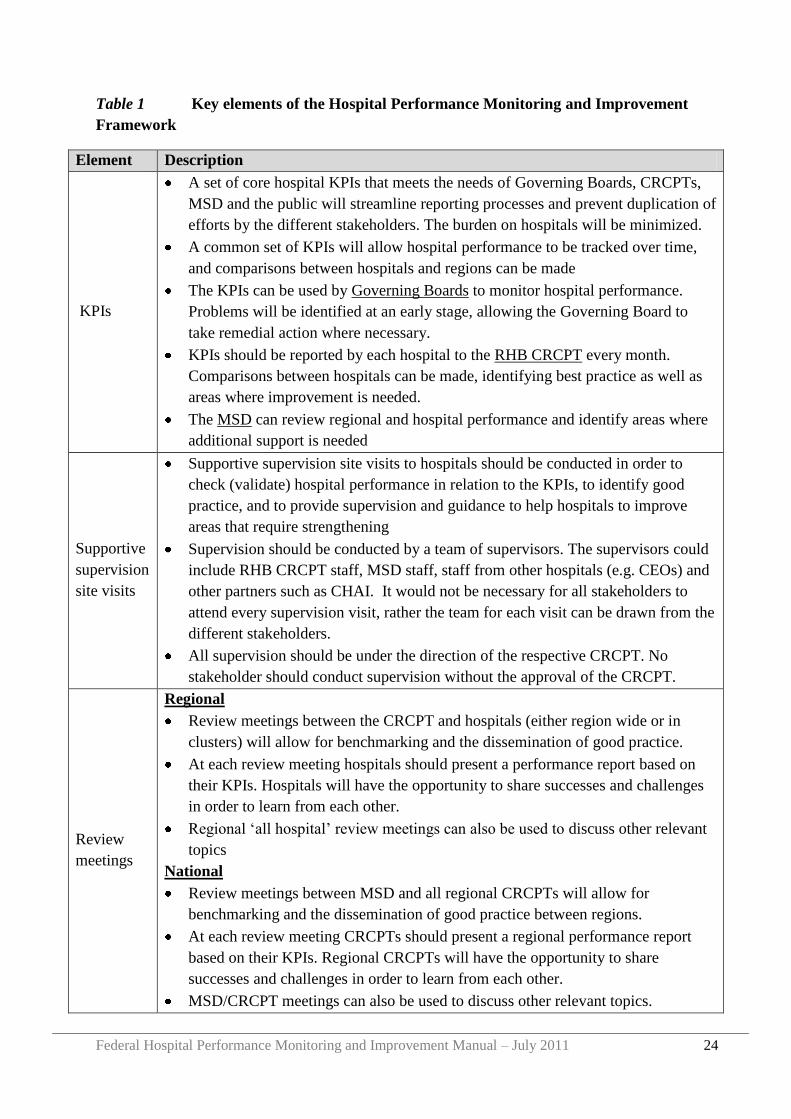
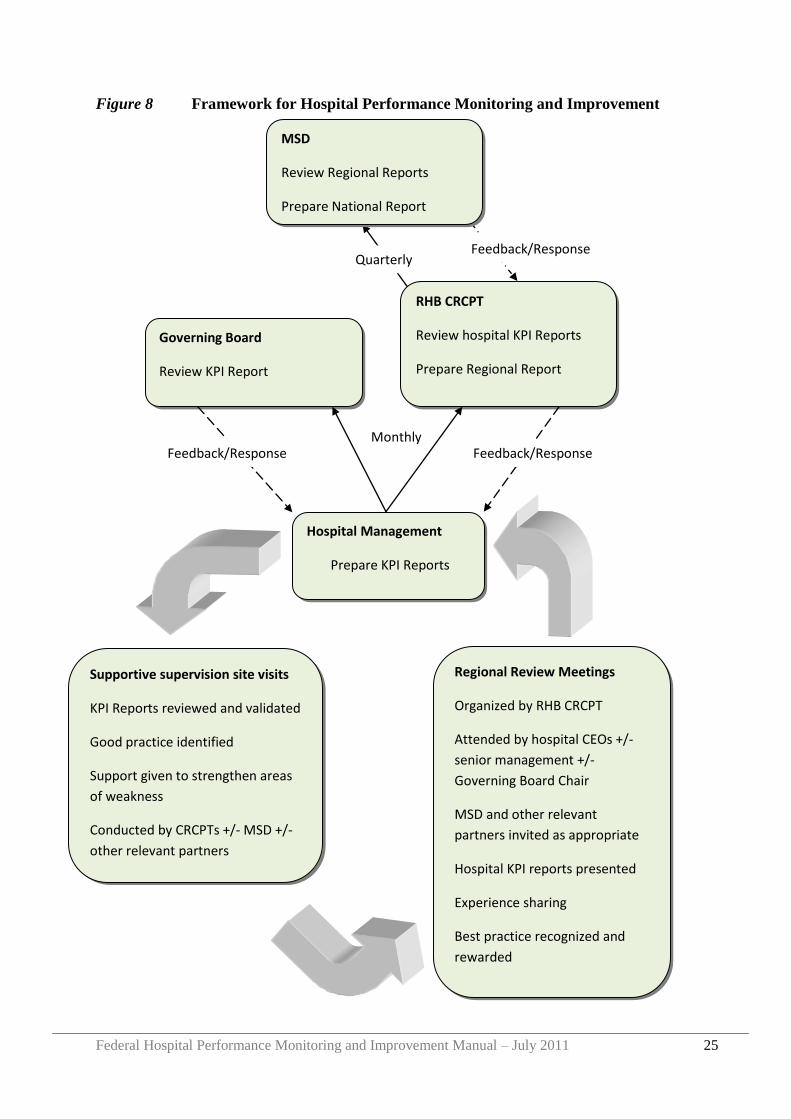
As illustrated in Table 1 and Figure 8 below, the Framework for Hospital Performance
Monitoring and Improvement has three main elements:
1) The establishment, reporting and review of a core set of hospital KPIs;
2) Supportive supervision site visits to hospitals, led by the respective RHB CRCPT and
including other bodies such as MSD or partners as relevant; and
3) Review meetings:
Regional (or cluster) review meetings between each RHB and all hospitals in the
respective Region; and
MSD and all Regional CRCPTs review meetings.
Federal Hospital Performance Monitoring and Improvement Manual – July 2011 24
Table 1 Key elements of the Hospital Performance Monitoring and Improvement
Framework
Element Description
KPIs
A set of core hospital KPIs that meets the needs of Governing Boards, CRCPTs,
MSD and the public will streamline reporting processes and prevent duplication of
efforts by the different stakeholders. The burden on hospitals will be minimized.
A common set of KPIs will allow hospital performance to be tracked over time,
and comparisons between hospitals and regions can be made
The KPIs can be used by Governing Boards to monitor hospital performance.
Problems will be identified at an early stage, allowing the Governing Board to
take remedial action where necessary.
KPIs should be reported by each hospital to the RHB CRCPT every month.
Comparisons between hospitals can be made, identifying best practice as well as
areas where improvement is needed.
The MSD can review regional and hospital performance and identify areas where
additional support is needed
Supportive
supervision
site visits
Supportive supervision site visits to hospitals should be conducted in order to
check (validate) hospital performance in relation to the KPIs, to identify good
practice, and to provide supervision and guidance to help hospitals to improve
areas that require strengthening
Supervision should be conducted by a team of supervisors. The supervisors could
include RHB CRCPT staff, MSD staff, staff from other hospitals (e.g. CEOs) and
other partners such as CHAI. It would not be necessary for all stakeholders to
attend every supervision visit, rather the team for each visit can be drawn from the
different stakeholders.
All supervision should be under the direction of the respective CRCPT. No
stakeholder should conduct supervision without the approval of the CRCPT.
Review
meetings
Regional
Review meetings between the CRCPT and hospitals (either region wide or in
clusters) will allow for benchmarking and the dissemination of good practice.
At each review meeting hospitals should present a performance report based on
their KPIs. Hospitals will have the opportunity to share successes and challenges
in order to learn from each other.
Regional „all hospital‟ review meetings can also be used to discuss other relevant
topics
National
Review meetings between MSD and all regional CRCPTs will allow for
benchmarking and the dissemination of good practice between regions.
At each review meeting CRCPTs should present a regional performance report
based on their KPIs. Regional CRCPTs will have the opportunity to share
successes and challenges in order to learn from each other.
MSD/CRCPT meetings can also be used to discuss other relevant topics.
Federal Hospital Performance Monitoring and Improvement Manual – July 2011 25
Figure 8 Framework for Hospital Performance Monitoring and Improvement
Monthly
Governing Board
Review KPI Report
Hospital Management
Prepare KPI Reports
RHB CRCPT
Review hospital KPI Reports
Prepare Regional Report
MSD
Review Regional Reports
Prepare National Report
Regional Review Meetings
Organized by RHB CRCPT
Attended by hospital CEOs +/-
senior management +/-
Governing Board Chair
MSD and other relevant
partners invited as appropriate
Hospital KPI reports presented
Experience sharing
Best practice recognized and
rewarded
Supportive supervision site visits
KPI Reports reviewed and validated
Good practice identified
Support given to strengthen areas
of weakness
Conducted by CRCPTs +/- MSD +/-
other relevant partners
Quarterly Feedback/Response
Feedback/Response Feedback/Response

Federal Hospital Performance Monitoring and Improvement Manual – July 2011 26
Federal Hospital Performance Monitoring and Improvement Manual – July 2011 27
Section 4 Hospital Key Performance Indicators (KPIs)
4.1 What are Key Performance Indicators?
An indicator is a way to measure a specific issue, or a way of saying "how much" or "how
many" or "to what extent”. Performance Indicators help to understand a system, compare it
and improve it.1
Different types of indicators are used for different purposes. For example indicators could be
used to monitor implementation of a specific program, to monitor the financial performance
of a hospital, to monitor the quality of care provided by each clinical team or to monitor
implementation of the hospital annual plan.
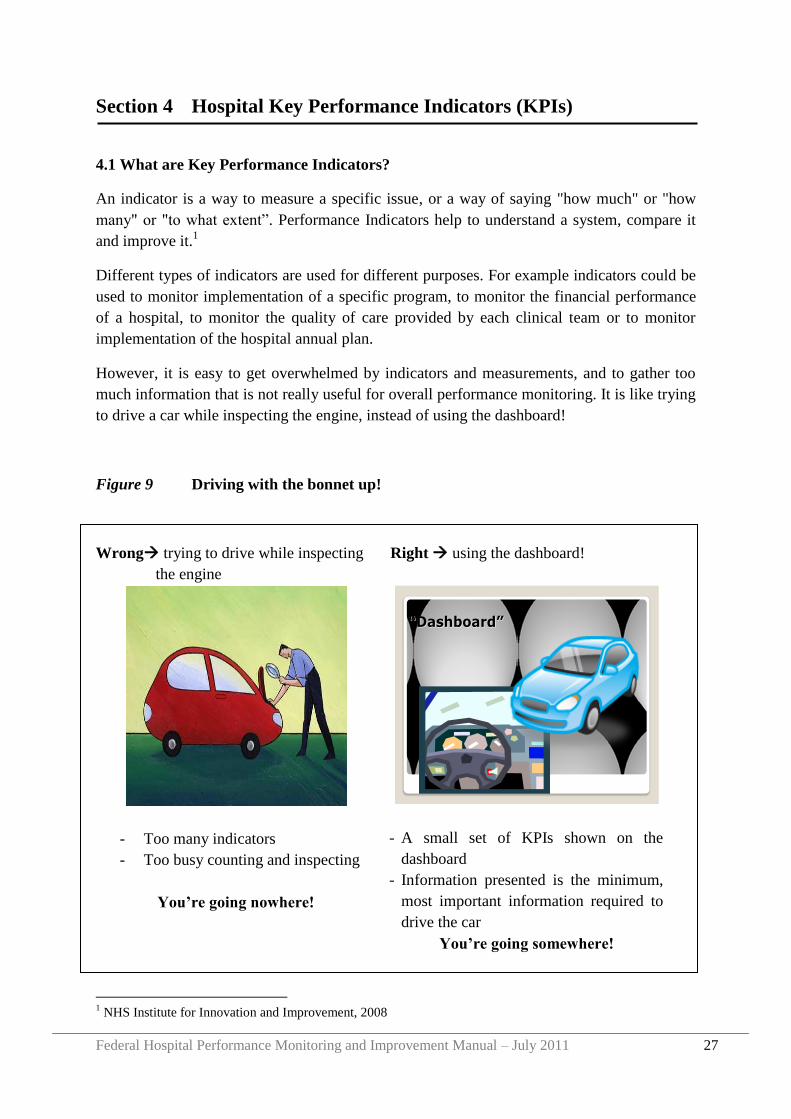
However, it is easy to get overwhelmed by indicators and measurements, and to gather too
much information that is not really useful for overall performance monitoring. It is like trying
to drive a car while inspecting the engine, instead of using the dashboard!
Figure 9 Driving with the bonnet up!
Wrong trying to drive while inspecting
the engine
- Too many indicators
- Too busy counting and inspecting
You‟re going nowhere!
Right using the dashboard!
“Dashboard”
- A small set of KPIs shown on the
dashboard
- Information presented is the minimum,
most important information required to
drive the car
You‟re going somewhere!
1 NHS Institute for Innovation and Improvement, 2008
Federal Hospital Performance Monitoring and Improvement Manual – July 2011 28
Instead of trying to monitor everything, hospital SMTs, Governing Boards and RHBs need a
core set of indicators that provide all the information they need to ensure that hospitals
provide effective, efficient and quality services. These KPIs should describe the minimum
information needed to effectively govern and manage hospital performance. The KPIs listed
below fulfill these requirements. They have been agreed by the RHBs and FMOH as the core
set of indictors that form the foundation of the Hospital Performance Monitoring and
Improvement Framework for Ethiopia.
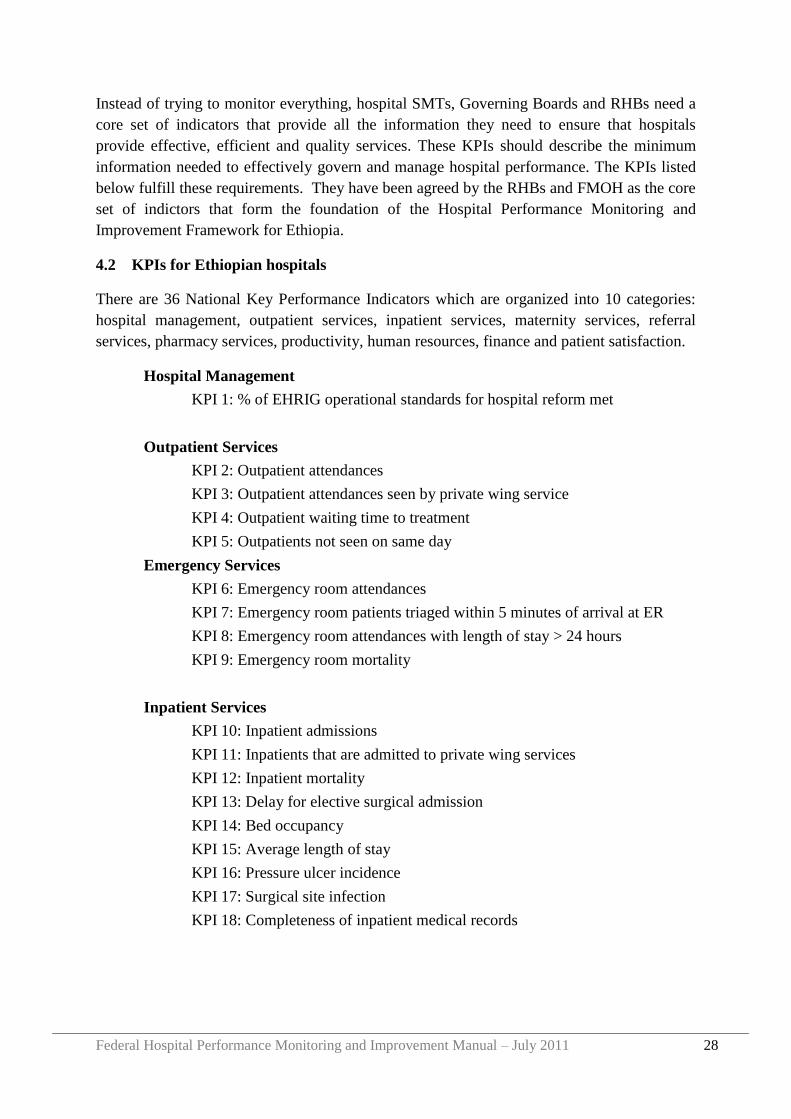
4.2 KPIs for Ethiopian hospitals
There are 36 National Key Performance Indicators which are organized into 10 categories:
hospital management, outpatient services, inpatient services, maternity services, referral
services, pharmacy services, productivity, human resources, finance and patient satisfaction.
Hospital Management
KPI 1: % of EHRIG operational standards for hospital reform met
Outpatient Services
KPI 2: Outpatient attendances
KPI 3: Outpatient attendances seen by private wing service
KPI 4: Outpatient waiting time to treatment
KPI 5: Outpatients not seen on same day
Emergency Services
KPI 6: Emergency room attendances
KPI 7: Emergency room patients triaged within 5 minutes of arrival at ER
KPI 8: Emergency room attendances with length of stay > 24 hours
KPI 9: Emergency room mortality
Inpatient Services
KPI 10: Inpatient admissions
KPI 11: Inpatients that are admitted to private wing services
KPI 12: Inpatient mortality
KPI 13: Delay for elective surgical admission
KPI 14: Bed occupancy
KPI 15: Average length of stay
KPI 16: Pressure ulcer incidence
KPI 17: Surgical site infection
KPI 18: Completeness of inpatient medical records
Federal Hospital Performance Monitoring and Improvement Manual – July 2011 29
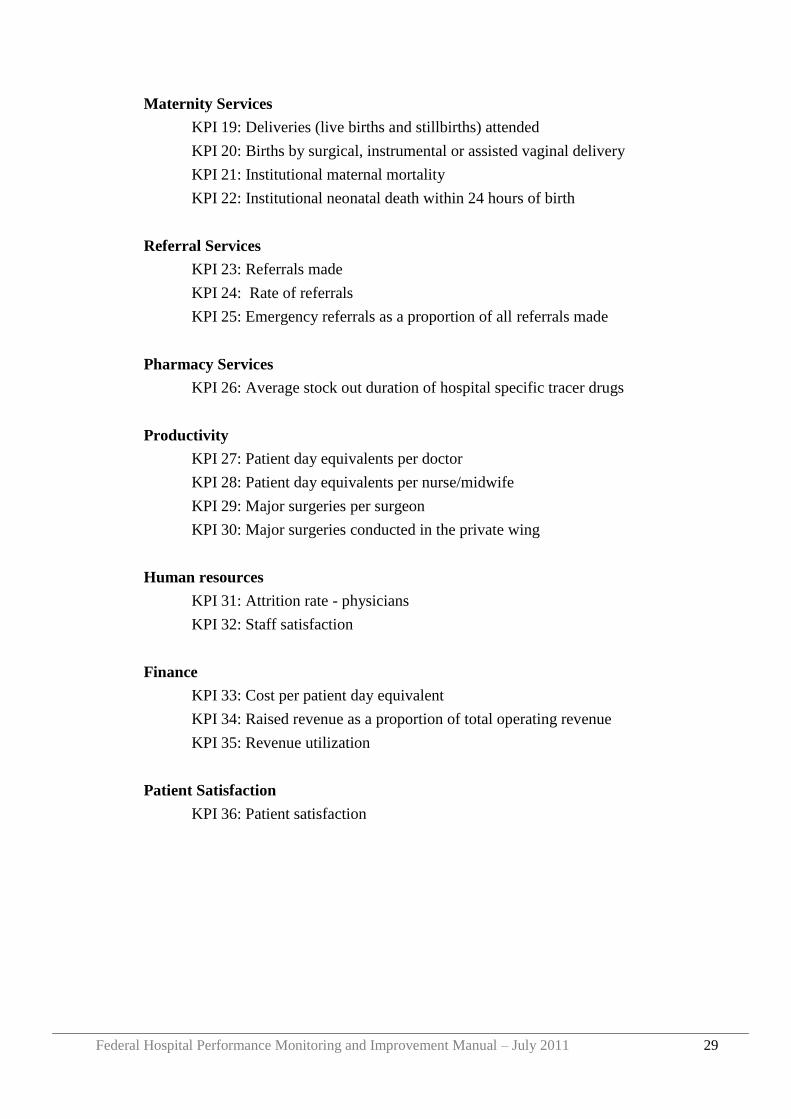
Maternity Services
KPI 19: Deliveries (live births and stillbirths) attended
KPI 20: Births by surgical, instrumental or assisted vaginal delivery
KPI 21: Institutional maternal mortality
KPI 22: Institutional neonatal death within 24 hours of birth
Referral Services
KPI 23: Referrals made
KPI 24: Rate of referrals
KPI 25: Emergency referrals as a proportion of all referrals made
Pharmacy Services
KPI 26: Average stock out duration of hospital specific tracer drugs
Productivity
KPI 27: Patient day equivalents per doctor
KPI 28: Patient day equivalents per nurse/midwife
KPI 29: Major surgeries per surgeon
KPI 30: Major surgeries conducted in the private wing
Human resources
KPI 31: Attrition rate - physicians
KPI 32: Staff satisfaction
Finance
KPI 33: Cost per patient day equivalent
KPI 34: Raised revenue as a proportion of total operating revenue
KPI 35: Revenue utilization
Patient Satisfaction
KPI 36: Patient satisfaction
Federal Hospital Performance Monitoring and Improvement Manual – July 2011 30
4.3 Relationship with HMIS
The Health Management Information System (HMIS) draws its data from routine service and
administrative records and is primarily designed to monitor and refine implementation
programmes of the Health Sector Development Plans2. Additionally, the indicators are based
on the priorities of the Plan for Accelerated and Sustained Development to End Poverty, the
needs and priorities of local authorities, and the requirements of international agreements,
such as the Millennium Development Goals.
On the other hand, the hospital KPIs, are a small set of 36 indicators with the primary
function of assisting hospital SMTs, Governing Boards, RHBs and FMOH to oversee hospital
operations. The hospital KPIs do not replace the HMIS indicators and existing HMIS
reporting, review and monitoring processes should continue.
4.4 Collecting hospital KPI data
Hospitals should develop suitable mechanisms for collecting KPI data. These mechanisms
should ensure that the information is accurate and that it has been properly checked prior to
submission. To achieve this, each KPI needs an assigned data owner and the organization
needs a named KPI focal person.
4.4.1 KPI Data Owners
The data owner should be an individual who is responsible for the primary data source (e.g.
register, record or database) from which the KPI is drawn and who has responsibility for the
service area that is being measured.
Each KPI data owner is responsible for:
Maintenance of the primary data source(s) for KPI information
Calculating the KPI, at the end of each reporting period
Submitting the KPI to the KPI focal person at the end of each reporting period
Reviewing the KPI, and identify any action that is needed as a result (i.e. performance
improvement plan)
For example the Head of Human Resources (HR) could the KPI data owner for KPI 31:
Attrition rate - Physicians and KPI 32: Staff satisfaction
2 FMOH (2008) HMIS/M&E Indicator Definitions: HMIS / M&E Technical Standards: Area 1.
Federal Hospital Performance Monitoring and Improvement Manual – July 2011 31
4.4.2 KPI focal person
A single focal person should be assigned to collect all KPIs and the data elements from the
data owners and to prepare the hospital KPI report. The KPI focal person should be a member
of the hospital quality committee (see 4.6.1 below). If the hospital has a separate HMIS
performance monitoring team the KPI focal person should be one of the HMIS team
members. A deputy KPI focal person should also be assigned to act in the absence of the KPI
focal person.
The KPI focal person is responsible for:
Collecting KPI data from every KPI data owner at the end of the reporting period
Checking the accuracy of the KPI data, by reviewing data sources and conducting
spot checks for accuracy on the data sources and the KPIs submitted by data owners
Entering the KPI data into the electronic Hospital KPI Database
Preparing the KPI report (including data elements and KPI results) from the KPI
Database
Submitting the KPI report to the hospital Quality Committee and CEO
Training the KPI data owners, ensuring that each understands the meaning of the KPI,
how to maintain the primary data source and calculate the KPI.
Ensuring the availability of all required computer hardware and software, stationery
and forms for the collation and submission of KPIs.
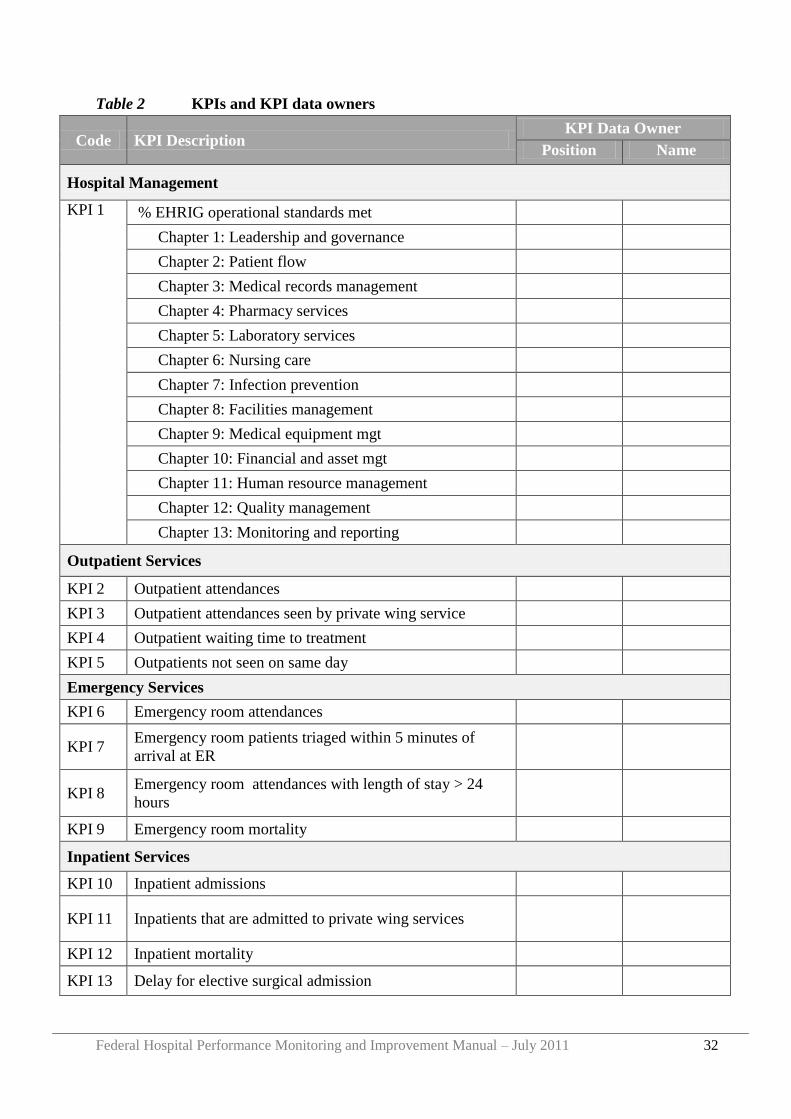
Table 2 on the following page, can be used to list the people assigned to each KPI. If a staff
member changes, the Table should be updated with the name of the new person assigned as
the data owner. The list should be established and updated by the KPI focal person with any
changes approved by the CEO.
Federal Hospital Performance Monitoring and Improvement Manual – July 2011 32
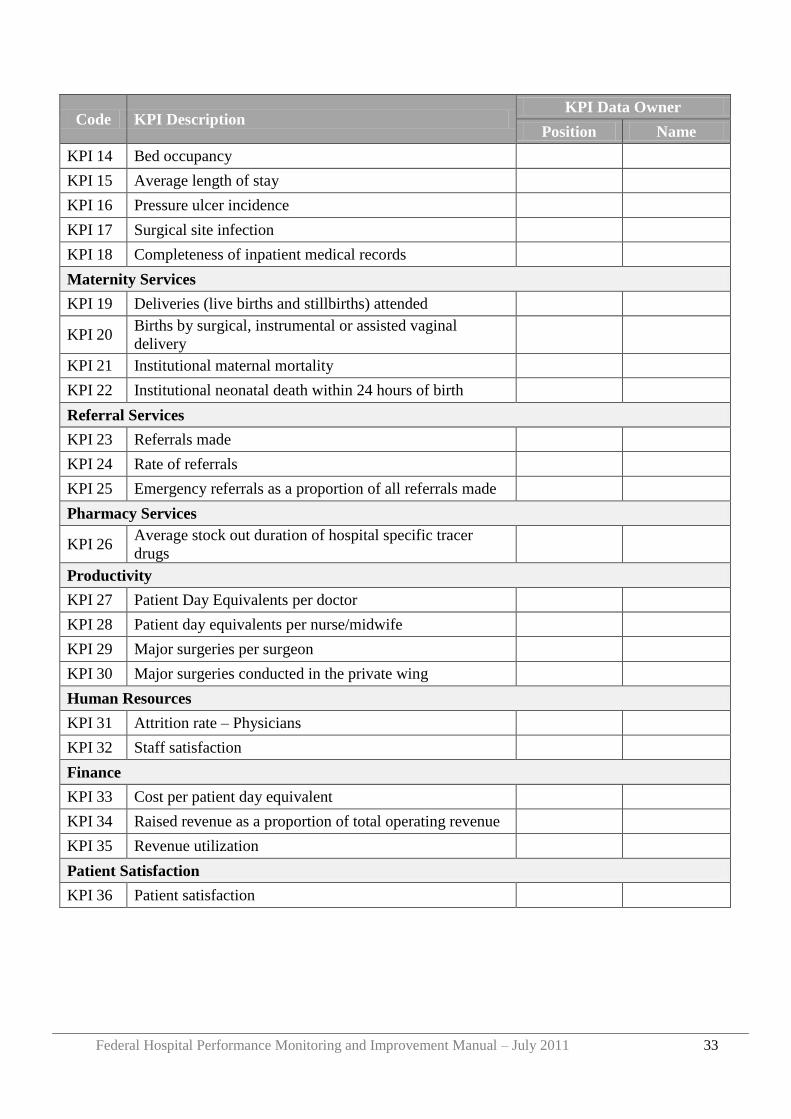
Table 2 KPIs and KPI data owners
Code KPI Description KPI Data Owner
Position Name
Hospital Management
KPI 1 % EHRIG operational standards met
Chapter 1: Leadership and governance
Chapter 2: Patient flow
Chapter 3: Medical records management
Chapter 4: Pharmacy services
Chapter 5: Laboratory services
Chapter 6: Nursing care
Chapter 7: Infection prevention
Chapter 8: Facilities management
Chapter 9: Medical equipment mgt
Chapter 10: Financial and asset mgt
Chapter 11: Human resource management
Chapter 12: Quality management
Chapter 13: Monitoring and reporting
Outpatient Services
KPI 2 Outpatient attendances
KPI 3 Outpatient attendances seen by private wing service
KPI 4 Outpatient waiting time to treatment
KPI 5 Outpatients not seen on same day
Emergency Services
KPI 6 Emergency room attendances
KPI 7 Emergency room patients triaged within 5 minutes of
arrival at ER
KPI 8 Emergency room attendances with length of stay > 24
hours
KPI 9 Emergency room mortality
Inpatient Services
KPI 10 Inpatient admissions
KPI 11 Inpatients that are admitted to private wing services
KPI 12 Inpatient mortality
KPI 13 Delay for elective surgical admission
Federal Hospital Performance Monitoring and Improvement Manual – July 2011 33
Code KPI Description KPI Data Owner
Position Name
KPI 14 Bed occupancy
KPI 15 Average length of stay
KPI 16 Pressure ulcer incidence
KPI 17 Surgical site infection
KPI 18 Completeness of inpatient medical records
Maternity Services
KPI 19 Deliveries (live births and stillbirths) attended
KPI 20 Births by surgical, instrumental or assisted vaginal
delivery
KPI 21 Institutional maternal mortality
KPI 22 Institutional neonatal death within 24 hours of birth
Referral Services
KPI 23 Referrals made
KPI 24 Rate of referrals
KPI 25 Emergency referrals as a proportion of all referrals made
Pharmacy Services
KPI 26 Average stock out duration of hospital specific tracer
drugs
Productivity
KPI 27 Patient Day Equivalents per doctor
KPI 28 Patient day equivalents per nurse/midwife
KPI 29 Major surgeries per surgeon
KPI 30 Major surgeries conducted in the private wing
Human Resources
KPI 31 Attrition rate – Physicians
KPI 32 Staff satisfaction
Finance
KPI 33 Cost per patient day equivalent
KPI 34 Raised revenue as a proportion of total operating revenue
KPI 35 Revenue utilization
Patient Satisfaction
KPI 36 Patient satisfaction
Federal Hospital Performance Monitoring and Improvement Manual – July 2011 34
4.5 Analyzing and reporting hospital KPI data
4.5.1 Analysis and reporting at hospital level
An electronic Hospital KPI Database has been created (in Excel) into which the KPI focal
person should enter all KPI data elements. The KPI Database will automatically generate KPI
results and related tables and charts. KPI reports can be printed from this Database.
A „User Guide to the Hospital KPI Database‟ is presented in Appendix 1.
After entering and checking the data, the KPI focal person should print the KPI report and
submit this to their quality committee and the CEO. The hospital CEO should check and sign
off the KPIs before submitting them to the Governing Board Chair.
Additionally, KPI data should be submitted to the RHB. Ideally, the KPI focal person should
email the electronic KPI Database to the RHB ever month. If this is not possible, the KPI
focal person should print a copy of the data elements and a copy of the KPI results directly
from the KPI Database and should fax these to the RHB.
KPI reports should be submitted to the RHB by the 10th
of each month.
Hospitals should also keep track of progress towards attainment of EHRIG standards. To
assist with this, a Hospital EHRIG Database has been created into which the KPI focal person
should enter all EHRIG self assessment results (see Section 5 below and Appendix 6). The
EHRIG Database will automatically generate tables and charts from the entered data.
A „User Guide to the Hospital EHRIG Database‟ is presented in Appendix 2.
The KPI focal person should email an electronic copy of the EHRIG Database to the RHB
every quarter. If this is not possible then a hard copy of the EHRIG self assessment tool (see
Appendix 6) should be faxed to the RHB.
4.5.2 Analysis and reporting at regional level
Each RHB should assign a focal person to receive KPI and EHRIG databases/ reports from
all hospitals, and should share the name, contact telephone number and email address of the
focal person with each hospital.
An electronic Regional KPI Database has been created (in Excel) into which the RHB should
enter all KPI data elements reported by each hospital. The KPI Database will automatically
generate KPI results and related tables and charts, including regional averages. KPI reports
can be printed from this Database.
A „User Guide to the Regional KPI Database‟ is presented in Appendix 3.
Additionally, a Regional EHRIG Database has been created (in Excel) into which the RHB
should enter all hospital EHRIG reports. The EHRIG Database will automatically generate
tables and charts, including regional averages, from the entered data.
Federal Hospital Performance Monitoring and Improvement Manual – July 2011 35
A „User Guide to the Regional EHRIG Database‟ is presented in Appendix 4.
Every quarter, the RHB should email electronic copies of the Regional KPI Database and
Regional EHRIG Database to MSD. If it is not possible to send electronically then hard
copies of the KPI Data Elements and KPI Data Results, together with a hard copy of the
average attainment within the Region of each EHRIG should be faxed to MSD.
4.6 How should KPI reports be used?
Hospital KPI data should be used as information for action to guide decision making and
planning for performance improvement at all levels. The performance improvement tools
presented in Section 2 can be used, alongside KPI results, to determine actions to be taken to
improve performance. Particular considerations for hospital management and staff,
Governing Boards, RHBs and the FMOH are outlined below.
4.6.1 Use of KPIs by hospital management and staff
The data owner of each KPI is responsible not just for reporting the KPI data, but also for
reflecting on the information and collaborating with colleagues to improve performance.
Useful questions to consider when reviewing KPI data include:
- How does this KPI result compare to the last reporting period? Is there improvement?
No change? Is performance worse than before? How and why has the change in
performance happened?
- How does the KPI compare to the target for the reporting period? Has the target been
reached? If the target has not been reached, why not?
- Is there a need for further improvement on this KPI?
- Is additional information required?
- Is further support (e.g. trainings, supervision) required from the RHB or other partners
to support the hospital to make improvements?
The KPI data owner, together with case team and other relevant colleagues should analyze
the performance and develop actions that need to be taken to improve performance, using the
tools outlined in Section 2.
Each hospital should have a performance management or quality committee (QC) to oversee
performance monitoring and improvement functions across the hospital. The name of such a
committee may differ from hospital to hospital but the important issue is not the name of
team per se, but rather to ensure that the functions/responsibilities described below are carried
out by designated individuals.
The QC should be comprised of a chairperson and between 4-6 quality officers. The QC
should be multidisciplinary, with members appointed from different clinical, administrative
and support case teams within the hospital. The chair of the QC should be a member of the
hospital senior management team. Where circumstances permit, and depending on the size of
the hospital, the chair and quality officers should be full time in their role. Where this is not
Federal Hospital Performance Monitoring and Improvement Manual – July 2011 36
possible, the members of the QC should have specified time allocated within their regular
working week for quality assurance activities.
Roles of the QC include:
a) To develop hospital performance and/ quality management strategy and present to the
Senior Management Team for approval,
b) To develop an implementation plan for the overall improvement of hospital performance
and monitor its execution,
c) To ensure that performance management activities relate to the vision and mission of the
hospital, and are aligned with the hospital strategic and annual plans,
d) To co-ordinate all hospital performance improvement activities,
e) To promote and support the participation of all staff in hospital performance
improvement activities,
f) To receive and analyze feedback information from patients, staff and visitors,
g) To receive clinical audit reports and maintain a record of all clinical audit activities,
h) To review selected hospital deaths
i) To monitor KPI data
j) To monitor HMIS performance
k) To conduct peer review in response to specific quality and safety concerns and to take
appropriate action and follow-up when deficiencies are identified, and
l) To update hospital staff on hospital performance improvement activities and findings
including:
a) Comparisons across time
b) Comparisons between case teams/departments
c) Comparisons with other health facilities.
The KPI focal person should be a member of the quality committee. The KPI focal person
should present all KPI reports to the quality committee for review. Further guidance on the
role of the quality committee, and hospital quality management can be found in Chapter 12,
Quality Management, of the Ethiopian hospital Reform Implementation Guidelines.
4.6.2 Use of KPIs by a hospital Governing Board
Hospital KPI Reports should be presented to the Governing Board by the hospital CEO. The
KPI report should be circulated at least one week in advance of the Governing Board
meeting, together with the agenda and any other discussion papers for the board meeting.
At the board meeting the CEO should present the KPI report, identifying areas of
improvement or weakness. The Governing Board should question the CEO on the data
Federal Hospital Performance Monitoring and Improvement Manual – July 2011 37
presented, seeking additional information if necessary. The Governing Board may also
instruct the CEO on specific follow up actions.
For example, if the Patient Satisfaction Score is low or is decreasing, the Governing Board
could ask the CEO to present the full results of the Patient Satisfaction Survey to see if there
are any particular areas of concern, and could ask the CEO to describe actions that the
hospital is going to take to improve patient satisfaction. Or, if inpatient mortality is high or
increasing, the Governing Board could ask the CEO if there are any factors to explain this
(perhaps a communicable disease outbreak) or to provide additional information on the
mortality rate for each ward or specialty (e.g. surgical mortality rate, paediatric mortality rate
etc) to identify if there is a particular problem area.
When reviewing the hospital KPI data and discussing with the CEO, questions that
Governing Board members should consider include:
- How does each KPI compare to the last reporting period? Is there improvement? No
change? Is performance worse than before?
o If there is improvement, how did this take place? Should special recognition
be given to any staff members or case teams who are responsible for the
improvement?
o If performance is worse why has this taken place?
o How does each KPI compare to the target for the reporting period? Has the
target been reached? If not, why not?
- Is additional information required from the CEO?
- What action should be taken by the CEO/hospital in response to the KPI results?
- What support (e.g. trainings, supervision) is required from the RHB or other partners
to support the hospital to make improvements?
4.6.3 Use of KPIs by Regional Health Bureaus
After receiving hospital KPI and EHRIG reports and entering these into the Regional KPI and
EHRIG Databases, the RHBs should compare hospitals, monitor changes over time and
calculate regional averages.
When reviewing individual hospital KPI reports, the RHB should consider the same
questions as outlined above for Governing Boards. In addition, the RHB should compare
performance between hospitals, in particular:
- Which hospitals are showing the best performance overall? Which are showing poor
performance?
- Which hospitals are improving? Which hospitals show slow or no improvement?
- What are the particular strengths in the region as a whole, what are the weaknesses?
The RHB should give feedback to each hospital on the KPI reports, asking for clarification or
further information where required.
Federal Hospital Performance Monitoring and Improvement Manual – July 2011 38
The RHB should also use the hospital KPI reports to identify areas for action by the RHB. In
particular, KPI reports should be used as input for hospital site visits and regional review
meetings (see Sections 5 and 6).
4.6.4 Use of KPIs by FMOH
The FMOH should assign a focal person to receive KPI reports from all RHBs, and should
share the name, contact telephone number and email address of the focal person with each
RHB. FMOH should review all regional KPI reports to compare regions, to monitor changes
over time and to calculate national averages. The electronic National KPI Database can be
used for this purpose.
When reviewing regional KPI reports, FMOH should consider the same questions as RHBs.
In addition, FMOH should compare performance between regions, in particular:
- Which regions are showing the best performance overall? Which are showing poor
performance?
- Which regions are improving? Which regions show slow or no improvement?
- What are the common strengths in all regions, what are the common weaknesses?
FMOH should give feedback to each RHB on the KPI reports, asking for clarification or
further information where required. FMOH should not contact hospitals directly in response
to the KPI reports, but instead should discuss first with the RHB so that a joint response can
be made to the hospital and any follow up action can be agreed jointly between FMOH and
the RHB.
In particular, KPI reports should be used as input for hospital site visits and regional and
national review meetings (see Sections 6 and 7).
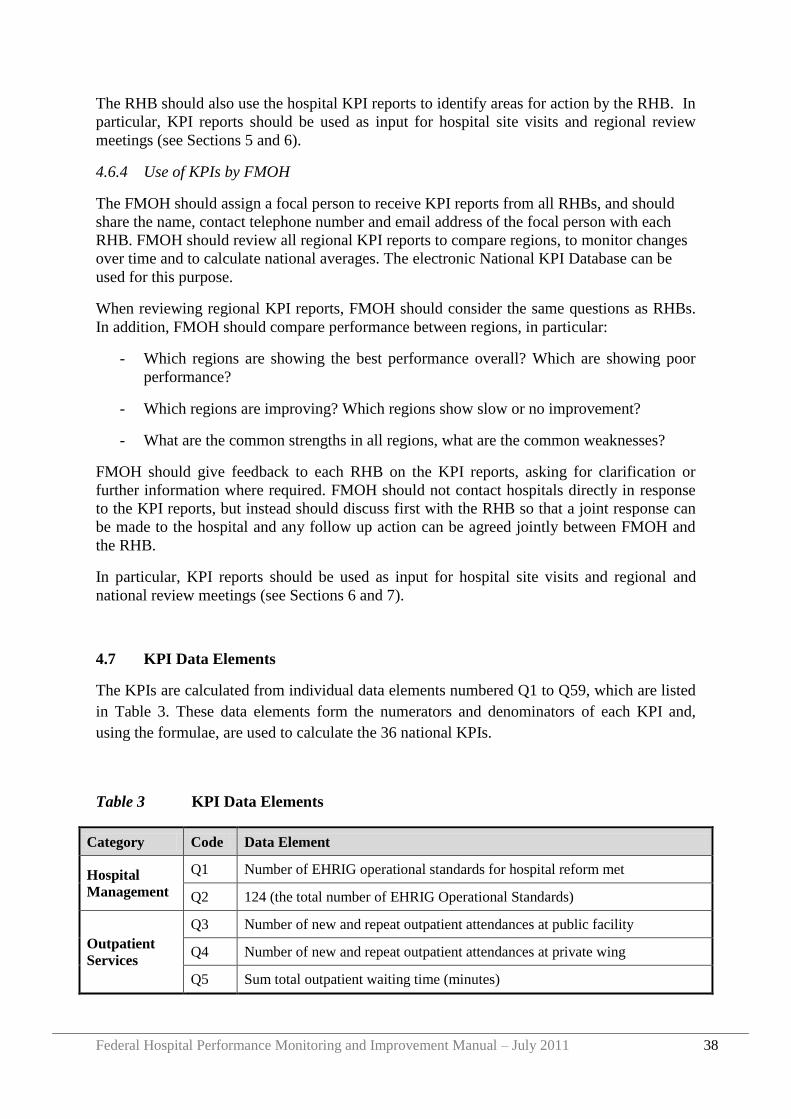
4.7 KPI Data Elements
The KPIs are calculated from individual data elements numbered Q1 to Q59, which are listed
in Table 3. These data elements form the numerators and denominators of each KPI and,
using the formulae, are used to calculate the 36 national KPIs.
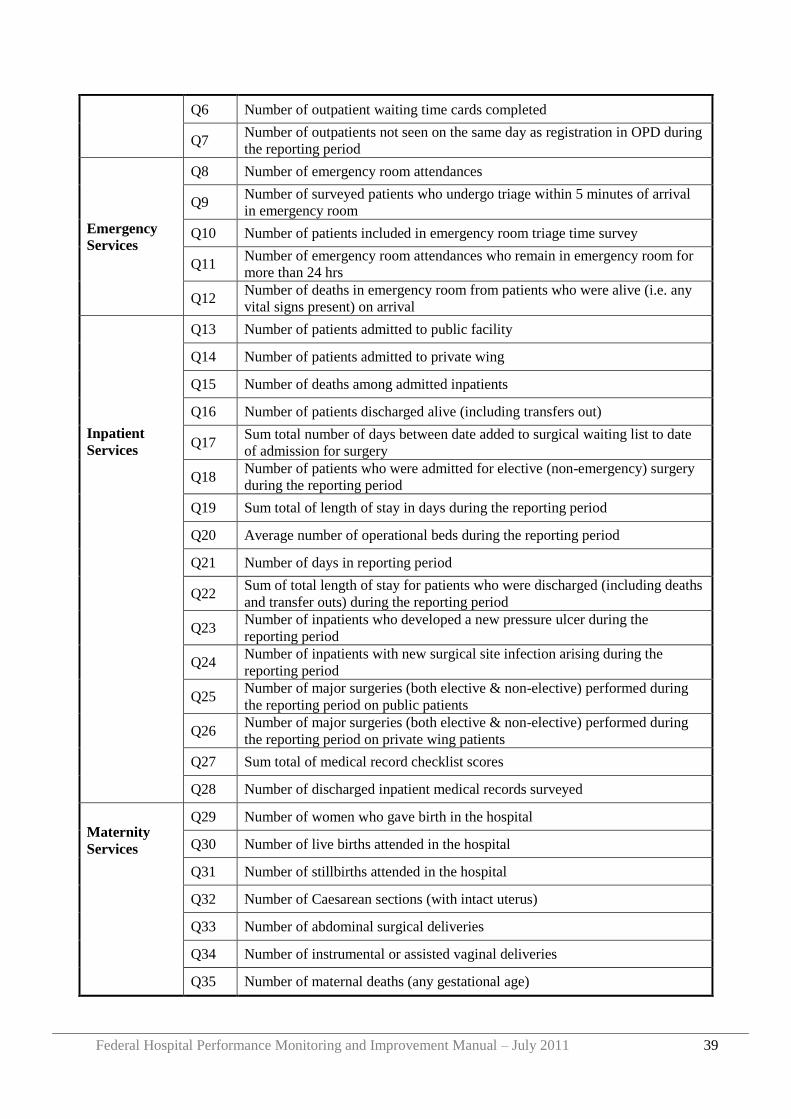
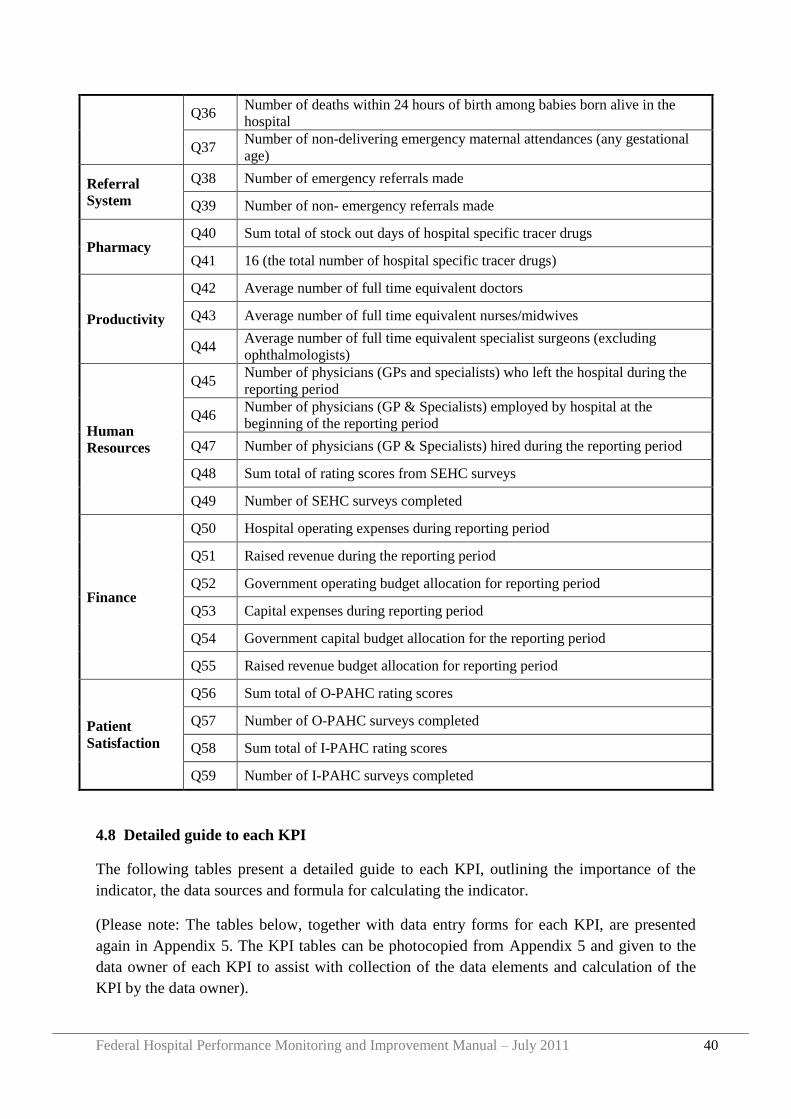
Table 3 KPI Data Elements
Category Code Data Element
Hospital
Management
Q1 Number of EHRIG operational standards for hospital reform met
Q2 124 (the total number of EHRIG Operational Standards)
Outpatient
Services
Q3 Number of new and repeat outpatient attendances at public facility
Q4 Number of new and repeat outpatient attendances at private wing
Q5 Sum total outpatient waiting time (minutes)
Federal Hospital Performance Monitoring and Improvement Manual – July 2011 39
Q6 Number of outpatient waiting time cards completed
Q7 Number of outpatients not seen on the same day as registration in OPD during
the reporting period
Emergency
Services
Q8 Number of emergency room attendances
Q9 Number of surveyed patients who undergo triage within 5 minutes of arrival
in emergency room
Q10 Number of patients included in emergency room triage time survey
Q11 Number of emergency room attendances who remain in emergency room for
more than 24 hrs
Q12 Number of deaths in emergency room from patients who were alive (i.e. any
vital signs present) on arrival
Inpatient
Services
Q13 Number of patients admitted to public facility
Q14 Number of patients admitted to private wing
Q15 Number of deaths among admitted inpatients
Q16 Number of patients discharged alive (including transfers out)
Q17 Sum total number of days between date added to surgical waiting list to date
of admission for surgery
Q18 Number of patients who were admitted for elective (non-emergency) surgery
during the reporting period
Q19 Sum total of length of stay in days during the reporting period
Q20 Average number of operational beds during the reporting period
Q21 Number of days in reporting period
Q22 Sum of total length of stay for patients who were discharged (including deaths
and transfer outs) during the reporting period
Q23 Number of inpatients who developed a new pressure ulcer during the
reporting period
Q24 Number of inpatients with new surgical site infection arising during the
reporting period
Q25 Number of major surgeries (both elective & non-elective) performed during
the reporting period on public patients
Q26 Number of major surgeries (both elective & non-elective) performed during
the reporting period on private wing patients
Q27 Sum total of medical record checklist scores
Q28 Number of discharged inpatient medical records surveyed
Maternity
Services
Q29 Number of women who gave birth in the hospital
Q30 Number of live births attended in the hospital
Q31 Number of stillbirths attended in the hospital
Q32 Number of Caesarean sections (with intact uterus)
Q33 Number of abdominal surgical deliveries
Q34 Number of instrumental or assisted vaginal deliveries
Q35 Number of maternal deaths (any gestational age)
Federal Hospital Performance Monitoring and Improvement Manual – July 2011 40
Q36 Number of deaths within 24 hours of birth among babies born alive in the
hospital
Q37 Number of non-delivering emergency maternal attendances (any gestational
age)
Referral
System
Q38 Number of emergency referrals made
Q39 Number of non- emergency referrals made
Pharmacy Q40 Sum total of stock out days of hospital specific tracer drugs
Q41 16 (the total number of hospital specific tracer drugs)
Productivity
Q42 Average number of full time equivalent doctors
Q43 Average number of full time equivalent nurses/midwives
Q44 Average number of full time equivalent specialist surgeons (excluding
ophthalmologists)
Human
Resources
Q45 Number of physicians (GPs and specialists) who left the hospital during the
reporting period
Q46 Number of physicians (GP & Specialists) employed by hospital at the
beginning of the reporting period
Q47 Number of physicians (GP & Specialists) hired during the reporting period
Q48 Sum total of rating scores from SEHC surveys
Q49 Number of SEHC surveys completed
Finance
Q50 Hospital operating expenses during reporting period
Q51 Raised revenue during the reporting period
Q52 Government operating budget allocation for reporting period
Q53 Capital expenses during reporting period
Q54 Government capital budget allocation for the reporting period
Q55 Raised revenue budget allocation for reporting period
Patient
Satisfaction
Q56 Sum total of O-PAHC rating scores
Q57 Number of O-PAHC surveys completed
Q58 Sum total of I-PAHC rating scores
Q59 Number of I-PAHC surveys completed
4.8 Detailed guide to each KPI
The following tables present a detailed guide to each KPI, outlining the importance of the
indicator, the data sources and formula for calculating the indicator.
(Please note: The tables below, together with data entry forms for each KPI, are presented
again in Appendix 5. The KPI tables can be photocopied from Appendix 5 and given to the
data owner of each KPI to assist with collection of the data elements and calculation of the
KPI by the data owner).
Federal Hospital Performance Monitoring and Improvement Manual – July 2011 41
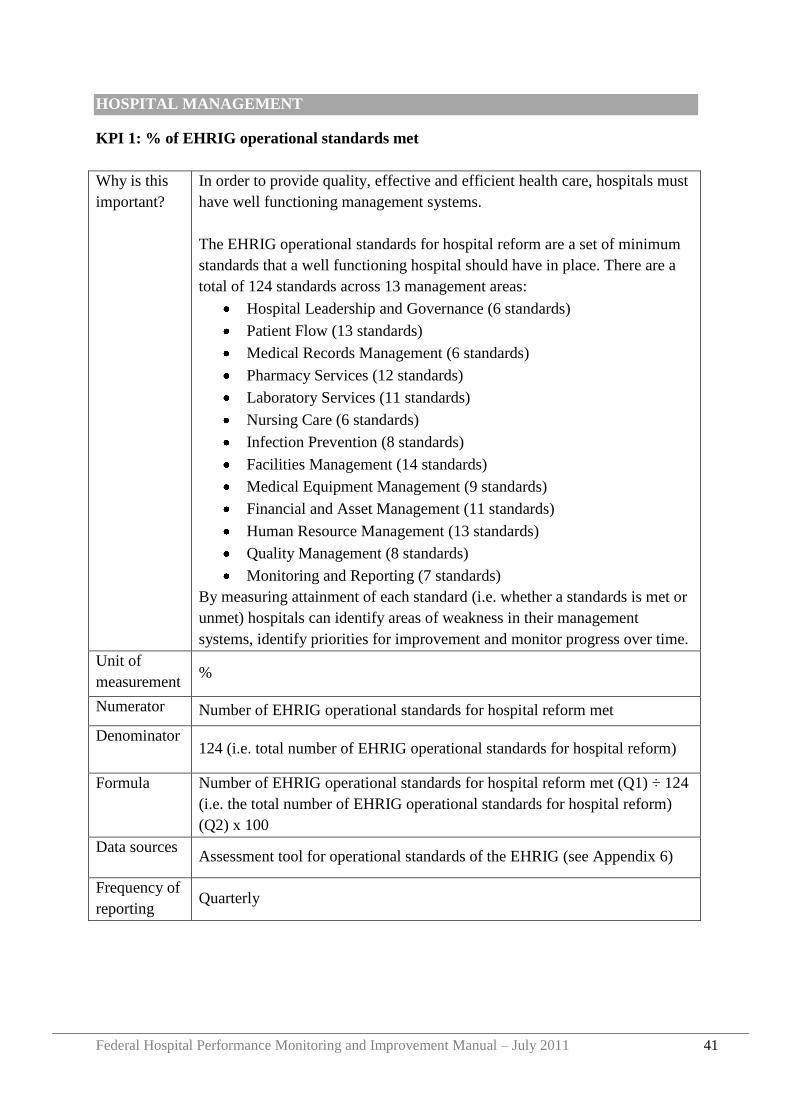
HOSPITAL MANAGEMENT
KPI 1: % of EHRIG operational standards met
Why is this
important?
In order to provide quality, effective and efficient health care, hospitals must
have well functioning management systems.
The EHRIG operational standards for hospital reform are a set of minimum
standards that a well functioning hospital should have in place. There are a
total of 124 standards across 13 management areas:
Hospital Leadership and Governance (6 standards)
Patient Flow (13 standards)
Medical Records Management (6 standards)
Pharmacy Services (12 standards)
Laboratory Services (11 standards)
Nursing Care (6 standards)
Infection Prevention (8 standards)
Facilities Management (14 standards)
Medical Equipment Management (9 standards)
Financial and Asset Management (11 standards)
Human Resource Management (13 standards)
Quality Management (8 standards)
Monitoring and Reporting (7 standards)
By measuring attainment of each standard (i.e. whether a standards is met or
unmet) hospitals can identify areas of weakness in their management
systems, identify priorities for improvement and monitor progress over time.
Unit of
measurement %
Numerator Number of EHRIG operational standards for hospital reform met
Denominator 124 (i.e. total number of EHRIG operational standards for hospital reform)
Formula Number of EHRIG operational standards for hospital reform met (Q1) ÷ 124
(i.e. the total number of EHRIG operational standards for hospital reform)
(Q2) x 100
Data sources Assessment tool for operational standards of the EHRIG (see Appendix 6)
Frequency of
reporting Quarterly
Federal Hospital Performance Monitoring and Improvement Manual – July 2011 42
OUTPATIENT SERVICES
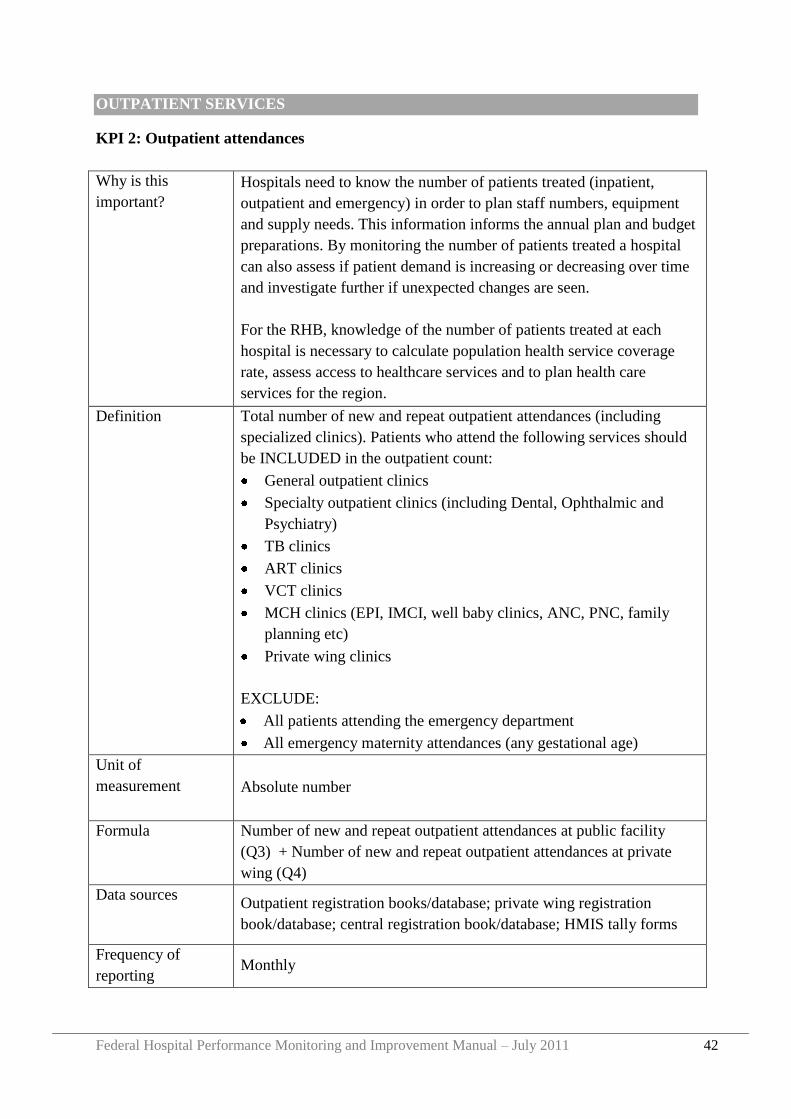
KPI 2: Outpatient attendances
Why is this
important?
Hospitals need to know the number of patients treated (inpatient,
outpatient and emergency) in order to plan staff numbers, equipment
and supply needs. This information informs the annual plan and budget
preparations. By monitoring the number of patients treated a hospital
can also assess if patient demand is increasing or decreasing over time
and investigate further if unexpected changes are seen.
For the RHB, knowledge of the number of patients treated at each
hospital is necessary to calculate population health service coverage
rate, assess access to healthcare services and to plan health care
services for the region.
Definition Total number of new and repeat outpatient attendances (including
specialized clinics). Patients who attend the following services should
be INCLUDED in the outpatient count:
General outpatient clinics
Specialty outpatient clinics (including Dental, Ophthalmic and
Psychiatry)
TB clinics
ART clinics
VCT clinics
MCH clinics (EPI, IMCI, well baby clinics, ANC, PNC, family
planning etc)
Private wing clinics
EXCLUDE:
All patients attending the emergency department
All emergency maternity attendances (any gestational age)
Unit of
measurement Absolute number
Formula Number of new and repeat outpatient attendances at public facility
(Q3) + Number of new and repeat outpatient attendances at private
wing (Q4)
Data sources Outpatient registration books/database; private wing registration
book/database; central registration book/database; HMIS tally forms
Frequency of
reporting Monthly
Federal Hospital Performance Monitoring and Improvement Manual – July 2011 43
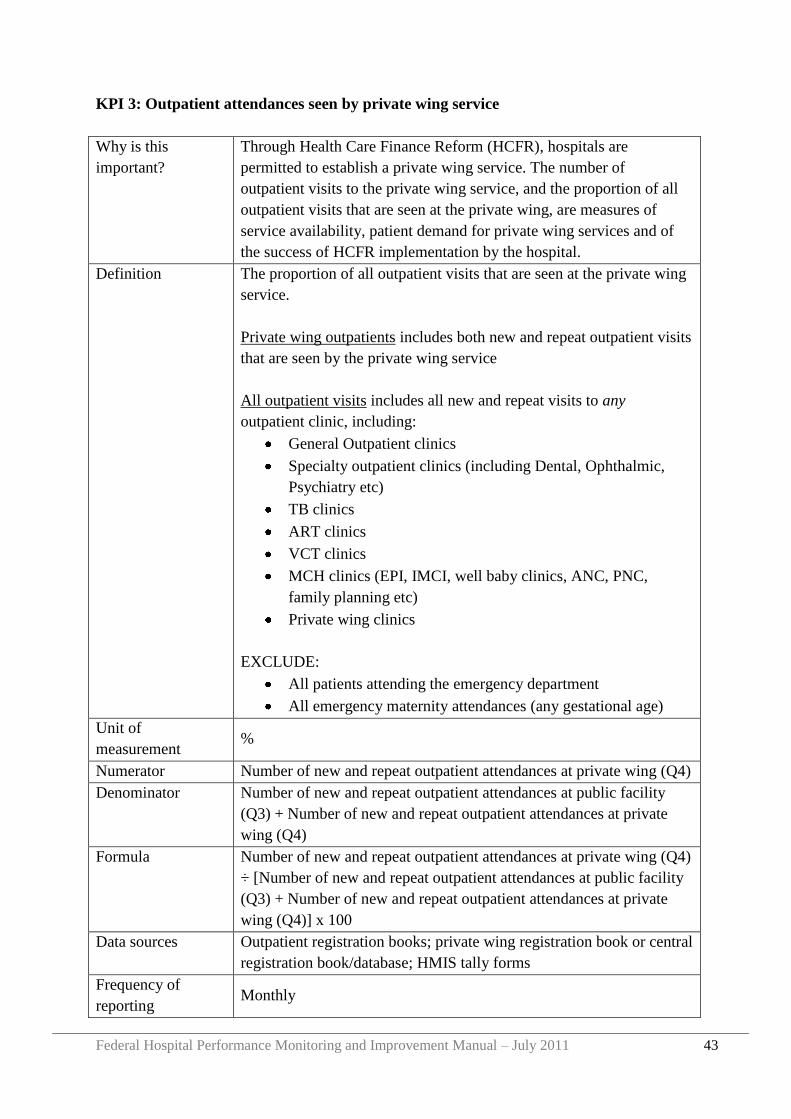
KPI 3: Outpatient attendances seen by private wing service
Why is this
important?
Through Health Care Finance Reform (HCFR), hospitals are
permitted to establish a private wing service. The number of
outpatient visits to the private wing service, and the proportion of all
outpatient visits that are seen at the private wing, are measures of
service availability, patient demand for private wing services and of
the success of HCFR implementation by the hospital.
Definition The proportion of all outpatient visits that are seen at the private wing
service.
Private wing outpatients includes both new and repeat outpatient visits
that are seen by the private wing service
All outpatient visits includes all new and repeat visits to any
outpatient clinic, including:
General Outpatient clinics
Specialty outpatient clinics (including Dental, Ophthalmic,
Psychiatry etc)
TB clinics
ART clinics
VCT clinics
MCH clinics (EPI, IMCI, well baby clinics, ANC, PNC,
family planning etc)
Private wing clinics
EXCLUDE:
All patients attending the emergency department
All emergency maternity attendances (any gestational age)
Unit of
measurement %
Numerator Number of new and repeat outpatient attendances at private wing (Q4)
Denominator Number of new and repeat outpatient attendances at public facility
(Q3) + Number of new and repeat outpatient attendances at private
wing (Q4)
Formula Number of new and repeat outpatient attendances at private wing (Q4)
÷ [Number of new and repeat outpatient attendances at public facility
(Q3) + Number of new and repeat outpatient attendances at private
wing (Q4)] x 100
Data sources Outpatient registration books; private wing registration book or central
registration book/database; HMIS tally forms
Frequency of
reporting Monthly
Federal Hospital Performance Monitoring and Improvement Manual – July 2011 44
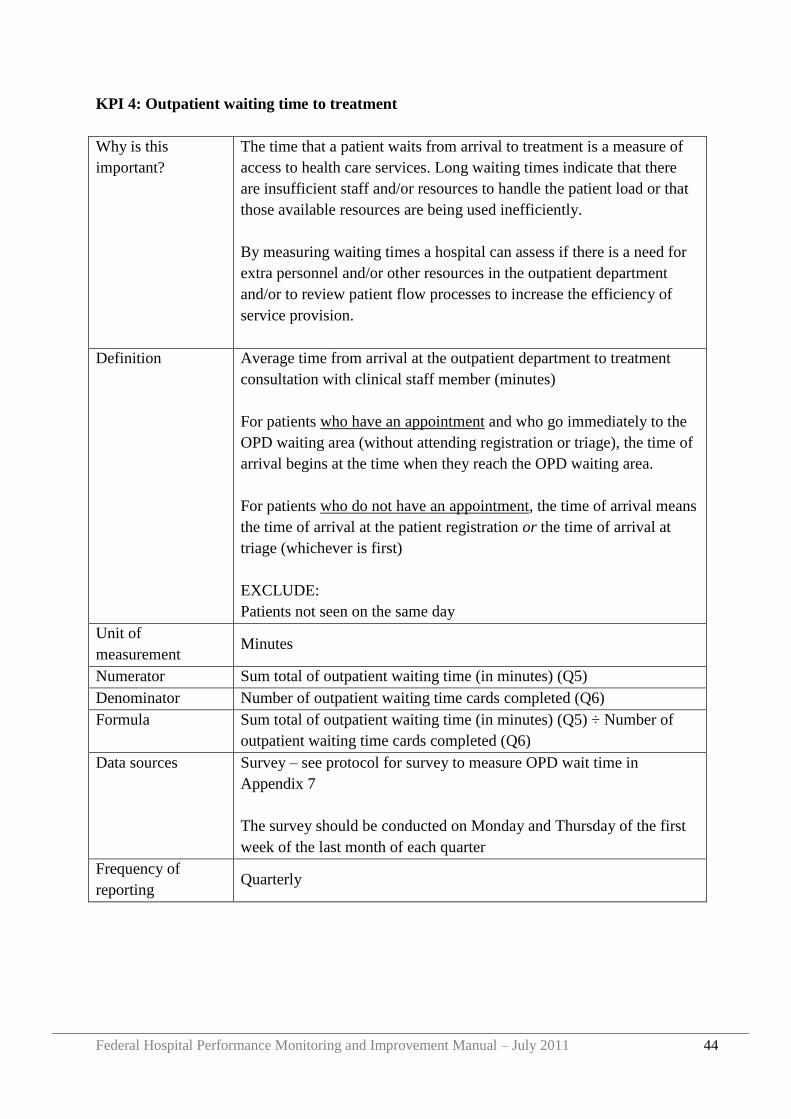
KPI 4: Outpatient waiting time to treatment
Why is this
important?
The time that a patient waits from arrival to treatment is a measure of
access to health care services. Long waiting times indicate that there
are insufficient staff and/or resources to handle the patient load or that
those available resources are being used inefficiently.
By measuring waiting times a hospital can assess if there is a need for
extra personnel and/or other resources in the outpatient department
and/or to review patient flow processes to increase the efficiency of
service provision.
Definition Average time from arrival at the outpatient department to treatment
consultation with clinical staff member (minutes)
For patients who have an appointment and who go immediately to the
OPD waiting area (without attending registration or triage), the time of
arrival begins at the time when they reach the OPD waiting area.
For patients who do not have an appointment, the time of arrival means
the time of arrival at the patient registration or the time of arrival at
triage (whichever is first)
EXCLUDE:
Patients not seen on the same day
Unit of
measurement Minutes
Numerator Sum total of outpatient waiting time (in minutes) (Q5)
Denominator Number of outpatient waiting time cards completed (Q6)
Formula Sum total of outpatient waiting time (in minutes) (Q5) ÷ Number of
outpatient waiting time cards completed (Q6)
Data sources Survey – see protocol for survey to measure OPD wait time in
Appendix 7
The survey should be conducted on Monday and Thursday of the first
week of the last month of each quarter
Frequency of
reporting Quarterly
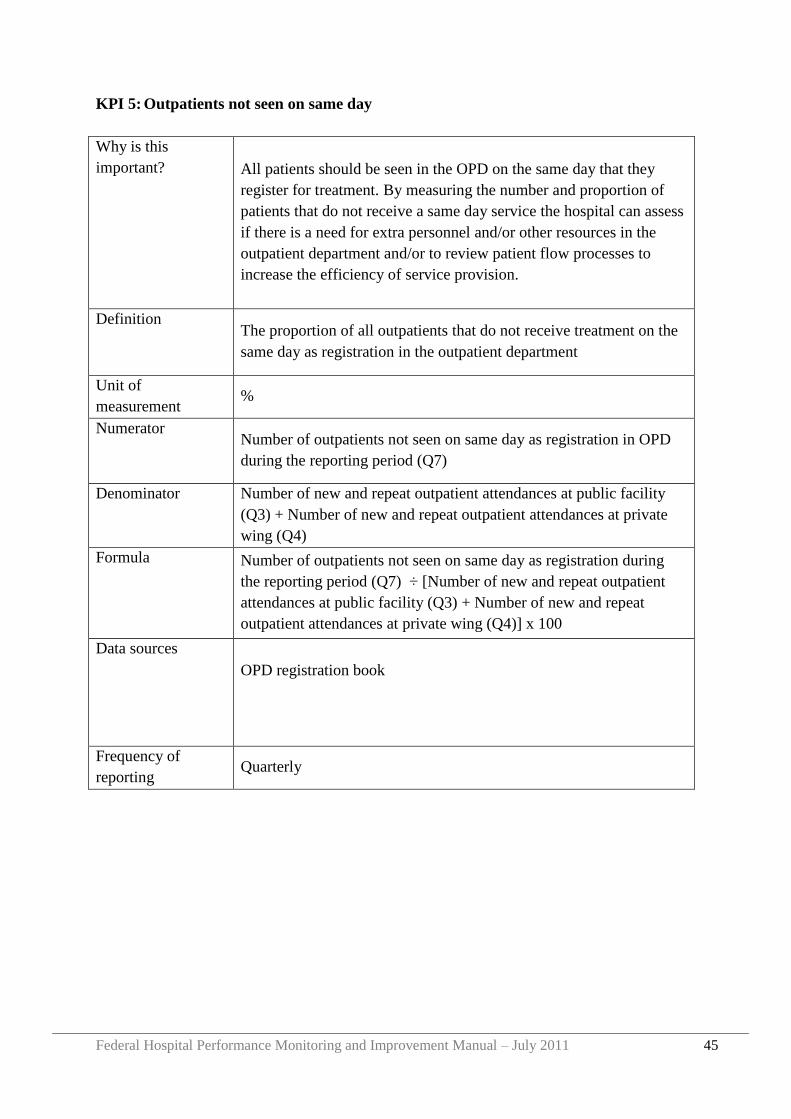
Federal Hospital Performance Monitoring and Improvement Manual – July 2011 45
KPI 5: Outpatients not seen on same day
Why is this
important? All patients should be seen in the OPD on the same day that they
register for treatment. By measuring the number and proportion of
patients that do not receive a same day service the hospital can assess
if there is a need for extra personnel and/or other resources in the
outpatient department and/or to review patient flow processes to
increase the efficiency of service provision.
Definition The proportion of all outpatients that do not receive treatment on the
same day as registration in the outpatient department
Unit of
measurement %
Numerator Number of outpatients not seen on same day as registration in OPD
during the reporting period (Q7)
Denominator Number of new and repeat outpatient attendances at public facility
(Q3) + Number of new and repeat outpatient attendances at private
wing (Q4)
Formula Number of outpatients not seen on same day as registration during
the reporting period (Q7) ÷ [Number of new and repeat outpatient
attendances at public facility (Q3) + Number of new and repeat
outpatient attendances at private wing (Q4)] x 100
Data sources
OPD registration book
Frequency of
reporting Quarterly
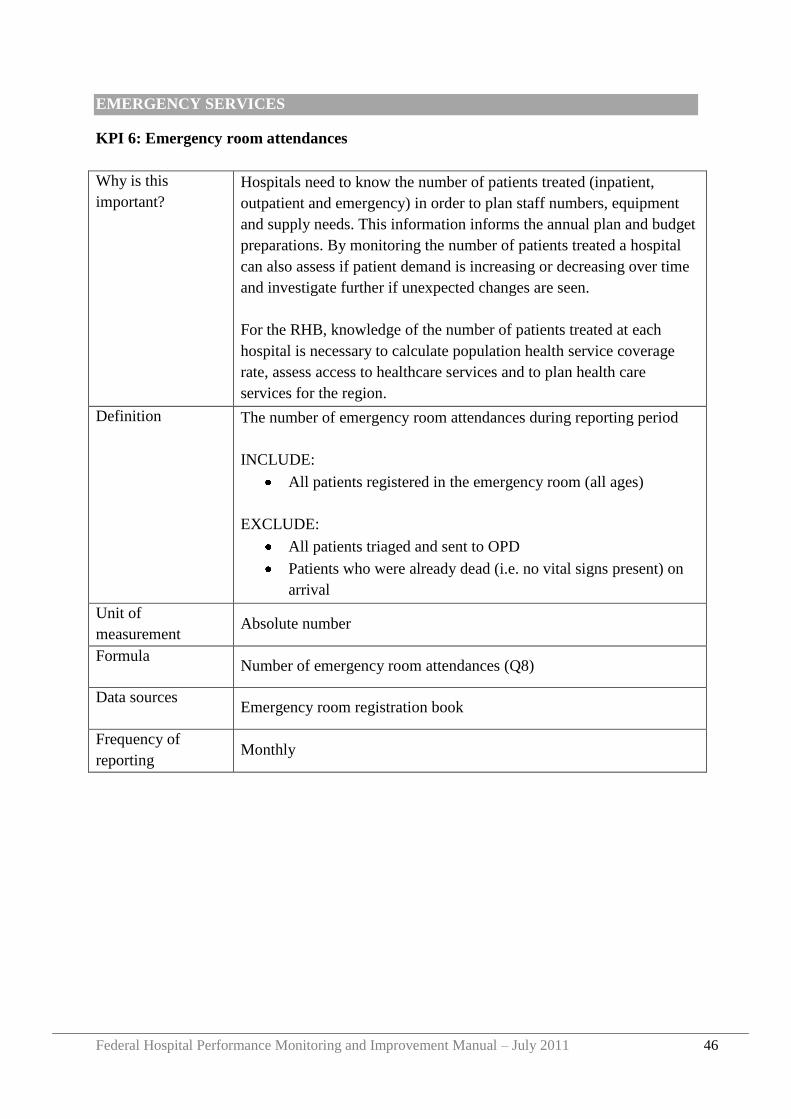
Federal Hospital Performance Monitoring and Improvement Manual – July 2011 46
EMERGENCY SERVICES
KPI 6: Emergency room attendances
Why is this
important?
Hospitals need to know the number of patients treated (inpatient,
outpatient and emergency) in order to plan staff numbers, equipment
and supply needs. This information informs the annual plan and budget
preparations. By monitoring the number of patients treated a hospital
can also assess if patient demand is increasing or decreasing over time
and investigate further if unexpected changes are seen.
For the RHB, knowledge of the number of patients treated at each
hospital is necessary to calculate population health service coverage
rate, assess access to healthcare services and to plan health care
services for the region.
Definition The number of emergency room attendances during reporting period
INCLUDE:
All patients registered in the emergency room (all ages)
EXCLUDE:
All patients triaged and sent to OPD
Patients who were already dead (i.e. no vital signs present) on
arrival
Unit of
measurement Absolute number
Formula Number of emergency room attendances (Q8)
Data sources Emergency room registration book
Frequency of
reporting Monthly
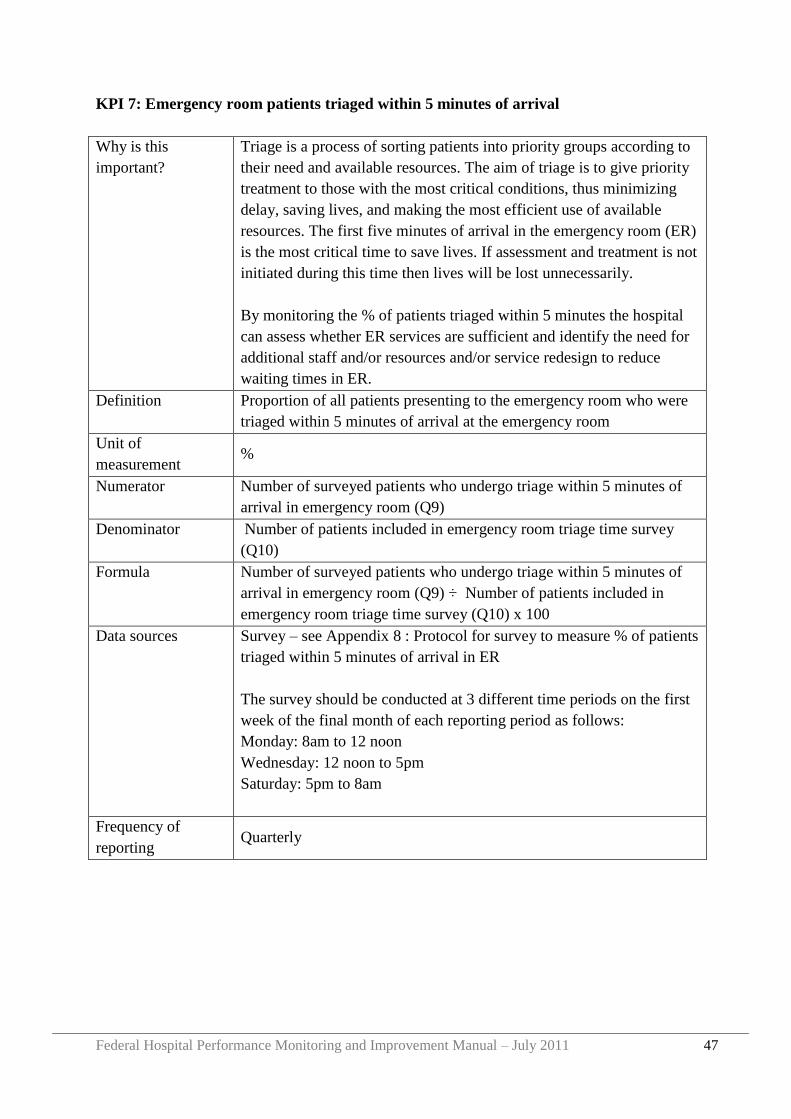
Federal Hospital Performance Monitoring and Improvement Manual – July 2011 47
KPI 7: Emergency room patients triaged within 5 minutes of arrival
Why is this
important?
Triage is a process of sorting patients into priority groups according to
their need and available resources. The aim of triage is to give priority
treatment to those with the most critical conditions, thus minimizing
delay, saving lives, and making the most efficient use of available
resources. The first five minutes of arrival in the emergency room (ER)
is the most critical time to save lives. If assessment and treatment is not
initiated during this time then lives will be lost unnecessarily.
By monitoring the % of patients triaged within 5 minutes the hospital
can assess whether ER services are sufficient and identify the need for
additional staff and/or resources and/or service redesign to reduce
waiting times in ER.
Definition Proportion of all patients presenting to the emergency room who were
triaged within 5 minutes of arrival at the emergency room
Unit of
measurement %
Numerator Number of surveyed patients who undergo triage within 5 minutes of
arrival in emergency room (Q9)
Denominator Number of patients included in emergency room triage time survey
(Q10)
Formula Number of surveyed patients who undergo triage within 5 minutes of
arrival in emergency room (Q9) ÷ Number of patients included in
emergency room triage time survey (Q10) x 100
Data sources Survey – see Appendix 8 : Protocol for survey to measure % of patients
triaged within 5 minutes of arrival in ER
The survey should be conducted at 3 different time periods on the first
week of the final month of each reporting period as follows:
Monday: 8am to 12 noon
Wednesday: 12 noon to 5pm
Saturday: 5pm to 8am
Frequency of
reporting Quarterly
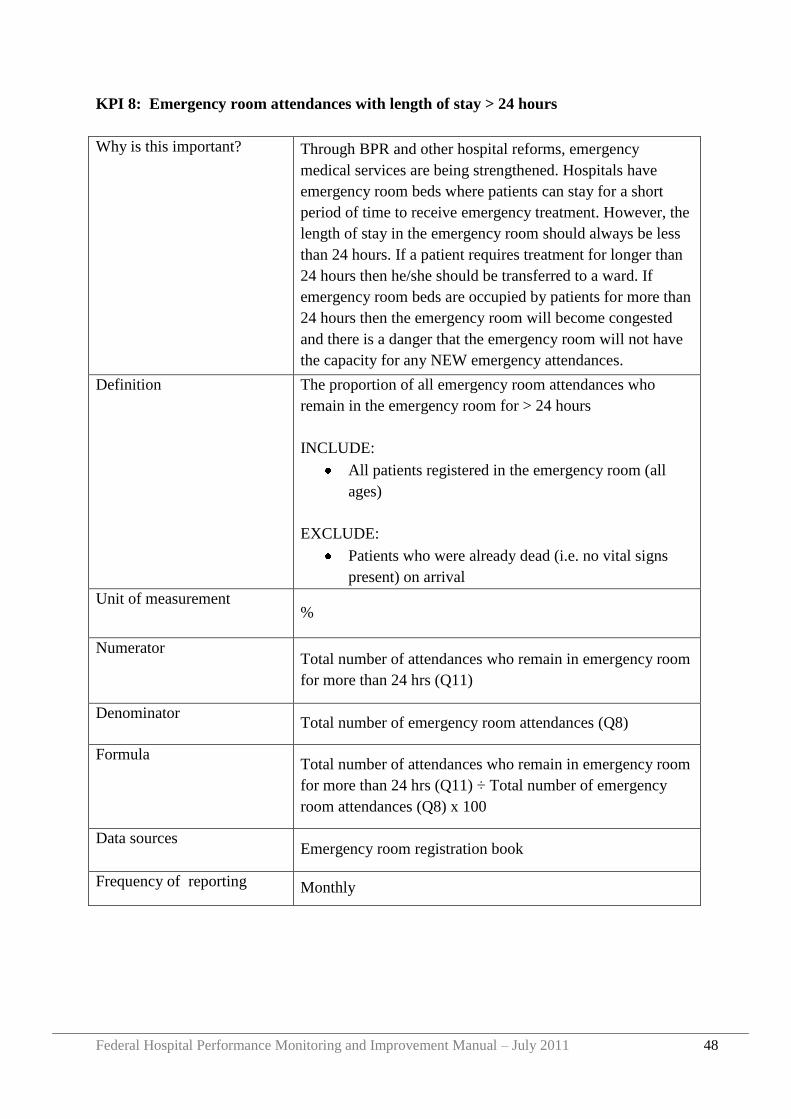
Federal Hospital Performance Monitoring and Improvement Manual – July 2011 48
KPI 8: Emergency room attendances with length of stay > 24 hours
Why is this important? Through BPR and other hospital reforms, emergency
medical services are being strengthened. Hospitals have
emergency room beds where patients can stay for a short
period of time to receive emergency treatment. However, the
length of stay in the emergency room should always be less
than 24 hours. If a patient requires treatment for longer than
24 hours then he/she should be transferred to a ward. If
emergency room beds are occupied by patients for more than
24 hours then the emergency room will become congested
and there is a danger that the emergency room will not have
the capacity for any NEW emergency attendances.
Definition The proportion of all emergency room attendances who
remain in the emergency room for > 24 hours
INCLUDE:
All patients registered in the emergency room (all
ages)
EXCLUDE:
Patients who were already dead (i.e. no vital signs
present) on arrival
Unit of measurement %
Numerator Total number of attendances who remain in emergency room
for more than 24 hrs (Q11)
Denominator Total number of emergency room attendances (Q8)
Formula Total number of attendances who remain in emergency room
for more than 24 hrs (Q11) ÷ Total number of emergency
room attendances (Q8) x 100
Data sources Emergency room registration book
Frequency of reporting Monthly
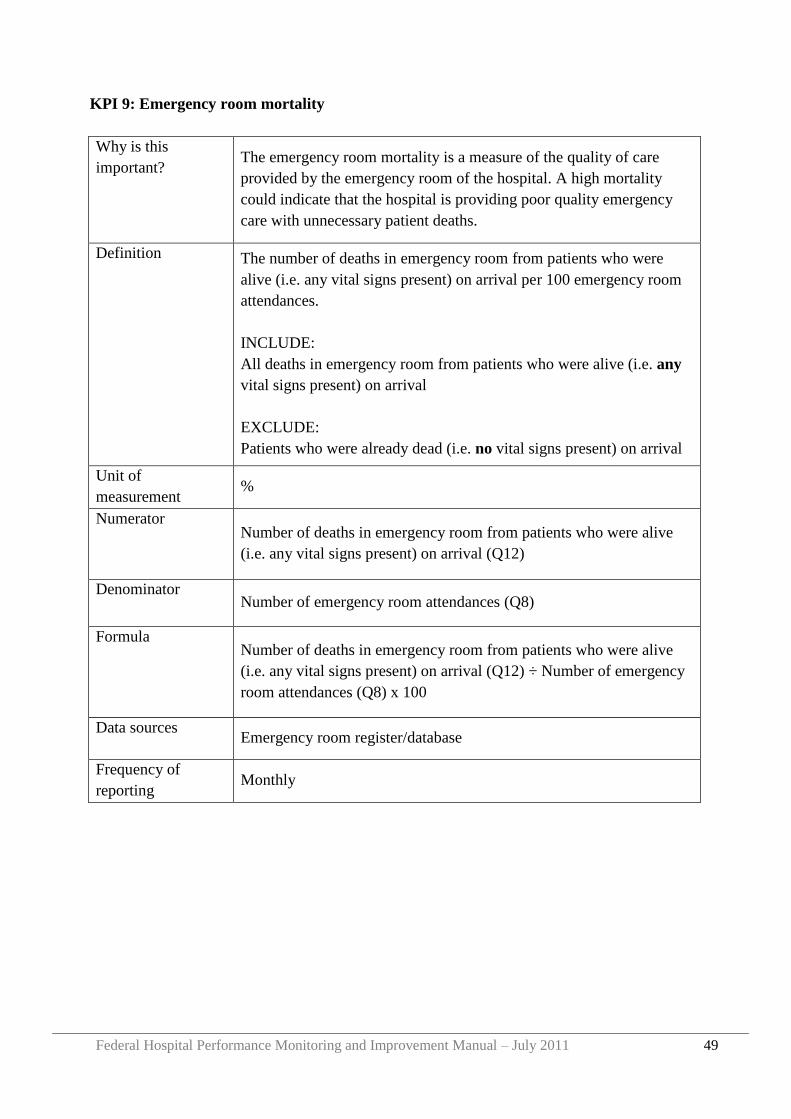
Federal Hospital Performance Monitoring and Improvement Manual – July 2011 49
KPI 9: Emergency room mortality
Why is this
important? The emergency room mortality is a measure of the quality of care
provided by the emergency room of the hospital. A high mortality
could indicate that the hospital is providing poor quality emergency
care with unnecessary patient deaths.
Definition The number of deaths in emergency room from patients who were
alive (i.e. any vital signs present) on arrival per 100 emergency room
attendances.
INCLUDE:
All deaths in emergency room from patients who were alive (i.e. any
vital signs present) on arrival
EXCLUDE:
Patients who were already dead (i.e. no vital signs present) on arrival
Unit of
measurement %
Numerator Number of deaths in emergency room from patients who were alive
(i.e. any vital signs present) on arrival (Q12)
Denominator Number of emergency room attendances (Q8)
Formula Number of deaths in emergency room from patients who were alive
(i.e. any vital signs present) on arrival (Q12) ÷ Number of emergency
room attendances (Q8) x 100
Data sources Emergency room register/database
Frequency of
reporting Monthly
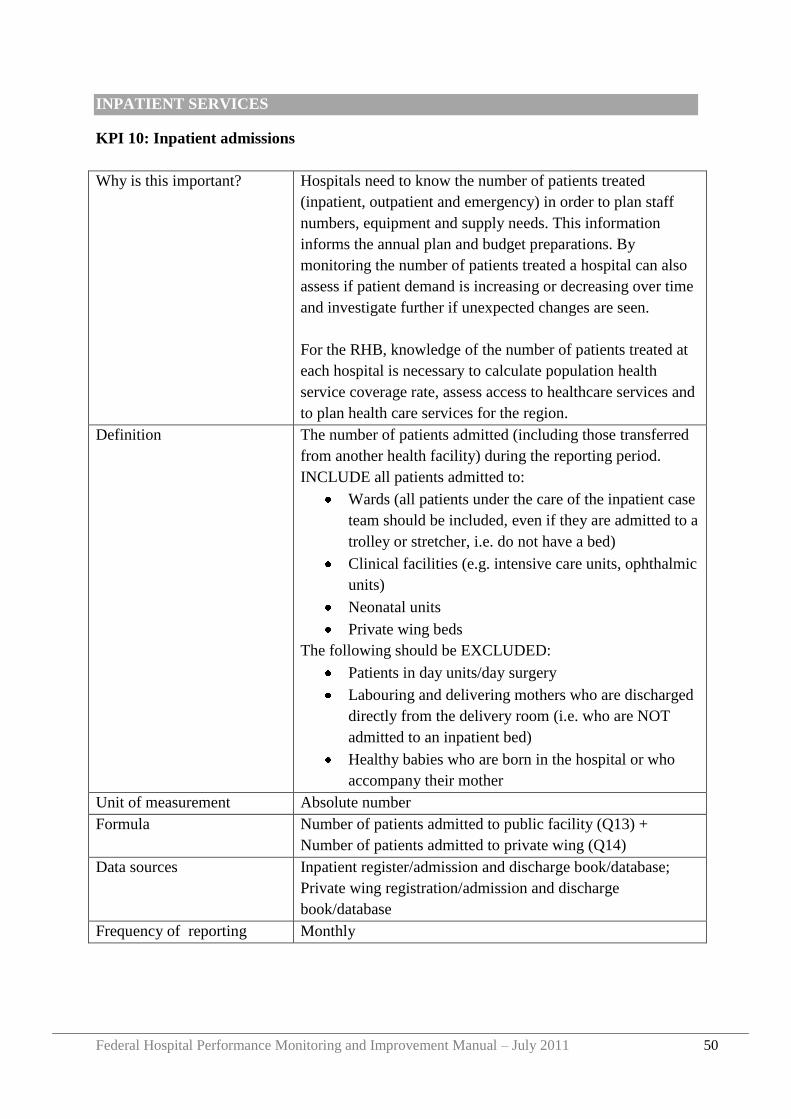
Federal Hospital Performance Monitoring and Improvement Manual – July 2011 50
INPATIENT SERVICES
KPI 10: Inpatient admissions
Why is this important? Hospitals need to know the number of patients treated
(inpatient, outpatient and emergency) in order to plan staff
numbers, equipment and supply needs. This information
informs the annual plan and budget preparations. By
monitoring the number of patients treated a hospital can also
assess if patient demand is increasing or decreasing over time
and investigate further if unexpected changes are seen.
For the RHB, knowledge of the number of patients treated at
each hospital is necessary to calculate population health
service coverage rate, assess access to healthcare services and
to plan health care services for the region.
Definition The number of patients admitted (including those transferred
from another health facility) during the reporting period.
INCLUDE all patients admitted to:
Wards (all patients under the care of the inpatient case
team should be included, even if they are admitted to a
trolley or stretcher, i.e. do not have a bed)
Clinical facilities (e.g. intensive care units, ophthalmic
units)
Neonatal units
Private wing beds
The following should be EXCLUDED:
Patients in day units/day surgery
Labouring and delivering mothers who are discharged
directly from the delivery room (i.e. who are NOT
admitted to an inpatient bed)
Healthy babies who are born in the hospital or who
accompany their mother
Unit of measurement Absolute number
Formula Number of patients admitted to public facility (Q13) +
Number of patients admitted to private wing (Q14)
Data sources Inpatient register/admission and discharge book/database;
Private wing registration/admission and discharge
book/database
Frequency of reporting Monthly
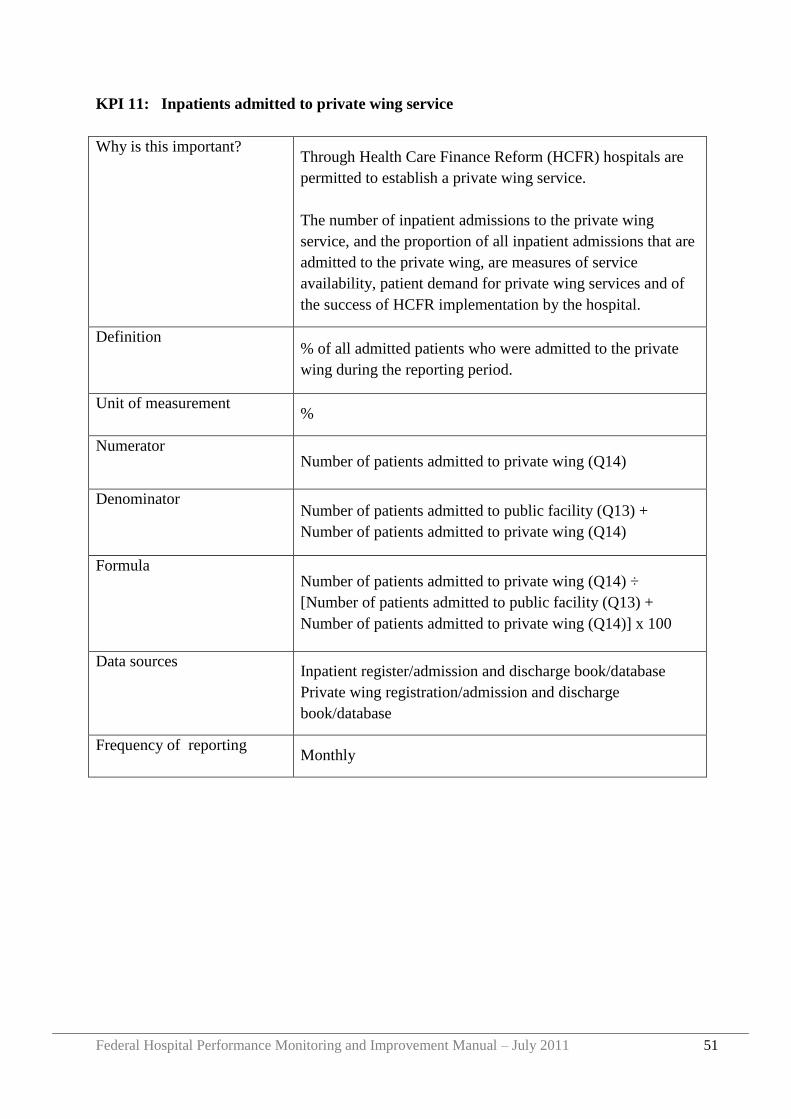
Federal Hospital Performance Monitoring and Improvement Manual – July 2011 51
KPI 11: Inpatients admitted to private wing service
Why is this important? Through Health Care Finance Reform (HCFR) hospitals are
permitted to establish a private wing service.
The number of inpatient admissions to the private wing
service, and the proportion of all inpatient admissions that are
admitted to the private wing, are measures of service
availability, patient demand for private wing services and of
the success of HCFR implementation by the hospital.
Definition % of all admitted patients who were admitted to the private
wing during the reporting period.
Unit of measurement %
Numerator Number of patients admitted to private wing (Q14)
Denominator Number of patients admitted to public facility (Q13) +
Number of patients admitted to private wing (Q14)
Formula Number of patients admitted to private wing (Q14) ÷
[Number of patients admitted to public facility (Q13) +
Number of patients admitted to private wing (Q14)] x 100
Data sources Inpatient register/admission and discharge book/database
Private wing registration/admission and discharge
book/database
Frequency of reporting Monthly
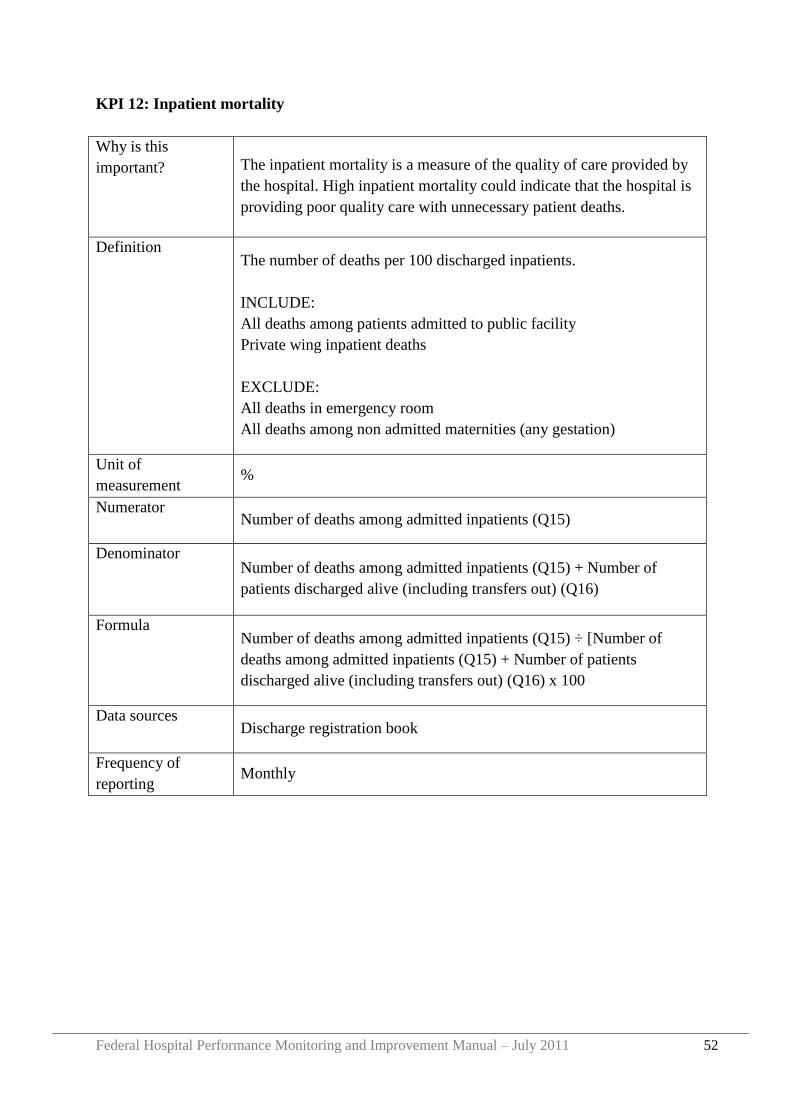
Federal Hospital Performance Monitoring and Improvement Manual – July 2011 52
KPI 12: Inpatient mortality
Why is this
important? The inpatient mortality is a measure of the quality of care provided by
the hospital. High inpatient mortality could indicate that the hospital is
providing poor quality care with unnecessary patient deaths.
Definition The number of deaths per 100 discharged inpatients.
INCLUDE:
All deaths among patients admitted to public facility
Private wing inpatient deaths
EXCLUDE:
All deaths in emergency room
All deaths among non admitted maternities (any gestation)
Unit of
measurement %
Numerator Number of deaths among admitted inpatients (Q15)
Denominator Number of deaths among admitted inpatients (Q15) + Number of
patients discharged alive (including transfers out) (Q16)
Formula Number of deaths among admitted inpatients (Q15) ÷ [Number of
deaths among admitted inpatients (Q15) + Number of patients
discharged alive (including transfers out) (Q16) x 100
Data sources Discharge registration book
Frequency of
reporting Monthly
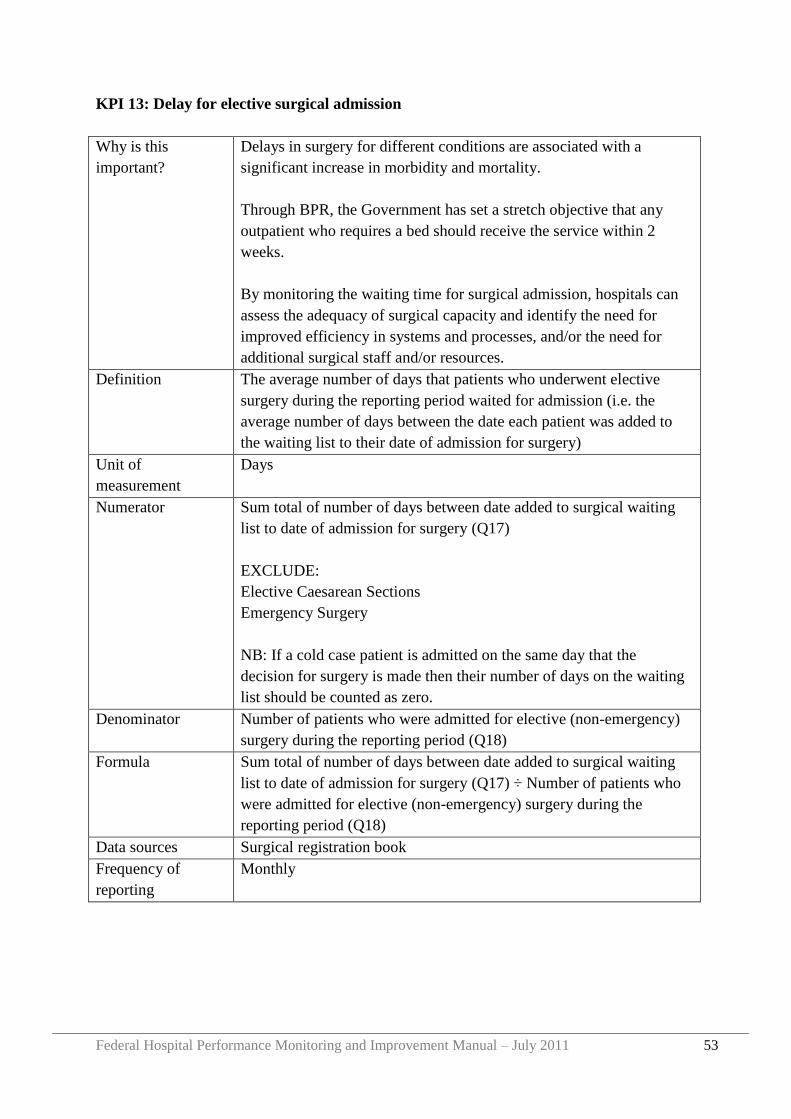
Federal Hospital Performance Monitoring and Improvement Manual – July 2011 53
KPI 13: Delay for elective surgical admission
Why is this
important?
Delays in surgery for different conditions are associated with a
significant increase in morbidity and mortality.
Through BPR, the Government has set a stretch objective that any
outpatient who requires a bed should receive the service within 2
weeks.
By monitoring the waiting time for surgical admission, hospitals can
assess the adequacy of surgical capacity and identify the need for
improved efficiency in systems and processes, and/or the need for
additional surgical staff and/or resources.
Definition The average number of days that patients who underwent elective
surgery during the reporting period waited for admission (i.e. the
average number of days between the date each patient was added to
the waiting list to their date of admission for surgery)
Unit of
measurement
Days
Numerator Sum total of number of days between date added to surgical waiting
list to date of admission for surgery (Q17)
EXCLUDE:
Elective Caesarean Sections
Emergency Surgery
NB: If a cold case patient is admitted on the same day that the
decision for surgery is made then their number of days on the waiting
list should be counted as zero.
Denominator Number of patients who were admitted for elective (non-emergency)
surgery during the reporting period (Q18)
Formula Sum total of number of days between date added to surgical waiting
list to date of admission for surgery (Q17) ÷ Number of patients who
were admitted for elective (non-emergency) surgery during the
reporting period (Q18)
Data sources Surgical registration book
Frequency of
reporting
Monthly
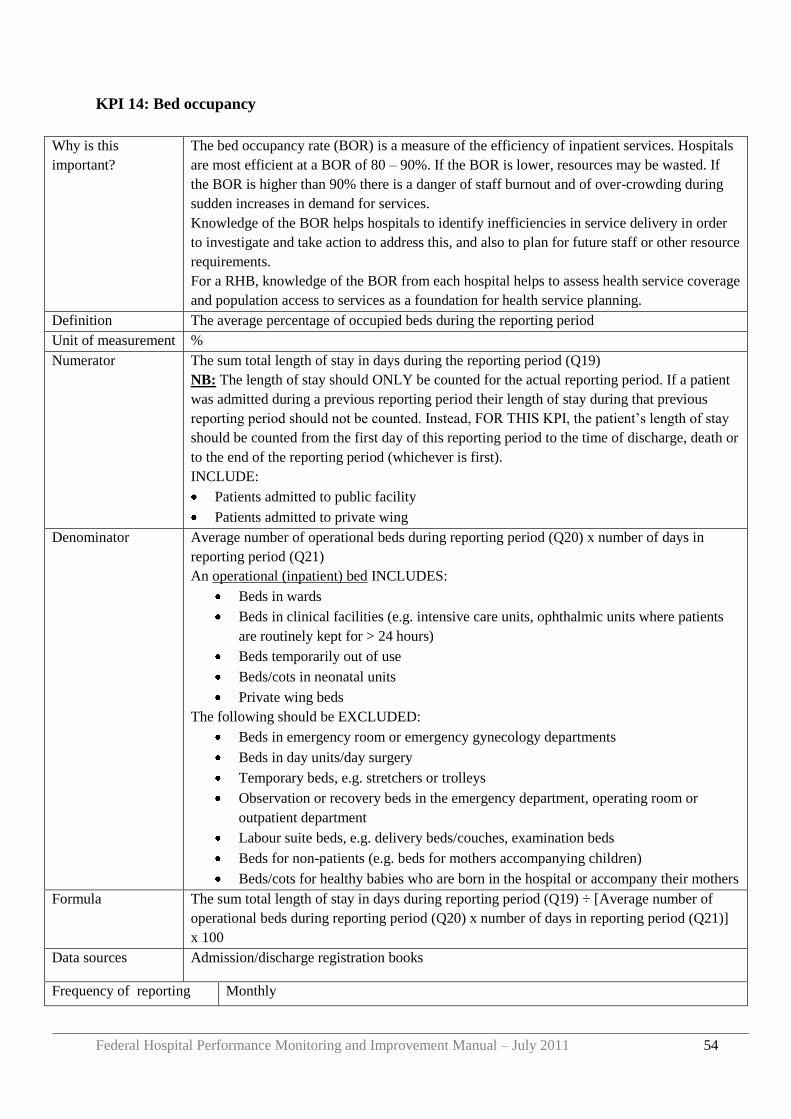
Federal Hospital Performance Monitoring and Improvement Manual – July 2011 54
KPI 14: Bed occupancy
Why is this
important?
The bed occupancy rate (BOR) is a measure of the efficiency of inpatient services. Hospitals
are most efficient at a BOR of 80 – 90%. If the BOR is lower, resources may be wasted. If
the BOR is higher than 90% there is a danger of staff burnout and of over-crowding during
sudden increases in demand for services.
Knowledge of the BOR helps hospitals to identify inefficiencies in service delivery in order
to investigate and take action to address this, and also to plan for future staff or other resource
requirements.
For a RHB, knowledge of the BOR from each hospital helps to assess health service coverage
and population access to services as a foundation for health service planning.
Definition The average percentage of occupied beds during the reporting period
Unit of measurement %
Numerator The sum total length of stay in days during the reporting period (Q19)
NB: The length of stay should ONLY be counted for the actual reporting period. If a patient
was admitted during a previous reporting period their length of stay during that previous
reporting period should not be counted. Instead, FOR THIS KPI, the patient‟s length of stay
should be counted from the first day of this reporting period to the time of discharge, death or
to the end of the reporting period (whichever is first).
INCLUDE:
Patients admitted to public facility
Patients admitted to private wing
Denominator Average number of operational beds during reporting period (Q20) x number of days in
reporting period (Q21)
An operational (inpatient) bed INCLUDES:
Beds in wards
Beds in clinical facilities (e.g. intensive care units, ophthalmic units where patients
are routinely kept for > 24 hours)
Beds temporarily out of use
Beds/cots in neonatal units
Private wing beds
The following should be EXCLUDED:
Beds in emergency room or emergency gynecology departments
Beds in day units/day surgery
Temporary beds, e.g. stretchers or trolleys
Observation or recovery beds in the emergency department, operating room or
outpatient department
Labour suite beds, e.g. delivery beds/couches, examination beds
Beds for non-patients (e.g. beds for mothers accompanying children)
Beds/cots for healthy babies who are born in the hospital or accompany their mothers
Formula The sum total length of stay in days during reporting period (Q19) ÷ [Average number of
operational beds during reporting period (Q20) x number of days in reporting period (Q21)]
x 100
Data sources Admission/discharge registration books
Frequency of reporting Monthly
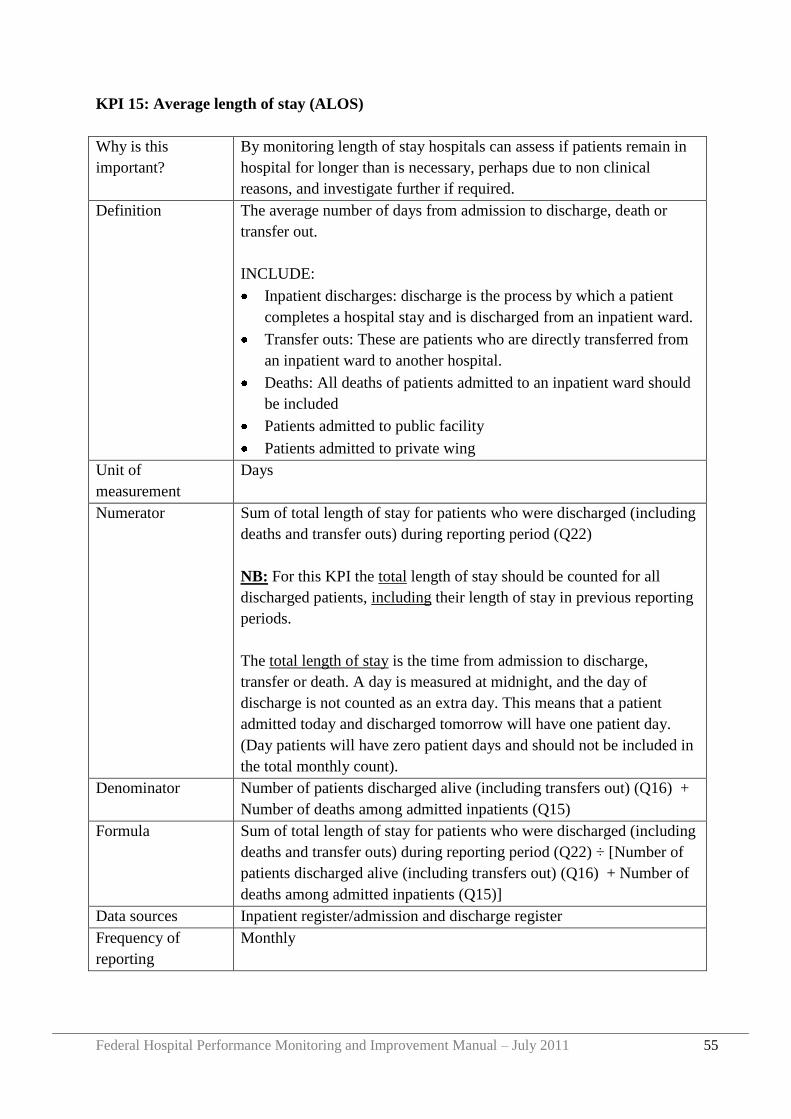
Federal Hospital Performance Monitoring and Improvement Manual – July 2011 55
KPI 15: Average length of stay (ALOS)
Why is this
important?
By monitoring length of stay hospitals can assess if patients remain in
hospital for longer than is necessary, perhaps due to non clinical
reasons, and investigate further if required.
Definition The average number of days from admission to discharge, death or
transfer out.
INCLUDE:
Inpatient discharges: discharge is the process by which a patient
completes a hospital stay and is discharged from an inpatient ward.
Transfer outs: These are patients who are directly transferred from
an inpatient ward to another hospital.
Deaths: All deaths of patients admitted to an inpatient ward should
be included
Patients admitted to public facility
Patients admitted to private wing
Unit of
measurement
Days
Numerator Sum of total length of stay for patients who were discharged (including
deaths and transfer outs) during reporting period (Q22)
NB: For this KPI the total length of stay should be counted for all
discharged patients, including their length of stay in previous reporting
periods.
The total length of stay is the time from admission to discharge,
transfer or death. A day is measured at midnight, and the day of
discharge is not counted as an extra day. This means that a patient
admitted today and discharged tomorrow will have one patient day.
(Day patients will have zero patient days and should not be included in
the total monthly count).
Denominator Number of patients discharged alive (including transfers out) (Q16) +
Number of deaths among admitted inpatients (Q15)
Formula Sum of total length of stay for patients who were discharged (including
deaths and transfer outs) during reporting period (Q22) ÷ [Number of
patients discharged alive (including transfers out) (Q16) + Number of
deaths among admitted inpatients (Q15)]
Data sources Inpatient register/admission and discharge register
Frequency of
reporting
Monthly
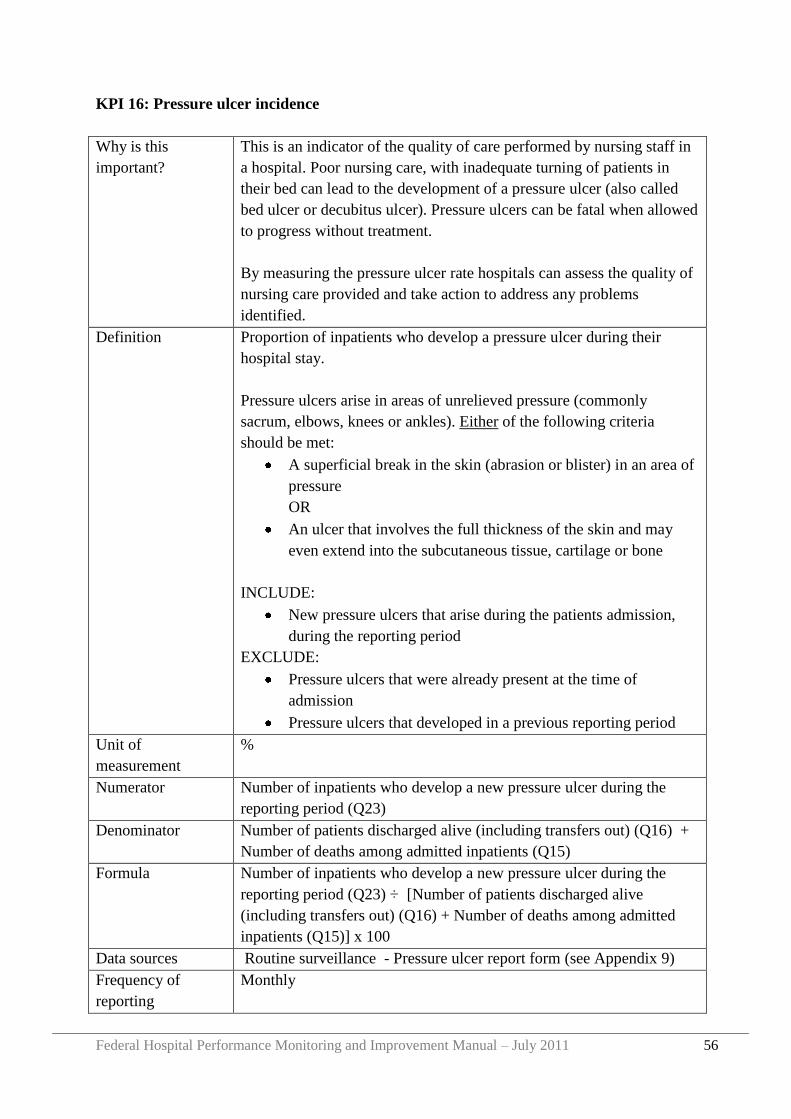
Federal Hospital Performance Monitoring and Improvement Manual – July 2011 56
KPI 16: Pressure ulcer incidence
Why is this
important?
This is an indicator of the quality of care performed by nursing staff in
a hospital. Poor nursing care, with inadequate turning of patients in
their bed can lead to the development of a pressure ulcer (also called
bed ulcer or decubitus ulcer). Pressure ulcers can be fatal when allowed
to progress without treatment.
By measuring the pressure ulcer rate hospitals can assess the quality of
nursing care provided and take action to address any problems
identified.
Definition Proportion of inpatients who develop a pressure ulcer during their
hospital stay.
Pressure ulcers arise in areas of unrelieved pressure (commonly
sacrum, elbows, knees or ankles). Either of the following criteria
should be met:
A superficial break in the skin (abrasion or blister) in an area of
pressure
OR
An ulcer that involves the full thickness of the skin and may
even extend into the subcutaneous tissue, cartilage or bone
INCLUDE:
New pressure ulcers that arise during the patients admission,
during the reporting period
EXCLUDE:
Pressure ulcers that were already present at the time of
admission
Pressure ulcers that developed in a previous reporting period
Unit of
measurement
%
Numerator Number of inpatients who develop a new pressure ulcer during the
reporting period (Q23)
Denominator Number of patients discharged alive (including transfers out) (Q16) +
Number of deaths among admitted inpatients (Q15)
Formula Number of inpatients who develop a new pressure ulcer during the
reporting period (Q23) ÷ [Number of patients discharged alive
(including transfers out) (Q16) + Number of deaths among admitted
inpatients (Q15)] x 100
Data sources Routine surveillance - Pressure ulcer report form (see Appendix 9)
Frequency of
reporting
Monthly
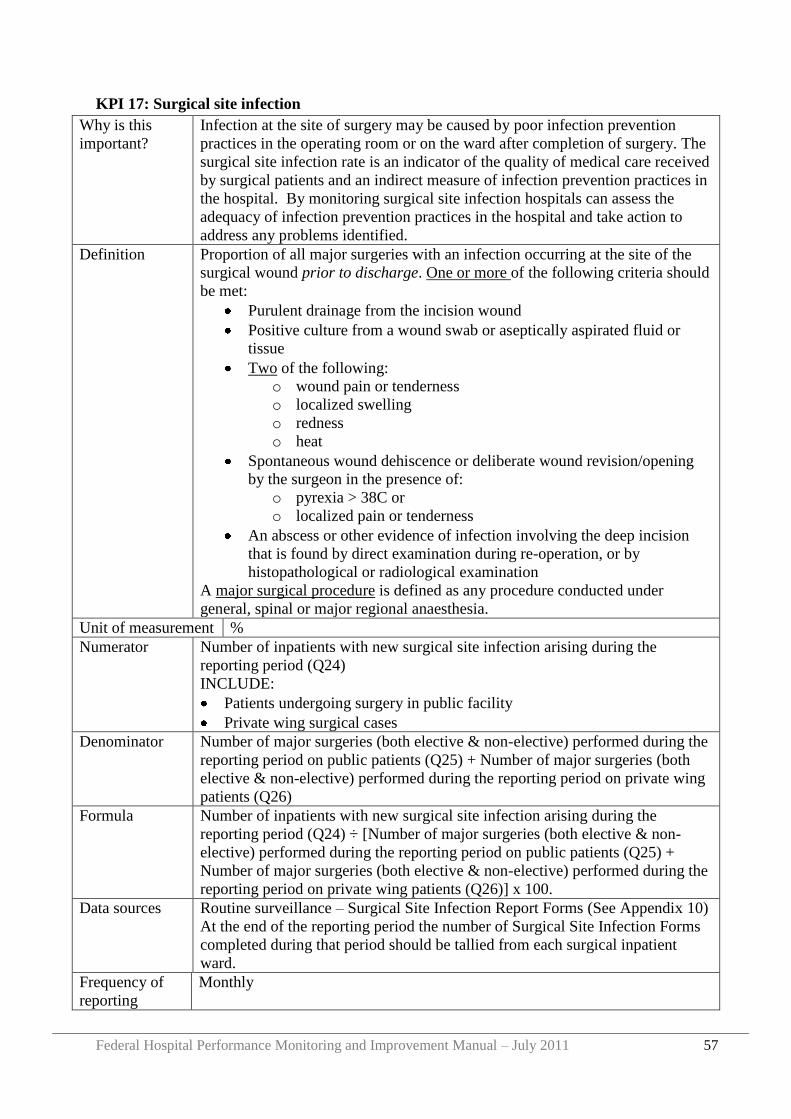
Federal Hospital Performance Monitoring and Improvement Manual – July 2011 57
KPI 17: Surgical site infection
Why is this
important?
Infection at the site of surgery may be caused by poor infection prevention
practices in the operating room or on the ward after completion of surgery. The
surgical site infection rate is an indicator of the quality of medical care received
by surgical patients and an indirect measure of infection prevention practices in
the hospital. By monitoring surgical site infection hospitals can assess the
adequacy of infection prevention practices in the hospital and take action to
address any problems identified.
Definition Proportion of all major surgeries with an infection occurring at the site of the
surgical wound prior to discharge. One or more of the following criteria should
be met:
Purulent drainage from the incision wound
Positive culture from a wound swab or aseptically aspirated fluid or
tissue
Two of the following:
o wound pain or tenderness
o localized swelling
o redness
o heat
Spontaneous wound dehiscence or deliberate wound revision/opening
by the surgeon in the presence of:
o pyrexia > 38C or
o localized pain or tenderness
An abscess or other evidence of infection involving the deep incision
that is found by direct examination during re-operation, or by
histopathological or radiological examination
A major surgical procedure is defined as any procedure conducted under
general, spinal or major regional anaesthesia.
Unit of measurement %
Numerator Number of inpatients with new surgical site infection arising during the
reporting period (Q24)
INCLUDE:
Patients undergoing surgery in public facility
Private wing surgical cases
Denominator Number of major surgeries (both elective & non-elective) performed during the
reporting period on public patients (Q25) + Number of major surgeries (both
elective & non-elective) performed during the reporting period on private wing
patients (Q26)
Formula Number of inpatients with new surgical site infection arising during the
reporting period (Q24) ÷ [Number of major surgeries (both elective & non-
elective) performed during the reporting period on public patients (Q25) +
Number of major surgeries (both elective & non-elective) performed during the
reporting period on private wing patients (Q26)] x 100.
Data sources Routine surveillance – Surgical Site Infection Report Forms (See Appendix 10)
At the end of the reporting period the number of Surgical Site Infection Forms
completed during that period should be tallied from each surgical inpatient
ward.
Frequency of
reporting
Monthly
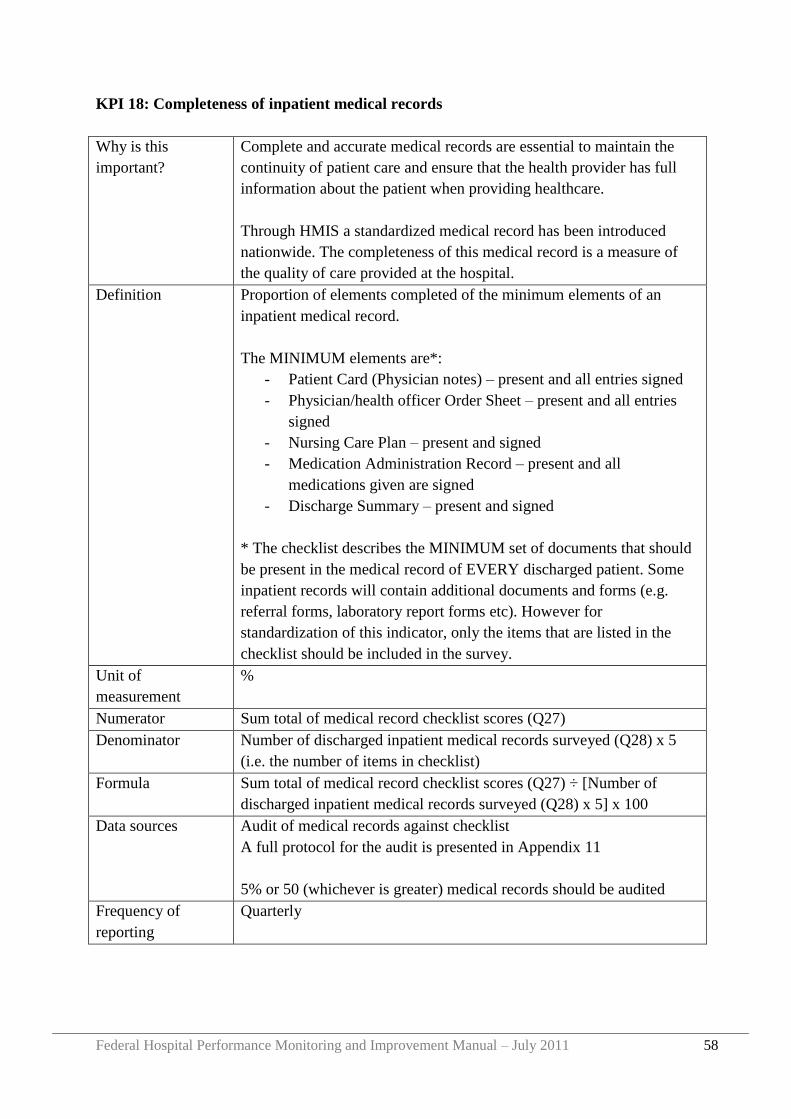
Federal Hospital Performance Monitoring and Improvement Manual – July 2011 58
KPI 18: Completeness of inpatient medical records
Why is this
important?
Complete and accurate medical records are essential to maintain the
continuity of patient care and ensure that the health provider has full
information about the patient when providing healthcare.
Through HMIS a standardized medical record has been introduced
nationwide. The completeness of this medical record is a measure of
the quality of care provided at the hospital.
Definition Proportion of elements completed of the minimum elements of an
inpatient medical record.
The MINIMUM elements are*:
- Patient Card (Physician notes) – present and all entries signed
- Physician/health officer Order Sheet – present and all entries
signed
- Nursing Care Plan – present and signed
- Medication Administration Record – present and all
medications given are signed
- Discharge Summary – present and signed
* The checklist describes the MINIMUM set of documents that should
be present in the medical record of EVERY discharged patient. Some
inpatient records will contain additional documents and forms (e.g.
referral forms, laboratory report forms etc). However for
standardization of this indicator, only the items that are listed in the
checklist should be included in the survey.
Unit of
measurement
%
Numerator Sum total of medical record checklist scores (Q27)
Denominator Number of discharged inpatient medical records surveyed (Q28) x 5
(i.e. the number of items in checklist)
Formula Sum total of medical record checklist scores (Q27) ÷ [Number of
discharged inpatient medical records surveyed (Q28) x 5] x 100
Data sources Audit of medical records against checklist
A full protocol for the audit is presented in Appendix 11
5% or 50 (whichever is greater) medical records should be audited
Frequency of
reporting
Quarterly
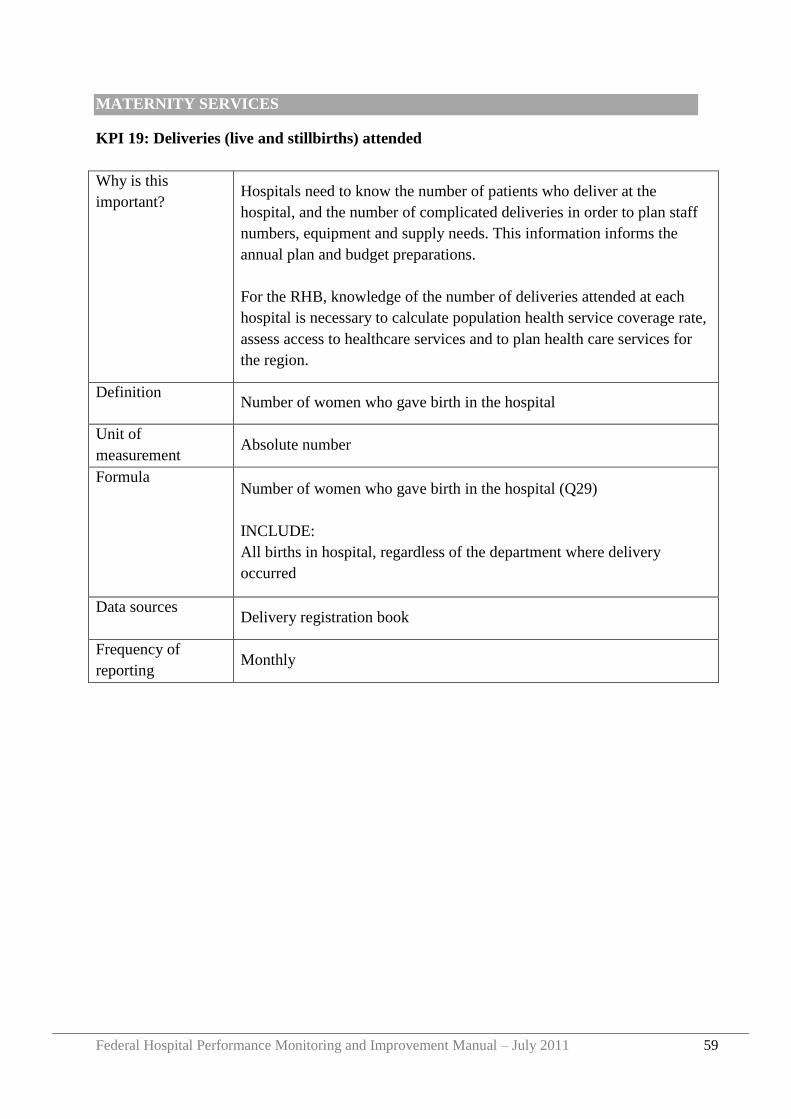
Federal Hospital Performance Monitoring and Improvement Manual – July 2011 59
MATERNITY SERVICES
KPI 19: Deliveries (live and stillbirths) attended
Why is this
important? Hospitals need to know the number of patients who deliver at the
hospital, and the number of complicated deliveries in order to plan staff
numbers, equipment and supply needs. This information informs the
annual plan and budget preparations.
For the RHB, knowledge of the number of deliveries attended at each
hospital is necessary to calculate population health service coverage rate,
assess access to healthcare services and to plan health care services for
the region.
Definition Number of women who gave birth in the hospital
Unit of
measurement Absolute number
Formula Number of women who gave birth in the hospital (Q29)
INCLUDE:
All births in hospital, regardless of the department where delivery
occurred
Data sources Delivery registration book
Frequency of
reporting Monthly
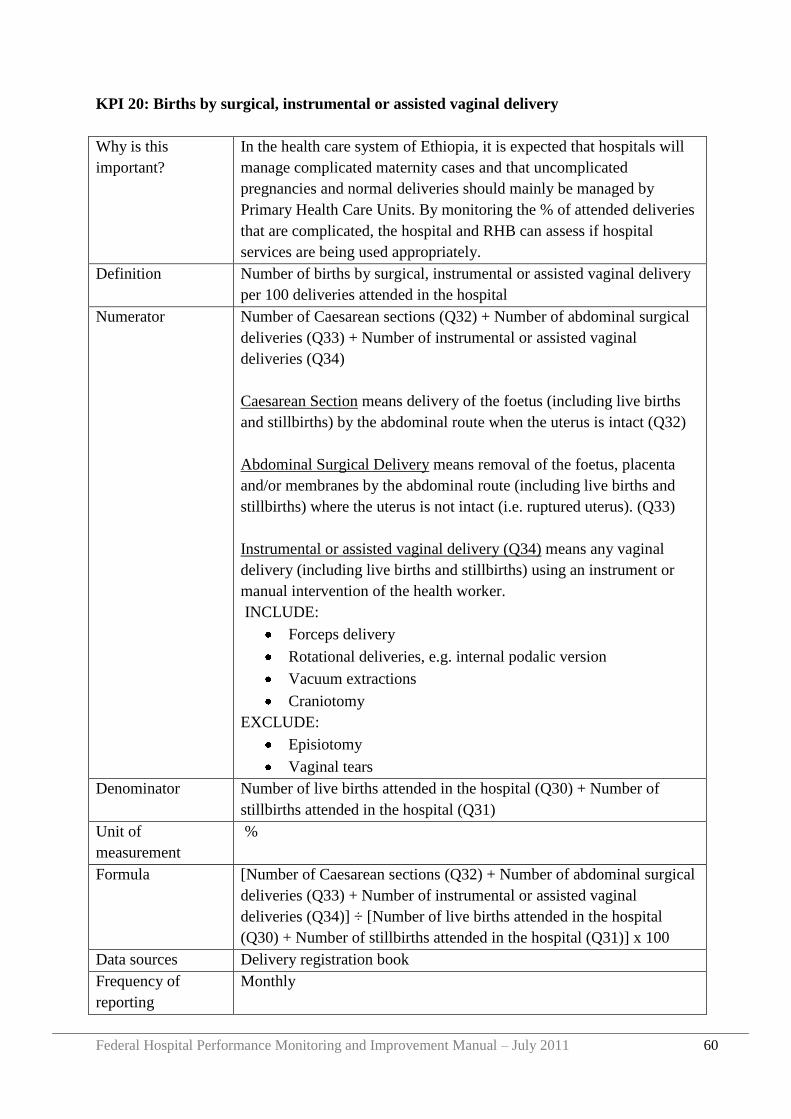
Federal Hospital Performance Monitoring and Improvement Manual – July 2011 60
KPI 20: Births by surgical, instrumental or assisted vaginal delivery
Why is this
important?
In the health care system of Ethiopia, it is expected that hospitals will
manage complicated maternity cases and that uncomplicated
pregnancies and normal deliveries should mainly be managed by
Primary Health Care Units. By monitoring the % of attended deliveries
that are complicated, the hospital and RHB can assess if hospital
services are being used appropriately.
Definition Number of births by surgical, instrumental or assisted vaginal delivery
per 100 deliveries attended in the hospital
Numerator Number of Caesarean sections (Q32) + Number of abdominal surgical
deliveries (Q33) + Number of instrumental or assisted vaginal
deliveries (Q34)
Caesarean Section means delivery of the foetus (including live births
and stillbirths) by the abdominal route when the uterus is intact (Q32)
Abdominal Surgical Delivery means removal of the foetus, placenta
and/or membranes by the abdominal route (including live births and
stillbirths) where the uterus is not intact (i.e. ruptured uterus). (Q33)
Instrumental or assisted vaginal delivery (Q34) means any vaginal
delivery (including live births and stillbirths) using an instrument or
manual intervention of the health worker.
INCLUDE:
Forceps delivery
Rotational deliveries, e.g. internal podalic version
Vacuum extractions
Craniotomy
EXCLUDE:
Episiotomy
Vaginal tears
Denominator Number of live births attended in the hospital (Q30) + Number of
stillbirths attended in the hospital (Q31)
Unit of
measurement
%
Formula [Number of Caesarean sections (Q32) + Number of abdominal surgical
deliveries (Q33) + Number of instrumental or assisted vaginal
deliveries (Q34)] ÷ [Number of live births attended in the hospital
(Q30) + Number of stillbirths attended in the hospital (Q31)] x 100
Data sources Delivery registration book
Frequency of
reporting
Monthly
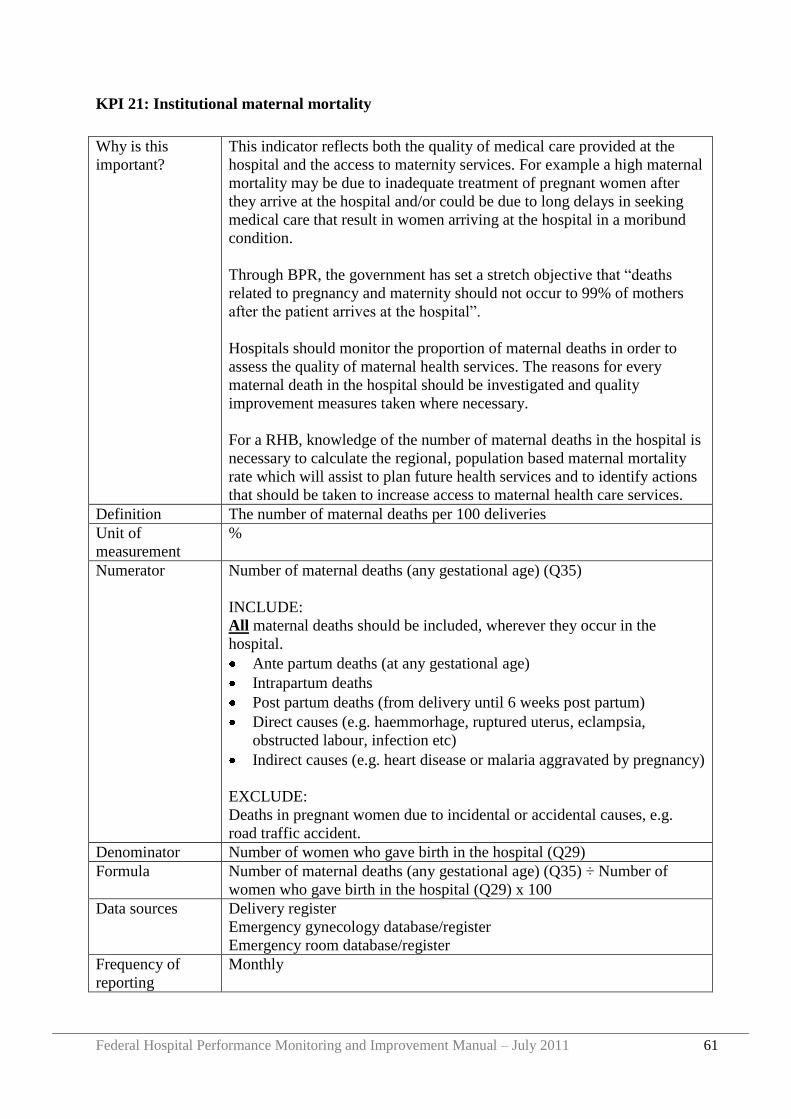
Federal Hospital Performance Monitoring and Improvement Manual – July 2011 61
KPI 21: Institutional maternal mortality
Why is this
important?
This indicator reflects both the quality of medical care provided at the
hospital and the access to maternity services. For example a high maternal
mortality may be due to inadequate treatment of pregnant women after
they arrive at the hospital and/or could be due to long delays in seeking
medical care that result in women arriving at the hospital in a moribund
condition.
Through BPR, the government has set a stretch objective that “deaths
related to pregnancy and maternity should not occur to 99% of mothers
after the patient arrives at the hospital”.
Hospitals should monitor the proportion of maternal deaths in order to
assess the quality of maternal health services. The reasons for every
maternal death in the hospital should be investigated and quality
improvement measures taken where necessary.
For a RHB, knowledge of the number of maternal deaths in the hospital is
necessary to calculate the regional, population based maternal mortality
rate which will assist to plan future health services and to identify actions
that should be taken to increase access to maternal health care services.
Definition The number of maternal deaths per 100 deliveries
Unit of
measurement
%
Numerator Number of maternal deaths (any gestational age) (Q35)
INCLUDE:
All maternal deaths should be included, wherever they occur in the
hospital.
Ante partum deaths (at any gestational age)
Intrapartum deaths
Post partum deaths (from delivery until 6 weeks post partum)
Direct causes (e.g. haemmorhage, ruptured uterus, eclampsia,
obstructed labour, infection etc)
Indirect causes (e.g. heart disease or malaria aggravated by pregnancy)
EXCLUDE:
Deaths in pregnant women due to incidental or accidental causes, e.g.
road traffic accident.
Denominator Number of women who gave birth in the hospital (Q29)
Formula Number of maternal deaths (any gestational age) (Q35) ÷ Number of
women who gave birth in the hospital (Q29) x 100
Data sources Delivery register
Emergency gynecology database/register
Emergency room database/register
Frequency of
reporting
Monthly
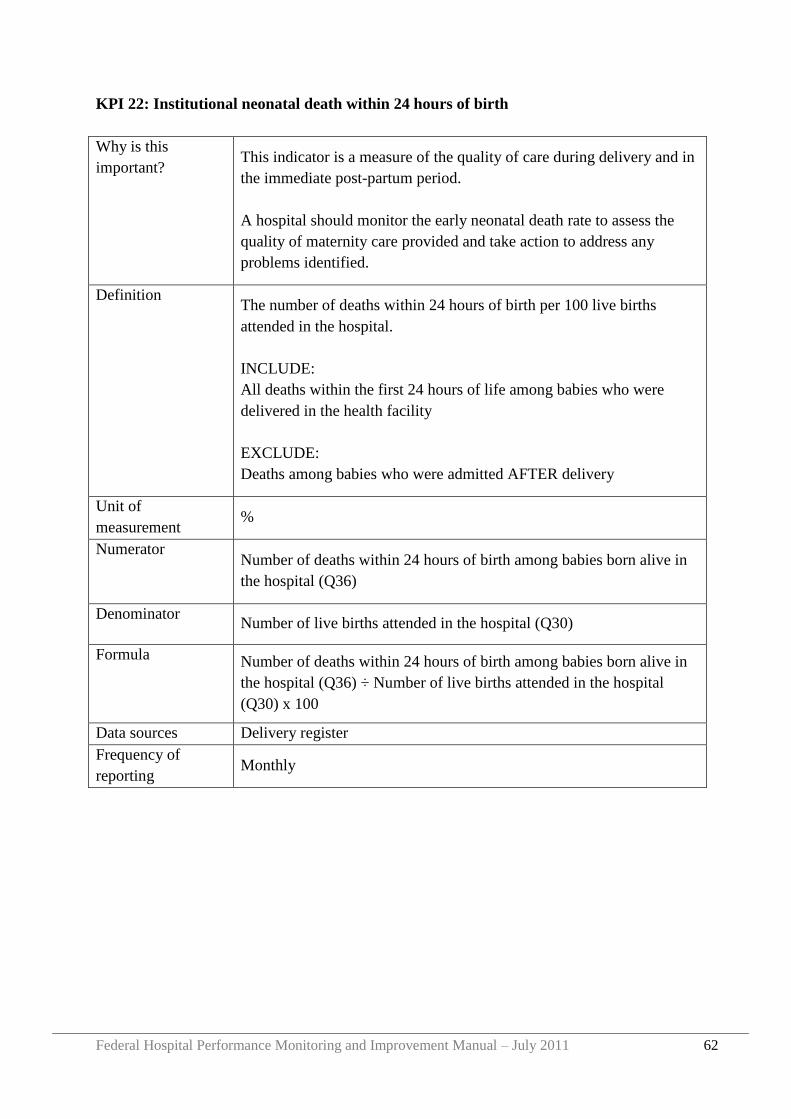
Federal Hospital Performance Monitoring and Improvement Manual – July 2011 62
KPI 22: Institutional neonatal death within 24 hours of birth
Why is this
important? This indicator is a measure of the quality of care during delivery and in
the immediate post-partum period.
A hospital should monitor the early neonatal death rate to assess the
quality of maternity care provided and take action to address any
problems identified.
Definition The number of deaths within 24 hours of birth per 100 live births
attended in the hospital.
INCLUDE:
All deaths within the first 24 hours of life among babies who were
delivered in the health facility
EXCLUDE:
Deaths among babies who were admitted AFTER delivery
Unit of
measurement %
Numerator Number of deaths within 24 hours of birth among babies born alive in
the hospital (Q36)
Denominator Number of live births attended in the hospital (Q30)
Formula Number of deaths within 24 hours of birth among babies born alive in
the hospital (Q36) ÷ Number of live births attended in the hospital
(Q30) x 100
Data sources Delivery register
Frequency of
reporting Monthly
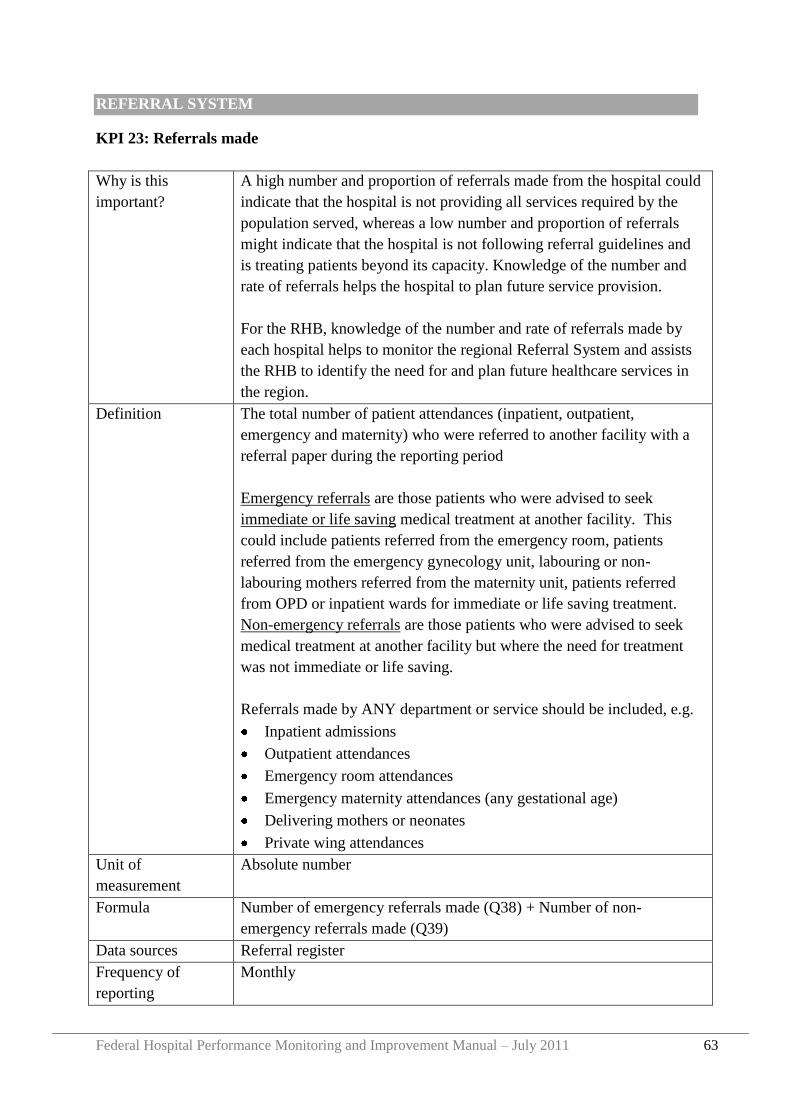
Federal Hospital Performance Monitoring and Improvement Manual – July 2011 63
REFERRAL SYSTEM
KPI 23: Referrals made
Why is this
important?
A high number and proportion of referrals made from the hospital could
indicate that the hospital is not providing all services required by the
population served, whereas a low number and proportion of referrals
might indicate that the hospital is not following referral guidelines and
is treating patients beyond its capacity. Knowledge of the number and
rate of referrals helps the hospital to plan future service provision.
For the RHB, knowledge of the number and rate of referrals made by
each hospital helps to monitor the regional Referral System and assists
the RHB to identify the need for and plan future healthcare services in
the region.
Definition The total number of patient attendances (inpatient, outpatient,
emergency and maternity) who were referred to another facility with a
referral paper during the reporting period
Emergency referrals are those patients who were advised to seek
immediate or life saving medical treatment at another facility. This
could include patients referred from the emergency room, patients
referred from the emergency gynecology unit, labouring or non-
labouring mothers referred from the maternity unit, patients referred
from OPD or inpatient wards for immediate or life saving treatment.
Non-emergency referrals are those patients who were advised to seek
medical treatment at another facility but where the need for treatment
was not immediate or life saving.
Referrals made by ANY department or service should be included, e.g.
Inpatient admissions
Outpatient attendances
Emergency room attendances
Emergency maternity attendances (any gestational age)
Delivering mothers or neonates
Private wing attendances
Unit of
measurement
Absolute number
Formula Number of emergency referrals made (Q38) + Number of non-
emergency referrals made (Q39)
Data sources Referral register
Frequency of
reporting
Monthly
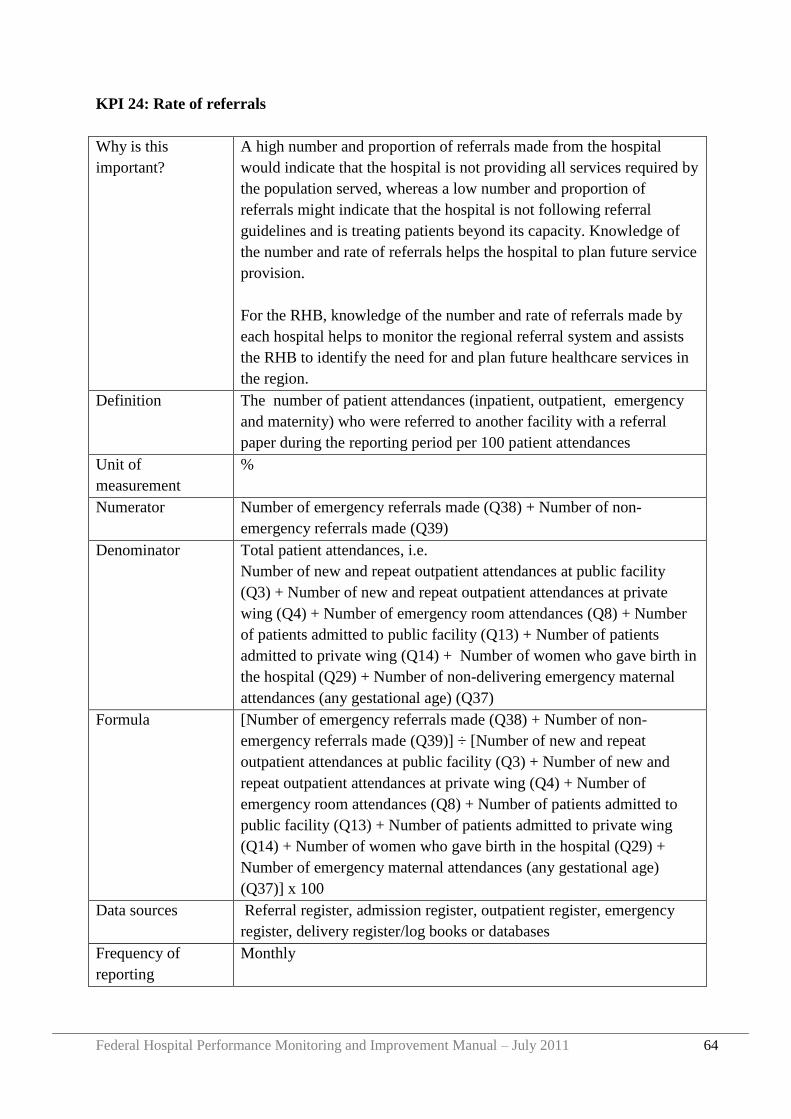
Federal Hospital Performance Monitoring and Improvement Manual – July 2011 64
KPI 24: Rate of referrals
Why is this
important?
A high number and proportion of referrals made from the hospital
would indicate that the hospital is not providing all services required by
the population served, whereas a low number and proportion of
referrals might indicate that the hospital is not following referral
guidelines and is treating patients beyond its capacity. Knowledge of
the number and rate of referrals helps the hospital to plan future service
provision.
For the RHB, knowledge of the number and rate of referrals made by
each hospital helps to monitor the regional referral system and assists
the RHB to identify the need for and plan future healthcare services in
the region.
Definition The number of patient attendances (inpatient, outpatient, emergency
and maternity) who were referred to another facility with a referral
paper during the reporting period per 100 patient attendances
Unit of
measurement
%
Numerator Number of emergency referrals made (Q38) + Number of non-
emergency referrals made (Q39)
Denominator Total patient attendances, i.e.
Number of new and repeat outpatient attendances at public facility
(Q3) + Number of new and repeat outpatient attendances at private
wing (Q4) + Number of emergency room attendances (Q8) + Number
of patients admitted to public facility (Q13) + Number of patients
admitted to private wing (Q14) + Number of women who gave birth in
the hospital (Q29) + Number of non-delivering emergency maternal
attendances (any gestational age) (Q37)
Formula [Number of emergency referrals made (Q38) + Number of non-
emergency referrals made (Q39)] ÷ [Number of new and repeat
outpatient attendances at public facility (Q3) + Number of new and
repeat outpatient attendances at private wing (Q4) + Number of
emergency room attendances (Q8) + Number of patients admitted to
public facility (Q13) + Number of patients admitted to private wing
(Q14) + Number of women who gave birth in the hospital (Q29) +
Number of emergency maternal attendances (any gestational age)
(Q37)] x 100
Data sources Referral register, admission register, outpatient register, emergency
register, delivery register/log books or databases
Frequency of
reporting
Monthly
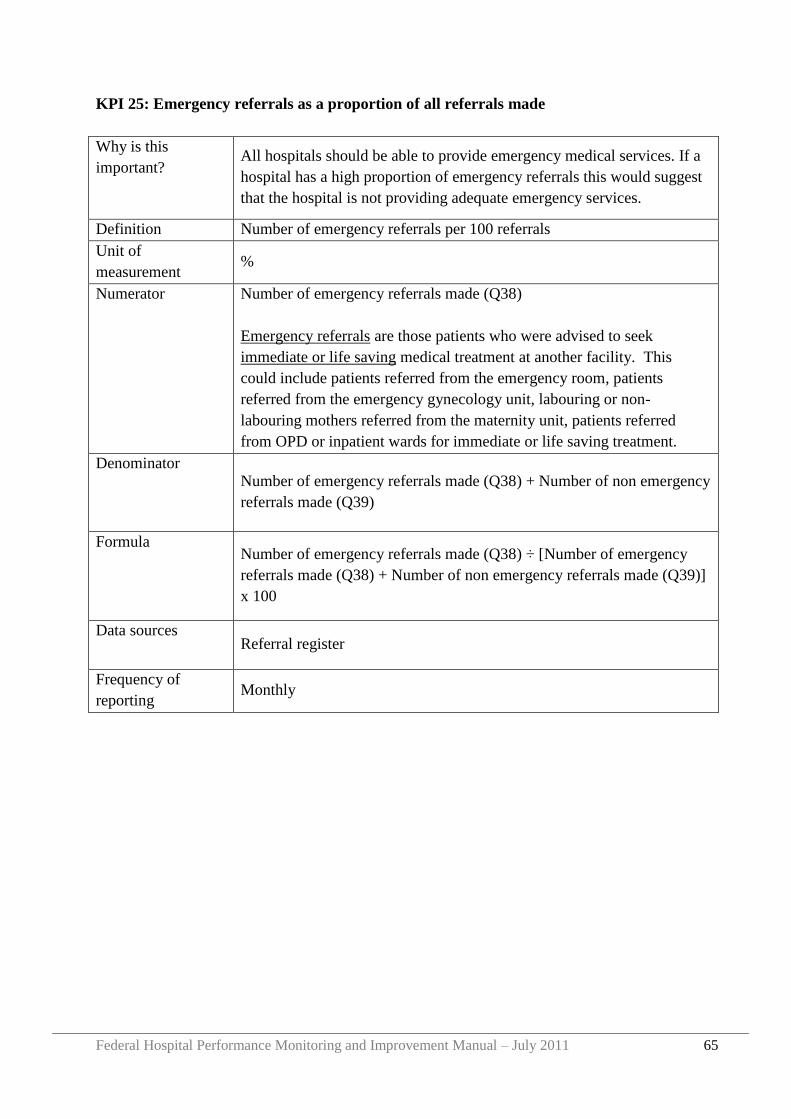
Federal Hospital Performance Monitoring and Improvement Manual – July 2011 65
KPI 25: Emergency referrals as a proportion of all referrals made
Why is this
important? All hospitals should be able to provide emergency medical services. If a
hospital has a high proportion of emergency referrals this would suggest
that the hospital is not providing adequate emergency services.
Definition Number of emergency referrals per 100 referrals
Unit of
measurement %
Numerator Number of emergency referrals made (Q38)
Emergency referrals are those patients who were advised to seek
immediate or life saving medical treatment at another facility. This
could include patients referred from the emergency room, patients
referred from the emergency gynecology unit, labouring or non-
labouring mothers referred from the maternity unit, patients referred
from OPD or inpatient wards for immediate or life saving treatment.
Denominator Number of emergency referrals made (Q38) + Number of non emergency
referrals made (Q39)
Formula Number of emergency referrals made (Q38) ÷ [Number of emergency
referrals made (Q38) + Number of non emergency referrals made (Q39)]
x 100
Data sources Referral register
Frequency of
reporting Monthly
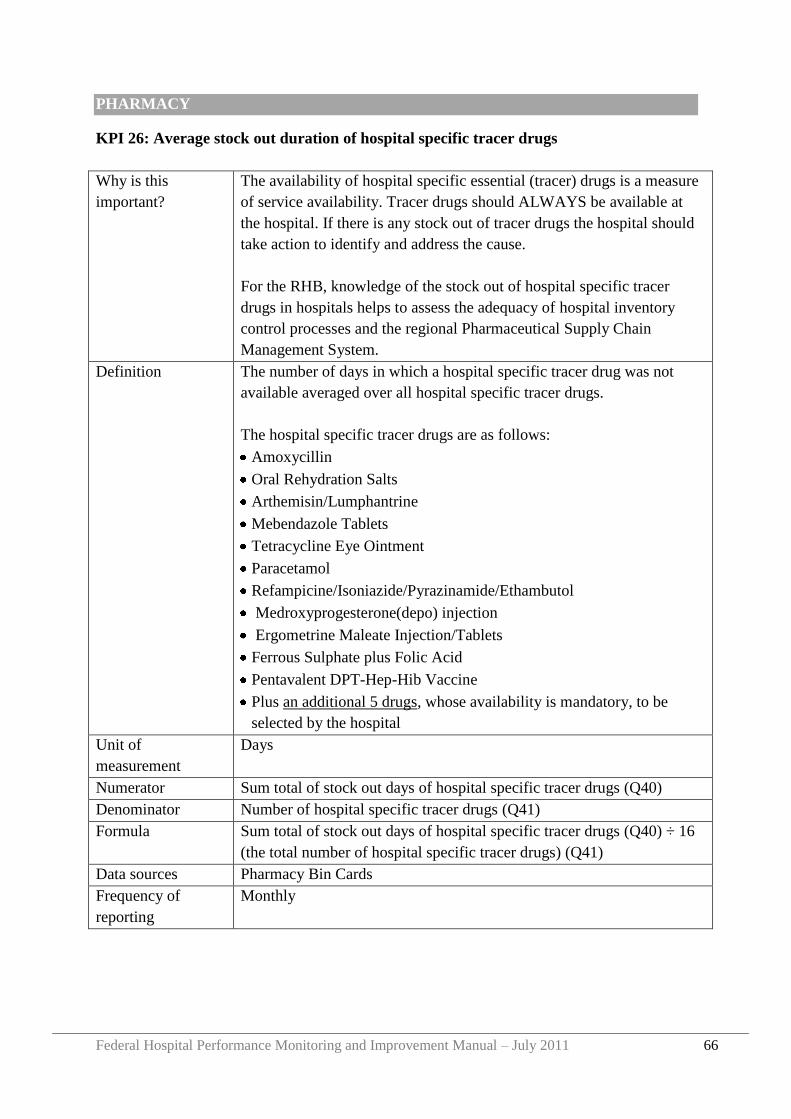
Federal Hospital Performance Monitoring and Improvement Manual – July 2011 66
PHARMACY
KPI 26: Average stock out duration of hospital specific tracer drugs
Why is this
important?
The availability of hospital specific essential (tracer) drugs is a measure
of service availability. Tracer drugs should ALWAYS be available at
the hospital. If there is any stock out of tracer drugs the hospital should
take action to identify and address the cause.
For the RHB, knowledge of the stock out of hospital specific tracer
drugs in hospitals helps to assess the adequacy of hospital inventory
control processes and the regional Pharmaceutical Supply Chain
Management System.
Definition The number of days in which a hospital specific tracer drug was not
available averaged over all hospital specific tracer drugs.
The hospital specific tracer drugs are as follows:
Amoxycillin
Oral Rehydration Salts
Arthemisin/Lumphantrine
Mebendazole Tablets
Tetracycline Eye Ointment
Paracetamol
Refampicine/Isoniazide/Pyrazinamide/Ethambutol
Medroxyprogesterone(depo) injection
Ergometrine Maleate Injection/Tablets
Ferrous Sulphate plus Folic Acid
Pentavalent DPT-Hep-Hib Vaccine
Plus an additional 5 drugs, whose availability is mandatory, to be
selected by the hospital
Unit of
measurement
Days
Numerator Sum total of stock out days of hospital specific tracer drugs (Q40)
Denominator Number of hospital specific tracer drugs (Q41)
Formula Sum total of stock out days of hospital specific tracer drugs (Q40) ÷ 16
(the total number of hospital specific tracer drugs) (Q41)
Data sources Pharmacy Bin Cards
Frequency of
reporting
Monthly
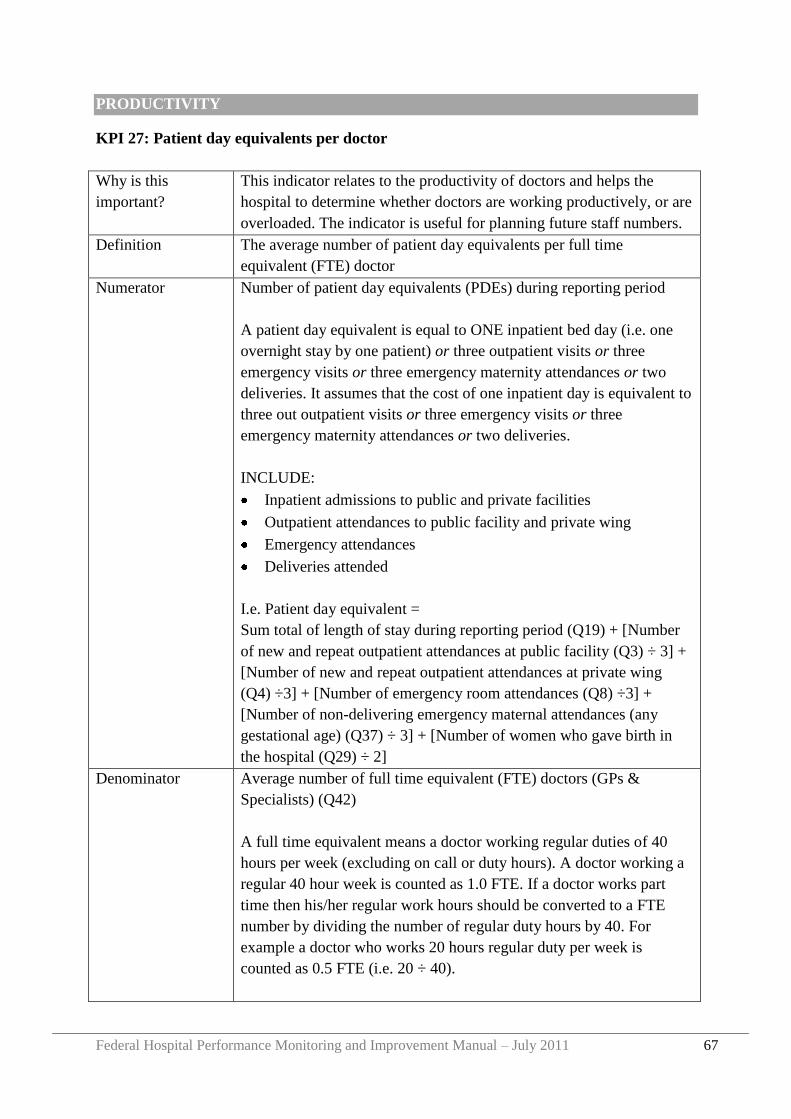
Federal Hospital Performance Monitoring and Improvement Manual – July 2011 67
PRODUCTIVITY
KPI 27: Patient day equivalents per doctor
Why is this
important?
This indicator relates to the productivity of doctors and helps the
hospital to determine whether doctors are working productively, or are
overloaded. The indicator is useful for planning future staff numbers.
Definition The average number of patient day equivalents per full time
equivalent (FTE) doctor
Numerator Number of patient day equivalents (PDEs) during reporting period
A patient day equivalent is equal to ONE inpatient bed day (i.e. one
overnight stay by one patient) or three outpatient visits or three
emergency visits or three emergency maternity attendances or two
deliveries. It assumes that the cost of one inpatient day is equivalent to
three out outpatient visits or three emergency visits or three
emergency maternity attendances or two deliveries.
INCLUDE:
Inpatient admissions to public and private facilities
Outpatient attendances to public facility and private wing
Emergency attendances
Deliveries attended
I.e. Patient day equivalent =
Sum total of length of stay during reporting period (Q19) + [Number
of new and repeat outpatient attendances at public facility (Q3) ÷ 3] +
[Number of new and repeat outpatient attendances at private wing
(Q4) ÷3] + [Number of emergency room attendances (Q8) ÷3] +
[Number of non-delivering emergency maternal attendances (any
gestational age) (Q37) ÷ 3] + [Number of women who gave birth in
the hospital (Q29) ÷ 2]
Denominator Average number of full time equivalent (FTE) doctors (GPs &
Specialists) (Q42)
A full time equivalent means a doctor working regular duties of 40
hours per week (excluding on call or duty hours). A doctor working a
regular 40 hour week is counted as 1.0 FTE. If a doctor works part
time then his/her regular work hours should be converted to a FTE
number by dividing the number of regular duty hours by 40. For
example a doctor who works 20 hours regular duty per week is
counted as 0.5 FTE (i.e. 20 ÷ 40).
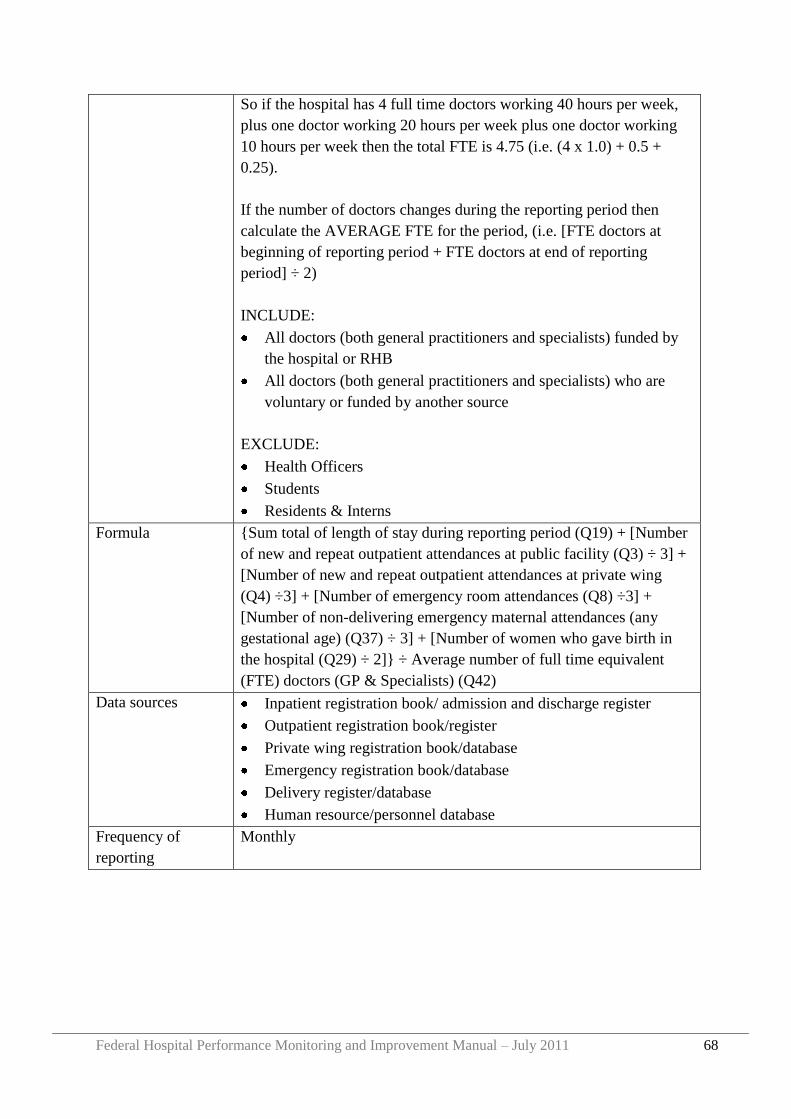
Federal Hospital Performance Monitoring and Improvement Manual – July 2011 68
So if the hospital has 4 full time doctors working 40 hours per week,
plus one doctor working 20 hours per week plus one doctor working
10 hours per week then the total FTE is 4.75 (i.e. (4 x 1.0) + 0.5 +
0.25).
If the number of doctors changes during the reporting period then
calculate the AVERAGE FTE for the period, (i.e. [FTE doctors at
beginning of reporting period + FTE doctors at end of reporting
period] ÷ 2)
INCLUDE:
All doctors (both general practitioners and specialists) funded by
the hospital or RHB
All doctors (both general practitioners and specialists) who are
voluntary or funded by another source
EXCLUDE:
Health Officers
Students
Residents & Interns
Formula {Sum total of length of stay during reporting period (Q19) + [Number
of new and repeat outpatient attendances at public facility (Q3) ÷ 3] +
[Number of new and repeat outpatient attendances at private wing
(Q4) ÷3] + [Number of emergency room attendances (Q8) ÷3] +
[Number of non-delivering emergency maternal attendances (any
gestational age) (Q37) ÷ 3] + [Number of women who gave birth in
the hospital (Q29) ÷ 2]} ÷ Average number of full time equivalent
(FTE) doctors (GP & Specialists) (Q42)
Data sources Inpatient registration book/ admission and discharge register
Outpatient registration book/register
Private wing registration book/database
Emergency registration book/database
Delivery register/database
Human resource/personnel database
Frequency of
reporting
Monthly
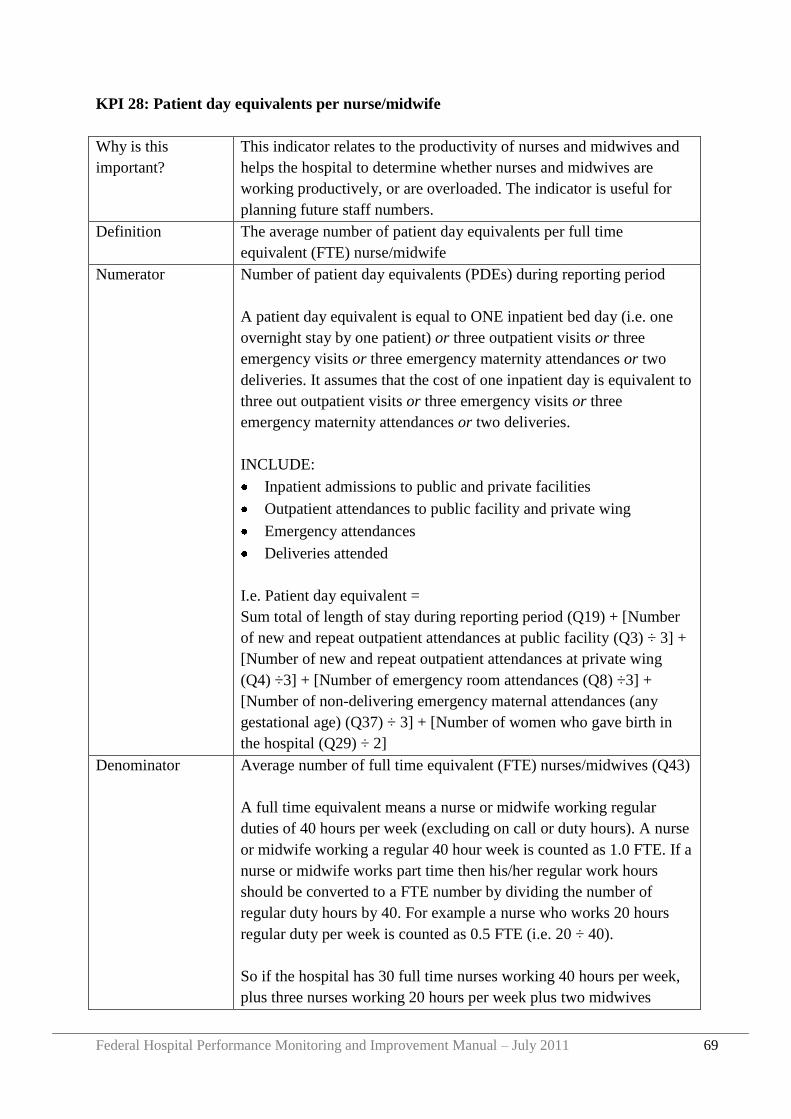
Federal Hospital Performance Monitoring and Improvement Manual – July 2011 69
KPI 28: Patient day equivalents per nurse/midwife
Why is this
important?
This indicator relates to the productivity of nurses and midwives and
helps the hospital to determine whether nurses and midwives are
working productively, or are overloaded. The indicator is useful for
planning future staff numbers.
Definition The average number of patient day equivalents per full time
equivalent (FTE) nurse/midwife
Numerator Number of patient day equivalents (PDEs) during reporting period
A patient day equivalent is equal to ONE inpatient bed day (i.e. one
overnight stay by one patient) or three outpatient visits or three
emergency visits or three emergency maternity attendances or two
deliveries. It assumes that the cost of one inpatient day is equivalent to
three out outpatient visits or three emergency visits or three
emergency maternity attendances or two deliveries.
INCLUDE:
Inpatient admissions to public and private facilities
Outpatient attendances to public facility and private wing
Emergency attendances
Deliveries attended
I.e. Patient day equivalent =
Sum total of length of stay during reporting period (Q19) + [Number
of new and repeat outpatient attendances at public facility (Q3) ÷ 3] +
[Number of new and repeat outpatient attendances at private wing
(Q4) ÷3] + [Number of emergency room attendances (Q8) ÷3] +
[Number of non-delivering emergency maternal attendances (any
gestational age) (Q37) ÷ 3] + [Number of women who gave birth in
the hospital (Q29) ÷ 2]
Denominator Average number of full time equivalent (FTE) nurses/midwives (Q43)
A full time equivalent means a nurse or midwife working regular
duties of 40 hours per week (excluding on call or duty hours). A nurse
or midwife working a regular 40 hour week is counted as 1.0 FTE. If a
nurse or midwife works part time then his/her regular work hours
should be converted to a FTE number by dividing the number of
regular duty hours by 40. For example a nurse who works 20 hours
regular duty per week is counted as 0.5 FTE (i.e. 20 ÷ 40).
So if the hospital has 30 full time nurses working 40 hours per week,
plus three nurses working 20 hours per week plus two midwives
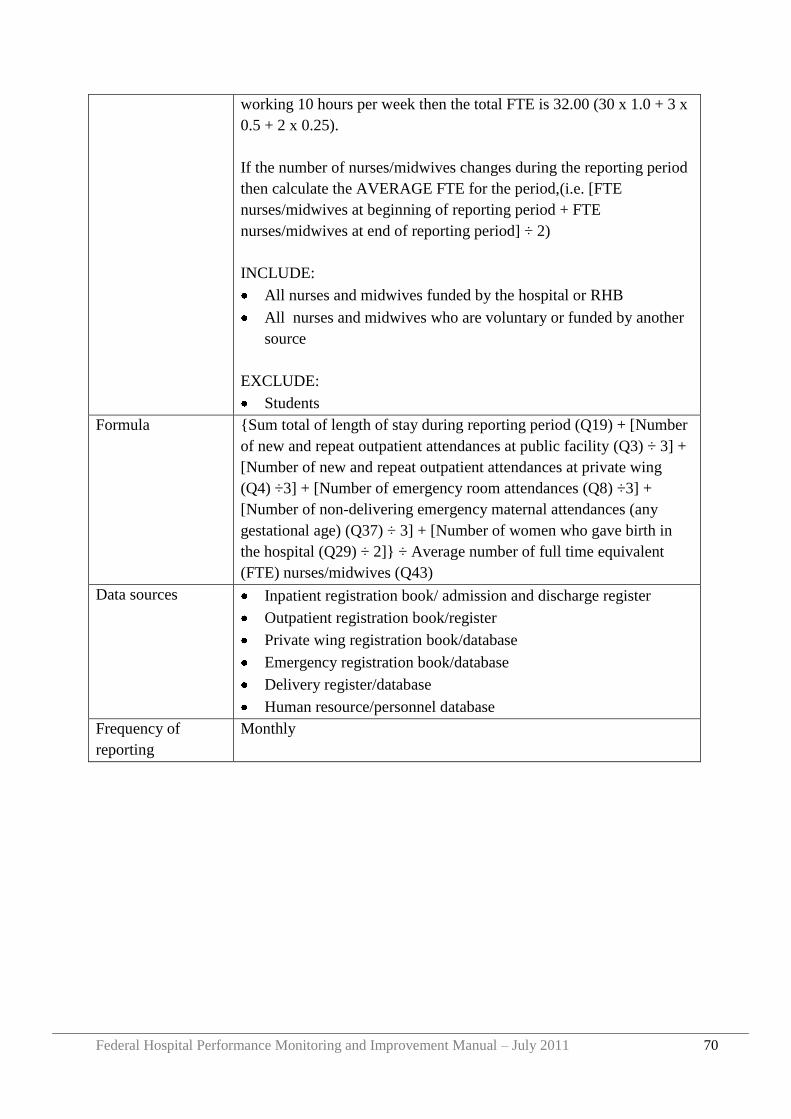
Federal Hospital Performance Monitoring and Improvement Manual – July 2011 70
working 10 hours per week then the total FTE is 32.00 (30 x 1.0 + 3 x
0.5 + 2 x 0.25).
If the number of nurses/midwives changes during the reporting period
then calculate the AVERAGE FTE for the period,(i.e. [FTE
nurses/midwives at beginning of reporting period + FTE
nurses/midwives at end of reporting period] ÷ 2)
INCLUDE:
All nurses and midwives funded by the hospital or RHB
All nurses and midwives who are voluntary or funded by another
source
EXCLUDE:
Students
Formula {Sum total of length of stay during reporting period (Q19) + [Number
of new and repeat outpatient attendances at public facility (Q3) ÷ 3] +
[Number of new and repeat outpatient attendances at private wing
(Q4) ÷3] + [Number of emergency room attendances (Q8) ÷3] +
[Number of non-delivering emergency maternal attendances (any
gestational age) (Q37) ÷ 3] + [Number of women who gave birth in
the hospital (Q29) ÷ 2]} ÷ Average number of full time equivalent
(FTE) nurses/midwives (Q43)
Data sources Inpatient registration book/ admission and discharge register
Outpatient registration book/register
Private wing registration book/database
Emergency registration book/database
Delivery register/database
Human resource/personnel database
Frequency of
reporting
Monthly
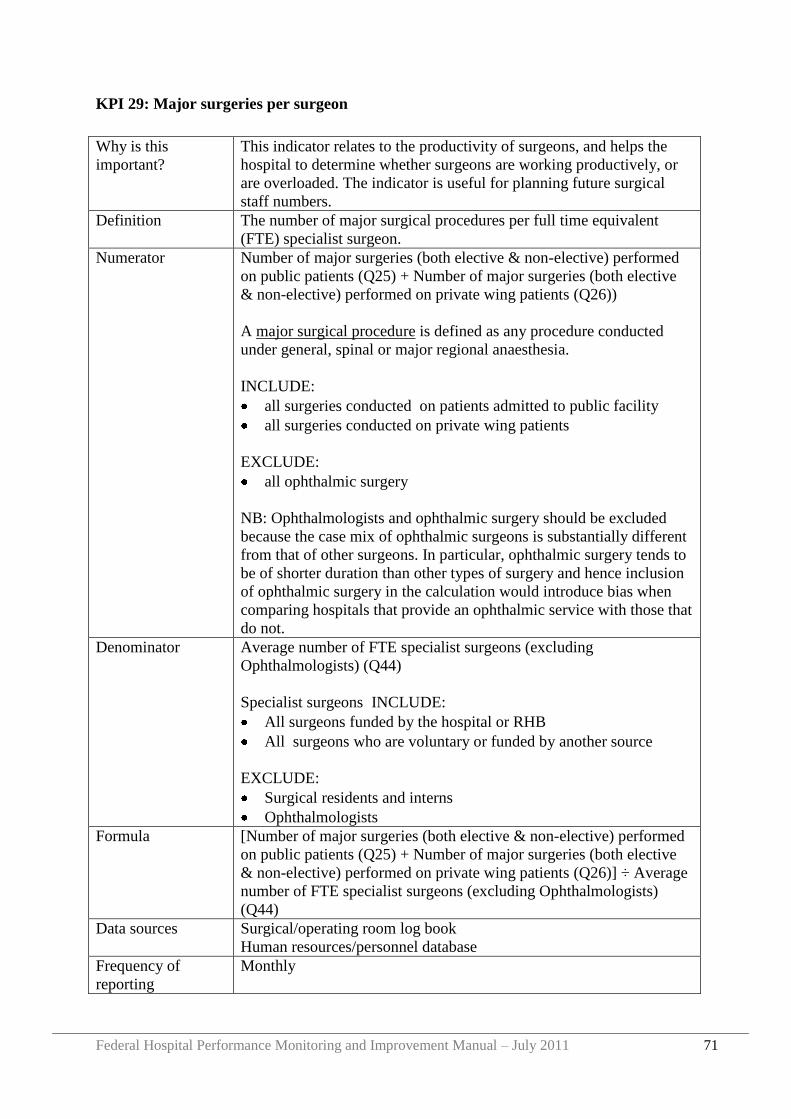
Federal Hospital Performance Monitoring and Improvement Manual – July 2011 71
KPI 29: Major surgeries per surgeon
Why is this
important?
This indicator relates to the productivity of surgeons, and helps the
hospital to determine whether surgeons are working productively, or
are overloaded. The indicator is useful for planning future surgical
staff numbers.
Definition The number of major surgical procedures per full time equivalent
(FTE) specialist surgeon.
Numerator Number of major surgeries (both elective & non-elective) performed
on public patients (Q25) + Number of major surgeries (both elective
& non-elective) performed on private wing patients (Q26))
A major surgical procedure is defined as any procedure conducted
under general, spinal or major regional anaesthesia.
INCLUDE:
all surgeries conducted on patients admitted to public facility
all surgeries conducted on private wing patients
EXCLUDE:
all ophthalmic surgery
NB: Ophthalmologists and ophthalmic surgery should be excluded
because the case mix of ophthalmic surgeons is substantially different
from that of other surgeons. In particular, ophthalmic surgery tends to
be of shorter duration than other types of surgery and hence inclusion
of ophthalmic surgery in the calculation would introduce bias when
comparing hospitals that provide an ophthalmic service with those that
do not.
Denominator Average number of FTE specialist surgeons (excluding
Ophthalmologists) (Q44)
Specialist surgeons INCLUDE:
All surgeons funded by the hospital or RHB
All surgeons who are voluntary or funded by another source
EXCLUDE:
Surgical residents and interns
Ophthalmologists
Formula [Number of major surgeries (both elective & non-elective) performed
on public patients (Q25) + Number of major surgeries (both elective
& non-elective) performed on private wing patients (Q26)] ÷ Average
number of FTE specialist surgeons (excluding Ophthalmologists)
(Q44)
Data sources Surgical/operating room log book
Human resources/personnel database
Frequency of
reporting
Monthly
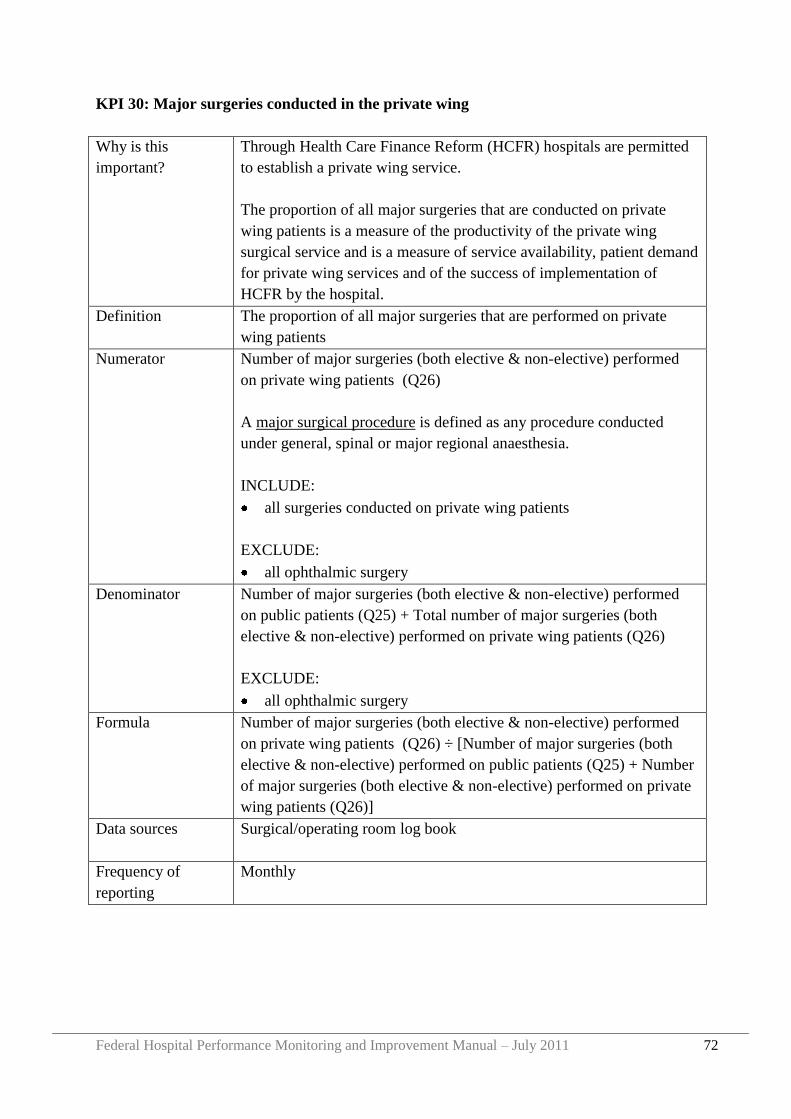
Federal Hospital Performance Monitoring and Improvement Manual – July 2011 72
KPI 30: Major surgeries conducted in the private wing
Why is this
important?
Through Health Care Finance Reform (HCFR) hospitals are permitted
to establish a private wing service.
The proportion of all major surgeries that are conducted on private
wing patients is a measure of the productivity of the private wing
surgical service and is a measure of service availability, patient demand
for private wing services and of the success of implementation of
HCFR by the hospital.
Definition The proportion of all major surgeries that are performed on private
wing patients
Numerator Number of major surgeries (both elective & non-elective) performed
on private wing patients (Q26)
A major surgical procedure is defined as any procedure conducted
under general, spinal or major regional anaesthesia.
INCLUDE:
all surgeries conducted on private wing patients
EXCLUDE:
all ophthalmic surgery
Denominator Number of major surgeries (both elective & non-elective) performed
on public patients (Q25) + Total number of major surgeries (both
elective & non-elective) performed on private wing patients (Q26)
EXCLUDE:
all ophthalmic surgery
Formula Number of major surgeries (both elective & non-elective) performed
on private wing patients (Q26) ÷ [Number of major surgeries (both
elective & non-elective) performed on public patients (Q25) + Number
of major surgeries (both elective & non-elective) performed on private
wing patients (Q26)]
Data sources Surgical/operating room log book
Frequency of
reporting
Monthly
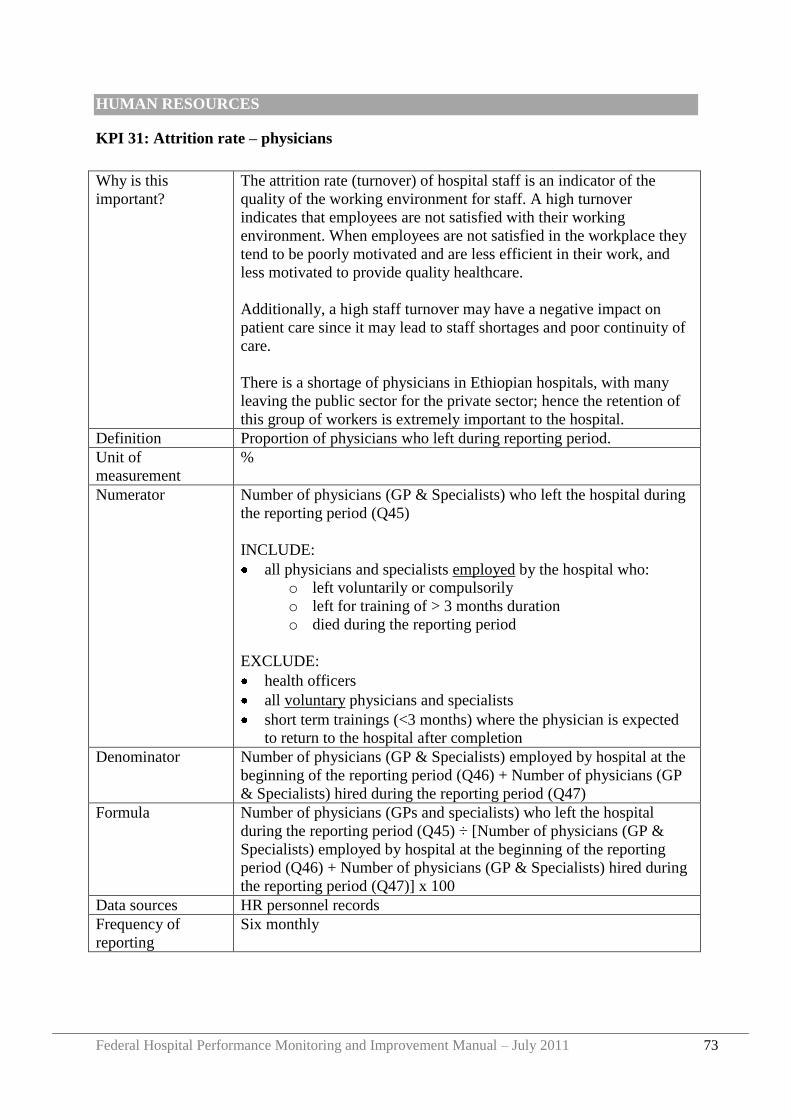
Federal Hospital Performance Monitoring and Improvement Manual – July 2011 73
HUMAN RESOURCES
KPI 31: Attrition rate – physicians
Why is this
important?
The attrition rate (turnover) of hospital staff is an indicator of the
quality of the working environment for staff. A high turnover
indicates that employees are not satisfied with their working
environment. When employees are not satisfied in the workplace they
tend to be poorly motivated and are less efficient in their work, and
less motivated to provide quality healthcare.
Additionally, a high staff turnover may have a negative impact on
patient care since it may lead to staff shortages and poor continuity of
care.
There is a shortage of physicians in Ethiopian hospitals, with many
leaving the public sector for the private sector; hence the retention of
this group of workers is extremely important to the hospital.
Definition Proportion of physicians who left during reporting period.
Unit of
measurement
%
Numerator Number of physicians (GP & Specialists) who left the hospital during
the reporting period (Q45)
INCLUDE:
all physicians and specialists employed by the hospital who:
o left voluntarily or compulsorily
o left for training of > 3 months duration
o died during the reporting period
EXCLUDE:
health officers
all voluntary physicians and specialists
short term trainings (<3 months) where the physician is expected
to return to the hospital after completion
Denominator Number of physicians (GP & Specialists) employed by hospital at the
beginning of the reporting period (Q46) + Number of physicians (GP
& Specialists) hired during the reporting period (Q47)
Formula Number of physicians (GPs and specialists) who left the hospital
during the reporting period (Q45) ÷ [Number of physicians (GP &
Specialists) employed by hospital at the beginning of the reporting
period (Q46) + Number of physicians (GP & Specialists) hired during
the reporting period (Q47)] x 100
Data sources HR personnel records
Frequency of
reporting
Six monthly
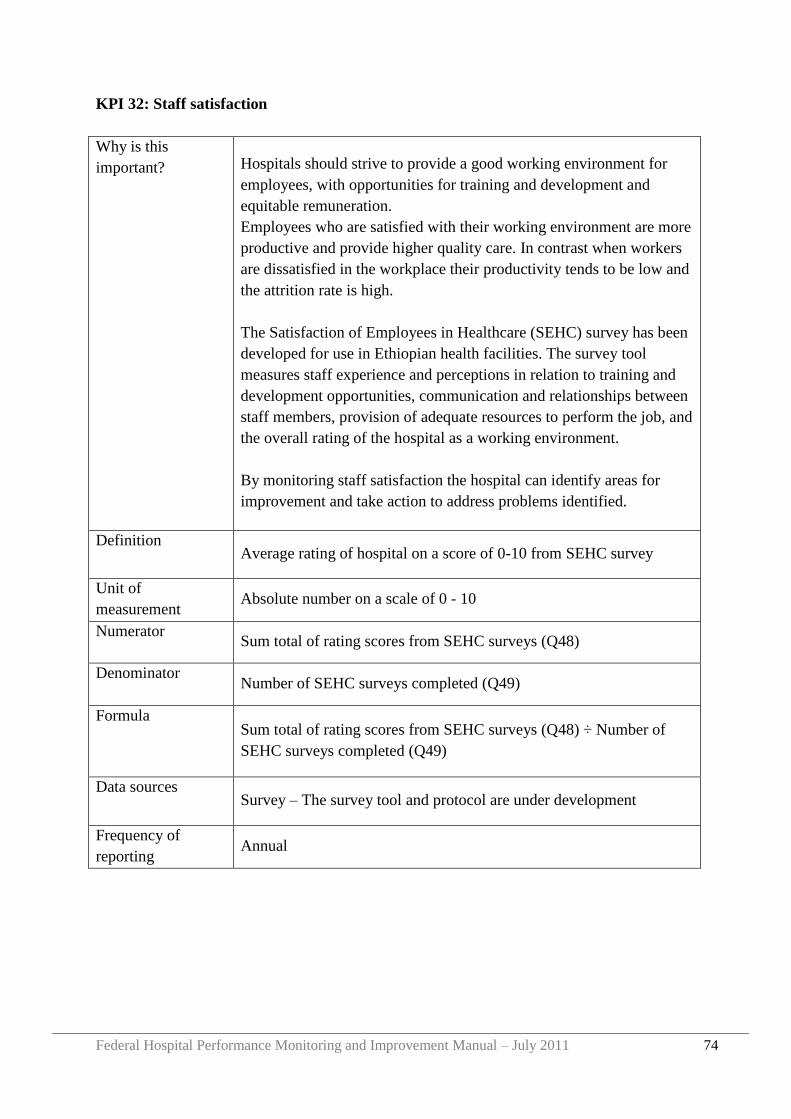
Federal Hospital Performance Monitoring and Improvement Manual – July 2011 74
KPI 32: Staff satisfaction
Why is this
important? Hospitals should strive to provide a good working environment for
employees, with opportunities for training and development and
equitable remuneration.
Employees who are satisfied with their working environment are more
productive and provide higher quality care. In contrast when workers
are dissatisfied in the workplace their productivity tends to be low and
the attrition rate is high.
The Satisfaction of Employees in Healthcare (SEHC) survey has been
developed for use in Ethiopian health facilities. The survey tool
measures staff experience and perceptions in relation to training and
development opportunities, communication and relationships between
staff members, provision of adequate resources to perform the job, and
the overall rating of the hospital as a working environment.
By monitoring staff satisfaction the hospital can identify areas for
improvement and take action to address problems identified.
Definition Average rating of hospital on a score of 0-10 from SEHC survey
Unit of
measurement Absolute number on a scale of 0 - 10
Numerator Sum total of rating scores from SEHC surveys (Q48)
Denominator Number of SEHC surveys completed (Q49)
Formula Sum total of rating scores from SEHC surveys (Q48) ÷ Number of
SEHC surveys completed (Q49)
Data sources Survey – The survey tool and protocol are under development
Frequency of
reporting Annual
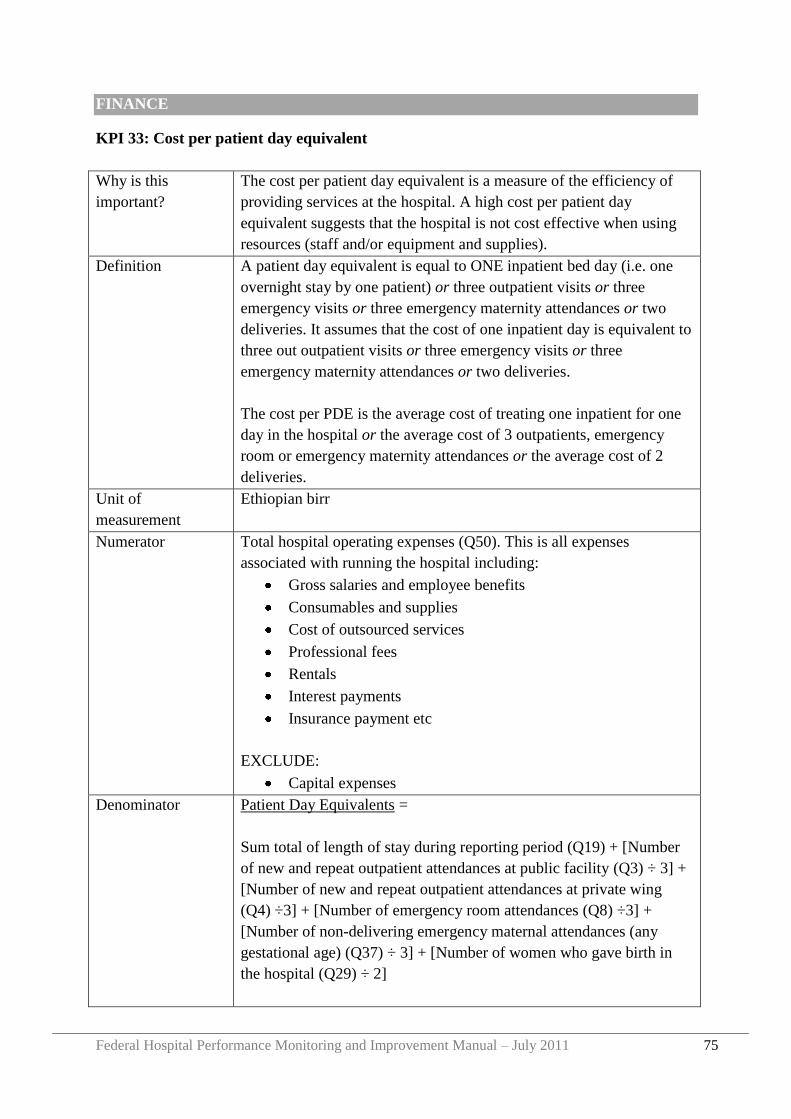
Federal Hospital Performance Monitoring and Improvement Manual – July 2011 75
FINANCE
KPI 33: Cost per patient day equivalent
Why is this
important?
The cost per patient day equivalent is a measure of the efficiency of
providing services at the hospital. A high cost per patient day
equivalent suggests that the hospital is not cost effective when using
resources (staff and/or equipment and supplies).
Definition A patient day equivalent is equal to ONE inpatient bed day (i.e. one
overnight stay by one patient) or three outpatient visits or three
emergency visits or three emergency maternity attendances or two
deliveries. It assumes that the cost of one inpatient day is equivalent to
three out outpatient visits or three emergency visits or three
emergency maternity attendances or two deliveries.
The cost per PDE is the average cost of treating one inpatient for one
day in the hospital or the average cost of 3 outpatients, emergency
room or emergency maternity attendances or the average cost of 2
deliveries.
Unit of
measurement
Ethiopian birr
Numerator Total hospital operating expenses (Q50). This is all expenses
associated with running the hospital including:
Gross salaries and employee benefits
Consumables and supplies
Cost of outsourced services
Professional fees
Rentals
Interest payments
Insurance payment etc
EXCLUDE:
Capital expenses
Denominator Patient Day Equivalents =
Sum total of length of stay during reporting period (Q19) + [Number
of new and repeat outpatient attendances at public facility (Q3) ÷ 3] +
[Number of new and repeat outpatient attendances at private wing
(Q4) ÷3] + [Number of emergency room attendances (Q8) ÷3] +
[Number of non-delivering emergency maternal attendances (any
gestational age) (Q37) ÷ 3] + [Number of women who gave birth in
the hospital (Q29) ÷ 2]
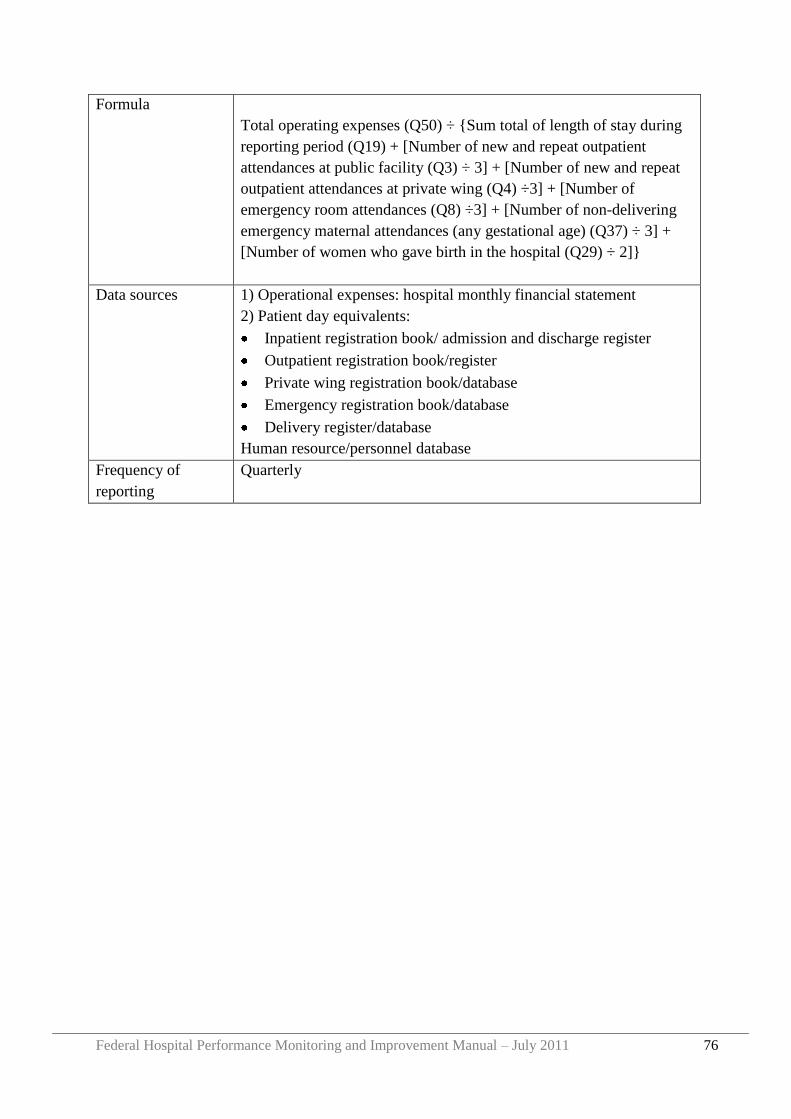
Federal Hospital Performance Monitoring and Improvement Manual – July 2011 76
Formula
Total operating expenses (Q50) ÷ {Sum total of length of stay during
reporting period (Q19) + [Number of new and repeat outpatient
attendances at public facility (Q3) ÷ 3] + [Number of new and repeat
outpatient attendances at private wing (Q4) ÷3] + [Number of
emergency room attendances (Q8) ÷3] + [Number of non-delivering
emergency maternal attendances (any gestational age) (Q37) ÷ 3] +
[Number of women who gave birth in the hospital (Q29) ÷ 2]}
Data sources 1) Operational expenses: hospital monthly financial statement
2) Patient day equivalents:
Inpatient registration book/ admission and discharge register
Outpatient registration book/register
Private wing registration book/database
Emergency registration book/database
Delivery register/database
Human resource/personnel database
Frequency of
reporting
Quarterly
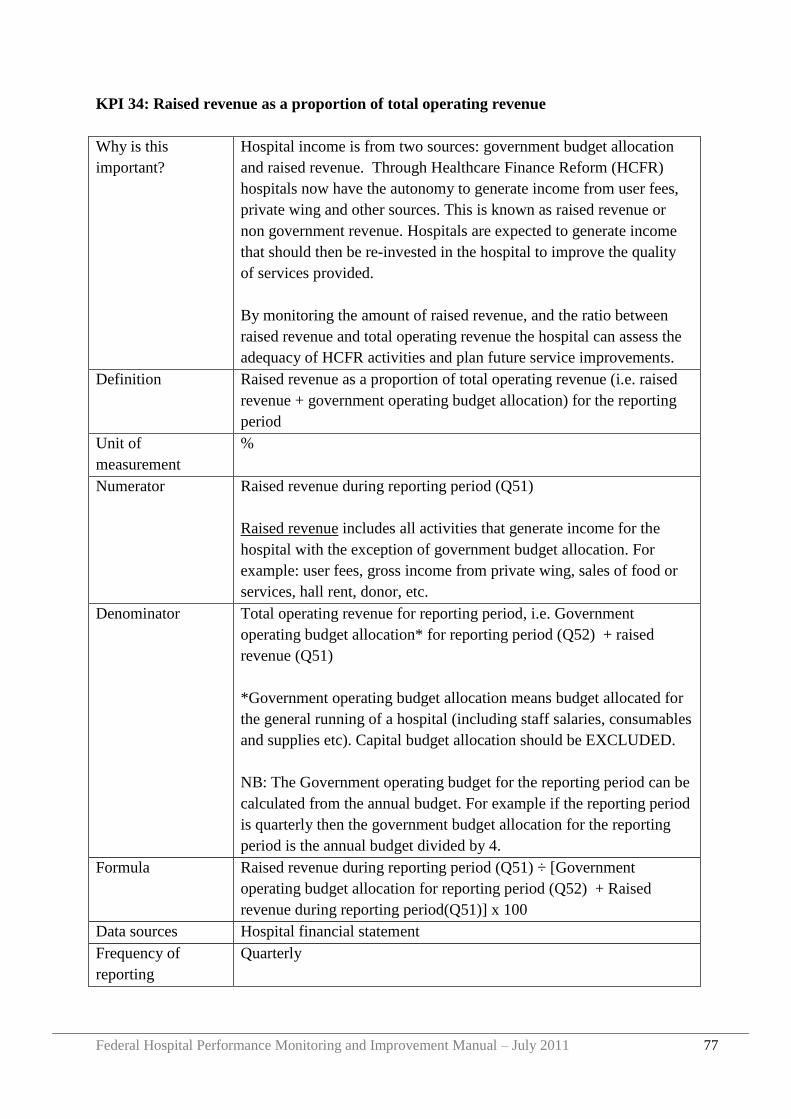
Federal Hospital Performance Monitoring and Improvement Manual – July 2011 77
KPI 34: Raised revenue as a proportion of total operating revenue
Why is this
important?
Hospital income is from two sources: government budget allocation
and raised revenue. Through Healthcare Finance Reform (HCFR)
hospitals now have the autonomy to generate income from user fees,
private wing and other sources. This is known as raised revenue or
non government revenue. Hospitals are expected to generate income
that should then be re-invested in the hospital to improve the quality
of services provided.
By monitoring the amount of raised revenue, and the ratio between
raised revenue and total operating revenue the hospital can assess the
adequacy of HCFR activities and plan future service improvements.
Definition Raised revenue as a proportion of total operating revenue (i.e. raised
revenue + government operating budget allocation) for the reporting
period
Unit of
measurement
%
Numerator Raised revenue during reporting period (Q51)
Raised revenue includes all activities that generate income for the
hospital with the exception of government budget allocation. For
example: user fees, gross income from private wing, sales of food or
services, hall rent, donor, etc.
Denominator Total operating revenue for reporting period, i.e. Government
operating budget allocation* for reporting period (Q52) + raised
revenue (Q51)
*Government operating budget allocation means budget allocated for
the general running of a hospital (including staff salaries, consumables
and supplies etc). Capital budget allocation should be EXCLUDED.
NB: The Government operating budget for the reporting period can be
calculated from the annual budget. For example if the reporting period
is quarterly then the government budget allocation for the reporting
period is the annual budget divided by 4.
Formula Raised revenue during reporting period (Q51) ÷ [Government
operating budget allocation for reporting period (Q52) + Raised
revenue during reporting period(Q51)] x 100
Data sources Hospital financial statement
Frequency of
reporting
Quarterly
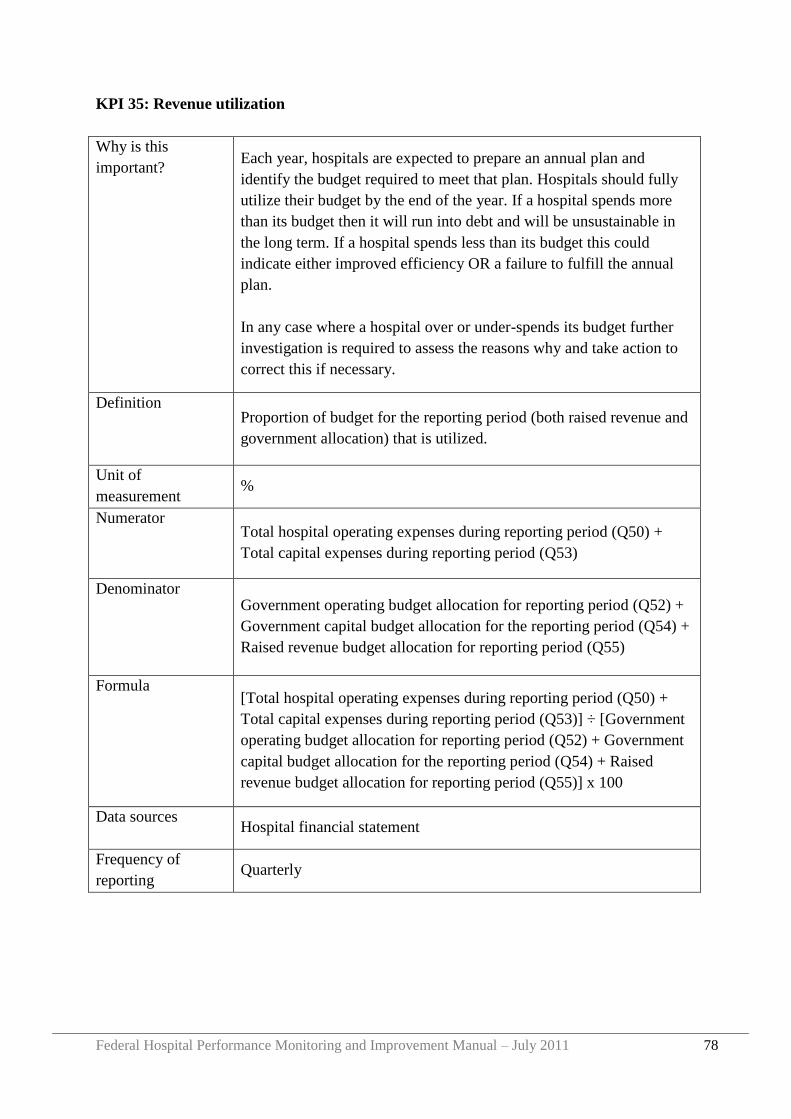
Federal Hospital Performance Monitoring and Improvement Manual – July 2011 78
KPI 35: Revenue utilization
Why is this
important? Each year, hospitals are expected to prepare an annual plan and
identify the budget required to meet that plan. Hospitals should fully
utilize their budget by the end of the year. If a hospital spends more
than its budget then it will run into debt and will be unsustainable in
the long term. If a hospital spends less than its budget this could
indicate either improved efficiency OR a failure to fulfill the annual
plan.
In any case where a hospital over or under-spends its budget further
investigation is required to assess the reasons why and take action to
correct this if necessary.
Definition Proportion of budget for the reporting period (both raised revenue and
government allocation) that is utilized.
Unit of
measurement %
Numerator Total hospital operating expenses during reporting period (Q50) +
Total capital expenses during reporting period (Q53)
Denominator Government operating budget allocation for reporting period (Q52) +
Government capital budget allocation for the reporting period (Q54) +
Raised revenue budget allocation for reporting period (Q55)
Formula [Total hospital operating expenses during reporting period (Q50) +
Total capital expenses during reporting period (Q53)] ÷ [Government
operating budget allocation for reporting period (Q52) + Government
capital budget allocation for the reporting period (Q54) + Raised
revenue budget allocation for reporting period (Q55)] x 100
Data sources Hospital financial statement
Frequency of
reporting Quarterly
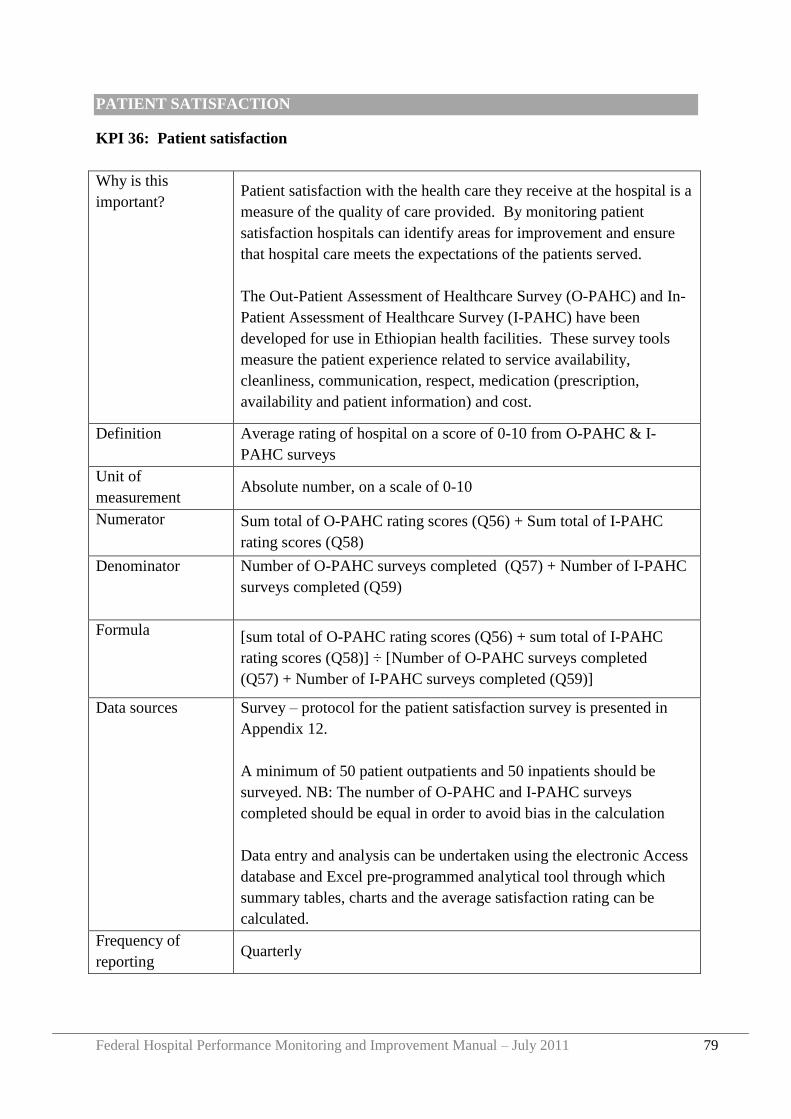
Federal Hospital Performance Monitoring and Improvement Manual – July 2011 79
PATIENT SATISFACTION
KPI 36: Patient satisfaction
Why is this
important? Patient satisfaction with the health care they receive at the hospital is a
measure of the quality of care provided. By monitoring patient
satisfaction hospitals can identify areas for improvement and ensure
that hospital care meets the expectations of the patients served.
The Out-Patient Assessment of Healthcare Survey (O-PAHC) and In-
Patient Assessment of Healthcare Survey (I-PAHC) have been
developed for use in Ethiopian health facilities. These survey tools
measure the patient experience related to service availability,
cleanliness, communication, respect, medication (prescription,
availability and patient information) and cost.
Definition Average rating of hospital on a score of 0-10 from O-PAHC & I-
PAHC surveys
Unit of
measurement Absolute number, on a scale of 0-10
Numerator Sum total of O-PAHC rating scores (Q56) + Sum total of I-PAHC
rating scores (Q58)
Denominator Number of O-PAHC surveys completed (Q57) + Number of I-PAHC
surveys completed (Q59)
Formula [sum total of O-PAHC rating scores (Q56) + sum total of I-PAHC
rating scores (Q58)] ÷ [Number of O-PAHC surveys completed
(Q57) + Number of I-PAHC surveys completed (Q59)]
Data sources Survey – protocol for the patient satisfaction survey is presented in
Appendix 12.
A minimum of 50 patient outpatients and 50 inpatients should be
surveyed. NB: The number of O-PAHC and I-PAHC surveys
completed should be equal in order to avoid bias in the calculation
Data entry and analysis can be undertaken using the electronic Access
database and Excel pre-programmed analytical tool through which
summary tables, charts and the average satisfaction rating can be
calculated.
Frequency of
reporting Quarterly

Federal Hospital Performance Monitoring and Improvement Manual – July 2011 80
Federal Hospital Performance Monitoring and Improvement Manual – July 2011 81
Section 5 Hospital Supportive Supervision Site Visits
5.1 Purpose of hospital supportive supervision site visits
The purpose of a hospital supportive supervision site visit is:
To provide guidance and technical assistance to improve hospital performance
To assure the RHB that KPI and any other performance data reported by the hospital
to the RHB is accurate
To identify, recognize and learn from good practice, which can then be shared with
other hospitals
To identify areas for improvement
To identify areas where additional support from the RHB or other partners is required,
and to plan with the hospital for the provision of that support
These are common to all site visits conducted by the RHB but there may be additional
reasons for site visits. For example, the site visit could be conducted collaboratively with
Faculty from the Masters in Hospital and Healthcare Administration Program (MHA) and
have an additional aim to assess „on site‟ the performance of a hospital CEO who is
participating in the MHA, or the site visit could be conducted with a partner NGO to assess a
specific area where the partner has provided direct assistance to the hospital.
The purpose of the site visit and specific areas of focus should always be agreed by the site
visit team and should be informed to the hospital in advance of the visit taking place (see
Section 5.4 below).
5.2 Overview of the supportive supervision site visit process
Step 1 Selection of the site visit team
Step 2 Pre-visit preparation
Step 3 The site visit
Step 4 Post-visit report and follow up
A timeline for each of the above steps is presented in Figure 10 followed by detailed
descriptions of each step.
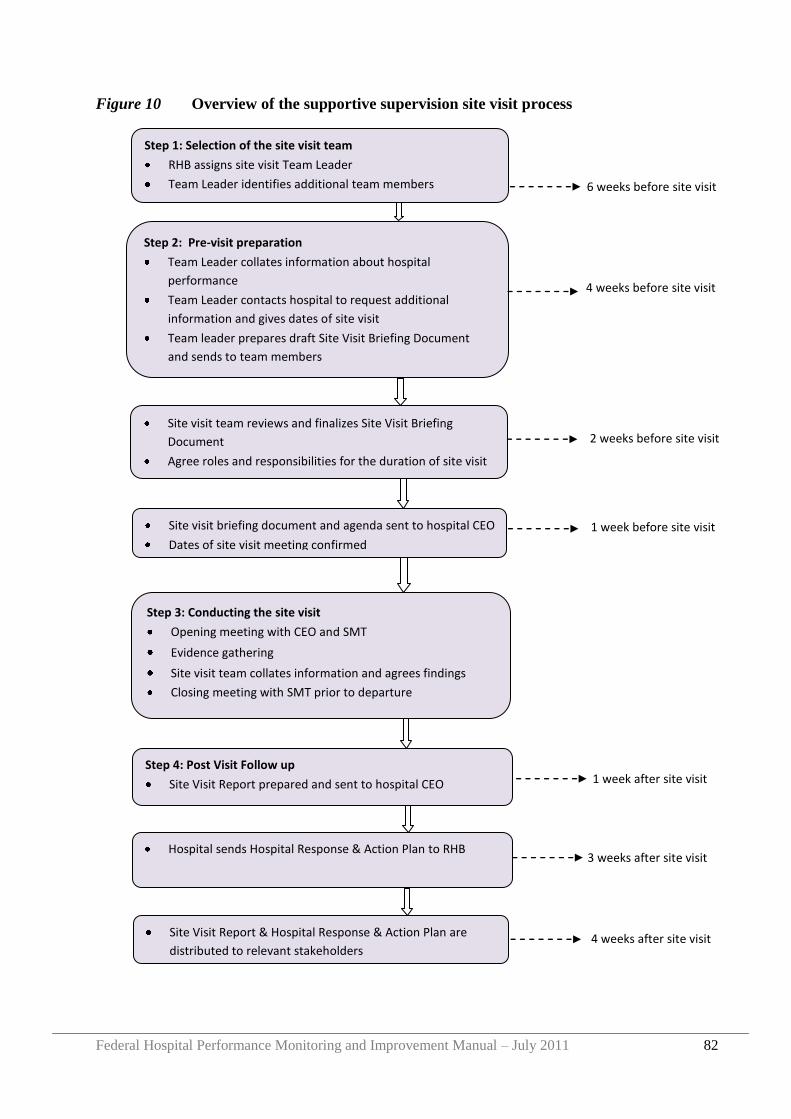
Federal Hospital Performance Monitoring and Improvement Manual – July 2011 82
Figure 10 Overview of the supportive supervision site visit process
Step 1: Selection of the site visit team
RHB assigns site visit Team Leader
Team Leader identifies additional team members
Step 2: Pre-visit preparation
Team Leader collates information about hospital
performance
Team Leader contacts hospital to request additional
information and gives dates of site visit
Team leader prepares draft Site Visit Briefing Document
and sends to team members
Site visit team reviews and finalizes Site Visit Briefing
Document
Agree roles and responsibilities for the duration of site visit
agreed
site visit agenda finalized
Site visit briefing document and agenda sent to hospital CEO
Dates of site visit meeting confirmed
Step 3: Conducting the site visit
Opening meeting with CEO and SMT
Evidence gathering
Site visit team collates information and agrees findings
Closing meeting with SMT prior to departure
Step 4: Post Visit Follow up
Site Visit Report prepared and sent to hospital CEO
Hospital sends Hospital Response & Action Plan to RHB
4 weeks before site visit
2 weeks before site visit
1 week before site visit
1 week after site visit
3 weeks after site visit
Site Visit Report & Hospital Response & Action Plan are
distributed to relevant stakeholders
6 weeks before site visit
4 weeks after site visit
Federal Hospital Performance Monitoring and Improvement Manual – July 2011 83
5.3 Selection of the site visit team
The first step in the site visit process is to determine membership of the site visit team.
The site visit should be led and coordinated by the RHB in collaboration with other partners
as relevant. Potential participants include FMOH staff, staff from other hospitals (e.g. a
respected hospital CEO), CHAI EHMI staff, MHA Faculty or others.
A minimum of three individuals should conduct the site visit. This will allow each person to
carry out specific functions during the site visit and minimize the time required at the
hospital.
A team leader should be assigned by the RHB to oversee the site visit process. The roles of
the team leader include:
To establish membership of the site visit team
To prepare the site visit briefing document
To co-ordinate the site visit process, following the steps outlined below
To ensure communication between site visit team members both before and after the
site visit is conducted
To communicate with the hospital CEO both before and after the site visit
To prepare the site visit report and distribute to relevant stakeholders (e.g. RHB Head,
Hospital CEO and GB Chair, site visit team members).
To ensure the hospital provides a written response to the site visit report. To follow up
on any action described in the site visit report or the hospital response
To ensure the site visit report and the hospital response are maintained on file by the
RHB
To establish the date or timeline within which the next hospital site visit should be
conducted
5.4 Pre-visit preparation for a site visit
The success of a site visit is dependent on adequate planning and preparation by both the site
visit team and hospital management.
Federal Hospital Performance Monitoring and Improvement Manual – July 2011 84
5.4.1 Preparation by the site visit team
Collate information
Firstly, the site visit team leader should collate all available evidence about the performance
of the hospital, in order to identify specific areas that should be addressed during the site
visit. Much of this evidence will already be on record with the RHB. As a minimum, the
following information should be reviewed:
The most recent site visit report and the hospital response & action plant
The most recent, and previous hospital KPI reports
The most recent, and previous hospital self assessment reports on attainment of EHRIG
standards
The hospital KPIs and attainment of EHRIG standard reports should also be compared with
other hospitals in the region to assess how well the hospital is performing in relation to
others.
If any of the above information is not available in the RHB, the team leader should contact
the hospital CEO to request them to submit the missing information.
Prepare draft site visit briefing document
After gathering the above information, the site visit team leader should review all evidence
and based on this should prepare a site visit briefing document. This should include:
Summary of hospital performance
Strengths/successes of the hospital
Areas of possible weakness
Evidence that requires validation (e.g. selected KPIs, selected chapters of EHRIG self
assessments etc)
Priority areas for further investigation during the site visit
Service areas to be visited during site visit
Staff members to be interviewed during site visit
Additional information for the hospital to prepare for the site visit team. For example, if
the patient satisfaction rating score is low, the team leader may ask the hospital CEO to
prepare the full results of the patient survey for review at the site visit. If the physician
attrition rate is high the team leader may ask the CEO to provide a breakdown of the
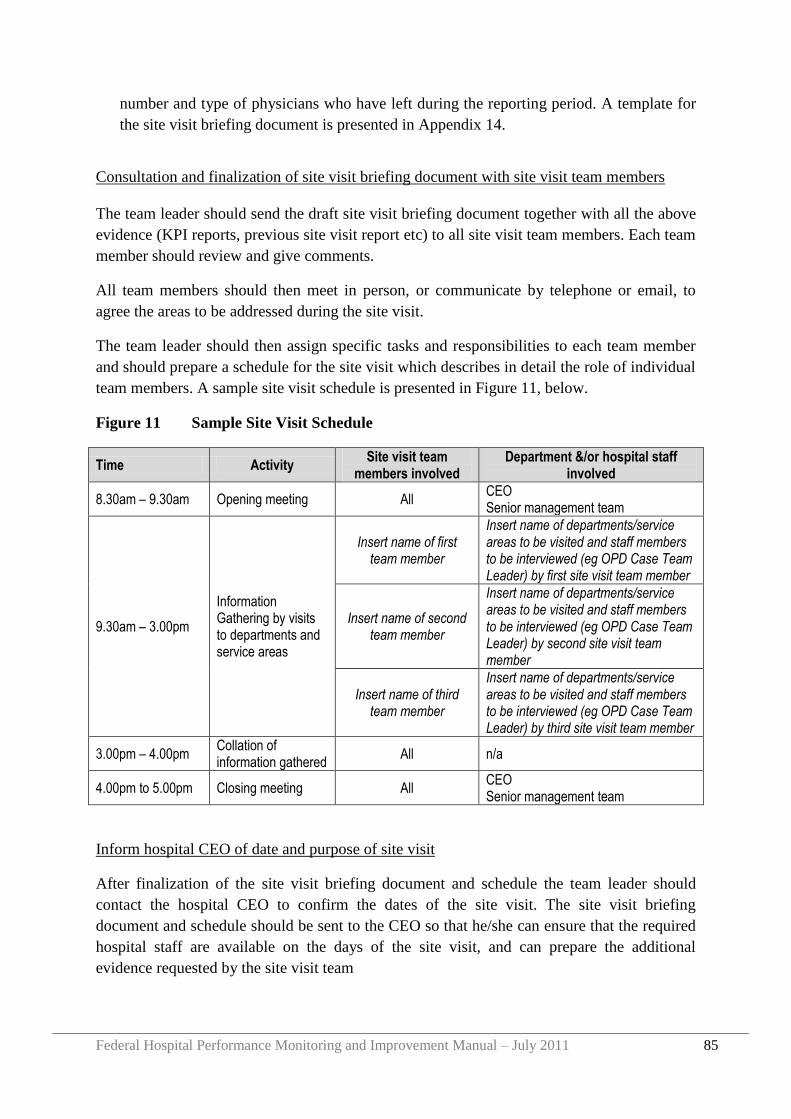
Federal Hospital Performance Monitoring and Improvement Manual – July 2011 85
number and type of physicians who have left during the reporting period. A template for
the site visit briefing document is presented in Appendix 14.
Consultation and finalization of site visit briefing document with site visit team members
The team leader should send the draft site visit briefing document together with all the above
evidence (KPI reports, previous site visit report etc) to all site visit team members. Each team
member should review and give comments.
All team members should then meet in person, or communicate by telephone or email, to
agree the areas to be addressed during the site visit.
The team leader should then assign specific tasks and responsibilities to each team member
and should prepare a schedule for the site visit which describes in detail the role of individual
team members. A sample site visit schedule is presented in Figure 11, below.
Figure 11 Sample Site Visit Schedule
Time Activity Site visit team
members involved Department &/or hospital staff
involved
8.30am – 9.30am Opening meeting All CEO Senior management team
9.30am – 3.00pm
Information Gathering by visits to departments and service areas
Insert name of first team member
Insert name of departments/service areas to be visited and staff members to be interviewed (eg OPD Case Team Leader) by first site visit team member
Insert name of second team member
Insert name of departments/service areas to be visited and staff members to be interviewed (eg OPD Case Team Leader) by second site visit team member
Insert name of third team member
Insert name of departments/service areas to be visited and staff members to be interviewed (eg OPD Case Team Leader) by third site visit team member
3.00pm – 4.00pm Collation of information gathered
All n/a
4.00pm to 5.00pm Closing meeting All CEO Senior management team
Inform hospital CEO of date and purpose of site visit
After finalization of the site visit briefing document and schedule the team leader should
contact the hospital CEO to confirm the dates of the site visit. The site visit briefing
document and schedule should be sent to the CEO so that he/she can ensure that the required
hospital staff are available on the days of the site visit, and can prepare the additional
evidence requested by the site visit team
Federal Hospital Performance Monitoring and Improvement Manual – July 2011 86
5.4.2 Preparation by the Hospital
After receiving the site visit briefing document and schedule, the hospital CEO should share
these with the senior management team and should prepare any supplementary evidence
requested in the briefing document.
The CEO should inform all hospital staff that a site visit is being conducted; giving a general
overview of the purpose of the site visit and priority areas that the site visit team will review.
In particular, the CEO should ensure that the management and staff of all service areas that
will be visited during the site visit are available on the days of the site visit.
5.5 Conducting the site visit
The site visit should last between one to two days, although may be lengthened if necessary.
5.5.1 Opening meeting
On arrival at the hospital, the site visit team should first have an opening meeting with the
CEO and SMT to give an overview of the purpose of the site visit, to confirm the schedule
and to receive any additional information that had been requested from the hospital. The
SMT should also be given opportunity to comment on the schedule and to add any areas that
they think are missing and that they would like the site visit team to review. The site visit
team may also take this opportunity to update the SMT on any relevant regional or national
developments that the hospital should be aware of.
5.5.2 Information gathering
The team should then split up, each team member visiting the departments and services
within the hospital as per the planned schedule.
Each team member should prepare detailed notes on their activities during the site visit,
ensuring that the specific questions raised in the site visit briefing document are addressed.
5.5.3 Collation of evidence
After visiting the different service areas, the site visit team should meet together and should
report back to on their assigned tasks. Together, the team should agree initial findings of the
visit, including strengths and weaknesses of the hospital, recommendations to the hospital
and specific areas that the hospital should address. The team should also identify areas where
additional support from the RHB is required and a provisional date/timeline for the next site
visit.
Federal Hospital Performance Monitoring and Improvement Manual – July 2011 87
5.5.4 Closing meeting
After the internal meeting among site visit team members alone, the team should then invite
the hospital CEO and SMT to join them for a closing meeting. The team should present their
overall findings as described above, and give opportunity to the SMT to respond to these.
These findings should be seen as provisional, with the possibility of adding further areas or
revising the focus after further reflection.
5.6 Post Visit Follow Up
Following the site visit, the team leader should prepare a detailed report that describes how
the visit was conducted and the main findings and recommendations arising. A template for a
site visit report is presented in Appendix 15.
The report should be reviewed by all site visit team members. When reviewing the draft
report team members should consider:
Does the report present the impression of the hospital that you want it to convey?
Does the report contain the key messages arising from the site visit?
Does the report describe any follow up action that is expected from the hospital?
Are recommendations based on evidence gathered during the site visit?
Are all recommendations important? Are they feasible?
Does the report identify any follow up action or support that is required from the
RHB?
Will the report help to improve hospital services? If not, how can the report be
improved?
After finalizing the report by the site visit team, the report should be sent to the hospital CEO
who should review and prepare a hospital response & action plan that describes specific
actions that the hospital will take in the light of the report. When reviewing the report the
hospital CEO should consider:
Is the report factually accurate? If not, the CEO should include a correction of any errors
in their written response
What specific actions should the hospital take to address the recommendations made in
the report? In what timeframe?
Does the report describe all areas of support that the hospital expects from the RHB to
assist the hospital to act on the recommendations?

Federal Hospital Performance Monitoring and Improvement Manual – July 2011 88
Are there any additional comments that the CEO would like to raise with the RHB about
the site visit process itself? Anything that could be improved in the process?
A sample template for the hospital response to a site visit report is presented in Appendix 16.
The CEO should send a copy of the hospital response and action plan to the site visit team
leader.
After finalizing the site visit report and the hospital response, copies of both should be shared
with the RHB Head and all relevant stakeholders. Copies should be kept on file within the
RHB and used as evidence when preparing subsequent site visits and regional review
meetings (see Section 6).
Federal Hospital Performance Monitoring and Improvement Manual – July 2011 89
Section 6 Regional Review Meetings
6.1 Purpose
Regular meetings between the RHB and all hospitals in the region provide the opportunity for
communication and experience sharing between the RHB and hospitals. Specifically review
meetings can be used to:
Present and discuss hospital performance reports
Benchmark
Identify and reward good practice
Share successes and challenges
Discuss other relevant topics
6.2 Frequency of meetings
Review meetings should be held as a minimum every six months.
6.3 Length of meeting
In general the meeting should last for two days, but may be longer if the need arises.
6.4 Participants
a) RHB staff
The meeting should be attended by RHB curative and rehabilitative core
process team members. The RHB Head and deputies should also attend
whenever possible. Additional RHB staff members should be invited if the
agenda includes topics that are of relevance to them.
b) Hospital staff
As a minimum the hospital CEO and Medical Director should attend the
meeting. Additional participants could include other members of the hospital
senior management team and/or the Governing Board Chair.
c) Medical Services Directorate
The FMOH regional focal persons for the region should be invited to attend
since this will maintain strong communication between FMOH, the RHB and
hospitals and will build capacity in FMOH to support the RHB and hospitals
when required.
d) Other
Additional partners (such as CHAI or other NGOs) could be invited to attend
according to their area of expertise and relevance for the agenda.
Federal Hospital Performance Monitoring and Improvement Manual – July 2011 90
6.5 Pre Meeting Preparation
Before each meeting the RHB should determine the venue, set the meeting agenda, identify
participants and send an invitation letter plus agenda to all hospitals, describing which
participants should attend to represent the hospital. Additional partners such as FMOH staff
or NGO partners should be invited as relevant. The invitation letter and agenda should be sent
at least 3 weeks in advance of the meeting, with a follow up email or phone call to confirm
attendance approximately one week in advance of the meeting.
To prepare for each meeting, the RHB should review all hospital KPI reports and the most
recent site visit report and hospital response and action plan. Using these reports the RHB
should identify successes and challenges within individual hospitals or across the region as a
whole.
Based on the findings, the RHB should identify specific hospitals to give presentations or
share experience at the meeting and should inform these hospitals in advance so that the
hospitals can prepare all necessary information.
6.6 Conducting the meeting
The meeting should be chaired by the RHB, with additional facilitators for each session or
topic according to need.
Specific individuals from within the RHB, FMOH or partners should be assigned to take
minutes of the meeting.
At each meeting the RHB should give a presentation on the KPI and EHRIG standards
assessment reports from each hospital, including regional averages and recommendations
from the RHB in response to the findings. Other agenda items will vary from meeting to
meeting according to need.
6.7 Post meeting follow up
The RHB should prepare minutes and circulate these to all participants within a maximum of
two weeks following the meeting. The minutes may also be sent to others as relevant (for
example the RHB Head and FMOH).
Federal Hospital Performance Monitoring and Improvement Manual – July 2011 91
Section 7 FMOH and RHB Meetings
7.1 Purpose
Regular meetings between FMOH and all RHBs provide the opportunity for communication
and experience sharing between regions. Specifically FMOH/RHB meetings can be used to:
Present and discuss regional performance reports
Benchmark
Identify and reward good practice
Share successes and challenges
Share recent research reports related to hospital performance
Discuss other relevant topics
7.2 Frequency of meetings
FMOH/RHB meetings should be held as a minimum every quarter
7.3 Length of meeting
In general the meeting will last for two days, but may be longer if the need arises.
7.4 Participants
a) FMOH Staff
All members of the MSD should attend the meeting. Additional FMOH staff
should be invited if the agenda includes topics that are of relevance to them.
b) RHB Staff
Ideally, all members of each CRCPT of all RHBs should attend every meeting,
but as a minimum the RHB core process owner and hospital lead should be in
attendance.
c) Hospital staff
A selected number of hospital CEOs, governing board chairs and/or other
senior managers should be invited to attend meetings depending on the agenda
items.
d) Other
Additional partners (such as CHAI or other NGOs) could be invited to attend
according to their area of expertise and relevance for the agenda.
Federal Hospital Performance Monitoring and Improvement Manual – July 2011 92
7.5 Pre Meeting Preparation
Before each meeting FMOH should determine the venue, set the meeting agenda, identify
participants and send an invitation letter plus agenda to all RHBs +/- specific hospitals +/-
other partners as relevant. The invitation letter and agenda should be sent at least 3 weeks in
advance of the meeting, with a follow up email or phone call to confirm attendance
approximately one week in advance of the meeting.
To prepare for each meeting, FMOH should review all regional KPI reports to identify
successes and challenges within individual regions or across the country as a whole.
Based on the findings, FMOH should identify specific RHBs to give presentations or share
experience at the meeting and should inform these RHBs in advance so that the RHB can
prepare all necessary information.
7.6 Conducting the meeting
The meeting should be chaired by FMOH, with additional facilitators for each session or
topic according to need.
Specific individuals from within FMOH or partners should be assigned to take minutes of the
meeting.
At each meeting FMOH should give a presentation on the KPI and EHRIG standards
assessment reports from each region, and recommendations from FMOH in response to the
findings. Other agenda items will vary from meeting to meeting.
7.7 Post meeting activities
FMOH should prepare minutes and circulate these to all participants within a maximum of
two weeks following the meeting. The minutes may also be sent to others as relevant (for
example all RHB heads, and other FMOH directors or Ministers).
Federal Hospital Performance Monitoring and Improvement Manual – July 2011 93
Appendix 1 User Guide: Hospital KPI Database
Background
The Federal Ministry of Health (FMOH) and Regional Health Bureaus (RHB) are leading a
sector wide reform to strengthen and improve health services in Ethiopia. To support these
efforts, the Medical Services Directorate (MSD) of the FMOH, in collaboration with regional
health bureaus (RHBs) and hospital Governing Boards has developed a performance
monitoring framework for hospitals, based on a national core set of 36 Key Performance
Indicators (KPI) which measure hospital performance in the areas of efficiency,
effectiveness, and quality.
The set of KPIs are made up of 59 data elements, which are used in the calculation of the
KPIs. Data elements are collected from sourcing documents at the hospital level and used to
calculate KPIs by “KPI Data Owners”. The hospital “KPI Focal Person” collects all Data
Elements and KPI Results from each and every KPI Data Owner.
The KPI Focal Person is responsible to present the KPI results to the hospital Quality
Committee and CEO. After approval by the CEO the information should be sent to the RHB.
The CEO should also present the KPI results to the hospital Governing Board.
In an effort to support and standardize this process of collection, analysis and dissemination,
an MSExcel tool for hospitals (the „Hospital KPI Database‟) has been developed.
The guidance in this document describes how to use this excel tool in data collection,
reporting, and analysis. Based on the data entered into the tool, automatic tables and reports
are produced that describe an individual hospital‟s overall performance within a given time
period.
Operational Requirements
To use the Hospital KPI Database, Excel 2007 is preferred. Using the tool in Excel 2003 will
compromise some of the functions of the tool and limit its effectiveness in presenting a given
hospital‟s data.
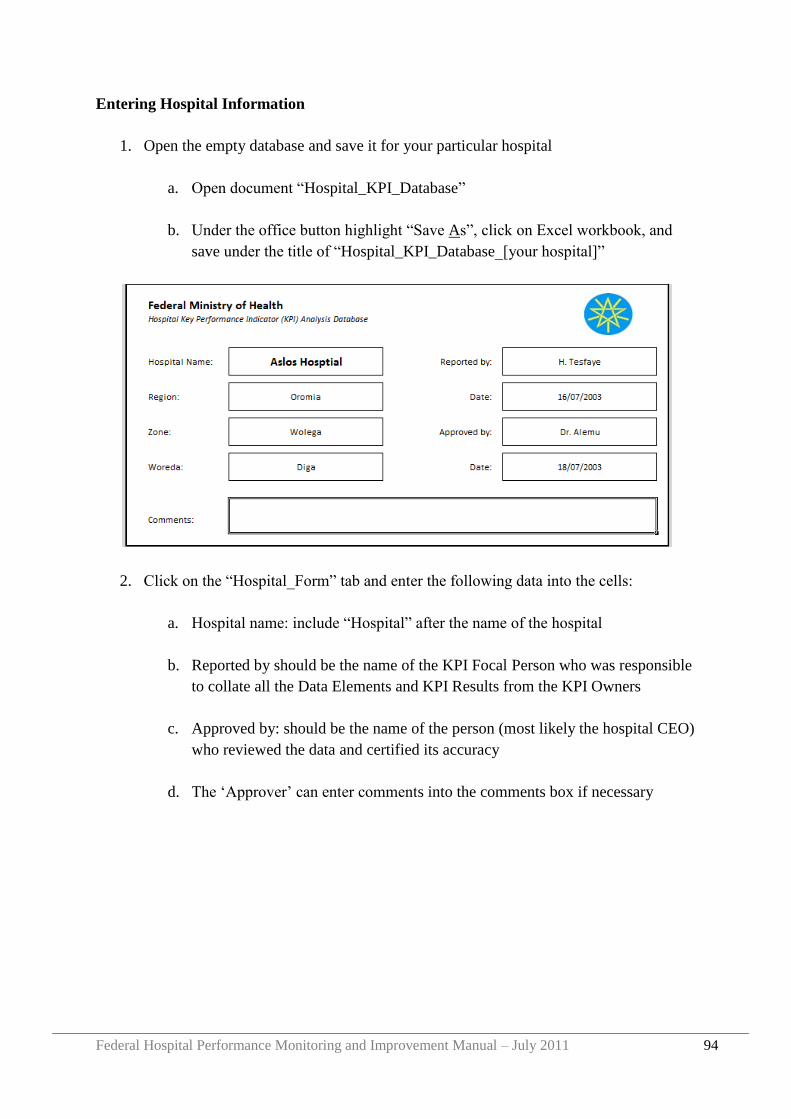
Federal Hospital Performance Monitoring and Improvement Manual – July 2011 94
Entering Hospital Information
1. Open the empty database and save it for your particular hospital
a. Open document “Hospital_KPI_Database”
b. Under the office button highlight “Save As”, click on Excel workbook, and
save under the title of “Hospital_KPI_Database_[your hospital]”
2. Click on the “Hospital_Form” tab and enter the following data into the cells:
a. Hospital name: include “Hospital” after the name of the hospital
b. Reported by should be the name of the KPI Focal Person who was responsible
to collate all the Data Elements and KPI Results from the KPI Owners
c. Approved by: should be the name of the person (most likely the hospital CEO)
who reviewed the data and certified its accuracy
d. The „Approver‟ can enter comments into the comments box if necessary
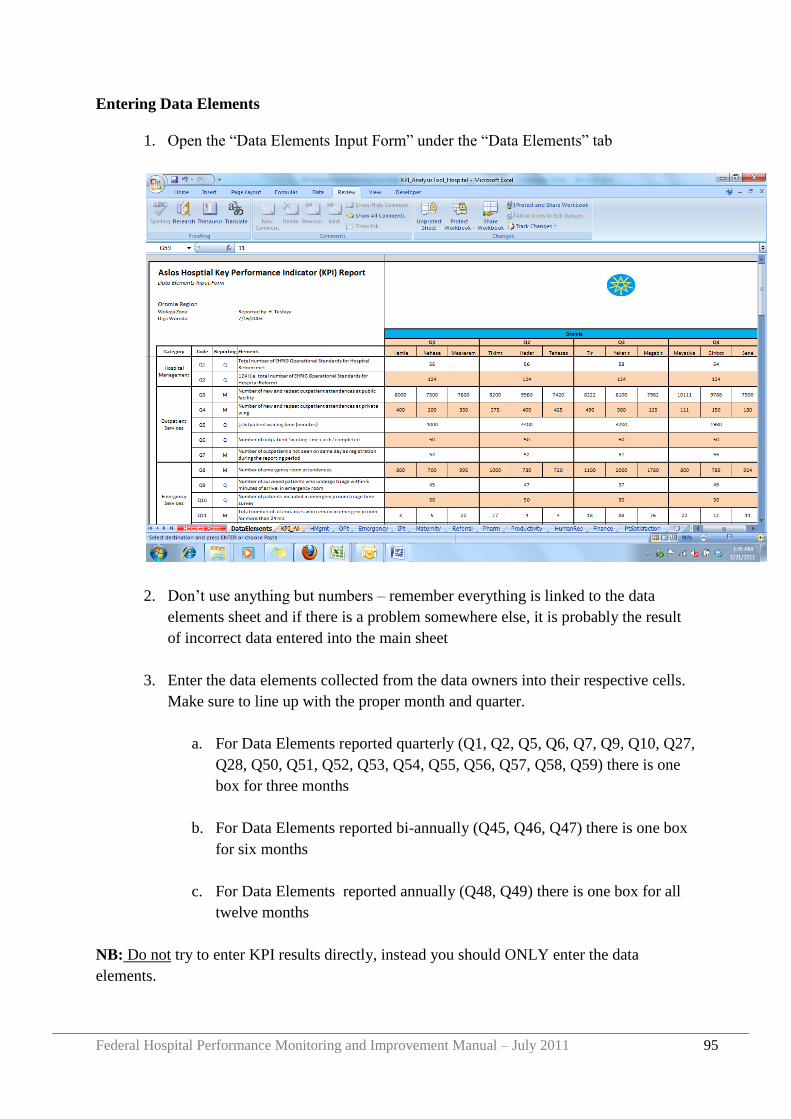
Federal Hospital Performance Monitoring and Improvement Manual – July 2011 95
Entering Data Elements
1. Open the “Data Elements Input Form” under the “Data Elements” tab
2. Don‟t use anything but numbers – remember everything is linked to the data
elements sheet and if there is a problem somewhere else, it is probably the result
of incorrect data entered into the main sheet
3. Enter the data elements collected from the data owners into their respective cells.
Make sure to line up with the proper month and quarter.
a. For Data Elements reported quarterly (Q1, Q2, Q5, Q6, Q7, Q9, Q10, Q27,
Q28, Q50, Q51, Q52, Q53, Q54, Q55, Q56, Q57, Q58, Q59) there is one
box for three months
b. For Data Elements reported bi-annually (Q45, Q46, Q47) there is one box
for six months
c. For Data Elements reported annually (Q48, Q49) there is one box for all
twelve months
NB: Do not try to enter KPI results directly, instead you should ONLY enter the data
elements.
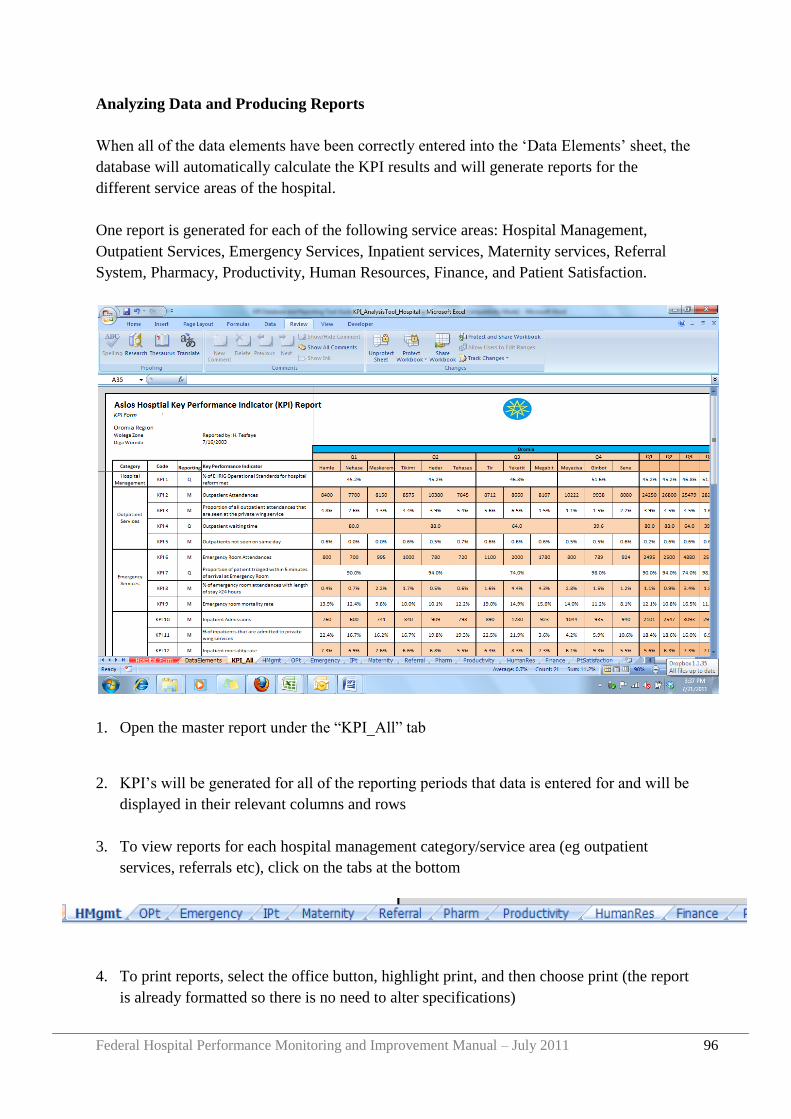
Federal Hospital Performance Monitoring and Improvement Manual – July 2011 96
Analyzing Data and Producing Reports
When all of the data elements have been correctly entered into the „Data Elements‟ sheet, the
database will automatically calculate the KPI results and will generate reports for the
different service areas of the hospital.
One report is generated for each of the following service areas: Hospital Management,
Outpatient Services, Emergency Services, Inpatient services, Maternity services, Referral
System, Pharmacy, Productivity, Human Resources, Finance, and Patient Satisfaction.
1. Open the master report under the “KPI_All” tab
2. KPI‟s will be generated for all of the reporting periods that data is entered for and will be
displayed in their relevant columns and rows
3. To view reports for each hospital management category/service area (eg outpatient
services, referrals etc), click on the tabs at the bottom
4. To print reports, select the office button, highlight print, and then choose print (the report
is already formatted so there is no need to alter specifications)
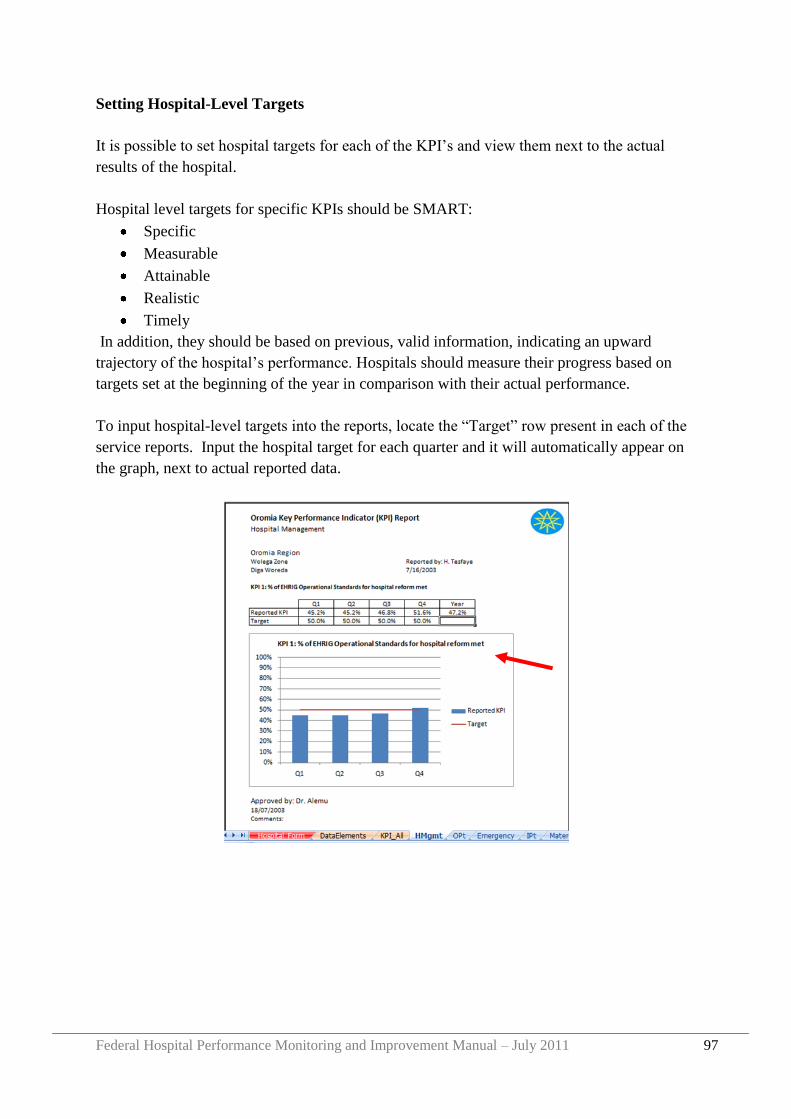
Federal Hospital Performance Monitoring and Improvement Manual – July 2011 97
Setting Hospital-Level Targets
It is possible to set hospital targets for each of the KPI‟s and view them next to the actual
results of the hospital.
Hospital level targets for specific KPIs should be SMART:
Specific
Measurable
Attainable
Realistic
Timely
In addition, they should be based on previous, valid information, indicating an upward
trajectory of the hospital‟s performance. Hospitals should measure their progress based on
targets set at the beginning of the year in comparison with their actual performance.
To input hospital-level targets into the reports, locate the “Target” row present in each of the
service reports. Input the hospital target for each quarter and it will automatically appear on
the graph, next to actual reported data.
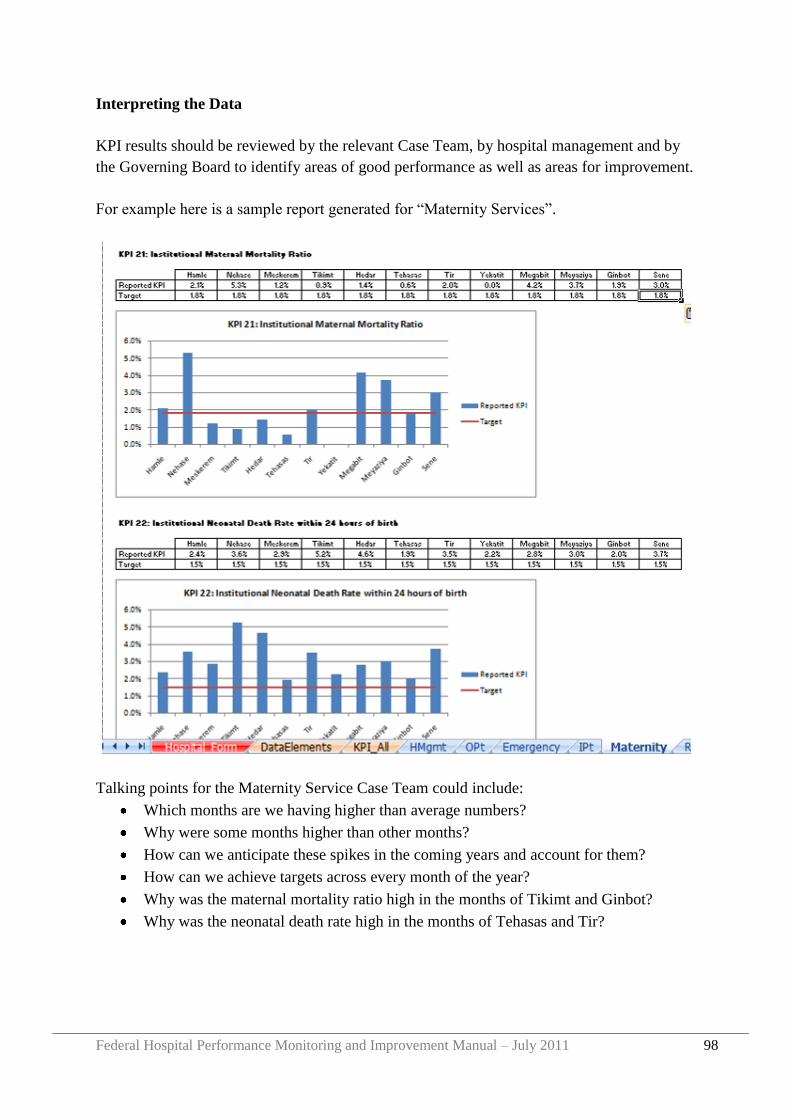
Federal Hospital Performance Monitoring and Improvement Manual – July 2011 98
Interpreting the Data
KPI results should be reviewed by the relevant Case Team, by hospital management and by
the Governing Board to identify areas of good performance as well as areas for improvement.
For example here is a sample report generated for “Maternity Services”.
Talking points for the Maternity Service Case Team could include:
Which months are we having higher than average numbers?
Why were some months higher than other months?
How can we anticipate these spikes in the coming years and account for them?
How can we achieve targets across every month of the year?
Why was the maternal mortality ratio high in the months of Tikimt and Ginbot?
Why was the neonatal death rate high in the months of Tehasas and Tir?
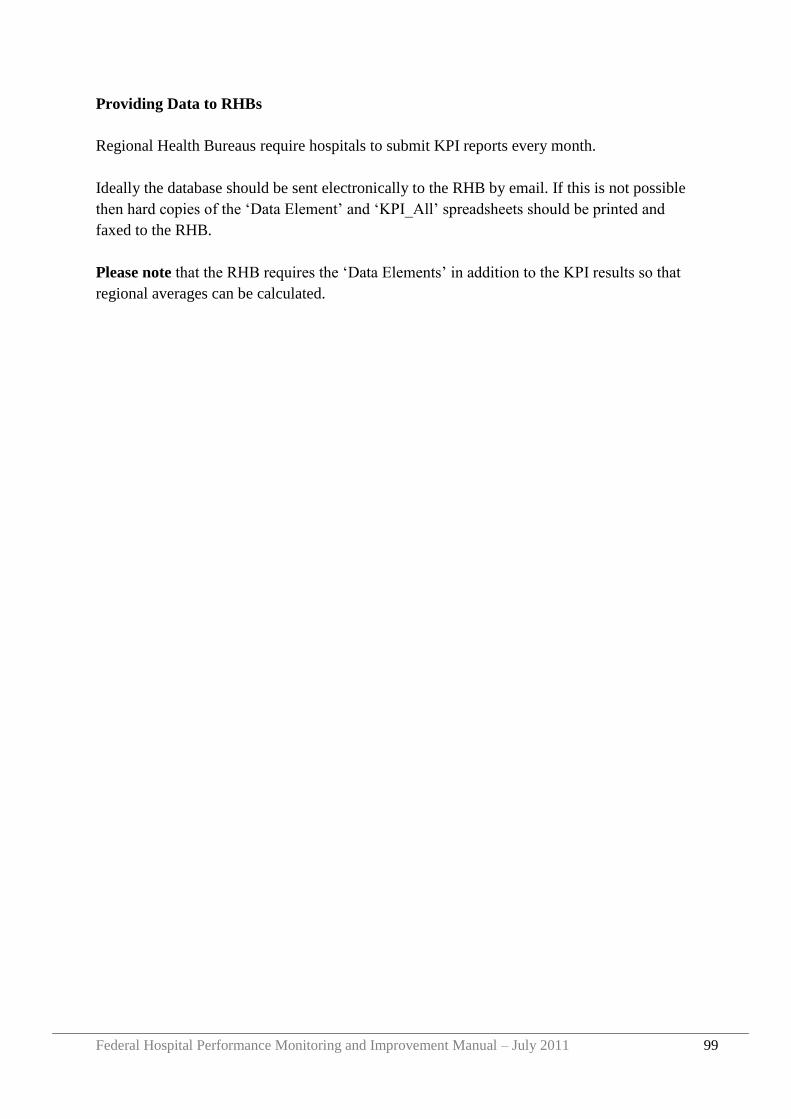
Federal Hospital Performance Monitoring and Improvement Manual – July 2011 99
Providing Data to RHBs
Regional Health Bureaus require hospitals to submit KPI reports every month.
Ideally the database should be sent electronically to the RHB by email. If this is not possible
then hard copies of the „Data Element‟ and „KPI_All‟ spreadsheets should be printed and
faxed to the RHB.
Please note that the RHB requires the „Data Elements‟ in addition to the KPI results so that
regional averages can be calculated.

Federal Hospital Performance Monitoring and Improvement Manual – July 2011 100
Federal Hospital Performance Monitoring and Improvement Manual – July 2011 101
Appendix 2 User Guide: Hospital EHRIG Database
Background
The Federal Ministry of Health (FMOH) and Regional Health Bureaus (RHB) are leading a
sector wide reform to strengthen and improve health services in Ethiopia. Central to these
efforts is the Ethiopian Hospital Reform Implementation Guidelines (EHRIG) which sets out
124 operational standards for hospital management in the areas of:
- Hospital leadership and governance
- Patient flow
- Medical records management
- Pharmacy services
- Laboratory services
- Nursing care standards
- Infection prevention
- Facilities management
- Medical equipment management
- Financial and asset management
- Human resource management
- Quality management
- Monitoring and reporting.
Hospitals are expected to improve their internal management systems in order to attain all
124 EHRIG standards. Hospitals should self-assess their attainment of the EHRIG standards
every quarter and should submit these EHRIG reports to their RHB.
To assist hospitals to record and analyze the attainment of EHRIG standards, and to monitor
changes over time, an MSExcel tool has been created (the „Hospital_EHRIG_Database).
The guidance in this document describes how to use the Hospital EHRIG Database for data
collection, reporting, and analysis. Based on the data entered into the tool, tables and charts
are automatically generated that show the hospital‟s progress towards the attainment of
standards over time.
Operational Requirements
To use the Hospital EHRIG Database, Excel 2007 is preferred. Using the tool in Excel 2003
will compromise some of the functions of the tool and limit its effectiveness in presenting the
hospital‟s data.
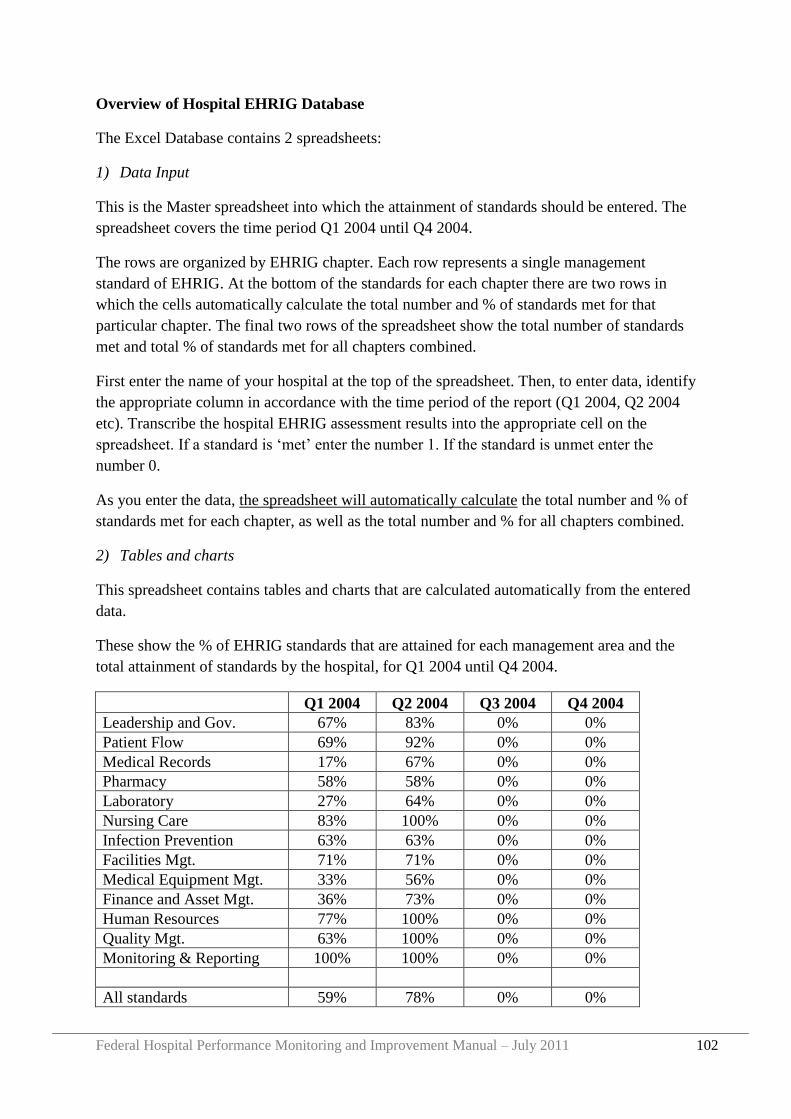
Federal Hospital Performance Monitoring and Improvement Manual – July 2011 102
Overview of Hospital EHRIG Database
The Excel Database contains 2 spreadsheets:
1) Data Input
This is the Master spreadsheet into which the attainment of standards should be entered. The
spreadsheet covers the time period Q1 2004 until Q4 2004.
The rows are organized by EHRIG chapter. Each row represents a single management
standard of EHRIG. At the bottom of the standards for each chapter there are two rows in
which the cells automatically calculate the total number and % of standards met for that
particular chapter. The final two rows of the spreadsheet show the total number of standards
met and total % of standards met for all chapters combined.
First enter the name of your hospital at the top of the spreadsheet. Then, to enter data, identify
the appropriate column in accordance with the time period of the report (Q1 2004, Q2 2004
etc). Transcribe the hospital EHRIG assessment results into the appropriate cell on the
spreadsheet. If a standard is „met‟ enter the number 1. If the standard is unmet enter the
number 0.
As you enter the data, the spreadsheet will automatically calculate the total number and % of
standards met for each chapter, as well as the total number and % for all chapters combined.
2) Tables and charts
This spreadsheet contains tables and charts that are calculated automatically from the entered
data.
These show the % of EHRIG standards that are attained for each management area and the
total attainment of standards by the hospital, for Q1 2004 until Q4 2004.
Q1 2004 Q2 2004 Q3 2004 Q4 2004
Leadership and Gov. 67% 83% 0% 0%
Patient Flow 69% 92% 0% 0%
Medical Records 17% 67% 0% 0%
Pharmacy 58% 58% 0% 0%
Laboratory 27% 64% 0% 0%
Nursing Care 83% 100% 0% 0%
Infection Prevention 63% 63% 0% 0%
Facilities Mgt. 71% 71% 0% 0%
Medical Equipment Mgt. 33% 56% 0% 0%
Finance and Asset Mgt. 36% 73% 0% 0%
Human Resources 77% 100% 0% 0%
Quality Mgt. 63% 100% 0% 0%
Monitoring & Reporting 100% 100% 0% 0%
All standards 59% 78% 0% 0%
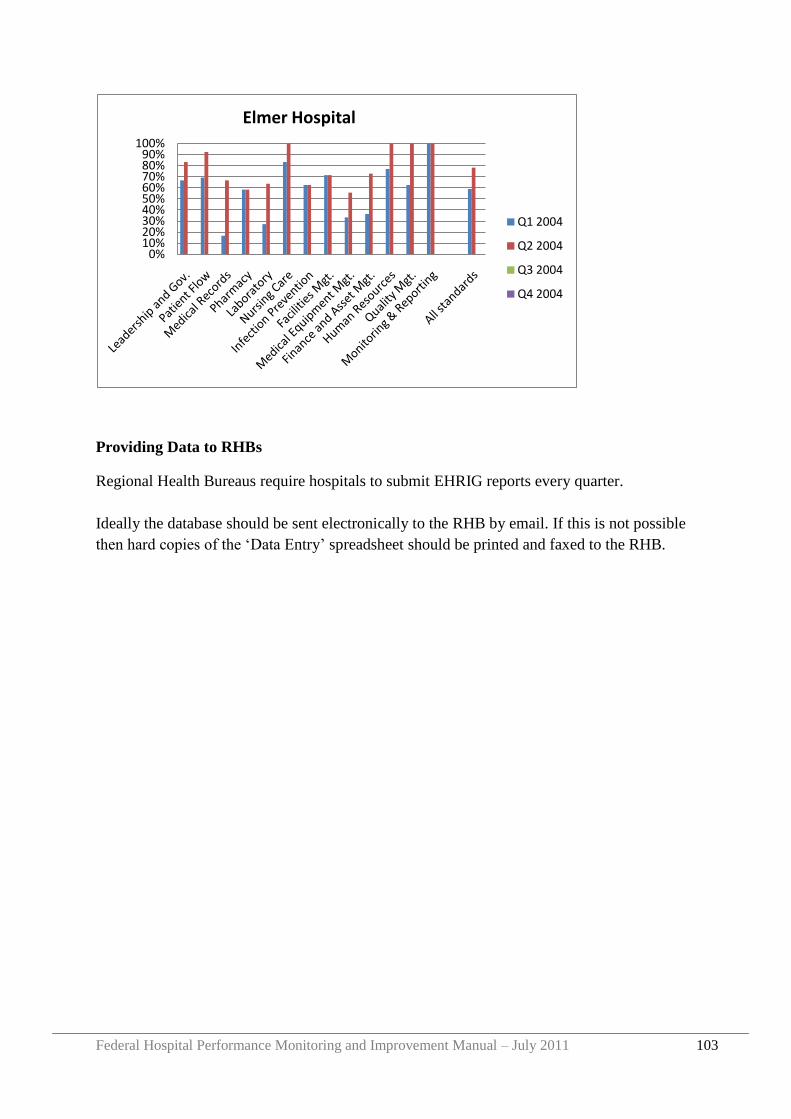
Federal Hospital Performance Monitoring and Improvement Manual – July 2011 103
Providing Data to RHBs
Regional Health Bureaus require hospitals to submit EHRIG reports every quarter.
Ideally the database should be sent electronically to the RHB by email. If this is not possible
then hard copies of the „Data Entry‟ spreadsheet should be printed and faxed to the RHB.
0%10%20%30%40%50%60%70%80%90%
100%
Elmer Hospital
Q1 2004
Q2 2004
Q3 2004
Q4 2004

Federal Hospital Performance Monitoring and Improvement Manual – July 2011 104
Federal Hospital Performance Monitoring and Improvement Manual – July 2011 105
Appendix 3 User Guide: Regional KPI Database
Background
The Federal Ministry of Health (FMOH) and Regional Health Bureaus (RHB) are leading a
sector wide reform to strengthen and improve health services in Ethiopia. To support these
efforts, the Medical Services Directorate (MSD) of the FMOH, in collaboration with regional
health bureaus (RHBs) and hospital Governing Boards has developed a performance
monitoring framework for hospitals, based on a national core set of 36 Key Performance
Indicators (KPI) which measure hospital performance in the areas of efficiency,
effectiveness, and quality.
The set of KPIs are made up of 59 data elements, which are used in the calculation of the
KPIs. Data elements are collected from sourcing documents at the hospital level and used to
calculate KPIs by “KPI Data Owners”. The hospital “KPI Focal Person” collects all Data
Elements and KPI Results from each and every KPI Data Owner and, after approval by the
CEO, submits to the RHB.
The RHB should collate and analyze KPI reports from all hospitals in the Region, give
feedback to hospitals, and should calculate Regional average KPI results based on the
hospital data.
In an effort to support and standardize this process of collection, analysis and dissemination,
an MSExcel tool has been developed for each Region (the „Regional_ KPI_ Database_[your
region]‟).
The guidance in this document describes how to use this excel tool in data collection,
reporting, and analysis. Based on the data entered into the tool, automatic tables and reports
are produced that describe the region‟s overall performance within a given time period.
Operational Requirements
To use the Regional KPI Database, Excel 2007 is preferred. Using the tool in Excel 2003
will compromise some of the functions of the tool and limit its effectiveness in presenting a
given hospital‟s data.
Federal Hospital Performance Monitoring and Improvement Manual – July 2011 106
Entering Regional Information
1. Open the empty database and save it for your particular region
a. Open document “Regional_KPI_Database”
b. Under the office button highlight “Save As”, click on Excel workbook, and save
under the title of “Regional_KPI_Database_[your region]”
2. Click on the “Region_Form” tab and enter the following data into the cells:
a. Region name
b. Reporting period: month and year
c. Name of each hospital in the region
d. For each hospital enter „yes‟ or „no‟ to indicate if the hospital has submitted its
monthly KPI report
e. Enter the name of the person who compiled the report and the date the report was
compiled
f. Enter the name of the person who reviewed and approved the report, and the date of
approval. Generally the „Approver‟ would be the RHB Curative and Rehabilitative
Core Process Owner
Entering Data Elements
3. Open the “Data Elements” tab
4. Enter the data elements reported by the hospitals into their respective cells. Make
sure to line up with the proper month and quarter.
For Data Elements reported quarterly (Q1, Q2, Q5, Q6, Q7, Q9, Q10, Q27, Q28, Q50, Q51,
Q52, Q53, Q54, Q55, Q56, Q57, Q58, Q59) there is one box for three months.
For Data Elements reported bi-annually (Q45, Q46, Q47) there is one box for six months.
For Data Elements reported annually (Q48, Q49) there is one box for all twelve months.
Don‟t use anything but numbers – remember everything is linked to the data elements sheet
and if there is a problem somewhere else, it is probably the result of incorrect data entered
into the main sheet.
If a hospital submitted an electronic copy of their data elements using the
Hospital_KPI_Database then the data elements can be cut and pasted directly into the
Regional_KPI_Database. Otherwise, the KPI data elements have to be transcribed into each
cell individually.
Federal Hospital Performance Monitoring and Improvement Manual – July 2011 107
Analyzing Data and Producing Reports
When all of the data elements have been correctly entered into the „Data Elements‟ sheet, the
database will automatically calculate the KPI results and will generate reports for the region.
5. Open the master report under the “KPI_Master” tab
KPI‟s will be generated for all of the reporting periods that data is entered for and will be
displayed in their relevant columns and rows.
Do not try to enter KPI results directly, instead you should ONLY enter the data elements.
6. To view reports for each KPI (Leadership and Governance, Patient Flow etc) click on the
appropriate tab.
A table is displayed that shows the quarterly KPI result for each hospital, together with charts
for each quarter.
7. To print reports, select the office button, highlight print, and then choose print (the report
is already formatted so there is no need to alter specifications)
Setting Regional-Level Targets
It is possible to set regional targets for each of the KPI‟s and view them next to the actual
results of the region.
Region level targets for specific KPIs should be SMART:
Specific
Measurable
Attainable
Realistic
Timely
In addition, they should be based on previous, valid information, indicating an upward
trajectory of the hospital‟s performance. Regions should measure their progress based on
targets set at the beginning of the year in comparison with their actual performance.
8. Click on the „Target Form‟ tab
Enter the quarter and annual targets for each KPI into the appropriate cells.
Federal Hospital Performance Monitoring and Improvement Manual – July 2011 108
The targets will automatically appear on the KPI reports, next to the actual data in the tables
and graphs.
Interpreting the Data
KPI results should be reviewed by the RHB and feedback given to hospitals. The RHB could
present regional reports at the RHB/hospital review meetings and at the MSD/RHB review
meetings.
Providing Data to FMOH
MSD requires regions to submit KPI reports every quarter.
Ideally the database should be sent electronically to MSD by email. If this is not possible then
hard copies of the „Data Element‟ and „KPI_Master‟ spreadsheets should be printed and
faxed to the RHB.
Please note that MSD requires the „Data Elements‟ in addition to the KPI results so that
national averages can be calculated.
Federal Hospital Performance Monitoring and Improvement Manual – July 2011 109
Appendix 4 User Guide: Regional EHRIG Database
Background
The Federal Ministry of Health (FMOH) and Regional Health Bureaus (RHB) are leading a
sector wide reform to strengthen and improve health services in Ethiopia. Central to these
efforts is the Ethiopian Hospital Reform Implementation Guidelines (EHRIG) which sets out
124 operational standards for hospital management in the areas of:
- Hospital leadership and governance
- Patient flow
- Medical records management
- Pharmacy services
- Laboratory services
- Nursing care standards
- Infection prevention
- Facilities management
- Medical equipment management
- Financial and asset management
- Human resource management
- Quality management
- Monitoring and reporting.
Hospitals are expected to improve their internal management systems in order to attain all
124 EHRIG standards. Hospitals should self-assess their attainment of the EHRIG standards
every quarter and should submit these EHRIG reports to their RHB.
RHBs are expected to receive and review hospital reports and to calculate regional averages.
By monitoring progress towards attainment of EHRIG standards across the region, each RHB
can identify priority areas for improvement and can identify areas where hospitals require
additional support from the RHB or other partners.
To assist RHBs to record and analyze the attainment of EHRIG standards by hospitals in the
Region, and to monitor changes over time, an MSExcel tool has been created for each RHB
(the „Regional_EHRIG_Database_[your region]). Each Regional Database lists all hospitals
in the region by name, and contains data entry cells for every one of the hospitals.
The guidance in this document describes how to use the Regional EHRIG Databases for data
collection, reporting, and analysis. Based on the data entered into the tool, automatic tables
and reports are produced that describe each hospital‟s overall performance within a given
time period and the average performance for the region as a whole.
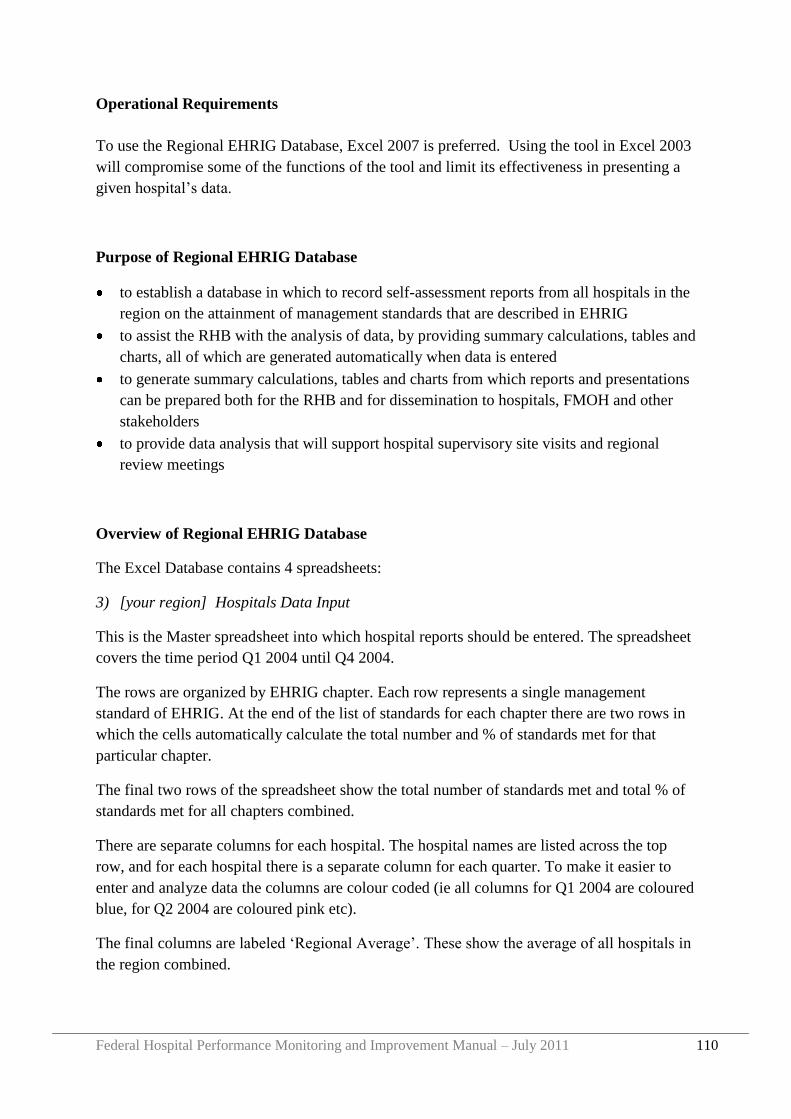
Federal Hospital Performance Monitoring and Improvement Manual – July 2011 110
Operational Requirements
To use the Regional EHRIG Database, Excel 2007 is preferred. Using the tool in Excel 2003
will compromise some of the functions of the tool and limit its effectiveness in presenting a
given hospital‟s data.
Purpose of Regional EHRIG Database
to establish a database in which to record self-assessment reports from all hospitals in the
region on the attainment of management standards that are described in EHRIG
to assist the RHB with the analysis of data, by providing summary calculations, tables and
charts, all of which are generated automatically when data is entered
to generate summary calculations, tables and charts from which reports and presentations
can be prepared both for the RHB and for dissemination to hospitals, FMOH and other
stakeholders
to provide data analysis that will support hospital supervisory site visits and regional
review meetings
Overview of Regional EHRIG Database
The Excel Database contains 4 spreadsheets:
3) [your region] Hospitals Data Input
This is the Master spreadsheet into which hospital reports should be entered. The spreadsheet
covers the time period Q1 2004 until Q4 2004.
The rows are organized by EHRIG chapter. Each row represents a single management
standard of EHRIG. At the end of the list of standards for each chapter there are two rows in
which the cells automatically calculate the total number and % of standards met for that
particular chapter.
The final two rows of the spreadsheet show the total number of standards met and total % of
standards met for all chapters combined.
There are separate columns for each hospital. The hospital names are listed across the top
row, and for each hospital there is a separate column for each quarter. To make it easier to
enter and analyze data the columns are colour coded (ie all columns for Q1 2004 are coloured
blue, for Q2 2004 are coloured pink etc).
The final columns are labeled „Regional Average‟. These show the average of all hospitals in
the region combined.
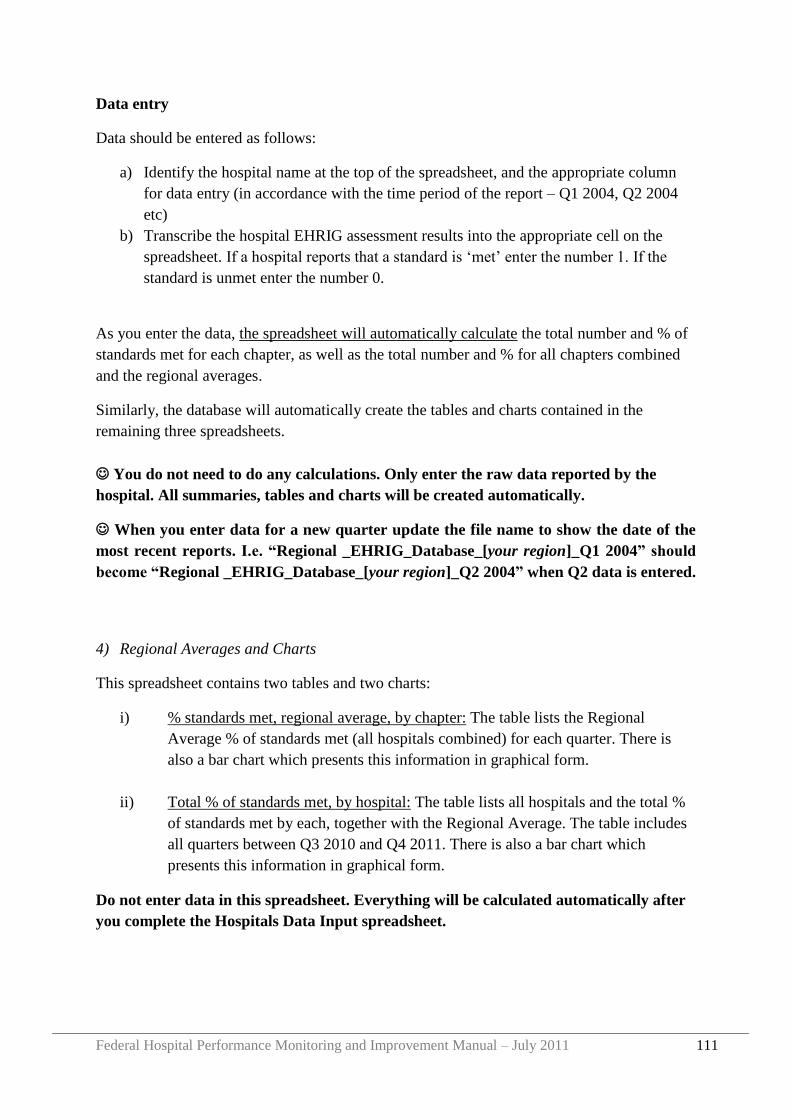
Federal Hospital Performance Monitoring and Improvement Manual – July 2011 111
Data entry
Data should be entered as follows:
a) Identify the hospital name at the top of the spreadsheet, and the appropriate column
for data entry (in accordance with the time period of the report – Q1 2004, Q2 2004
etc)
b) Transcribe the hospital EHRIG assessment results into the appropriate cell on the
spreadsheet. If a hospital reports that a standard is „met‟ enter the number 1. If the
standard is unmet enter the number 0.
As you enter the data, the spreadsheet will automatically calculate the total number and % of
standards met for each chapter, as well as the total number and % for all chapters combined
and the regional averages.
Similarly, the database will automatically create the tables and charts contained in the
remaining three spreadsheets.
You do not need to do any calculations. Only enter the raw data reported by the
hospital. All summaries, tables and charts will be created automatically.
When you enter data for a new quarter update the file name to show the date of the
most recent reports. I.e. “Regional _EHRIG_Database_[your region]_Q1 2004” should
become “Regional _EHRIG_Database_[your region]_Q2 2004” when Q2 data is entered.
4) Regional Averages and Charts
This spreadsheet contains two tables and two charts:
i) % standards met, regional average, by chapter: The table lists the Regional
Average % of standards met (all hospitals combined) for each quarter. There is
also a bar chart which presents this information in graphical form.
ii) Total % of standards met, by hospital: The table lists all hospitals and the total %
of standards met by each, together with the Regional Average. The table includes
all quarters between Q3 2010 and Q4 2011. There is also a bar chart which
presents this information in graphical form.
Do not enter data in this spreadsheet. Everything will be calculated automatically after
you complete the Hospitals Data Input spreadsheet.
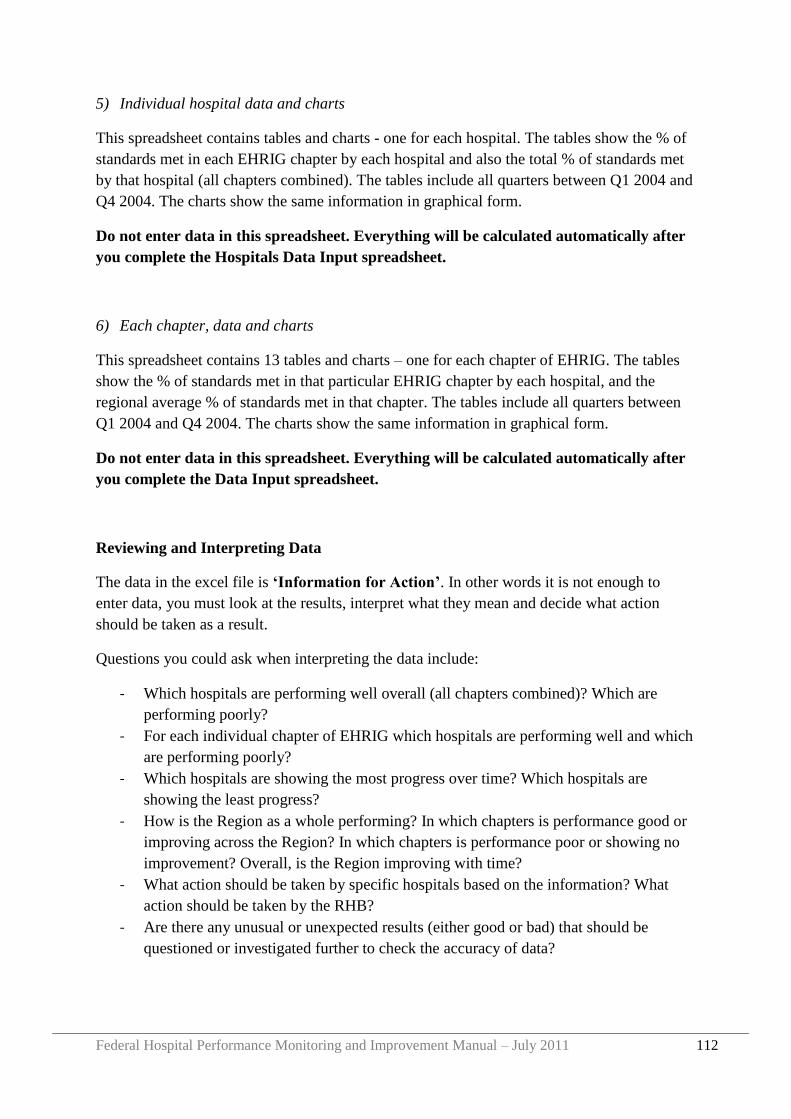
Federal Hospital Performance Monitoring and Improvement Manual – July 2011 112
5) Individual hospital data and charts
This spreadsheet contains tables and charts - one for each hospital. The tables show the % of
standards met in each EHRIG chapter by each hospital and also the total % of standards met
by that hospital (all chapters combined). The tables include all quarters between Q1 2004 and
Q4 2004. The charts show the same information in graphical form.
Do not enter data in this spreadsheet. Everything will be calculated automatically after
you complete the Hospitals Data Input spreadsheet.
6) Each chapter, data and charts
This spreadsheet contains 13 tables and charts – one for each chapter of EHRIG. The tables
show the % of standards met in that particular EHRIG chapter by each hospital, and the
regional average % of standards met in that chapter. The tables include all quarters between
Q1 2004 and Q4 2004. The charts show the same information in graphical form.
Do not enter data in this spreadsheet. Everything will be calculated automatically after
you complete the Data Input spreadsheet.
Reviewing and Interpreting Data
The data in the excel file is „Information for Action‟. In other words it is not enough to
enter data, you must look at the results, interpret what they mean and decide what action
should be taken as a result.
Questions you could ask when interpreting the data include:
- Which hospitals are performing well overall (all chapters combined)? Which are
performing poorly?
- For each individual chapter of EHRIG which hospitals are performing well and which
are performing poorly?
- Which hospitals are showing the most progress over time? Which hospitals are
showing the least progress?
- How is the Region as a whole performing? In which chapters is performance good or
improving across the Region? In which chapters is performance poor or showing no
improvement? Overall, is the Region improving with time?
- What action should be taken by specific hospitals based on the information? What
action should be taken by the RHB?
- Are there any unusual or unexpected results (either good or bad) that should be
questioned or investigated further to check the accuracy of data?

Federal Hospital Performance Monitoring and Improvement Manual – July 2011 113
Providing Data to MSD
Each RHB should provide quarterly reports to MSD on the attainment of EHRIG standards
by each hospital in the Region.
Ideally, the RHB should email an electronic copy of the Database to MSD. If this is not
possible then the Data Input Spreadsheet should be printed and faxed to MSD.

Federal Hospital Performance Monitoring and Improvement Manual – July 2011 114
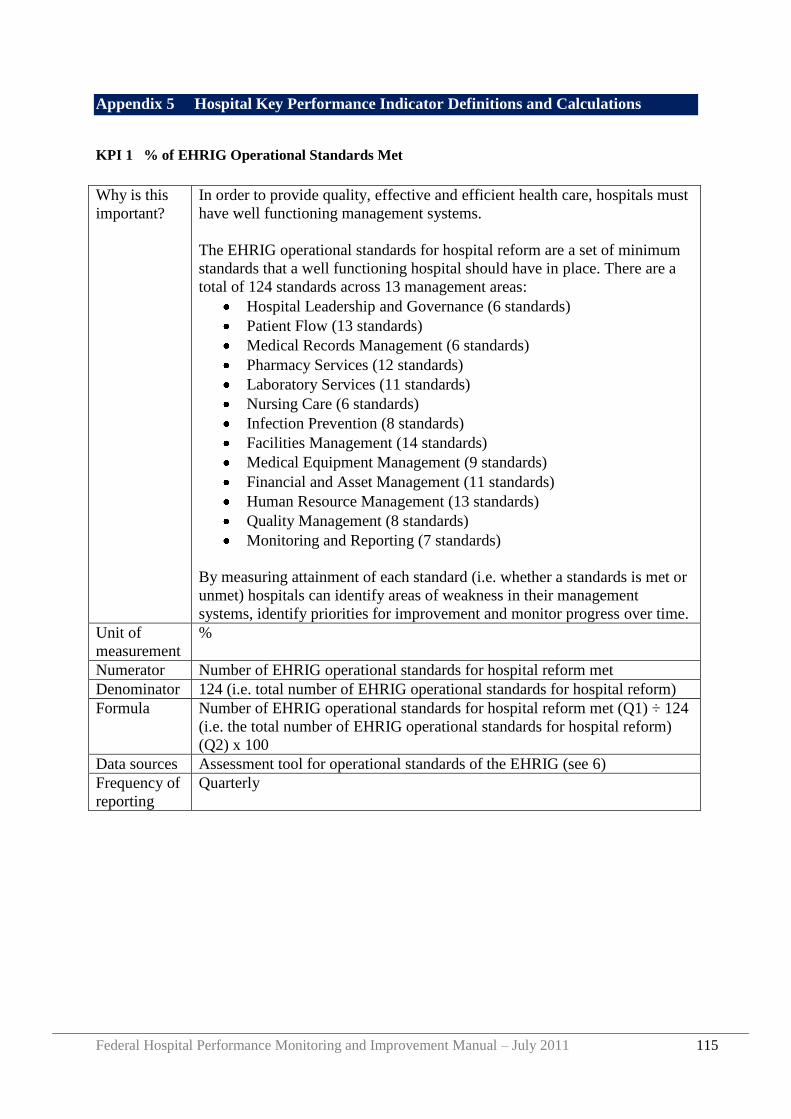
Federal Hospital Performance Monitoring and Improvement Manual – July 2011 115
Appendix 5 Hospital Key Performance Indicator Definitions and Calculations
KPI 1 % of EHRIG Operational Standards Met
Why is this
important?
In order to provide quality, effective and efficient health care, hospitals must
have well functioning management systems.
The EHRIG operational standards for hospital reform are a set of minimum
standards that a well functioning hospital should have in place. There are a
total of 124 standards across 13 management areas:
Hospital Leadership and Governance (6 standards)
Patient Flow (13 standards)
Medical Records Management (6 standards)
Pharmacy Services (12 standards)
Laboratory Services (11 standards)
Nursing Care (6 standards)
Infection Prevention (8 standards)
Facilities Management (14 standards)
Medical Equipment Management (9 standards)
Financial and Asset Management (11 standards)
Human Resource Management (13 standards)
Quality Management (8 standards)
Monitoring and Reporting (7 standards)
By measuring attainment of each standard (i.e. whether a standards is met or
unmet) hospitals can identify areas of weakness in their management
systems, identify priorities for improvement and monitor progress over time.
Unit of
measurement
%
Numerator Number of EHRIG operational standards for hospital reform met
Denominator 124 (i.e. total number of EHRIG operational standards for hospital reform)
Formula Number of EHRIG operational standards for hospital reform met (Q1) ÷ 124
(i.e. the total number of EHRIG operational standards for hospital reform)
(Q2) x 100
Data sources Assessment tool for operational standards of the EHRIG (see 6)
Frequency of
reporting
Quarterly
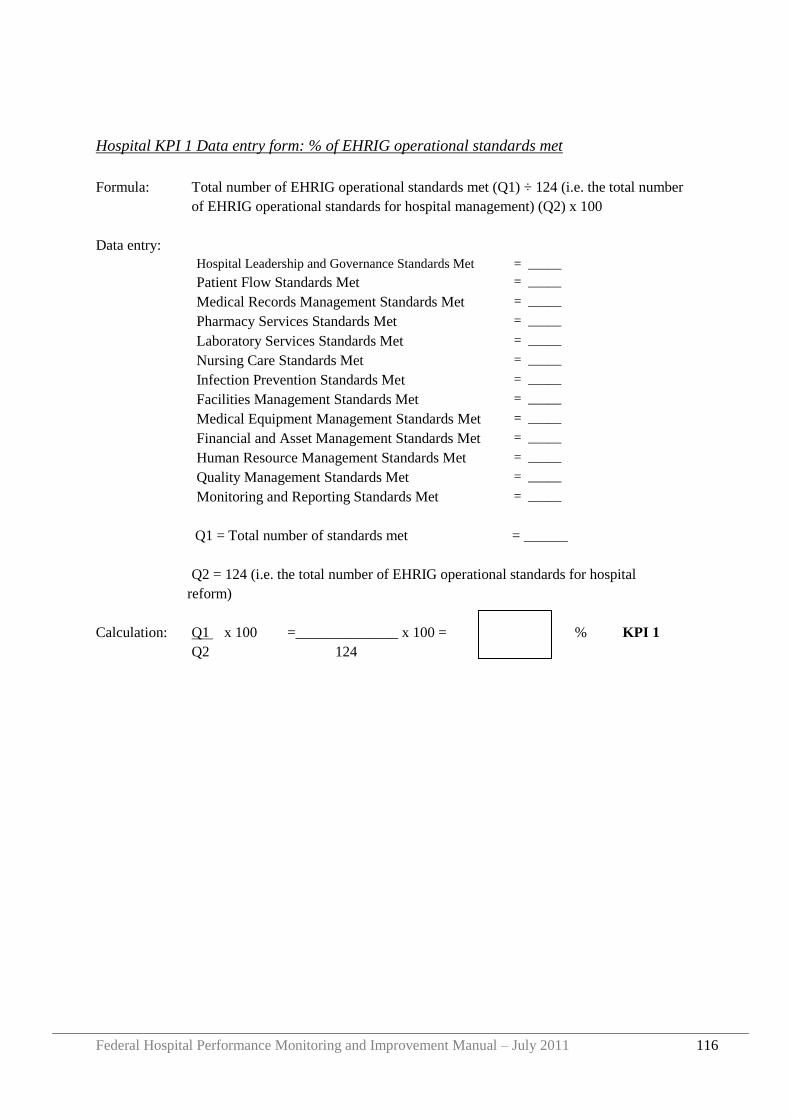
Federal Hospital Performance Monitoring and Improvement Manual – July 2011 116
Hospital KPI 1 Data entry form: % of EHRIG operational standards met
Formula: Total number of EHRIG operational standards met (Q1) ÷ 124 (i.e. the total number
of EHRIG operational standards for hospital management) (Q2) x 100
Data entry:
Hospital Leadership and Governance Standards Met = _____
Patient Flow Standards Met = _____
Medical Records Management Standards Met = _____
Pharmacy Services Standards Met = _____
Laboratory Services Standards Met = _____
Nursing Care Standards Met = _____
Infection Prevention Standards Met = _____
Facilities Management Standards Met = _____
Medical Equipment Management Standards Met = _____
Financial and Asset Management Standards Met = _____
Human Resource Management Standards Met = _____
Quality Management Standards Met = _____
Monitoring and Reporting Standards Met = _____
Q1 = Total number of standards met = ______
Q2 = 124 (i.e. the total number of EHRIG operational standards for hospital
reform)
Calculation: Q1 x 100 =______________ x 100 = % KPI 1
Q2 124
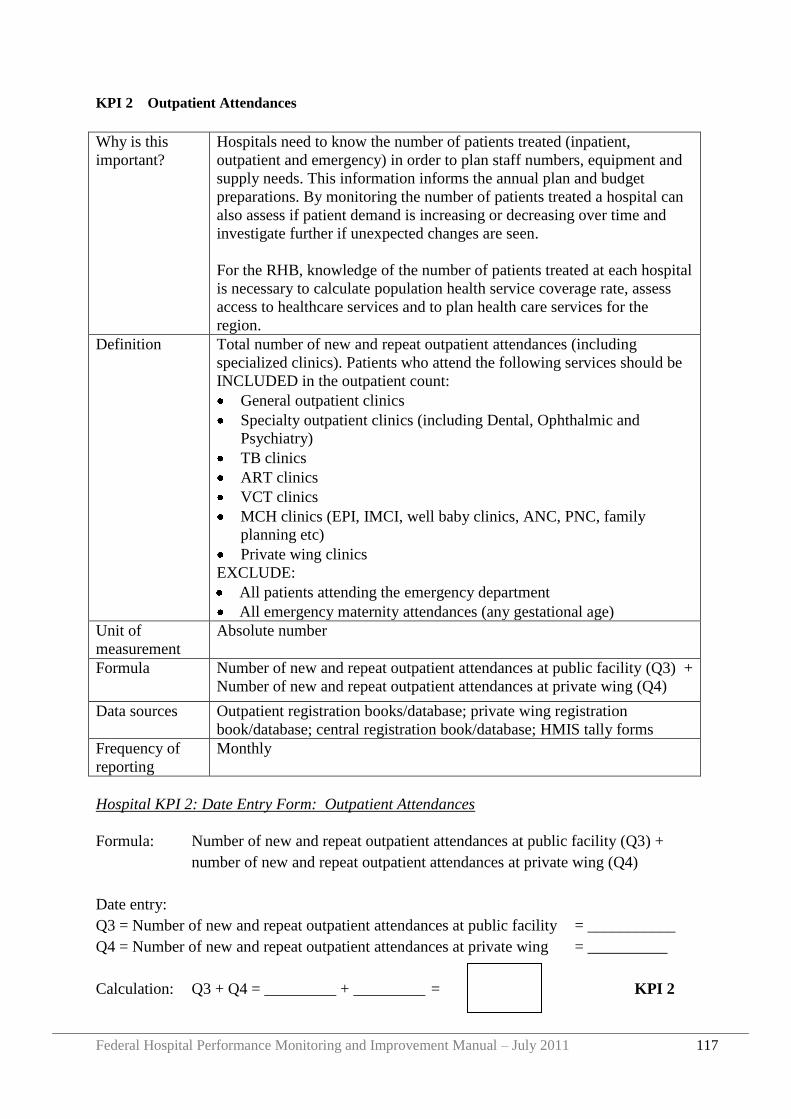
Federal Hospital Performance Monitoring and Improvement Manual – July 2011 117
KPI 2 Outpatient Attendances
Why is this
important?
Hospitals need to know the number of patients treated (inpatient,
outpatient and emergency) in order to plan staff numbers, equipment and
supply needs. This information informs the annual plan and budget
preparations. By monitoring the number of patients treated a hospital can
also assess if patient demand is increasing or decreasing over time and
investigate further if unexpected changes are seen.
For the RHB, knowledge of the number of patients treated at each hospital
is necessary to calculate population health service coverage rate, assess
access to healthcare services and to plan health care services for the
region.
Definition Total number of new and repeat outpatient attendances (including
specialized clinics). Patients who attend the following services should be
INCLUDED in the outpatient count:
General outpatient clinics
Specialty outpatient clinics (including Dental, Ophthalmic and
Psychiatry)
TB clinics
ART clinics
VCT clinics
MCH clinics (EPI, IMCI, well baby clinics, ANC, PNC, family
planning etc)
Private wing clinics
EXCLUDE:
All patients attending the emergency department
All emergency maternity attendances (any gestational age)
Unit of
measurement
Absolute number
Formula Number of new and repeat outpatient attendances at public facility (Q3) +
Number of new and repeat outpatient attendances at private wing (Q4)
Data sources Outpatient registration books/database; private wing registration
book/database; central registration book/database; HMIS tally forms
Frequency of
reporting
Monthly
Hospital KPI 2: Date Entry Form: Outpatient Attendances
Formula: Number of new and repeat outpatient attendances at public facility (Q3) +
number of new and repeat outpatient attendances at private wing (Q4)
Date entry:
Q3 = Number of new and repeat outpatient attendances at public facility = ___________
Q4 = Number of new and repeat outpatient attendances at private wing = __________
Calculation: Q3 + Q4 = _________ + _________ = KPI 2
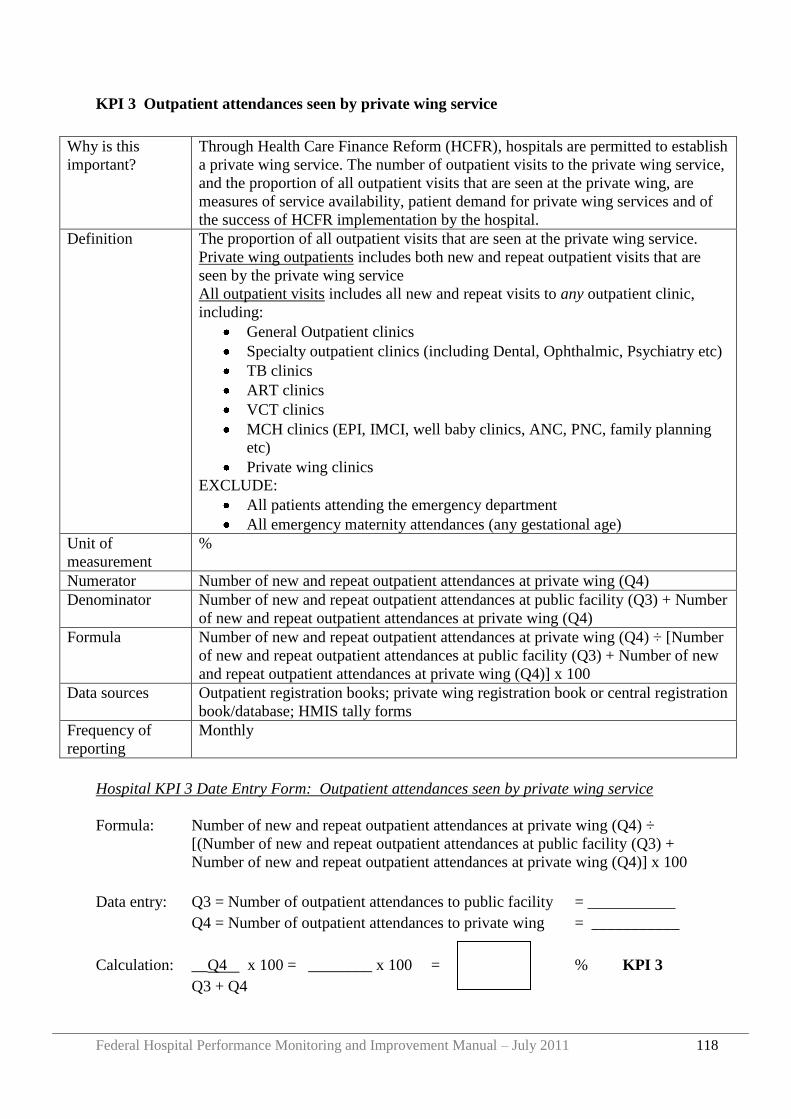
Federal Hospital Performance Monitoring and Improvement Manual – July 2011 118
KPI 3 Outpatient attendances seen by private wing service
Why is this
important?
Through Health Care Finance Reform (HCFR), hospitals are permitted to establish
a private wing service. The number of outpatient visits to the private wing service,
and the proportion of all outpatient visits that are seen at the private wing, are
measures of service availability, patient demand for private wing services and of
the success of HCFR implementation by the hospital.
Definition The proportion of all outpatient visits that are seen at the private wing service.
Private wing outpatients includes both new and repeat outpatient visits that are
seen by the private wing service
All outpatient visits includes all new and repeat visits to any outpatient clinic,
including:
General Outpatient clinics
Specialty outpatient clinics (including Dental, Ophthalmic, Psychiatry etc)
TB clinics
ART clinics
VCT clinics
MCH clinics (EPI, IMCI, well baby clinics, ANC, PNC, family planning
etc)
Private wing clinics
EXCLUDE:
All patients attending the emergency department
All emergency maternity attendances (any gestational age)
Unit of
measurement
%
Numerator Number of new and repeat outpatient attendances at private wing (Q4)
Denominator Number of new and repeat outpatient attendances at public facility (Q3) + Number
of new and repeat outpatient attendances at private wing (Q4)
Formula Number of new and repeat outpatient attendances at private wing (Q4) ÷ [Number
of new and repeat outpatient attendances at public facility (Q3) + Number of new
and repeat outpatient attendances at private wing (Q4)] x 100
Data sources Outpatient registration books; private wing registration book or central registration
book/database; HMIS tally forms
Frequency of
reporting
Monthly
Hospital KPI 3 Date Entry Form: Outpatient attendances seen by private wing service
Formula: Number of new and repeat outpatient attendances at private wing (Q4) ÷
[(Number of new and repeat outpatient attendances at public facility (Q3) +
Number of new and repeat outpatient attendances at private wing (Q4)] x 100
Data entry: Q3 = Number of outpatient attendances to public facility = ___________
Q4 = Number of outpatient attendances to private wing = ___________
Calculation: __Q4 x 100 = ________ x 100 = % KPI 3
Q3 + Q4
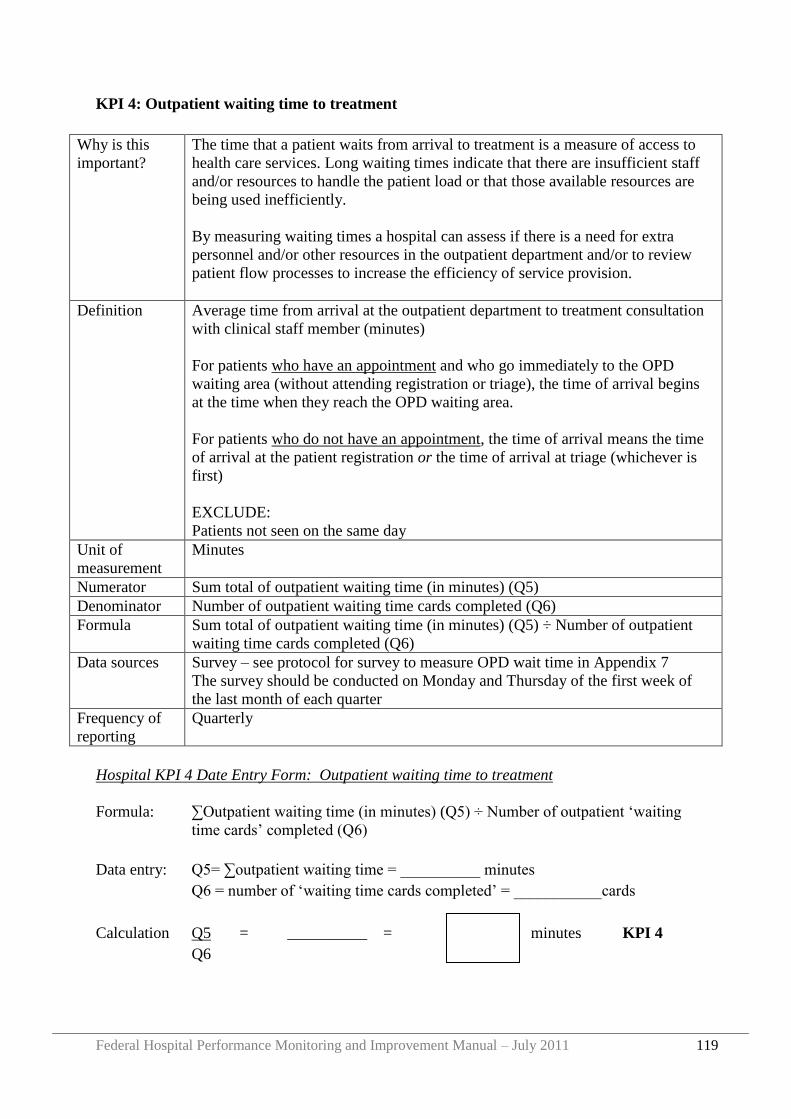
Federal Hospital Performance Monitoring and Improvement Manual – July 2011 119
KPI 4: Outpatient waiting time to treatment
Why is this
important?
The time that a patient waits from arrival to treatment is a measure of access to
health care services. Long waiting times indicate that there are insufficient staff
and/or resources to handle the patient load or that those available resources are
being used inefficiently.
By measuring waiting times a hospital can assess if there is a need for extra
personnel and/or other resources in the outpatient department and/or to review
patient flow processes to increase the efficiency of service provision.
Definition Average time from arrival at the outpatient department to treatment consultation
with clinical staff member (minutes)
For patients who have an appointment and who go immediately to the OPD
waiting area (without attending registration or triage), the time of arrival begins
at the time when they reach the OPD waiting area.
For patients who do not have an appointment, the time of arrival means the time
of arrival at the patient registration or the time of arrival at triage (whichever is
first)
EXCLUDE:
Patients not seen on the same day
Unit of
measurement
Minutes
Numerator Sum total of outpatient waiting time (in minutes) (Q5)
Denominator Number of outpatient waiting time cards completed (Q6)
Formula Sum total of outpatient waiting time (in minutes) (Q5) ÷ Number of outpatient
waiting time cards completed (Q6)
Data sources Survey – see protocol for survey to measure OPD wait time in Appendix 7
The survey should be conducted on Monday and Thursday of the first week of
the last month of each quarter
Frequency of
reporting
Quarterly
Hospital KPI 4 Date Entry Form: Outpatient waiting time to treatment
Formula: ∑Outpatient waiting time (in minutes) (Q5) † Number of outpatient „waiting
time cards‟ completed (Q6)
Data entry: Q5= ∑outpatient waiting time = __________ minutes
Q6 = number of „waiting time cards completed‟ = ___________cards
Calculation Q5 = __________ = minutes KPI 4
Q6
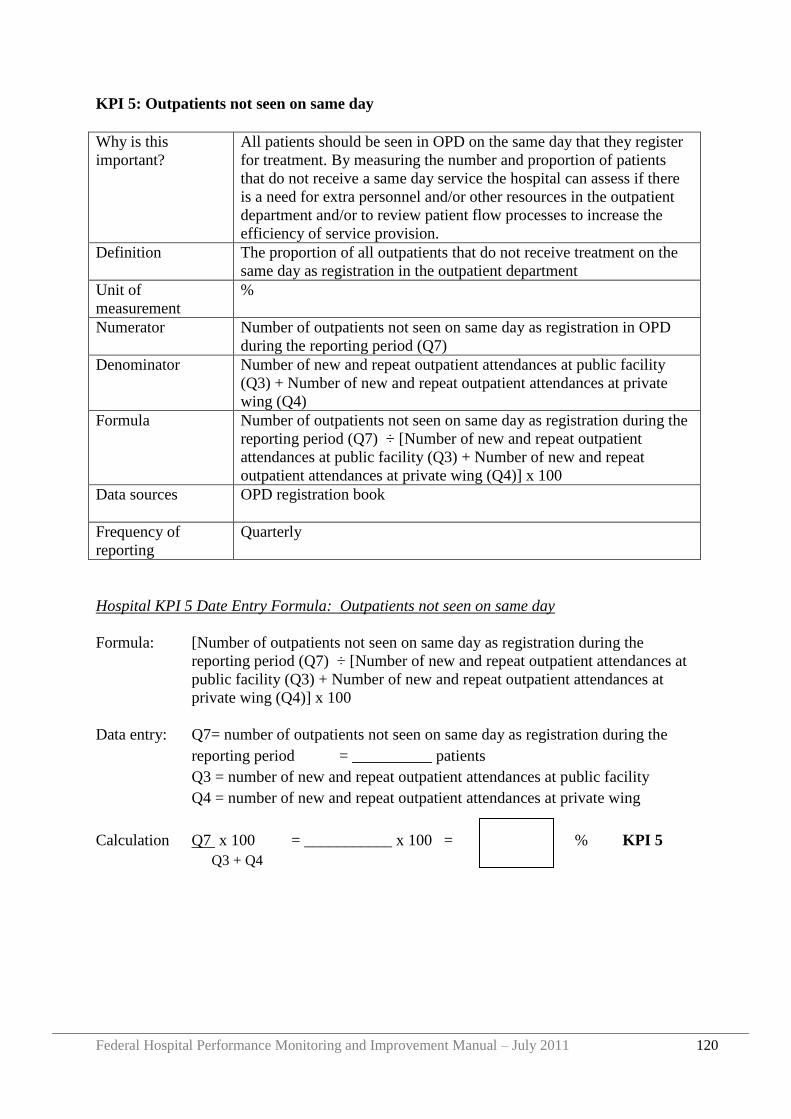
Federal Hospital Performance Monitoring and Improvement Manual – July 2011 120
KPI 5: Outpatients not seen on same day
Why is this
important?
All patients should be seen in OPD on the same day that they register
for treatment. By measuring the number and proportion of patients
that do not receive a same day service the hospital can assess if there
is a need for extra personnel and/or other resources in the outpatient
department and/or to review patient flow processes to increase the
efficiency of service provision.
Definition The proportion of all outpatients that do not receive treatment on the
same day as registration in the outpatient department
Unit of
measurement
%
Numerator Number of outpatients not seen on same day as registration in OPD
during the reporting period (Q7)
Denominator Number of new and repeat outpatient attendances at public facility
(Q3) + Number of new and repeat outpatient attendances at private
wing (Q4)
Formula Number of outpatients not seen on same day as registration during the
reporting period (Q7) ÷ [Number of new and repeat outpatient
attendances at public facility (Q3) + Number of new and repeat
outpatient attendances at private wing (Q4)] x 100
Data sources OPD registration book
Frequency of
reporting
Quarterly
Hospital KPI 5 Date Entry Formula: Outpatients not seen on same day
Formula: [Number of outpatients not seen on same day as registration during the
reporting period (Q7) ÷ [Number of new and repeat outpatient attendances at
public facility (Q3) + Number of new and repeat outpatient attendances at
private wing (Q4)] x 100
Data entry: Q7= number of outpatients not seen on same day as registration during the
reporting period = __________ patients
Q3 = number of new and repeat outpatient attendances at public facility
Q4 = number of new and repeat outpatient attendances at private wing
Calculation Q7 x 100 = ___________ x 100 = % KPI 5
Q3 + Q4
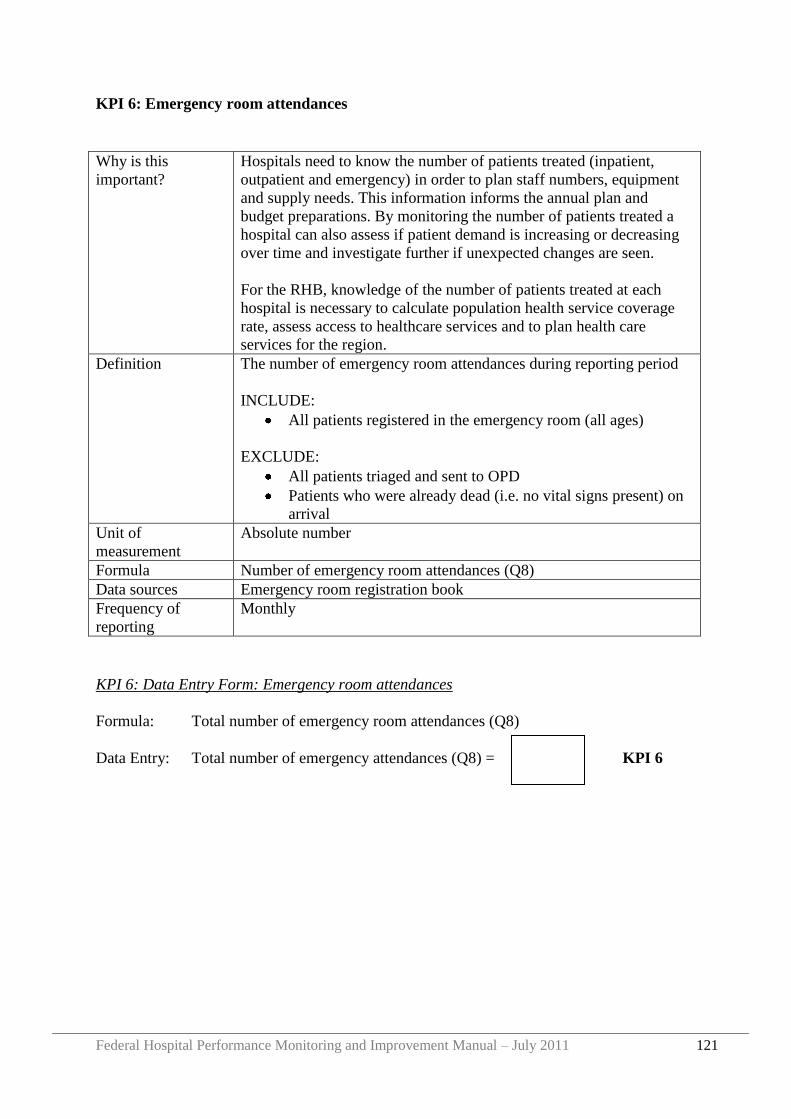
Federal Hospital Performance Monitoring and Improvement Manual – July 2011 121
KPI 6: Emergency room attendances
Why is this
important?
Hospitals need to know the number of patients treated (inpatient,
outpatient and emergency) in order to plan staff numbers, equipment
and supply needs. This information informs the annual plan and
budget preparations. By monitoring the number of patients treated a
hospital can also assess if patient demand is increasing or decreasing
over time and investigate further if unexpected changes are seen.
For the RHB, knowledge of the number of patients treated at each
hospital is necessary to calculate population health service coverage
rate, assess access to healthcare services and to plan health care
services for the region.
Definition The number of emergency room attendances during reporting period
INCLUDE:
All patients registered in the emergency room (all ages)
EXCLUDE:
All patients triaged and sent to OPD
Patients who were already dead (i.e. no vital signs present) on
arrival
Unit of
measurement
Absolute number
Formula Number of emergency room attendances (Q8)
Data sources Emergency room registration book
Frequency of
reporting
Monthly
KPI 6: Data Entry Form: Emergency room attendances
Formula: Total number of emergency room attendances (Q8)
Data Entry: Total number of emergency attendances (Q8) = KPI 6
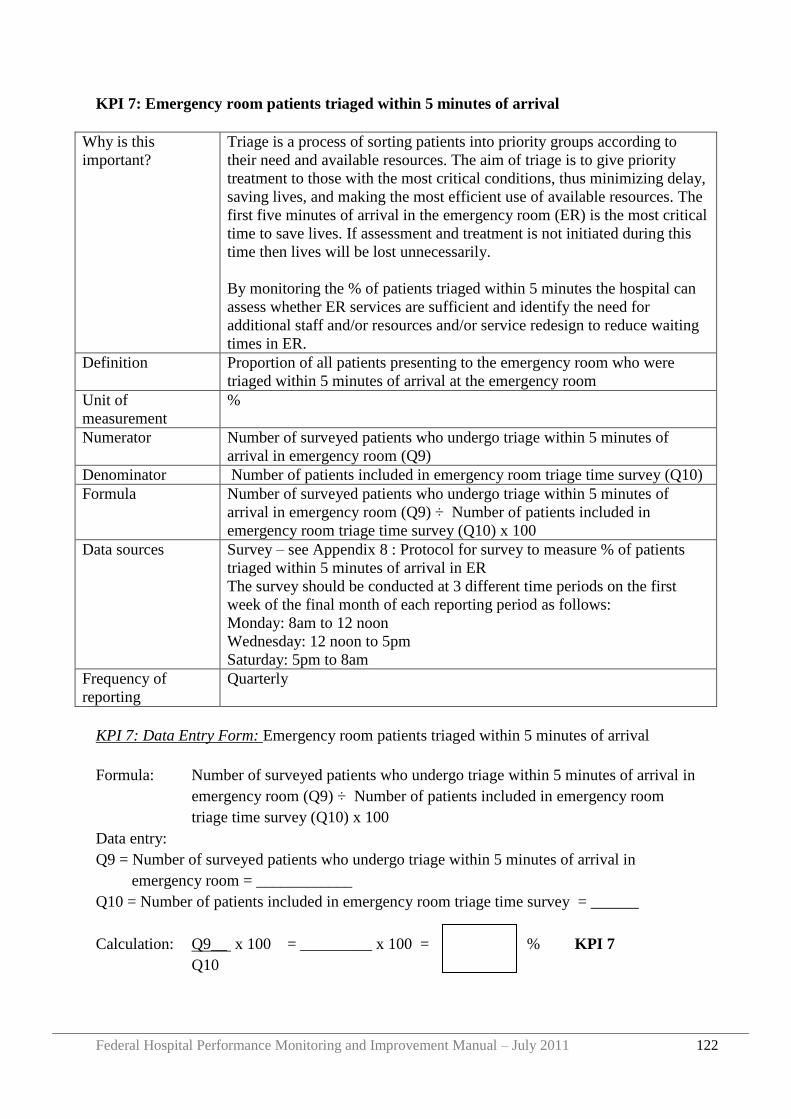
Federal Hospital Performance Monitoring and Improvement Manual – July 2011 122
KPI 7: Emergency room patients triaged within 5 minutes of arrival
Why is this
important?
Triage is a process of sorting patients into priority groups according to
their need and available resources. The aim of triage is to give priority
treatment to those with the most critical conditions, thus minimizing delay,
saving lives, and making the most efficient use of available resources. The
first five minutes of arrival in the emergency room (ER) is the most critical
time to save lives. If assessment and treatment is not initiated during this
time then lives will be lost unnecessarily.
By monitoring the % of patients triaged within 5 minutes the hospital can
assess whether ER services are sufficient and identify the need for
additional staff and/or resources and/or service redesign to reduce waiting
times in ER.
Definition Proportion of all patients presenting to the emergency room who were
triaged within 5 minutes of arrival at the emergency room
Unit of
measurement
%
Numerator Number of surveyed patients who undergo triage within 5 minutes of
arrival in emergency room (Q9)
Denominator Number of patients included in emergency room triage time survey (Q10)
Formula Number of surveyed patients who undergo triage within 5 minutes of
arrival in emergency room (Q9) ÷ Number of patients included in
emergency room triage time survey (Q10) x 100
Data sources Survey – see Appendix 8 : Protocol for survey to measure % of patients
triaged within 5 minutes of arrival in ER
The survey should be conducted at 3 different time periods on the first
week of the final month of each reporting period as follows:
Monday: 8am to 12 noon
Wednesday: 12 noon to 5pm
Saturday: 5pm to 8am
Frequency of
reporting
Quarterly
KPI 7: Data Entry Form: Emergency room patients triaged within 5 minutes of arrival
Formula: Number of surveyed patients who undergo triage within 5 minutes of arrival in
emergency room (Q9) ÷ Number of patients included in emergency room
triage time survey (Q10) x 100
Data entry:
Q9 = Number of surveyed patients who undergo triage within 5 minutes of arrival in
emergency room = ____________
Q10 = Number of patients included in emergency room triage time survey = ______
Calculation: Q9__ x 100 = _________ x 100 = % KPI 7
Q10
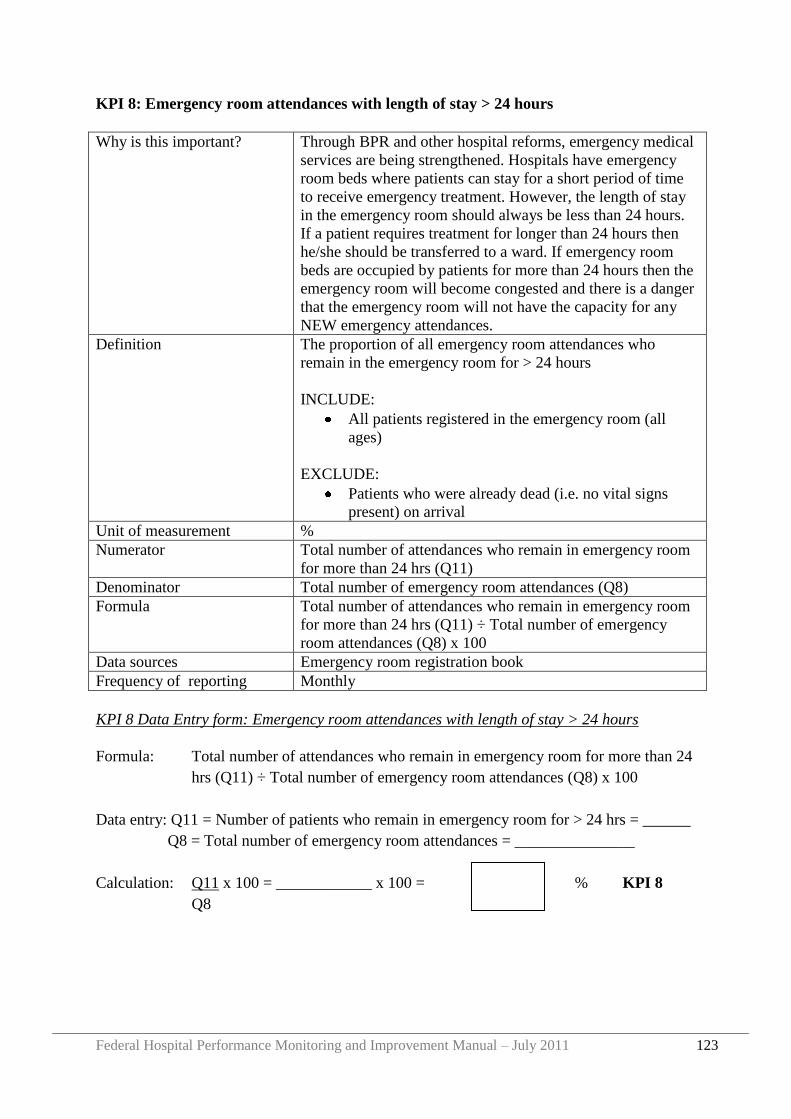
Federal Hospital Performance Monitoring and Improvement Manual – July 2011 123
KPI 8: Emergency room attendances with length of stay > 24 hours
Why is this important? Through BPR and other hospital reforms, emergency medical
services are being strengthened. Hospitals have emergency
room beds where patients can stay for a short period of time
to receive emergency treatment. However, the length of stay
in the emergency room should always be less than 24 hours.
If a patient requires treatment for longer than 24 hours then
he/she should be transferred to a ward. If emergency room
beds are occupied by patients for more than 24 hours then the
emergency room will become congested and there is a danger
that the emergency room will not have the capacity for any
NEW emergency attendances.
Definition The proportion of all emergency room attendances who
remain in the emergency room for > 24 hours
INCLUDE:
All patients registered in the emergency room (all
ages)
EXCLUDE:
Patients who were already dead (i.e. no vital signs
present) on arrival
Unit of measurement %
Numerator Total number of attendances who remain in emergency room
for more than 24 hrs (Q11)
Denominator Total number of emergency room attendances (Q8)
Formula Total number of attendances who remain in emergency room
for more than 24 hrs (Q11) ÷ Total number of emergency
room attendances (Q8) x 100
Data sources Emergency room registration book
Frequency of reporting Monthly
KPI 8 Data Entry form: Emergency room attendances with length of stay > 24 hours
Formula: Total number of attendances who remain in emergency room for more than 24
hrs (Q11) ÷ Total number of emergency room attendances (Q8) x 100
Data entry: Q11 = Number of patients who remain in emergency room for > 24 hrs = ______
Q8 = Total number of emergency room attendances = _______________
Calculation: Q11 x 100 = ____________ x 100 = % KPI 8
Q8
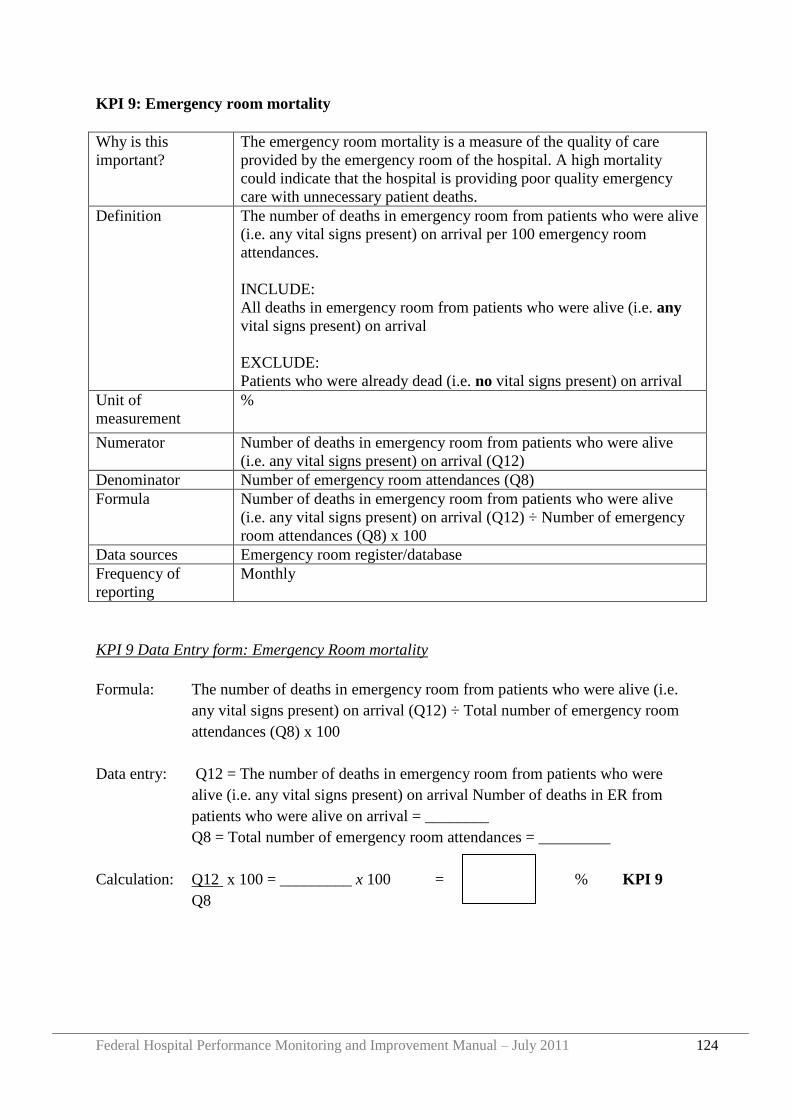
Federal Hospital Performance Monitoring and Improvement Manual – July 2011 124
KPI 9: Emergency room mortality
Why is this
important?
The emergency room mortality is a measure of the quality of care
provided by the emergency room of the hospital. A high mortality
could indicate that the hospital is providing poor quality emergency
care with unnecessary patient deaths.
Definition The number of deaths in emergency room from patients who were alive
(i.e. any vital signs present) on arrival per 100 emergency room
attendances.
INCLUDE:
All deaths in emergency room from patients who were alive (i.e. any
vital signs present) on arrival
EXCLUDE:
Patients who were already dead (i.e. no vital signs present) on arrival
Unit of
measurement
%
Numerator Number of deaths in emergency room from patients who were alive
(i.e. any vital signs present) on arrival (Q12)
Denominator Number of emergency room attendances (Q8)
Formula Number of deaths in emergency room from patients who were alive
(i.e. any vital signs present) on arrival (Q12) ÷ Number of emergency
room attendances (Q8) x 100
Data sources Emergency room register/database
Frequency of
reporting
Monthly
KPI 9 Data Entry form: Emergency Room mortality
Formula: The number of deaths in emergency room from patients who were alive (i.e.
any vital signs present) on arrival (Q12) ÷ Total number of emergency room
attendances (Q8) x 100
Data entry: Q12 = The number of deaths in emergency room from patients who were
alive (i.e. any vital signs present) on arrival Number of deaths in ER from
patients who were alive on arrival = ________
Q8 = Total number of emergency room attendances = _________
Calculation: Q12 x 100 = _________ x 100 = % KPI 9
Q8
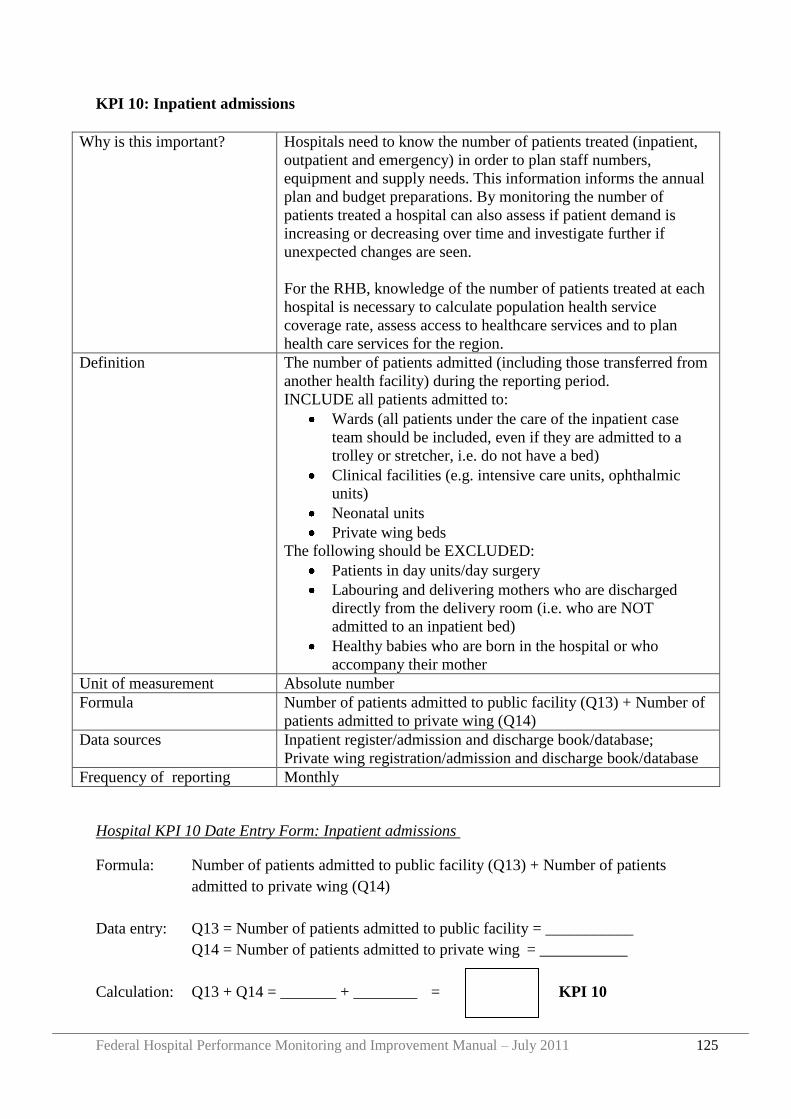
Federal Hospital Performance Monitoring and Improvement Manual – July 2011 125
KPI 10: Inpatient admissions
Why is this important? Hospitals need to know the number of patients treated (inpatient,
outpatient and emergency) in order to plan staff numbers,
equipment and supply needs. This information informs the annual
plan and budget preparations. By monitoring the number of
patients treated a hospital can also assess if patient demand is
increasing or decreasing over time and investigate further if
unexpected changes are seen.
For the RHB, knowledge of the number of patients treated at each
hospital is necessary to calculate population health service
coverage rate, assess access to healthcare services and to plan
health care services for the region.
Definition The number of patients admitted (including those transferred from
another health facility) during the reporting period.
INCLUDE all patients admitted to:
Wards (all patients under the care of the inpatient case
team should be included, even if they are admitted to a
trolley or stretcher, i.e. do not have a bed)
Clinical facilities (e.g. intensive care units, ophthalmic
units)
Neonatal units
Private wing beds
The following should be EXCLUDED:
Patients in day units/day surgery
Labouring and delivering mothers who are discharged
directly from the delivery room (i.e. who are NOT
admitted to an inpatient bed)
Healthy babies who are born in the hospital or who
accompany their mother
Unit of measurement Absolute number
Formula Number of patients admitted to public facility (Q13) + Number of
patients admitted to private wing (Q14)
Data sources Inpatient register/admission and discharge book/database;
Private wing registration/admission and discharge book/database
Frequency of reporting Monthly
Hospital KPI 10 Date Entry Form: Inpatient admissions
Formula: Number of patients admitted to public facility (Q13) + Number of patients
admitted to private wing (Q14)
Data entry: Q13 = Number of patients admitted to public facility = ___________
Q14 = Number of patients admitted to private wing = ___________
Calculation: Q13 + Q14 = _______ + ________ = KPI 10
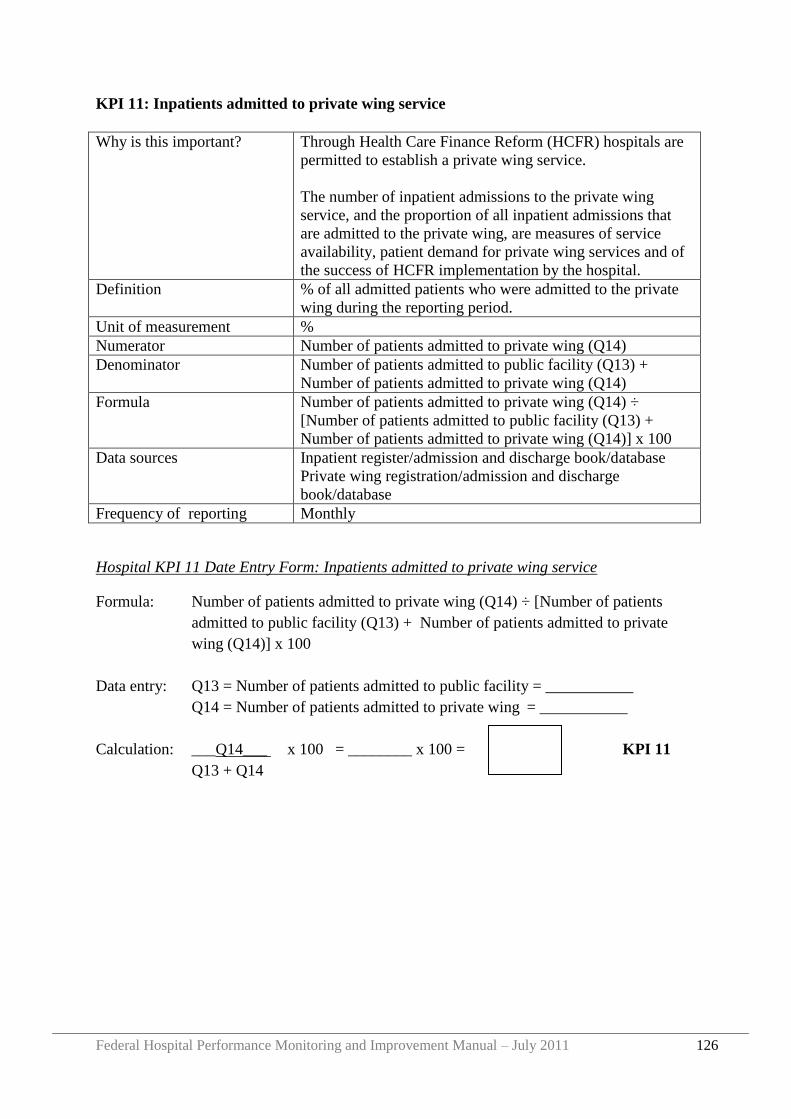
Federal Hospital Performance Monitoring and Improvement Manual – July 2011 126
KPI 11: Inpatients admitted to private wing service
Why is this important? Through Health Care Finance Reform (HCFR) hospitals are
permitted to establish a private wing service.
The number of inpatient admissions to the private wing
service, and the proportion of all inpatient admissions that
are admitted to the private wing, are measures of service
availability, patient demand for private wing services and of
the success of HCFR implementation by the hospital.
Definition % of all admitted patients who were admitted to the private
wing during the reporting period.
Unit of measurement %
Numerator Number of patients admitted to private wing (Q14)
Denominator Number of patients admitted to public facility (Q13) +
Number of patients admitted to private wing (Q14)
Formula Number of patients admitted to private wing (Q14) ÷
[Number of patients admitted to public facility (Q13) +
Number of patients admitted to private wing (Q14)] x 100
Data sources Inpatient register/admission and discharge book/database
Private wing registration/admission and discharge
book/database
Frequency of reporting Monthly
Hospital KPI 11 Date Entry Form: Inpatients admitted to private wing service
Formula: Number of patients admitted to private wing (Q14) ÷ [Number of patients
admitted to public facility (Q13) + Number of patients admitted to private
wing (Q14)] x 100
Data entry: Q13 = Number of patients admitted to public facility = ___________
Q14 = Number of patients admitted to private wing = ___________
Calculation: ___Q14___ x 100 = ________ x 100 = KPI 11
Q13 + Q14
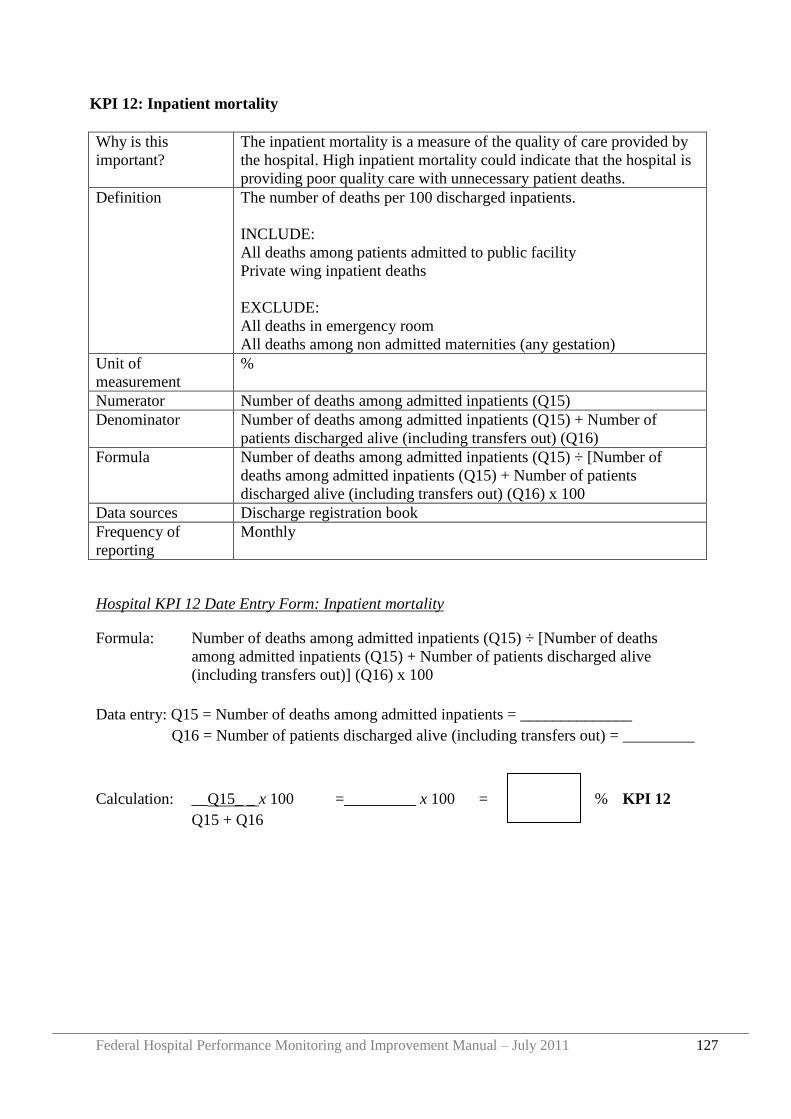
Federal Hospital Performance Monitoring and Improvement Manual – July 2011 127
KPI 12: Inpatient mortality
Why is this
important?
The inpatient mortality is a measure of the quality of care provided by
the hospital. High inpatient mortality could indicate that the hospital is
providing poor quality care with unnecessary patient deaths.
Definition The number of deaths per 100 discharged inpatients.
INCLUDE:
All deaths among patients admitted to public facility
Private wing inpatient deaths
EXCLUDE:
All deaths in emergency room
All deaths among non admitted maternities (any gestation)
Unit of
measurement
%
Numerator Number of deaths among admitted inpatients (Q15)
Denominator Number of deaths among admitted inpatients (Q15) + Number of
patients discharged alive (including transfers out) (Q16)
Formula Number of deaths among admitted inpatients (Q15) ÷ [Number of
deaths among admitted inpatients (Q15) + Number of patients
discharged alive (including transfers out) (Q16) x 100
Data sources Discharge registration book
Frequency of
reporting
Monthly
Hospital KPI 12 Date Entry Form: Inpatient mortality
Formula: Number of deaths among admitted inpatients (Q15) ÷ [Number of deaths
among admitted inpatients (Q15) + Number of patients discharged alive
(including transfers out)] (Q16) x 100
Data entry: Q15 = Number of deaths among admitted inpatients = ______________
Q16 = Number of patients discharged alive (including transfers out) = _________
Calculation: __Q15_ _ x 100 =_________ x 100 = % KPI 12
Q15 + Q16
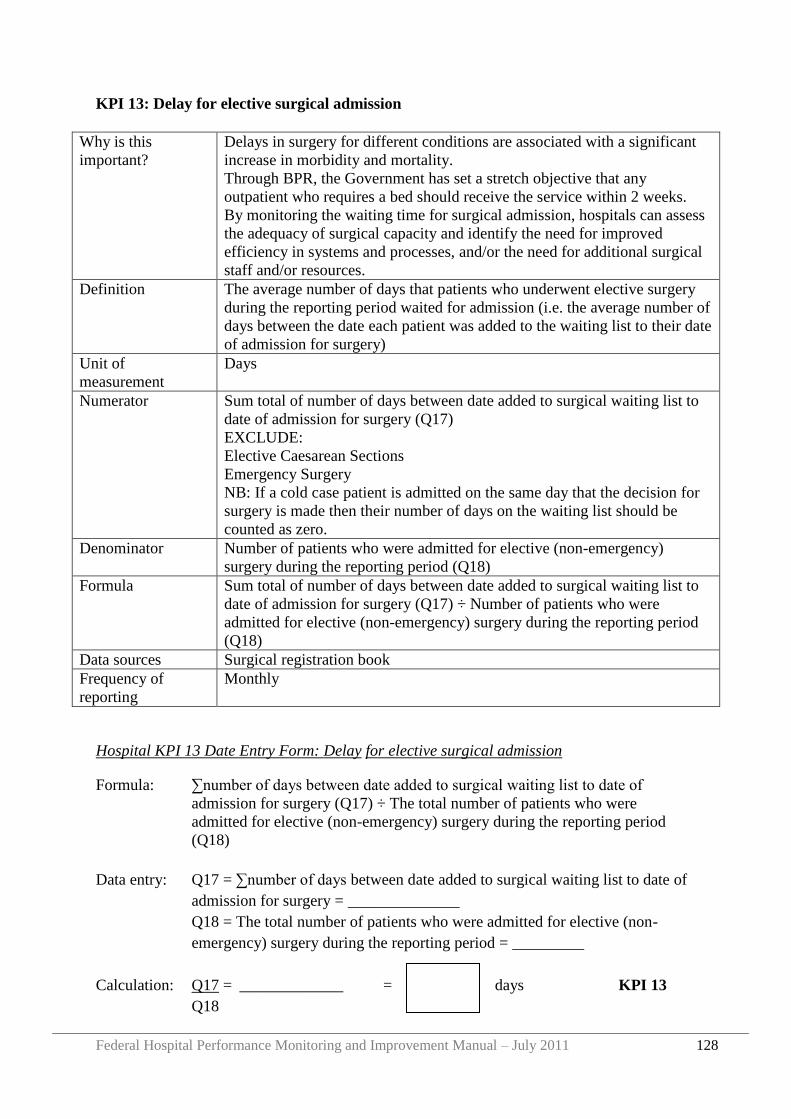
Federal Hospital Performance Monitoring and Improvement Manual – July 2011 128
KPI 13: Delay for elective surgical admission
Why is this
important?
Delays in surgery for different conditions are associated with a significant
increase in morbidity and mortality.
Through BPR, the Government has set a stretch objective that any
outpatient who requires a bed should receive the service within 2 weeks.
By monitoring the waiting time for surgical admission, hospitals can assess
the adequacy of surgical capacity and identify the need for improved
efficiency in systems and processes, and/or the need for additional surgical
staff and/or resources.
Definition The average number of days that patients who underwent elective surgery
during the reporting period waited for admission (i.e. the average number of
days between the date each patient was added to the waiting list to their date
of admission for surgery)
Unit of
measurement
Days
Numerator Sum total of number of days between date added to surgical waiting list to
date of admission for surgery (Q17)
EXCLUDE:
Elective Caesarean Sections
Emergency Surgery
NB: If a cold case patient is admitted on the same day that the decision for
surgery is made then their number of days on the waiting list should be
counted as zero.
Denominator Number of patients who were admitted for elective (non-emergency)
surgery during the reporting period (Q18)
Formula Sum total of number of days between date added to surgical waiting list to
date of admission for surgery (Q17) ÷ Number of patients who were
admitted for elective (non-emergency) surgery during the reporting period
(Q18)
Data sources Surgical registration book
Frequency of
reporting
Monthly
Hospital KPI 13 Date Entry Form: Delay for elective surgical admission
Formula: ∑number of days between date added to surgical waiting list to date of
admission for surgery (Q17) ÷ The total number of patients who were
admitted for elective (non-emergency) surgery during the reporting period
(Q18)
Data entry: Q17 = ∑number of days between date added to surgical waiting list to date of
admission for surgery = ______________
Q18 = The total number of patients who were admitted for elective (non-
emergency) surgery during the reporting period = _________
Calculation: Q17 = _____________ = days KPI 13
Q18
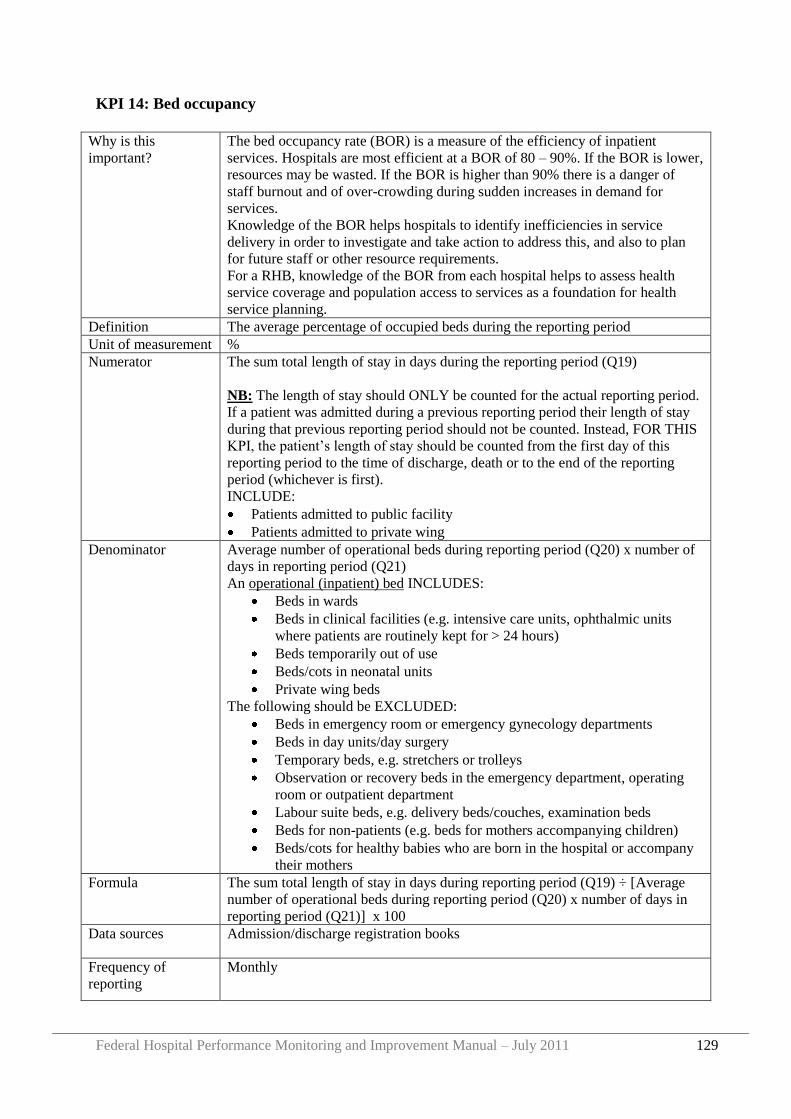
Federal Hospital Performance Monitoring and Improvement Manual – July 2011 129
KPI 14: Bed occupancy
Why is this
important?
The bed occupancy rate (BOR) is a measure of the efficiency of inpatient
services. Hospitals are most efficient at a BOR of 80 – 90%. If the BOR is lower,
resources may be wasted. If the BOR is higher than 90% there is a danger of
staff burnout and of over-crowding during sudden increases in demand for
services.
Knowledge of the BOR helps hospitals to identify inefficiencies in service
delivery in order to investigate and take action to address this, and also to plan
for future staff or other resource requirements.
For a RHB, knowledge of the BOR from each hospital helps to assess health
service coverage and population access to services as a foundation for health
service planning.
Definition The average percentage of occupied beds during the reporting period
Unit of measurement %
Numerator The sum total length of stay in days during the reporting period (Q19)
NB: The length of stay should ONLY be counted for the actual reporting period.
If a patient was admitted during a previous reporting period their length of stay
during that previous reporting period should not be counted. Instead, FOR THIS
KPI, the patient‟s length of stay should be counted from the first day of this
reporting period to the time of discharge, death or to the end of the reporting
period (whichever is first).
INCLUDE:
Patients admitted to public facility
Patients admitted to private wing
Denominator Average number of operational beds during reporting period (Q20) x number of
days in reporting period (Q21)
An operational (inpatient) bed INCLUDES:
Beds in wards
Beds in clinical facilities (e.g. intensive care units, ophthalmic units
where patients are routinely kept for > 24 hours)
Beds temporarily out of use
Beds/cots in neonatal units
Private wing beds
The following should be EXCLUDED:
Beds in emergency room or emergency gynecology departments
Beds in day units/day surgery
Temporary beds, e.g. stretchers or trolleys
Observation or recovery beds in the emergency department, operating
room or outpatient department
Labour suite beds, e.g. delivery beds/couches, examination beds
Beds for non-patients (e.g. beds for mothers accompanying children)
Beds/cots for healthy babies who are born in the hospital or accompany
their mothers
Formula The sum total length of stay in days during reporting period (Q19) ÷ [Average
number of operational beds during reporting period (Q20) x number of days in
reporting period (Q21)] x 100
Data sources Admission/discharge registration books
Frequency of
reporting
Monthly
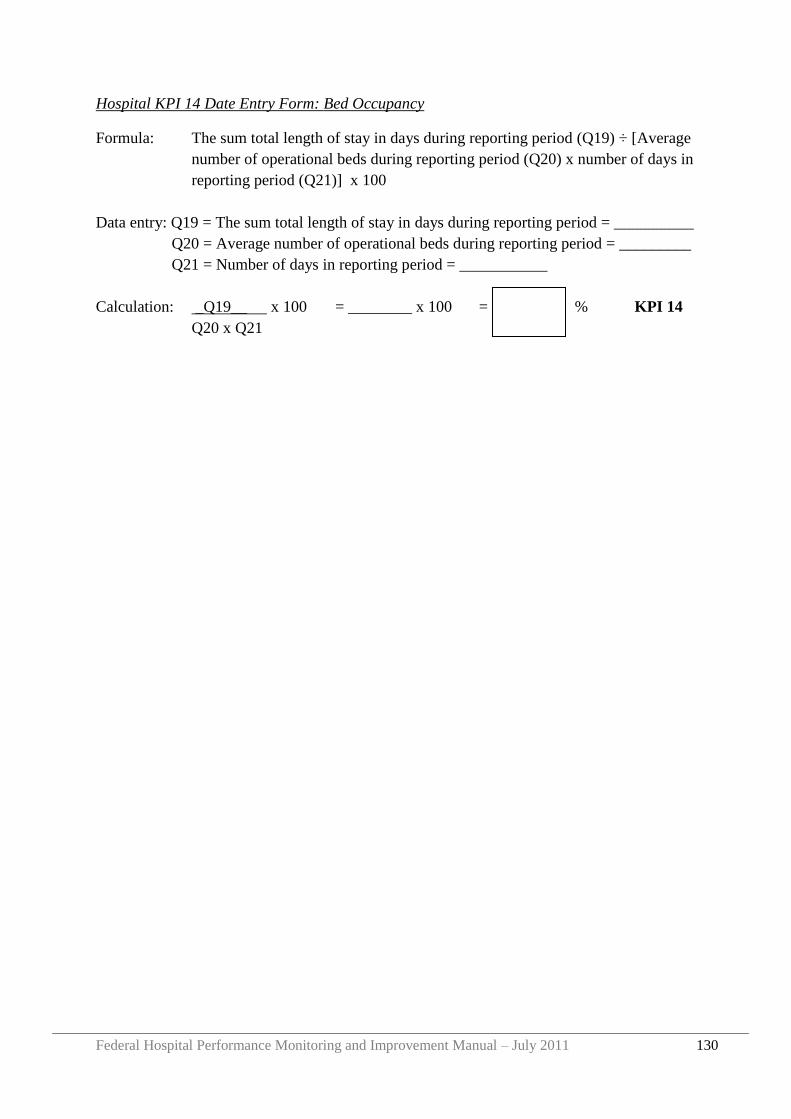
Federal Hospital Performance Monitoring and Improvement Manual – July 2011 130
Hospital KPI 14 Date Entry Form: Bed Occupancy
Formula: The sum total length of stay in days during reporting period (Q19) ÷ [Average
number of operational beds during reporting period (Q20) x number of days in
reporting period (Q21)] x 100
Data entry: Q19 = The sum total length of stay in days during reporting period = __________
Q20 = Average number of operational beds during reporting period = _________
Q21 = Number of days in reporting period = ___________
Calculation: _Q19__ x 100 = ________ x 100 = % KPI 14
Q20 x Q21
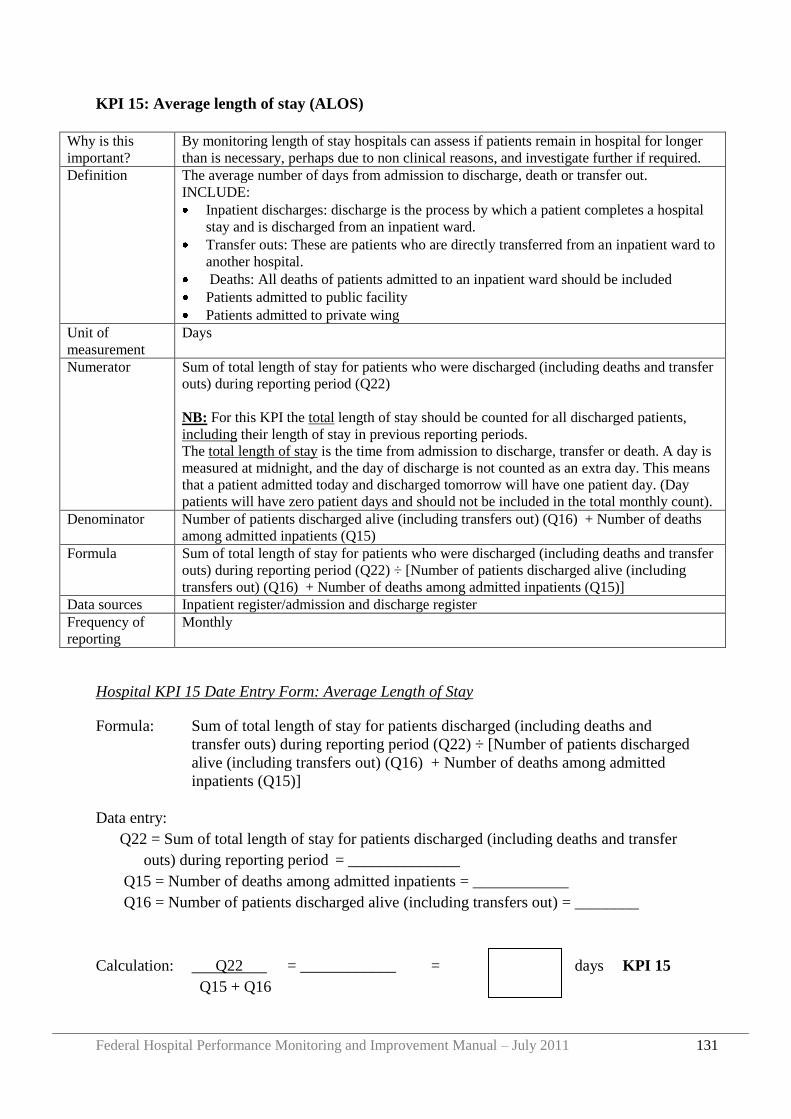
Federal Hospital Performance Monitoring and Improvement Manual – July 2011 131
KPI 15: Average length of stay (ALOS)
Why is this
important?
By monitoring length of stay hospitals can assess if patients remain in hospital for longer
than is necessary, perhaps due to non clinical reasons, and investigate further if required.
Definition The average number of days from admission to discharge, death or transfer out.
INCLUDE:
Inpatient discharges: discharge is the process by which a patient completes a hospital
stay and is discharged from an inpatient ward.
Transfer outs: These are patients who are directly transferred from an inpatient ward to
another hospital.
Deaths: All deaths of patients admitted to an inpatient ward should be included
Patients admitted to public facility
Patients admitted to private wing
Unit of
measurement
Days
Numerator Sum of total length of stay for patients who were discharged (including deaths and transfer
outs) during reporting period (Q22)
NB: For this KPI the total length of stay should be counted for all discharged patients,
including their length of stay in previous reporting periods.
The total length of stay is the time from admission to discharge, transfer or death. A day is
measured at midnight, and the day of discharge is not counted as an extra day. This means
that a patient admitted today and discharged tomorrow will have one patient day. (Day
patients will have zero patient days and should not be included in the total monthly count).
Denominator Number of patients discharged alive (including transfers out) (Q16) + Number of deaths
among admitted inpatients (Q15)
Formula Sum of total length of stay for patients who were discharged (including deaths and transfer
outs) during reporting period (Q22) ÷ [Number of patients discharged alive (including
transfers out) (Q16) + Number of deaths among admitted inpatients (Q15)]
Data sources Inpatient register/admission and discharge register
Frequency of
reporting
Monthly
Hospital KPI 15 Date Entry Form: Average Length of Stay
Formula: Sum of total length of stay for patients discharged (including deaths and
transfer outs) during reporting period (Q22) ÷ [Number of patients discharged
alive (including transfers out) (Q16) + Number of deaths among admitted
inpatients (Q15)]
Data entry:
Q22 = Sum of total length of stay for patients discharged (including deaths and transfer
outs) during reporting period = ______________
Q15 = Number of deaths among admitted inpatients = ____________
Q16 = Number of patients discharged alive (including transfers out) = ________
Calculation: Q22 = ____________ = days KPI 15
Q15 + Q16
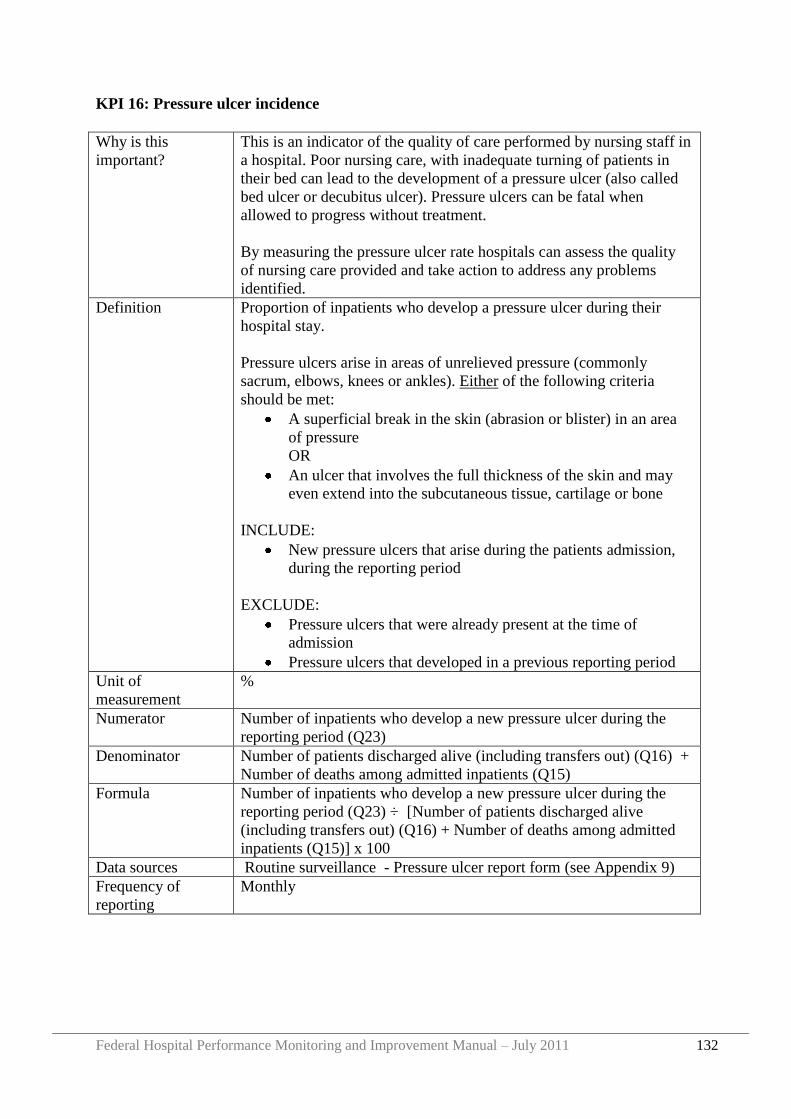
Federal Hospital Performance Monitoring and Improvement Manual – July 2011 132
KPI 16: Pressure ulcer incidence
Why is this
important?
This is an indicator of the quality of care performed by nursing staff in
a hospital. Poor nursing care, with inadequate turning of patients in
their bed can lead to the development of a pressure ulcer (also called
bed ulcer or decubitus ulcer). Pressure ulcers can be fatal when
allowed to progress without treatment.
By measuring the pressure ulcer rate hospitals can assess the quality
of nursing care provided and take action to address any problems
identified.
Definition Proportion of inpatients who develop a pressure ulcer during their
hospital stay.
Pressure ulcers arise in areas of unrelieved pressure (commonly
sacrum, elbows, knees or ankles). Either of the following criteria
should be met:
A superficial break in the skin (abrasion or blister) in an area
of pressure
OR
An ulcer that involves the full thickness of the skin and may
even extend into the subcutaneous tissue, cartilage or bone
INCLUDE:
New pressure ulcers that arise during the patients admission,
during the reporting period
EXCLUDE:
Pressure ulcers that were already present at the time of
admission
Pressure ulcers that developed in a previous reporting period
Unit of
measurement
%
Numerator Number of inpatients who develop a new pressure ulcer during the
reporting period (Q23)
Denominator Number of patients discharged alive (including transfers out) (Q16) +
Number of deaths among admitted inpatients (Q15)
Formula Number of inpatients who develop a new pressure ulcer during the
reporting period (Q23) ÷ [Number of patients discharged alive
(including transfers out) (Q16) + Number of deaths among admitted
inpatients (Q15)] x 100
Data sources Routine surveillance - Pressure ulcer report form (see Appendix 9)
Frequency of
reporting
Monthly
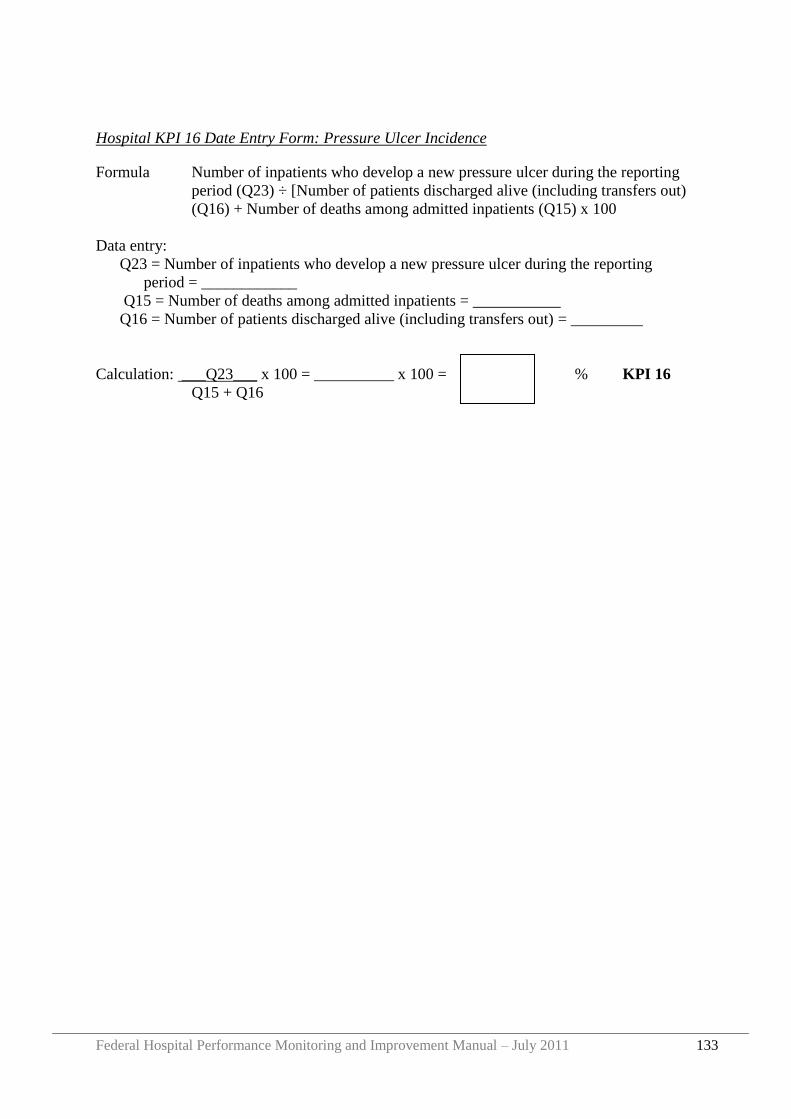
Federal Hospital Performance Monitoring and Improvement Manual – July 2011 133
Hospital KPI 16 Date Entry Form: Pressure Ulcer Incidence
Formula Number of inpatients who develop a new pressure ulcer during the reporting
period (Q23) ÷ [Number of patients discharged alive (including transfers out)
(Q16) + Number of deaths among admitted inpatients (Q15) x 100
Data entry:
Q23 = Number of inpatients who develop a new pressure ulcer during the reporting
period = ____________
Q15 = Number of deaths among admitted inpatients = ___________
Q16 = Number of patients discharged alive (including transfers out) = _________
Calculation: ___Q23___ x 100 = __________ x 100 = % KPI 16
Q15 + Q16
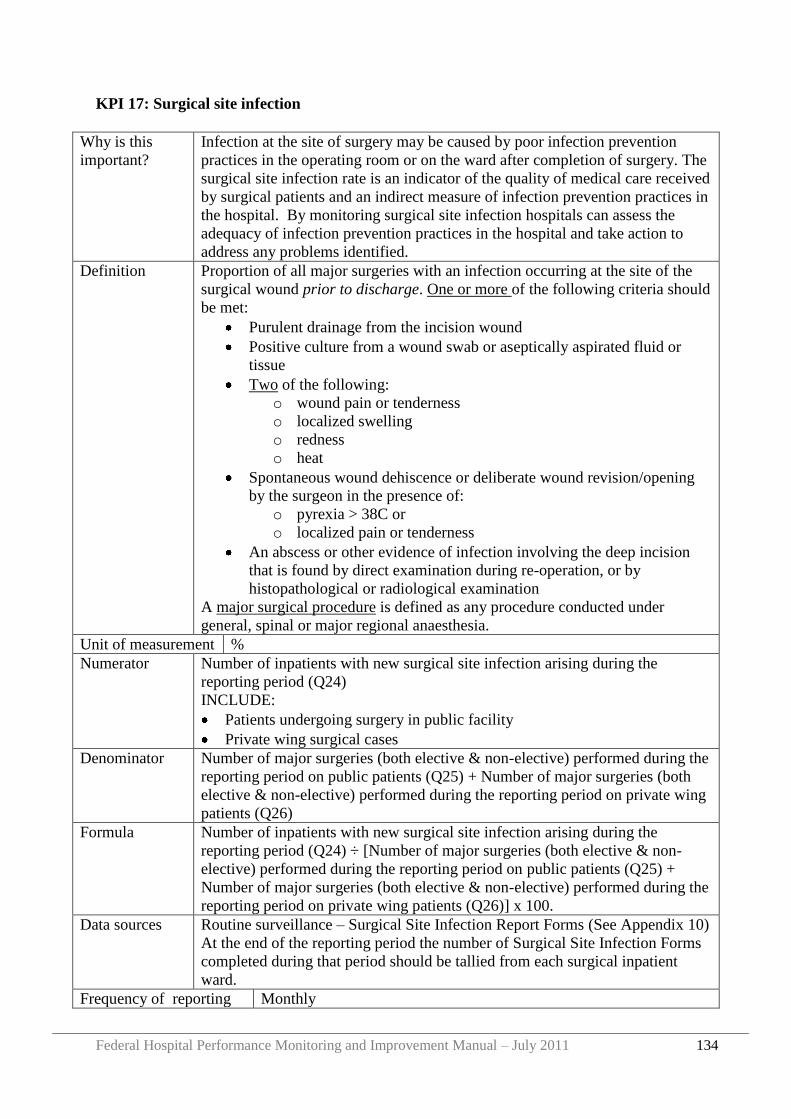
Federal Hospital Performance Monitoring and Improvement Manual – July 2011 134
KPI 17: Surgical site infection
Why is this
important?
Infection at the site of surgery may be caused by poor infection prevention
practices in the operating room or on the ward after completion of surgery. The
surgical site infection rate is an indicator of the quality of medical care received
by surgical patients and an indirect measure of infection prevention practices in
the hospital. By monitoring surgical site infection hospitals can assess the
adequacy of infection prevention practices in the hospital and take action to
address any problems identified.
Definition Proportion of all major surgeries with an infection occurring at the site of the
surgical wound prior to discharge. One or more of the following criteria should
be met:
Purulent drainage from the incision wound
Positive culture from a wound swab or aseptically aspirated fluid or
tissue
Two of the following:
o wound pain or tenderness
o localized swelling
o redness
o heat
Spontaneous wound dehiscence or deliberate wound revision/opening
by the surgeon in the presence of:
o pyrexia > 38C or
o localized pain or tenderness
An abscess or other evidence of infection involving the deep incision
that is found by direct examination during re-operation, or by
histopathological or radiological examination
A major surgical procedure is defined as any procedure conducted under
general, spinal or major regional anaesthesia.
Unit of measurement %
Numerator Number of inpatients with new surgical site infection arising during the
reporting period (Q24)
INCLUDE:
Patients undergoing surgery in public facility
Private wing surgical cases
Denominator Number of major surgeries (both elective & non-elective) performed during the
reporting period on public patients (Q25) + Number of major surgeries (both
elective & non-elective) performed during the reporting period on private wing
patients (Q26)
Formula Number of inpatients with new surgical site infection arising during the
reporting period (Q24) ÷ [Number of major surgeries (both elective & non-
elective) performed during the reporting period on public patients (Q25) +
Number of major surgeries (both elective & non-elective) performed during the
reporting period on private wing patients (Q26)] x 100.
Data sources Routine surveillance – Surgical Site Infection Report Forms (See Appendix 10)
At the end of the reporting period the number of Surgical Site Infection Forms
completed during that period should be tallied from each surgical inpatient
ward.
Frequency of reporting Monthly
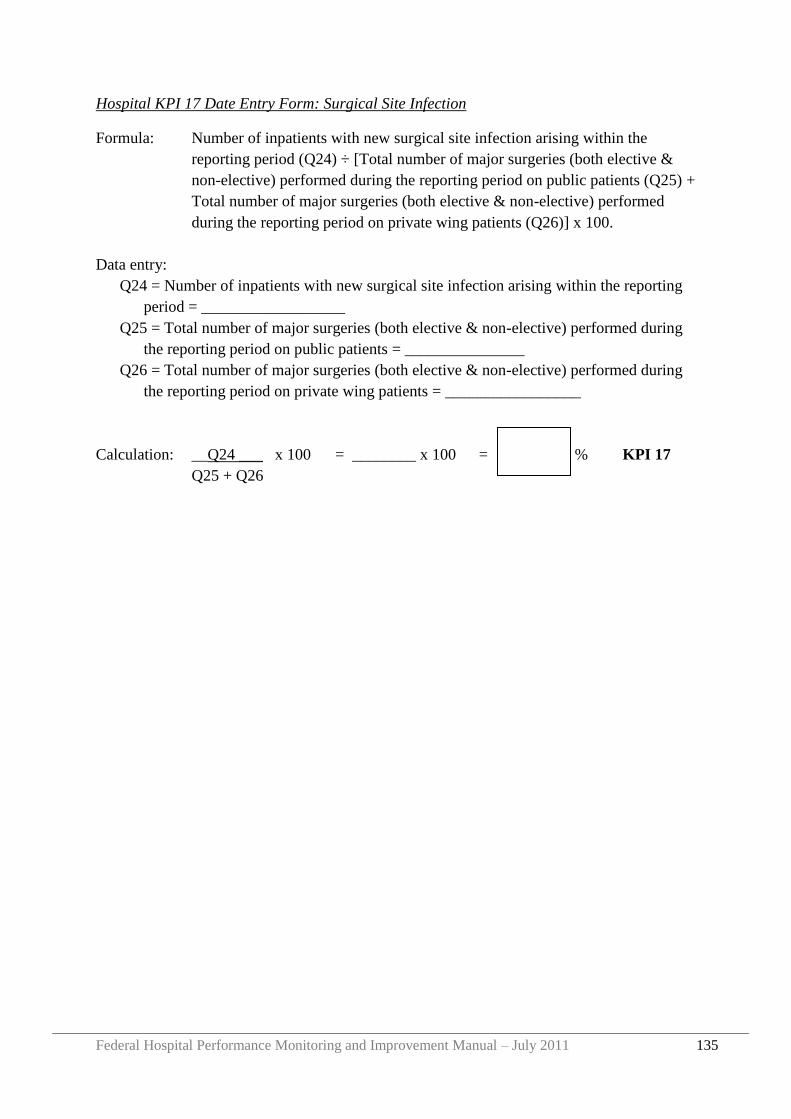
Federal Hospital Performance Monitoring and Improvement Manual – July 2011 135
Hospital KPI 17 Date Entry Form: Surgical Site Infection
Formula: Number of inpatients with new surgical site infection arising within the
reporting period (Q24) ÷ [Total number of major surgeries (both elective &
non-elective) performed during the reporting period on public patients (Q25) +
Total number of major surgeries (both elective & non-elective) performed
during the reporting period on private wing patients (Q26)] x 100.
Data entry:
Q24 = Number of inpatients with new surgical site infection arising within the reporting
period = __________________
Q25 = Total number of major surgeries (both elective & non-elective) performed during
the reporting period on public patients = _______________
Q26 = Total number of major surgeries (both elective & non-elective) performed during
the reporting period on private wing patients = _________________
Calculation: __Q24 ___ x 100 = ________ x 100 = % KPI 17
Q25 + Q26
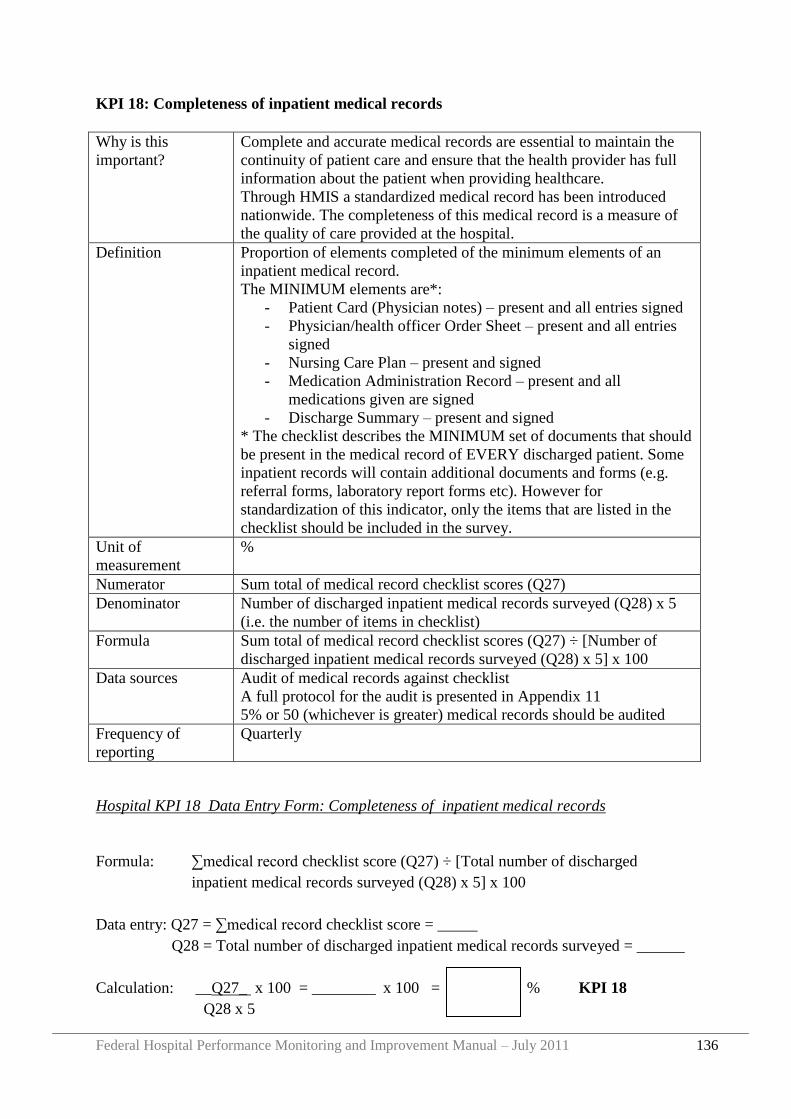
Federal Hospital Performance Monitoring and Improvement Manual – July 2011 136
KPI 18: Completeness of inpatient medical records
Why is this
important?
Complete and accurate medical records are essential to maintain the
continuity of patient care and ensure that the health provider has full
information about the patient when providing healthcare.
Through HMIS a standardized medical record has been introduced
nationwide. The completeness of this medical record is a measure of
the quality of care provided at the hospital.
Definition Proportion of elements completed of the minimum elements of an
inpatient medical record.
The MINIMUM elements are*:
- Patient Card (Physician notes) – present and all entries signed
- Physician/health officer Order Sheet – present and all entries
signed
- Nursing Care Plan – present and signed
- Medication Administration Record – present and all
medications given are signed
- Discharge Summary – present and signed
* The checklist describes the MINIMUM set of documents that should
be present in the medical record of EVERY discharged patient. Some
inpatient records will contain additional documents and forms (e.g.
referral forms, laboratory report forms etc). However for
standardization of this indicator, only the items that are listed in the
checklist should be included in the survey.
Unit of
measurement
%
Numerator Sum total of medical record checklist scores (Q27)
Denominator Number of discharged inpatient medical records surveyed (Q28) x 5
(i.e. the number of items in checklist)
Formula Sum total of medical record checklist scores (Q27) ÷ [Number of
discharged inpatient medical records surveyed (Q28) x 5] x 100
Data sources Audit of medical records against checklist
A full protocol for the audit is presented in Appendix 11
5% or 50 (whichever is greater) medical records should be audited
Frequency of
reporting
Quarterly
Hospital KPI 18 Data Entry Form: Completeness of inpatient medical records
Formula: ∑medical record checklist score (Q27) ÷ [Total number of discharged
inpatient medical records surveyed (Q28) x 5] x 100
Data entry: Q27 = ∑medical record checklist score = _____
Q28 = Total number of discharged inpatient medical records surveyed = ______
Calculation: __Q27_ x 100 = ________ x 100 = % KPI 18
Q28 x 5
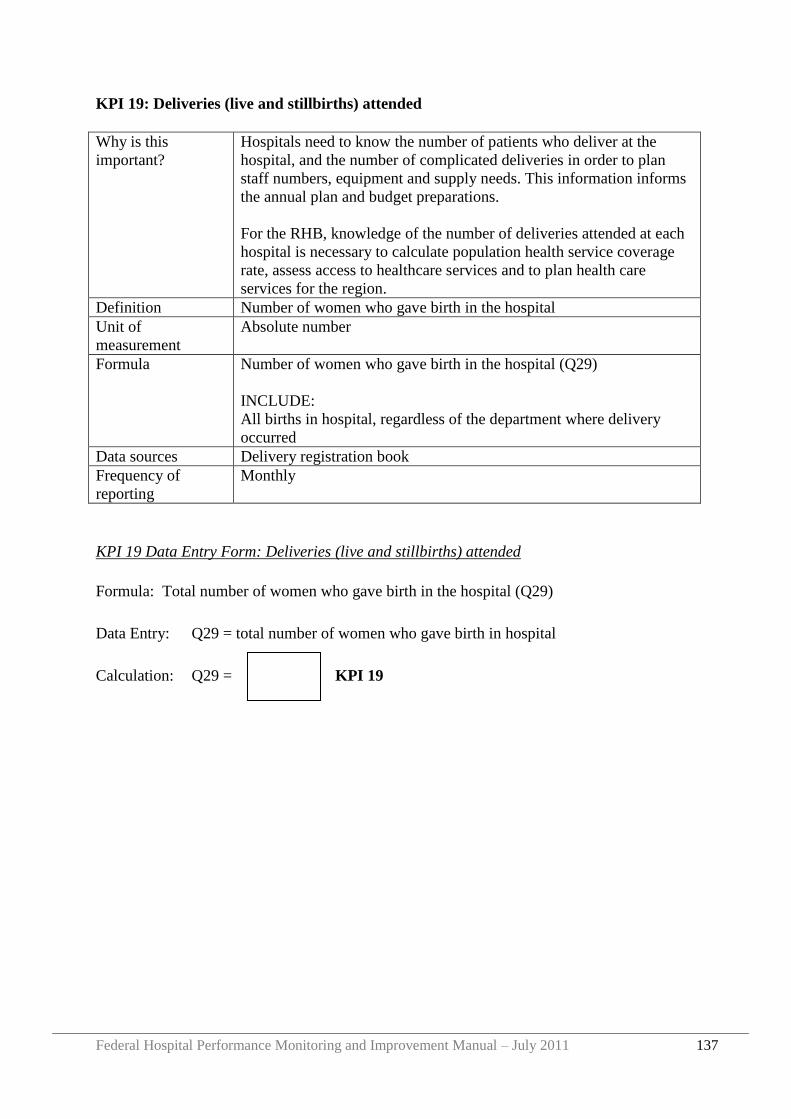
Federal Hospital Performance Monitoring and Improvement Manual – July 2011 137
KPI 19: Deliveries (live and stillbirths) attended
Why is this
important?
Hospitals need to know the number of patients who deliver at the
hospital, and the number of complicated deliveries in order to plan
staff numbers, equipment and supply needs. This information informs
the annual plan and budget preparations.
For the RHB, knowledge of the number of deliveries attended at each
hospital is necessary to calculate population health service coverage
rate, assess access to healthcare services and to plan health care
services for the region.
Definition Number of women who gave birth in the hospital
Unit of
measurement
Absolute number
Formula Number of women who gave birth in the hospital (Q29)
INCLUDE:
All births in hospital, regardless of the department where delivery
occurred
Data sources Delivery registration book
Frequency of
reporting
Monthly
KPI 19 Data Entry Form: Deliveries (live and stillbirths) attended
Formula: Total number of women who gave birth in the hospital (Q29)
Data Entry: Q29 = total number of women who gave birth in hospital
Calculation: Q29 = KPI 19
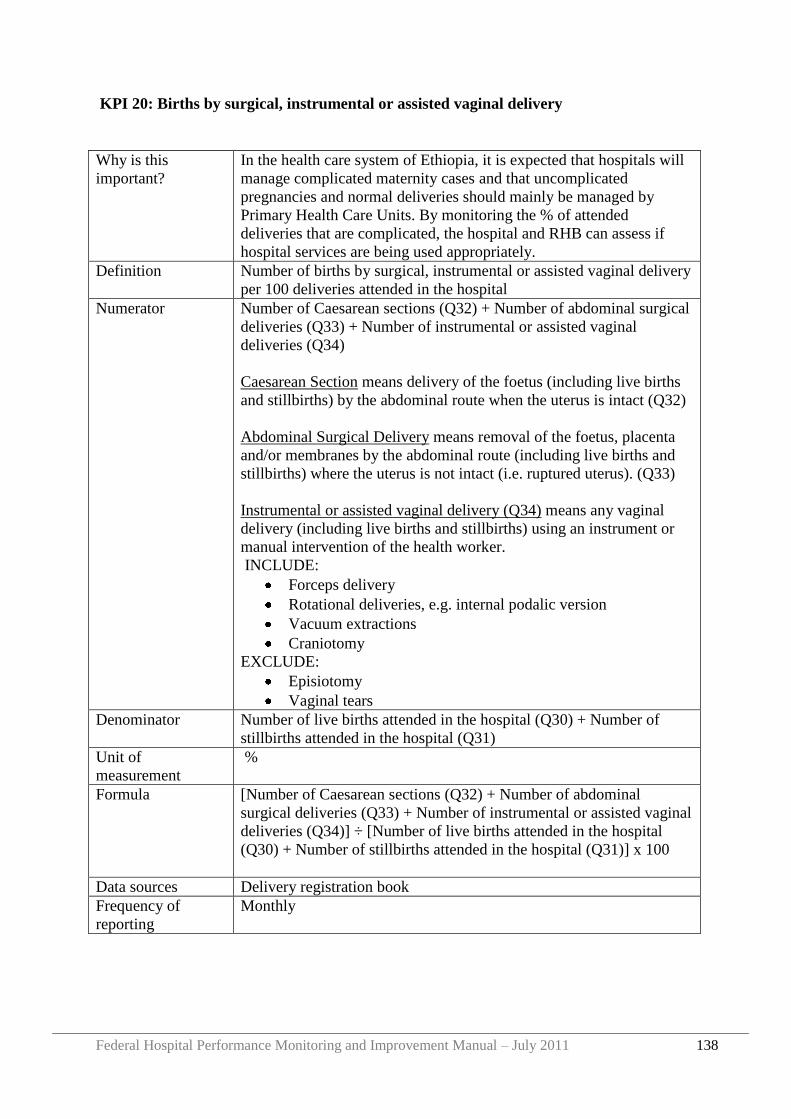
Federal Hospital Performance Monitoring and Improvement Manual – July 2011 138
KPI 20: Births by surgical, instrumental or assisted vaginal delivery
Why is this
important?
In the health care system of Ethiopia, it is expected that hospitals will
manage complicated maternity cases and that uncomplicated
pregnancies and normal deliveries should mainly be managed by
Primary Health Care Units. By monitoring the % of attended
deliveries that are complicated, the hospital and RHB can assess if
hospital services are being used appropriately.
Definition Number of births by surgical, instrumental or assisted vaginal delivery
per 100 deliveries attended in the hospital
Numerator Number of Caesarean sections (Q32) + Number of abdominal surgical
deliveries (Q33) + Number of instrumental or assisted vaginal
deliveries (Q34)
Caesarean Section means delivery of the foetus (including live births
and stillbirths) by the abdominal route when the uterus is intact (Q32)
Abdominal Surgical Delivery means removal of the foetus, placenta
and/or membranes by the abdominal route (including live births and
stillbirths) where the uterus is not intact (i.e. ruptured uterus). (Q33)
Instrumental or assisted vaginal delivery (Q34) means any vaginal
delivery (including live births and stillbirths) using an instrument or
manual intervention of the health worker.
INCLUDE:
Forceps delivery
Rotational deliveries, e.g. internal podalic version
Vacuum extractions
Craniotomy
EXCLUDE:
Episiotomy
Vaginal tears
Denominator Number of live births attended in the hospital (Q30) + Number of
stillbirths attended in the hospital (Q31)
Unit of
measurement
%
Formula [Number of Caesarean sections (Q32) + Number of abdominal
surgical deliveries (Q33) + Number of instrumental or assisted vaginal
deliveries (Q34)] ÷ [Number of live births attended in the hospital
(Q30) + Number of stillbirths attended in the hospital (Q31)] x 100
Data sources Delivery registration book
Frequency of
reporting
Monthly
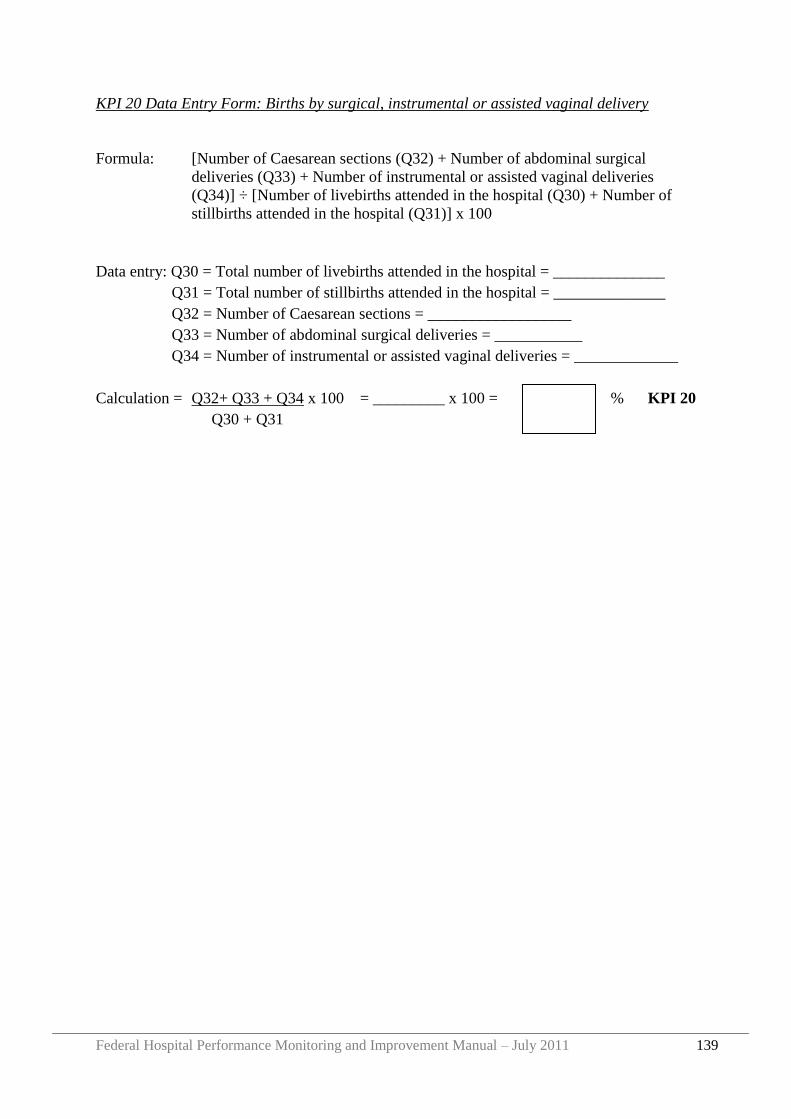
Federal Hospital Performance Monitoring and Improvement Manual – July 2011 139
KPI 20 Data Entry Form: Births by surgical, instrumental or assisted vaginal delivery
Formula: [Number of Caesarean sections (Q32) + Number of abdominal surgical
deliveries (Q33) + Number of instrumental or assisted vaginal deliveries
(Q34)] ÷ [Number of livebirths attended in the hospital (Q30) + Number of
stillbirths attended in the hospital (Q31)] x 100
Data entry: Q30 = Total number of livebirths attended in the hospital = ______________
Q31 = Total number of stillbirths attended in the hospital = ______________
Q32 = Number of Caesarean sections = __________________
Q33 = Number of abdominal surgical deliveries = ___________
Q34 = Number of instrumental or assisted vaginal deliveries = _____________
Calculation = Q32+ Q33 + Q34 x 100 = _________ x 100 = % KPI 20
Q30 + Q31
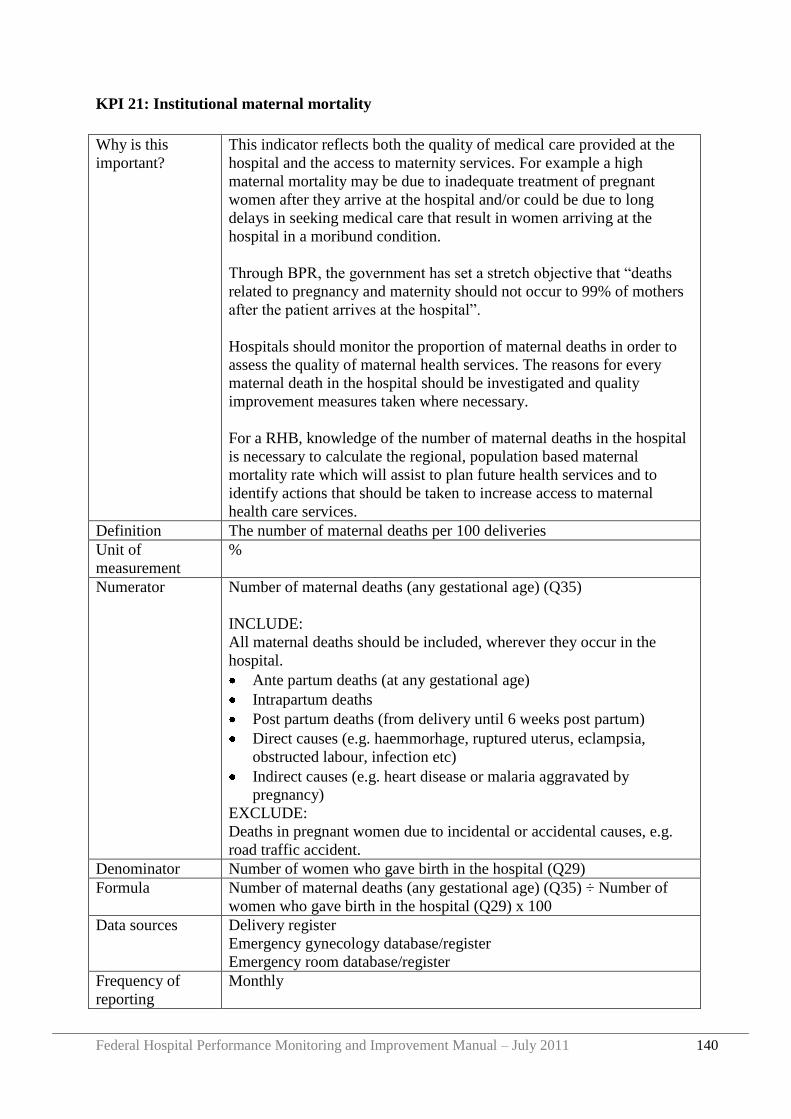
Federal Hospital Performance Monitoring and Improvement Manual – July 2011 140
KPI 21: Institutional maternal mortality
Why is this
important?
This indicator reflects both the quality of medical care provided at the
hospital and the access to maternity services. For example a high
maternal mortality may be due to inadequate treatment of pregnant
women after they arrive at the hospital and/or could be due to long
delays in seeking medical care that result in women arriving at the
hospital in a moribund condition.
Through BPR, the government has set a stretch objective that “deaths
related to pregnancy and maternity should not occur to 99% of mothers
after the patient arrives at the hospital”.
Hospitals should monitor the proportion of maternal deaths in order to
assess the quality of maternal health services. The reasons for every
maternal death in the hospital should be investigated and quality
improvement measures taken where necessary.
For a RHB, knowledge of the number of maternal deaths in the hospital
is necessary to calculate the regional, population based maternal
mortality rate which will assist to plan future health services and to
identify actions that should be taken to increase access to maternal
health care services.
Definition The number of maternal deaths per 100 deliveries
Unit of
measurement
%
Numerator Number of maternal deaths (any gestational age) (Q35)
INCLUDE:
All maternal deaths should be included, wherever they occur in the
hospital.
Ante partum deaths (at any gestational age)
Intrapartum deaths
Post partum deaths (from delivery until 6 weeks post partum)
Direct causes (e.g. haemmorhage, ruptured uterus, eclampsia,
obstructed labour, infection etc)
Indirect causes (e.g. heart disease or malaria aggravated by
pregnancy)
EXCLUDE:
Deaths in pregnant women due to incidental or accidental causes, e.g.
road traffic accident.
Denominator Number of women who gave birth in the hospital (Q29)
Formula Number of maternal deaths (any gestational age) (Q35) ÷ Number of
women who gave birth in the hospital (Q29) x 100
Data sources Delivery register
Emergency gynecology database/register
Emergency room database/register
Frequency of
reporting
Monthly
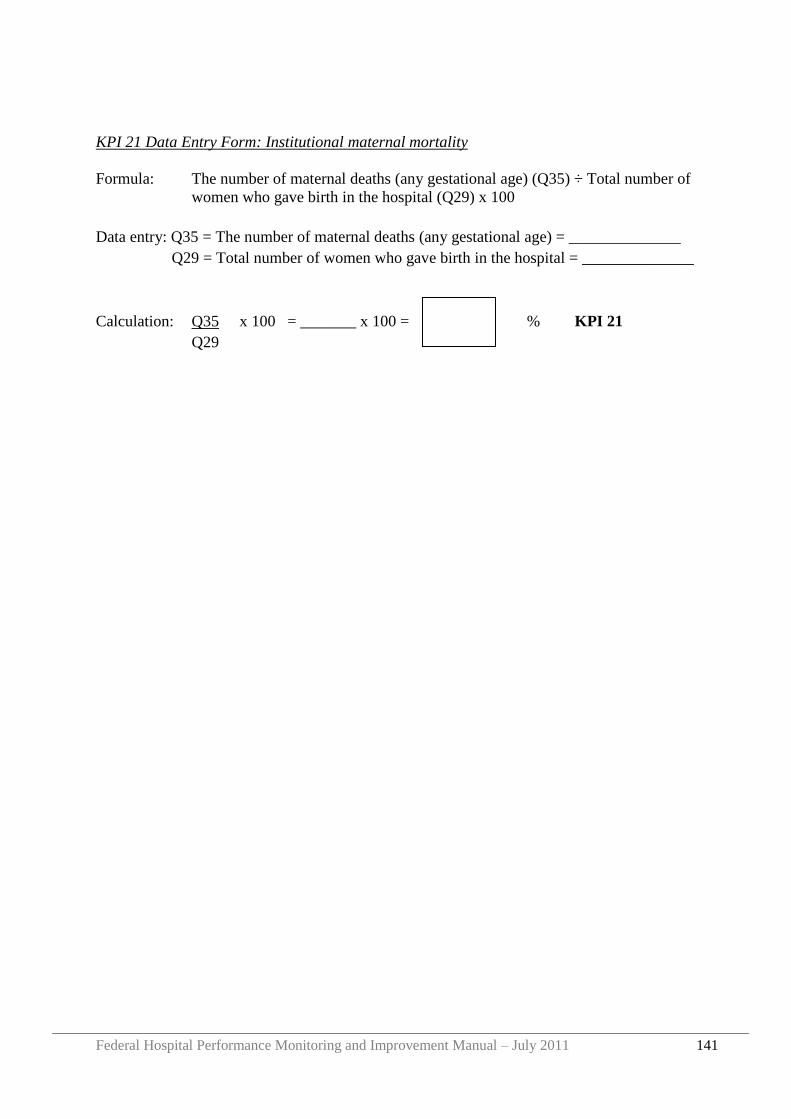
Federal Hospital Performance Monitoring and Improvement Manual – July 2011 141
KPI 21 Data Entry Form: Institutional maternal mortality
Formula: The number of maternal deaths (any gestational age) (Q35) ÷ Total number of
women who gave birth in the hospital (Q29) x 100
Data entry: Q35 = The number of maternal deaths (any gestational age) = ______________
Q29 = Total number of women who gave birth in the hospital = ______________
Calculation: Q35 x 100 = _______ x 100 = % KPI 21
Q29
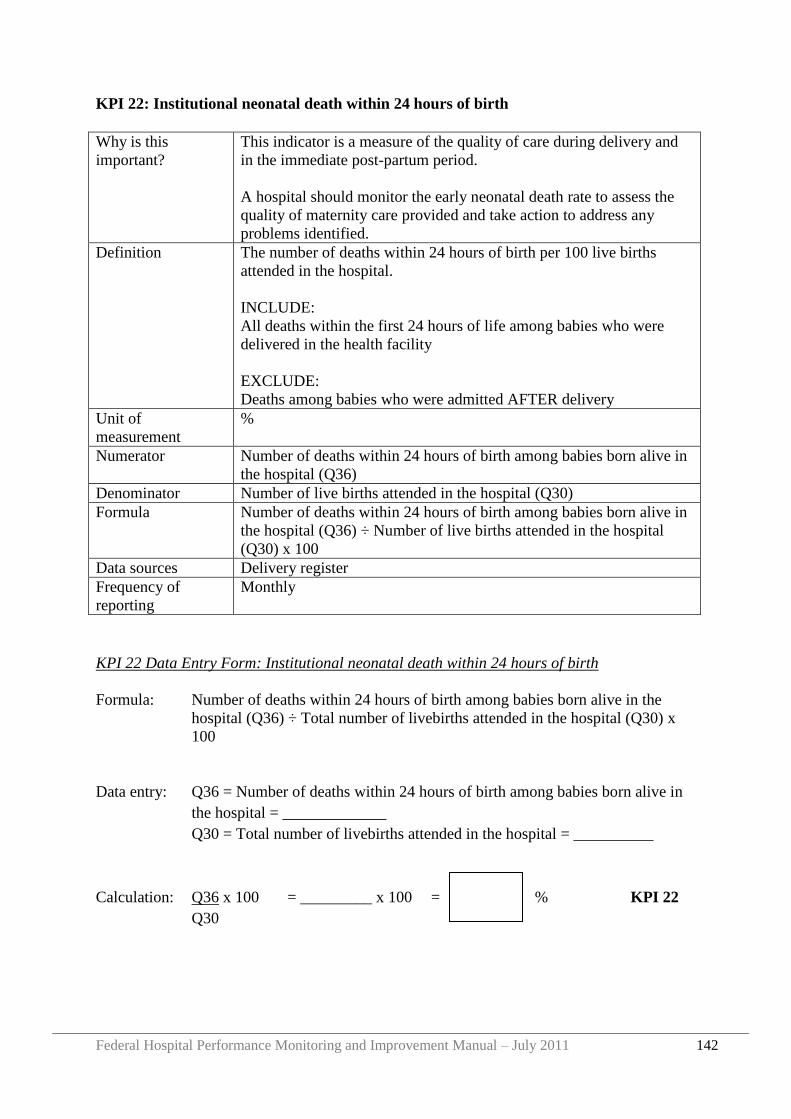
Federal Hospital Performance Monitoring and Improvement Manual – July 2011 142
KPI 22: Institutional neonatal death within 24 hours of birth
Why is this
important?
This indicator is a measure of the quality of care during delivery and
in the immediate post-partum period.
A hospital should monitor the early neonatal death rate to assess the
quality of maternity care provided and take action to address any
problems identified.
Definition The number of deaths within 24 hours of birth per 100 live births
attended in the hospital.
INCLUDE:
All deaths within the first 24 hours of life among babies who were
delivered in the health facility
EXCLUDE:
Deaths among babies who were admitted AFTER delivery
Unit of
measurement
%
Numerator Number of deaths within 24 hours of birth among babies born alive in
the hospital (Q36)
Denominator Number of live births attended in the hospital (Q30)
Formula Number of deaths within 24 hours of birth among babies born alive in
the hospital (Q36) ÷ Number of live births attended in the hospital
(Q30) x 100
Data sources Delivery register
Frequency of
reporting
Monthly
KPI 22 Data Entry Form: Institutional neonatal death within 24 hours of birth
Formula: Number of deaths within 24 hours of birth among babies born alive in the
hospital (Q36) ÷ Total number of livebirths attended in the hospital (Q30) x
100
Data entry: Q36 = Number of deaths within 24 hours of birth among babies born alive in
the hospital = _____________
Q30 = Total number of livebirths attended in the hospital = __________
Calculation: Q36 x 100 = _________ x 100 = % KPI 22
Q30
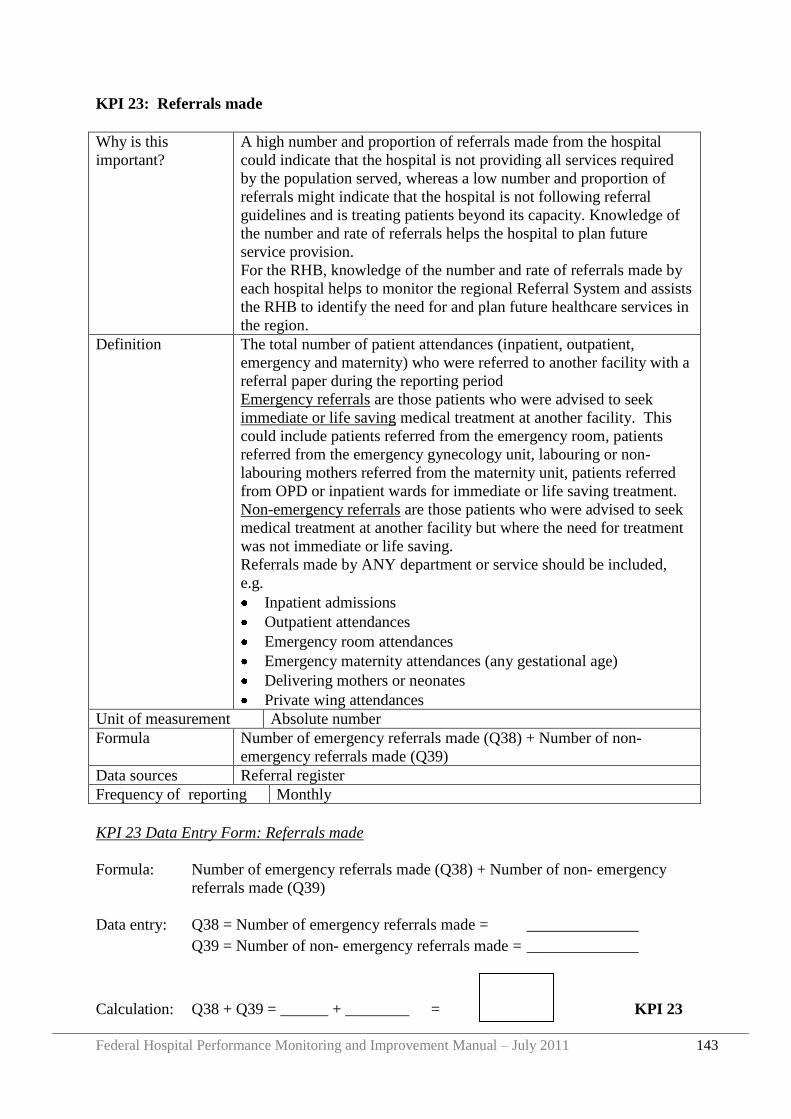
Federal Hospital Performance Monitoring and Improvement Manual – July 2011 143
KPI 23: Referrals made
Why is this
important?
A high number and proportion of referrals made from the hospital
could indicate that the hospital is not providing all services required
by the population served, whereas a low number and proportion of
referrals might indicate that the hospital is not following referral
guidelines and is treating patients beyond its capacity. Knowledge of
the number and rate of referrals helps the hospital to plan future
service provision.
For the RHB, knowledge of the number and rate of referrals made by
each hospital helps to monitor the regional Referral System and assists
the RHB to identify the need for and plan future healthcare services in
the region.
Definition The total number of patient attendances (inpatient, outpatient,
emergency and maternity) who were referred to another facility with a
referral paper during the reporting period
Emergency referrals are those patients who were advised to seek
immediate or life saving medical treatment at another facility. This
could include patients referred from the emergency room, patients
referred from the emergency gynecology unit, labouring or non-
labouring mothers referred from the maternity unit, patients referred
from OPD or inpatient wards for immediate or life saving treatment.
Non-emergency referrals are those patients who were advised to seek
medical treatment at another facility but where the need for treatment
was not immediate or life saving.
Referrals made by ANY department or service should be included,
e.g.
Inpatient admissions
Outpatient attendances
Emergency room attendances
Emergency maternity attendances (any gestational age)
Delivering mothers or neonates
Private wing attendances
Unit of measurement Absolute number
Formula Number of emergency referrals made (Q38) + Number of non-
emergency referrals made (Q39)
Data sources Referral register
Frequency of reporting Monthly
KPI 23 Data Entry Form: Referrals made
Formula: Number of emergency referrals made (Q38) + Number of non- emergency
referrals made (Q39)
Data entry: Q38 = Number of emergency referrals made = ______________
Q39 = Number of non- emergency referrals made = ______________
Calculation: Q38 + Q39 = ______ + ________ = KPI 23
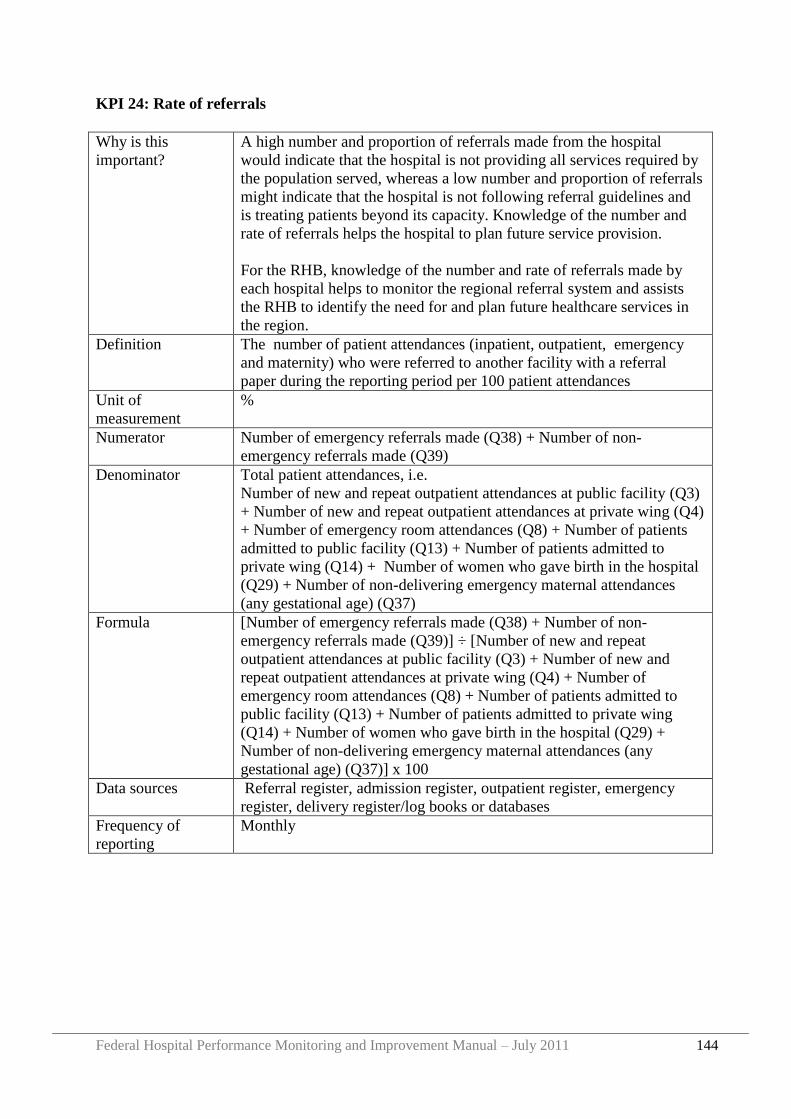
Federal Hospital Performance Monitoring and Improvement Manual – July 2011 144
KPI 24: Rate of referrals
Why is this
important?
A high number and proportion of referrals made from the hospital
would indicate that the hospital is not providing all services required by
the population served, whereas a low number and proportion of referrals
might indicate that the hospital is not following referral guidelines and
is treating patients beyond its capacity. Knowledge of the number and
rate of referrals helps the hospital to plan future service provision.
For the RHB, knowledge of the number and rate of referrals made by
each hospital helps to monitor the regional referral system and assists
the RHB to identify the need for and plan future healthcare services in
the region.
Definition The number of patient attendances (inpatient, outpatient, emergency
and maternity) who were referred to another facility with a referral
paper during the reporting period per 100 patient attendances
Unit of
measurement
%
Numerator Number of emergency referrals made (Q38) + Number of non-
emergency referrals made (Q39)
Denominator Total patient attendances, i.e.
Number of new and repeat outpatient attendances at public facility (Q3)
+ Number of new and repeat outpatient attendances at private wing (Q4)
+ Number of emergency room attendances (Q8) + Number of patients
admitted to public facility (Q13) + Number of patients admitted to
private wing (Q14) + Number of women who gave birth in the hospital
(Q29) + Number of non-delivering emergency maternal attendances
(any gestational age) (Q37)
Formula [Number of emergency referrals made (Q38) + Number of non-
emergency referrals made (Q39)] ÷ [Number of new and repeat
outpatient attendances at public facility (Q3) + Number of new and
repeat outpatient attendances at private wing (Q4) + Number of
emergency room attendances (Q8) + Number of patients admitted to
public facility (Q13) + Number of patients admitted to private wing
(Q14) + Number of women who gave birth in the hospital (Q29) +
Number of non-delivering emergency maternal attendances (any
gestational age) (Q37)] x 100
Data sources Referral register, admission register, outpatient register, emergency
register, delivery register/log books or databases
Frequency of
reporting
Monthly
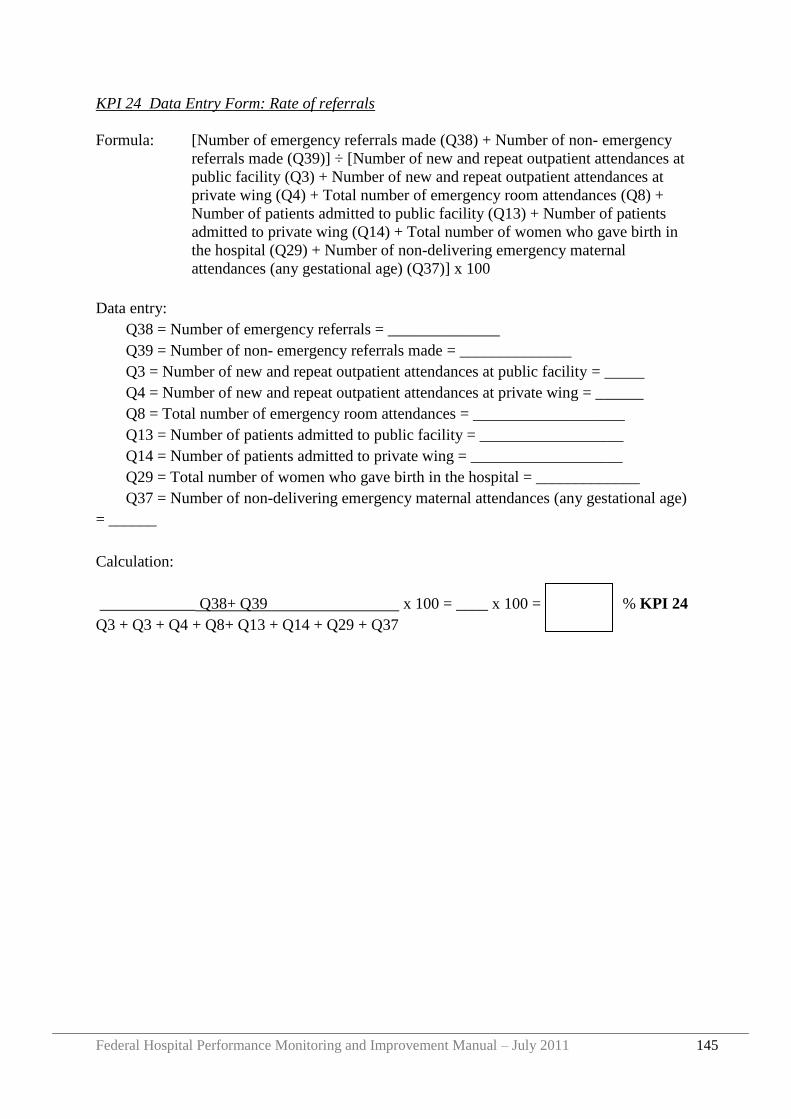
Federal Hospital Performance Monitoring and Improvement Manual – July 2011 145
KPI 24 Data Entry Form: Rate of referrals
Formula: [Number of emergency referrals made (Q38) + Number of non- emergency
referrals made (Q39)] ÷ [Number of new and repeat outpatient attendances at
public facility (Q3) + Number of new and repeat outpatient attendances at
private wing (Q4) + Total number of emergency room attendances (Q8) +
Number of patients admitted to public facility (Q13) + Number of patients
admitted to private wing (Q14) + Total number of women who gave birth in
the hospital (Q29) + Number of non-delivering emergency maternal
attendances (any gestational age) (Q37)] x 100
Data entry:
Q38 = Number of emergency referrals = ______________
Q39 = Number of non- emergency referrals made = ______________
Q3 = Number of new and repeat outpatient attendances at public facility = _____
Q4 = Number of new and repeat outpatient attendances at private wing = ______
Q8 = Total number of emergency room attendances = ___________________
Q13 = Number of patients admitted to public facility = __________________
Q14 = Number of patients admitted to private wing = ___________________
Q29 = Total number of women who gave birth in the hospital = _____________
Q37 = Number of non-delivering emergency maternal attendances (any gestational age)
= ______
Calculation:
____________ Q38+ Q39 x 100 = ____ x 100 = % KPI 24
Q3 + Q3 + Q4 + Q8+ Q13 + Q14 + Q29 + Q37
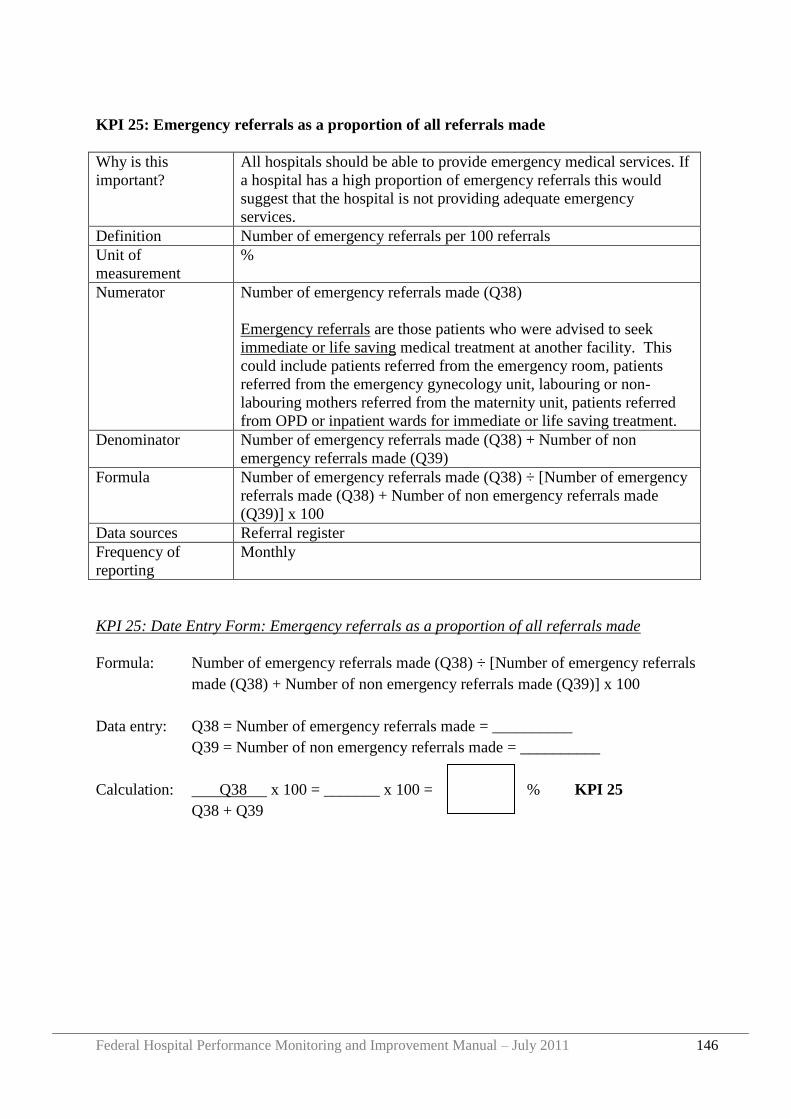
Federal Hospital Performance Monitoring and Improvement Manual – July 2011 146
KPI 25: Emergency referrals as a proportion of all referrals made
Why is this
important?
All hospitals should be able to provide emergency medical services. If
a hospital has a high proportion of emergency referrals this would
suggest that the hospital is not providing adequate emergency
services.
Definition Number of emergency referrals per 100 referrals
Unit of
measurement
%
Numerator Number of emergency referrals made (Q38)
Emergency referrals are those patients who were advised to seek
immediate or life saving medical treatment at another facility. This
could include patients referred from the emergency room, patients
referred from the emergency gynecology unit, labouring or non-
labouring mothers referred from the maternity unit, patients referred
from OPD or inpatient wards for immediate or life saving treatment.
Denominator Number of emergency referrals made (Q38) + Number of non
emergency referrals made (Q39)
Formula Number of emergency referrals made (Q38) ÷ [Number of emergency
referrals made (Q38) + Number of non emergency referrals made
(Q39)] x 100
Data sources Referral register
Frequency of
reporting
Monthly
KPI 25: Date Entry Form: Emergency referrals as a proportion of all referrals made
Formula: Number of emergency referrals made (Q38) ÷ [Number of emergency referrals
made (Q38) + Number of non emergency referrals made (Q39)] x 100
Data entry: Q38 = Number of emergency referrals made = __________
Q39 = Number of non emergency referrals made = __________
Calculation: Q38 x 100 = _______ x 100 = % KPI 25
Q38 + Q39
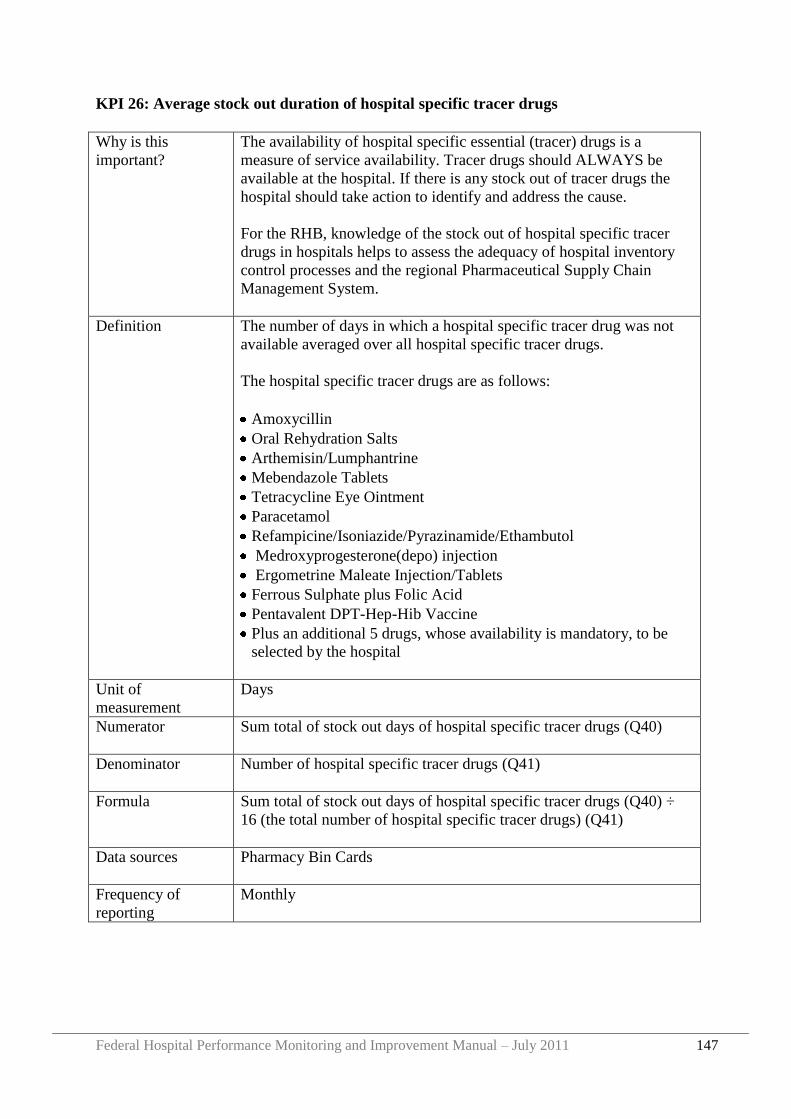
Federal Hospital Performance Monitoring and Improvement Manual – July 2011 147
KPI 26: Average stock out duration of hospital specific tracer drugs
Why is this
important?
The availability of hospital specific essential (tracer) drugs is a
measure of service availability. Tracer drugs should ALWAYS be
available at the hospital. If there is any stock out of tracer drugs the
hospital should take action to identify and address the cause.
For the RHB, knowledge of the stock out of hospital specific tracer
drugs in hospitals helps to assess the adequacy of hospital inventory
control processes and the regional Pharmaceutical Supply Chain
Management System.
Definition The number of days in which a hospital specific tracer drug was not
available averaged over all hospital specific tracer drugs.
The hospital specific tracer drugs are as follows:
Amoxycillin
Oral Rehydration Salts
Arthemisin/Lumphantrine
Mebendazole Tablets
Tetracycline Eye Ointment
Paracetamol
Refampicine/Isoniazide/Pyrazinamide/Ethambutol
Medroxyprogesterone(depo) injection
Ergometrine Maleate Injection/Tablets
Ferrous Sulphate plus Folic Acid
Pentavalent DPT-Hep-Hib Vaccine
Plus an additional 5 drugs, whose availability is mandatory, to be
selected by the hospital
Unit of
measurement
Days
Numerator Sum total of stock out days of hospital specific tracer drugs (Q40)
Denominator Number of hospital specific tracer drugs (Q41)
Formula Sum total of stock out days of hospital specific tracer drugs (Q40) ÷
16 (the total number of hospital specific tracer drugs) (Q41)
Data sources Pharmacy Bin Cards
Frequency of
reporting
Monthly
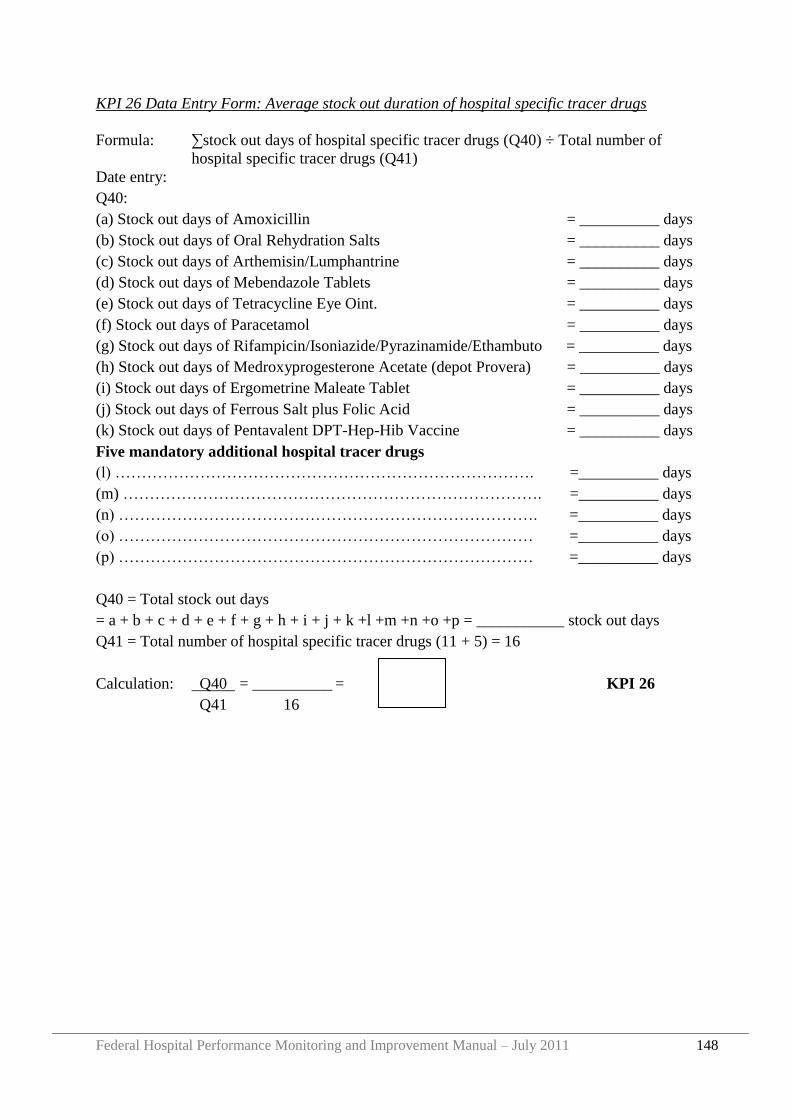
Federal Hospital Performance Monitoring and Improvement Manual – July 2011 148
KPI 26 Data Entry Form: Average stock out duration of hospital specific tracer drugs
Formula: ∑stock out days of hospital specific tracer drugs (Q40) ÷ Total number of
hospital specific tracer drugs (Q41)
Date entry:
Q40:
(a) Stock out days of Amoxicillin = __________ days
(b) Stock out days of Oral Rehydration Salts = __________ days
(c) Stock out days of Arthemisin/Lumphantrine = __________ days
(d) Stock out days of Mebendazole Tablets = __________ days
(e) Stock out days of Tetracycline Eye Oint. = __________ days
(f) Stock out days of Paracetamol = __________ days
(g) Stock out days of Rifampicin/Isoniazide/Pyrazinamide/Ethambuto = __________ days
(h) Stock out days of Medroxyprogesterone Acetate (depot Provera) = __________ days
(i) Stock out days of Ergometrine Maleate Tablet = __________ days
(j) Stock out days of Ferrous Salt plus Folic Acid = __________ days
(k) Stock out days of Pentavalent DPT-Hep-Hib Vaccine = __________ days
Five mandatory additional hospital tracer drugs
(l) ……………………………………………………………………. =__________ days
(m) ……………………………………………………………………. =__________ days
(n) ……………………………………………………………………. =__________ days
(o) …………………………………………………………………… =__________ days
(p) …………………………………………………………………… =__________ days
Q40 = Total stock out days
= a + b + c + d + e + f + g + h + i + j + k +l +m +n +o +p = ___________ stock out days
Q41 = Total number of hospital specific tracer drugs (11 + 5) = 16
Calculation: Q40 = __________ = KPI 26
Q41 16
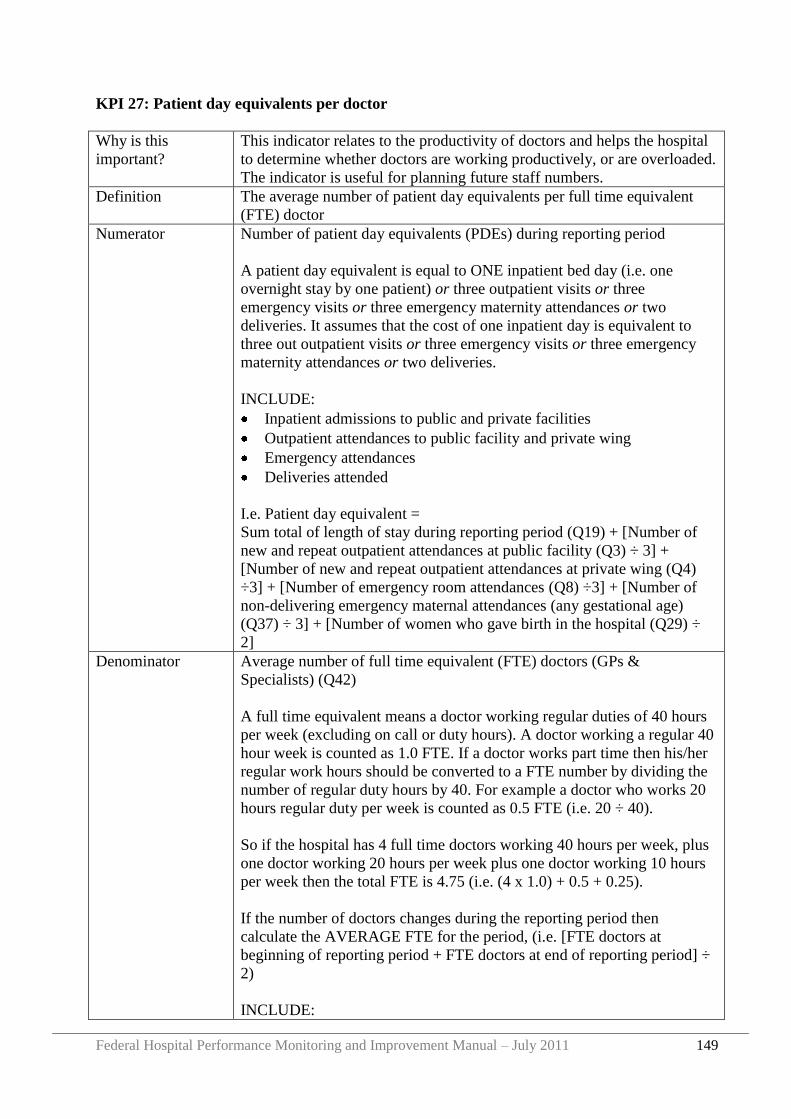
Federal Hospital Performance Monitoring and Improvement Manual – July 2011 149
KPI 27: Patient day equivalents per doctor
Why is this
important?
This indicator relates to the productivity of doctors and helps the hospital
to determine whether doctors are working productively, or are overloaded.
The indicator is useful for planning future staff numbers.
Definition The average number of patient day equivalents per full time equivalent
(FTE) doctor
Numerator Number of patient day equivalents (PDEs) during reporting period
A patient day equivalent is equal to ONE inpatient bed day (i.e. one
overnight stay by one patient) or three outpatient visits or three
emergency visits or three emergency maternity attendances or two
deliveries. It assumes that the cost of one inpatient day is equivalent to
three out outpatient visits or three emergency visits or three emergency
maternity attendances or two deliveries.
INCLUDE:
Inpatient admissions to public and private facilities
Outpatient attendances to public facility and private wing
Emergency attendances
Deliveries attended
I.e. Patient day equivalent =
Sum total of length of stay during reporting period (Q19) + [Number of
new and repeat outpatient attendances at public facility (Q3) ÷ 3] +
[Number of new and repeat outpatient attendances at private wing (Q4)
÷3] + [Number of emergency room attendances (Q8) ÷3] + [Number of
non-delivering emergency maternal attendances (any gestational age)
(Q37) ÷ 3] + [Number of women who gave birth in the hospital (Q29) ÷
2]
Denominator Average number of full time equivalent (FTE) doctors (GPs &
Specialists) (Q42)
A full time equivalent means a doctor working regular duties of 40 hours
per week (excluding on call or duty hours). A doctor working a regular 40
hour week is counted as 1.0 FTE. If a doctor works part time then his/her
regular work hours should be converted to a FTE number by dividing the
number of regular duty hours by 40. For example a doctor who works 20
hours regular duty per week is counted as 0.5 FTE (i.e. 20 ÷ 40).
So if the hospital has 4 full time doctors working 40 hours per week, plus
one doctor working 20 hours per week plus one doctor working 10 hours
per week then the total FTE is 4.75 (i.e. (4 x 1.0) + 0.5 + 0.25).
If the number of doctors changes during the reporting period then
calculate the AVERAGE FTE for the period, (i.e. [FTE doctors at
beginning of reporting period + FTE doctors at end of reporting period] ÷
2)
INCLUDE:
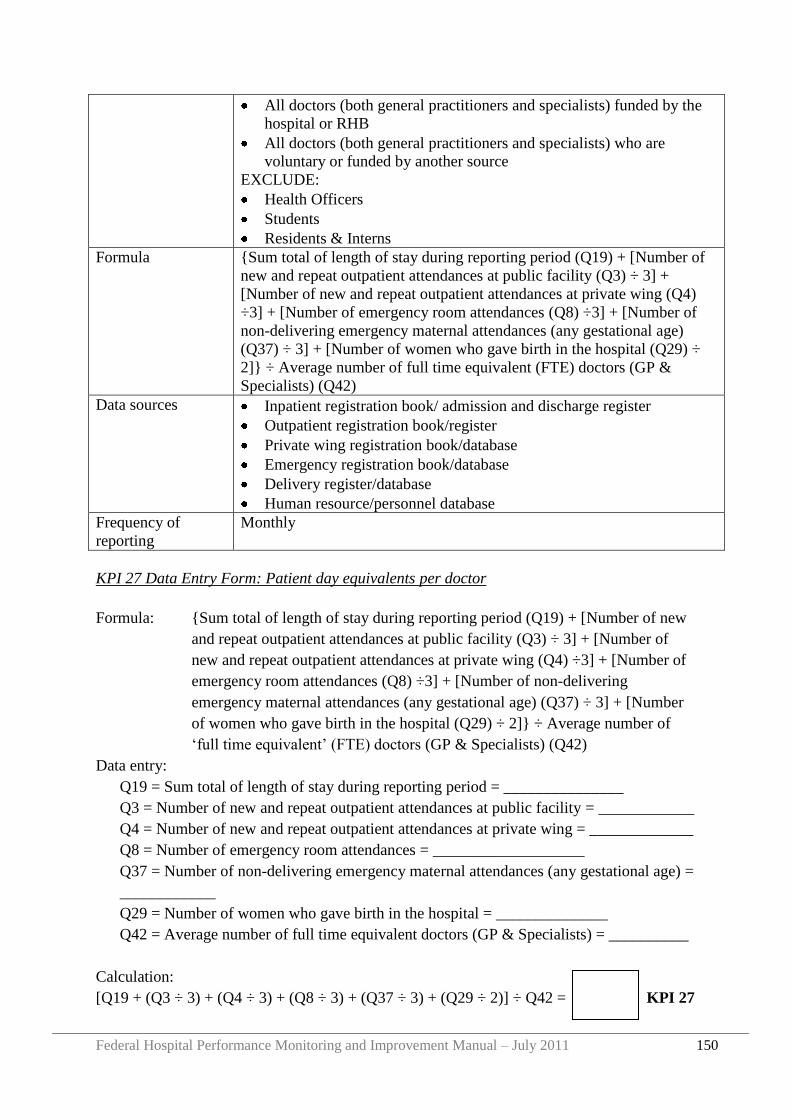
Federal Hospital Performance Monitoring and Improvement Manual – July 2011 150
All doctors (both general practitioners and specialists) funded by the
hospital or RHB
All doctors (both general practitioners and specialists) who are
voluntary or funded by another source
EXCLUDE:
Health Officers
Students
Residents & Interns
Formula {Sum total of length of stay during reporting period (Q19) + [Number of
new and repeat outpatient attendances at public facility (Q3) ÷ 3] +
[Number of new and repeat outpatient attendances at private wing (Q4)
÷3] + [Number of emergency room attendances (Q8) ÷3] + [Number of
non-delivering emergency maternal attendances (any gestational age)
(Q37) ÷ 3] + [Number of women who gave birth in the hospital (Q29) ÷
2]} ÷ Average number of full time equivalent (FTE) doctors (GP &
Specialists) (Q42)
Data sources Inpatient registration book/ admission and discharge register
Outpatient registration book/register
Private wing registration book/database
Emergency registration book/database
Delivery register/database
Human resource/personnel database
Frequency of
reporting
Monthly
KPI 27 Data Entry Form: Patient day equivalents per doctor
Formula: {Sum total of length of stay during reporting period (Q19) + [Number of new
and repeat outpatient attendances at public facility (Q3) ÷ 3] + [Number of
new and repeat outpatient attendances at private wing (Q4) ÷3] + [Number of
emergency room attendances (Q8) ÷3] + [Number of non-delivering
emergency maternal attendances (any gestational age) (Q37) ÷ 3] + [Number
of women who gave birth in the hospital (Q29) ÷ 2]} ÷ Average number of
„full time equivalent‟ (FTE) doctors (GP & Specialists) (Q42)
Data entry:
Q19 = Sum total of length of stay during reporting period = _______________
Q3 = Number of new and repeat outpatient attendances at public facility = ____________
Q4 = Number of new and repeat outpatient attendances at private wing = _____________
Q8 = Number of emergency room attendances = ___________________
Q37 = Number of non-delivering emergency maternal attendances (any gestational age) =
____________
Q29 = Number of women who gave birth in the hospital = ______________
Q42 = Average number of full time equivalent doctors (GP & Specialists) = __________
Calculation:
[Q19 + (Q3 ÷ 3) + (Q4 ÷ 3) + (Q8 ÷ 3) + (Q37 ÷ 3) + (Q29 ÷ 2)] ÷ Q42 = KPI 27
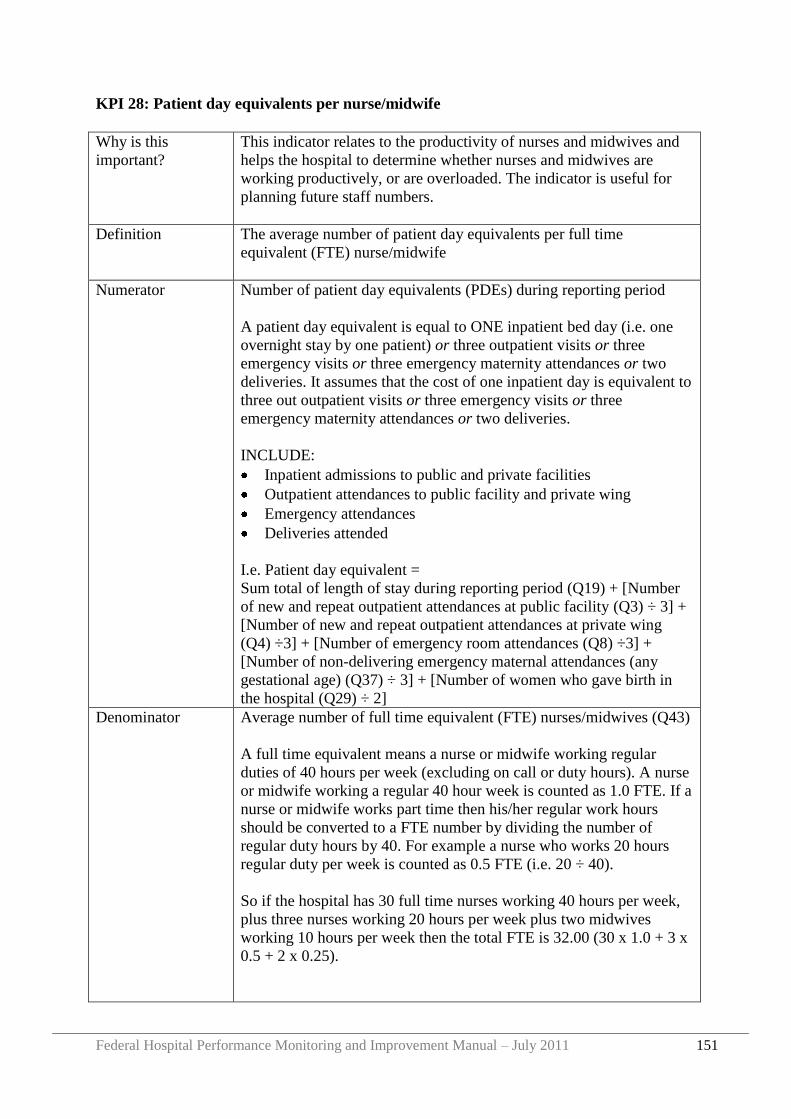
Federal Hospital Performance Monitoring and Improvement Manual – July 2011 151
KPI 28: Patient day equivalents per nurse/midwife
Why is this
important?
This indicator relates to the productivity of nurses and midwives and
helps the hospital to determine whether nurses and midwives are
working productively, or are overloaded. The indicator is useful for
planning future staff numbers.
Definition The average number of patient day equivalents per full time
equivalent (FTE) nurse/midwife
Numerator Number of patient day equivalents (PDEs) during reporting period
A patient day equivalent is equal to ONE inpatient bed day (i.e. one
overnight stay by one patient) or three outpatient visits or three
emergency visits or three emergency maternity attendances or two
deliveries. It assumes that the cost of one inpatient day is equivalent to
three out outpatient visits or three emergency visits or three
emergency maternity attendances or two deliveries.
INCLUDE:
Inpatient admissions to public and private facilities
Outpatient attendances to public facility and private wing
Emergency attendances
Deliveries attended
I.e. Patient day equivalent =
Sum total of length of stay during reporting period (Q19) + [Number
of new and repeat outpatient attendances at public facility (Q3) ÷ 3] +
[Number of new and repeat outpatient attendances at private wing
(Q4) ÷3] + [Number of emergency room attendances (Q8) ÷3] +
[Number of non-delivering emergency maternal attendances (any
gestational age) (Q37) ÷ 3] + [Number of women who gave birth in
the hospital (Q29) ÷ 2]
Denominator Average number of full time equivalent (FTE) nurses/midwives (Q43)
A full time equivalent means a nurse or midwife working regular
duties of 40 hours per week (excluding on call or duty hours). A nurse
or midwife working a regular 40 hour week is counted as 1.0 FTE. If a
nurse or midwife works part time then his/her regular work hours
should be converted to a FTE number by dividing the number of
regular duty hours by 40. For example a nurse who works 20 hours
regular duty per week is counted as 0.5 FTE (i.e. 20 ÷ 40).
So if the hospital has 30 full time nurses working 40 hours per week,
plus three nurses working 20 hours per week plus two midwives
working 10 hours per week then the total FTE is 32.00 (30 x 1.0 + 3 x
0.5 + 2 x 0.25).
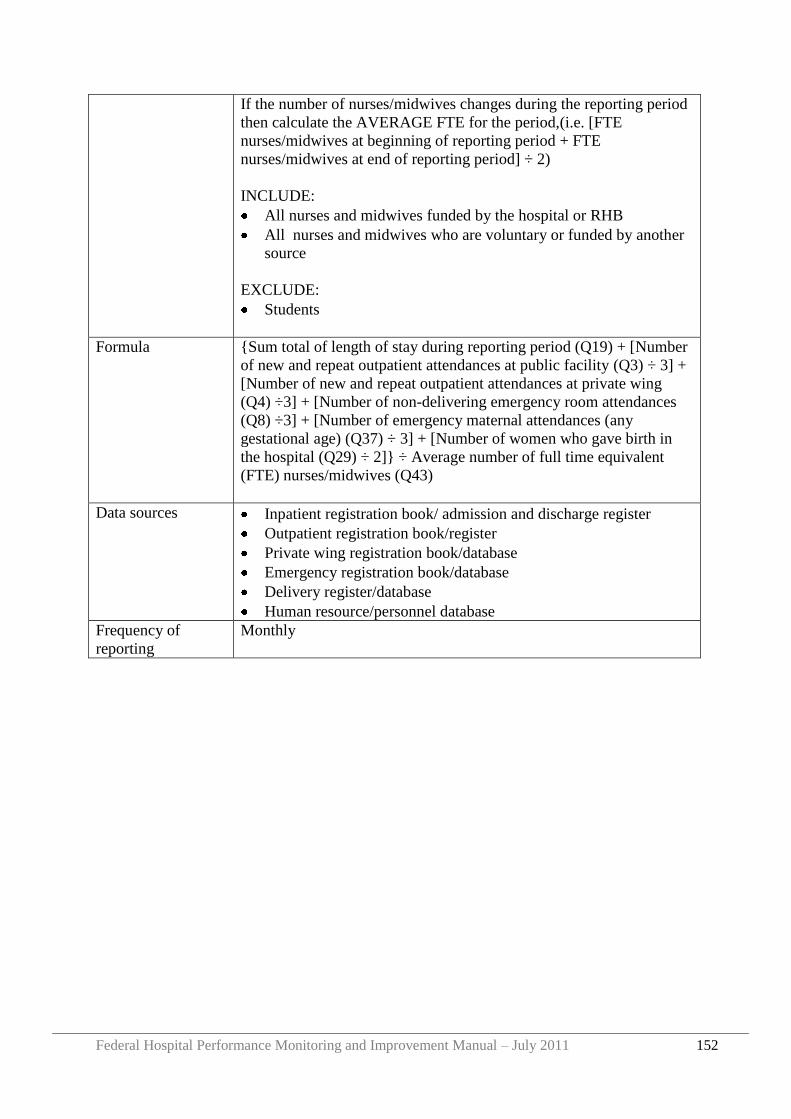
Federal Hospital Performance Monitoring and Improvement Manual – July 2011 152
If the number of nurses/midwives changes during the reporting period
then calculate the AVERAGE FTE for the period,(i.e. [FTE
nurses/midwives at beginning of reporting period + FTE
nurses/midwives at end of reporting period] ÷ 2)
INCLUDE:
All nurses and midwives funded by the hospital or RHB
All nurses and midwives who are voluntary or funded by another
source
EXCLUDE:
Students
Formula {Sum total of length of stay during reporting period (Q19) + [Number
of new and repeat outpatient attendances at public facility (Q3) ÷ 3] +
[Number of new and repeat outpatient attendances at private wing
(Q4) ÷3] + [Number of non-delivering emergency room attendances
(Q8) ÷3] + [Number of emergency maternal attendances (any
gestational age) (Q37) ÷ 3] + [Number of women who gave birth in
the hospital (Q29) ÷ 2]} ÷ Average number of full time equivalent
(FTE) nurses/midwives (Q43)
Data sources Inpatient registration book/ admission and discharge register
Outpatient registration book/register
Private wing registration book/database
Emergency registration book/database
Delivery register/database
Human resource/personnel database
Frequency of
reporting
Monthly
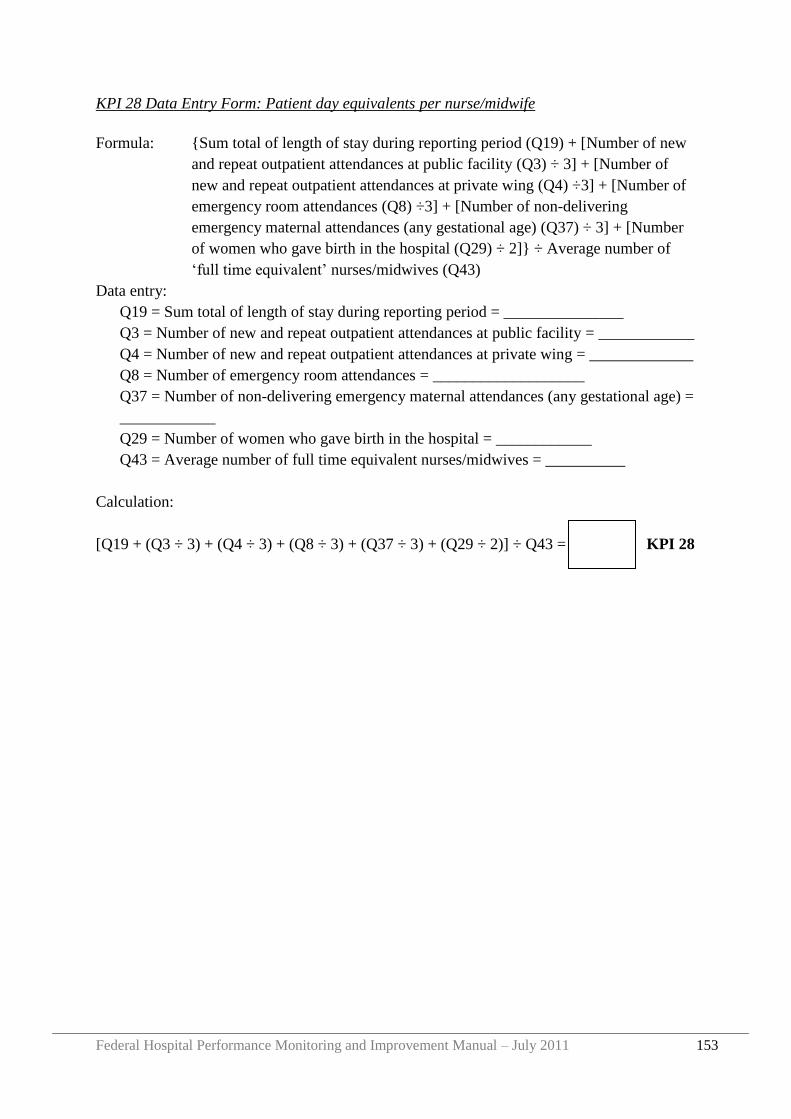
Federal Hospital Performance Monitoring and Improvement Manual – July 2011 153
KPI 28 Data Entry Form: Patient day equivalents per nurse/midwife
Formula: {Sum total of length of stay during reporting period (Q19) + [Number of new
and repeat outpatient attendances at public facility (Q3) ÷ 3] + [Number of
new and repeat outpatient attendances at private wing (Q4) ÷3] + [Number of
emergency room attendances (Q8) ÷3] + [Number of non-delivering
emergency maternal attendances (any gestational age) (Q37) ÷ 3] + [Number
of women who gave birth in the hospital (Q29) ÷ 2]} ÷ Average number of
„full time equivalent‟ nurses/midwives (Q43)
Data entry:
Q19 = Sum total of length of stay during reporting period = _______________
Q3 = Number of new and repeat outpatient attendances at public facility = ____________
Q4 = Number of new and repeat outpatient attendances at private wing = _____________
Q8 = Number of emergency room attendances = ___________________
Q37 = Number of non-delivering emergency maternal attendances (any gestational age) =
____________
Q29 = Number of women who gave birth in the hospital = ____________
Q43 = Average number of full time equivalent nurses/midwives = __________
Calculation:
[Q19 + (Q3 ÷ 3) + (Q4 ÷ 3) + (Q8 ÷ 3) + (Q37 ÷ 3) + (Q29 ÷ 2)] ÷ Q43 = KPI 28
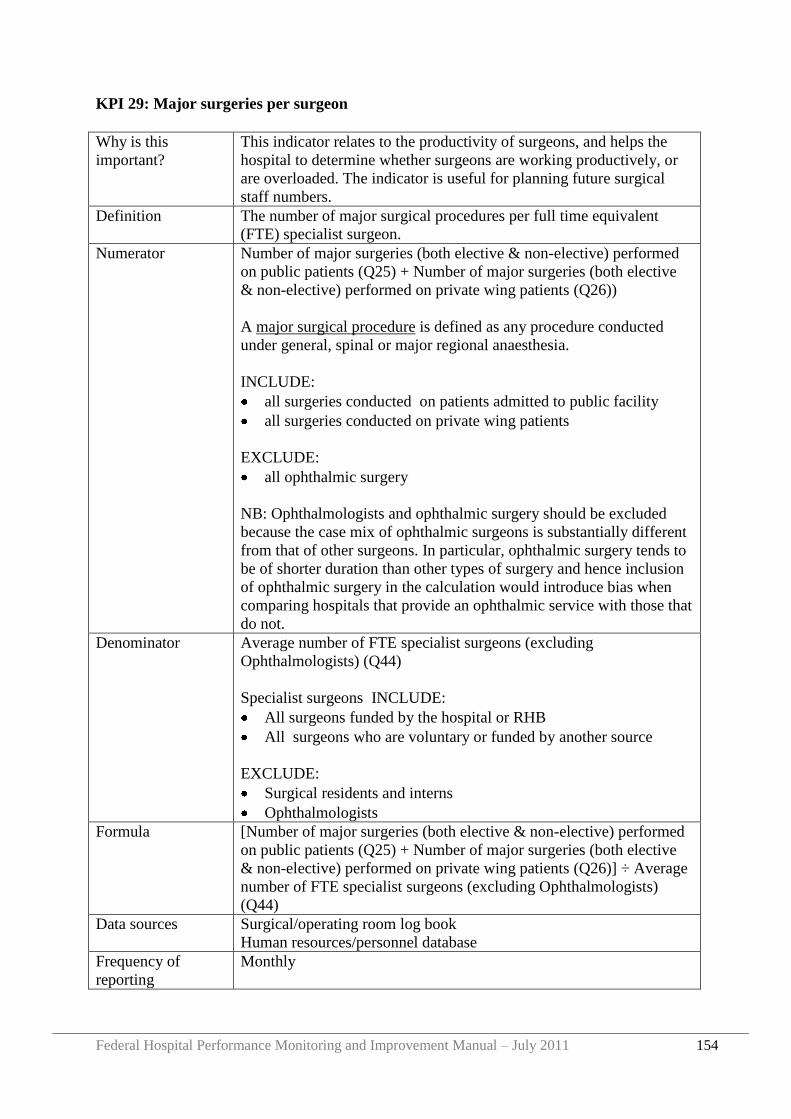
Federal Hospital Performance Monitoring and Improvement Manual – July 2011 154
KPI 29: Major surgeries per surgeon
Why is this
important?
This indicator relates to the productivity of surgeons, and helps the
hospital to determine whether surgeons are working productively, or
are overloaded. The indicator is useful for planning future surgical
staff numbers.
Definition The number of major surgical procedures per full time equivalent
(FTE) specialist surgeon.
Numerator Number of major surgeries (both elective & non-elective) performed
on public patients (Q25) + Number of major surgeries (both elective
& non-elective) performed on private wing patients (Q26))
A major surgical procedure is defined as any procedure conducted
under general, spinal or major regional anaesthesia.
INCLUDE:
all surgeries conducted on patients admitted to public facility
all surgeries conducted on private wing patients
EXCLUDE:
all ophthalmic surgery
NB: Ophthalmologists and ophthalmic surgery should be excluded
because the case mix of ophthalmic surgeons is substantially different
from that of other surgeons. In particular, ophthalmic surgery tends to
be of shorter duration than other types of surgery and hence inclusion
of ophthalmic surgery in the calculation would introduce bias when
comparing hospitals that provide an ophthalmic service with those that
do not.
Denominator Average number of FTE specialist surgeons (excluding
Ophthalmologists) (Q44)
Specialist surgeons INCLUDE:
All surgeons funded by the hospital or RHB
All surgeons who are voluntary or funded by another source
EXCLUDE:
Surgical residents and interns
Ophthalmologists
Formula [Number of major surgeries (both elective & non-elective) performed
on public patients (Q25) + Number of major surgeries (both elective
& non-elective) performed on private wing patients (Q26)] ÷ Average
number of FTE specialist surgeons (excluding Ophthalmologists)
(Q44)
Data sources Surgical/operating room log book
Human resources/personnel database
Frequency of
reporting
Monthly
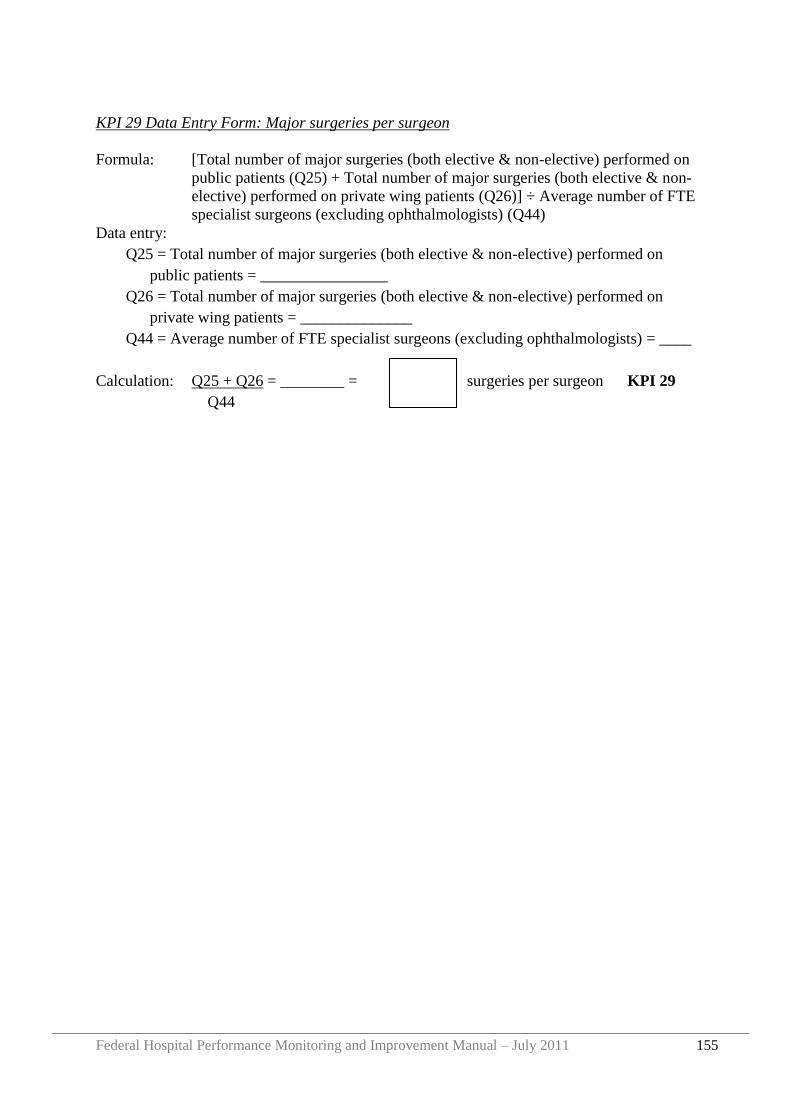
Federal Hospital Performance Monitoring and Improvement Manual – July 2011 155
KPI 29 Data Entry Form: Major surgeries per surgeon
Formula: [Total number of major surgeries (both elective & non-elective) performed on
public patients (Q25) + Total number of major surgeries (both elective & non-
elective) performed on private wing patients (Q26)] ÷ Average number of FTE
specialist surgeons (excluding ophthalmologists) (Q44)
Data entry:
Q25 = Total number of major surgeries (both elective & non-elective) performed on
public patients = ________________
Q26 = Total number of major surgeries (both elective & non-elective) performed on
private wing patients = ______________
Q44 = Average number of FTE specialist surgeons (excluding ophthalmologists) = ____
Calculation: Q25 + Q26 = ________ = surgeries per surgeon KPI 29
Q44
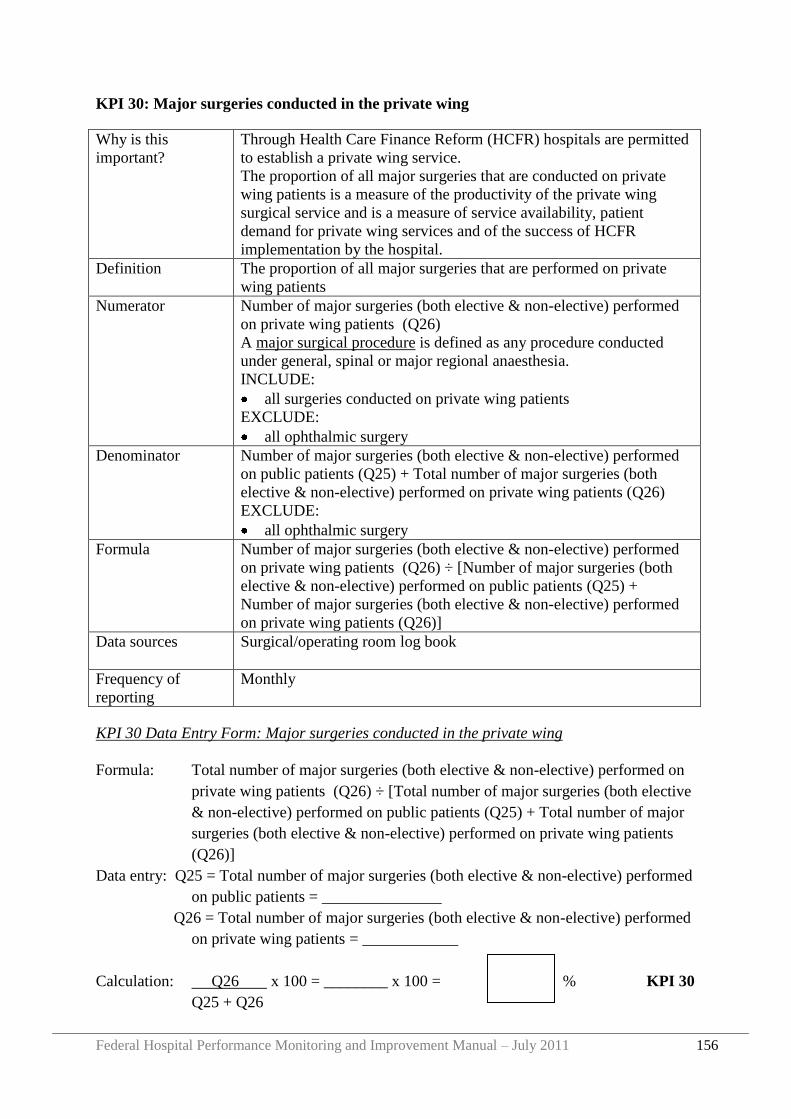
Federal Hospital Performance Monitoring and Improvement Manual – July 2011 156
KPI 30: Major surgeries conducted in the private wing
Why is this
important?
Through Health Care Finance Reform (HCFR) hospitals are permitted
to establish a private wing service.
The proportion of all major surgeries that are conducted on private
wing patients is a measure of the productivity of the private wing
surgical service and is a measure of service availability, patient
demand for private wing services and of the success of HCFR
implementation by the hospital.
Definition The proportion of all major surgeries that are performed on private
wing patients
Numerator Number of major surgeries (both elective & non-elective) performed
on private wing patients (Q26)
A major surgical procedure is defined as any procedure conducted
under general, spinal or major regional anaesthesia.
INCLUDE:
all surgeries conducted on private wing patients
EXCLUDE:
all ophthalmic surgery
Denominator Number of major surgeries (both elective & non-elective) performed
on public patients (Q25) + Total number of major surgeries (both
elective & non-elective) performed on private wing patients (Q26)
EXCLUDE:
all ophthalmic surgery
Formula Number of major surgeries (both elective & non-elective) performed
on private wing patients (Q26) ÷ [Number of major surgeries (both
elective & non-elective) performed on public patients (Q25) +
Number of major surgeries (both elective & non-elective) performed
on private wing patients (Q26)]
Data sources Surgical/operating room log book
Frequency of
reporting
Monthly
KPI 30 Data Entry Form: Major surgeries conducted in the private wing
Formula: Total number of major surgeries (both elective & non-elective) performed on
private wing patients (Q26) ÷ [Total number of major surgeries (both elective
& non-elective) performed on public patients (Q25) + Total number of major
surgeries (both elective & non-elective) performed on private wing patients
(Q26)]
Data entry: Q25 = Total number of major surgeries (both elective & non-elective) performed
on public patients = _______________
Q26 = Total number of major surgeries (both elective & non-elective) performed
on private wing patients = ____________
Calculation: Q26 x 100 = ________ x 100 = % KPI 30
Q25 + Q26
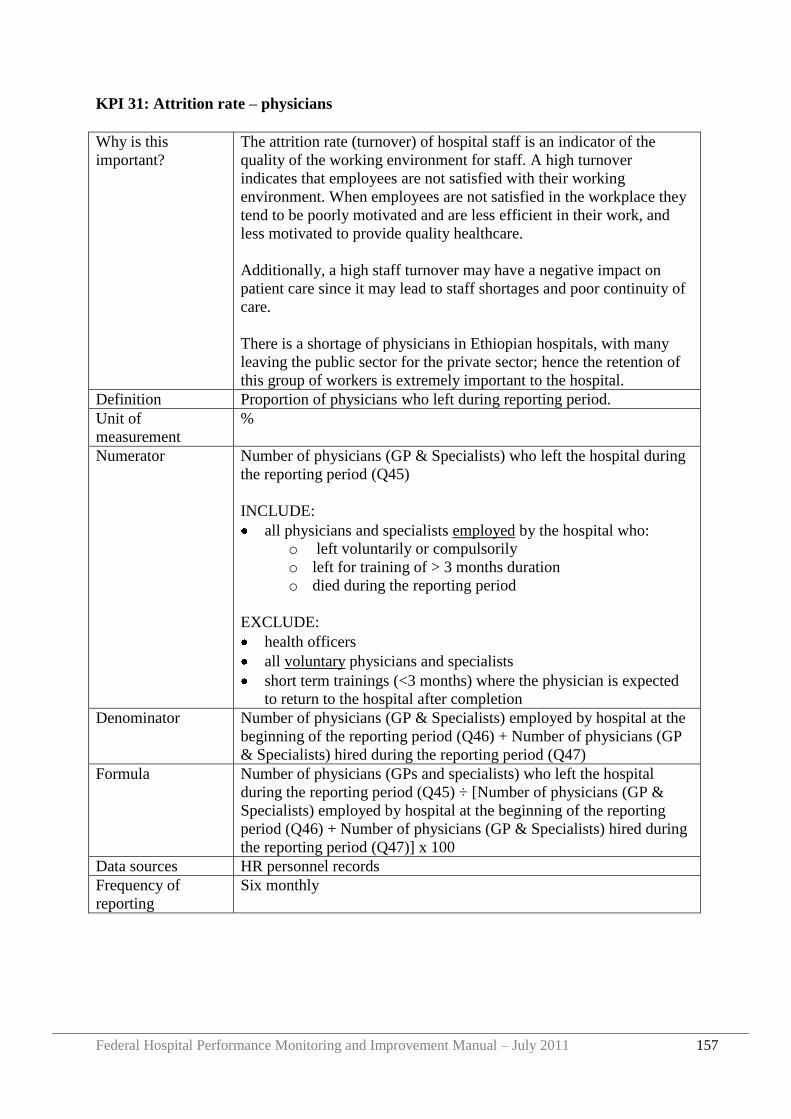
Federal Hospital Performance Monitoring and Improvement Manual – July 2011 157
KPI 31: Attrition rate – physicians
Why is this
important?
The attrition rate (turnover) of hospital staff is an indicator of the
quality of the working environment for staff. A high turnover
indicates that employees are not satisfied with their working
environment. When employees are not satisfied in the workplace they
tend to be poorly motivated and are less efficient in their work, and
less motivated to provide quality healthcare.
Additionally, a high staff turnover may have a negative impact on
patient care since it may lead to staff shortages and poor continuity of
care.
There is a shortage of physicians in Ethiopian hospitals, with many
leaving the public sector for the private sector; hence the retention of
this group of workers is extremely important to the hospital.
Definition Proportion of physicians who left during reporting period.
Unit of
measurement
%
Numerator Number of physicians (GP & Specialists) who left the hospital during
the reporting period (Q45)
INCLUDE:
all physicians and specialists employed by the hospital who:
o left voluntarily or compulsorily
o left for training of > 3 months duration
o died during the reporting period
EXCLUDE:
health officers
all voluntary physicians and specialists
short term trainings (<3 months) where the physician is expected
to return to the hospital after completion
Denominator Number of physicians (GP & Specialists) employed by hospital at the
beginning of the reporting period (Q46) + Number of physicians (GP
& Specialists) hired during the reporting period (Q47)
Formula Number of physicians (GPs and specialists) who left the hospital
during the reporting period (Q45) ÷ [Number of physicians (GP &
Specialists) employed by hospital at the beginning of the reporting
period (Q46) + Number of physicians (GP & Specialists) hired during
the reporting period (Q47)] x 100
Data sources HR personnel records
Frequency of
reporting
Six monthly
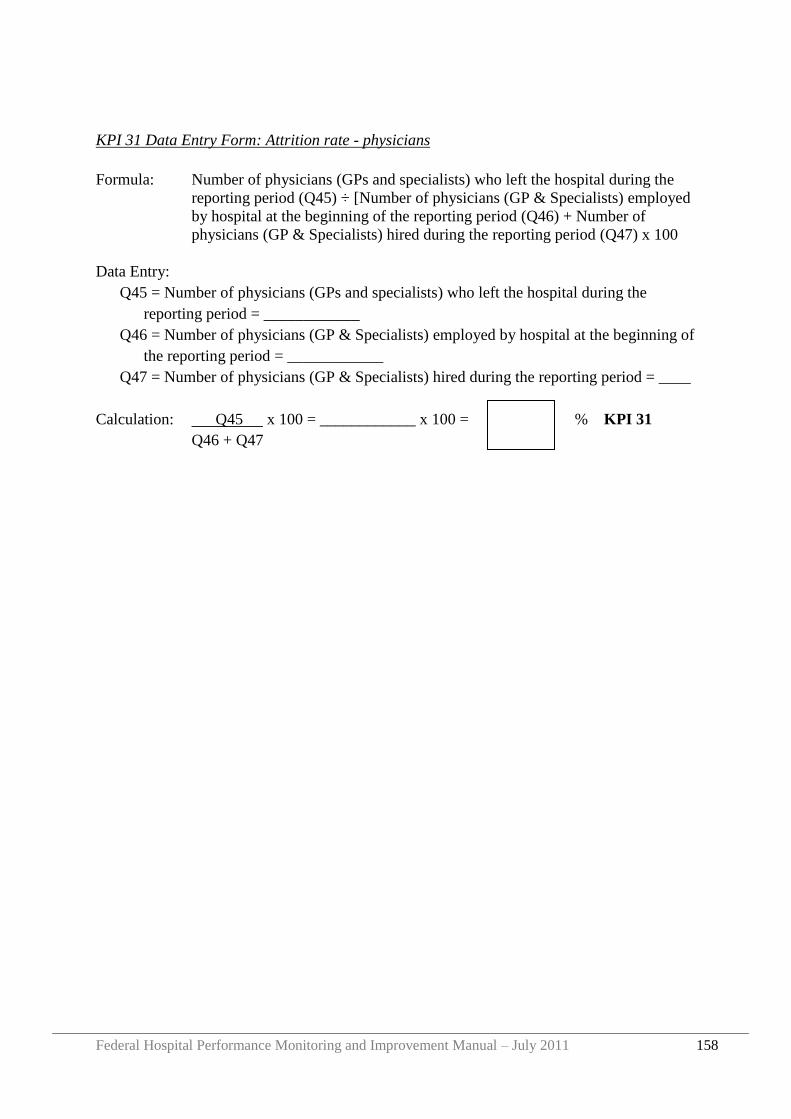
Federal Hospital Performance Monitoring and Improvement Manual – July 2011 158
KPI 31 Data Entry Form: Attrition rate - physicians
Formula: Number of physicians (GPs and specialists) who left the hospital during the
reporting period (Q45) ÷ [Number of physicians (GP & Specialists) employed
by hospital at the beginning of the reporting period (Q46) + Number of
physicians (GP & Specialists) hired during the reporting period (Q47) x 100
Data Entry:
Q45 = Number of physicians (GPs and specialists) who left the hospital during the
reporting period = ____________
Q46 = Number of physicians (GP & Specialists) employed by hospital at the beginning of
the reporting period = ____________
Q47 = Number of physicians (GP & Specialists) hired during the reporting period = ____
Calculation: Q45 x 100 = ____________ x 100 = % KPI 31
Q46 + Q47
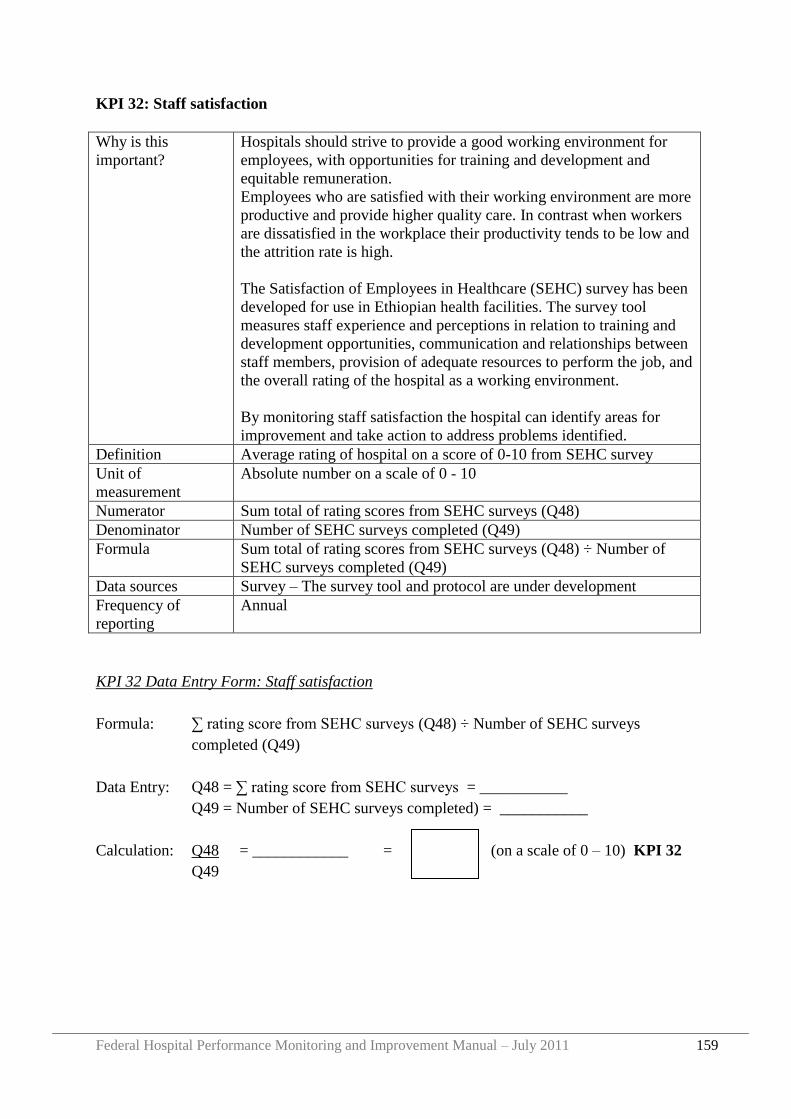
Federal Hospital Performance Monitoring and Improvement Manual – July 2011 159
KPI 32: Staff satisfaction
Why is this
important?
Hospitals should strive to provide a good working environment for
employees, with opportunities for training and development and
equitable remuneration.
Employees who are satisfied with their working environment are more
productive and provide higher quality care. In contrast when workers
are dissatisfied in the workplace their productivity tends to be low and
the attrition rate is high.
The Satisfaction of Employees in Healthcare (SEHC) survey has been
developed for use in Ethiopian health facilities. The survey tool
measures staff experience and perceptions in relation to training and
development opportunities, communication and relationships between
staff members, provision of adequate resources to perform the job, and
the overall rating of the hospital as a working environment.
By monitoring staff satisfaction the hospital can identify areas for
improvement and take action to address problems identified.
Definition Average rating of hospital on a score of 0-10 from SEHC survey
Unit of
measurement
Absolute number on a scale of 0 - 10
Numerator Sum total of rating scores from SEHC surveys (Q48)
Denominator Number of SEHC surveys completed (Q49)
Formula Sum total of rating scores from SEHC surveys (Q48) ÷ Number of
SEHC surveys completed (Q49)
Data sources Survey – The survey tool and protocol are under development
Frequency of
reporting
Annual
KPI 32 Data Entry Form: Staff satisfaction
Formula: ∑ rating score from SEHC surveys (Q48) ÷ Number of SEHC surveys
completed (Q49)
Data Entry: Q48 = ∑ rating score from SEHC surveys = ___________
Q49 = Number of SEHC surveys completed) = ___________
Calculation: Q48 = ____________ = (on a scale of 0 – 10) KPI 32
Q49
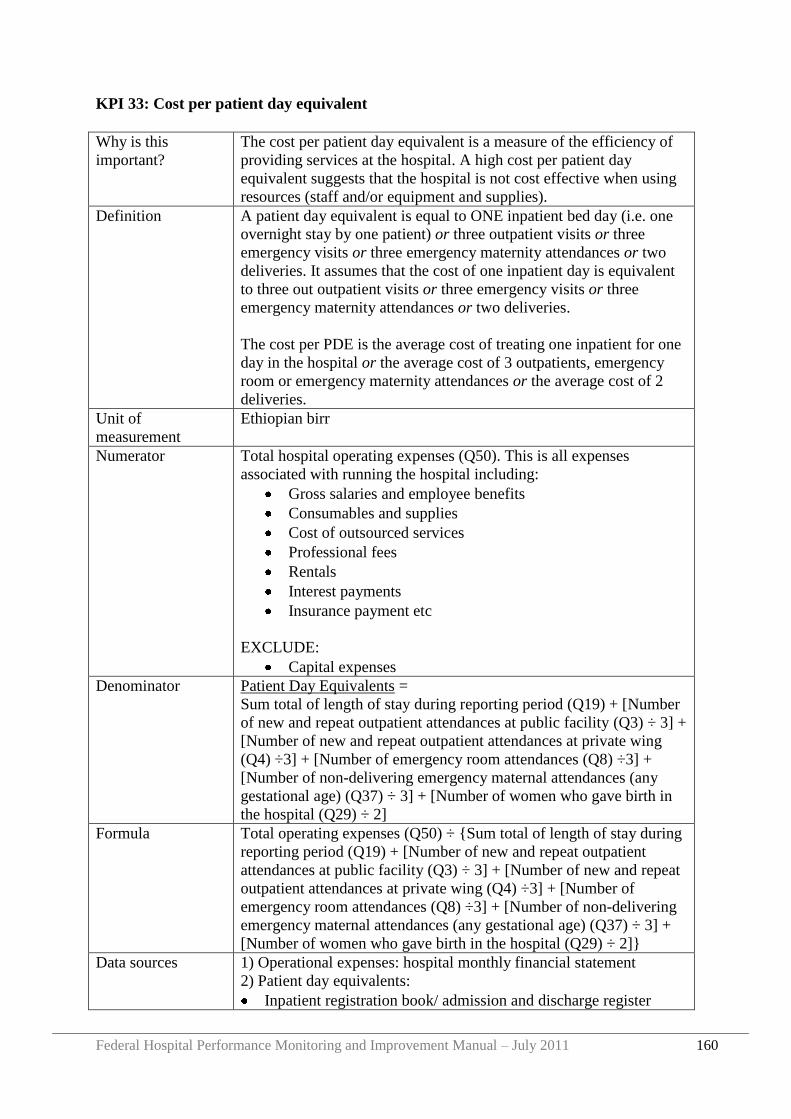
Federal Hospital Performance Monitoring and Improvement Manual – July 2011 160
KPI 33: Cost per patient day equivalent
Why is this
important?
The cost per patient day equivalent is a measure of the efficiency of
providing services at the hospital. A high cost per patient day
equivalent suggests that the hospital is not cost effective when using
resources (staff and/or equipment and supplies).
Definition A patient day equivalent is equal to ONE inpatient bed day (i.e. one
overnight stay by one patient) or three outpatient visits or three
emergency visits or three emergency maternity attendances or two
deliveries. It assumes that the cost of one inpatient day is equivalent
to three out outpatient visits or three emergency visits or three
emergency maternity attendances or two deliveries.
The cost per PDE is the average cost of treating one inpatient for one
day in the hospital or the average cost of 3 outpatients, emergency
room or emergency maternity attendances or the average cost of 2
deliveries.
Unit of
measurement
Ethiopian birr
Numerator Total hospital operating expenses (Q50). This is all expenses
associated with running the hospital including:
Gross salaries and employee benefits
Consumables and supplies
Cost of outsourced services
Professional fees
Rentals
Interest payments
Insurance payment etc
EXCLUDE:
Capital expenses
Denominator Patient Day Equivalents =
Sum total of length of stay during reporting period (Q19) + [Number
of new and repeat outpatient attendances at public facility (Q3) ÷ 3] +
[Number of new and repeat outpatient attendances at private wing
(Q4) ÷3] + [Number of emergency room attendances (Q8) ÷3] +
[Number of non-delivering emergency maternal attendances (any
gestational age) (Q37) ÷ 3] + [Number of women who gave birth in
the hospital (Q29) ÷ 2]
Formula Total operating expenses (Q50) ÷ {Sum total of length of stay during
reporting period (Q19) + [Number of new and repeat outpatient
attendances at public facility (Q3) ÷ 3] + [Number of new and repeat
outpatient attendances at private wing (Q4) ÷3] + [Number of
emergency room attendances (Q8) ÷3] + [Number of non-delivering
emergency maternal attendances (any gestational age) (Q37) ÷ 3] +
[Number of women who gave birth in the hospital (Q29) ÷ 2]}
Data sources 1) Operational expenses: hospital monthly financial statement
2) Patient day equivalents:
Inpatient registration book/ admission and discharge register
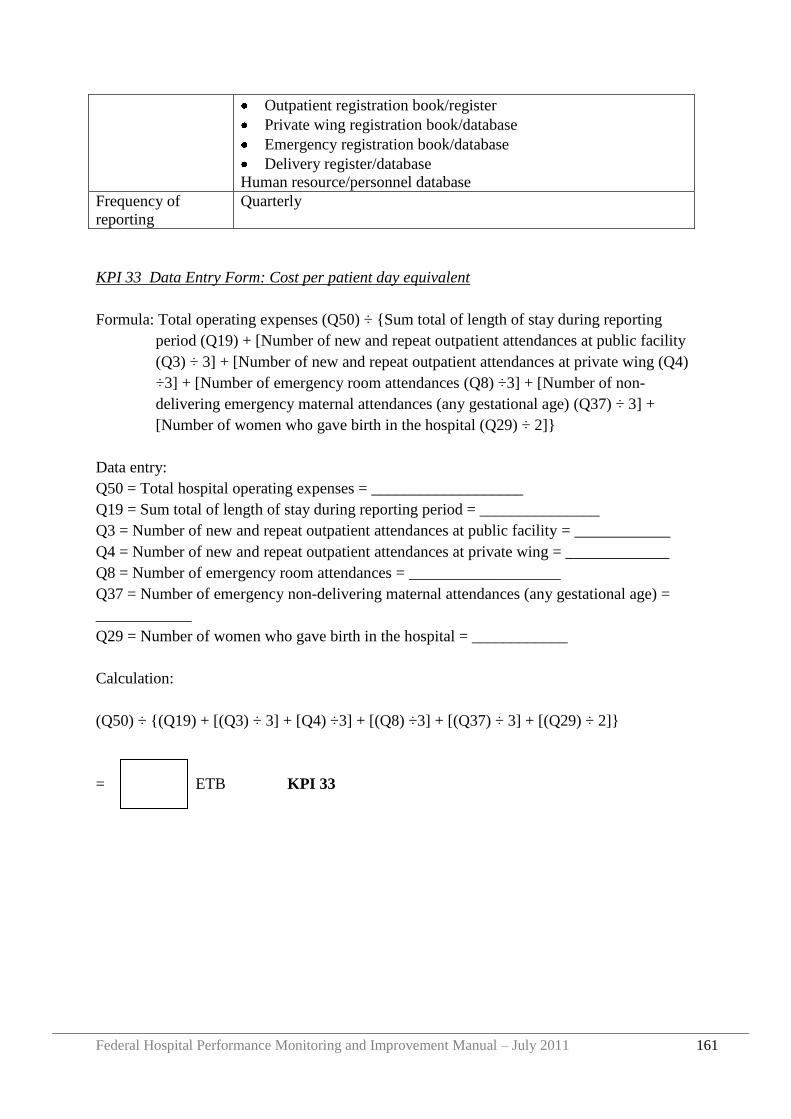
Federal Hospital Performance Monitoring and Improvement Manual – July 2011 161
Outpatient registration book/register
Private wing registration book/database
Emergency registration book/database
Delivery register/database
Human resource/personnel database
Frequency of
reporting
Quarterly
KPI 33 Data Entry Form: Cost per patient day equivalent
Formula: Total operating expenses (Q50) ÷ {Sum total of length of stay during reporting
period (Q19) + [Number of new and repeat outpatient attendances at public facility
(Q3) ÷ 3] + [Number of new and repeat outpatient attendances at private wing (Q4)
÷3] + [Number of emergency room attendances (Q8) ÷3] + [Number of non-
delivering emergency maternal attendances (any gestational age) (Q37) ÷ 3] +
[Number of women who gave birth in the hospital (Q29) ÷ 2]}
Data entry:
Q50 = Total hospital operating expenses = ___________________
Q19 = Sum total of length of stay during reporting period = _______________
Q3 = Number of new and repeat outpatient attendances at public facility = ____________
Q4 = Number of new and repeat outpatient attendances at private wing = _____________
Q8 = Number of emergency room attendances = ___________________
Q37 = Number of emergency non-delivering maternal attendances (any gestational age) =
____________
Q29 = Number of women who gave birth in the hospital = ____________
Calculation:
(Q50) ÷ {(Q19) + [(Q3) ÷ 3] + [Q4) ÷3] + [(Q8) ÷3] + [(Q37) ÷ 3] + [(Q29) ÷ 2]}
= ETB KPI 33
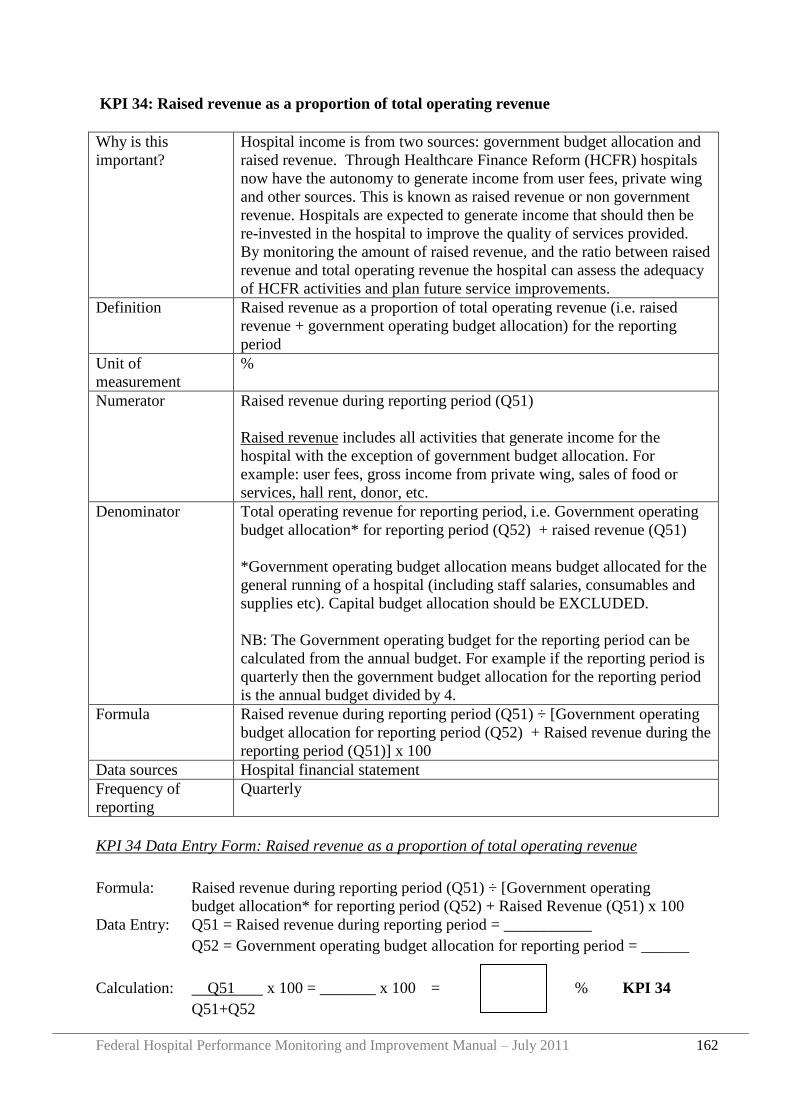
Federal Hospital Performance Monitoring and Improvement Manual – July 2011 162
KPI 34: Raised revenue as a proportion of total operating revenue
Why is this
important?
Hospital income is from two sources: government budget allocation and
raised revenue. Through Healthcare Finance Reform (HCFR) hospitals
now have the autonomy to generate income from user fees, private wing
and other sources. This is known as raised revenue or non government
revenue. Hospitals are expected to generate income that should then be
re-invested in the hospital to improve the quality of services provided.
By monitoring the amount of raised revenue, and the ratio between raised
revenue and total operating revenue the hospital can assess the adequacy
of HCFR activities and plan future service improvements.
Definition Raised revenue as a proportion of total operating revenue (i.e. raised
revenue + government operating budget allocation) for the reporting
period
Unit of
measurement
%
Numerator Raised revenue during reporting period (Q51)
Raised revenue includes all activities that generate income for the
hospital with the exception of government budget allocation. For
example: user fees, gross income from private wing, sales of food or
services, hall rent, donor, etc.
Denominator Total operating revenue for reporting period, i.e. Government operating
budget allocation* for reporting period (Q52) + raised revenue (Q51)
*Government operating budget allocation means budget allocated for the
general running of a hospital (including staff salaries, consumables and
supplies etc). Capital budget allocation should be EXCLUDED.
NB: The Government operating budget for the reporting period can be
calculated from the annual budget. For example if the reporting period is
quarterly then the government budget allocation for the reporting period
is the annual budget divided by 4.
Formula Raised revenue during reporting period (Q51) ÷ [Government operating
budget allocation for reporting period (Q52) + Raised revenue during the
reporting period (Q51)] x 100
Data sources Hospital financial statement
Frequency of
reporting
Quarterly
KPI 34 Data Entry Form: Raised revenue as a proportion of total operating revenue
Formula: Raised revenue during reporting period (Q51) ÷ [Government operating
budget allocation* for reporting period (Q52) + Raised Revenue (Q51) x 100
Data Entry: Q51 = Raised revenue during reporting period = ___________
Q52 = Government operating budget allocation for reporting period = ______
Calculation: Q51 x 100 = _______ x 100 = % KPI 34
Q51+Q52
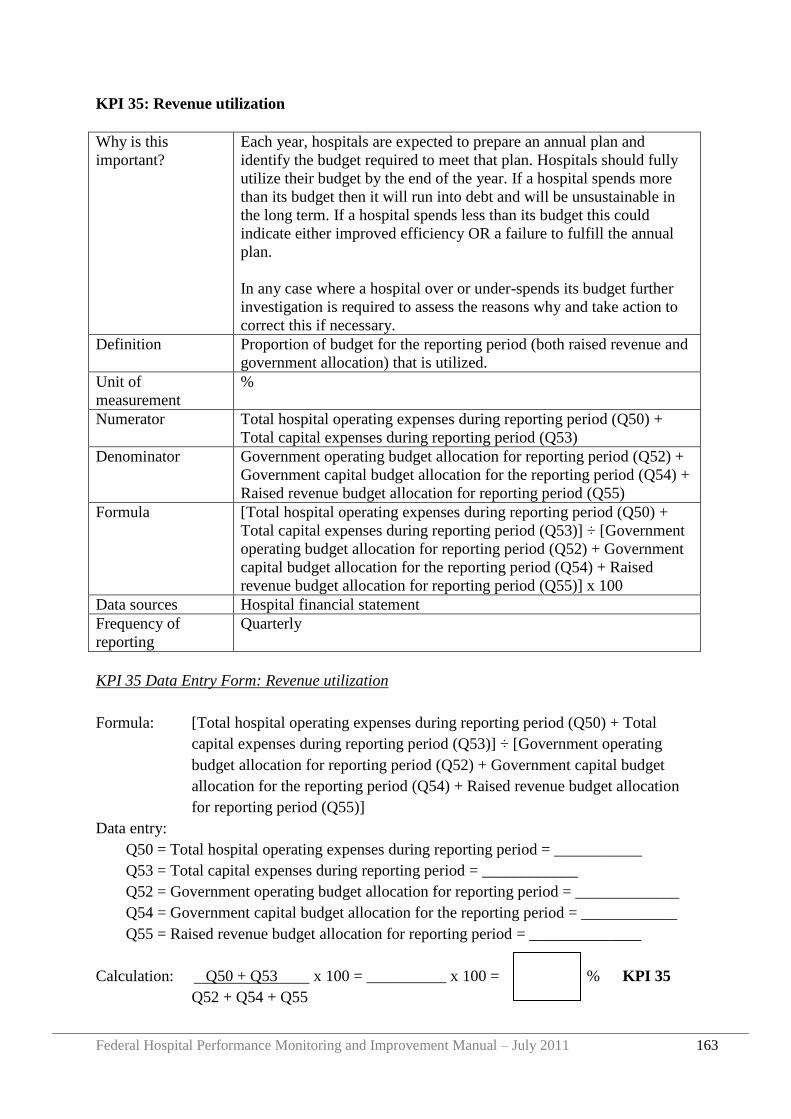
Federal Hospital Performance Monitoring and Improvement Manual – July 2011 163
KPI 35: Revenue utilization
Why is this
important?
Each year, hospitals are expected to prepare an annual plan and
identify the budget required to meet that plan. Hospitals should fully
utilize their budget by the end of the year. If a hospital spends more
than its budget then it will run into debt and will be unsustainable in
the long term. If a hospital spends less than its budget this could
indicate either improved efficiency OR a failure to fulfill the annual
plan.
In any case where a hospital over or under-spends its budget further
investigation is required to assess the reasons why and take action to
correct this if necessary.
Definition Proportion of budget for the reporting period (both raised revenue and
government allocation) that is utilized.
Unit of
measurement
%
Numerator Total hospital operating expenses during reporting period (Q50) +
Total capital expenses during reporting period (Q53)
Denominator Government operating budget allocation for reporting period (Q52) +
Government capital budget allocation for the reporting period (Q54) +
Raised revenue budget allocation for reporting period (Q55)
Formula [Total hospital operating expenses during reporting period (Q50) +
Total capital expenses during reporting period (Q53)] ÷ [Government
operating budget allocation for reporting period (Q52) + Government
capital budget allocation for the reporting period (Q54) + Raised
revenue budget allocation for reporting period (Q55)] x 100
Data sources Hospital financial statement
Frequency of
reporting
Quarterly
KPI 35 Data Entry Form: Revenue utilization
Formula: [Total hospital operating expenses during reporting period (Q50) + Total
capital expenses during reporting period (Q53)] ÷ [Government operating
budget allocation for reporting period (Q52) + Government capital budget
allocation for the reporting period (Q54) + Raised revenue budget allocation
for reporting period (Q55)]
Data entry:
Q50 = Total hospital operating expenses during reporting period = ___________
Q53 = Total capital expenses during reporting period = ____________
Q52 = Government operating budget allocation for reporting period = _____________
Q54 = Government capital budget allocation for the reporting period = ____________
Q55 = Raised revenue budget allocation for reporting period = ______________
Calculation: Q50 + Q53 x 100 = __________ x 100 = % KPI 35
Q52 + Q54 + Q55
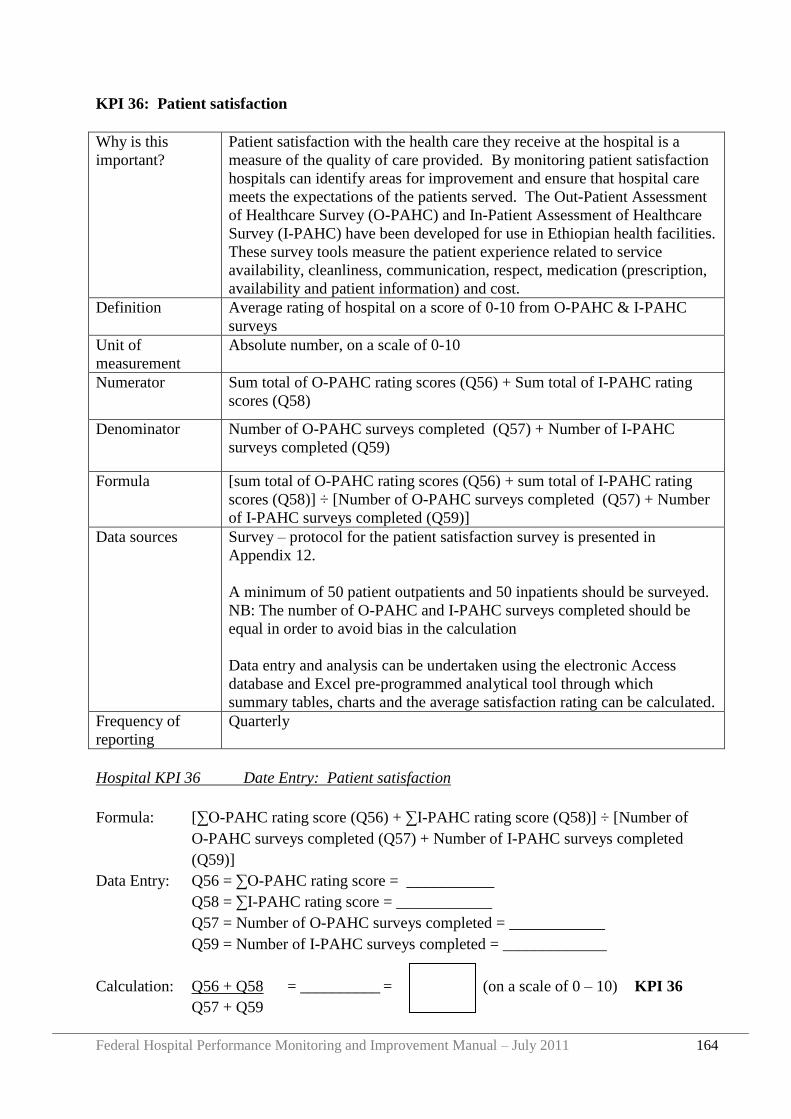
Federal Hospital Performance Monitoring and Improvement Manual – July 2011 164
KPI 36: Patient satisfaction
Why is this
important?
Patient satisfaction with the health care they receive at the hospital is a
measure of the quality of care provided. By monitoring patient satisfaction
hospitals can identify areas for improvement and ensure that hospital care
meets the expectations of the patients served. The Out-Patient Assessment
of Healthcare Survey (O-PAHC) and In-Patient Assessment of Healthcare
Survey (I-PAHC) have been developed for use in Ethiopian health facilities.
These survey tools measure the patient experience related to service
availability, cleanliness, communication, respect, medication (prescription,
availability and patient information) and cost.
Definition Average rating of hospital on a score of 0-10 from O-PAHC & I-PAHC
surveys
Unit of
measurement
Absolute number, on a scale of 0-10
Numerator Sum total of O-PAHC rating scores (Q56) + Sum total of I-PAHC rating
scores (Q58)
Denominator Number of O-PAHC surveys completed (Q57) + Number of I-PAHC
surveys completed (Q59)
Formula [sum total of O-PAHC rating scores (Q56) + sum total of I-PAHC rating
scores (Q58)] ÷ [Number of O-PAHC surveys completed (Q57) + Number
of I-PAHC surveys completed (Q59)]
Data sources Survey – protocol for the patient satisfaction survey is presented in
Appendix 12.
A minimum of 50 patient outpatients and 50 inpatients should be surveyed.
NB: The number of O-PAHC and I-PAHC surveys completed should be
equal in order to avoid bias in the calculation
Data entry and analysis can be undertaken using the electronic Access
database and Excel pre-programmed analytical tool through which
summary tables, charts and the average satisfaction rating can be calculated.
Frequency of
reporting
Quarterly
Hospital KPI 36 Date Entry: Patient satisfaction
Formula: [∑O-PAHC rating score (Q56) + ∑I-PAHC rating score (Q58)] ÷ [Number of
O-PAHC surveys completed (Q57) + Number of I-PAHC surveys completed
(Q59)]
Data Entry: Q56 = ∑O-PAHC rating score = ___________
Q58 = ∑I-PAHC rating score = ____________
Q57 = Number of O-PAHC surveys completed = ____________
Q59 = Number of I-PAHC surveys completed = _____________
Calculation: Q56 + Q58 = __________ = (on a scale of 0 – 10) KPI 36
Q57 + Q59
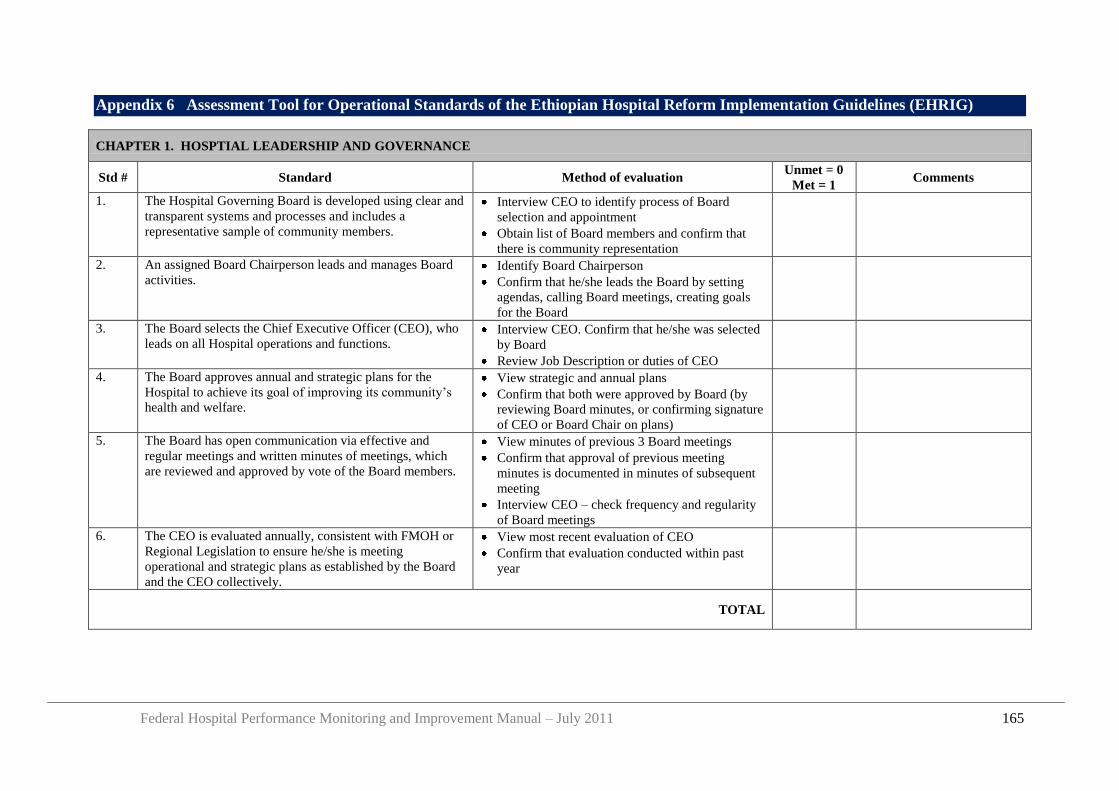
Federal Hospital Performance Monitoring and Improvement Manual – July 2011 165
Appendix 6 Assessment Tool for Operational Standards of the Ethiopian Hospital Reform Implementation Guidelines (EHRIG)
CHAPTER 1. HOSPTIAL LEADERSHIP AND GOVERNANCE
Std # Standard Method of evaluation Unmet = 0
Met = 1 Comments
1. The Hospital Governing Board is developed using clear and
transparent systems and processes and includes a
representative sample of community members.
Interview CEO to identify process of Board
selection and appointment
Obtain list of Board members and confirm that
there is community representation
2. An assigned Board Chairperson leads and manages Board
activities. Identify Board Chairperson
Confirm that he/she leads the Board by setting
agendas, calling Board meetings, creating goals
for the Board
3. The Board selects the Chief Executive Officer (CEO), who
leads on all Hospital operations and functions. Interview CEO. Confirm that he/she was selected
by Board
Review Job Description or duties of CEO
4. The Board approves annual and strategic plans for the
Hospital to achieve its goal of improving its community‟s
health and welfare.
View strategic and annual plans
Confirm that both were approved by Board (by
reviewing Board minutes, or confirming signature
of CEO or Board Chair on plans)
5. The Board has open communication via effective and
regular meetings and written minutes of meetings, which
are reviewed and approved by vote of the Board members.
View minutes of previous 3 Board meetings
Confirm that approval of previous meeting
minutes is documented in minutes of subsequent
meeting
Interview CEO – check frequency and regularity
of Board meetings
6. The CEO is evaluated annually, consistent with FMOH or
Regional Legislation to ensure he/she is meeting
operational and strategic plans as established by the Board
and the CEO collectively.
View most recent evaluation of CEO
Confirm that evaluation conducted within past
year
TOTAL
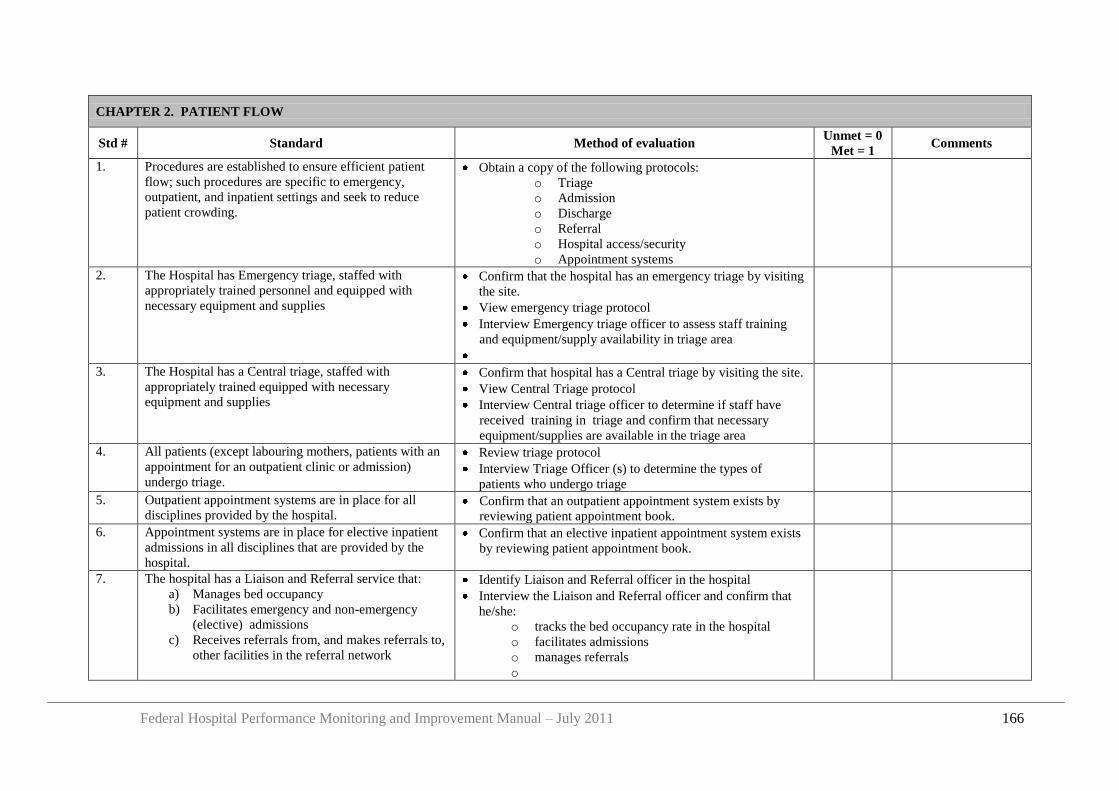
Federal Hospital Performance Monitoring and Improvement Manual – July 2011 166
CHAPTER 2. PATIENT FLOW
Std # Standard Method of evaluation Unmet = 0
Met = 1 Comments
1. Procedures are established to ensure efficient patient
flow; such procedures are specific to emergency,
outpatient, and inpatient settings and seek to reduce
patient crowding.
Obtain a copy of the following protocols:
o Triage
o Admission
o Discharge
o Referral
o Hospital access/security
o Appointment systems
2. The Hospital has Emergency triage, staffed with
appropriately trained personnel and equipped with
necessary equipment and supplies
Confirm that the hospital has an emergency triage by visiting
the site.
View emergency triage protocol
Interview Emergency triage officer to assess staff training
and equipment/supply availability in triage area
3. The Hospital has a Central triage, staffed with
appropriately trained equipped with necessary
equipment and supplies
Confirm that hospital has a Central triage by visiting the site.
View Central Triage protocol
Interview Central triage officer to determine if staff have
received training in triage and confirm that necessary
equipment/supplies are available in the triage area
4. All patients (except labouring mothers, patients with an
appointment for an outpatient clinic or admission)
undergo triage.
Review triage protocol
Interview Triage Officer (s) to determine the types of
patients who undergo triage
5. Outpatient appointment systems are in place for all
disciplines provided by the hospital. Confirm that an outpatient appointment system exists by
reviewing patient appointment book.
6. Appointment systems are in place for elective inpatient
admissions in all disciplines that are provided by the
hospital.
Confirm that an elective inpatient appointment system exists
by reviewing patient appointment book.
7. The hospital has a Liaison and Referral service that:
a) Manages bed occupancy
b) Facilitates emergency and non-emergency
(elective) admissions
c) Receives referrals from, and makes referrals to,
other facilities in the referral network
Identify Liaison and Referral officer in the hospital
Interview the Liaison and Referral officer and confirm that
he/she:
o tracks the bed occupancy rate in the hospital
o facilitates admissions
o manages referrals
o
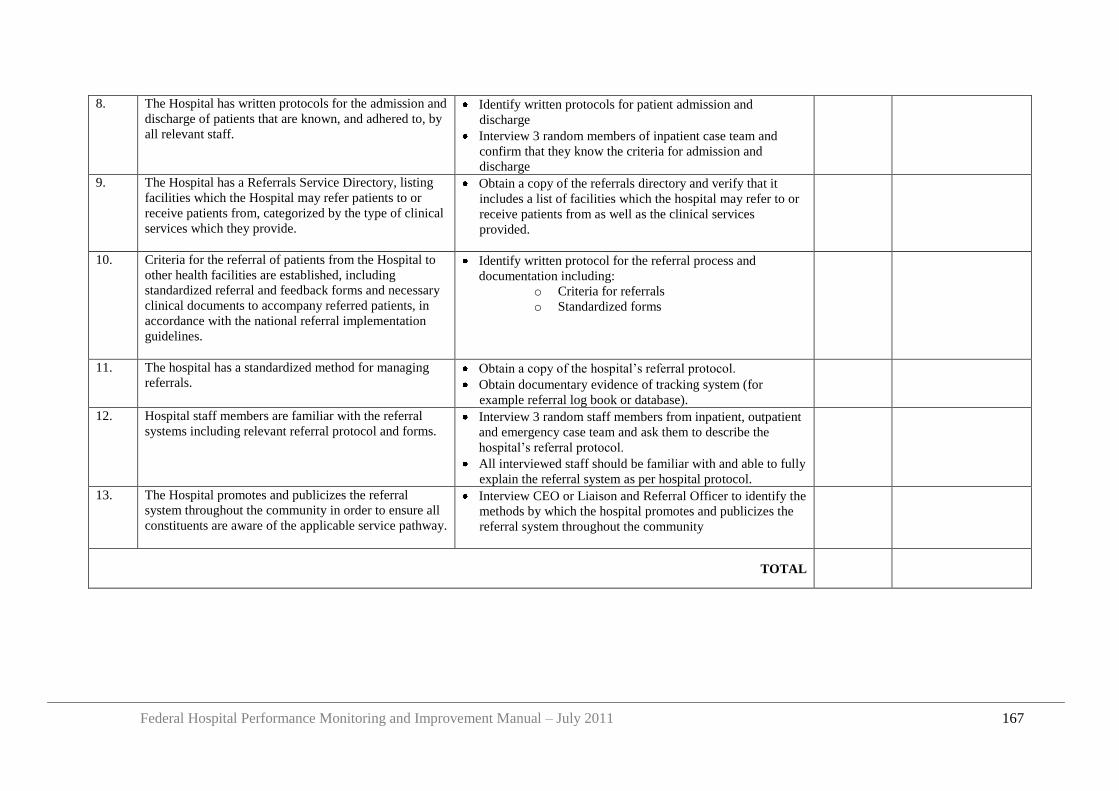
Federal Hospital Performance Monitoring and Improvement Manual – July 2011 167
8. The Hospital has written protocols for the admission and
discharge of patients that are known, and adhered to, by
all relevant staff.
Identify written protocols for patient admission and
discharge
Interview 3 random members of inpatient case team and
confirm that they know the criteria for admission and
discharge
9. The Hospital has a Referrals Service Directory, listing
facilities which the Hospital may refer patients to or
receive patients from, categorized by the type of clinical
services which they provide.
Obtain a copy of the referrals directory and verify that it
includes a list of facilities which the hospital may refer to or
receive patients from as well as the clinical services
provided.
10. Criteria for the referral of patients from the Hospital to
other health facilities are established, including
standardized referral and feedback forms and necessary
clinical documents to accompany referred patients, in
accordance with the national referral implementation
guidelines.
Identify written protocol for the referral process and
documentation including:
o Criteria for referrals
o Standardized forms
11. The hospital has a standardized method for managing
referrals. Obtain a copy of the hospital‟s referral protocol.
Obtain documentary evidence of tracking system (for
example referral log book or database).
12. Hospital staff members are familiar with the referral
systems including relevant referral protocol and forms. Interview 3 random staff members from inpatient, outpatient
and emergency case team and ask them to describe the
hospital‟s referral protocol.
All interviewed staff should be familiar with and able to fully
explain the referral system as per hospital protocol.
13. The Hospital promotes and publicizes the referral
system throughout the community in order to ensure all
constituents are aware of the applicable service pathway.
Interview CEO or Liaison and Referral Officer to identify the
methods by which the hospital promotes and publicizes the
referral system throughout the community
TOTAL
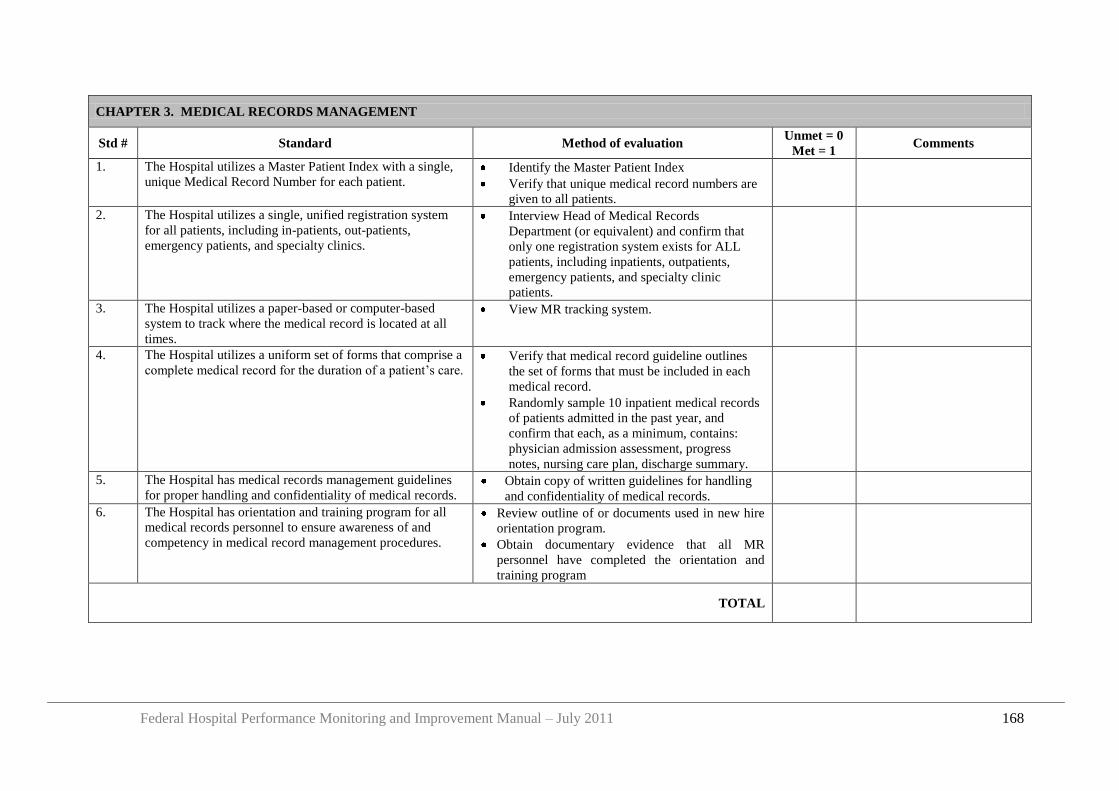
Federal Hospital Performance Monitoring and Improvement Manual – July 2011 168
CHAPTER 3. MEDICAL RECORDS MANAGEMENT
Std # Standard Method of evaluation Unmet = 0
Met = 1 Comments
1. The Hospital utilizes a Master Patient Index with a single,
unique Medical Record Number for each patient. Identify the Master Patient Index
Verify that unique medical record numbers are
given to all patients.
2. The Hospital utilizes a single, unified registration system
for all patients, including in-patients, out-patients,
emergency patients, and specialty clinics.
Interview Head of Medical Records
Department (or equivalent) and confirm that
only one registration system exists for ALL
patients, including inpatients, outpatients,
emergency patients, and specialty clinic
patients.
3. The Hospital utilizes a paper-based or computer-based
system to track where the medical record is located at all
times.
View MR tracking system.
4. The Hospital utilizes a uniform set of forms that comprise a
complete medical record for the duration of a patient‟s care. Verify that medical record guideline outlines
the set of forms that must be included in each
medical record.
Randomly sample 10 inpatient medical records
of patients admitted in the past year, and
confirm that each, as a minimum, contains:
physician admission assessment, progress
notes, nursing care plan, discharge summary.
5. The Hospital has medical records management guidelines
for proper handling and confidentiality of medical records. Obtain copy of written guidelines for handling
and confidentiality of medical records.
6. The Hospital has orientation and training program for all
medical records personnel to ensure awareness of and
competency in medical record management procedures.
Review outline of or documents used in new hire
orientation program.
Obtain documentary evidence that all MR
personnel have completed the orientation and
training program
TOTAL
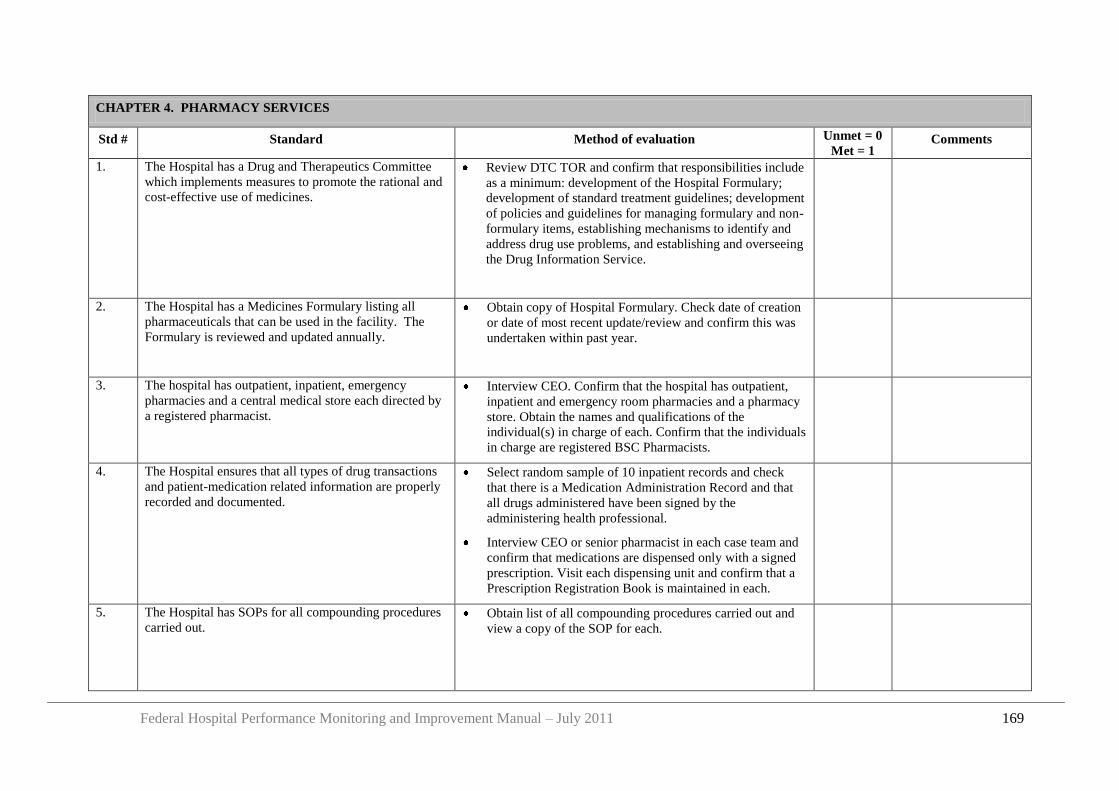
Federal Hospital Performance Monitoring and Improvement Manual – July 2011 169
CHAPTER 4. PHARMACY SERVICES
Std # Standard Method of evaluation Unmet = 0
Met = 1 Comments
1. The Hospital has a Drug and Therapeutics Committee
which implements measures to promote the rational and
cost-effective use of medicines.
Review DTC TOR and confirm that responsibilities include
as a minimum: development of the Hospital Formulary;
development of standard treatment guidelines; development
of policies and guidelines for managing formulary and non-
formulary items, establishing mechanisms to identify and
address drug use problems, and establishing and overseeing
the Drug Information Service.
2. The Hospital has a Medicines Formulary listing all
pharmaceuticals that can be used in the facility. The
Formulary is reviewed and updated annually.
Obtain copy of Hospital Formulary. Check date of creation
or date of most recent update/review and confirm this was
undertaken within past year.
3. The hospital has outpatient, inpatient, emergency
pharmacies and a central medical store each directed by
a registered pharmacist.
Interview CEO. Confirm that the hospital has outpatient,
inpatient and emergency room pharmacies and a pharmacy
store. Obtain the names and qualifications of the
individual(s) in charge of each. Confirm that the individuals
in charge are registered BSC Pharmacists.
4. The Hospital ensures that all types of drug transactions
and patient-medication related information are properly
recorded and documented.
Select random sample of 10 inpatient records and check
that there is a Medication Administration Record and that
all drugs administered have been signed by the
administering health professional.
Interview CEO or senior pharmacist in each case team and
confirm that medications are dispensed only with a signed
prescription. Visit each dispensing unit and confirm that a
Prescription Registration Book is maintained in each.
5. The Hospital has SOPs for all compounding procedures
carried out. Obtain list of all compounding procedures carried out and
view a copy of the SOP for each.
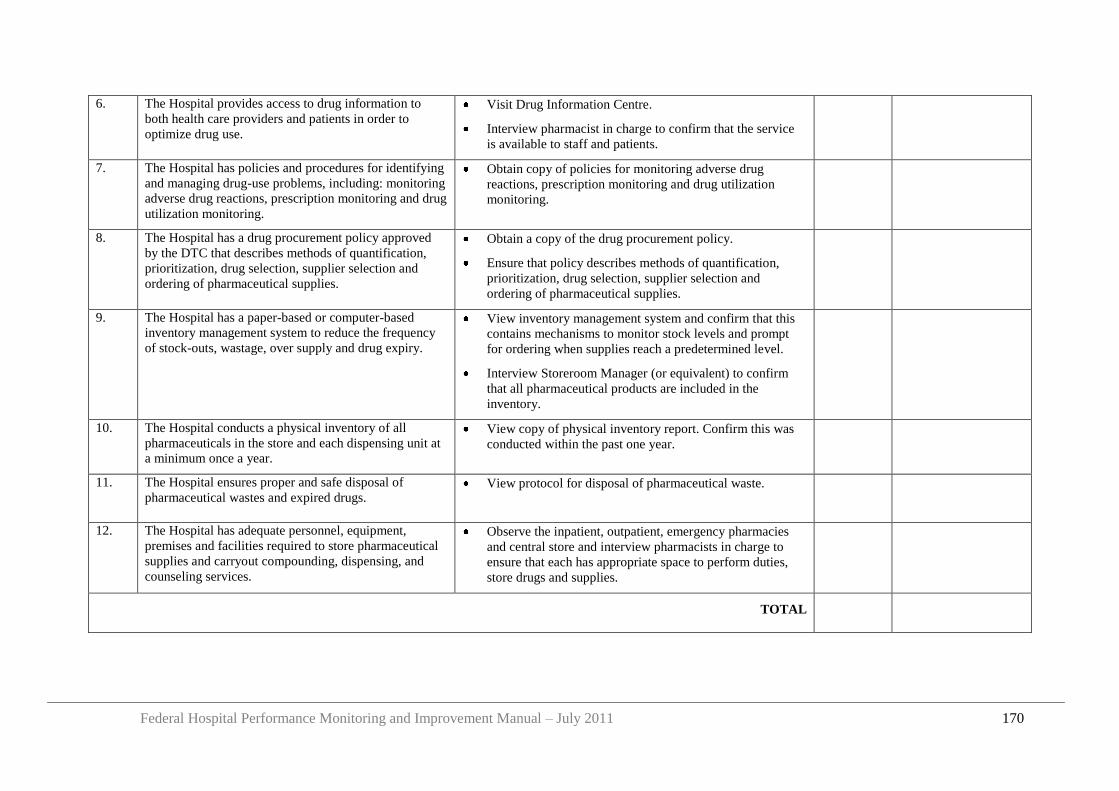
Federal Hospital Performance Monitoring and Improvement Manual – July 2011 170
6. The Hospital provides access to drug information to
both health care providers and patients in order to
optimize drug use.
Visit Drug Information Centre.
Interview pharmacist in charge to confirm that the service
is available to staff and patients.
7. The Hospital has policies and procedures for identifying
and managing drug-use problems, including: monitoring
adverse drug reactions, prescription monitoring and drug
utilization monitoring.
Obtain copy of policies for monitoring adverse drug
reactions, prescription monitoring and drug utilization
monitoring.
8. The Hospital has a drug procurement policy approved
by the DTC that describes methods of quantification,
prioritization, drug selection, supplier selection and
ordering of pharmaceutical supplies.
Obtain a copy of the drug procurement policy.
Ensure that policy describes methods of quantification,
prioritization, drug selection, supplier selection and
ordering of pharmaceutical supplies.
9. The Hospital has a paper-based or computer-based
inventory management system to reduce the frequency
of stock-outs, wastage, over supply and drug expiry.
View inventory management system and confirm that this
contains mechanisms to monitor stock levels and prompt
for ordering when supplies reach a predetermined level.
Interview Storeroom Manager (or equivalent) to confirm
that all pharmaceutical products are included in the
inventory.
10. The Hospital conducts a physical inventory of all
pharmaceuticals in the store and each dispensing unit at
a minimum once a year.
View copy of physical inventory report. Confirm this was
conducted within the past one year.
11. The Hospital ensures proper and safe disposal of
pharmaceutical wastes and expired drugs. View protocol for disposal of pharmaceutical waste.
12. The Hospital has adequate personnel, equipment,
premises and facilities required to store pharmaceutical
supplies and carryout compounding, dispensing, and
counseling services.
Observe the inpatient, outpatient, emergency pharmacies
and central store and interview pharmacists in charge to
ensure that each has appropriate space to perform duties,
store drugs and supplies.
TOTAL
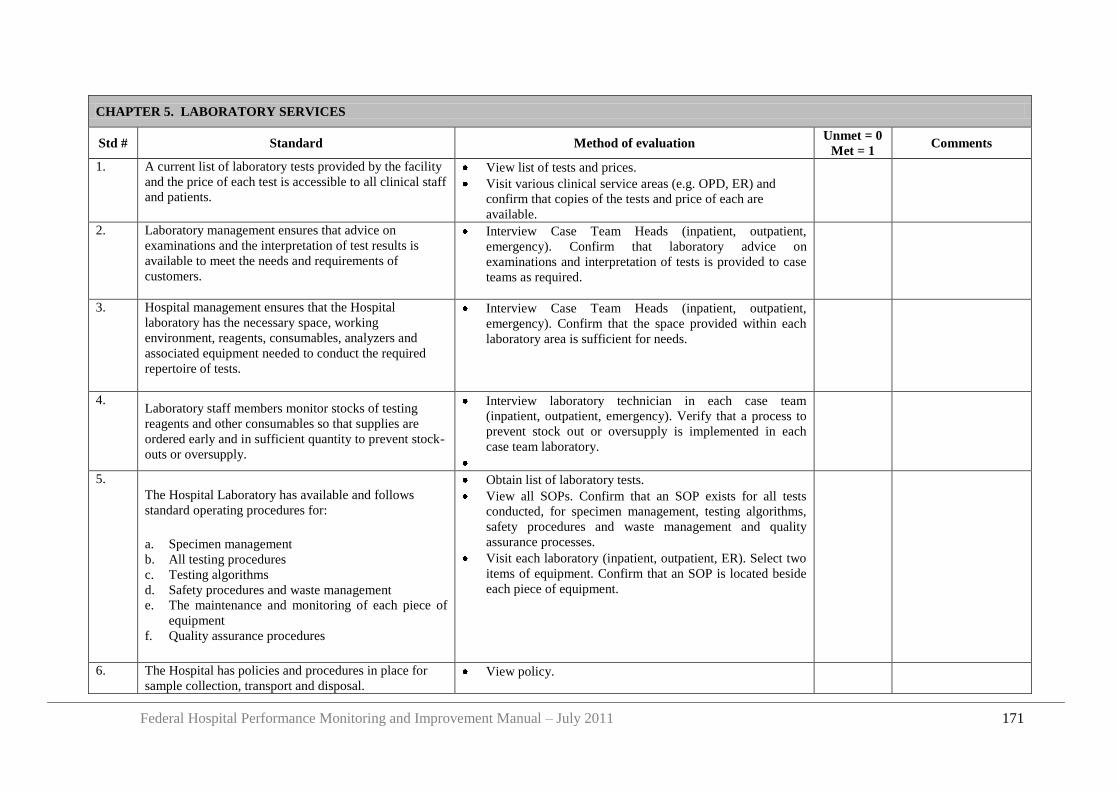
Federal Hospital Performance Monitoring and Improvement Manual – July 2011 171
CHAPTER 5. LABORATORY SERVICES
Std # Standard Method of evaluation Unmet = 0
Met = 1 Comments
1. A current list of laboratory tests provided by the facility
and the price of each test is accessible to all clinical staff
and patients.
View list of tests and prices.
Visit various clinical service areas (e.g. OPD, ER) and
confirm that copies of the tests and price of each are
available.
2. Laboratory management ensures that advice on
examinations and the interpretation of test results is
available to meet the needs and requirements of
customers.
Interview Case Team Heads (inpatient, outpatient,
emergency). Confirm that laboratory advice on
examinations and interpretation of tests is provided to case
teams as required.
3. Hospital management ensures that the Hospital
laboratory has the necessary space, working
environment, reagents, consumables, analyzers and
associated equipment needed to conduct the required
repertoire of tests.
Interview Case Team Heads (inpatient, outpatient,
emergency). Confirm that the space provided within each
laboratory area is sufficient for needs.
4. Laboratory staff members monitor stocks of testing
reagents and other consumables so that supplies are
ordered early and in sufficient quantity to prevent stock-
outs or oversupply.
Interview laboratory technician in each case team
(inpatient, outpatient, emergency). Verify that a process to
prevent stock out or oversupply is implemented in each
case team laboratory.
5.
The Hospital Laboratory has available and follows
standard operating procedures for:
a. Specimen management
b. All testing procedures
c. Testing algorithms
d. Safety procedures and waste management
e. The maintenance and monitoring of each piece of
equipment
f. Quality assurance procedures
Obtain list of laboratory tests.
View all SOPs. Confirm that an SOP exists for all tests
conducted, for specimen management, testing algorithms,
safety procedures and waste management and quality
assurance processes.
Visit each laboratory (inpatient, outpatient, ER). Select two
items of equipment. Confirm that an SOP is located beside
each piece of equipment.
6. The Hospital has policies and procedures in place for
sample collection, transport and disposal. View policy.
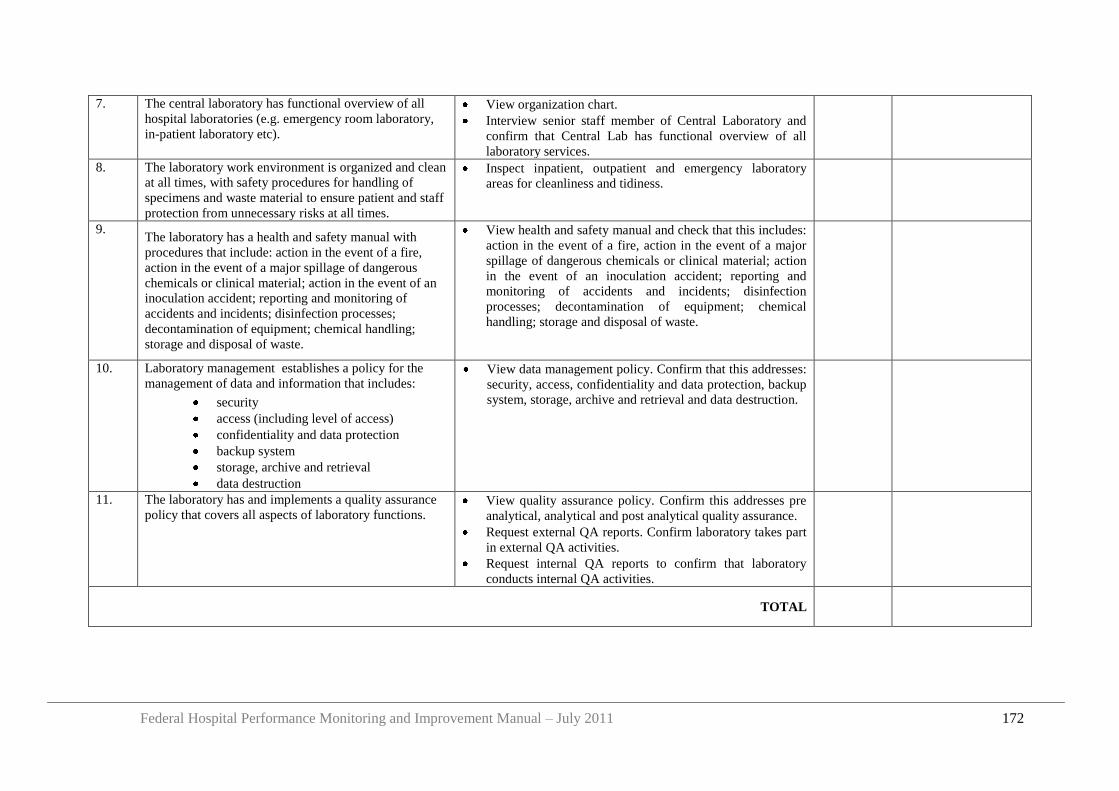
Federal Hospital Performance Monitoring and Improvement Manual – July 2011 172
7. The central laboratory has functional overview of all
hospital laboratories (e.g. emergency room laboratory,
in-patient laboratory etc).
View organization chart.
Interview senior staff member of Central Laboratory and
confirm that Central Lab has functional overview of all
laboratory services.
8. The laboratory work environment is organized and clean
at all times, with safety procedures for handling of
specimens and waste material to ensure patient and staff
protection from unnecessary risks at all times.
Inspect inpatient, outpatient and emergency laboratory
areas for cleanliness and tidiness.
9. The laboratory has a health and safety manual with
procedures that include: action in the event of a fire,
action in the event of a major spillage of dangerous
chemicals or clinical material; action in the event of an
inoculation accident; reporting and monitoring of
accidents and incidents; disinfection processes;
decontamination of equipment; chemical handling;
storage and disposal of waste.
View health and safety manual and check that this includes:
action in the event of a fire, action in the event of a major
spillage of dangerous chemicals or clinical material; action
in the event of an inoculation accident; reporting and
monitoring of accidents and incidents; disinfection
processes; decontamination of equipment; chemical
handling; storage and disposal of waste.
10. Laboratory management establishes a policy for the
management of data and information that includes:
security
access (including level of access)
confidentiality and data protection
backup system
storage, archive and retrieval
data destruction
View data management policy. Confirm that this addresses:
security, access, confidentiality and data protection, backup
system, storage, archive and retrieval and data destruction.
11. The laboratory has and implements a quality assurance
policy that covers all aspects of laboratory functions. View quality assurance policy. Confirm this addresses pre
analytical, analytical and post analytical quality assurance.
Request external QA reports. Confirm laboratory takes part
in external QA activities.
Request internal QA reports to confirm that laboratory
conducts internal QA activities.
TOTAL
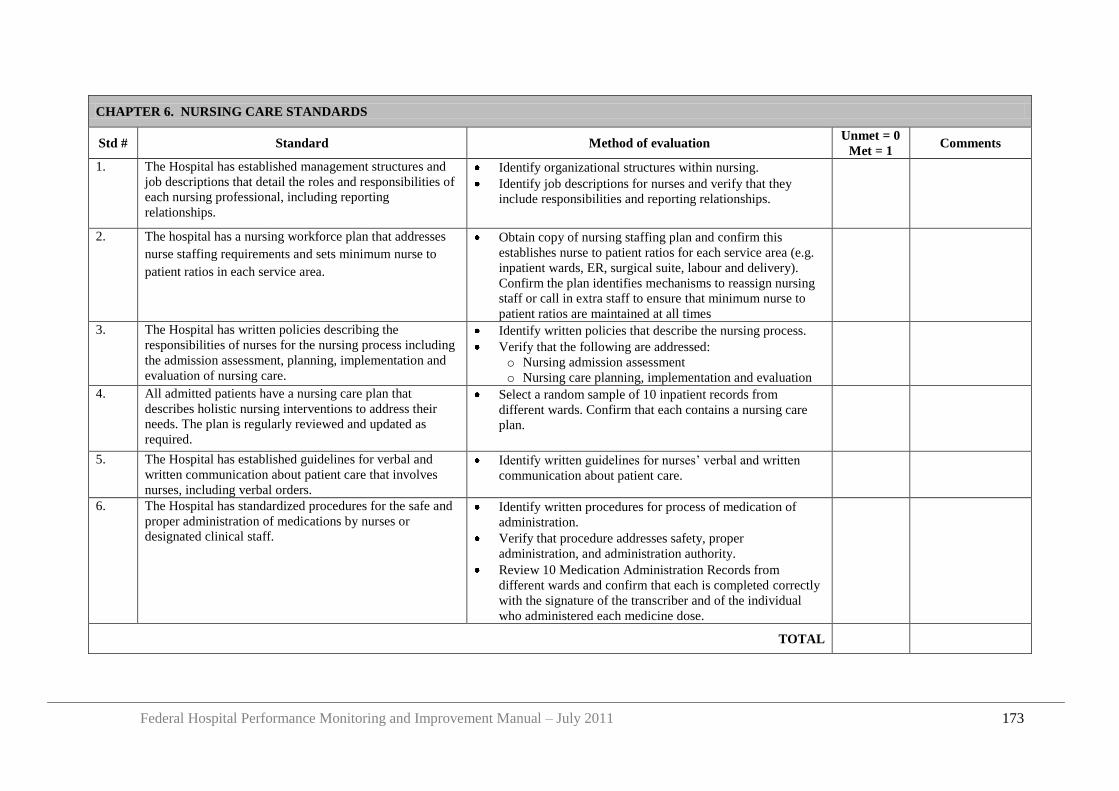
Federal Hospital Performance Monitoring and Improvement Manual – July 2011 173
CHAPTER 6. NURSING CARE STANDARDS
Std # Standard Method of evaluation Unmet = 0
Met = 1 Comments
1. The Hospital has established management structures and
job descriptions that detail the roles and responsibilities of
each nursing professional, including reporting
relationships.
Identify organizational structures within nursing.
Identify job descriptions for nurses and verify that they
include responsibilities and reporting relationships.
2. The hospital has a nursing workforce plan that addresses
nurse staffing requirements and sets minimum nurse to
patient ratios in each service area.
Obtain copy of nursing staffing plan and confirm this
establishes nurse to patient ratios for each service area (e.g.
inpatient wards, ER, surgical suite, labour and delivery).
Confirm the plan identifies mechanisms to reassign nursing
staff or call in extra staff to ensure that minimum nurse to
patient ratios are maintained at all times
3. The Hospital has written policies describing the
responsibilities of nurses for the nursing process including
the admission assessment, planning, implementation and
evaluation of nursing care.
Identify written policies that describe the nursing process.
Verify that the following are addressed:
o Nursing admission assessment
o Nursing care planning, implementation and evaluation
4. All admitted patients have a nursing care plan that
describes holistic nursing interventions to address their
needs. The plan is regularly reviewed and updated as
required.
Select a random sample of 10 inpatient records from
different wards. Confirm that each contains a nursing care
plan.
5. The Hospital has established guidelines for verbal and
written communication about patient care that involves
nurses, including verbal orders.
Identify written guidelines for nurses‟ verbal and written
communication about patient care.
6. The Hospital has standardized procedures for the safe and
proper administration of medications by nurses or
designated clinical staff.
Identify written procedures for process of medication of
administration.
Verify that procedure addresses safety, proper
administration, and administration authority.
Review 10 Medication Administration Records from
different wards and confirm that each is completed correctly
with the signature of the transcriber and of the individual
who administered each medicine dose.
TOTAL
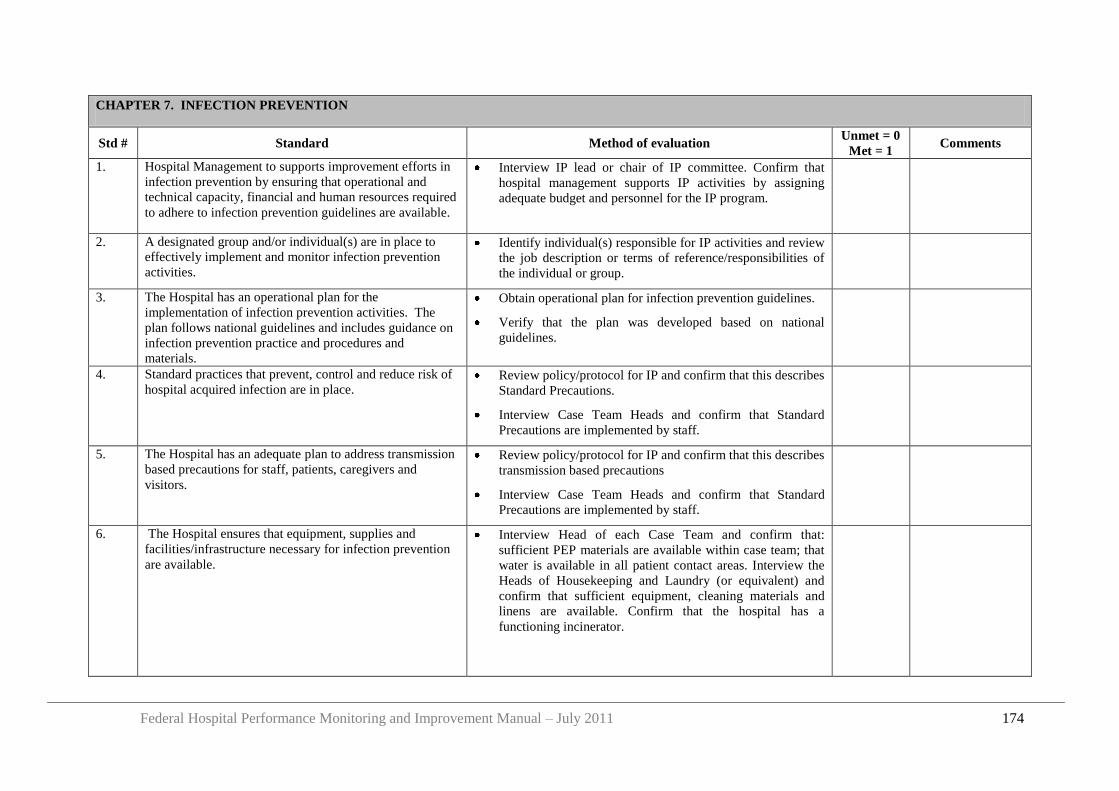
Federal Hospital Performance Monitoring and Improvement Manual – July 2011 174
CHAPTER 7. INFECTION PREVENTION
Std # Standard Method of evaluation Unmet = 0
Met = 1 Comments
1. Hospital Management to supports improvement efforts in
infection prevention by ensuring that operational and
technical capacity, financial and human resources required
to adhere to infection prevention guidelines are available.
Interview IP lead or chair of IP committee. Confirm that
hospital management supports IP activities by assigning
adequate budget and personnel for the IP program.
2. A designated group and/or individual(s) are in place to
effectively implement and monitor infection prevention
activities.
Identify individual(s) responsible for IP activities and review
the job description or terms of reference/responsibilities of
the individual or group.
3. The Hospital has an operational plan for the
implementation of infection prevention activities. The
plan follows national guidelines and includes guidance on
infection prevention practice and procedures and
materials.
Obtain operational plan for infection prevention guidelines.
Verify that the plan was developed based on national
guidelines.
4. Standard practices that prevent, control and reduce risk of
hospital acquired infection are in place. Review policy/protocol for IP and confirm that this describes
Standard Precautions.
Interview Case Team Heads and confirm that Standard
Precautions are implemented by staff.
5. The Hospital has an adequate plan to address transmission
based precautions for staff, patients, caregivers and
visitors.
Review policy/protocol for IP and confirm that this describes
transmission based precautions
Interview Case Team Heads and confirm that Standard
Precautions are implemented by staff.
6. The Hospital ensures that equipment, supplies and
facilities/infrastructure necessary for infection prevention
are available.
Interview Head of each Case Team and confirm that:
sufficient PEP materials are available within case team; that
water is available in all patient contact areas. Interview the
Heads of Housekeeping and Laundry (or equivalent) and
confirm that sufficient equipment, cleaning materials and
linens are available. Confirm that the hospital has a
functioning incinerator.
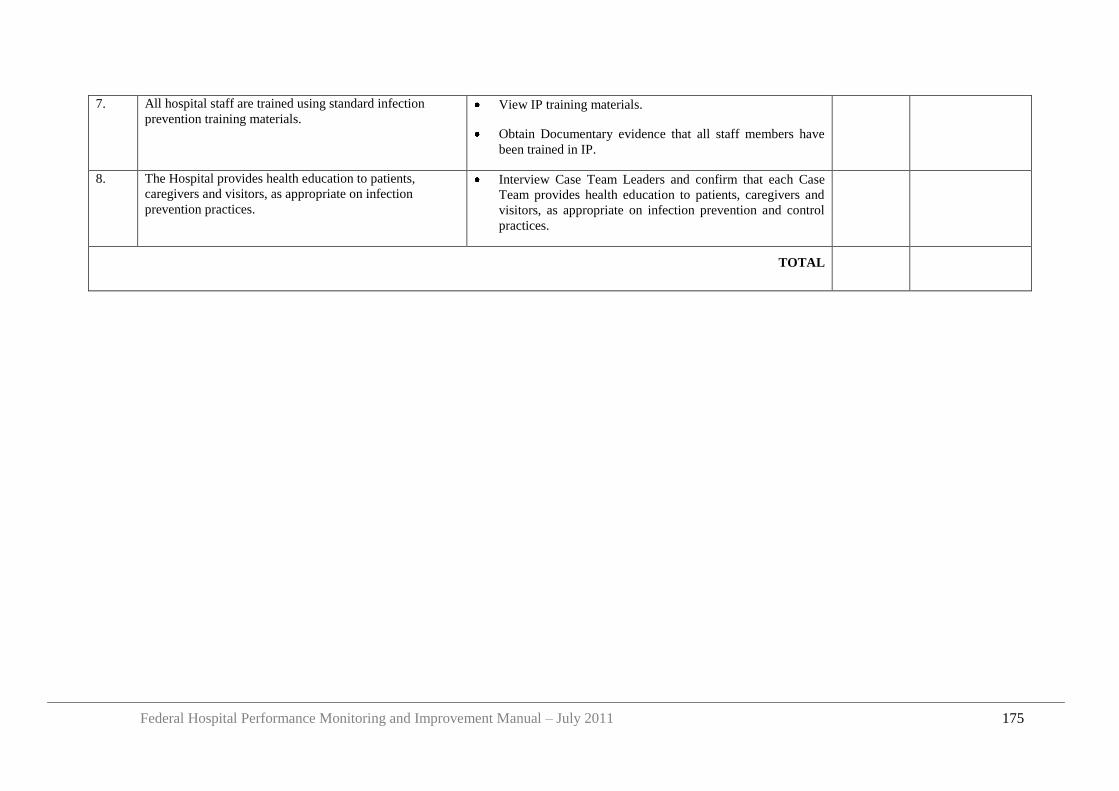
Federal Hospital Performance Monitoring and Improvement Manual – July 2011 175
7. All hospital staff are trained using standard infection
prevention training materials. View IP training materials.
Obtain Documentary evidence that all staff members have
been trained in IP.
8. The Hospital provides health education to patients,
caregivers and visitors, as appropriate on infection
prevention practices.
Interview Case Team Leaders and confirm that each Case
Team provides health education to patients, caregivers and
visitors, as appropriate on infection prevention and control
practices.
TOTAL
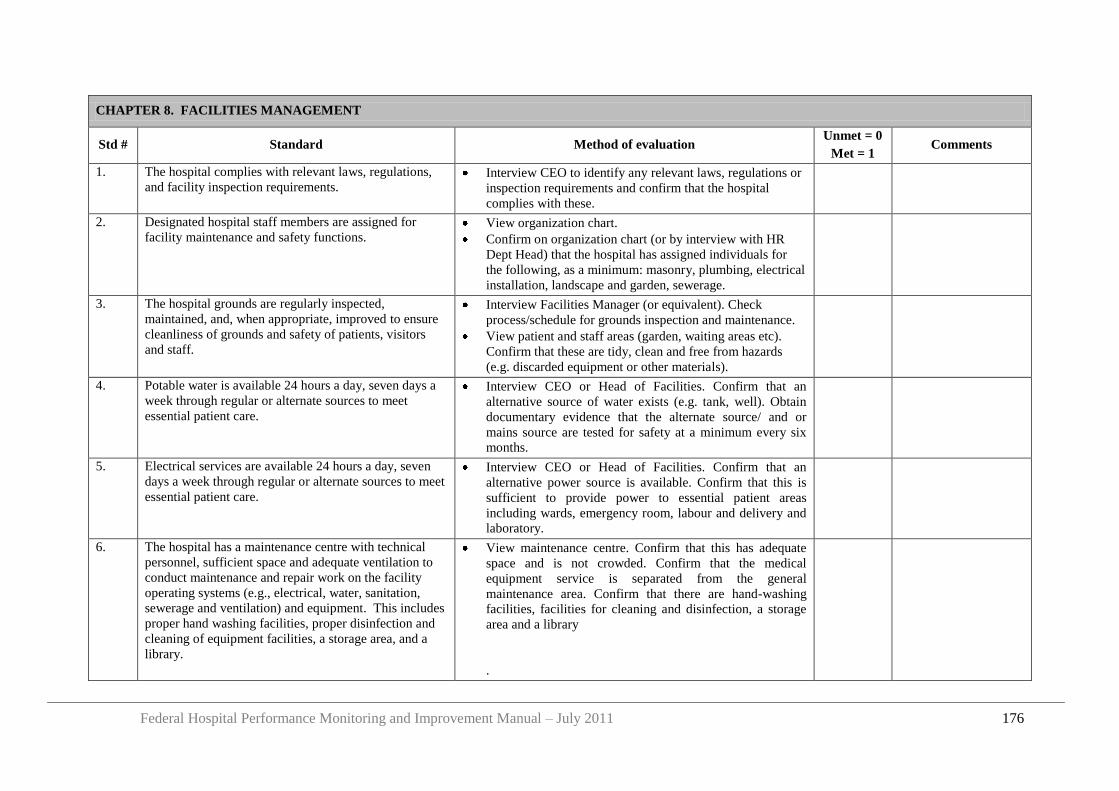
Federal Hospital Performance Monitoring and Improvement Manual – July 2011 176
CHAPTER 8. FACILITIES MANAGEMENT
Std # Standard Method of evaluation Unmet = 0
Met = 1 Comments
1. The hospital complies with relevant laws, regulations,
and facility inspection requirements. Interview CEO to identify any relevant laws, regulations or
inspection requirements and confirm that the hospital
complies with these.
2. Designated hospital staff members are assigned for
facility maintenance and safety functions. View organization chart.
Confirm on organization chart (or by interview with HR
Dept Head) that the hospital has assigned individuals for
the following, as a minimum: masonry, plumbing, electrical
installation, landscape and garden, sewerage.
3. The hospital grounds are regularly inspected,
maintained, and, when appropriate, improved to ensure
cleanliness of grounds and safety of patients, visitors
and staff.
Interview Facilities Manager (or equivalent). Check
process/schedule for grounds inspection and maintenance.
View patient and staff areas (garden, waiting areas etc).
Confirm that these are tidy, clean and free from hazards
(e.g. discarded equipment or other materials).
4. Potable water is available 24 hours a day, seven days a
week through regular or alternate sources to meet
essential patient care.
Interview CEO or Head of Facilities. Confirm that an
alternative source of water exists (e.g. tank, well). Obtain
documentary evidence that the alternate source/ and or
mains source are tested for safety at a minimum every six
months.
5. Electrical services are available 24 hours a day, seven
days a week through regular or alternate sources to meet
essential patient care.
Interview CEO or Head of Facilities. Confirm that an
alternative power source is available. Confirm that this is
sufficient to provide power to essential patient areas
including wards, emergency room, labour and delivery and
laboratory.
6. The hospital has a maintenance centre with technical
personnel, sufficient space and adequate ventilation to
conduct maintenance and repair work on the facility
operating systems (e.g., electrical, water, sanitation,
sewerage and ventilation) and equipment. This includes
proper hand washing facilities, proper disinfection and
cleaning of equipment facilities, a storage area, and a
library.
View maintenance centre. Confirm that this has adequate
space and is not crowded. Confirm that the medical
equipment service is separated from the general
maintenance area. Confirm that there are hand-washing
facilities, facilities for cleaning and disinfection, a storage
area and a library
.
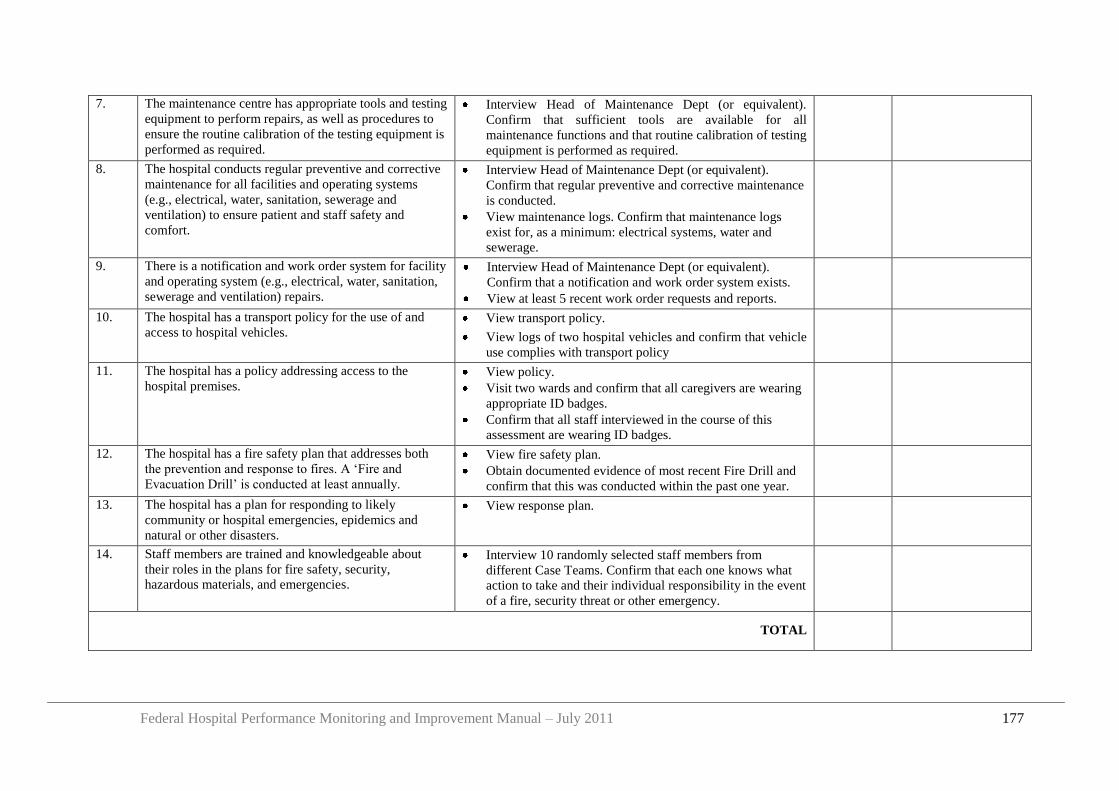
Federal Hospital Performance Monitoring and Improvement Manual – July 2011 177
7. The maintenance centre has appropriate tools and testing
equipment to perform repairs, as well as procedures to
ensure the routine calibration of the testing equipment is
performed as required.
Interview Head of Maintenance Dept (or equivalent).
Confirm that sufficient tools are available for all
maintenance functions and that routine calibration of testing
equipment is performed as required.
8. The hospital conducts regular preventive and corrective
maintenance for all facilities and operating systems
(e.g., electrical, water, sanitation, sewerage and
ventilation) to ensure patient and staff safety and
comfort.
Interview Head of Maintenance Dept (or equivalent).
Confirm that regular preventive and corrective maintenance
is conducted.
View maintenance logs. Confirm that maintenance logs
exist for, as a minimum: electrical systems, water and
sewerage.
9. There is a notification and work order system for facility
and operating system (e.g., electrical, water, sanitation,
sewerage and ventilation) repairs.
Interview Head of Maintenance Dept (or equivalent).
Confirm that a notification and work order system exists.
View at least 5 recent work order requests and reports.
10. The hospital has a transport policy for the use of and
access to hospital vehicles. View transport policy.
View logs of two hospital vehicles and confirm that vehicle
use complies with transport policy
11. The hospital has a policy addressing access to the
hospital premises. View policy.
Visit two wards and confirm that all caregivers are wearing
appropriate ID badges.
Confirm that all staff interviewed in the course of this
assessment are wearing ID badges.
12. The hospital has a fire safety plan that addresses both
the prevention and response to fires. A „Fire and
Evacuation Drill‟ is conducted at least annually.
View fire safety plan.
Obtain documented evidence of most recent Fire Drill and
confirm that this was conducted within the past one year.
13. The hospital has a plan for responding to likely
community or hospital emergencies, epidemics and
natural or other disasters.
View response plan.
14. Staff members are trained and knowledgeable about
their roles in the plans for fire safety, security,
hazardous materials, and emergencies.
Interview 10 randomly selected staff members from
different Case Teams. Confirm that each one knows what
action to take and their individual responsibility in the event
of a fire, security threat or other emergency.
TOTAL
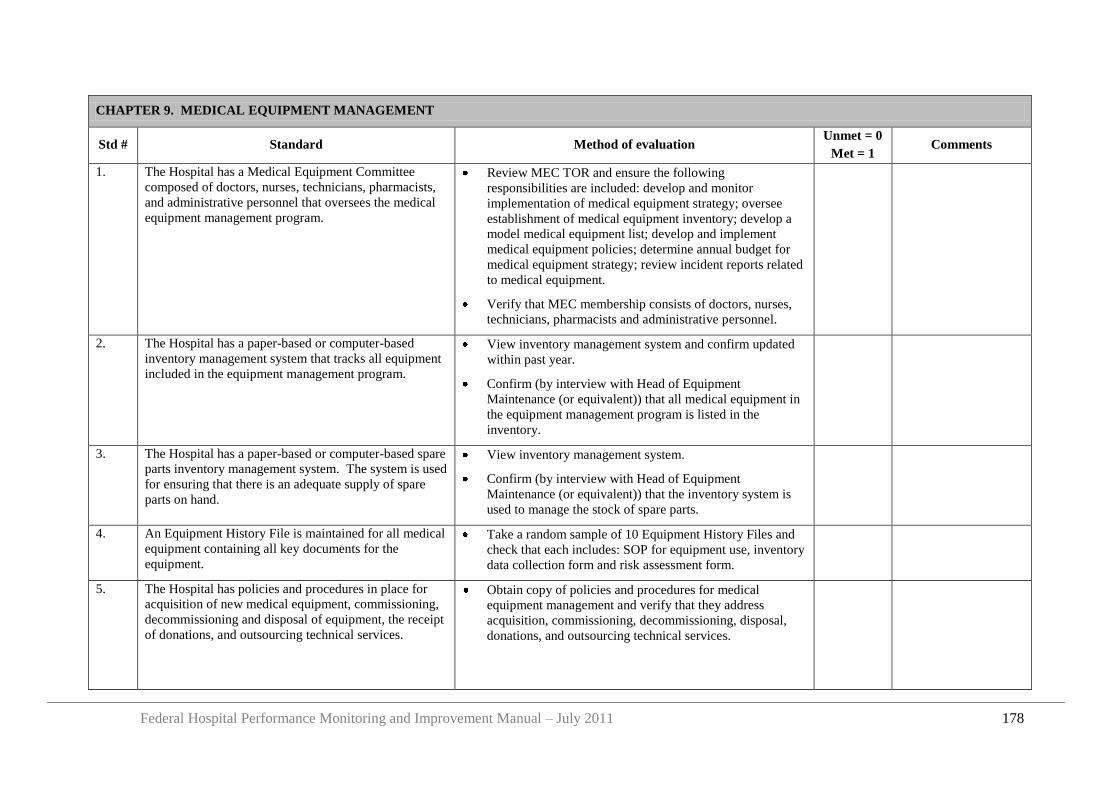
Federal Hospital Performance Monitoring and Improvement Manual – July 2011 178
CHAPTER 9. MEDICAL EQUIPMENT MANAGEMENT
Std # Standard Method of evaluation Unmet = 0
Met = 1 Comments
1. The Hospital has a Medical Equipment Committee
composed of doctors, nurses, technicians, pharmacists,
and administrative personnel that oversees the medical
equipment management program.
Review MEC TOR and ensure the following
responsibilities are included: develop and monitor
implementation of medical equipment strategy; oversee
establishment of medical equipment inventory; develop a
model medical equipment list; develop and implement
medical equipment policies; determine annual budget for
medical equipment strategy; review incident reports related
to medical equipment.
Verify that MEC membership consists of doctors, nurses,
technicians, pharmacists and administrative personnel.
2. The Hospital has a paper-based or computer-based
inventory management system that tracks all equipment
included in the equipment management program.
View inventory management system and confirm updated
within past year.
Confirm (by interview with Head of Equipment
Maintenance (or equivalent)) that all medical equipment in
the equipment management program is listed in the
inventory.
3. The Hospital has a paper-based or computer-based spare
parts inventory management system. The system is used
for ensuring that there is an adequate supply of spare
parts on hand.
View inventory management system.
Confirm (by interview with Head of Equipment
Maintenance (or equivalent)) that the inventory system is
used to manage the stock of spare parts.
4. An Equipment History File is maintained for all medical
equipment containing all key documents for the
equipment.
Take a random sample of 10 Equipment History Files and
check that each includes: SOP for equipment use, inventory
data collection form and risk assessment form.
5. The Hospital has policies and procedures in place for
acquisition of new medical equipment, commissioning,
decommissioning and disposal of equipment, the receipt
of donations, and outsourcing technical services.
Obtain copy of policies and procedures for medical
equipment management and verify that they address
acquisition, commissioning, decommissioning, disposal,
donations, and outsourcing technical services.
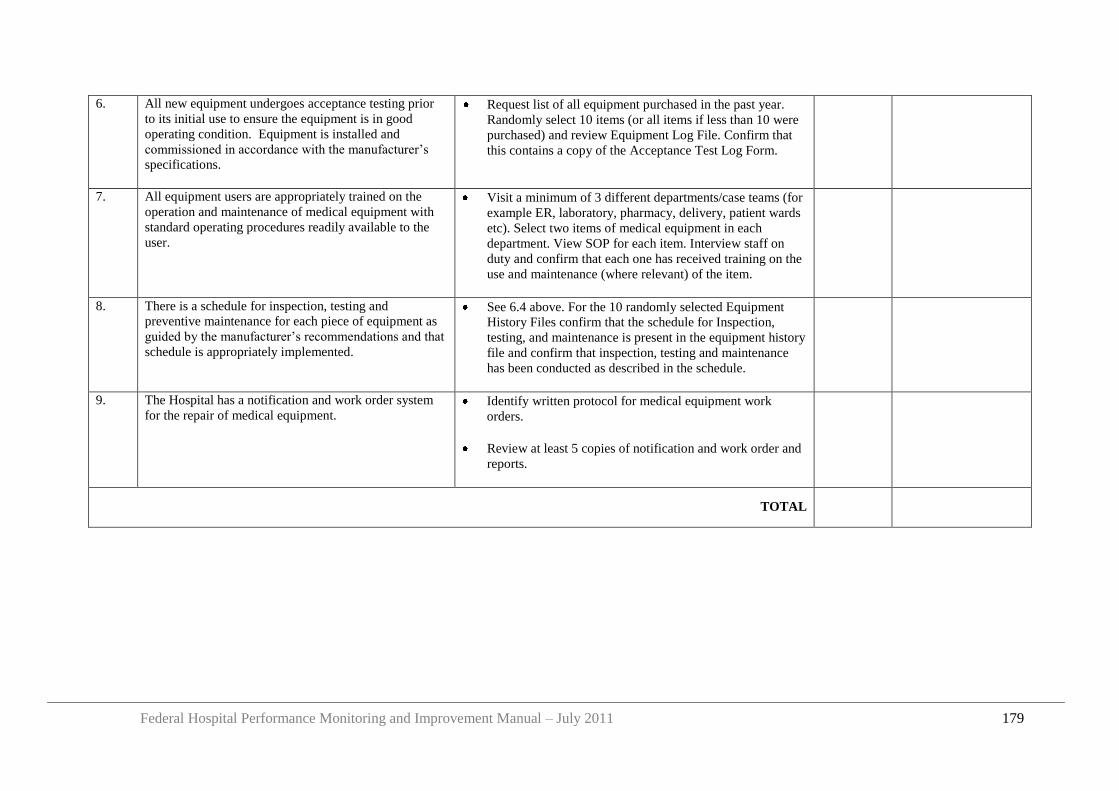
Federal Hospital Performance Monitoring and Improvement Manual – July 2011 179
6. All new equipment undergoes acceptance testing prior
to its initial use to ensure the equipment is in good
operating condition. Equipment is installed and
commissioned in accordance with the manufacturer‟s
specifications.
Request list of all equipment purchased in the past year.
Randomly select 10 items (or all items if less than 10 were
purchased) and review Equipment Log File. Confirm that
this contains a copy of the Acceptance Test Log Form.
7. All equipment users are appropriately trained on the
operation and maintenance of medical equipment with
standard operating procedures readily available to the
user.
Visit a minimum of 3 different departments/case teams (for
example ER, laboratory, pharmacy, delivery, patient wards
etc). Select two items of medical equipment in each
department. View SOP for each item. Interview staff on
duty and confirm that each one has received training on the
use and maintenance (where relevant) of the item.
8. There is a schedule for inspection, testing and
preventive maintenance for each piece of equipment as
guided by the manufacturer‟s recommendations and that
schedule is appropriately implemented.
See 6.4 above. For the 10 randomly selected Equipment
History Files confirm that the schedule for Inspection,
testing, and maintenance is present in the equipment history
file and confirm that inspection, testing and maintenance
has been conducted as described in the schedule.
9. The Hospital has a notification and work order system
for the repair of medical equipment. Identify written protocol for medical equipment work
orders.
Review at least 5 copies of notification and work order and
reports.
TOTAL
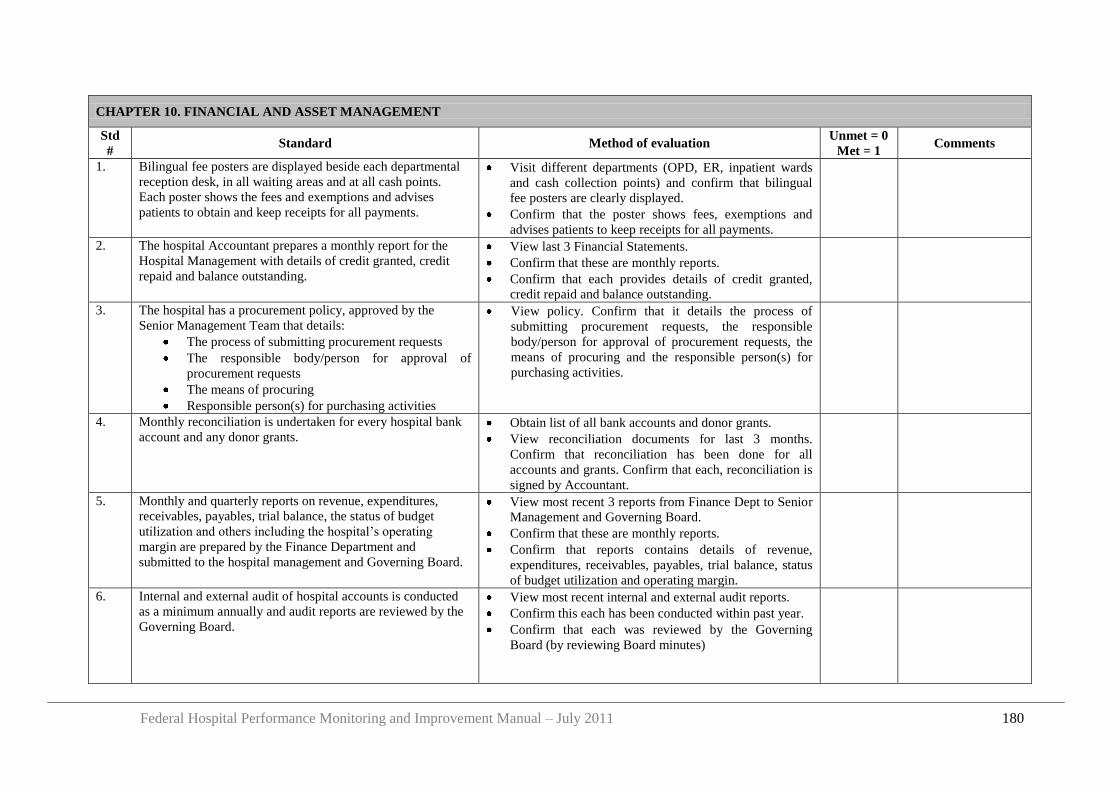
Federal Hospital Performance Monitoring and Improvement Manual – July 2011 180
CHAPTER 10. FINANCIAL AND ASSET MANAGEMENT
Std
# Standard Method of evaluation
Unmet = 0
Met = 1 Comments
1. Bilingual fee posters are displayed beside each departmental
reception desk, in all waiting areas and at all cash points.
Each poster shows the fees and exemptions and advises
patients to obtain and keep receipts for all payments.
Visit different departments (OPD, ER, inpatient wards
and cash collection points) and confirm that bilingual
fee posters are clearly displayed.
Confirm that the poster shows fees, exemptions and
advises patients to keep receipts for all payments.
2. The hospital Accountant prepares a monthly report for the
Hospital Management with details of credit granted, credit
repaid and balance outstanding.
View last 3 Financial Statements.
Confirm that these are monthly reports.
Confirm that each provides details of credit granted,
credit repaid and balance outstanding.
3. The hospital has a procurement policy, approved by the
Senior Management Team that details:
The process of submitting procurement requests
The responsible body/person for approval of
procurement requests
The means of procuring
Responsible person(s) for purchasing activities
View policy. Confirm that it details the process of
submitting procurement requests, the responsible
body/person for approval of procurement requests, the
means of procuring and the responsible person(s) for
purchasing activities.
4. Monthly reconciliation is undertaken for every hospital bank
account and any donor grants. Obtain list of all bank accounts and donor grants.
View reconciliation documents for last 3 months.
Confirm that reconciliation has been done for all
accounts and grants. Confirm that each, reconciliation is
signed by Accountant.
5. Monthly and quarterly reports on revenue, expenditures,
receivables, payables, trial balance, the status of budget
utilization and others including the hospital‟s operating
margin are prepared by the Finance Department and
submitted to the hospital management and Governing Board.
View most recent 3 reports from Finance Dept to Senior
Management and Governing Board.
Confirm that these are monthly reports.
Confirm that reports contains details of revenue,
expenditures, receivables, payables, trial balance, status
of budget utilization and operating margin.
6. Internal and external audit of hospital accounts is conducted
as a minimum annually and audit reports are reviewed by the
Governing Board.
View most recent internal and external audit reports.
Confirm this each has been conducted within past year.
Confirm that each was reviewed by the Governing
Board (by reviewing Board minutes)
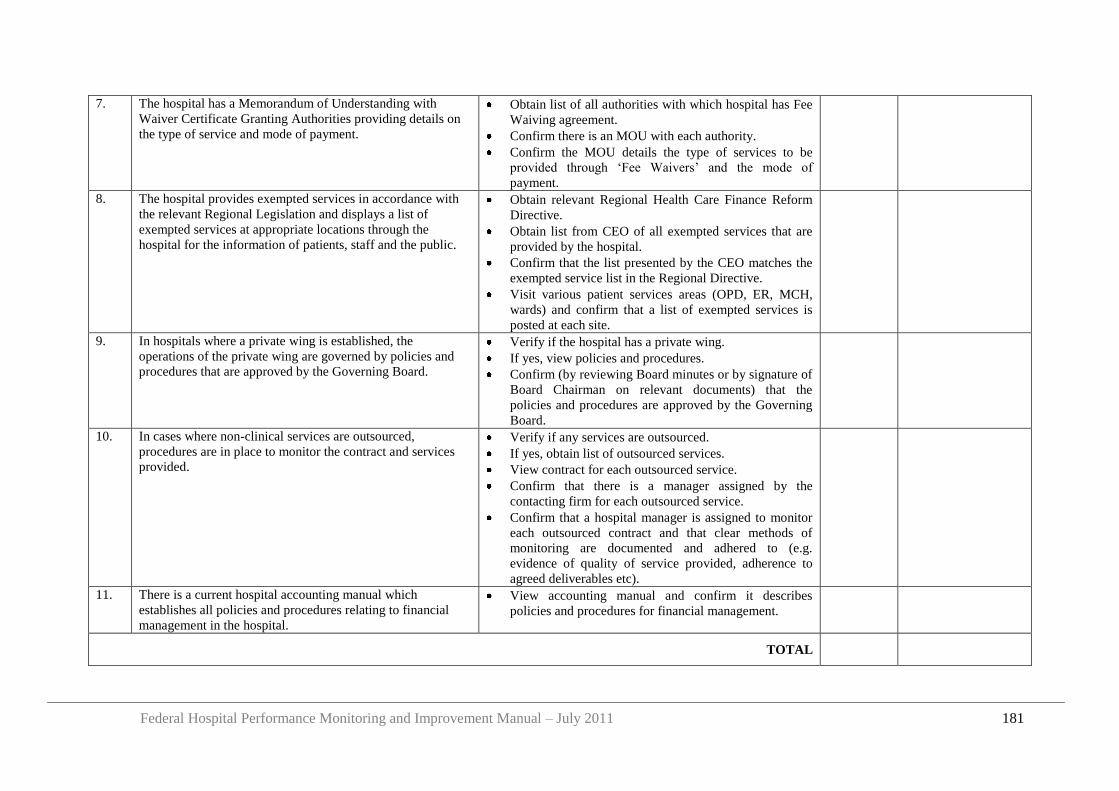
Federal Hospital Performance Monitoring and Improvement Manual – July 2011 181
7. The hospital has a Memorandum of Understanding with
Waiver Certificate Granting Authorities providing details on
the type of service and mode of payment.
Obtain list of all authorities with which hospital has Fee
Waiving agreement.
Confirm there is an MOU with each authority.
Confirm the MOU details the type of services to be
provided through „Fee Waivers‟ and the mode of
payment.
8. The hospital provides exempted services in accordance with
the relevant Regional Legislation and displays a list of
exempted services at appropriate locations through the
hospital for the information of patients, staff and the public.
Obtain relevant Regional Health Care Finance Reform
Directive.
Obtain list from CEO of all exempted services that are
provided by the hospital.
Confirm that the list presented by the CEO matches the
exempted service list in the Regional Directive.
Visit various patient services areas (OPD, ER, MCH,
wards) and confirm that a list of exempted services is
posted at each site.
9. In hospitals where a private wing is established, the
operations of the private wing are governed by policies and
procedures that are approved by the Governing Board.
Verify if the hospital has a private wing.
If yes, view policies and procedures.
Confirm (by reviewing Board minutes or by signature of
Board Chairman on relevant documents) that the
policies and procedures are approved by the Governing
Board.
10. In cases where non-clinical services are outsourced,
procedures are in place to monitor the contract and services
provided.
Verify if any services are outsourced.
If yes, obtain list of outsourced services.
View contract for each outsourced service.
Confirm that there is a manager assigned by the
contacting firm for each outsourced service.
Confirm that a hospital manager is assigned to monitor
each outsourced contract and that clear methods of
monitoring are documented and adhered to (e.g.
evidence of quality of service provided, adherence to
agreed deliverables etc).
11. There is a current hospital accounting manual which
establishes all policies and procedures relating to financial
management in the hospital.
View accounting manual and confirm it describes
policies and procedures for financial management.
TOTAL
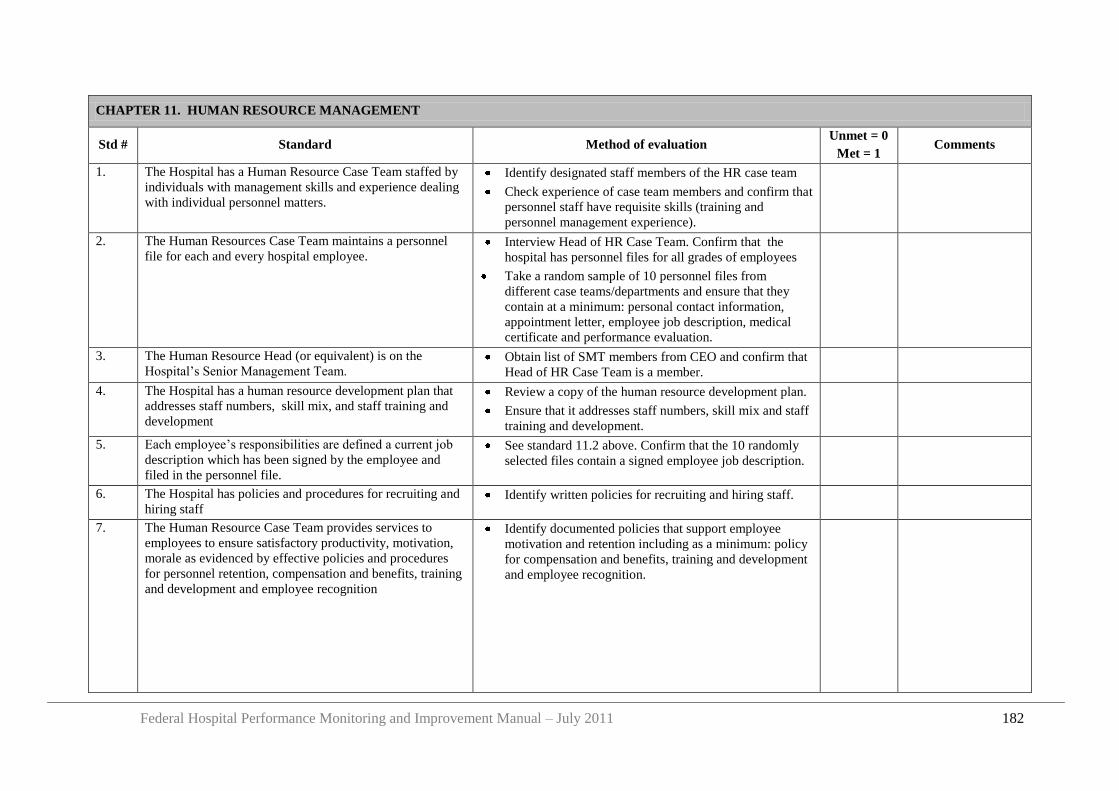
Federal Hospital Performance Monitoring and Improvement Manual – July 2011 182
CHAPTER 11. HUMAN RESOURCE MANAGEMENT
Std # Standard Method of evaluation Unmet = 0
Met = 1 Comments
1. The Hospital has a Human Resource Case Team staffed by
individuals with management skills and experience dealing
with individual personnel matters.
Identify designated staff members of the HR case team
Check experience of case team members and confirm that
personnel staff have requisite skills (training and
personnel management experience).
2. The Human Resources Case Team maintains a personnel
file for each and every hospital employee. Interview Head of HR Case Team. Confirm that the
hospital has personnel files for all grades of employees
Take a random sample of 10 personnel files from
different case teams/departments and ensure that they
contain at a minimum: personal contact information,
appointment letter, employee job description, medical
certificate and performance evaluation.
3. The Human Resource Head (or equivalent) is on the
Hospital‟s Senior Management Team. Obtain list of SMT members from CEO and confirm that
Head of HR Case Team is a member.
4. The Hospital has a human resource development plan that
addresses staff numbers, skill mix, and staff training and
development
Review a copy of the human resource development plan.
Ensure that it addresses staff numbers, skill mix and staff
training and development.
5. Each employee‟s responsibilities are defined a current job
description which has been signed by the employee and
filed in the personnel file.
See standard 11.2 above. Confirm that the 10 randomly
selected files contain a signed employee job description.
6. The Hospital has policies and procedures for recruiting and
hiring staff Identify written policies for recruiting and hiring staff.
7. The Human Resource Case Team provides services to
employees to ensure satisfactory productivity, motivation,
morale as evidenced by effective policies and procedures
for personnel retention, compensation and benefits, training
and development and employee recognition
Identify documented policies that support employee
motivation and retention including as a minimum: policy
for compensation and benefits, training and development
and employee recognition.
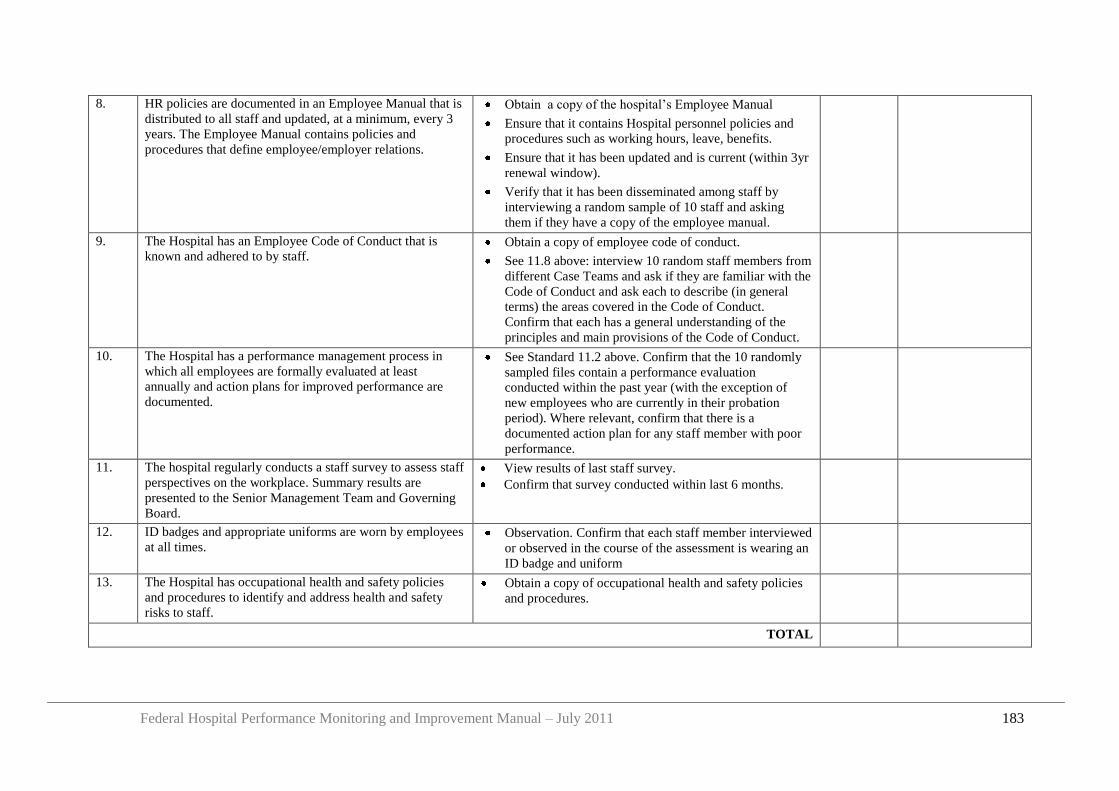
Federal Hospital Performance Monitoring and Improvement Manual – July 2011 183
8. HR policies are documented in an Employee Manual that is
distributed to all staff and updated, at a minimum, every 3
years. The Employee Manual contains policies and
procedures that define employee/employer relations.
Obtain a copy of the hospital‟s Employee Manual
Ensure that it contains Hospital personnel policies and
procedures such as working hours, leave, benefits.
Ensure that it has been updated and is current (within 3yr
renewal window).
Verify that it has been disseminated among staff by
interviewing a random sample of 10 staff and asking
them if they have a copy of the employee manual.
9. The Hospital has an Employee Code of Conduct that is
known and adhered to by staff. Obtain a copy of employee code of conduct.
See 11.8 above: interview 10 random staff members from
different Case Teams and ask if they are familiar with the
Code of Conduct and ask each to describe (in general
terms) the areas covered in the Code of Conduct.
Confirm that each has a general understanding of the
principles and main provisions of the Code of Conduct.
10. The Hospital has a performance management process in
which all employees are formally evaluated at least
annually and action plans for improved performance are
documented.
See Standard 11.2 above. Confirm that the 10 randomly
sampled files contain a performance evaluation
conducted within the past year (with the exception of
new employees who are currently in their probation
period). Where relevant, confirm that there is a
documented action plan for any staff member with poor
performance.
11. The hospital regularly conducts a staff survey to assess staff
perspectives on the workplace. Summary results are
presented to the Senior Management Team and Governing
Board.
View results of last staff survey.
Confirm that survey conducted within last 6 months.
12. ID badges and appropriate uniforms are worn by employees
at all times. Observation. Confirm that each staff member interviewed
or observed in the course of the assessment is wearing an
ID badge and uniform
13. The Hospital has occupational health and safety policies
and procedures to identify and address health and safety
risks to staff.
Obtain a copy of occupational health and safety policies
and procedures.
TOTAL
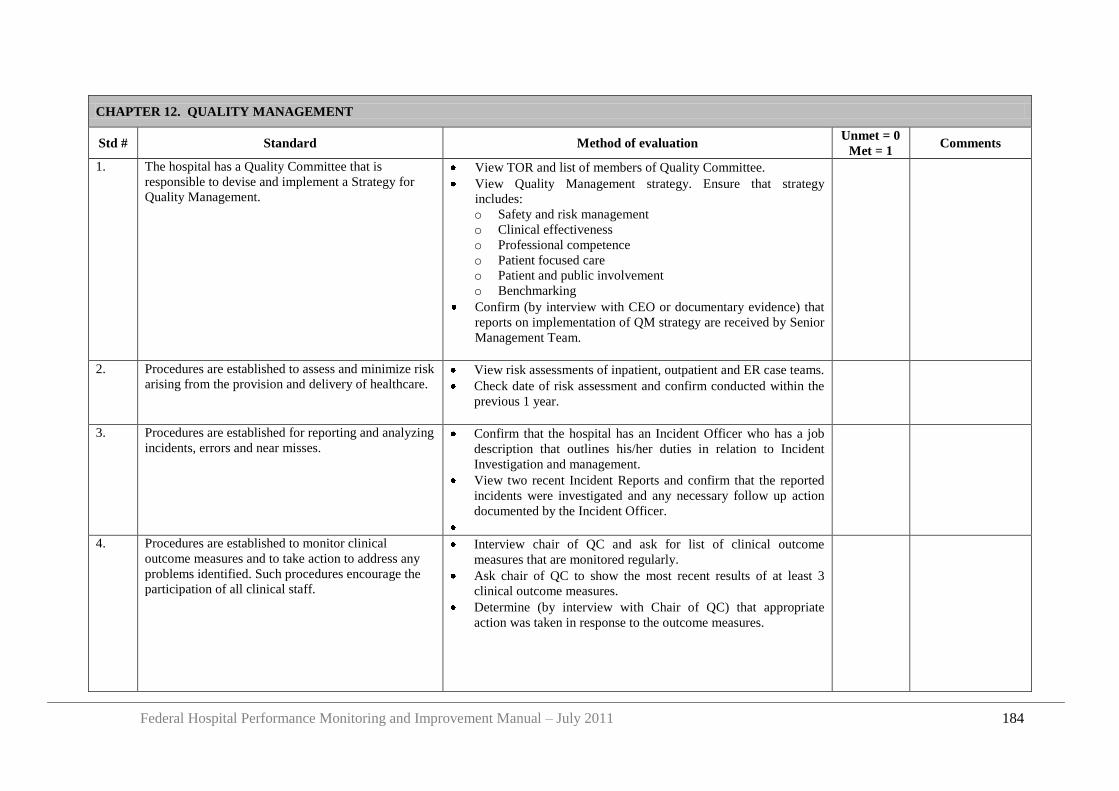
Federal Hospital Performance Monitoring and Improvement Manual – July 2011 184
CHAPTER 12. QUALITY MANAGEMENT
Std # Standard Method of evaluation Unmet = 0
Met = 1 Comments
1. The hospital has a Quality Committee that is
responsible to devise and implement a Strategy for
Quality Management.
View TOR and list of members of Quality Committee.
View Quality Management strategy. Ensure that strategy
includes:
o Safety and risk management
o Clinical effectiveness
o Professional competence
o Patient focused care
o Patient and public involvement
o Benchmarking
Confirm (by interview with CEO or documentary evidence) that
reports on implementation of QM strategy are received by Senior
Management Team.
2. Procedures are established to assess and minimize risk
arising from the provision and delivery of healthcare.
View risk assessments of inpatient, outpatient and ER case teams.
Check date of risk assessment and confirm conducted within the
previous 1 year.
3. Procedures are established for reporting and analyzing
incidents, errors and near misses. Confirm that the hospital has an Incident Officer who has a job
description that outlines his/her duties in relation to Incident
Investigation and management.
View two recent Incident Reports and confirm that the reported
incidents were investigated and any necessary follow up action
documented by the Incident Officer.
4. Procedures are established to monitor clinical
outcome measures and to take action to address any
problems identified. Such procedures encourage the
participation of all clinical staff.
Interview chair of QC and ask for list of clinical outcome
measures that are monitored regularly.
Ask chair of QC to show the most recent results of at least 3
clinical outcome measures.
Determine (by interview with Chair of QC) that appropriate
action was taken in response to the outcome measures.
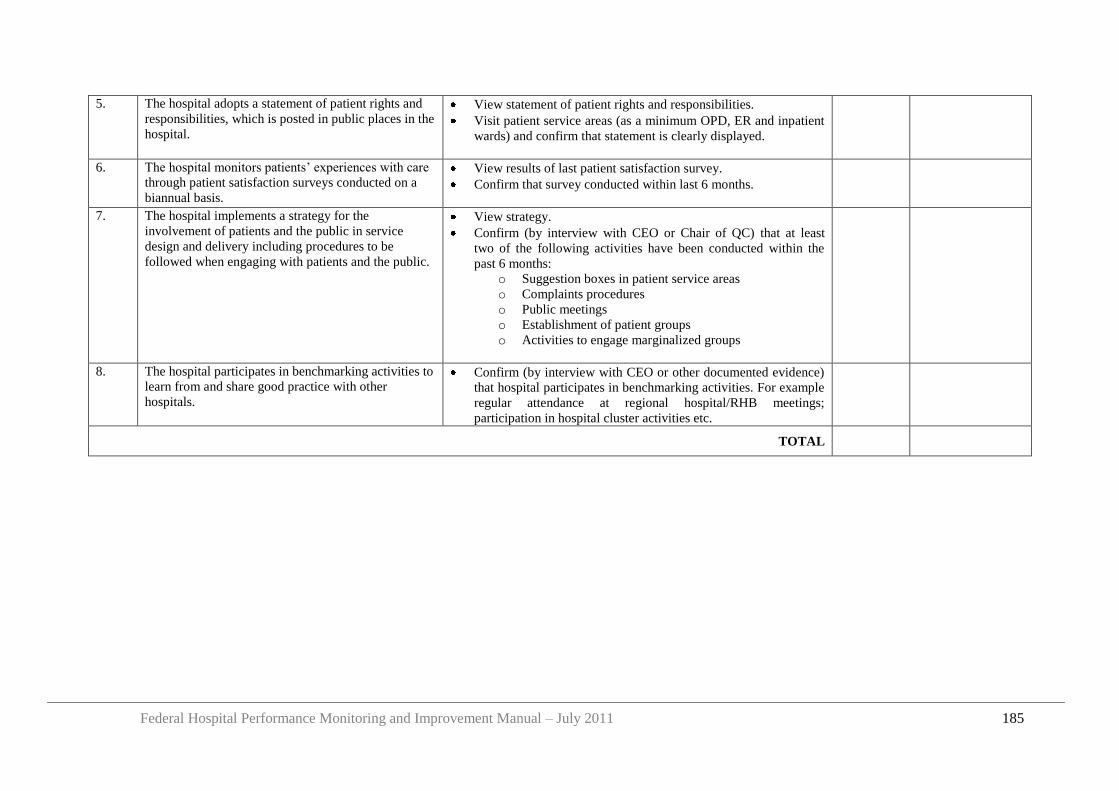
Federal Hospital Performance Monitoring and Improvement Manual – July 2011 185
5. The hospital adopts a statement of patient rights and
responsibilities, which is posted in public places in the
hospital.
View statement of patient rights and responsibilities.
Visit patient service areas (as a minimum OPD, ER and inpatient
wards) and confirm that statement is clearly displayed.
6. The hospital monitors patients‟ experiences with care
through patient satisfaction surveys conducted on a
biannual basis.
View results of last patient satisfaction survey.
Confirm that survey conducted within last 6 months.
7. The hospital implements a strategy for the
involvement of patients and the public in service
design and delivery including procedures to be
followed when engaging with patients and the public.
View strategy.
Confirm (by interview with CEO or Chair of QC) that at least
two of the following activities have been conducted within the
past 6 months:
o Suggestion boxes in patient service areas
o Complaints procedures
o Public meetings
o Establishment of patient groups
o Activities to engage marginalized groups
8. The hospital participates in benchmarking activities to
learn from and share good practice with other
hospitals.
Confirm (by interview with CEO or other documented evidence)
that hospital participates in benchmarking activities. For example
regular attendance at regional hospital/RHB meetings;
participation in hospital cluster activities etc.
TOTAL
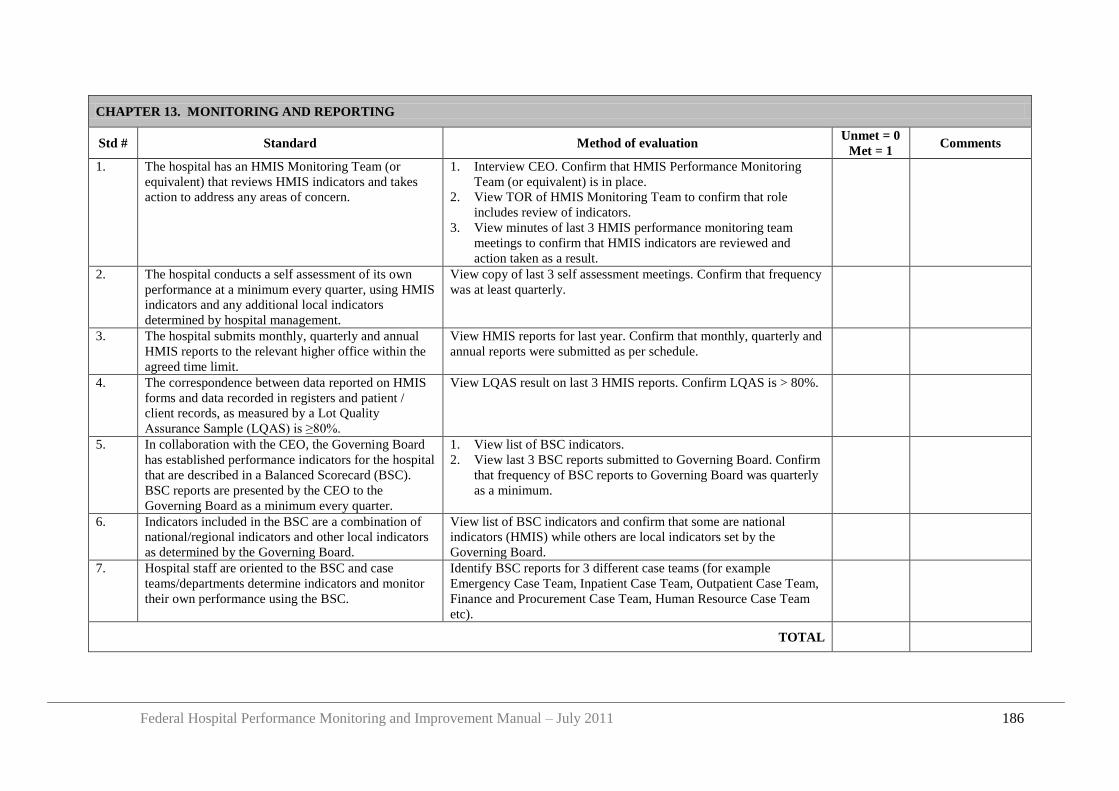
Federal Hospital Performance Monitoring and Improvement Manual – July 2011 186
CHAPTER 13. MONITORING AND REPORTING
Std # Standard Method of evaluation Unmet = 0
Met = 1 Comments
1. The hospital has an HMIS Monitoring Team (or
equivalent) that reviews HMIS indicators and takes
action to address any areas of concern.
1. Interview CEO. Confirm that HMIS Performance Monitoring
Team (or equivalent) is in place.
2. View TOR of HMIS Monitoring Team to confirm that role
includes review of indicators.
3. View minutes of last 3 HMIS performance monitoring team
meetings to confirm that HMIS indicators are reviewed and
action taken as a result.
2. The hospital conducts a self assessment of its own
performance at a minimum every quarter, using HMIS
indicators and any additional local indicators
determined by hospital management.
View copy of last 3 self assessment meetings. Confirm that frequency
was at least quarterly.
3. The hospital submits monthly, quarterly and annual
HMIS reports to the relevant higher office within the
agreed time limit.
View HMIS reports for last year. Confirm that monthly, quarterly and
annual reports were submitted as per schedule.
4. The correspondence between data reported on HMIS
forms and data recorded in registers and patient /
client records, as measured by a Lot Quality
Assurance Sample (LQAS) is ≥80%.
View LQAS result on last 3 HMIS reports. Confirm LQAS is > 80%.
5. In collaboration with the CEO, the Governing Board
has established performance indicators for the hospital
that are described in a Balanced Scorecard (BSC).
BSC reports are presented by the CEO to the
Governing Board as a minimum every quarter.
1. View list of BSC indicators.
2. View last 3 BSC reports submitted to Governing Board. Confirm
that frequency of BSC reports to Governing Board was quarterly
as a minimum.
6. Indicators included in the BSC are a combination of
national/regional indicators and other local indicators
as determined by the Governing Board.
View list of BSC indicators and confirm that some are national
indicators (HMIS) while others are local indicators set by the
Governing Board.
7. Hospital staff are oriented to the BSC and case
teams/departments determine indicators and monitor
their own performance using the BSC.
Identify BSC reports for 3 different case teams (for example
Emergency Case Team, Inpatient Case Team, Outpatient Case Team,
Finance and Procurement Case Team, Human Resource Case Team
etc).
TOTAL
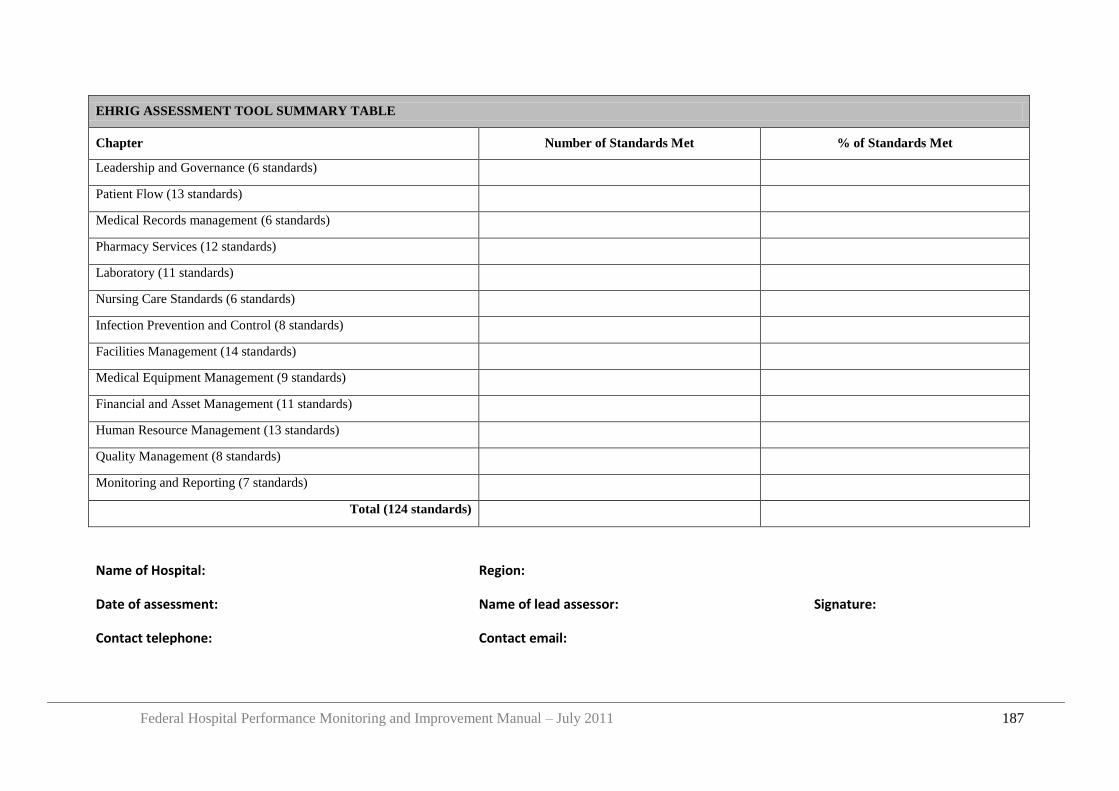
Federal Hospital Performance Monitoring and Improvement Manual – July 2011 187
EHRIG ASSESSMENT TOOL SUMMARY TABLE
Chapter Number of Standards Met % of Standards Met
Leadership and Governance (6 standards)
Patient Flow (13 standards)
Medical Records management (6 standards)
Pharmacy Services (12 standards)
Laboratory (11 standards)
Nursing Care Standards (6 standards)
Infection Prevention and Control (8 standards)
Facilities Management (14 standards)
Medical Equipment Management (9 standards)
Financial and Asset Management (11 standards)
Human Resource Management (13 standards)
Quality Management (8 standards)
Monitoring and Reporting (7 standards)
Total (124 standards)
Name of Hospital: Region:
Date of assessment: Name of lead assessor: Signature:
Contact telephone: Contact email:

Federal Hospital Performance Monitoring and Improvement Manual – July 2011 188
Federal Hospital Performance Monitoring and Improvement Manual – July 2011 189
Appendix 7 Survey Protocol: Outpatient Waiting Time to Treatment
Purpose of survey:
The average OPD wait time is one of the Key Performance Indicators that should be reported
by hospitals to their Governing Board and to the RHB has a measure of hospital performance.
Period of survey:
The survey should be conducted on Monday and Thursday of the first week of the last month
of each quarter.
Role of KPI Owner:
The hospital should assign an „owner‟ for the KPI „Outpatient Waiting Time to Treatment”.
He/she is responsible to oversee the survey, to select and train surveyors, to issue „Waiting
Time Cards‟ to each surveyor, to receive completed „Waiting Time Cards‟ from the surveyors
at the end of the survey period, and to calculate the average wait time at the end of the survey
period.
Additionally, at the start of each survey period the KPI Owner should inform all OPD staff
that the survey is taking place and should instruct OPD Case Teams to complete the relevant
section on the „Waiting Time Card‟ for every patient seen and ensure that all Waiting Time
Cards are returned to the surveyor at the end of the survey day.
Selection and role of surveyors:
The KPI Owner should assign individuals to act as surveyors. The number of surveyors
required will depend on the patient load. However, there should be sufficient surveyors to
ensure that the waiting time of each and every outpatient is measured during the study period.
As an approximation, the number of surveyors required will be approximately the same as the
number of individuals conducting patient registration.
Ideally, the surveyors should be individuals who DO NOT WORK regularly in the outpatient
department in order to avoid bias. Surveyors could be volunteers from the community,
students or hospital staff assigned from other departments. If necessary, the hospital should
provide payment to surveyors according to the number of hours worked.
The surveyors should follow the methodology outlined below to conduct the survey and
should submit all completed „Waiting Time Cards‟ to the KPI Owner at the end of the survey
period.
Role of OPD Case Teams:
A member of each clinical case team should receive the Waiting Time Card from each and
every patient seen during the survey period. He/she should record on the Card the time at
which the clinical consultation begins, and the name of the case team. Instructions should be
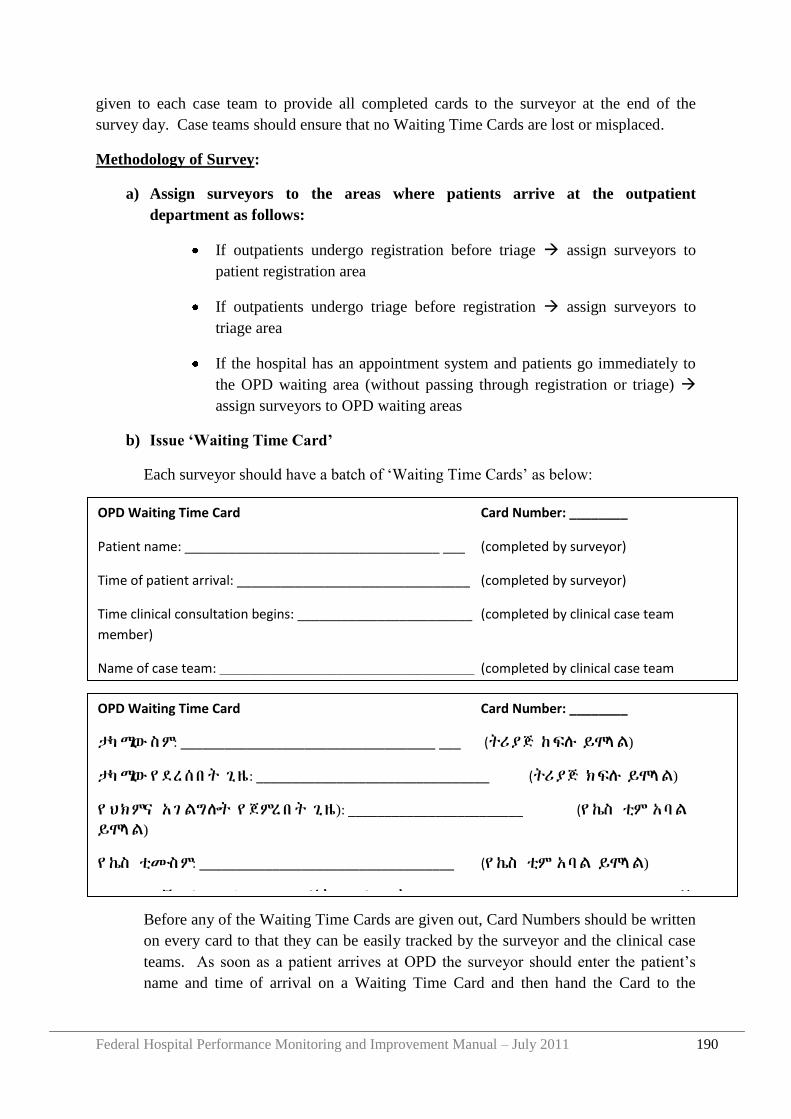
Federal Hospital Performance Monitoring and Improvement Manual – July 2011 190
given to each case team to provide all completed cards to the surveyor at the end of the
survey day. Case teams should ensure that no Waiting Time Cards are lost or misplaced.
Methodology of Survey:
a) Assign surveyors to the areas where patients arrive at the outpatient
department as follows:
If outpatients undergo registration before triage assign surveyors to
patient registration area
If outpatients undergo triage before registration assign surveyors to
triage area
If the hospital has an appointment system and patients go immediately to
the OPD waiting area (without passing through registration or triage)
assign surveyors to OPD waiting areas
b) Issue „Waiting Time Card‟
Each surveyor should have a batch of „Waiting Time Cards‟ as below:
Before any of the Waiting Time Cards are given out, Card Numbers should be written
on every card to that they can be easily tracked by the surveyor and the clinical case
teams. As soon as a patient arrives at OPD the surveyor should enter the patient‟s
name and time of arrival on a Waiting Time Card and then hand the Card to the
OPD Waiting Time Card Card Number: ________
Patient name: ___________________________________ ___ (completed by surveyor)
Time of patient arrival: ________________________________ (completed by surveyor)
Time clinical consultation begins: ________________________ (completed by clinical case team
member)
Name of case team: ___________________________________ (completed by clinical case team
member)
Wait time (in minutes): _________________(completed by surveyor after collecting card from case team) OPD Waiting Time Card Card Number: ________
ታካሚው ስም: ___________________________________ ___ (ትሪያጅ ከፍሉ ይሞላል)
ታካሚው የ ደረሰበ ት ጊዜ: ________________________________ (ትሪያጅ ክፍሉ ይሞላል)
የ ህክምና አገ ልግሎት የ ጀምረበት ጊዜ): ________________________ (የ ኬስ ቲም አባል
ይሞላል)
የ ኬስ ቲሙ ስም: ___________________________________ (የ ኬስ ቲም አባል ይሞላል)
(የ ተመላ ላ ሽ ተካሚ ህክምና ለማግኘት የ ወሰደበ ት ጊዜ (በ ደቂቃ): __________________ (የመረጃ
ክፍል ይሞላል)
Federal Hospital Performance Monitoring and Improvement Manual – July 2011 191
patient. The surveyor should instruct the patient to give the card to a member of the
clinical case team.
The Surveyor should keep track of the number of cards issued and the number of
cards completed. To do this he/she should keep a tally of the number of Waiting Time
Cards issued and follow up any that are missing at the end of the day.
c) Clinical Case Teams receive „Waiting Time Card‟
On arrival in the consultation room, the patient should hand over the Waiting Time
Card to a member of the case team. If the patient does not automatically hand this
over then a member of the team should request the Card from the patient.
The case team member should record on the Card the time at which the consultation
begins. The case team should keep all Cards received from patients.
d) Surveyor collects completed „Waiting Time Cards‟.
At the end of the day (or close of clinic) the surveyor(s) should collect all Cards from
each and every Case Team and should compare this with the list of Cards issued. If
any cards are missing the surveyor(s) should follow up with the relevant Case Team
and determine whether the patient was seen that day.
e) Every effort should be made to ensure that no Cards are missing or lost because this
could lead to an inaccurate survey result.Surveyor calculates waiting time for each
patient
After receiving the Waiting Time Cards from each clinical case team, the surveyor
should calculate the wait time for that patient (in minutes) and should enter it onto the
Card.
f) KPI Owner calculates average waiting time (KPI 4)
At the end of the survey period the KPI owner should collect all Waiting Time Cards
from each surveyor.
The KPI Owner should tally the total wait times and divide by the total number of
completed Cards in order to calculate the average wait time during the survey period.
In cases where the patient was seen on the same day but the Waiting Time Cards were
lost or incomplete, the Waiting Time Cards should be excluded from the survey
count.
g) KPI Owner reports to KPI focal person
After calculating Outpatient Waiting Time the KPI owner should report all data
elements and KPI result to the KPI focal person. The KPI focal person will then
check the calculations and enter them into the KPI report form.

Federal Hospital Performance Monitoring and Improvement Manual – July 2011 192
h) Optional, supplementary data analysis
If the average wait time is very long (especially if some patients are not seen on the
same day) then the surveyor may also want to record the range (shortest and longest)
of wait times.
Similarly, the waiting time for each clinical case team could be analyzed separately to
see if there are any differences between clinical teams. This information could help to
assess the efficiency of each case team and/or to determine the need for additional
clinical staff in particular case teams and/or the need for patient numbers assigned to a
specific case team to be decreased or increased.
Federal Hospital Performance Monitoring and Improvement Manual – July 2011 193
Appendix 8 Survey Protocol: Emergency Patients Triaged Within 5 Minutes of Arrival
Purpose of survey:
Through BPR, the Ministry of Health has set a stretch objective that „any patient with the
need for emergency treatment should be provided with the service within 5 minutes of arrival
at the hospital”.
The proportion of emergency patients who undergo triage within 5 minutes is one of the Key
Performance Indicators that should be reported by hospitals to their Governing Board and to
the RHB has a measure of hospital performance.
Period of survey:
The survey should be conducted during the following time periods during the final week of
the reporting period:
Monday: 8am to 12 noon
Wednesday: 12 noon to 5pm
Saturday: 6pm to 8am
Role of KPI Owner:
The hospital should assign an „owner‟ for the KPI „% of patients triaged within 5 minutes of
arrival in ER”. He/she is responsible to oversee the survey, to select and train surveyors, and
to calculate the proportion seen within 5 minutes at the end of the survey period.
Additionally, at the start of each survey period the KPI Owner should inform all ER staff that
the survey is taking place.
Selection and role of surveyors:
The KPI Owner should assign individuals to act as surveyors. The number of surveyors
required will depend on the patient load. However, there should be sufficient surveyors to
ensure that the waiting time of each and every emergency patient is measured during the
study period.
Ideally, the surveyors should be individuals who DO NOT WORK regularly in the
emergency department in order to avoid bias. Surveyors could be clinical or non clinical staff
from other hospital departments. If necessary, the hospital should provide payment to
surveyors according to the number of hours worked.
The surveyors should follow the methodology outlined below to conduct the survey and
should submit all completed „Triage Data Forms‟ to KPI Owner at the end of the survey
period.
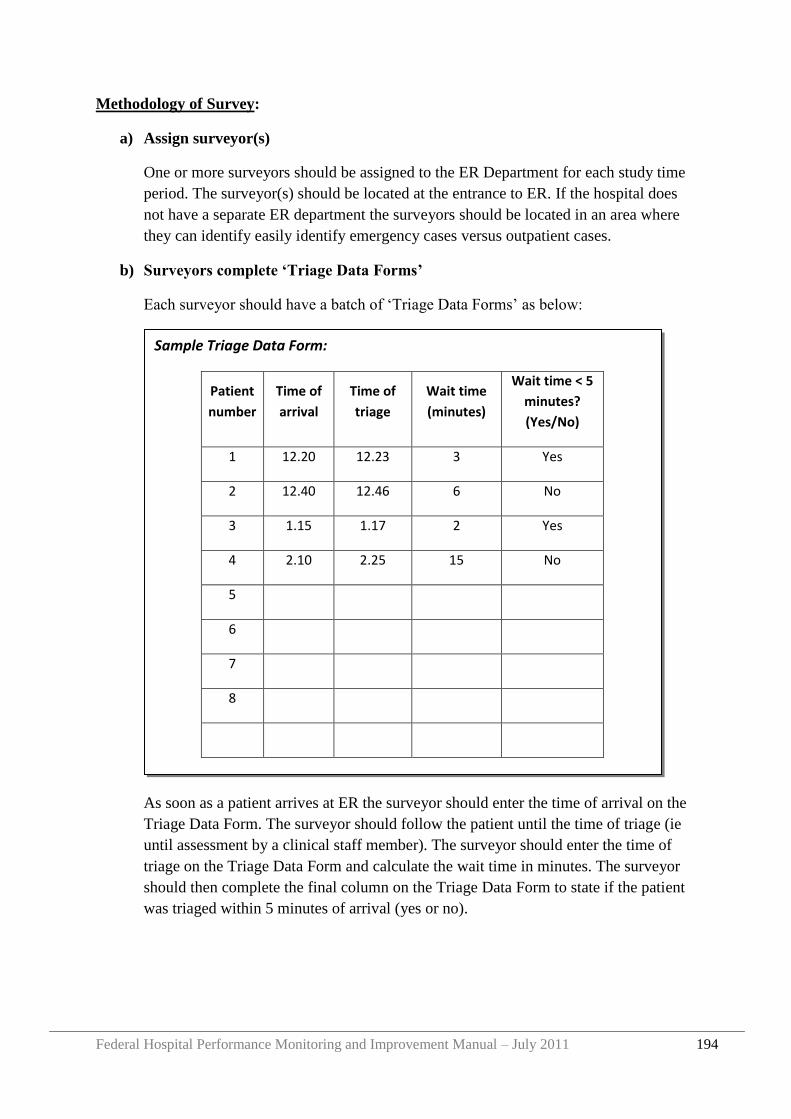
Federal Hospital Performance Monitoring and Improvement Manual – July 2011 194
Methodology of Survey:
a) Assign surveyor(s)
One or more surveyors should be assigned to the ER Department for each study time
period. The surveyor(s) should be located at the entrance to ER. If the hospital does
not have a separate ER department the surveyors should be located in an area where
they can identify easily identify emergency cases versus outpatient cases.
b) Surveyors complete „Triage Data Forms‟
Each surveyor should have a batch of „Triage Data Forms‟ as below:
As soon as a patient arrives at ER the surveyor should enter the time of arrival on the
Triage Data Form. The surveyor should follow the patient until the time of triage (ie
until assessment by a clinical staff member). The surveyor should enter the time of
triage on the Triage Data Form and calculate the wait time in minutes. The surveyor
should then complete the final column on the Triage Data Form to state if the patient
was triaged within 5 minutes of arrival (yes or no).
Sample Triage Data Form:
Patient
number
Time of
arrival
Time of
triage
Wait time
(minutes)
Wait time < 5
minutes?
(Yes/No)
1 12.20 12.23 3 Yes
2 12.40 12.46 6 No
3 1.15 1.17 2 Yes
4 2.10 2.25 15 No
5
6
7
8
Name of Surveyor: _______________________
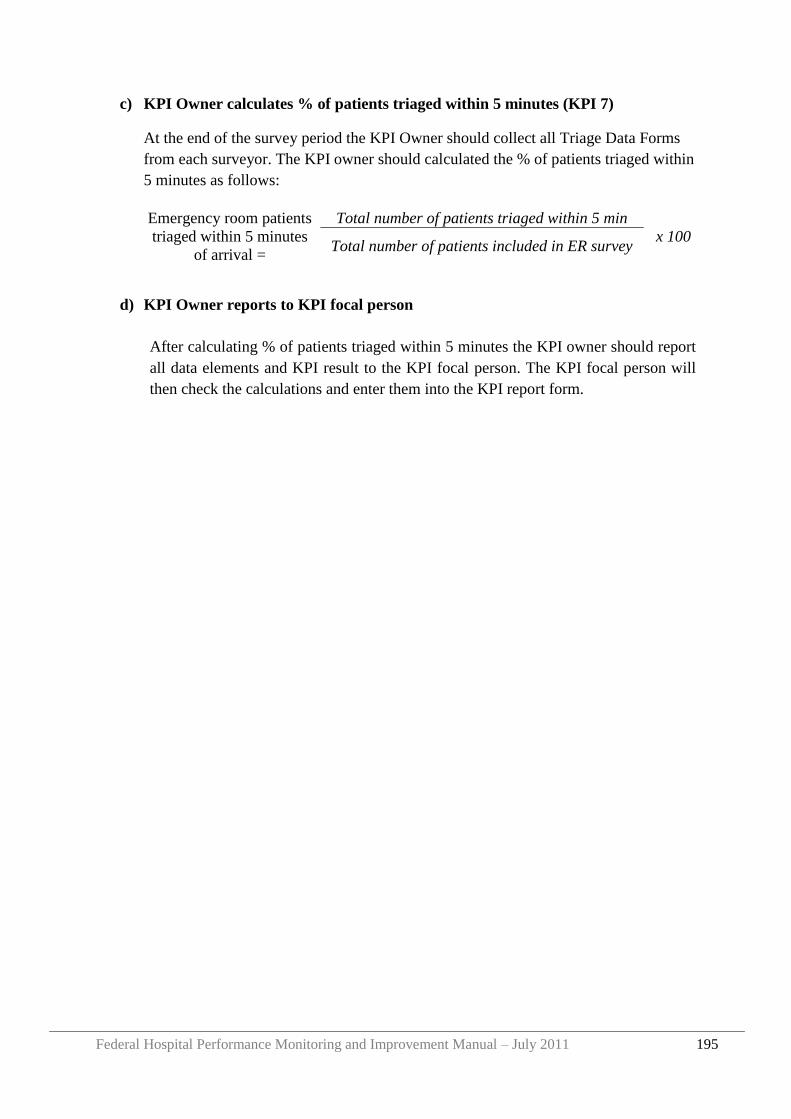
Federal Hospital Performance Monitoring and Improvement Manual – July 2011 195
c) KPI Owner calculates % of patients triaged within 5 minutes (KPI 7)
At the end of the survey period the KPI Owner should collect all Triage Data Forms
from each surveyor. The KPI owner should calculated the % of patients triaged within
5 minutes as follows:
d) KPI Owner reports to KPI focal person
After calculating % of patients triaged within 5 minutes the KPI owner should report
all data elements and KPI result to the KPI focal person. The KPI focal person will
then check the calculations and enter them into the KPI report form.
Emergency room patients
triaged within 5 minutes
of arrival =
Total number of patients triaged within 5 min
x 100 Total number of patients included in ER survey

Federal Hospital Performance Monitoring and Improvement Manual – July 2011 196
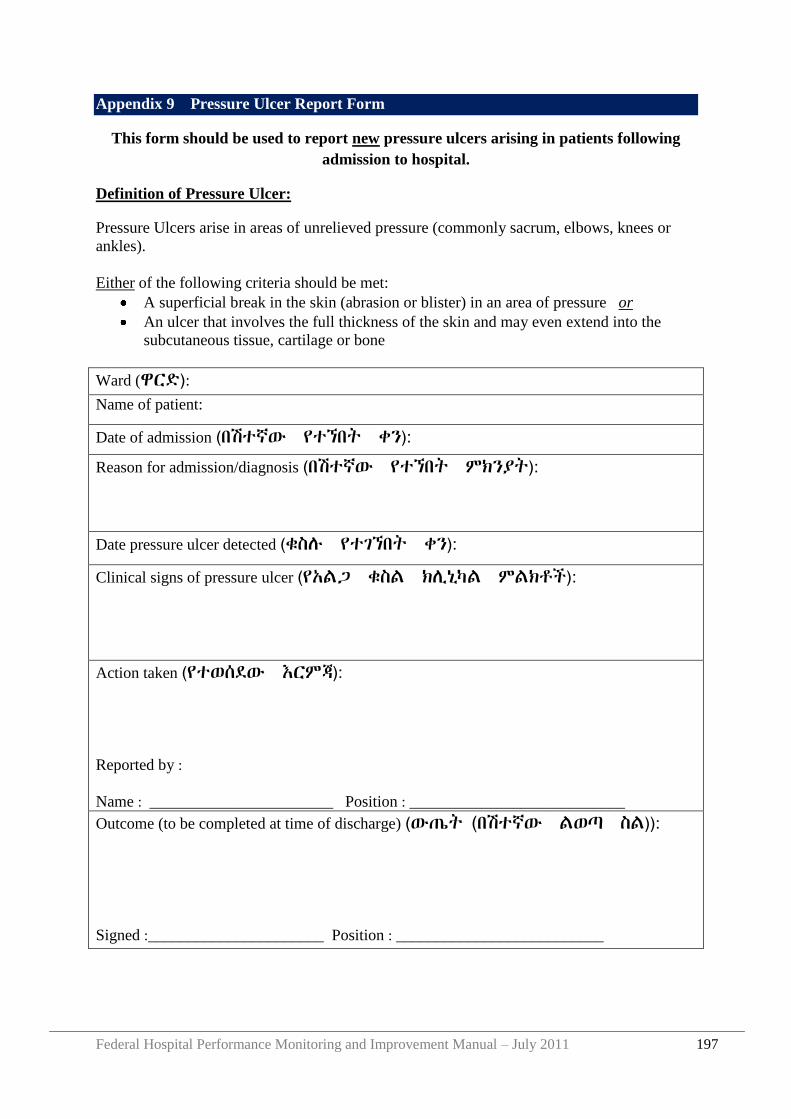
Federal Hospital Performance Monitoring and Improvement Manual – July 2011 197
Appendix 9 Pressure Ulcer Report Form
This form should be used to report new pressure ulcers arising in patients following
admission to hospital.
Definition of Pressure Ulcer:
Pressure Ulcers arise in areas of unrelieved pressure (commonly sacrum, elbows, knees or
ankles).
Either of the following criteria should be met:
A superficial break in the skin (abrasion or blister) in an area of pressure or
An ulcer that involves the full thickness of the skin and may even extend into the
subcutaneous tissue, cartilage or bone
Ward (ዋርዴ): Name of patient:
Date of admission (በሽተኛው የተኘበት ቀን):
Reason for admission/diagnosis (በሽተኛው የተኘበት ምክንያት):
Date pressure ulcer detected (ቁስለ የተገኘበት ቀን):
Clinical signs of pressure ulcer (የአሌጋ ቁስሌ ክሉኒካሌ ምሌክቶች):
Action taken (የተወሰዯው እርምጃ):
Reported by :
Name : _______________________ Position : ___________________________
Outcome (to be completed at time of discharge) (ውጤት (በሽተኛው ሌወጣ ስሌ)):
Signed :______________________ Position : __________________________

Federal Hospital Performance Monitoring and Improvement Manual – July 2011 198
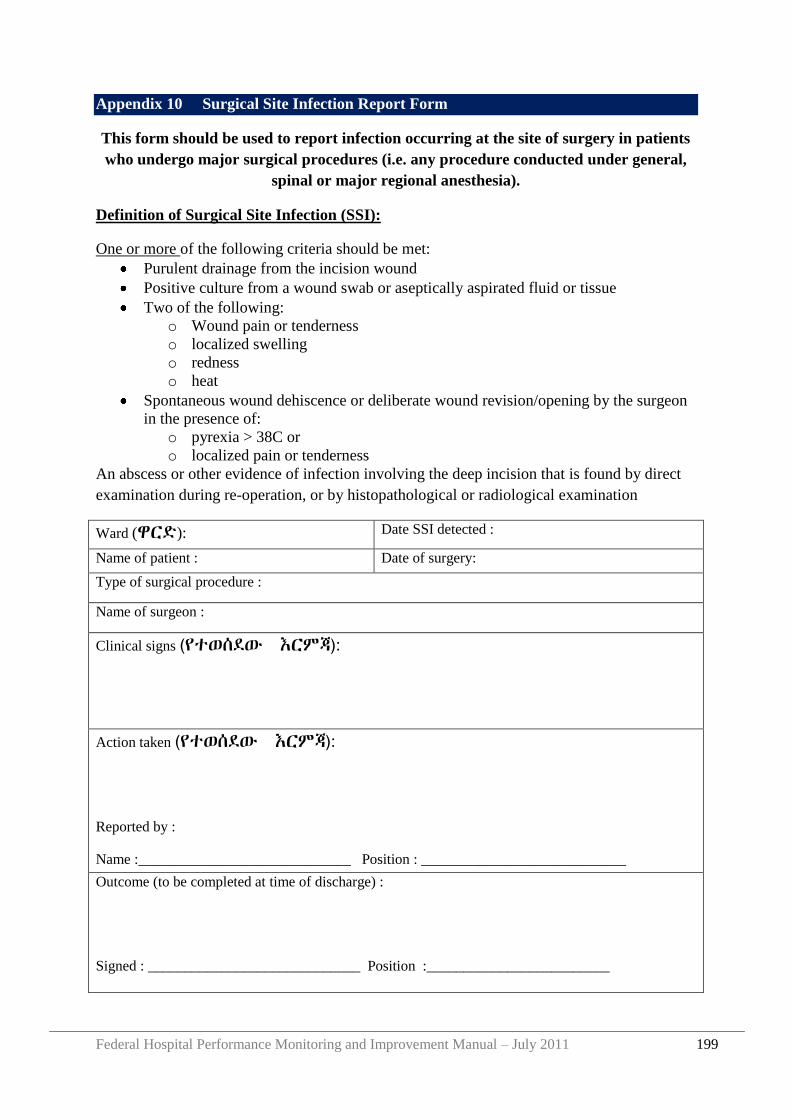
Federal Hospital Performance Monitoring and Improvement Manual – July 2011 199
Appendix 10 Surgical Site Infection Report Form
This form should be used to report infection occurring at the site of surgery in patients
who undergo major surgical procedures (i.e. any procedure conducted under general,
spinal or major regional anesthesia).
Definition of Surgical Site Infection (SSI):
One or more of the following criteria should be met:
Purulent drainage from the incision wound
Positive culture from a wound swab or aseptically aspirated fluid or tissue
Two of the following:
o Wound pain or tenderness
o localized swelling
o redness
o heat
Spontaneous wound dehiscence or deliberate wound revision/opening by the surgeon
in the presence of:
o pyrexia > 38C or
o localized pain or tenderness
An abscess or other evidence of infection involving the deep incision that is found by direct
examination during re-operation, or by histopathological or radiological examination
Ward (ዋርዴ): Date SSI detected :
Name of patient : Date of surgery:
Type of surgical procedure :
Name of surgeon :
Clinical signs (የተወሰዯው እርምጃ):
Action taken (የተወሰዯው እርምጃ):
Reported by :
Name :_____________________________ Position : ____________________________
Outcome (to be completed at time of discharge) :
Signed : _____________________________ Position :_________________________

Federal Hospital Performance Monitoring and Improvement Manual – July 2011 200
Federal Hospital Performance Monitoring and Improvement Manual – July 2011 201
Appendix 11 Audit Protocol: Completeness of Inpatient Medical Records
Purpose of Audit:
The „% of medical records complete‟ is one of the Key Performance Indicators that the
hospital should report every quarter to the Governing Board and Regional Health Bureau.
Frequency of Audit:
The audit should be conducted quarterly.
Role of KPI Owner:
The hospital should assign an „owner‟ for this KPI. He/she is responsible to oversee the
Medical Record Audit, to select and train Medical Record staff who will conduct the audit,
and to liaise with the Medical Records Department to select and obtain the Medical Records
which are included in the audit.
Selection and Role of Medical Record Reviewers:
The Medical Record Reviewers should be members of the Medical Records Department.
Each should review the assigned Medical Records following the checklist below and submit
their completed Forms to the KPI Owner.
Methodology of Survey:
a) Select and obtain the medical records
Identify and list all patients who were discharged from an inpatient ward during the
reporting period. This information can be obtained from the Medical Records
Database or Admission/Discharge Registers.
The sample size of medical records to be surveyed should be 50 or 5% (which ever
number is higher) of the discharged patients. After identifying your sample size
randomly select patients from the discharged list. Obtain the Medical Records of these
patients from the Medical Records Department. If any Medical Record is missing,
another patient /Medical Record should be selected as a replacement.
b) Complete Medical Record Review Form
For each of the selected Medical Records complete the following Review Form:
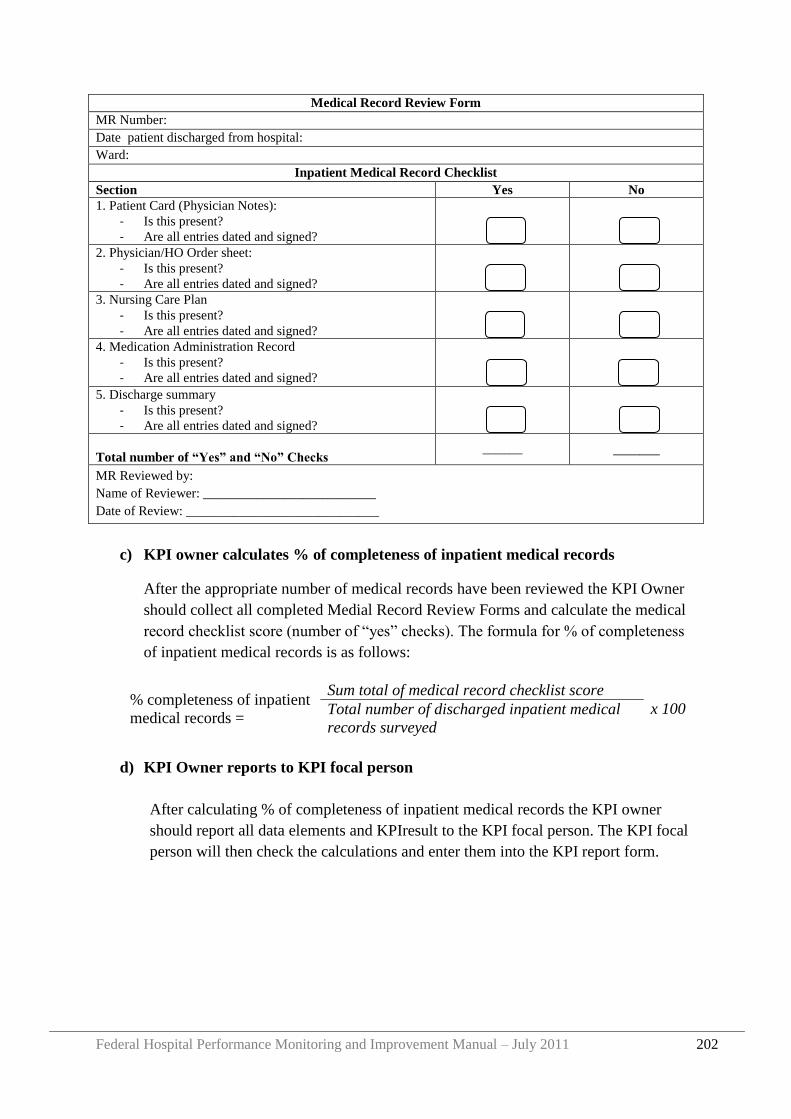
Federal Hospital Performance Monitoring and Improvement Manual – July 2011 202
Medical Record Review Form
MR Number:
Date patient discharged from hospital:
Ward:
Inpatient Medical Record Checklist
Section Yes No
1. Patient Card (Physician Notes):
- Is this present?
- Are all entries dated and signed?
2. Physician/HO Order sheet:
- Is this present?
- Are all entries dated and signed?
3. Nursing Care Plan
- Is this present?
- Are all entries dated and signed?
4. Medication Administration Record
- Is this present?
- Are all entries dated and signed?
5. Discharge summary
- Is this present?
- Are all entries dated and signed?
Total number of “Yes” and “No” Checks ______ _______
MR Reviewed by:
Name of Reviewer: __________________________
Date of Review: _____________________________
c) KPI owner calculates % of completeness of inpatient medical records
After the appropriate number of medical records have been reviewed the KPI Owner
should collect all completed Medial Record Review Forms and calculate the medical
record checklist score (number of “yes” checks). The formula for % of completeness
of inpatient medical records is as follows:
d) KPI Owner reports to KPI focal person
After calculating % of completeness of inpatient medical records the KPI owner
should report all data elements and KPIresult to the KPI focal person. The KPI focal
person will then check the calculations and enter them into the KPI report form.
% completeness of inpatient
medical records =
Sum total of medical record checklist score
x 100 Total number of discharged inpatient medical
records surveyed
Federal Hospital Performance Monitoring and Improvement Manual – July 2011 203
Appendix 12 Survey Protocol: Patient Satisfaction
Purpose of Survey:
To provide a standardized survey for outpatients‟ and inpatients‟ experiences which hospitals
can use to monitor patient satisfaction with services, and changes in satisfaction over time.
The Key Performance Indicator “Patient Satisfaction” will be calculated using the average
responses to question 19 in the Inpatient – Patient Assessment of Health Care (I-PAHC)
survey and question 16 in the Outpatient – Patient Assessment of Health Care (O-PAHC).
Period of Survey:
Hospitals should perform a total of 50 Inpatient and 50 Outpatient surveys each quarter. The
surveys should be collected over a time period of one to two weeks. No more than 10 surveys
should be collected in a day and surveys should be collected on different days and different
times of day (morning and afternoon) over the survey period.
I-PAHC surveys should be administered at the time of discharge. O-PAHC surveys should be
given at the end of the outpatient visit right before the patient leaves the outpatient area.
Role of KPI owner:
The hospital should assign an „owner‟ for the KPI „Patient Satisfaction‟. He/she is
responsible to oversee the survey, to select and train surveyors, to issue O-PAHC and I-
PAHC surveys to each surveyor, to receive completed surveys from centralized collection
area, calculate patient satisfaction (KPI 36) and response rate, and give all completed surveys
to a data entry person who will enter them into the O/I-PAHC Access Database.
Selection and role of surveyors:
Each health facility should assign one or more individuals to administer the surveys to
patients. The individual conducting the survey (also referred to as “surveyor”) should
understand the survey well, including all survey questions and answer choices. To minimize
bias the surveyor should not be involved in direct patient care. A surveyor must have good
interpersonal skills to interact sensitively with patients and must not lead the patients to
particular responses but should administer the survey objectively. Each surveyor must be
trained to ensure he/she understands the purpose and process of the PAHC surveys.
Surveyors are responsible for collecting all completed surveys and returning them to a
centralized collection area determined by the health facility.
Surveys can be completed by the patient themselves (written) or the surveyor may read each
survey question to the patient and transcribe the patient response (oral). When orally
administering the PAHC survey, the surveyor should read the question exactly as written on
the PAHC instrument. If the patient has a query about certain questions on the survey,
surveyors should not provide responses or more detail about what the question might be. This
will introduce the surveyor‟s interpretation into the question, which is a form of bias. When
encountering such a challenge, the best approach is for the surveyor to remind the respondent
Federal Hospital Performance Monitoring and Improvement Manual – July 2011 204
that there is no right or wrong response and that the interpretation of the patient is the best
possible one. Then, the surveyor should re-read the question for the patient
Patient recruitment:
Participation is voluntary and patient anonymity must be maintained. No identifying
information (such as patient‟s name) should be collected. All patients must be 18 years old or
older. In addition, for I-PAHC, participants must have a hospital stay of 2 days or more.
Participants should be excluded from both surveys if cognitively impaired and unable to
understand the survey questions. For the outpatient survey, patients should be selected to
reflect a diversity of outpatient areas. Emergency room services may also be assessed using
the outpatient survey. For the inpatient survey patients should be selected from a range of
different wards to reflect the diversity of services.
The surveyor should not select patients based on his/her presumptions about whether the
patient appears pleased or not pleased with services rendered.
Methodology of Survey:
a) Assign and train surveyors
Selection and training of surveyors should be in accordance with above stated
protocol and should be done well in advance of survey period.
b) Select patients for survey
Surveyors should be provided with a logbook to record the number of patients asked
to participate in survey, number of surveys actually completed by patients and what
type of survey was administered (written or oral). This is to measure the survey
response rate as well as track surveys.
Patient recruitment should be in accordance with above stated protocol. Surveyor
should then approach the patient to inquire if he/she is interested in completing a
patient survey. The surveyor should explain the purpose of the survey and assure the
patient of his or her anonymity. If the patient does want to participate they must then
give their consent verbally before the survey can be administered.
c) Oral or written completion of survey
The survey may be completed by the patient themselves (written) or administered by
the surveyor who will transcribe the patient‟s answers (orally). An ID number should
be assigned to each survey sequentially as it is conducted. The ID should be entered
on the survey form and in a logbook.
Written Survey:
Surveyors will provide a blank patient survey to the patient to be completed by
him/herself. Patient should complete the survey at the time it is distributed and be
notified of a centralized collection area where they can return their completed survey.
Federal Hospital Performance Monitoring and Improvement Manual – July 2011 205
The surveyor should record the Survey No. in logbook and identify it as a “written
survey”.
Oral Survey:
If the patient requests that the survey be conducted orally surveyors will read each
question on the survey to the patient, transcribing the responses of the patient on to
the survey form. The surveyor should record the Survey No. in a logbook and identify
it is as “oral survey”. Once the survey is completed the surveyor should deliver it to a
centralized collection area for the KPI data owner to collect.
d) KPI owner calculates Patient Satisfaction Indicator and response rate
At the end of the survey period the KPI owner should collect all completed Inpatient
and Outpatient surveys from the centralized collection area. The KPI owner should
calculate Patient Satisfaction using patient answers to question 19 on the Inpatient
survey and question 16 on the Outpatient Survey, “On a scale of 0-10 (0 being the
worst facility, 10 being the best facility), how would you rate this health facility”. The
formula for the indicator is as follows:
Additionally the KPI owner should calculate the response rate of the survey.
This information should be collected by the surveyors and can be found in their
logbook. The formula for response rate is as follows:
e) KPI Owner reports to KPI focal person and Data Entry Person
After calculating Patient Satisfaction the KPI owner should report all data elements
and indicator to the KPI focal person. The KPI focal person will then check the
calculations and enter them into the KPI report form.
Additionally, all surveys should be given to the appropriate data entry person to enter
into the Access Database. See Appendix 7 for guidance.
Patient Satisfaction =
∑O-PAHC rating score + ∑I-PAHC rating score
Number of O-PAHC surveys completed + Number of I-PAHC
surveys completed
Response Rate = Number of completed survey
X 100 Total number of patients asked to complete survey
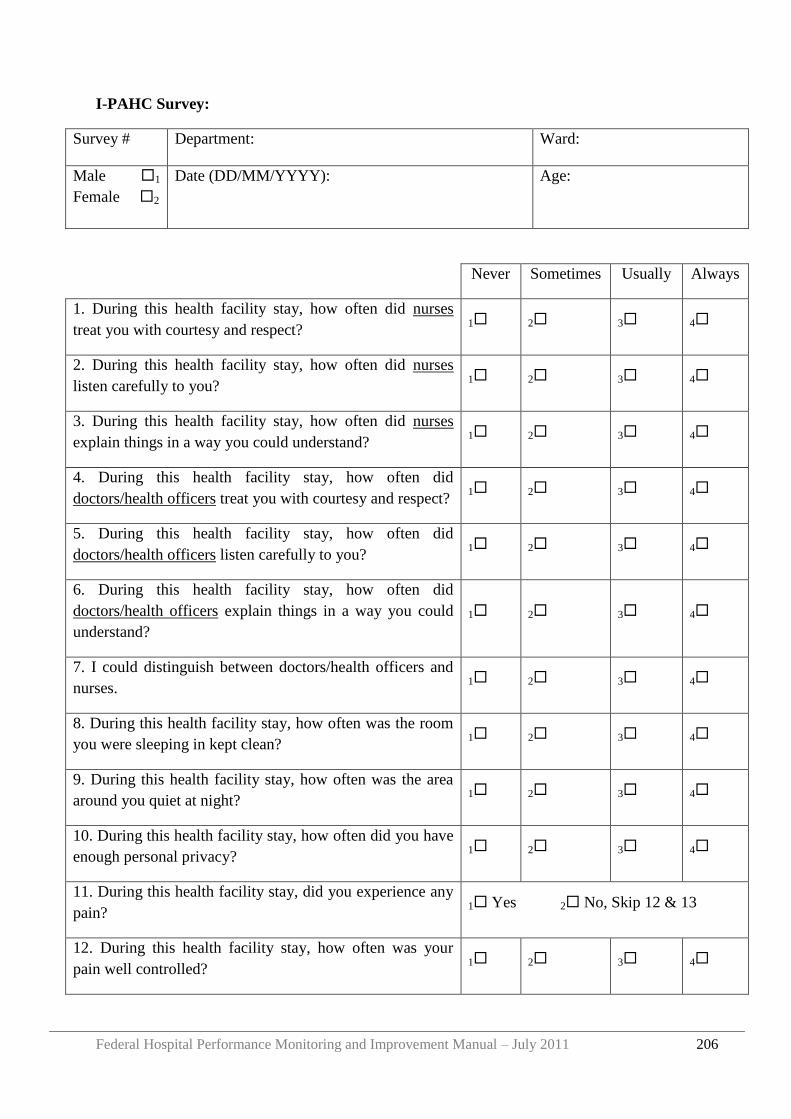
Federal Hospital Performance Monitoring and Improvement Manual – July 2011 206
I-PAHC Survey:
Survey # Department: Ward:
Male 1
Female 2
Date (DD/MM/YYYY): Age:
Never Sometimes Usually Always
1. During this health facility stay, how often did nurses
treat you with courtesy and respect? 1 2 3 4
2. During this health facility stay, how often did nurses
listen carefully to you? 1 2 3 4
3. During this health facility stay, how often did nurses
explain things in a way you could understand? 1 2 3 4
4. During this health facility stay, how often did
doctors/health officers treat you with courtesy and respect? 1 2 3 4
5. During this health facility stay, how often did
doctors/health officers listen carefully to you? 1 2 3 4
6. During this health facility stay, how often did
doctors/health officers explain things in a way you could
understand?
1 2 3 4
7. I could distinguish between doctors/health officers and
nurses. 1 2 3 4
8. During this health facility stay, how often was the room
you were sleeping in kept clean? 1 2 3 4
9. During this health facility stay, how often was the area
around you quiet at night? 1 2 3 4
10. During this health facility stay, how often did you have
enough personal privacy? 1 2 3 4
11. During this health facility stay, did you experience any
pain? 1 Yes 2 No, Skip 12 & 13
12. During this health facility stay, how often was your
pain well controlled? 1 2 3 4
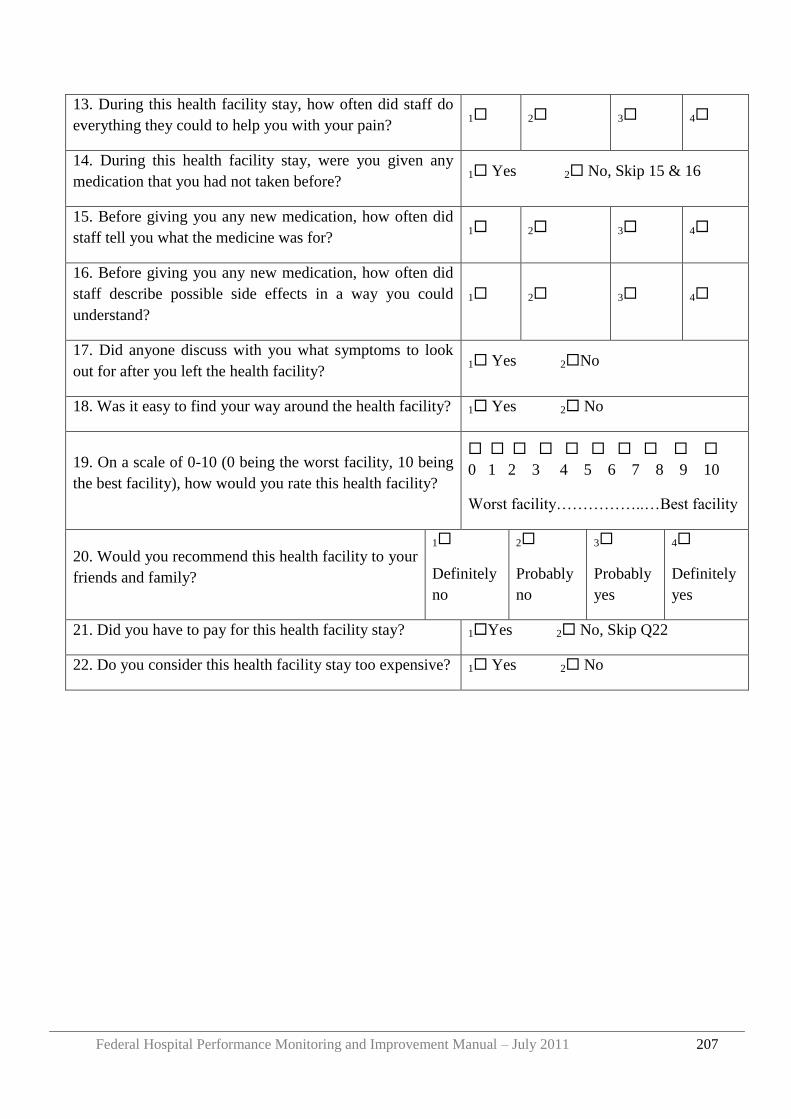
Federal Hospital Performance Monitoring and Improvement Manual – July 2011 207
13. During this health facility stay, how often did staff do
everything they could to help you with your pain? 1 2 3 4
14. During this health facility stay, were you given any
medication that you had not taken before? 1 Yes 2 No, Skip 15 & 16
15. Before giving you any new medication, how often did
staff tell you what the medicine was for? 1 2 3 4
16. Before giving you any new medication, how often did
staff describe possible side effects in a way you could
understand?
1 2 3 4
17. Did anyone discuss with you what symptoms to look
out for after you left the health facility? 1 Yes 2No
18. Was it easy to find your way around the health facility? 1 Yes 2 No
19. On a scale of 0-10 (0 being the worst facility, 10 being
the best facility), how would you rate this health facility?
0 1 2 3 4 5 6 7 8 9 10
Worst facility……………..…Best facility
20. Would you recommend this health facility to your
friends and family?
1
Definitely
no
2
Probably
no
3
Probably
yes
4
Definitely
yes
21. Did you have to pay for this health facility stay? 1Yes 2 No, Skip Q22
22. Do you consider this health facility stay too expensive? 1 Yes 2 No
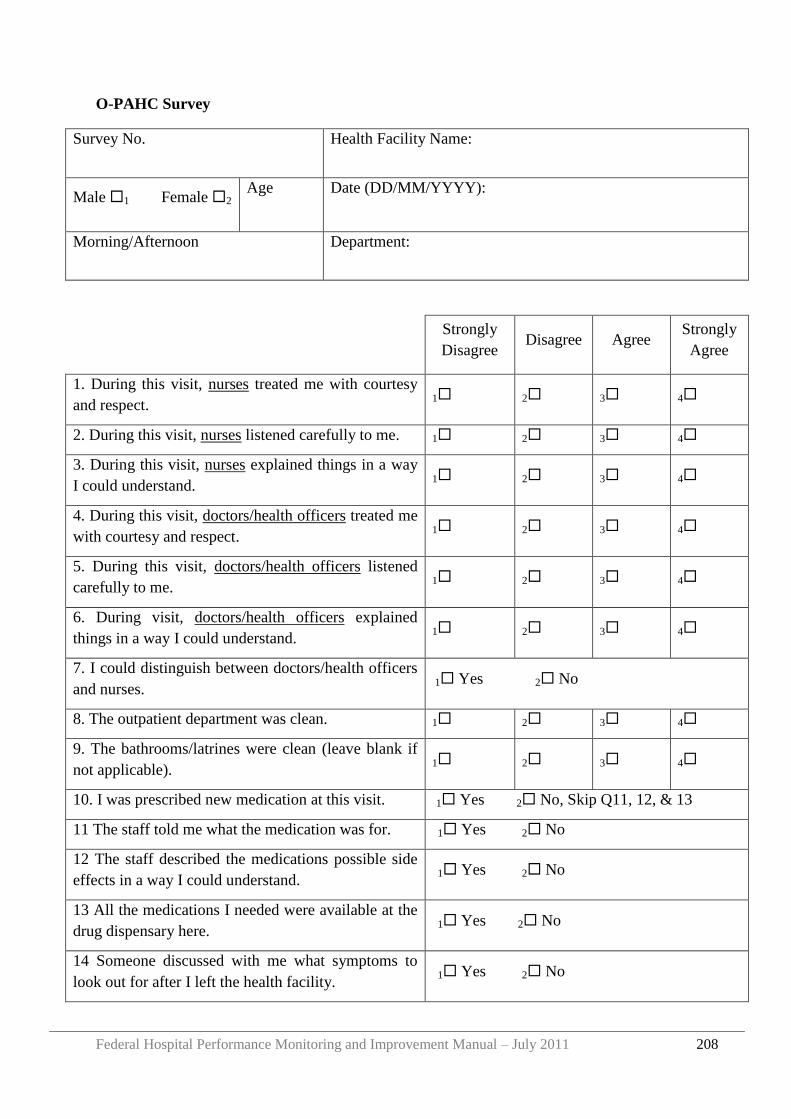
Federal Hospital Performance Monitoring and Improvement Manual – July 2011 208
O-PAHC Survey
Survey No. Health Facility Name:
Male 1 Female 2 Age Date (DD/MM/YYYY):
Morning/Afternoon Department:
Strongly
Disagree Disagree Agree
Strongly
Agree
1. During this visit, nurses treated me with courtesy
and respect. 1 2 3 4
2. During this visit, nurses listened carefully to me. 1 2 3 4
3. During this visit, nurses explained things in a way
I could understand. 1 2 3 4
4. During this visit, doctors/health officers treated me
with courtesy and respect. 1 2 3 4
5. During this visit, doctors/health officers listened
carefully to me. 1 2 3 4
6. During visit, doctors/health officers explained
things in a way I could understand. 1 2 3 4
7. I could distinguish between doctors/health officers
and nurses. 1 Yes 2 No
8. The outpatient department was clean. 1 2 3 4
9. The bathrooms/latrines were clean (leave blank if
not applicable). 1 2 3 4
10. I was prescribed new medication at this visit. 1 Yes 2 No, Skip Q11, 12, & 13
11 The staff told me what the medication was for. 1 Yes 2 No
12 The staff described the medications possible side
effects in a way I could understand. 1 Yes 2 No
13 All the medications I needed were available at the
drug dispensary here. 1 Yes 2 No
14 Someone discussed with me what symptoms to
look out for after I left the health facility. 1 Yes 2 No
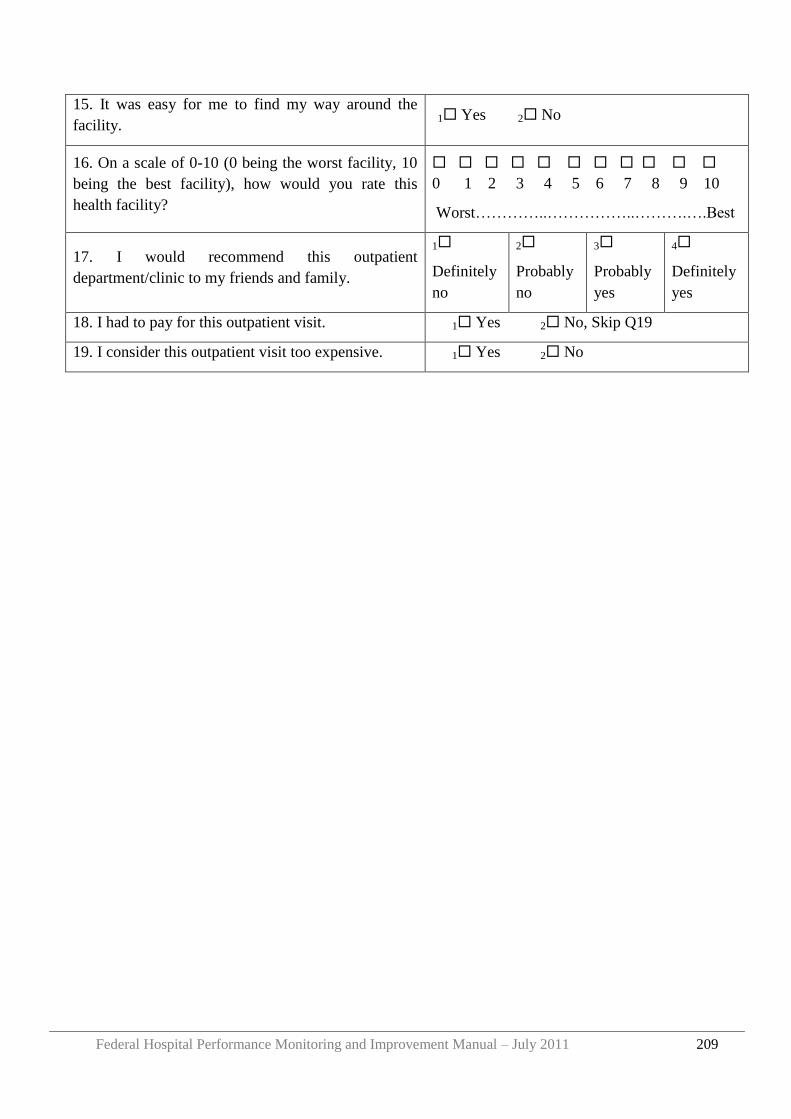
Federal Hospital Performance Monitoring and Improvement Manual – July 2011 209
15. It was easy for me to find my way around the
facility. 1 Yes 2 No
16. On a scale of 0-10 (0 being the worst facility, 10
being the best facility), how would you rate this
health facility?
0 1 2 3 4 5 6 7 8 9 10
Worst…………..……………..……….….Best
17. I would recommend this outpatient
department/clinic to my friends and family.
1
Definitely
no
2
Probably
no
3
Probably
yes
4
Definitely
yes
18. I had to pay for this outpatient visit. 1 Yes 2 No, Skip Q19
19. I consider this outpatient visit too expensive. 1 Yes 2 No
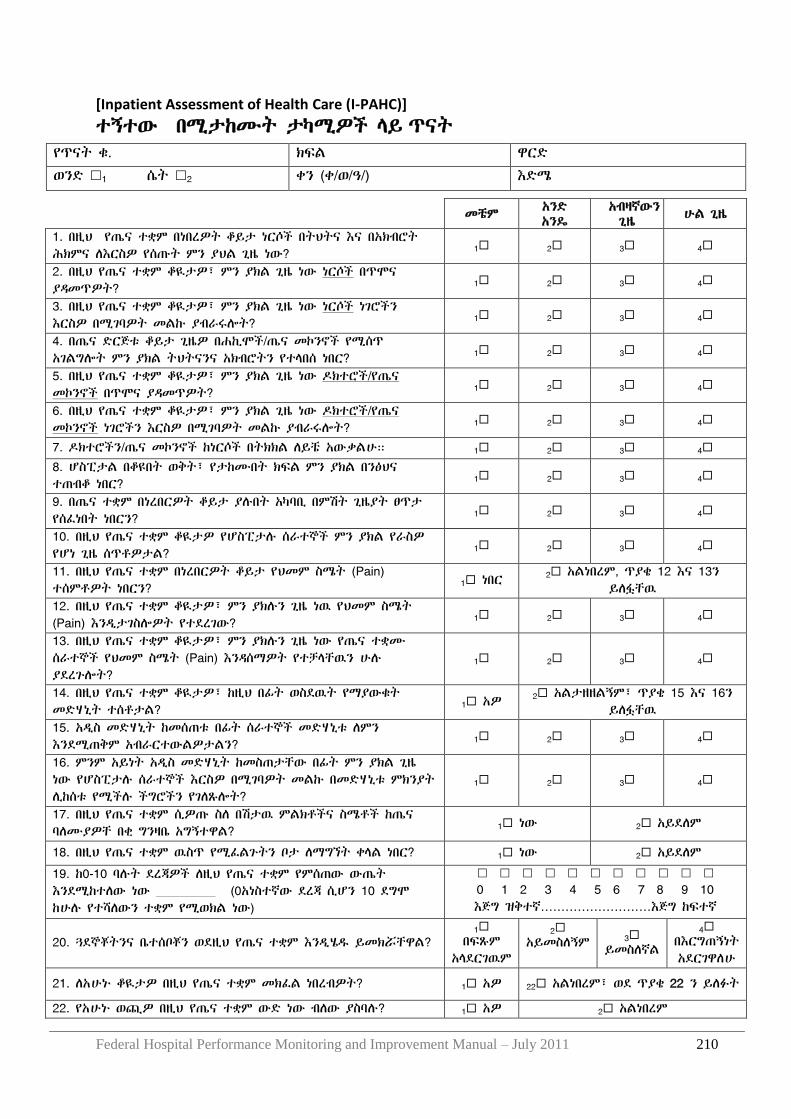
Federal Hospital Performance Monitoring and Improvement Manual – July 2011 210
[Inpatient Assessment of Health Care (I-PAHC)]
ተኝተው በሚታከሙት ታካሚዎች ሊይ ጥናት
የጥናት ቁ. ክፍሌ ዋርዴ
ወንዴ 1 ሴት 2 ቀን (ቀ/ወ/ዓ/) እዴሜ
መቼም አንዴ አንዳ
አብዛኛውን ጊዜ
ሁሌ ጊዜ
1. በዚህ የጤና ተቋም በነበረዎት ቆይታ ነርሶች በትህትና እና በአክብሮት ሕክምና ሇእርስዎ የሰጡት ምን ያህሌ ጊዜ ነው?
1 2 3 4
2. በዚህ የጤና ተቋም ቆዪታዎ፣ ምን ያክሌ ጊዜ ነው ነርሶች በጥሞና ያዲመጥዎት? 1 2 3 4
3. በዚህ የጤና ተቋም ቆዪታዎ፣ ምን ያክሌ ጊዜ ነው ነርሶች ነገሮችን እርስዎ በሚገባዎት መሌኩ ያብራሩልት? 1 2 3 4
4. በጤና ዴርጅቱ ቆይታ ጊዜዎ በሐኪሞች/ጤና መኮንኖች የሚሰጥ አገሌግልት ምን ያክሌ ትህትናንና አክብሮትን የተሊበሰ ነበር? 1 2 3 4
5. በዚህ የጤና ተቋም ቆዪታዎ፣ ምን ያክሌ ጊዜ ነው ድክተሮች/የጤና መኮንኖች በጥሞና ያዲመጥዎት? 1 2 3 4
6. በዚህ የጤና ተቋም ቆዪታዎ፣ ምን ያክሌ ጊዜ ነው ድክተሮች/የጤና መኮንኖች ነገሮችን እርስዎ በሚገባዎት መሌኩ ያብራሩልት? 1 2 3 4
7. ድክተሮችን/ጤና መኮንኖች ከነርሶች በትክክሌ ሇይቼ አውቃሌሁ። 1 2 3 4
8. ሆስፒታሌ በቆዩበት ወቅት፣ የታከሙበት ክፍሌ ምን ያክሌ በንፅህና ተጠብቆ ነበር? 1 2 3 4
9. በጤና ተቋም በነረበርዎት ቆይታ ያለበት አካባቢ በምሽት ጊዜያት ፀጥታ የሰፈነበት ነበርን? 1 2 3 4
10. በዚህ የጤና ተቋም ቆዪታዎ የሆስፒታለ ሰራተኞች ምን ያክሌ የራስዎ የሆነ ጊዜ ሰጥቶዎታሌ? 1 2 3 4
11. በዚህ የጤና ተቋም በነረበርዎት ቆይታ የህመም ስሜት (Pain) ተሰምቶዎት ነበርን? 1 ነበር 2 አሌነበረም, ጥያቄ 12 እና 13ን
ይሇፏቸዉ 12. በዚህ የጤና ተቋም ቆዪታዎ፣ ምን ያክለን ጊዜ ነዉ የህመም ስሜት (Pain) እንዱታገስልዎት የተዯረገው? 1 2 3 4
13. በዚህ የጤና ተቋም ቆዪታዎ፣ ምን ያክለን ጊዜ ነው የጤና ተቋሙ ሰራተኞች የህመም ስሜት (Pain) እንዲሰማዎት የተቻሊቸዉን ሁለ ያዯረጉልት?
1 2 3 4
14. በዚህ የጤና ተቋም ቆዪታዎ፣ ከዚህ በፊት ወስዯዉት የማያውቁት መዴሃኒት ተሰቶታሌ? 1 አዎ
2 አሌታዘዘሌኝም፣ ጥያቄ 15 እና 16ን ይሇፏቸዉ
15. አዱስ መዴሃኒት ከመሰጠቱ በፊት ሰራተኞች መዴሃኒቱ ሇምን እንዯሚጠቅም አብራርተውሌዎታሌን? 1 2 3 4
16. ምንም አይነት አዱስ መዴሃኒት ከመስጠታቸው በፊት ምን ያክሌ ጊዜ ነው የሆስፒታለ ሰራተኞች እርስዎ በሚገባዎት መሌኩ በመዴሃኒቱ ምክንያት ሉከሰቱ የሚችለ ችግሮችን የገሇጹልት?
1 2 3 4
17. በዚህ የጤና ተቋም ሲዎጡ ስሇ በሽታዉ ምሌክቶችና ስሜቶች ከጤና ባሇሙያዎቸ በቂ ግንዛቤ አግኝተዋሌ? 1 ነው 2 አይዯሇም
18. በዚህ የጤና ተቋም ዉስጥ የሚፈሌጉትን ቦታ ሇማግኘት ቀሊሌ ነበር? 1 ነው 2 አይዯሇም
19. ከ0-10 ባለት ዯረጃዎች ሇዚህ የጤና ተቋም የምሰጠው ውጤት እንዯሚከተሇው ነው 1()(0አነስተኛው ዯረጃ ሲሆን 10 ዯግሞ ከሁለ የተሻሇውን ተቋም የሚወክሌ ነው)
0 1 2 3 4 5 6 7 8 9 10 እጅግ ዝቅተኛ………………………እጅግ ከፍተኛ
20. ጓዯኞቾትንና ቤተሰቦቾን ወዯዚህ የጤና ተቋም እንዱሄደ ይመክሯቸዋሌ? 1
በፍጹም አሊዯርገዉም
2 አይመስሇኝም
3 ይመስሇኛሌ
4 በእርግጠኝነት አዯርገዋሇሁ
21. ሇአሁኑ ቆዪታዎ በዚህ የጤና ተቋም መክፈሌ ነበረብዎት? 1 አዎ 22 አሌነበረም፣ ወዯ ጥያቄ 22 ን ይሇፉት
22. የአሁኑ ወጪዎ በዚህ የጤና ተቋም ውዴ ነው ብሇው ያስባለ? 1 አዎ 2 አሌነበረም
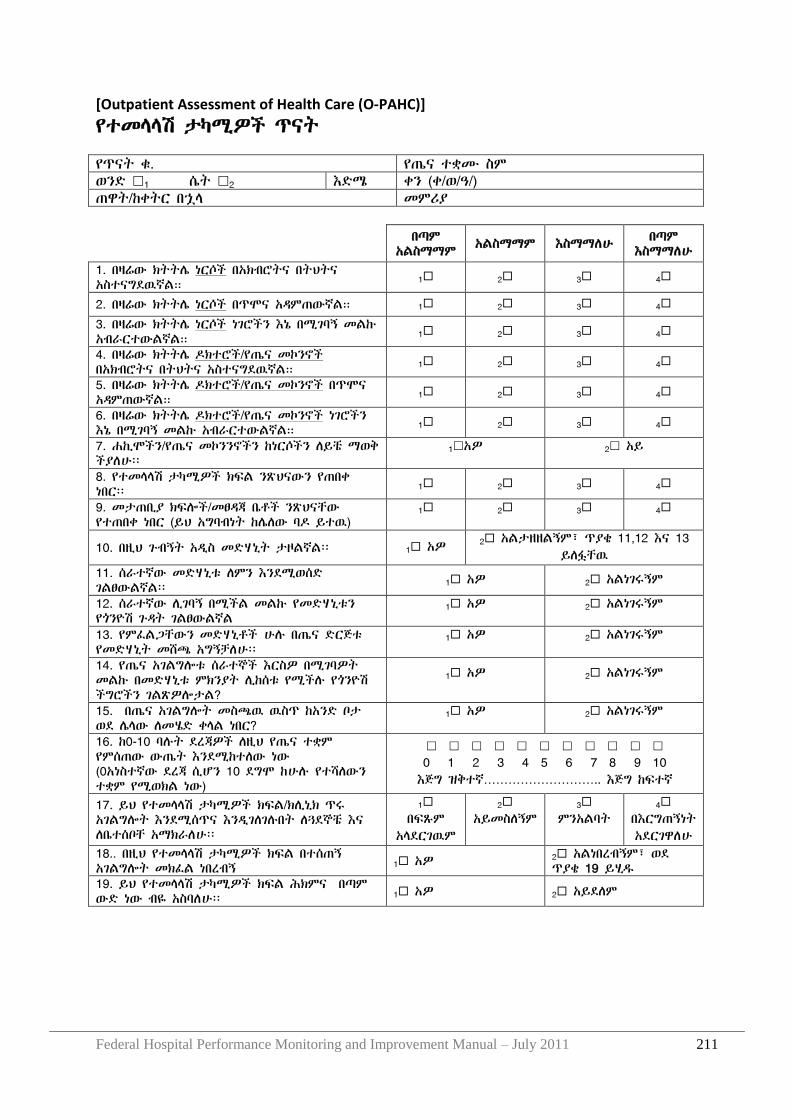
Federal Hospital Performance Monitoring and Improvement Manual – July 2011 211
[Outpatient Assessment of Health Care (O-PAHC)]
የተመሊሊሽ ታካሚዎች ጥናት የጥናት ቁ. የጤና ተቋሙ ስም ወንዴ 1 ሴት 2 እዴሜ ቀን (ቀ/ወ/ዓ/) ጠዋት/ከቀትር በኋሊ መምሪያ
በጣም አሌስማማም
አሌስማማም እስማማሇሁ በጣም እስማማሇሁ
1. በዛሬው ክትትላ ነርሶች በአክብሮትና በትህትና አስተናግዯዉኛሌ። 1 2 3 4
2. በዛሬው ክትትላ ነርሶች በጥሞና አዲምጠውኛሌ። 1 2 3 4
3. በዛሬው ክትትላ ነርሶች ነገሮችን እኔ በሚገባኝ መሌኩ አብራርተውሌኛሌ። 1 2 3 4
4. በዛሬው ክትትላ ድክተሮች/የጤና መኮንኖች በአክብሮትና በትህትና አስተናግዯዉኛሌ። 1 2 3 4
5. በዛሬው ክትትላ ድክተሮች/የጤና መኮንኖች በጥሞና አዲምጠውኛሌ። 1 2 3 4
6. በዛሬው ክትትላ ድክተሮች/የጤና መኮንኖች ነገሮችን እኔ በሚገባኝ መሌኩ አብራርተውሌኛሌ። 1 2 3 4
7. ሐኪሞችን/የጤና መኮንንኖችን ከነርሶችን ሇይቼ ማወቅ ችያሇሁ፡፡
1አዎ 2 አይ
8. የተመሊሊሽ ታካሚዎች ክፍሌ ንጽህናውን የጠበቀ ነበር፡፡ 1 2 3 4
9. መታጠቢያ ክፍልች/መፀዲጃ ቤቶች ንጽህናቸው የተጠበቀ ነበር (ይህ አግባብነት ከላሇው ባድ ይተዉ)
1 2 3 4
10. በዚህ ጉብኝት አዱስ መዴሃኒት ታዞሌኛሌ፡፡ 1 አዎ 2 አሌታዘዘሌኝም፣ ጥያቄ 11,12 እና 13 ይሇፏቸዉ
11. ሰራተኛው መዴሃኒቱ ሇምን እንዯሚወሰዴ ገሌፀውሌኛሌ፡፡ 1 አዎ 2 አሌነገሩኝም
12. ሰራተኛው ሉገባኝ በሚችሌ መሌኩ የመዴሃኒቱን የጎንዮሽ ጉዲት ገሌፀውሌኛሌ
1 አዎ 2 አሌነገሩኝም
13. የምፈሌጋቸውን መዴሃኒቶች ሁለ በጤና ዴርጅቱ የመዴሃኒት መሸጫ አግኝቻሇሁ፡፡
1 አዎ 2 አሌነገሩኝም
14. የጤና አገሌግልቱ ሰራተኞች እርስዎ በሚገባዎት መሌኩ በመዴሃኒቱ ምክንያት ሉከሰቱ የሚችለ የጎንዮሽ ችግሮችን ገሌጽዎልታሌ?
1 አዎ 2 አሌነገሩኝም
15. በጤና አገሌግልት መስጫዉ ዉስጥ ከአንዴ ቦታ ወዯ ላሊው ሇመሄዴ ቀሊሌ ነበር?
1 አዎ 2 አሌነገሩኝም
16. ከ0-10 ባለት ዯረጃዎች ሇዚህ የጤና ተቋም የምሰጠው ውጤት እንዯሚከተሇው ነው (0አነስተኛው ዯረጃ ሲሆን 10 ዯግሞ ከሁለ የተሻሇውን ተቋም የሚወክሌ ነው)
0 1 2 3 4 5 6 7 8 9 10 እጅግ ዝቅተኛ……………………….. እጅግ ከፍተኛ
17. ይህ የተመሊሊሽ ታካሚዎች ክፍሌ/ክሉኒክ ጥሩ አገሌግልት እንዯሚሰጥና እንዱገሇገለበት ሇጓዯኞቼ እና ሇቤተሰቦቸ አማክራሇሁ፡፡
1 በፍጹም
አሊዯርገዉም
2 አይመስሇኝም
3 ምንአሌባት
4 በእርግጠኝነት አዯርገዋሇሁ
18.. በዚህ የተመሊሊሽ ታካሚዎች ክፍሌ በተሰጠኝ አገሌግልት መክፈሌ ነበረብኝ 1 አዎ 2 አሌነበረብኝም፣ ወዯ
ጥያቄ 19 ይሂደ 19. ይህ የተመሊሊሽ ታካሚዎች ክፍሌ ሕክምና በጣም ውዴ ነው ብዬ አስባሇሁ፡፡ 1 አዎ 2 አይዯሇም

Federal Hospital Performance Monitoring and Improvement Manual – July 2011 212
Federal Hospital Performance Monitoring and Improvement Manual – July 2011 213
Appendix 13 O-PAHC and I-PAHC Database and Analytical Tool
Using the Access Database to enter data:
Two data entry forms have been created in Microsoft Access – one for I-PAHC and the
second for O-PAHC. The questions on each survey are listed in the database exactly as they
appear on the questionnaire.
Who should enter the data?
Data entry should be conducted by individuals with excellent attention to detail and
good keyboarding skills. The data entry person should enter the data reliably and
without error. Data entry should require no more than 4 minutes per survey; therefore,
entering 50 surveys in total should take approximately two hours. This should provide
adequate time for entry and checking entered data. It is the responsibility of the data
entry staff to check all of his/her work before submitting to supervisor for spot check.
How is data entered?
1. Open the Access Database
2. Select I-PAHC or O-PAHC
3. Select „Add New‟
4. Enter survey number and other relevant patient and survey details on the top of the
form
5. Enter all the responses exactly as on the survey. Leave any unanswered questions
blank.
6. After entering all responses from a single survey, go back and check that each entered
response is accurate
7. Click on „Save‟
8. Select “Add New ” to take you to the next blank survey form.
Spot checking
After all data has been entered, a supervisor should perform a spot check for each
batch. Spot checking requires randomly selecting a number of surveys per batch (of
50) to check whether the data entry clerk has accurately entered all responses from
the paper surveys. A supervisor should randomly select at least 5 surveys from each
batch of 50 to ensure the accuracy and quality of all entered data. In the event that
any errors are found by the supervisor during the spot check, he/she should then
proceed to checking 100% of that batch for further errors.
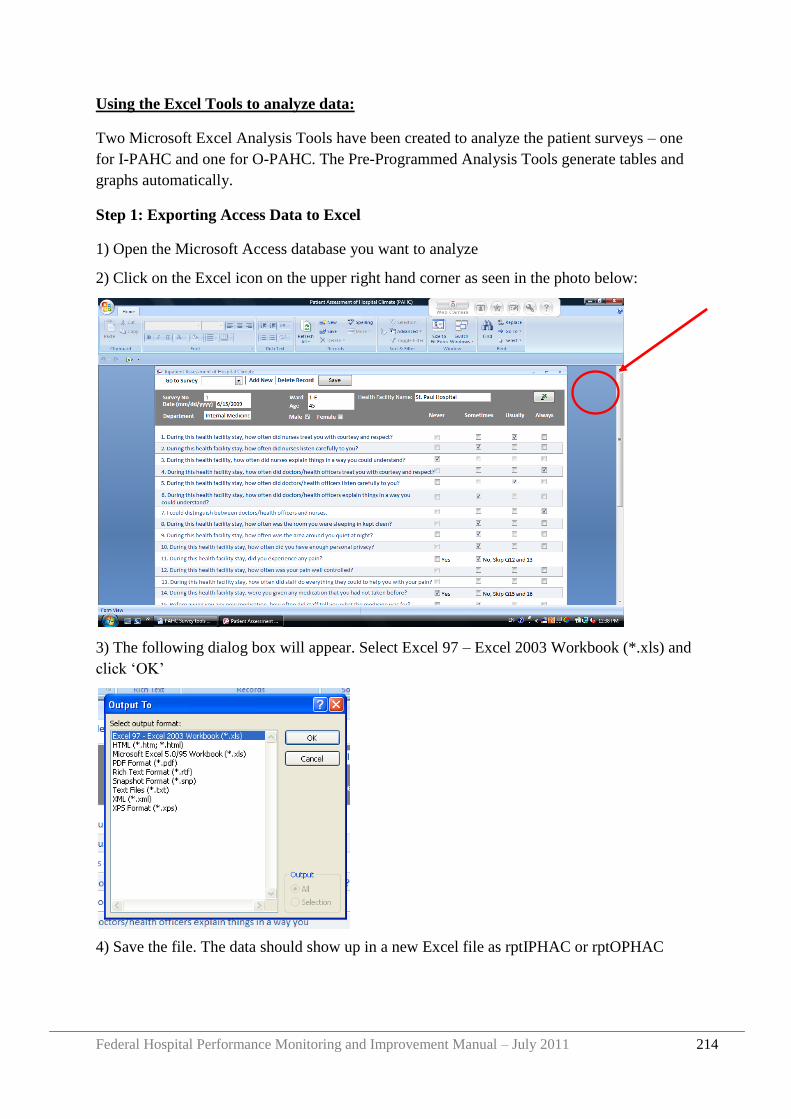
Federal Hospital Performance Monitoring and Improvement Manual – July 2011 214
Using the Excel Tools to analyze data:
Two Microsoft Excel Analysis Tools have been created to analyze the patient surveys – one
for I-PAHC and one for O-PAHC. The Pre-Programmed Analysis Tools generate tables and
graphs automatically.
Step 1: Exporting Access Data to Excel
1) Open the Microsoft Access database you want to analyze
2) Click on the Excel icon on the upper right hand corner as seen in the photo below:
3) The following dialog box will appear. Select Excel 97 – Excel 2003 Workbook (*.xls) and
click „OK‟
4) Save the file. The data should show up in a new Excel file as rptIPHAC or rptOPHAC
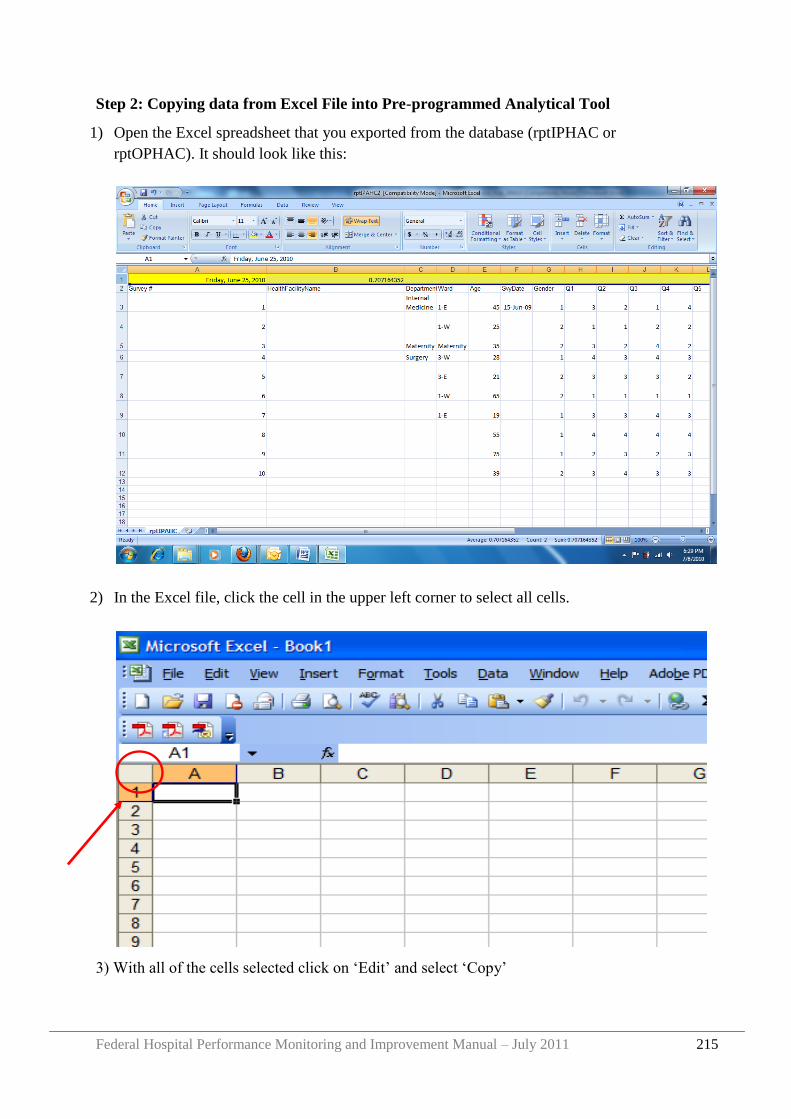
Federal Hospital Performance Monitoring and Improvement Manual – July 2011 215
Step 2: Copying data from Excel File into Pre-programmed Analytical Tool
1) Open the Excel spreadsheet that you exported from the database (rptIPHAC or
rptOPHAC). It should look like this:
2) In the Excel file, click the cell in the upper left corner to select all cells.
3) With all of the cells selected click on „Edit‟ and select „Copy‟
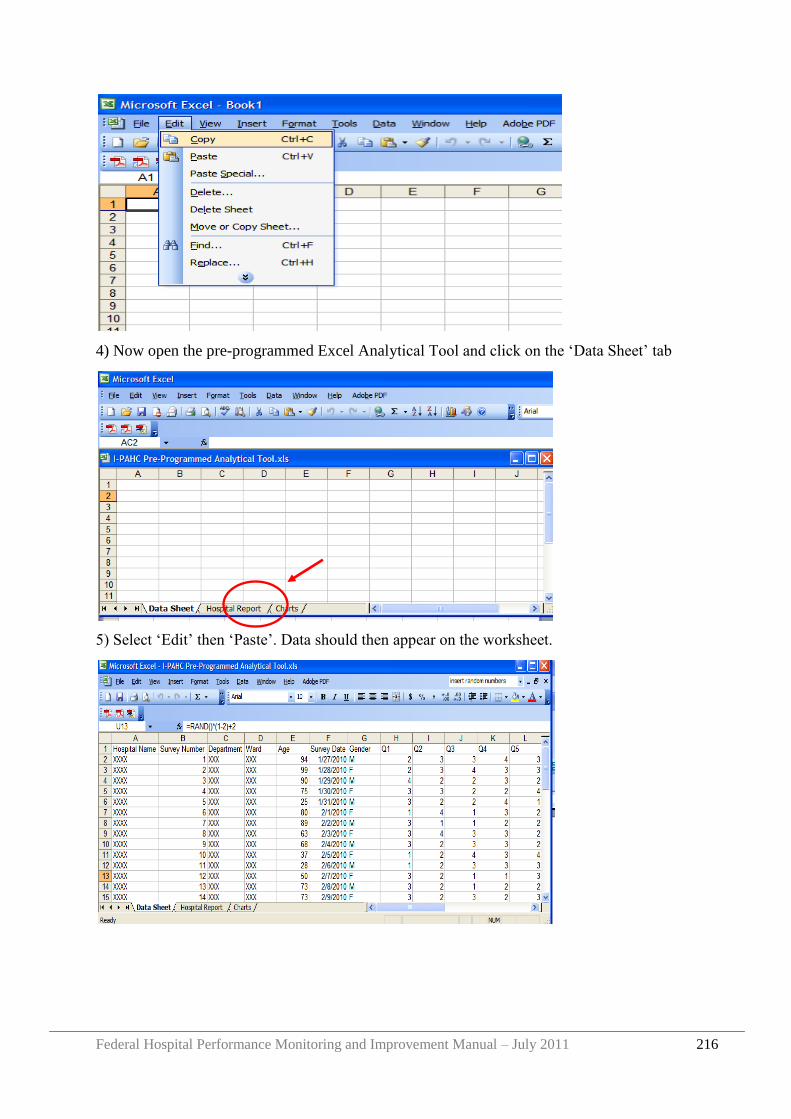
Federal Hospital Performance Monitoring and Improvement Manual – July 2011 216
4) Now open the pre-programmed Excel Analytical Tool and click on the „Data Sheet‟ tab
5) Select „Edit‟ then „Paste‟. Data should then appear on the worksheet.
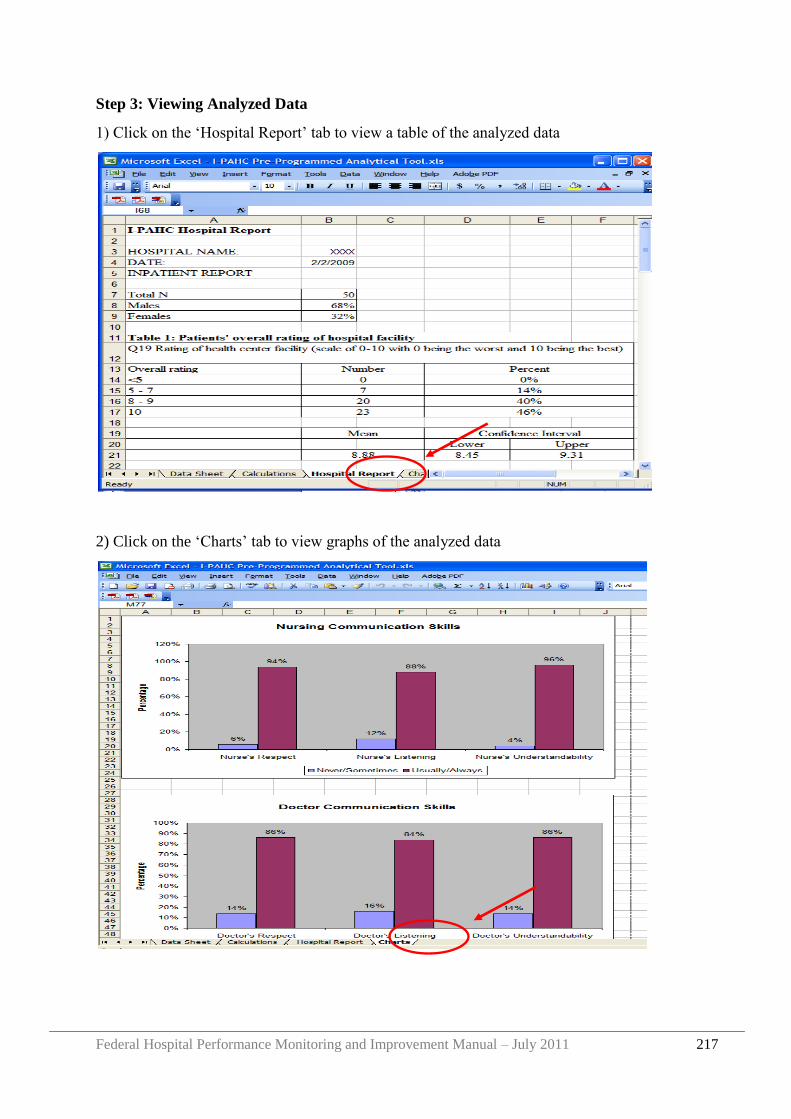
Federal Hospital Performance Monitoring and Improvement Manual – July 2011 217
Step 3: Viewing Analyzed Data
1) Click on the „Hospital Report‟ tab to view a table of the analyzed data
2) Click on the „Charts‟ tab to view graphs of the analyzed data
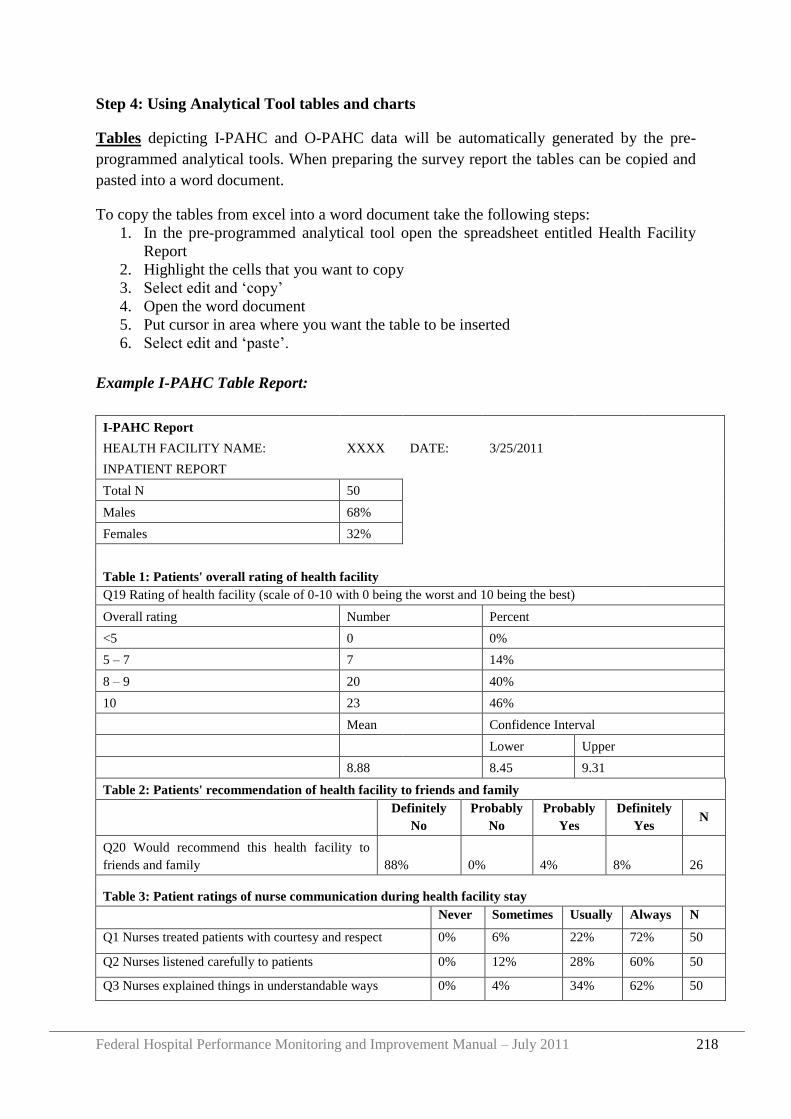
Federal Hospital Performance Monitoring and Improvement Manual – July 2011 218
Step 4: Using Analytical Tool tables and charts
Tables depicting I-PAHC and O-PAHC data will be automatically generated by the pre-
programmed analytical tools. When preparing the survey report the tables can be copied and
pasted into a word document.
To copy the tables from excel into a word document take the following steps:
1. In the pre-programmed analytical tool open the spreadsheet entitled Health Facility
Report
2. Highlight the cells that you want to copy
3. Select edit and „copy‟
4. Open the word document
5. Put cursor in area where you want the table to be inserted
6. Select edit and „paste‟.
Example I-PAHC Table Report:
I-PAHC Report
HEALTH FACILITY NAME: XXXX DATE: 3/25/2011
INPATIENT REPORT
Total N 50
Males 68%
Females 32%
Table 1: Patients' overall rating of health facility
Q19 Rating of health facility (scale of 0-10 with 0 being the worst and 10 being the best)
Overall rating Number Percent
<5 0 0%
5 – 7 7 14%
8 – 9 20 40%
10 23 46%
Mean Confidence Interval
Lower Upper
8.88 8.45 9.31
Table 2: Patients' recommendation of health facility to friends and family
Definitely
No
Probably
No
Probably
Yes
Definitely
Yes N
Q20 Would recommend this health facility to
friends and family 88% 0% 4% 8% 26
Table 3: Patient ratings of nurse communication during health facility stay
Never Sometimes Usually Always N
Q1 Nurses treated patients with courtesy and respect 0% 6% 22% 72% 50
Q2 Nurses listened carefully to patients 0% 12% 28% 60% 50
Q3 Nurses explained things in understandable ways 0% 4% 34% 62% 50
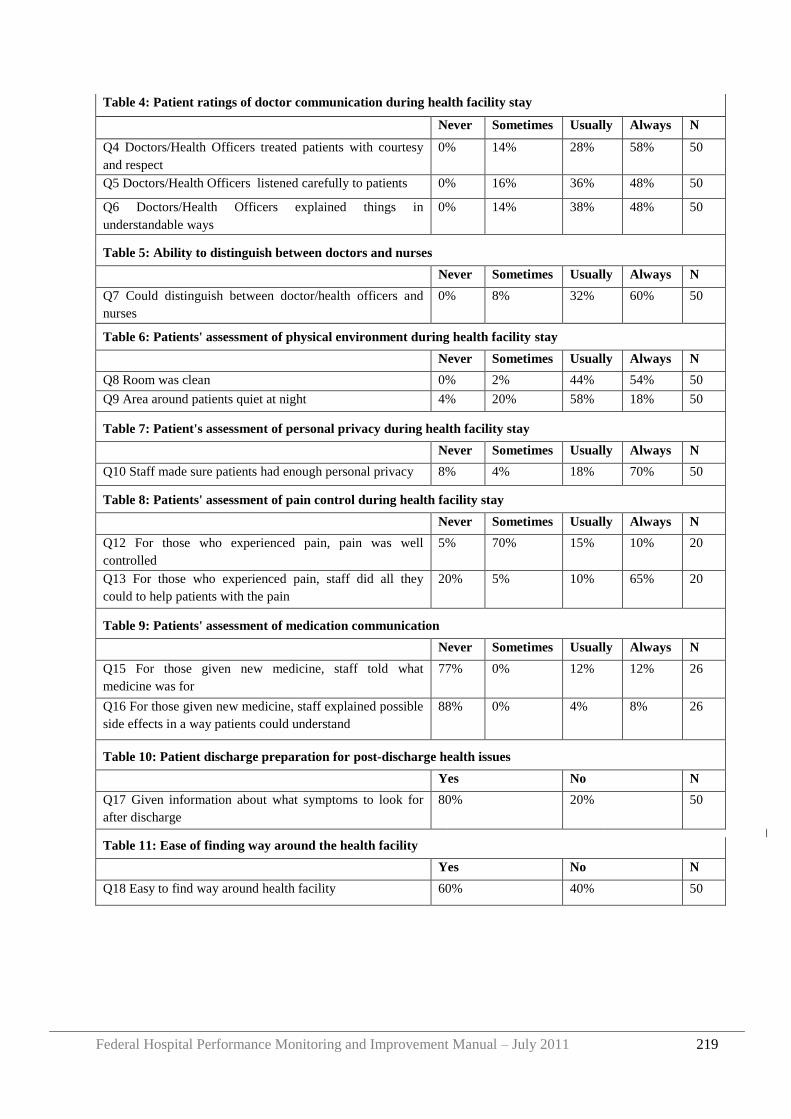
Federal Hospital Performance Monitoring and Improvement Manual – July 2011 219
Table 4: Patient ratings of doctor communication during health facility stay
Never Sometimes Usually Always N
Q4 Doctors/Health Officers treated patients with courtesy
and respect
0% 14% 28% 58% 50
Q5 Doctors/Health Officers listened carefully to patients 0% 16% 36% 48% 50
Q6 Doctors/Health Officers explained things in
understandable ways
0% 14% 38% 48% 50
Table 5: Ability to distinguish between doctors and nurses
Never Sometimes Usually Always N
Q7 Could distinguish between doctor/health officers and
nurses
0% 8% 32% 60% 50
Table 6: Patients' assessment of physical environment during health facility stay
Never Sometimes Usually Always N
Q8 Room was clean 0% 2% 44% 54% 50
Q9 Area around patients quiet at night 4% 20% 58% 18% 50
Table 7: Patient's assessment of personal privacy during health facility stay
Never Sometimes Usually Always N
Q10 Staff made sure patients had enough personal privacy 8% 4% 18% 70% 50
Table 8: Patients' assessment of pain control during health facility stay
Never Sometimes Usually Always N
Q12 For those who experienced pain, pain was well
controlled
5% 70% 15% 10% 20
Q13 For those who experienced pain, staff did all they
could to help patients with the pain
20% 5% 10% 65% 20
Table 9: Patients' assessment of medication communication
Never Sometimes Usually Always N
Q15 For those given new medicine, staff told what
medicine was for
77% 0% 12% 12% 26
Q16 For those given new medicine, staff explained possible
side effects in a way patients could understand
88% 0% 4% 8% 26
Table 10: Patient discharge preparation for post-discharge health issues
Yes No N
Q17 Given information about what symptoms to look for
after discharge
80% 20% 50
Table 11: Ease of finding way around the health facility
Yes No N
Q18 Easy to find way around health facility 60% 40% 50
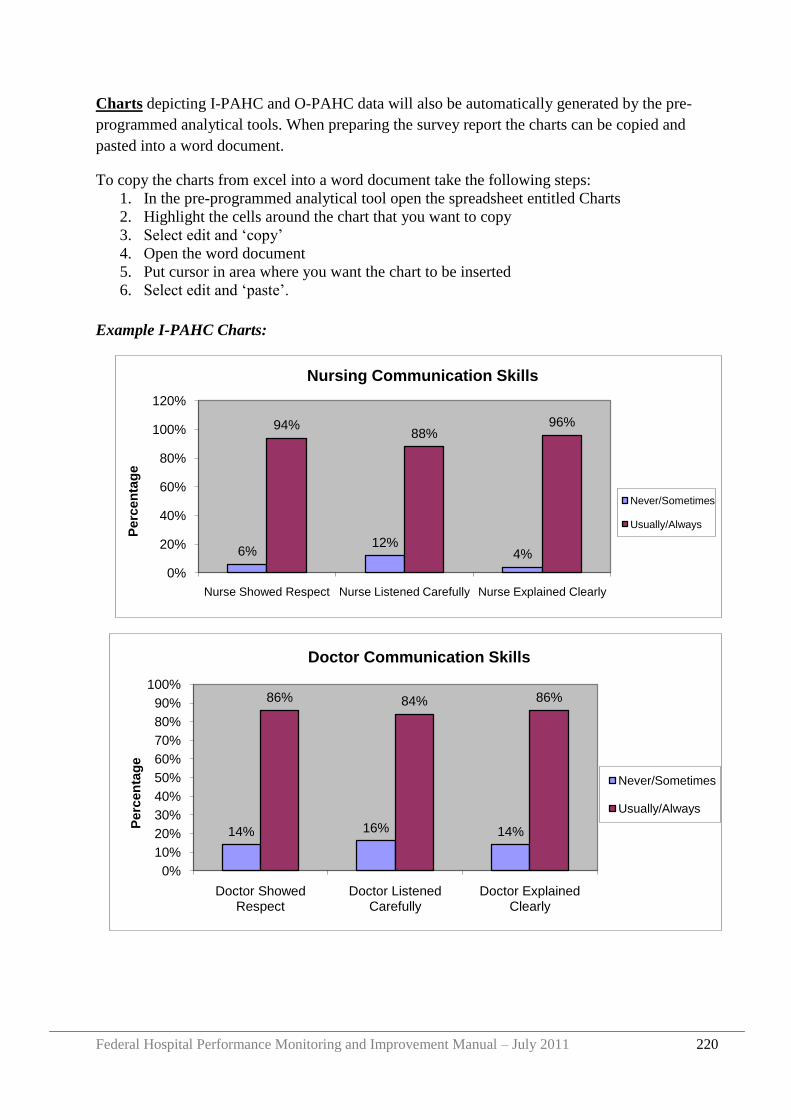
Federal Hospital Performance Monitoring and Improvement Manual – July 2011 220
6%12%
4%
94%88%
96%
0%
20%
40%
60%
80%
100%
120%
Nurse Showed Respect Nurse Listened Carefully Nurse Explained Clearly
Perc
en
tag
e
Nursing Communication Skills
Never/Sometimes
Usually/Always
Charts depicting I-PAHC and O-PAHC data will also be automatically generated by the pre-
programmed analytical tools. When preparing the survey report the charts can be copied and
pasted into a word document.
To copy the charts from excel into a word document take the following steps:
1. In the pre-programmed analytical tool open the spreadsheet entitled Charts
2. Highlight the cells around the chart that you want to copy
3. Select edit and „copy‟
4. Open the word document
5. Put cursor in area where you want the chart to be inserted
6. Select edit and „paste‟.
Example I-PAHC Charts:
14% 16% 14%
86% 84% 86%
0%
10%
20%
30%
40%
50%
60%
70%
80%
90%
100%
Doctor Showed Respect
Doctor Listened Carefully
Doctor Explained Clearly
Perc
en
tag
e
Doctor Communication Skills
Never/Sometimes
Usually/Always
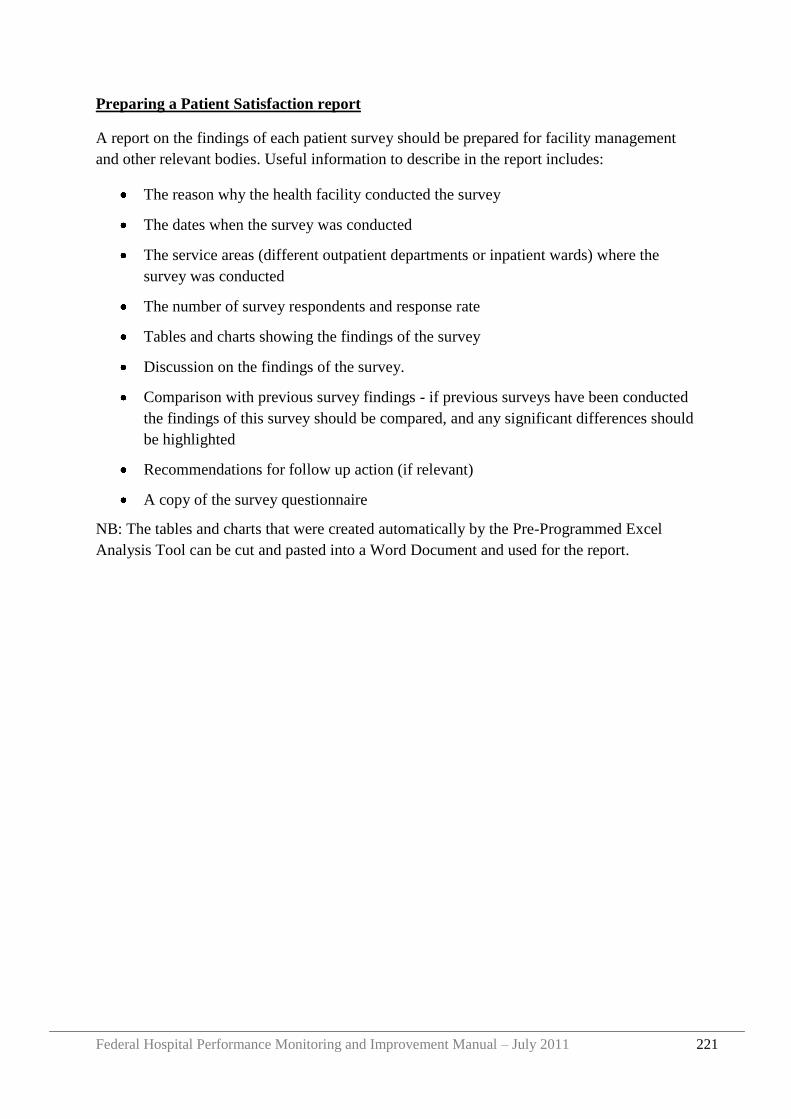
Federal Hospital Performance Monitoring and Improvement Manual – July 2011 221
Preparing a Patient Satisfaction report
A report on the findings of each patient survey should be prepared for facility management
and other relevant bodies. Useful information to describe in the report includes:
The reason why the health facility conducted the survey
The dates when the survey was conducted
The service areas (different outpatient departments or inpatient wards) where the
survey was conducted
The number of survey respondents and response rate
Tables and charts showing the findings of the survey
Discussion on the findings of the survey.
Comparison with previous survey findings - if previous surveys have been conducted
the findings of this survey should be compared, and any significant differences should
be highlighted
Recommendations for follow up action (if relevant)
A copy of the survey questionnaire
NB: The tables and charts that were created automatically by the Pre-Programmed Excel
Analysis Tool can be cut and pasted into a Word Document and used for the report.

Federal Hospital Performance Monitoring and Improvement Manual – July 2011 222
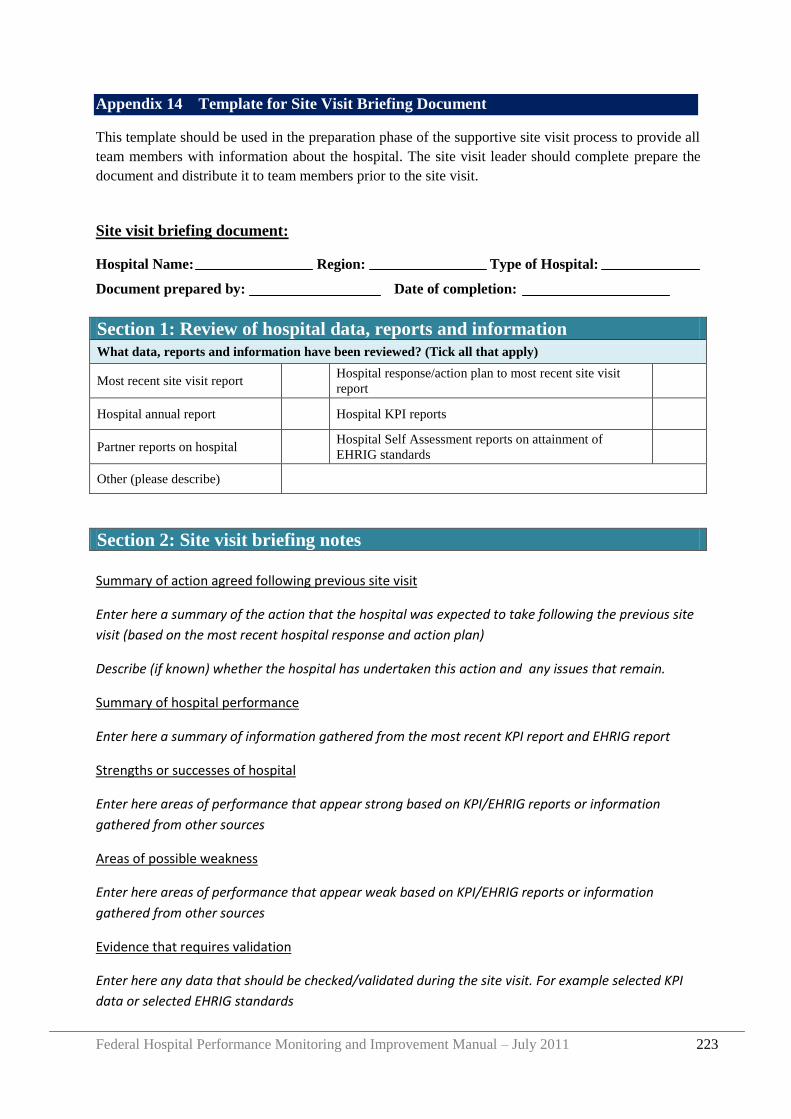
Federal Hospital Performance Monitoring and Improvement Manual – July 2011 223
Appendix 14 Template for Site Visit Briefing Document
This template should be used in the preparation phase of the supportive site visit process to provide all
team members with information about the hospital. The site visit leader should complete prepare the
document and distribute it to team members prior to the site visit.
Site visit briefing document:
Hospital Name: Region: Type of Hospital:
Document prepared by: Date of completion:
Section 1: Review of hospital data, reports and information
What data, reports and information have been reviewed? (Tick all that apply)
Most recent site visit report Hospital response/action plan to most recent site visit
report
Hospital annual report Hospital KPI reports
Partner reports on hospital Hospital Self Assessment reports on attainment of
EHRIG standards
Other (please describe)
Section 2: Site visit briefing notes
Summary of action agreed following previous site visit
Enter here a summary of the action that the hospital was expected to take following the previous site
visit (based on the most recent hospital response and action plan)
Describe (if known) whether the hospital has undertaken this action and any issues that remain.
Summary of hospital performance
Enter here a summary of information gathered from the most recent KPI report and EHRIG report
Strengths or successes of hospital
Enter here areas of performance that appear strong based on KPI/EHRIG reports or information
gathered from other sources
Areas of possible weakness
Enter here areas of performance that appear weak based on KPI/EHRIG reports or information
gathered from other sources
Evidence that requires validation
Enter here any data that should be checked/validated during the site visit. For example selected KPI
data or selected EHRIG standards
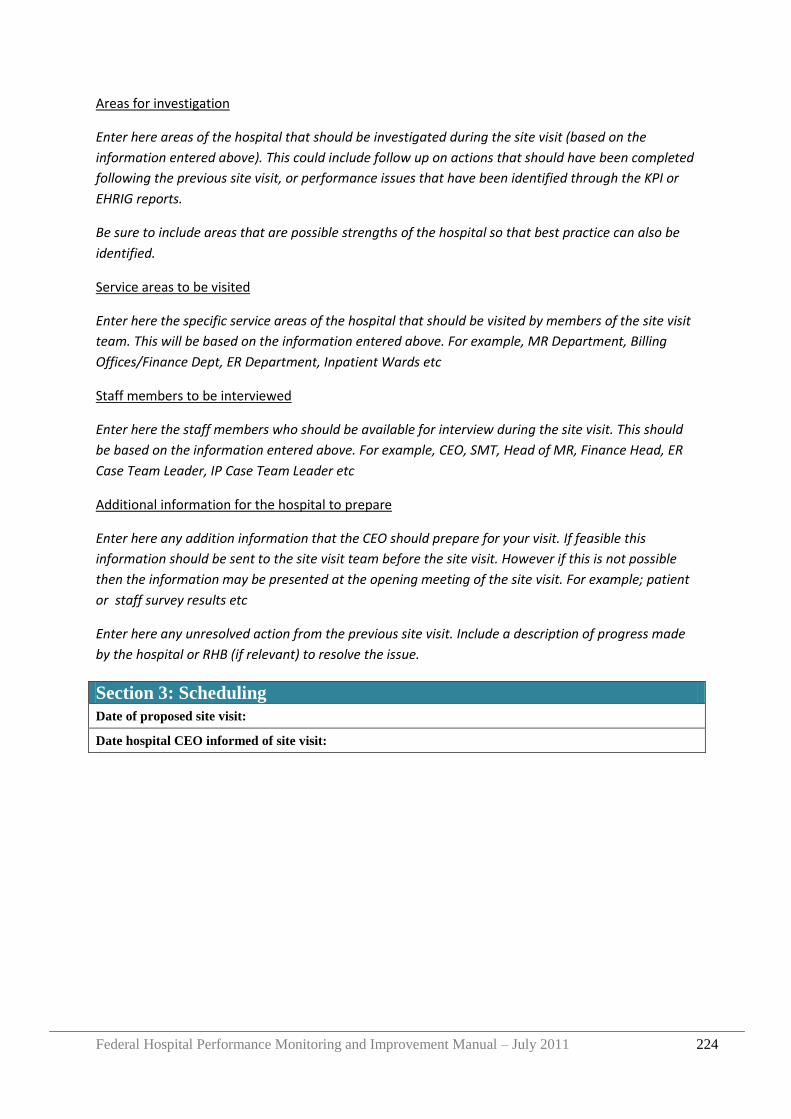
Federal Hospital Performance Monitoring and Improvement Manual – July 2011 224
Areas for investigation
Enter here areas of the hospital that should be investigated during the site visit (based on the
information entered above). This could include follow up on actions that should have been completed
following the previous site visit, or performance issues that have been identified through the KPI or
EHRIG reports.
Be sure to include areas that are possible strengths of the hospital so that best practice can also be
identified.
Service areas to be visited
Enter here the specific service areas of the hospital that should be visited by members of the site visit
team. This will be based on the information entered above. For example, MR Department, Billing
Offices/Finance Dept, ER Department, Inpatient Wards etc
Staff members to be interviewed
Enter here the staff members who should be available for interview during the site visit. This should
be based on the information entered above. For example, CEO, SMT, Head of MR, Finance Head, ER
Case Team Leader, IP Case Team Leader etc
Additional information for the hospital to prepare
Enter here any addition information that the CEO should prepare for your visit. If feasible this
information should be sent to the site visit team before the site visit. However if this is not possible
then the information may be presented at the opening meeting of the site visit. For example; patient
or staff survey results etc
Enter here any unresolved action from the previous site visit. Include a description of progress made
by the hospital or RHB (if relevant) to resolve the issue.
Section 3: Scheduling
Date of proposed site visit:
Date hospital CEO informed of site visit:
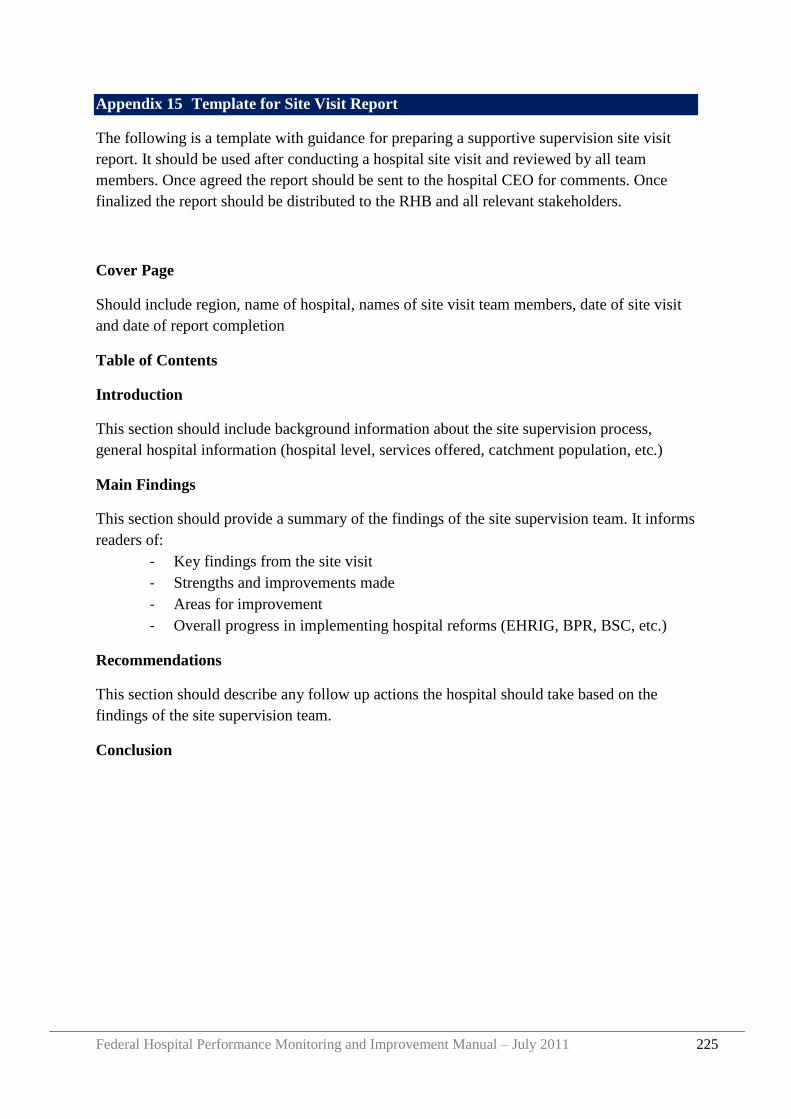
Federal Hospital Performance Monitoring and Improvement Manual – July 2011 225
Appendix 15 Template for Site Visit Report
The following is a template with guidance for preparing a supportive supervision site visit
report. It should be used after conducting a hospital site visit and reviewed by all team
members. Once agreed the report should be sent to the hospital CEO for comments. Once
finalized the report should be distributed to the RHB and all relevant stakeholders.
Cover Page
Should include region, name of hospital, names of site visit team members, date of site visit
and date of report completion
Table of Contents
Introduction
This section should include background information about the site supervision process,
general hospital information (hospital level, services offered, catchment population, etc.)
Main Findings
This section should provide a summary of the findings of the site supervision team. It informs
readers of:
- Key findings from the site visit
- Strengths and improvements made
- Areas for improvement
- Overall progress in implementing hospital reforms (EHRIG, BPR, BSC, etc.)
Recommendations
This section should describe any follow up actions the hospital should take based on the
findings of the site supervision team.
Conclusion

Federal Hospital Performance Monitoring and Improvement Manual – July 2011 226
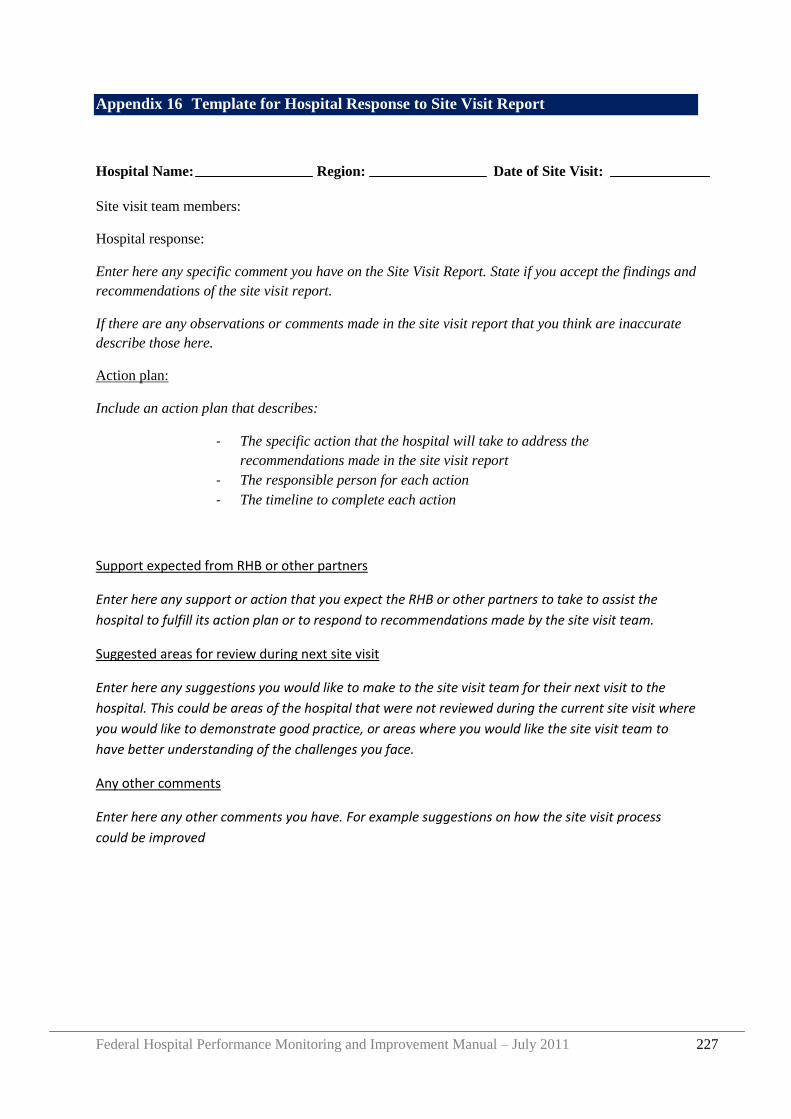
Federal Hospital Performance Monitoring and Improvement Manual – July 2011 227
Appendix 16 Template for Hospital Response to Site Visit Report
Hospital Name: Region: Date of Site Visit:
Site visit team members:
Hospital response:
Enter here any specific comment you have on the Site Visit Report. State if you accept the findings and
recommendations of the site visit report.
If there are any observations or comments made in the site visit report that you think are inaccurate
describe those here.
Action plan:
Include an action plan that describes:
- The specific action that the hospital will take to address the
recommendations made in the site visit report
- The responsible person for each action
- The timeline to complete each action
Support expected from RHB or other partners
Enter here any support or action that you expect the RHB or other partners to take to assist the
hospital to fulfill its action plan or to respond to recommendations made by the site visit team.
Suggested areas for review during next site visit
Enter here any suggestions you would like to make to the site visit team for their next visit to the
hospital. This could be areas of the hospital that were not reviewed during the current site visit where
you would like to demonstrate good practice, or areas where you would like the site visit team to
have better understanding of the challenges you face.
Any other comments
Enter here any other comments you have. For example suggestions on how the site visit process
could be improved