hospitality outlook: 2015-2019 south africa nigeria ... · pdf filehospitality outlook:...
TRANSCRIPT
The African Traveller
Hospitality outlook: 2015-2019 South Africa – Nigeria – Mauritius – Kenya 5th edition May 2015

The information contained in this publication is provided for general information purposes only and does not constitute the provision of legal or professional advice in any way. Before making any decision or taking any action, a professional advisor should be consulted. No responsibility for loss to any person acting or refraining from action as a result of any material in this publication can be accepted by the author, copyright owner or publisher.
PwC 3
Hospitality outlook: 2015-2019South Africa – Nigeria – Mauritius–Kenya
Fifth edition
PwC’s team of hospitality specialists provide an unbiased overview of how the hospitality industry in South Africa, Nigeria, Mauritius and Kenya is expected to develop over the coming years. The publication focuses on the following major industry segments: hotels, guest houses and farms, caravan/camping sites, bush lodges and other accommodation. It details the key trends observed and discusses the challenges facing these sectors as well as considering their future prospects.
Hospitality outlook: 2015-2019 demonstrates deep knowledge of the local hospitality market and is a powerful tool for understanding critical business issues. To learn more about the challenges and opportunities that lie ahead for the hospitality industry in South Africa, please visit www.pwc.com/za/hospitality-and-leisure
About PwC’s hospitality industry groupEvery day, PricewaterhouseCoopers (PwC) plays a significant supporting role in hospitality businesses across the world. With our local knowledge of culture, laws and business needs, we help clients make the most of changing market scenarios.
We understand how developments in the broader hospitality environment are affecting our clients and work with them as a trusted advisor to provide solutions to help improve organisational effectiveness and long-term success. More significantly, we focus on the issues and challenges that are of utmost importance to our clients. These include restructuring, talent management, changing revenue models, compliance, changing guest requirements and managing capital spend. We have made a substantial commitment to understanding the forces that are impacting these issues and continue to develop and deliver solutions to help our clients achieve their financial, operational and strategic objectives.
4 The African Traveller – Hospitality outlook: 2015-2019
Hospitality Outlook: 2015-2019South Africa – Nigeria – Mauritius – Kenya
Prepared and edited by:PwC helps organisations and individuals create the value they’re looking for. We’re a network of firms in 157 countries with more than 195 000 people who are committed to delivering quality in assurance, tax and advisory services. Find out more by visiting us at pwc.com.
PricewaterhouseCoopers Inc. 2 Eglin Road Sunninghill, 2157 South Africa +27 (0)11 797 4000 www.pwc.com/za
Research methodologyHistorical data was derived from our analysis of Smith Travel Research (STR) data and local country data combined with other information on industry trends. As some of the historical data was generated through surveys, year-to-year swings sometimes occur because of entities of different sizes being sampled rather than because of underlying industry trends.
Historical data from STR may also differ from one year to the next, reflecting differences in the make-up of the participating sample of hotels. We applied a harmonising model to smooth out these swings in order to better reflect underlying market trends.
We then developed forecasting models based on the historical performance for each category, economic prospects for each country and the rest of the world, and estimates of domestic and international overnight travel. We also took into account announced plans for expansion by hotel operators, as well as competition, pricing trends and the expected reaction of proprietors to changing occupancy rates.
Quantitative research and analysis was provided by Wilkofsky Gruen Associates Inc., a provider of global research and analysis of the hospitality industry. See www.wilkofskygruen.com for more information.
Editorial teamNikki Forster, Hospitality Industry Leader, PwC Southern Africa Pietro Calicchio, Director, PwC South Africa Sunet Liebenberg, Senior Manager, PwC South Africa Basheena Bhoola, Senior Manager, PwC South Africa Osere Alakhume, Director, PwC Nigeria Nicolas Vaudin, Director, PwC Mauritius Michael Mugasa, Partner, PwC Kenya
Use of Outlook dataThe information contained in this publication is provided for general information purposes only and does not constitute the provision of legal or professional advice in any way. Before making any decision or taking any action, a professional advisor should be consulted. No responsibility for loss to any person acting or refraining from action as a result of any material in this publication can be accepted by the author, copyright owner or publisher.
The information in this document is provided ‘as is’ with no assurance or guarantee of completeness, accuracy or timeliness of the information, and without warranty of any kind. In no event will PricewaterhouseCoopers be liable for any losses arising from any decision made or action taken in reliance on the information provided.
Designations used by companies to distinguish their products are often claimed as trademarks. In all instances where PricewaterhouseCoopers is aware of a claim, the product names appear in initial capital letters or all capital letters. Readers, however, should contact those companies for more complete information regarding trademarks and registration.
Permission to citeNo part of this publication may be excerpted, reproduced, stored in a retrieval system or distributed or transmitted in any form or by any means, including electronic, mechanical, photocopying, recording or scanning without the prior written permission of PricewaterhouseCoopers.
Requests should be submitted in writing to Nikki Forster at [email protected] outlining the excerpts you wish to use along with a draft copy of the full report that excerpts will appear in. Provision of this information is necessary for every citation request to enable PricewaterhouseCoopers to assess the context in which the excerpts are being presented.
Editing and designThandeka Maduna Catherine Ensor
Many other professionals within PwC reviewed the text and contributed local expertise to this publication and we thank them for their assistance.
PwC 5
Johannesburg
14 May 2015
To our clients and friends both in and beyond the hospitality industry:
Welcome to Hospitality outlook: 2015-2019, the 5th edition in this series. This publication focuses on segments within the hospitality industry with detailed forecasts and analysis. It discusses the key trends observed in each segment as well as critical challenges and future prospects.
The accommodation market in South Africa enjoyed its third consecutive year of strong growth with a 9.1% advance following two years of double-digit gains.
Nigeria is forecast to be the fastest-growing market over the next five years with a projected 10.5% compound annual gain. Virtually all of that gain is expected during the latter three years of the forecast period.
Mauritius posted a modest 1.8% advance in 2014, helped by rising tourism, but declining room rates held down revenue growth.
Kenya’s hotel market has been declining for three years and we expect a further drop in 2015 and for as long as security concerns in East Africa persist.
We at PwC continue to stay on top of trends and developments that may impact hospitality companies, now and in the future, and look forward to sharing our thoughts further with you.
We appreciate your feedback and ask that you continue to tell us what we can do to make our publications more relevant and useful to you.
If you would like clarification on any matters covered in this publication, or you believe we can be of service to your business in any way, please contact one of our hospitality specialists listed on page 57 of this report.
Finally, we thank you for your support and wish you an exciting and rewarding year ahead.
Sincerely,
Nikki Forster
Director Hospitality Industry Leader PwC Southern Africa
6 The African Traveller – Hospitality outlook: 2015-2019
Table of contents
The Market OverviewTravel and tourism in South Africa
Hotel accommodation in South Africa
Guest houses and guest farms in South Africa
Caravan/camping sites, bush lodges and other accommodation in South Africa
Looking back: 2014 Outlook: 2015 – 2019
8
24
10
26
14
28
16
29
PwC 7
Hotel accommodation in Nigeria
Looking back: 2014
Outlook: 2015 – 2019
Looking back: 2014
Outlook: 2015 – 2019
Hotel accommodation in Mauritius
Looking back: 2014
Outlook: 2015 – 2019
How safe is your hotel network?
Hospitality industry group contacts
Hotel accommodation in Kenya
34
48
39
51
40
52
47
56
8 The African Traveller – Hospitality outlook: 2015-2019
The Market
PwC 9
This report covers South Africa, Nigeria, Mauritius and Kenya. The market consists of spending generated by renting rooms. Accommodation sectors in South Africa consist of hotels, guest houses and guest farms, game lodges, caravan sites, camping sites and other overnight accommodation. For Nigeria, Mauritius and Kenya, only information on hotels is presented.
Figures for South Africa are expressed in rand; those for Nigeria and Kenya are shown in US dollars (US$); and figures for Mauritius are expressed in euros. Tables showing comparisons between countries are in rand. We use a constant exchange rate for the 2008-2019 period.
Exchange rates used in this report
Rand: US$ 10.8352
US$: naira 163.5910
Rand: euros 14.3798
Euros: rupees 39.1907
Euros: US$ 0.7535
US$: shilling 86.5624
10 The African Traveller – Hospitality outlook: 2015-2019
Overview
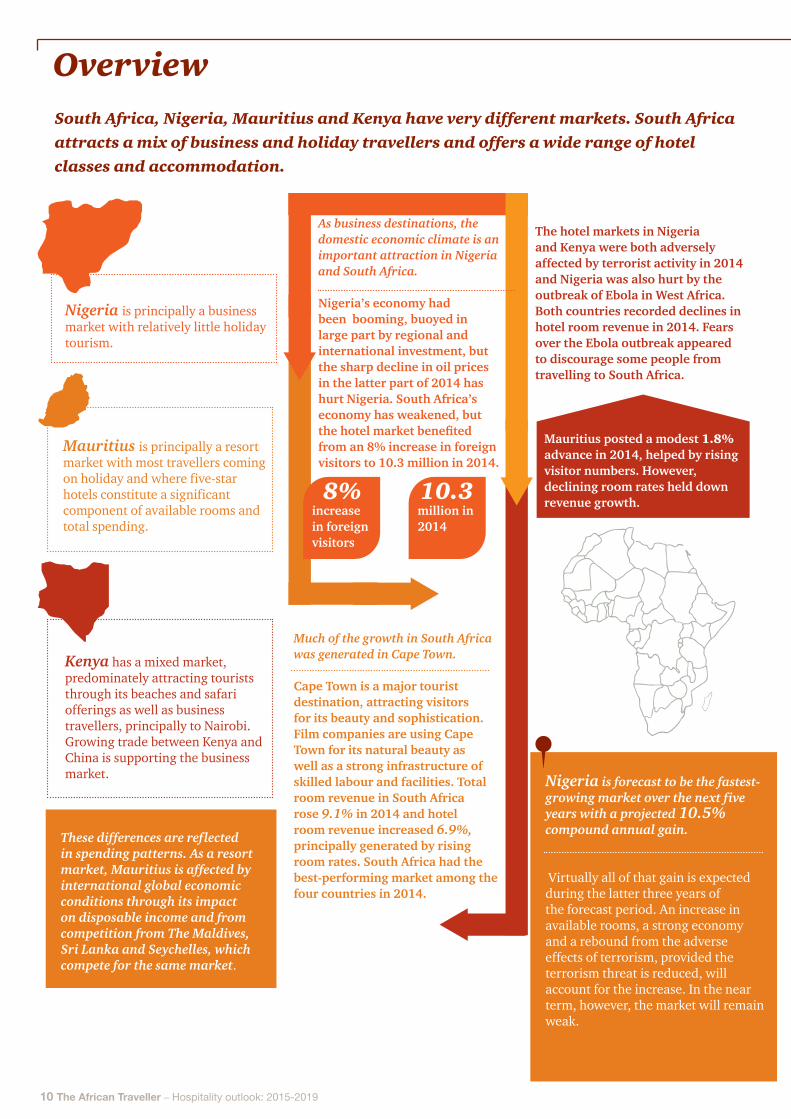
These differences are reflected in spending patterns. As a resort market, Mauritius is affected by international global economic conditions through its impact on disposable income and from competition from The Maldives, Sri Lanka and Seychelles, which compete for the same market.
South Africa, Nigeria, Mauritius and Kenya have very different markets. South Africa attracts a mix of business and holiday travellers and offers a wide range of hotel classes and accommodation.
Nigeria is principally a business market with relatively little holiday tourism.
Mauritius is principally a resort market with most travellers coming on holiday and where five-star hotels constitute a significant component of available rooms and total spending.
Kenya has a mixed market, predominately attracting tourists through its beaches and safari offerings as well as business travellers, principally to Nairobi. Growing trade between Kenya and China is supporting the business market.
As business destinations, the domestic economic climate is an important attraction in Nigeria and South Africa. Nigeria’s economy had been booming, buoyed in large part by regional and international investment, but the sharp decline in oil prices in the latter part of 2014 has hurt Nigeria. South Africa’s economy has weakened, but the hotel market benefited from an 8% increase in foreign visitors to 10.3 million in 2014.
Much of the growth in South Africa was generated in Cape Town. Cape Town is a major tourist destination, attracting visitors for its beauty and sophistication. Film companies are using Cape Town for its natural beauty as well as a strong infrastructure of skilled labour and facilities. Total room revenue in South Africa rose 9.1% in 2014 and hotel room revenue increased 6.9%, principally generated by rising room rates. South Africa had the best-performing market among the four countries in 2014.
8% 10.3increase in foreign visitors
million in 2014
The hotel markets in Nigeria and Kenya were both adversely affected by terrorist activity in 2014 and Nigeria was also hurt by the outbreak of Ebola in West Africa. Both countries recorded declines in hotel room revenue in 2014. Fears over the Ebola outbreak appeared to discourage some people from travelling to South Africa.
Mauritius posted a modest 1.8% advance in 2014, helped by rising visitor numbers. However, declining room rates held down revenue growth.
Nigeria is forecast to be the fastest-growing market over the next five years with a projected 10.5% compound annual gain.
Virtually all of that gain is expected during the latter three years of the forecast period. An increase in available rooms, a strong economy and a rebound from the adverse effects of terrorism, provided the terrorism threat is reduced, will account for the increase. In the near term, however, the market will remain weak.
PwC 11
Kenya’s hotel market has been declining for three years and we expect a further drop in 2015.
The coastal resorts have been most affected by the drop in tourism and a number of hotels have closed. The Q2 2015 Kenya Tourist Report from BMI expressed concerns that the security situation and the perceived threat of Ebola are hurting the hotel and restaurant industries. The business component of the market, however, is picking up and we expect expansion in that sector to lead to an overall increase beginning in 2016. Growth for the forecast period as a whole will average 4.7% on a compound annual basis.
We expect total room revenue in South Africa to expand at an 8.0% compound annual rate overall and by 8.1% compounded annually for hotels.
Growth in room rates will be the principal driver of revenue growth in South Africa, with new hotels in Cape Town leading the expansion.
Total room revenue in Mauritius will grow at a projected 3.6% compound annual rate, helped by an improving global economy and growth in foreign travel, but competition will keep room rates from expanding at any meaningful degree and we expect Mauritius to be the slowest growing of the four countries over the next five years.
12 The African Traveller – Hospitality outlook: 2015-2019
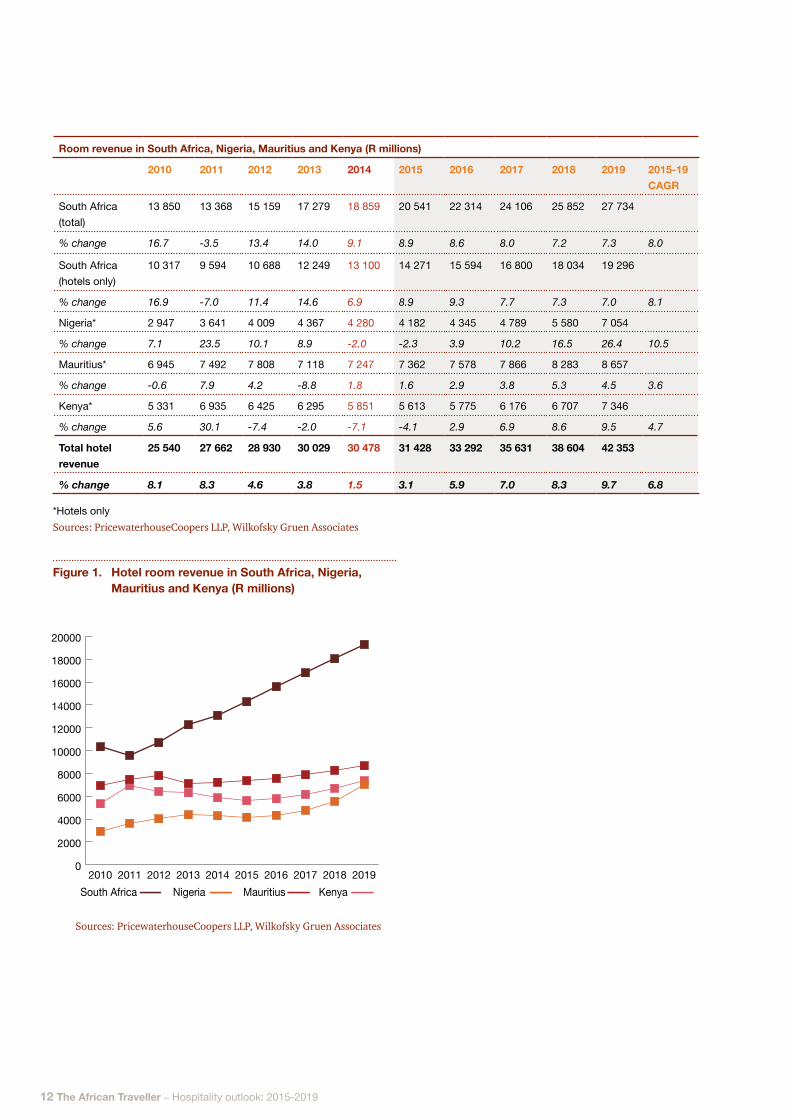
Room revenue in South Africa, Nigeria, Mauritius and Kenya (R millions)
2010 2011 2012 2013 2014 2015 2016 2017 2018 2019 2015-19 CAGR
South Africa (total)
13 850 13 368 15 159 17 279 18 859 20 541 22 314 24 106 25 852 27 734
% change 16.7 -3.5 13.4 14.0 9.1 8.9 8.6 8.0 7.2 7.3 8.0
South Africa (hotels only)
10 317 9 594 10 688 12 249 13 100 14 271 15 594 16 800 18 034 19 296
% change 16.9 -7.0 11.4 14.6 6.9 8.9 9.3 7.7 7.3 7.0 8.1
Nigeria* 2 947 3 641 4 009 4 367 4 280 4 182 4 345 4 789 5 580 7 054
% change 7.1 23.5 10.1 8.9 -2.0 -2.3 3.9 10.2 16.5 26.4 10.5
Mauritius* 6 945 7 492 7 808 7 118 7 247 7 362 7 578 7 866 8 283 8 657
% change -0.6 7.9 4.2 -8.8 1.8 1.6 2.9 3.8 5.3 4.5 3.6
Kenya* 5 331 6 935 6 425 6 295 5 851 5 613 5 775 6 176 6 707 7 346
% change 5.6 30.1 -7.4 -2.0 -7.1 -4.1 2.9 6.9 8.6 9.5 4.7
Total hotel revenue
25 540 27 662 28 930 30 029 30 478 31 428 33 292 35 631 38 604 42 353
% change 8.1 8.3 4.6 3.8 1.5 3.1 5.9 7.0 8.3 9.7 6.8
0
2000
4000
6000
8000
10000
12000
14000
16000
18000
20000
2019201820172016201520142013201220112010South Africa MauritiusNigeria Kenya
*Hotels onlySources: PricewaterhouseCoopers LLP, Wilkofsky Gruen Associates
Figure 1. Hotel room revenue in South Africa, Nigeria, Mauritius and Kenya (R millions)
Sources: PricewaterhouseCoopers LLP, Wilkofsky Gruen Associates

PwC 13
14 The African Traveller – Hospitality outlook: 2015-2019
The accommodation market in South Africa enjoyed its third consecutive year of strong growth with a 9.1% advance following two years of double-digit gains. Spending rose to R18.9 billion in 2014 with rising room rates being the principal driver with a 5.4% increase. This gain, however, was less than the 8.4% increase in 2013.
South Africa
Total accommodation market in South Africa
PwC 15
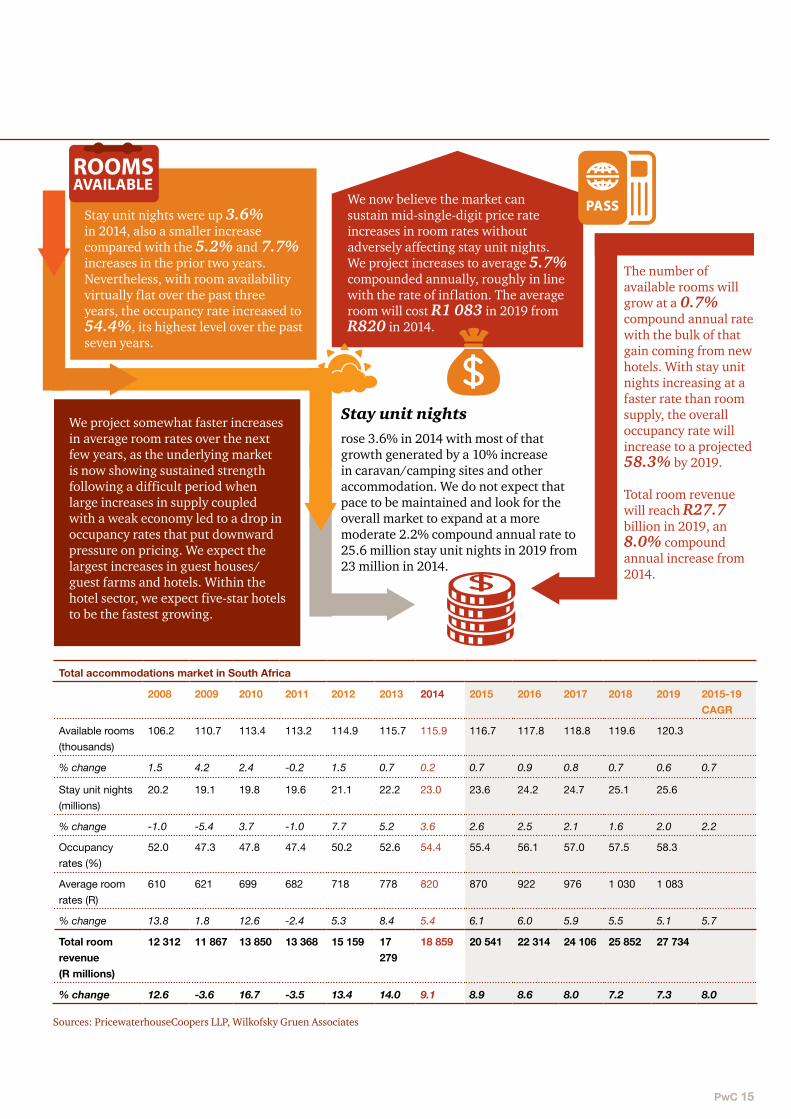
Stay unit nights were up 3.6% in 2014, also a smaller increase compared with the 5.2% and 7.7% increases in the prior two years. Nevertheless, with room availability virtually flat over the past three years, the occupancy rate increased to 54.4%, its highest level over the past seven years.
We now believe the market can sustain mid-single-digit price rate increases in room rates without adversely affecting stay unit nights. We project increases to average 5.7% compounded annually, roughly in line with the rate of inflation. The average room will cost R1 083 in 2019 from R820 in 2014.
The number of available rooms will grow at a 0.7% compound annual rate with the bulk of that gain coming from new hotels. With stay unit nights increasing at a faster rate than room supply, the overall occupancy rate will increase to a projected 58.3% by 2019.
Total room revenue will reach R27.7 billion in 2019, an 8.0% compound annual increase from 2014.
rose 3.6% in 2014 with most of that growth generated by a 10% increase in caravan/camping sites and other accommodation. We do not expect that pace to be maintained and look for the overall market to expand at a more moderate 2.2% compound annual rate to 25.6 million stay unit nights in 2019 from 23 million in 2014.
We project somewhat faster increases in average room rates over the next few years, as the underlying market is now showing sustained strength following a difficult period when large increases in supply coupled with a weak economy led to a drop in occupancy rates that put downward pressure on pricing. We expect the largest increases in guest houses/guest farms and hotels. Within the hotel sector, we expect five-star hotels to be the fastest growing.
Total accommodations market in South Africa
2008 2009 2010 2011 2012 2013 2014 2015 2016 2017 2018 2019 2015-19 CAGR
Available rooms (thousands)
106.2 110.7 113.4 113.2 114.9 115.7 115.9 116.7 117.8 118.8 119.6 120.3
% change 1.5 4.2 2.4 -0.2 1.5 0.7 0.2 0.7 0.9 0.8 0.7 0.6 0.7
Stay unit nights (millions)
20.2 19.1 19.8 19.6 21.1 22.2 23.0 23.6 24.2 24.7 25.1 25.6
% change -1.0 -5.4 3.7 -1.0 7.7 5.2 3.6 2.6 2.5 2.1 1.6 2.0 2.2
Occupancy rates (%)
52.0 47.3 47.8 47.4 50.2 52.6 54.4 55.4 56.1 57.0 57.5 58.3
Average room rates (R)
610 621 699 682 718 778 820 870 922 976 1 030 1 083
% change 13.8 1.8 12.6 -2.4 5.3 8.4 5.4 6.1 6.0 5.9 5.5 5.1 5.7
Total room revenue (R millions)
12 312 11 867 13 850 13 368 15 159 17 279
18 859 20 541 22 314 24 106 25 852 27 734
% change 12.6 -3.6 16.7 -3.5 13.4 14.0 9.1 8.9 8.6 8.0 7.2 7.3 8.0
Sources: PricewaterhouseCoopers LLP, Wilkofsky Gruen Associates
Stay unit nights
16 The African Traveller – Hospitality outlook: 2015-2019
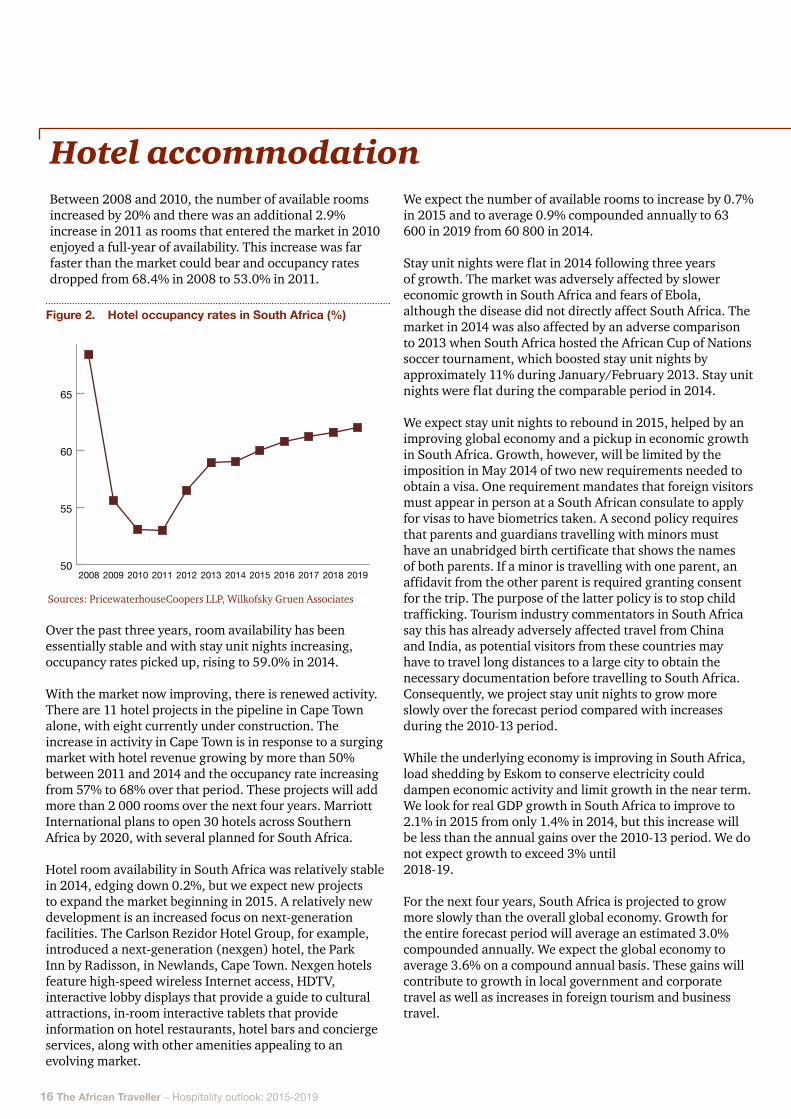
Hotel accommodationBetween 2008 and 2010, the number of available rooms increased by 20% and there was an additional 2.9% increase in 2011 as rooms that entered the market in 2010 enjoyed a full-year of availability. This increase was far faster than the market could bear and occupancy rates dropped from 68.4% in 2008 to 53.0% in 2011.
Over the past three years, room availability has been essentially stable and with stay unit nights increasing, occupancy rates picked up, rising to 59.0% in 2014.
With the market now improving, there is renewed activity. There are 11 hotel projects in the pipeline in Cape Town alone, with eight currently under construction. The increase in activity in Cape Town is in response to a surging market with hotel revenue growing by more than 50% between 2011 and 2014 and the occupancy rate increasing from 57% to 68% over that period. These projects will add more than 2 000 rooms over the next four years. Marriott International plans to open 30 hotels across Southern Africa by 2020, with several planned for South Africa.
Hotel room availability in South Africa was relatively stable in 2014, edging down 0.2%, but we expect new projects to expand the market beginning in 2015. A relatively new development is an increased focus on next-generation facilities. The Carlson Rezidor Hotel Group, for example, introduced a next-generation (nexgen) hotel, the Park Inn by Radisson, in Newlands, Cape Town. Nexgen hotels feature high-speed wireless Internet access, HDTV, interactive lobby displays that provide a guide to cultural attractions, in-room interactive tablets that provide information on hotel restaurants, hotel bars and concierge services, along with other amenities appealing to an evolving market.
Figure 2. Hotel occupancy rates in South Africa (%)
50
55
60
65
70
201920182017201620152014201320122011201020092008
Sources: PricewaterhouseCoopers LLP, Wilkofsky Gruen Associates
We expect the number of available rooms to increase by 0.7% in 2015 and to average 0.9% compounded annually to 63 600 in 2019 from 60 800 in 2014.
Stay unit nights were flat in 2014 following three years of growth. The market was adversely affected by slower economic growth in South Africa and fears of Ebola, although the disease did not directly affect South Africa. The market in 2014 was also affected by an adverse comparison to 2013 when South Africa hosted the African Cup of Nations soccer tournament, which boosted stay unit nights by approximately 11% during January/February 2013. Stay unit nights were flat during the comparable period in 2014.
We expect stay unit nights to rebound in 2015, helped by an improving global economy and a pickup in economic growth in South Africa. Growth, however, will be limited by the imposition in May 2014 of two new requirements needed to obtain a visa. One requirement mandates that foreign visitors must appear in person at a South African consulate to apply for visas to have biometrics taken. A second policy requires that parents and guardians travelling with minors must have an unabridged birth certificate that shows the names of both parents. If a minor is travelling with one parent, an affidavit from the other parent is required granting consent for the trip. The purpose of the latter policy is to stop child trafficking. Tourism industry commentators in South Africa say this has already adversely affected travel from China and India, as potential visitors from these countries may have to travel long distances to a large city to obtain the necessary documentation before travelling to South Africa. Consequently, we project stay unit nights to grow more slowly over the forecast period compared with increases during the 2010-13 period.
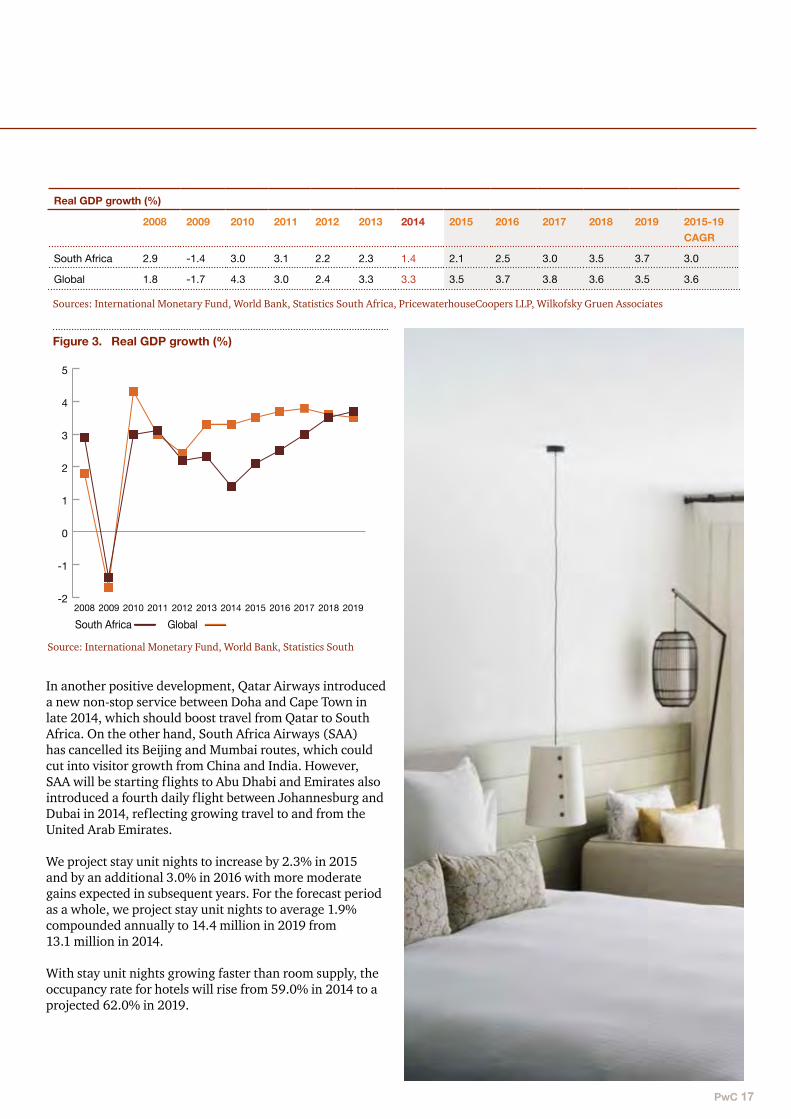
While the underlying economy is improving in South Africa, load shedding by Eskom to conserve electricity could dampen economic activity and limit growth in the near term. We look for real GDP growth in South Africa to improve to 2.1% in 2015 from only 1.4% in 2014, but this increase will be less than the annual gains over the 2010-13 period. We do not expect growth to exceed 3% until 2018-19.
For the next four years, South Africa is projected to grow more slowly than the overall global economy. Growth for the entire forecast period will average an estimated 3.0% compounded annually. We expect the global economy to average 3.6% on a compound annual basis. These gains will contribute to growth in local government and corporate travel as well as increases in foreign tourism and business travel.
PwC 17
Real GDP growth (%)
2008 2009 2010 2011 2012 2013 2014 2015 2016 2017 2018 2019 2015-19 CAGR
South Africa 2.9 -1.4 3.0 3.1 2.2 2.3 1.4 2.1 2.5 3.0 3.5 3.7 3.0
Global 1.8 -1.7 4.3 3.0 2.4 3.3 3.3 3.5 3.7 3.8 3.6 3.5 3.6
Sources: International Monetary Fund, World Bank, Statistics South Africa, PricewaterhouseCoopers LLP, Wilkofsky Gruen Associates
In another positive development, Qatar Airways introduced a new non-stop service between Doha and Cape Town in late 2014, which should boost travel from Qatar to South Africa. On the other hand, South Africa Airways (SAA) has cancelled its Beijing and Mumbai routes, which could cut into visitor growth from China and India. However, SAA will be starting flights to Abu Dhabi and Emirates also introduced a fourth daily flight between Johannesburg and Dubai in 2014, reflecting growing travel to and from the United Arab Emirates.
We project stay unit nights to increase by 2.3% in 2015 and by an additional 3.0% in 2016 with more moderate gains expected in subsequent years. For the forecast period as a whole, we project stay unit nights to average 1.9% compounded annually to 14.4 million in 2019 from 13.1 million in 2014.
With stay unit nights growing faster than room supply, the occupancy rate for hotels will rise from 59.0% in 2014 to a projected 62.0% in 2019.
Figure 3. Real GDP growth (%)
Source: International Monetary Fund, World Bank, Statistics South Africa, PricewaterhouseCoopers LLP, Wilkofsky Gruen Associates
-2
-1
0
1
2
3
4
5
201920182017201620152014201320122011201020092008
South Africa Global
18 The African Traveller – Hospitality outlook: 2015-2019
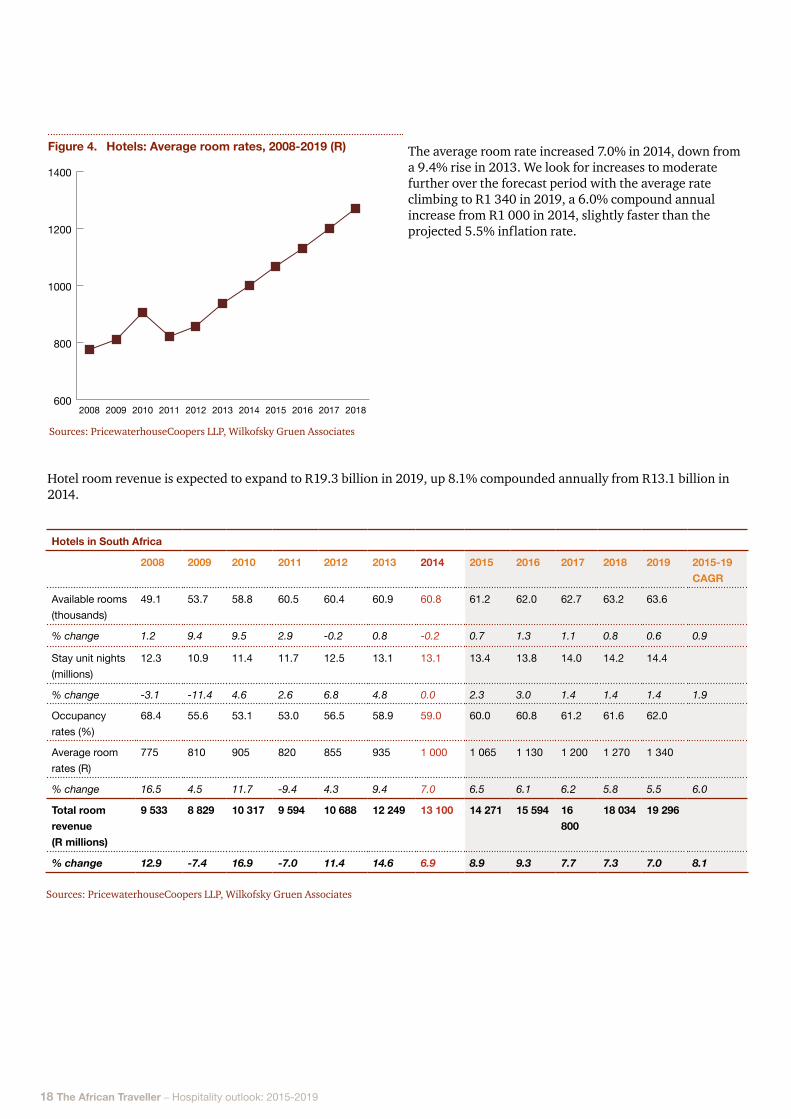
The average room rate increased 7.0% in 2014, down from a 9.4% rise in 2013. We look for increases to moderate further over the forecast period with the average rate climbing to R1 340 in 2019, a 6.0% compound annual increase from R1 000 in 2014, slightly faster than the projected 5.5% inflation rate.
Hotels in South Africa
2008 2009 2010 2011 2012 2013 2014 2015 2016 2017 2018 2019 2015-19 CAGR
Available rooms (thousands)
49.1 53.7 58.8 60.5 60.4 60.9 60.8 61.2 62.0 62.7 63.2 63.6
% change 1.2 9.4 9.5 2.9 -0.2 0.8 -0.2 0.7 1.3 1.1 0.8 0.6 0.9
Stay unit nights (millions)
12.3 10.9 11.4 11.7 12.5 13.1 13.1 13.4 13.8 14.0 14.2 14.4
% change -3.1 -11.4 4.6 2.6 6.8 4.8 0.0 2.3 3.0 1.4 1.4 1.4 1.9
Occupancy rates (%)
68.4 55.6 53.1 53.0 56.5 58.9 59.0 60.0 60.8 61.2 61.6 62.0
Average room rates (R)
775 810 905 820 855 935 1 000 1 065 1 130 1 200 1 270 1 340
% change 16.5 4.5 11.7 -9.4 4.3 9.4 7.0 6.5 6.1 6.2 5.8 5.5 6.0
Total room revenue (R millions)
9 533 8 829 10 317 9 594 10 688 12 249 13 100 14 271 15 594 16 800
18 034 19 296
% change 12.9 -7.4 16.9 -7.0 11.4 14.6 6.9 8.9 9.3 7.7 7.3 7.0 8.1
Sources: PricewaterhouseCoopers LLP, Wilkofsky Gruen Associates
Figure 4. Hotels: Average room rates, 2008-2019 (R)
Sources: PricewaterhouseCoopers LLP, Wilkofsky Gruen Associates
600
800
1000
1200
1400
20182017201620152014201320122011201020092008
Hotel room revenue is expected to expand to R19.3 billion in 2019, up 8.1% compounded annually from R13.1 billion in 2014.
PwC 19
Three-star hotels
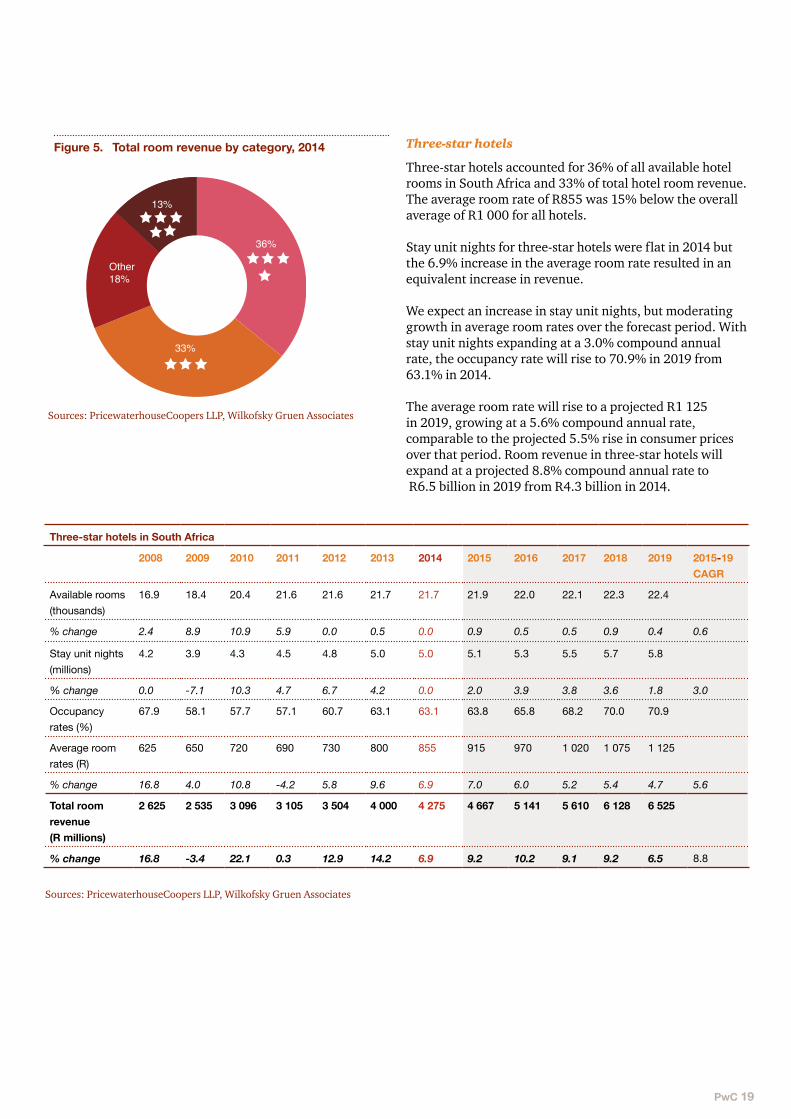
Three-star hotels accounted for 36% of all available hotel rooms in South Africa and 33% of total hotel room revenue. The average room rate of R855 was 15% below the overall average of R1 000 for all hotels.
Stay unit nights for three-star hotels were flat in 2014 but the 6.9% increase in the average room rate resulted in an equivalent increase in revenue.
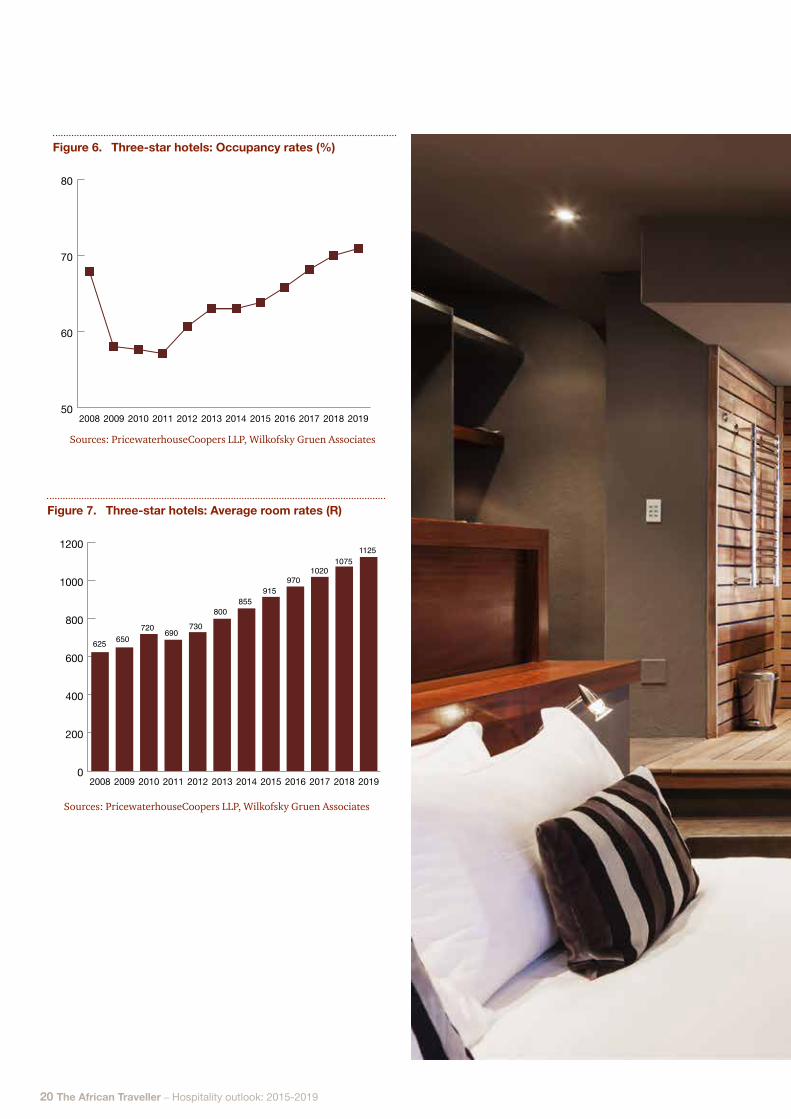
We expect an increase in stay unit nights, but moderating growth in average room rates over the forecast period. With stay unit nights expanding at a 3.0% compound annual rate, the occupancy rate will rise to 70.9% in 2019 from 63.1% in 2014.
The average room rate will rise to a projected R1 125 in 2019, growing at a 5.6% compound annual rate, comparable to the projected 5.5% rise in consumer prices over that period. Room revenue in three-star hotels will expand at a projected 8.8% compound annual rate to R6.5 billion in 2019 from R4.3 billion in 2014.
Three-star hotels in South Africa
2008 2009 2010 2011 2012 2013 2014 2015 2016 2017 2018 2019 2015-19 CAGR
Available rooms (thousands)
16.9 18.4 20.4 21.6 21.6 21.7 21.7 21.9 22.0 22.1 22.3 22.4
% change 2.4 8.9 10.9 5.9 0.0 0.5 0.0 0.9 0.5 0.5 0.9 0.4 0.6
Stay unit nights (millions)
4.2 3.9 4.3 4.5 4.8 5.0 5.0 5.1 5.3 5.5 5.7 5.8
% change 0.0 -7.1 10.3 4.7 6.7 4.2 0.0 2.0 3.9 3.8 3.6 1.8 3.0
Occupancy rates (%)
67.9 58.1 57.7 57.1 60.7 63.1 63.1 63.8 65.8 68.2 70.0 70.9
Average room rates (R)
625 650 720 690 730 800 855 915 970 1 020 1 075 1 125
% change 16.8 4.0 10.8 -4.2 5.8 9.6 6.9 7.0 6.0 5.2 5.4 4.7 5.6
Total room revenue (R millions)
2 625 2 535 3 096 3 105 3 504 4 000 4 275 4 667 5 141 5 610 6 128 6 525
% change 16.8 -3.4 22.1 0.3 12.9 14.2 6.9 9.2 10.2 9.1 9.2 6.5 8.8
Sources: PricewaterhouseCoopers LLP, Wilkofsky Gruen Associates
Sources: PricewaterhouseCoopers LLP, Wilkofsky Gruen Associates
Figure 5. Total room revenue by category, 2014
13%
Other18%
33%
36%
20 The African Traveller – Hospitality outlook: 2015-2019
Figure 6. Three-star hotels: Occupancy rates (%)
Sources: PricewaterhouseCoopers LLP, Wilkofsky Gruen Associates
50
60
70
80
201920182017201620152014201320122011201020092008
Sources: PricewaterhouseCoopers LLP, Wilkofsky Gruen Associates
Figure 7. Three-star hotels: Average room rates (R)
0
200
400
600
800
1000
1200
201920182017201620152014201320122011201020092008
625 650720 690
730
800855
915970
10201075
1125
PwC 21
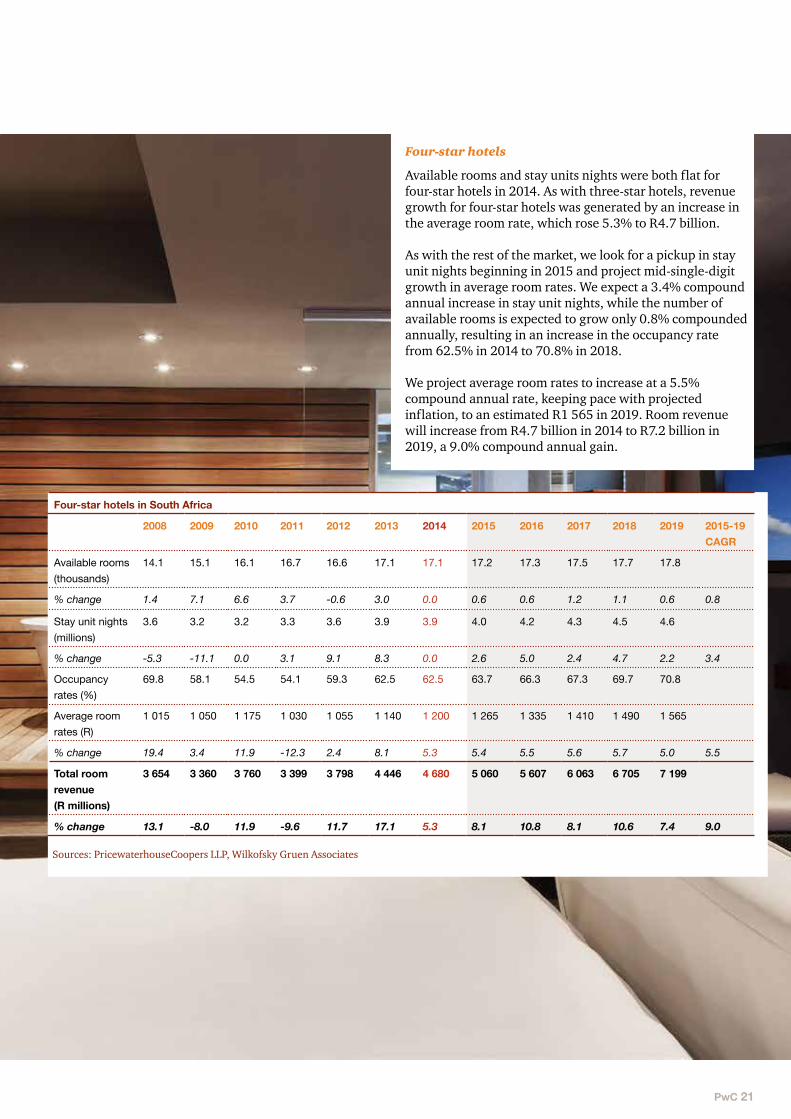
Four-star hotels
Available rooms and stay units nights were both flat for four-star hotels in 2014. As with three-star hotels, revenue growth for four-star hotels was generated by an increase in the average room rate, which rose 5.3% to R4.7 billion.
As with the rest of the market, we look for a pickup in stay unit nights beginning in 2015 and project mid-single-digit growth in average room rates. We expect a 3.4% compound annual increase in stay unit nights, while the number of available rooms is expected to grow only 0.8% compounded annually, resulting in an increase in the occupancy rate from 62.5% in 2014 to 70.8% in 2018.
We project average room rates to increase at a 5.5% compound annual rate, keeping pace with projected inflation, to an estimated R1 565 in 2019. Room revenue will increase from R4.7 billion in 2014 to R7.2 billion in 2019, a 9.0% compound annual gain.
Four-star hotels in South Africa
2008 2009 2010 2011 2012 2013 2014 2015 2016 2017 2018 2019 2015-19 CAGR
Available rooms (thousands)
14.1 15.1 16.1 16.7 16.6 17.1 17.1 17.2 17.3 17.5 17.7 17.8
% change 1.4 7.1 6.6 3.7 -0.6 3.0 0.0 0.6 0.6 1.2 1.1 0.6 0.8
Stay unit nights (millions)
3.6 3.2 3.2 3.3 3.6 3.9 3.9 4.0 4.2 4.3 4.5 4.6
% change -5.3 -11.1 0.0 3.1 9.1 8.3 0.0 2.6 5.0 2.4 4.7 2.2 3.4
Occupancy rates (%)
69.8 58.1 54.5 54.1 59.3 62.5 62.5 63.7 66.3 67.3 69.7 70.8
Average room rates (R)
1 015 1 050 1 175 1 030 1 055 1 140 1 200 1 265 1 335 1 410 1 490 1 565
% change 19.4 3.4 11.9 -12.3 2.4 8.1 5.3 5.4 5.5 5.6 5.7 5.0 5.5
Total room revenue (R millions)
3 654 3 360 3 760 3 399 3 798 4 446 4 680 5 060 5 607 6 063 6 705 7 199
% change 13.1 -8.0 11.9 -9.6 11.7 17.1 5.3 8.1 10.8 8.1 10.6 7.4 9.0
Sources: PricewaterhouseCoopers LLP, Wilkofsky Gruen Associates
22 The African Traveller – Hospitality outlook: 2015-2019
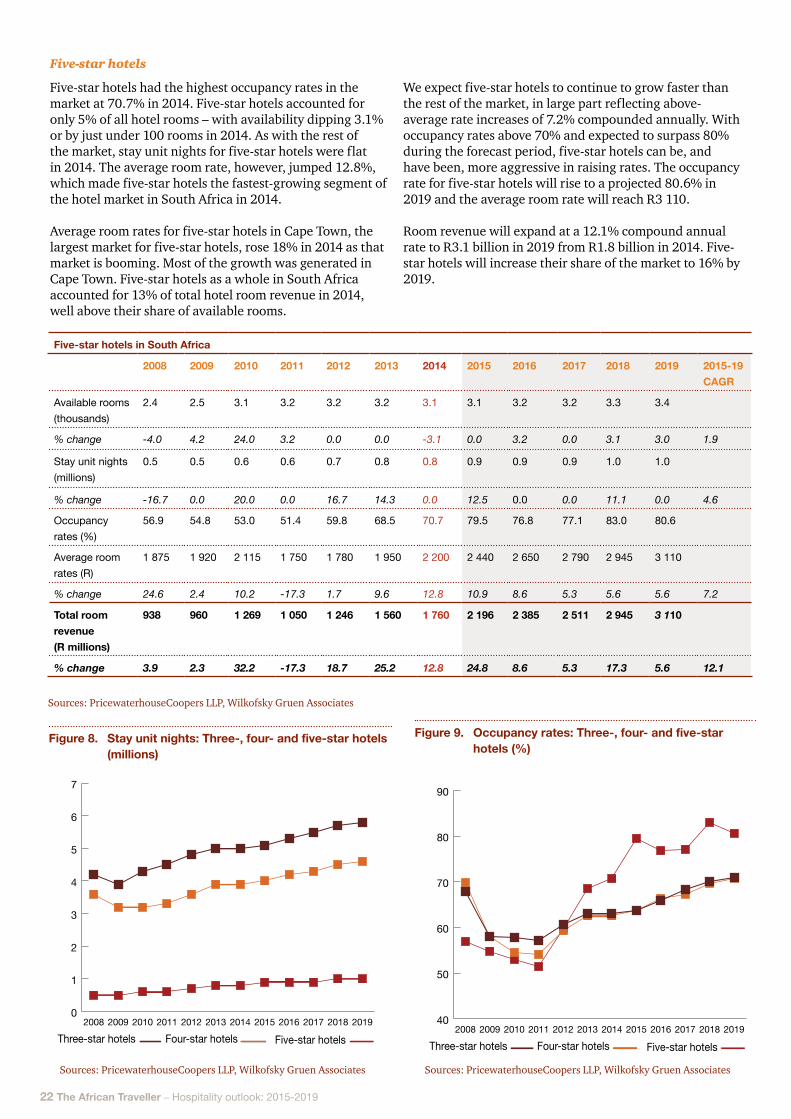
Five-star hotels
Five-star hotels had the highest occupancy rates in the market at 70.7% in 2014. Five-star hotels accounted for only 5% of all hotel rooms – with availability dipping 3.1% or by just under 100 rooms in 2014. As with the rest of the market, stay unit nights for five-star hotels were flat in 2014. The average room rate, however, jumped 12.8%, which made five-star hotels the fastest-growing segment of the hotel market in South Africa in 2014.
Average room rates for five-star hotels in Cape Town, the largest market for five-star hotels, rose 18% in 2014 as that market is booming. Most of the growth was generated in Cape Town. Five-star hotels as a whole in South Africa accounted for 13% of total hotel room revenue in 2014, well above their share of available rooms.
We expect five-star hotels to continue to grow faster than the rest of the market, in large part reflecting above-average rate increases of 7.2% compounded annually. With occupancy rates above 70% and expected to surpass 80% during the forecast period, five-star hotels can be, and have been, more aggressive in raising rates. The occupancy rate for five-star hotels will rise to a projected 80.6% in 2019 and the average room rate will reach R3 110.
Room revenue will expand at a 12.1% compound annual rate to R3.1 billion in 2019 from R1.8 billion in 2014. Five-star hotels will increase their share of the market to 16% by 2019.
Five-star hotels in South Africa
2008 2009 2010 2011 2012 2013 2014 2015 2016 2017 2018 2019 2015-19 CAGR
Available rooms (thousands)
2.4 2.5 3.1 3.2 3.2 3.2 3.1 3.1 3.2 3.2 3.3 3.4
% change -4.0 4.2 24.0 3.2 0.0 0.0 -3.1 0.0 3.2 0.0 3.1 3.0 1.9
Stay unit nights (millions)
0.5 0.5 0.6 0.6 0.7 0.8 0.8 0.9 0.9 0.9 1.0 1.0
% change -16.7 0.0 20.0 0.0 16.7 14.3 0.0 12.5 0.0 0.0 11.1 0.0 4.6
Occupancy rates (%)
56.9 54.8 53.0 51.4 59.8 68.5 70.7 79.5 76.8 77.1 83.0 80.6
Average room rates (R)
1 875 1 920 2 115 1 750 1 780 1 950 2 200 2 440 2 650 2 790 2 945 3 110
% change 24.6 2.4 10.2 -17.3 1.7 9.6 12.8 10.9 8.6 5.3 5.6 5.6 7.2
Total room revenue (R millions)
938 960 1 269 1 050 1 246 1 560 1 760 2 196 2 385 2 511 2 945 3 110
% change 3.9 2.3 32.2 -17.3 18.7 25.2 12.8 24.8 8.6 5.3 17.3 5.6 12.1
Sources: PricewaterhouseCoopers LLP, Wilkofsky Gruen Associates
Figure 8. Stay unit nights: Three-, four- and five-star hotels (millions)
0
1
2
3
4
5
6
7
201920182017201620152014201320122011201020092008
Three-star hotels Four-star hotels Five-star hotels
Sources: PricewaterhouseCoopers LLP, Wilkofsky Gruen Associates
Figure 9. Occupancy rates: Three-, four- and five-star hotels (%)
40
50
60
70
80
90
201920182017201620152014201320122011201020092008
Three-star hotels Four-star hotels Five-star hotels
Sources: PricewaterhouseCoopers LLP, Wilkofsky Gruen Associates
PwC 23
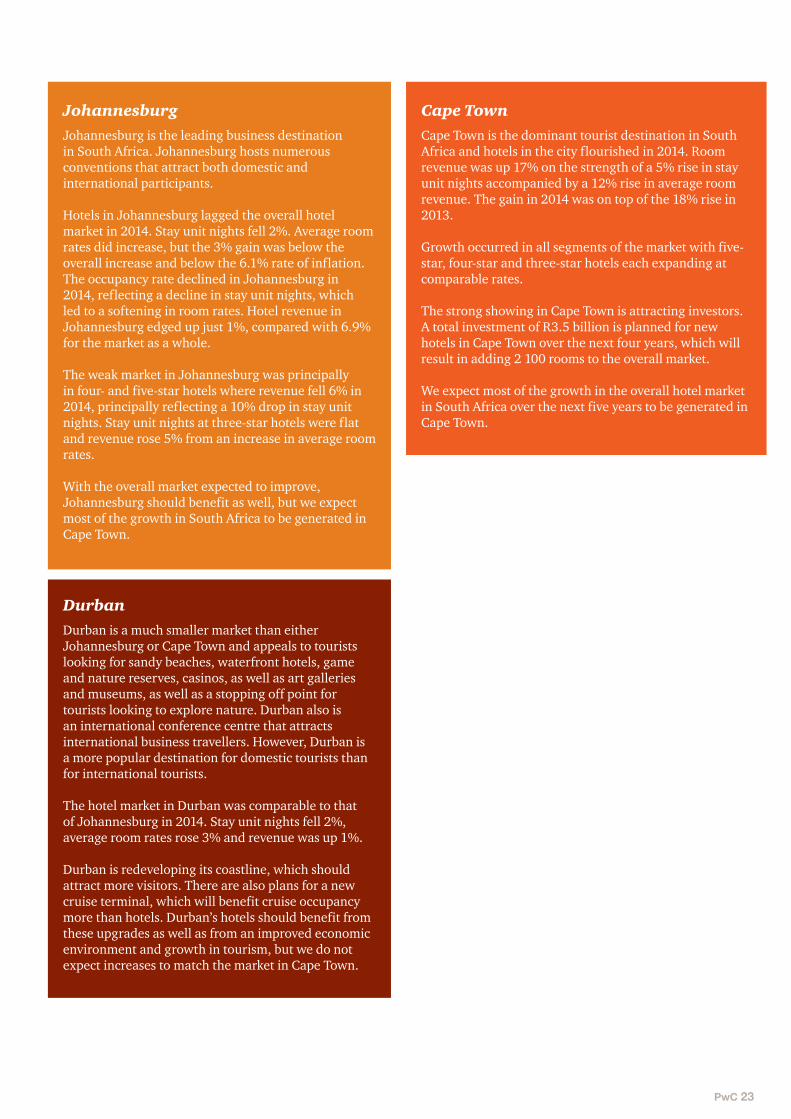
JohannesburgJohannesburg is the leading business destination in South Africa. Johannesburg hosts numerous conventions that attract both domestic and international participants.
Hotels in Johannesburg lagged the overall hotel market in 2014. Stay unit nights fell 2%. Average room rates did increase, but the 3% gain was below the overall increase and below the 6.1% rate of inflation. The occupancy rate declined in Johannesburg in 2014, reflecting a decline in stay unit nights, which led to a softening in room rates. Hotel revenue in Johannesburg edged up just 1%, compared with 6.9% for the market as a whole.
The weak market in Johannesburg was principally in four- and five-star hotels where revenue fell 6% in 2014, principally reflecting a 10% drop in stay unit nights. Stay unit nights at three-star hotels were flat and revenue rose 5% from an increase in average room rates.
With the overall market expected to improve, Johannesburg should benefit as well, but we expect most of the growth in South Africa to be generated in Cape Town.
Cape TownCape Town is the dominant tourist destination in South Africa and hotels in the city flourished in 2014. Room revenue was up 17% on the strength of a 5% rise in stay unit nights accompanied by a 12% rise in average room revenue. The gain in 2014 was on top of the 18% rise in 2013.
Growth occurred in all segments of the market with five-star, four-star and three-star hotels each expanding at comparable rates.
The strong showing in Cape Town is attracting investors. A total investment of R3.5 billion is planned for new hotels in Cape Town over the next four years, which will result in adding 2 100 rooms to the overall market.
We expect most of the growth in the overall hotel market in South Africa over the next five years to be generated in Cape Town.
DurbanDurban is a much smaller market than either Johannesburg or Cape Town and appeals to tourists looking for sandy beaches, waterfront hotels, game and nature reserves, casinos, as well as art galleries and museums, as well as a stopping off point for tourists looking to explore nature. Durban also is an international conference centre that attracts international business travellers. However, Durban is a more popular destination for domestic tourists than for international tourists.
The hotel market in Durban was comparable to that of Johannesburg in 2014. Stay unit nights fell 2%, average room rates rose 3% and revenue was up 1%.
Durban is redeveloping its coastline, which should attract more visitors. There are also plans for a new cruise terminal, which will benefit cruise occupancy more than hotels. Durban’s hotels should benefit from these upgrades as well as from an improved economic environment and growth in tourism, but we do not expect increases to match the market in Cape Town.
24 The African Traveller – Hospitality outlook: 2015-2019
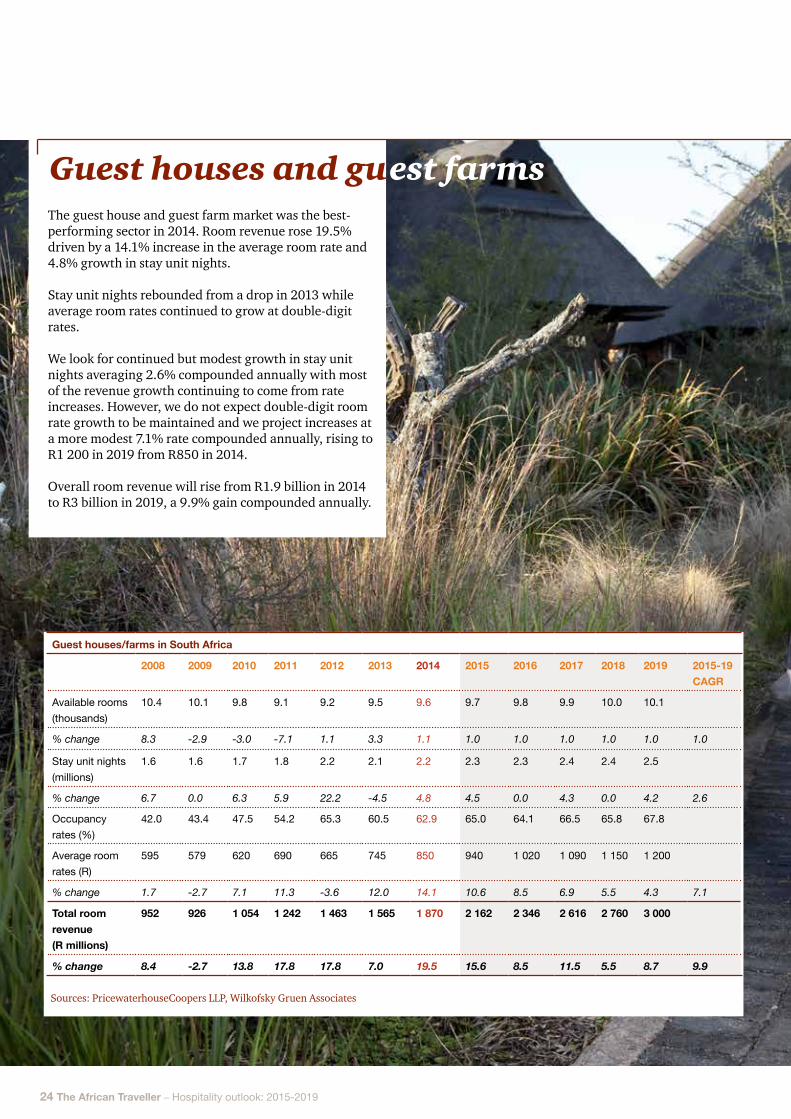
Guest houses/farms in South Africa
2008 2009 2010 2011 2012 2013 2014 2015 2016 2017 2018 2019 2015-19 CAGR
Available rooms (thousands)
10.4 10.1 9.8 9.1 9.2 9.5 9.6 9.7 9.8 9.9 10.0 10.1
% change 8.3 -2.9 -3.0 -7.1 1.1 3.3 1.1 1.0 1.0 1.0 1.0 1.0 1.0
Stay unit nights (millions)
1.6 1.6 1.7 1.8 2.2 2.1 2.2 2.3 2.3 2.4 2.4 2.5
% change 6.7 0.0 6.3 5.9 22.2 -4.5 4.8 4.5 0.0 4.3 0.0 4.2 2.6
Occupancy rates (%)
42.0 43.4 47.5 54.2 65.3 60.5 62.9 65.0 64.1 66.5 65.8 67.8
Average room rates (R)
595 579 620 690 665 745 850 940 1 020 1 090 1 150 1 200
% change 1.7 -2.7 7.1 11.3 -3.6 12.0 14.1 10.6 8.5 6.9 5.5 4.3 7.1
Total room revenue (R millions)
952 926 1 054 1 242 1 463 1 565 1 870 2 162 2 346 2 616 2 760 3 000
% change 8.4 -2.7 13.8 17.8 17.8 7.0 19.5 15.6 8.5 11.5 5.5 8.7 9.9
Sources: PricewaterhouseCoopers LLP, Wilkofsky Gruen Associates
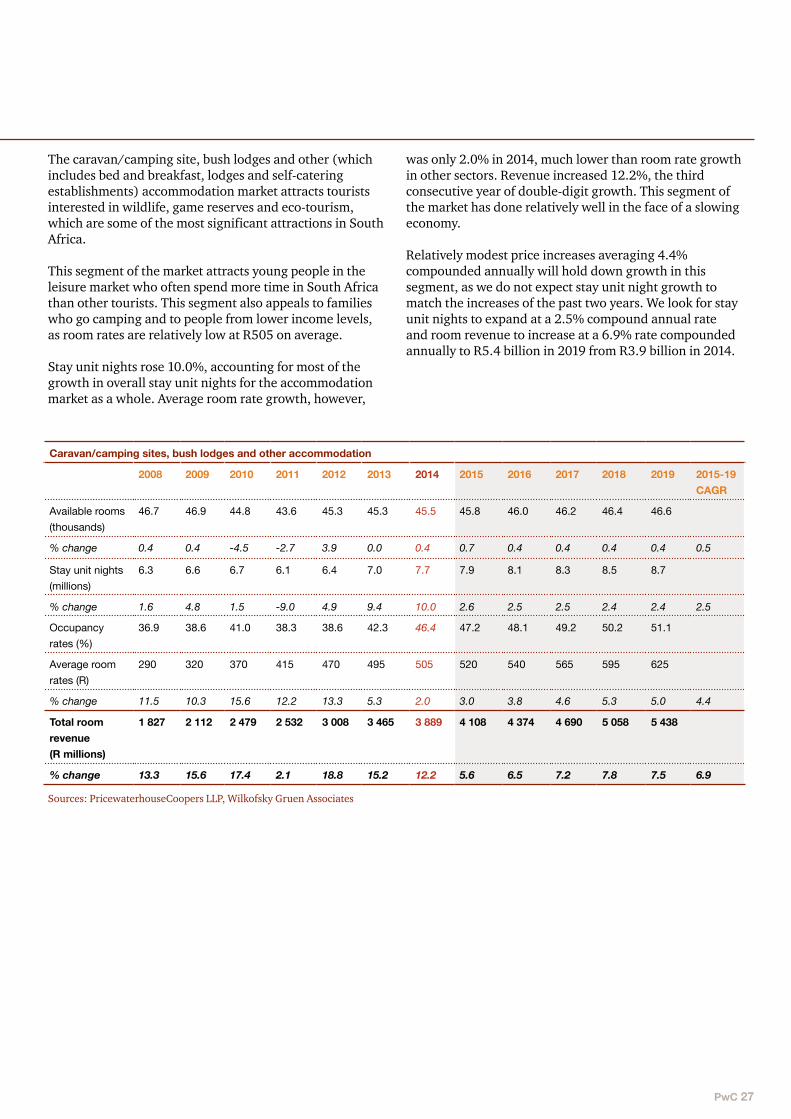
The guest house and guest farm market was the best-performing sector in 2014. Room revenue rose 19.5% driven by a 14.1% increase in the average room rate and 4.8% growth in stay unit nights.
Stay unit nights rebounded from a drop in 2013 while average room rates continued to grow at double-digit rates.
We look for continued but modest growth in stay unit nights averaging 2.6% compounded annually with most of the revenue growth continuing to come from rate increases. However, we do not expect double-digit room rate growth to be maintained and we project increases at a more modest 7.1% rate compounded annually, rising to R1 200 in 2019 from R850 in 2014.
Overall room revenue will rise from R1.9 billion in 2014 to R3 billion in 2019, a 9.9% gain compounded annually.
Guest houses and guest farms
PwC 25
Caravan/camping
Figure 10. Guest houses/farms: Average room rates (R)
0
200
400
600
800
1000
1200
1400
201920182017201620152014201320122011201020092008
595 579620
690 665745
850
9401020
10901150
1200
Sources: PricewaterhouseCoopers LLP, Wilkofsky Gruen Associates
Figure 11. Guest houses/farms: Stay unit nights and total room revenue
0,0
0,5
1,0
1,5
2,0
2,5
3,0
3,5
201920182017201620152014201320122011201020092008
Stay unit (milliions) Total room revenue (R billions)
Sources: PricewaterhouseCoopers LLP, Wilkofsky Gruen Associates

26 The African Traveller – Hospitality outlook: 2015-2019
Caravan/camping sites, bush lodges and other accommodation
PwC 27
The caravan/camping site, bush lodges and other (which includes bed and breakfast, lodges and self-catering establishments) accommodation market attracts tourists interested in wildlife, game reserves and eco-tourism, which are some of the most significant attractions in South Africa.
This segment of the market attracts young people in the leisure market who often spend more time in South Africa than other tourists. This segment also appeals to families who go camping and to people from lower income levels, as room rates are relatively low at R505 on average.
Stay unit nights rose 10.0%, accounting for most of the growth in overall stay unit nights for the accommodation market as a whole. Average room rate growth, however,
Caravan/camping sites, bush lodges and other accommodation
2008 2009 2010 2011 2012 2013 2014 2015 2016 2017 2018 2019 2015-19 CAGR
Available rooms (thousands)
46.7 46.9 44.8 43.6 45.3 45.3 45.5 45.8 46.0 46.2 46.4 46.6
% change 0.4 0.4 -4.5 -2.7 3.9 0.0 0.4 0.7 0.4 0.4 0.4 0.4 0.5
Stay unit nights (millions)
6.3 6.6 6.7 6.1 6.4 7.0 7.7 7.9 8.1 8.3 8.5 8.7
% change 1.6 4.8 1.5 -9.0 4.9 9.4 10.0 2.6 2.5 2.5 2.4 2.4 2.5
Occupancy rates (%)
36.9 38.6 41.0 38.3 38.6 42.3 46.4 47.2 48.1 49.2 50.2 51.1
Average room rates (R)
290 320 370 415 470 495 505 520 540 565 595 625
% change 11.5 10.3 15.6 12.2 13.3 5.3 2.0 3.0 3.8 4.6 5.3 5.0 4.4
Total room revenue (R millions)
1 827 2 112 2 479 2 532 3 008 3 465 3 889 4 108 4 374 4 690 5 058 5 438
% change 13.3 15.6 17.4 2.1 18.8 15.2 12.2 5.6 6.5 7.2 7.8 7.5 6.9
Sources: PricewaterhouseCoopers LLP, Wilkofsky Gruen Associates
was only 2.0% in 2014, much lower than room rate growth in other sectors. Revenue increased 12.2%, the third consecutive year of double-digit growth. This segment of the market has done relatively well in the face of a slowing economy.
Relatively modest price increases averaging 4.4% compounded annually will hold down growth in this segment, as we do not expect stay unit night growth to match the increases of the past two years. We look for stay unit nights to expand at a 2.5% compound annual rate and room revenue to increase at a 6.9% rate compounded annually to R5.4 billion in 2019 from R3.9 billion in 2014.
28 The African Traveller – Hospitality outlook: 2015-2019
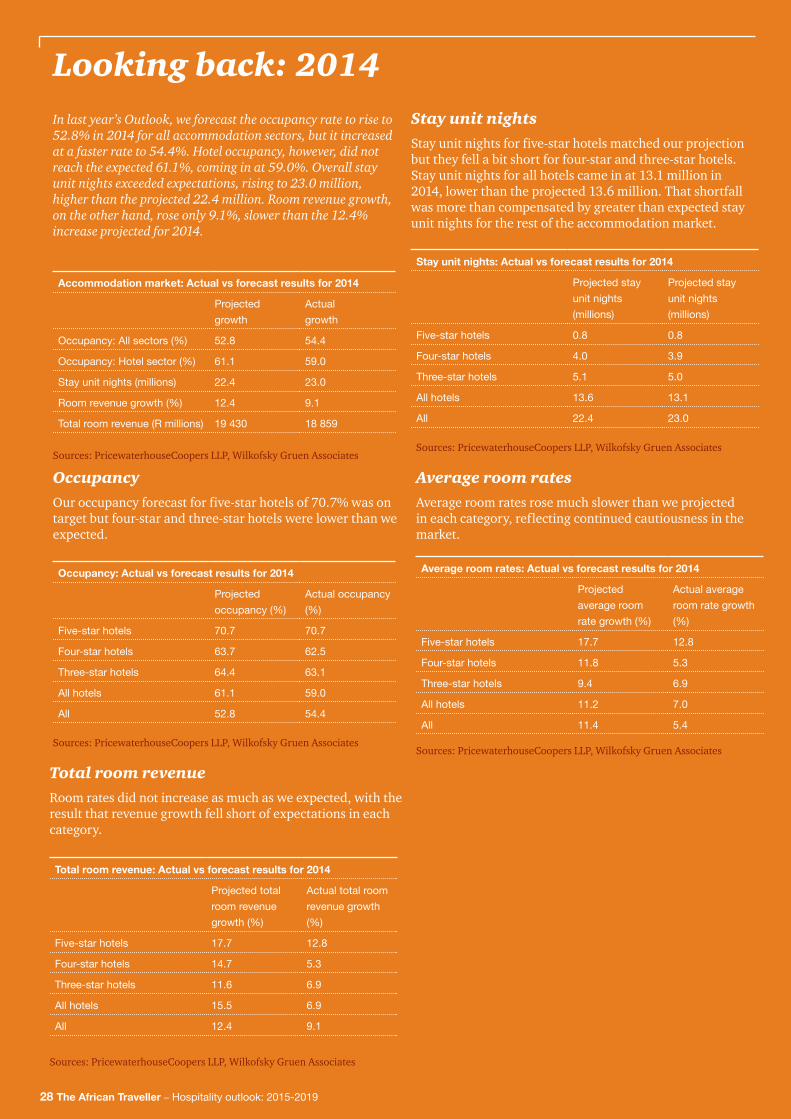
Looking back: 2014In last year’s Outlook, we forecast the occupancy rate to rise to 52.8% in 2014 for all accommodation sectors, but it increased at a faster rate to 54.4%. Hotel occupancy, however, did not reach the expected 61.1%, coming in at 59.0%. Overall stay unit nights exceeded expectations, rising to 23.0 million, higher than the projected 22.4 million. Room revenue growth, on the other hand, rose only 9.1%, slower than the 12.4% increase projected for 2014.
Accommodation market: Actual vs forecast results for 2014
Projectedgrowth
Actualgrowth
Occupancy: All sectors (%) 52.8 54.4
Occupancy: Hotel sector (%) 61.1 59.0
Stay unit nights (millions) 22.4 23.0
Room revenue growth (%) 12.4 9.1
Total room revenue (R millions) 19 430 18 859
Sources: PricewaterhouseCoopers LLP, Wilkofsky Gruen Associates
OccupancyOur occupancy forecast for five-star hotels of 70.7% was on target but four-star and three-star hotels were lower than we expected.
Occupancy: Actual vs forecast results for 2014
Projected occupancy (%)
Actual occupancy (%)
Five-star hotels 70.7 70.7
Four-star hotels 63.7 62.5
Three-star hotels 64.4 63.1
All hotels 61.1 59.0
All 52.8 54.4
Sources: PricewaterhouseCoopers LLP, Wilkofsky Gruen Associates
Stay unit nightsStay unit nights for five-star hotels matched our projection but they fell a bit short for four-star and three-star hotels. Stay unit nights for all hotels came in at 13.1 million in 2014, lower than the projected 13.6 million. That shortfall was more than compensated by greater than expected stay unit nights for the rest of the accommodation market.
Stay unit nights: Actual vs forecast results for 2014
Projected stay unit nights (millions)
Projected stay unit nights (millions)
Five-star hotels 0.8 0.8
Four-star hotels 4.0 3.9
Three-star hotels 5.1 5.0
All hotels 13.6 13.1
All 22.4 23.0
Sources: PricewaterhouseCoopers LLP, Wilkofsky Gruen Associates
Average room ratesAverage room rates rose much slower than we projected in each category, reflecting continued cautiousness in the market.
Average room rates: Actual vs forecast results for 2014
Projected average room rate growth (%)
Actual average room rate growth (%)
Five-star hotels 17.7 12.8
Four-star hotels 11.8 5.3
Three-star hotels 9.4 6.9
All hotels 11.2 7.0
All 11.4 5.4
Sources: PricewaterhouseCoopers LLP, Wilkofsky Gruen Associates
Total room revenueRoom rates did not increase as much as we expected, with the result that revenue growth fell short of expectations in each category.
Total room revenue: Actual vs forecast results for 2014
Projected total room revenue growth (%)
Actual total room revenue growth (%)
Five-star hotels 17.7 12.8
Four-star hotels 14.7 5.3
Three-star hotels 11.6 6.9
All hotels 15.5 6.9
All 12.4 9.1
Sources: PricewaterhouseCoopers LLP, Wilkofsky Gruen Associates
PwC 29
Outlook: 2015-2019
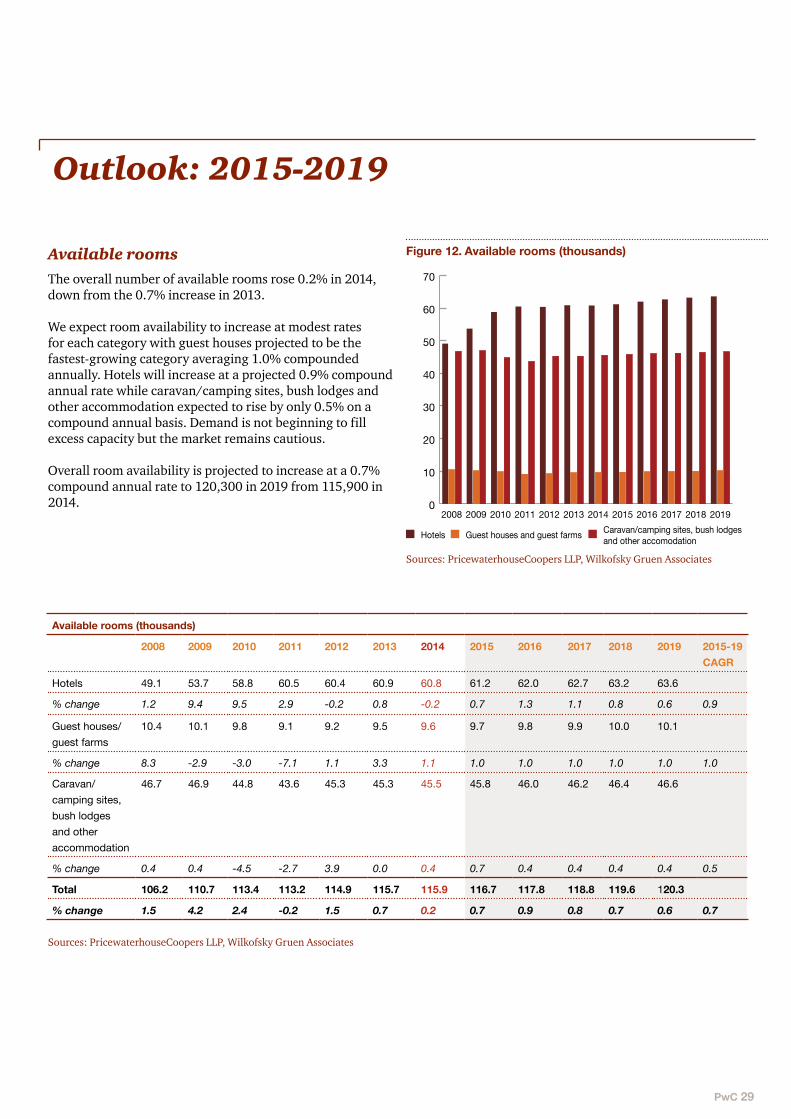
Available roomsThe overall number of available rooms rose 0.2% in 2014, down from the 0.7% increase in 2013.
We expect room availability to increase at modest rates for each category with guest houses projected to be the fastest-growing category averaging 1.0% compounded annually. Hotels will increase at a projected 0.9% compound annual rate while caravan/camping sites, bush lodges and other accommodation expected to rise by only 0.5% on a compound annual basis. Demand is not beginning to fill excess capacity but the market remains cautious.
Overall room availability is projected to increase at a 0.7% compound annual rate to 120,300 in 2019 from 115,900 in 2014.
Figure 12. Available rooms (thousands)
0
10
20
30
40
50
60
70
201920182017201620152014201320122011201020092008
Hotels Guest houses and guest farms Caravan/camping sites, bush lodges and other accomodation
Sources: PricewaterhouseCoopers LLP, Wilkofsky Gruen Associates
Sources: PricewaterhouseCoopers LLP, Wilkofsky Gruen Associates
Available rooms (thousands)
2008 2009 2010 2011 2012 2013 2014 2015 2016 2017 2018 2019 2015-19 CAGR
Hotels 49.1 53.7 58.8 60.5 60.4 60.9 60.8 61.2 62.0 62.7 63.2 63.6
% change 1.2 9.4 9.5 2.9 -0.2 0.8 -0.2 0.7 1.3 1.1 0.8 0.6 0.9
Guest houses/guest farms
10.4 10.1 9.8 9.1 9.2 9.5 9.6 9.7 9.8 9.9 10.0 10.1
% change 8.3 -2.9 -3.0 -7.1 1.1 3.3 1.1 1.0 1.0 1.0 1.0 1.0 1.0
Caravan/camping sites, bush lodges and other accommodation
46.7 46.9 44.8 43.6 45.3 45.3 45.5 45.8 46.0 46.2 46.4 46.6
% change 0.4 0.4 -4.5 -2.7 3.9 0.0 0.4 0.7 0.4 0.4 0.4 0.4 0.5
Total 106.2 110.7 113.4 113.2 114.9 115.7 115.9 116.7 117.8 118.8 119.6 120.3
% change 1.5 4.2 2.4 -0.2 1.5 0.7 0.2 0.7 0.9 0.8 0.7 0.6 0.7
30 The African Traveller – Hospitality outlook: 2015-2019
Sources: PricewaterhouseCoopers LLP, Wilkofsky Gruen Associates
Stay unit nights (millions)
2008 2009 2010 2011 2012 2013 2014 2015 2016 2017 2018 2019 2015-19 CAGR
Hotels 12.3 10.9 11.4 11.7 12.5 13.1 13.1 13.4 13.8 14.0 14.2 14.4
% change -3.1 -11.4 4.6 2.6 6.8 4.8 0.0 2.3 3.0 1.4 1.4 1.4 1.9
Guest houses/guest farms
1.6 1.6 1.7 1.8 2.2 2.1 2.2 2.3 2.3 2.4 2.4 2.5
% change 6.7 0.0 6.3 5.9 22.2 -4.5 4.8 4.5 0.0 4.3 0.0 4.2 2.6
Caravan/camping sites, bush lodges and other accommodation
6.3 6.6 6.7 6.1 6.4 7.0 7.7 7.9 8.1 8.3 8.5 8.7
% change 1.6 4.8 1.5 -9.0 4.9 9.4 10.0 2.6 2.5 2.5 2.4 2.4 2.5
Total 20.2 19.1 19.8 19.6 21.1 22.2 23.0 23.6 24.2 24.7 25.1 25.6
% change -1.0 -5.4 3.7 -1.0 7.7 5.2 3.6 2.6 2.5 2.1 1.6 2.0 2.2
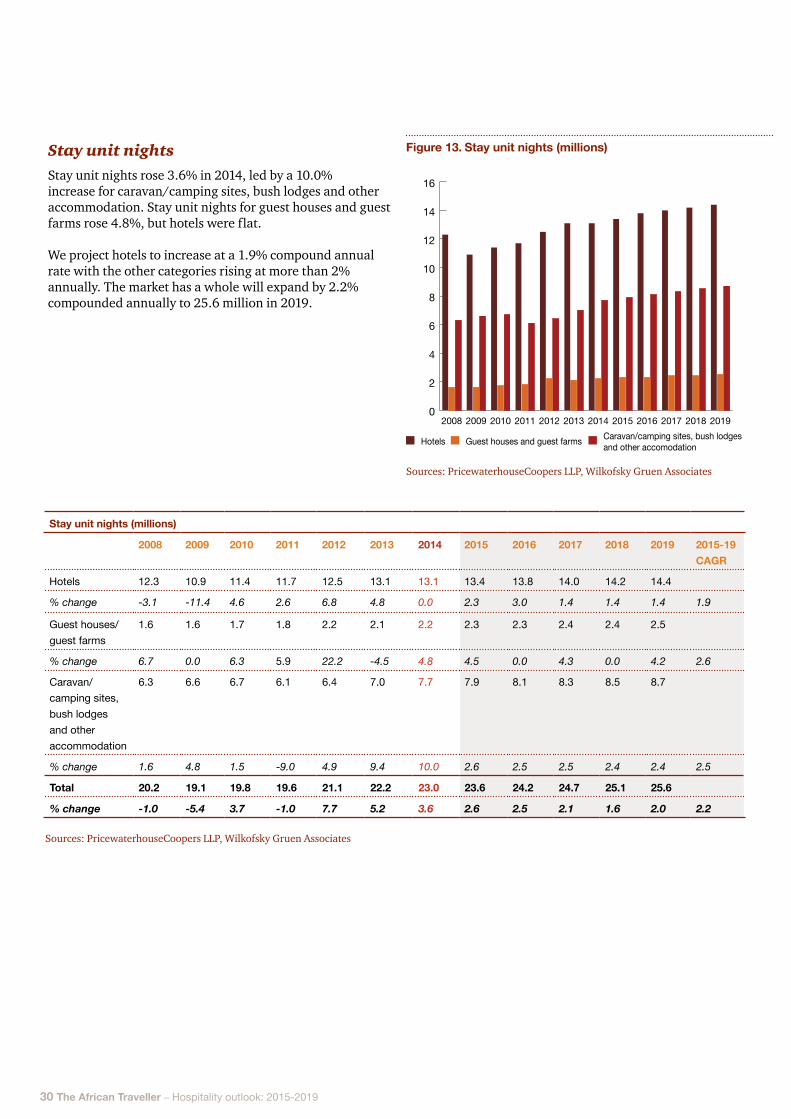
Stay unit nightsStay unit nights rose 3.6% in 2014, led by a 10.0% increase for caravan/camping sites, bush lodges and other accommodation. Stay unit nights for guest houses and guest farms rose 4.8%, but hotels were flat.
We project hotels to increase at a 1.9% compound annual rate with the other categories rising at more than 2% annually. The market has a whole will expand by 2.2% compounded annually to 25.6 million in 2019.
Figure 13. Stay unit nights (millions)
0
2
4
6
8
10
12
14
16
201920182017201620152014201320122011201020092008
Hotels Guest houses and guest farms Caravan/camping sites, bush lodges and other accomodation
Sources: PricewaterhouseCoopers LLP, Wilkofsky Gruen Associates
PwC 31
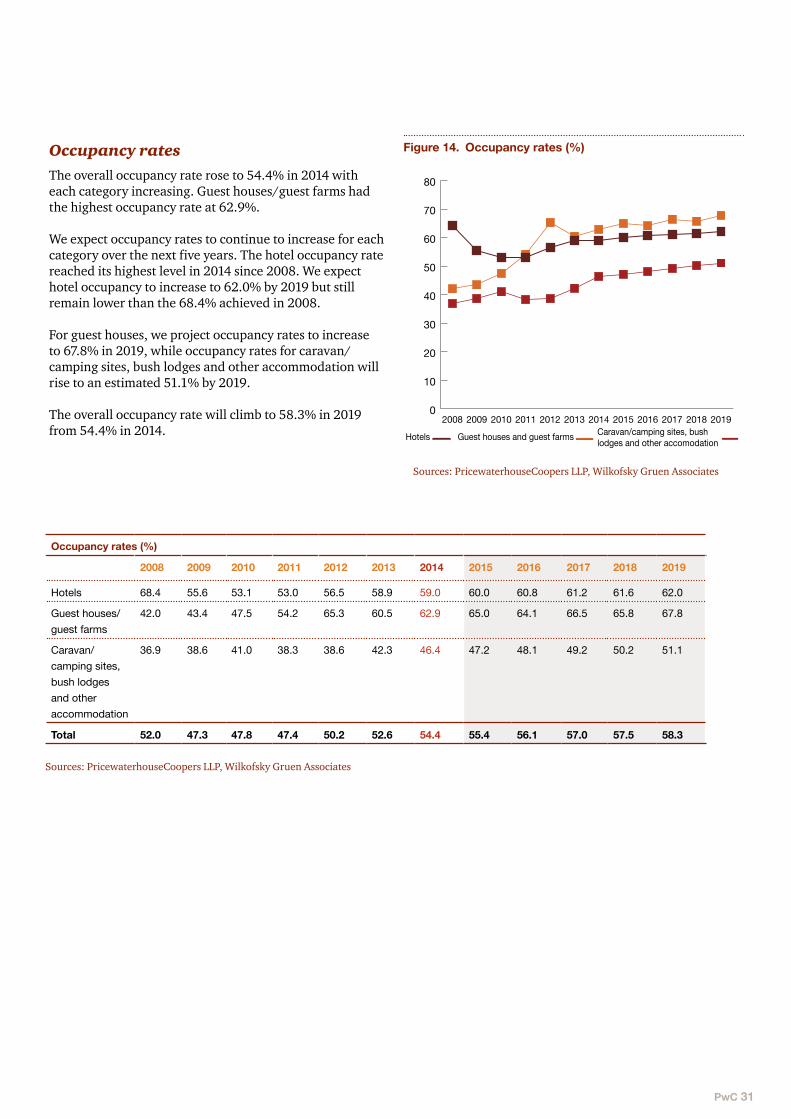
Occupancy ratesThe overall occupancy rate rose to 54.4% in 2014 with each category increasing. Guest houses/guest farms had the highest occupancy rate at 62.9%.
We expect occupancy rates to continue to increase for each category over the next five years. The hotel occupancy rate reached its highest level in 2014 since 2008. We expect hotel occupancy to increase to 62.0% by 2019 but still remain lower than the 68.4% achieved in 2008.
For guest houses, we project occupancy rates to increase to 67.8% in 2019, while occupancy rates for caravan/camping sites, bush lodges and other accommodation will rise to an estimated 51.1% by 2019.
The overall occupancy rate will climb to 58.3% in 2019 from 54.4% in 2014.
Figure 14. Occupancy rates (%)
0
10
20
30
40
50
60
70
80
201920182017201620152014201320122011201020092008
Hotels Guest houses and guest farms Caravan/camping sites, bush lodges and other accomodation
Sources: PricewaterhouseCoopers LLP, Wilkofsky Gruen Associates
Sources: PricewaterhouseCoopers LLP, Wilkofsky Gruen Associates
Occupancy rates (%)
2008 2009 2010 2011 2012 2013 2014 2015 2016 2017 2018 2019
Hotels 68.4 55.6 53.1 53.0 56.5 58.9 59.0 60.0 60.8 61.2 61.6 62.0
Guest houses/guest farms
42.0 43.4 47.5 54.2 65.3 60.5 62.9 65.0 64.1 66.5 65.8 67.8
Caravan/camping sites, bush lodges and other accommodation
36.9 38.6 41.0 38.3 38.6 42.3 46.4 47.2 48.1 49.2 50.2 51.1
Total 52.0 47.3 47.8 47.4 50.2 52.6 54.4 55.4 56.1 57.0 57.5 58.3
32 The African Traveller – Hospitality outlook: 2015-2019
Sources: PricewaterhouseCoopers LLP, Wilkofsky Gruen Associates
Sources: PricewaterhouseCoopers LLP, Wilkofsky Gruen Associates
Average room rates (R)
2008 2009 2010 2011 2012 2013 2014 2015 2016 2017 2018 2019 2015-19 CAGR
Hotels 775 810 905 820 855 935 1 000 1 065 1 130 1 200 1 270 1 340
% change 16.5 4.5 11.7 -9.4 4.3 9.4 7.0 6.5 6.1 6.2 5.8 5.5 6.0
Guest houses/guest farms
595 579 620 690 665 745 850 940 1 020 1 090 1 150 1 200
% change 1.7 -2.7 7.1 11.3 -3.6 12.0 14.1 10.6 8.5 6.9 5.5 4.3 7.1
Caravan/camping sites, bush lodges and other accommodation
290 320 370 415 470 495 505 520 540 565 595 625
% change 11.5 10.3 15.6 12.2 13.3 5.3 2.0 3.0 3.8 4.6 5.3 5.0 4.4
Total 610 621 699 682 718 778 820 870 922 976 1 030 1 083
% change 13.8 1.8 12.6 -2.4 5.3 8.4 5.4 6.1 6.0 5.9 5.5 5.1 5.7
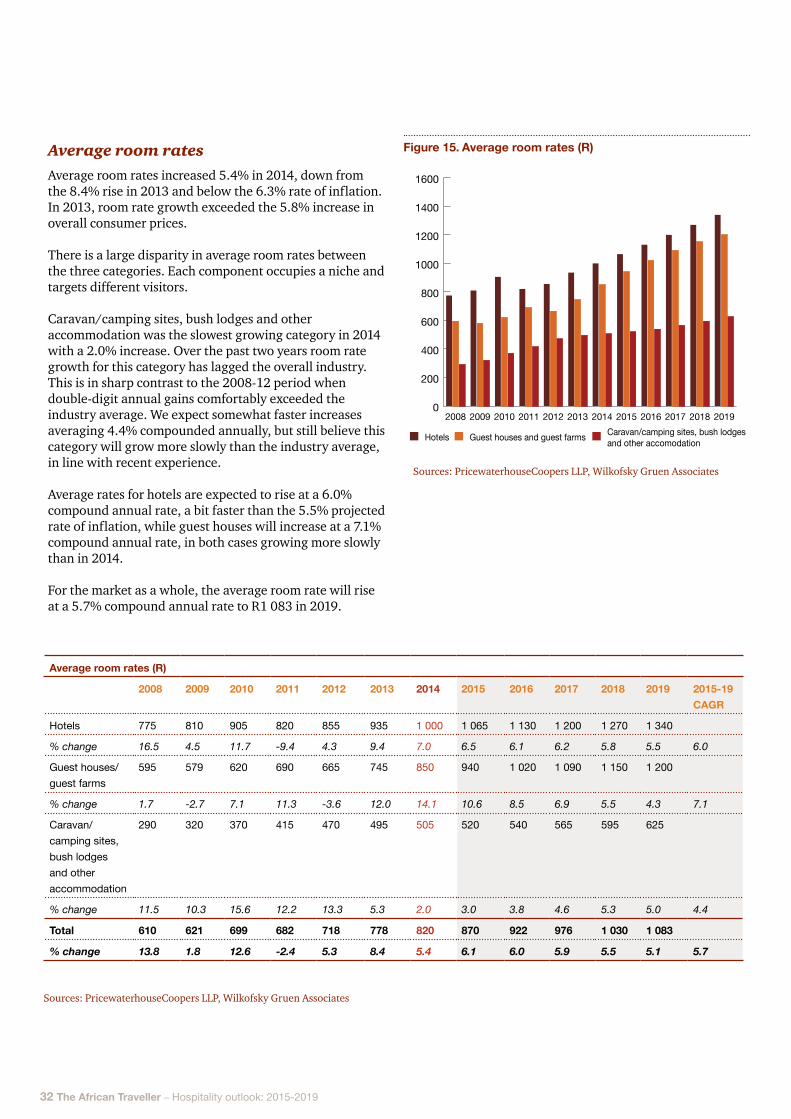
Average room ratesAverage room rates increased 5.4% in 2014, down from the 8.4% rise in 2013 and below the 6.3% rate of inflation. In 2013, room rate growth exceeded the 5.8% increase in overall consumer prices.
There is a large disparity in average room rates between the three categories. Each component occupies a niche and targets different visitors.
Caravan/camping sites, bush lodges and other accommodation was the slowest growing category in 2014 with a 2.0% increase. Over the past two years room rate growth for this category has lagged the overall industry. This is in sharp contrast to the 2008-12 period when double-digit annual gains comfortably exceeded the industry average. We expect somewhat faster increases averaging 4.4% compounded annually, but still believe this category will grow more slowly than the industry average, in line with recent experience.
Average rates for hotels are expected to rise at a 6.0% compound annual rate, a bit faster than the 5.5% projected rate of inflation, while guest houses will increase at a 7.1% compound annual rate, in both cases growing more slowly than in 2014.
For the market as a whole, the average room rate will rise at a 5.7% compound annual rate to R1 083 in 2019.
Figure 15. Average room rates (R)
0
200
400
600
800
1000
1200
1400
1600
201920182017201620152014201320122011201020092008
Hotels Guest houses and guest farms Caravan/camping sites, bush lodges and other accomodation
PwC 33
Figure 16. Total room revenue (R millions)
0
5000
10000
15000
20000
25000
201920182017201620152014201320122011201020092008
Hotels Guest houses and guest farms Caravan/camping sites, bush lodges and other accomodation
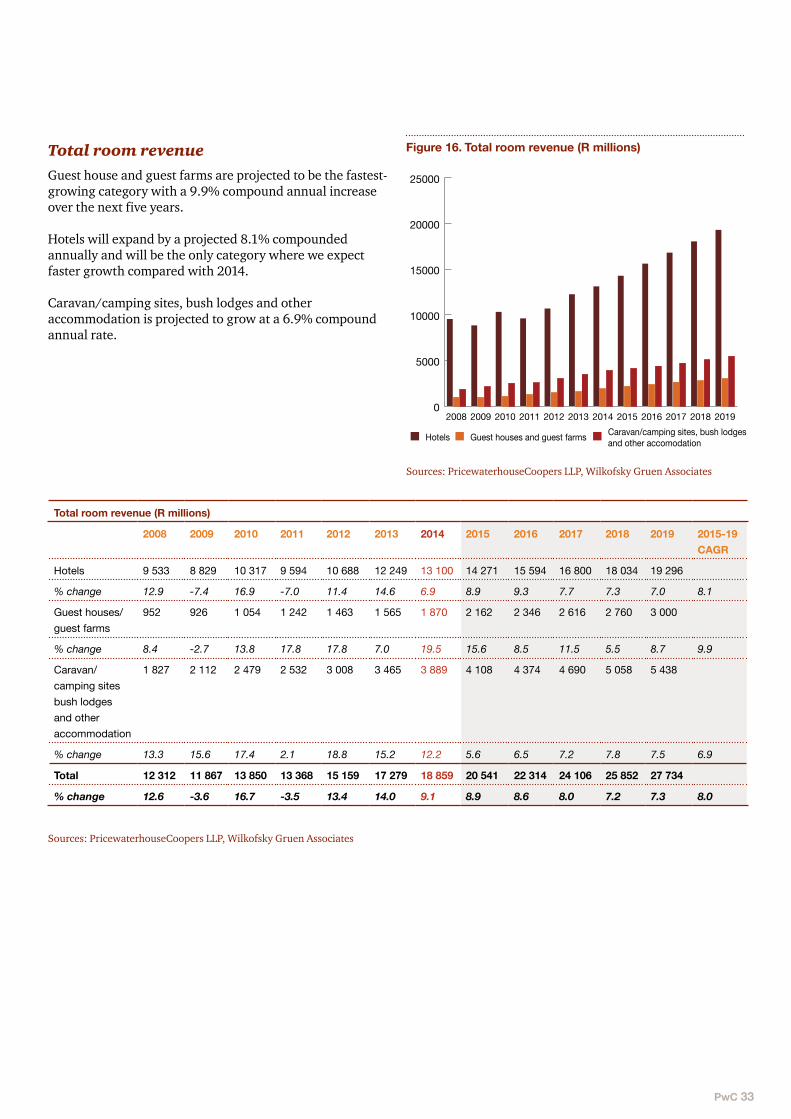
Total room revenueGuest house and guest farms are projected to be the fastest-growing category with a 9.9% compound annual increase over the next five years.
Hotels will expand by a projected 8.1% compounded annually and will be the only category where we expect faster growth compared with 2014.
Caravan/camping sites, bush lodges and other accommodation is projected to grow at a 6.9% compound annual rate.
Sources: PricewaterhouseCoopers LLP, Wilkofsky Gruen Associates
Total room revenue (R millions)
2008 2009 2010 2011 2012 2013 2014 2015 2016 2017 2018 2019 2015-19 CAGR
Hotels 9 533 8 829 10 317 9 594 10 688 12 249 13 100 14 271 15 594 16 800 18 034 19 296
% change 12.9 -7.4 16.9 -7.0 11.4 14.6 6.9 8.9 9.3 7.7 7.3 7.0 8.1
Guest houses/guest farms
952 926 1 054 1 242 1 463 1 565 1 870 2 162 2 346 2 616 2 760 3 000
% change 8.4 -2.7 13.8 17.8 17.8 7.0 19.5 15.6 8.5 11.5 5.5 8.7 9.9
Caravan/camping sites bush lodges and other accommodation
1 827 2 112 2 479 2 532 3 008 3 465 3 889 4 108 4 374 4 690 5 058 5 438
% change 13.3 15.6 17.4 2.1 18.8 15.2 12.2 5.6 6.5 7.2 7.8 7.5 6.9
Total 12 312 11 867 13 850 13 368 15 159 17 279 18 859 20 541 22 314 24 106 25 852 27 734
% change 12.6 -3.6 16.7 -3.5 13.4 14.0 9.1 8.9 8.6 8.0 7.2 7.3 8.0
Sources: PricewaterhouseCoopers LLP, Wilkofsky Gruen Associates
34 The African Traveller – Hospitality outlook: 2015-2019
Hotel accommodation in Nigeria
The Nigerian hotel market has been boosted by a strong economy. The economy expanded in real terms by 6.3% in 2014, its best showing since 2010. Following the GDP rebasing exercise carried out in 2014, Nigeria has the largest GDP in Africa surpassing South Africa.

PwC 35
Nevertheless, stay unit nights in 2014 declined by 5.9%, the first drop in many years, and the average occupancy rate fell to 49.8% from 55.4% in 2013. With average room rates increasing 4.2% however, the decrease in revenue was a more modest 2.0%. This decline may have been due to the increase in terrorist activities and Ebola outbreak recorded in 2014.
Boko Haram attacks in the north-eastern and western regions of the country led to sharp declines in visitors to those areas. Tourist areas such as the Yankari game reserve in Bauchi experienced sharp declines in patronage, but they represent a relatively small component of the hotel industry.
The Nigerian hotel market was also hit by health concerns following the Ebola outbreak in West Africa in July 2014. However, in October 2014, the World Health Organization declared Nigeria to be Ebola-free.
Nevertheless, the Nigerian hotel market continues to thrive despite the challenges faced. It is almost entirely corporate driven, as Nigeria remains a favourite destination for business in Africa. If it were more reliant on tourism, the adverse effects on hotels would likely have been greater.
Also, the Government has done a relatively good job in protecting Abuja and Lagos, where most of the major hotels are located, from terrorist attacks, which limited the impact.
Political uncertainty due to the 2015 presidential elections, which were postponed until 28 March, raised security concerns and discouraged travel and tourism. While the elections led to the peaceful transfer of power from incumbent president Goodluck Jonathan to former military ruler Muhammadu Buhari, the Foreign and Commonwealth office has advised against travel to certain parts of the country. This situation could mean a drop in occupancy rates from international visitors.
A number of initiatives have been put forward to promote tourism and positively impact the Nigerian hotel market.
In a bid to promote domestic travel and tourism, the Nigeria Tourism Development Corporation (NTDC) has been engaging the private sector and rebranding domestic tourism products and packages. There are also plans to create land and sea transportation hubs to encourage domestic travel.
36 The African Traveller – Hospitality outlook: 2015-2019
Online booking portals have provided ease of payment (online or mobile money) and opportunities for hotels to increase sales. Now, people can book accommodation in any hotel in multiple states and countries on just one hotel booking portal. Online booking portals (e.g., hotels.ng, booking.com, tripadvisor.com and jovago.com) have thousands of hotel listings across Nigeria. Other online merchants like Dealdey also feature hotel deals.
Because of its strong economy, the hotel industry in Nigeria has attracted significant investment, over US$3 billion in the past five years. The Nigerian Bureau of Statistics (NBS) estimates Nigeria’s rebased GDP at US$510 billion compared to US$269.55 billion prior to the rebasing. This is attracting global investors and spurring the formation of local angel investor and venture capital networks in Nigeria.
The hotel market has also been helped by strong economic growth. The economy expanded by 6.3% in real terms in 2014, its best showing since 2010.
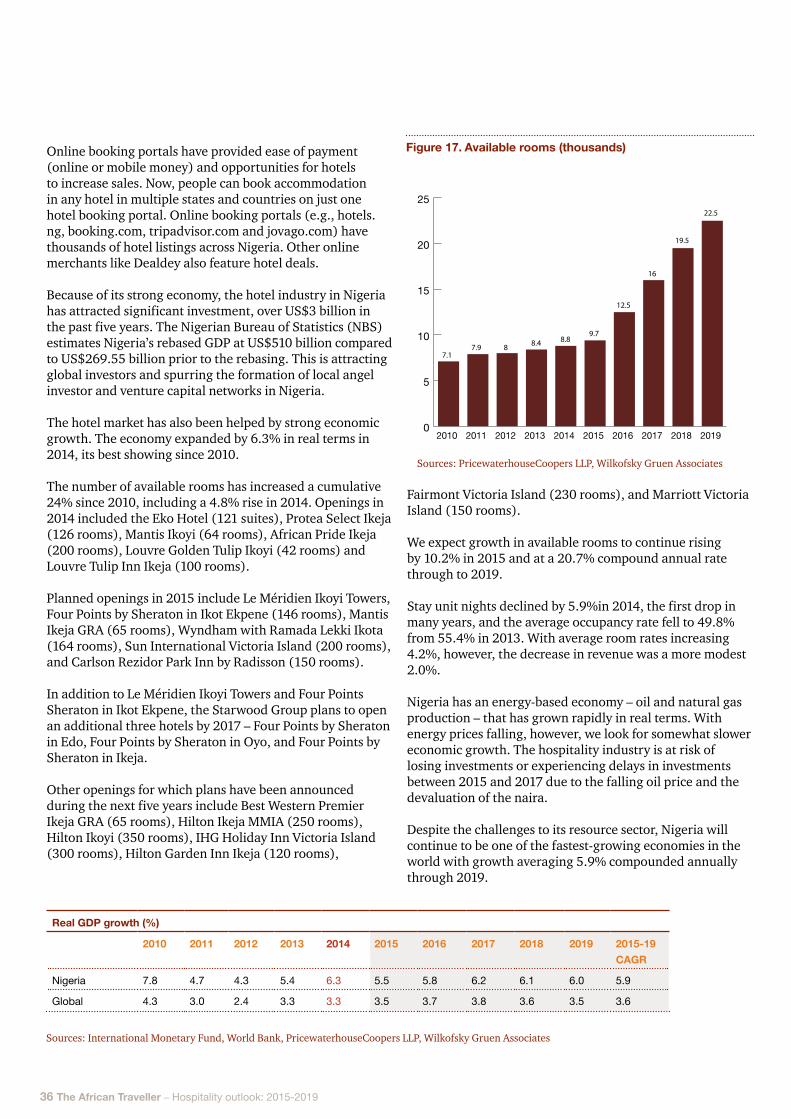
The number of available rooms has increased a cumulative 24% since 2010, including a 4.8% rise in 2014. Openings in 2014 included the Eko Hotel (121 suites), Protea Select Ikeja (126 rooms), Mantis Ikoyi (64 rooms), African Pride Ikeja (200 rooms), Louvre Golden Tulip Ikoyi (42 rooms) and Louvre Tulip Inn Ikeja (100 rooms).
Planned openings in 2015 include Le Méridien Ikoyi Towers, Four Points by Sheraton in Ikot Ekpene (146 rooms), Mantis Ikeja GRA (65 rooms), Wyndham with Ramada Lekki Ikota (164 rooms), Sun International Victoria Island (200 rooms), and Carlson Rezidor Park Inn by Radisson (150 rooms).
In addition to Le Méridien Ikoyi Towers and Four Points Sheraton in Ikot Ekpene, the Starwood Group plans to open an additional three hotels by 2017 – Four Points by Sheraton in Edo, Four Points by Sheraton in Oyo, and Four Points by Sheraton in Ikeja.
Other openings for which plans have been announced during the next five years include Best Western Premier Ikeja GRA (65 rooms), Hilton Ikeja MMIA (250 rooms), Hilton Ikoyi (350 rooms), IHG Holiday Inn Victoria Island (300 rooms), Hilton Garden Inn Ikeja (120 rooms),
Fairmont Victoria Island (230 rooms), and Marriott Victoria Island (150 rooms).
We expect growth in available rooms to continue rising by 10.2% in 2015 and at a 20.7% compound annual rate through to 2019.
Stay unit nights declined by 5.9%in 2014, the first drop in many years, and the average occupancy rate fell to 49.8% from 55.4% in 2013. With average room rates increasing 4.2%, however, the decrease in revenue was a more modest 2.0%.
Nigeria has an energy-based economy – oil and natural gas production – that has grown rapidly in real terms. With energy prices falling, however, we look for somewhat slower economic growth. The hospitality industry is at risk of losing investments or experiencing delays in investments between 2015 and 2017 due to the falling oil price and the devaluation of the naira.
Despite the challenges to its resource sector, Nigeria will continue to be one of the fastest-growing economies in the world with growth averaging 5.9% compounded annually through 2019.
Figure 17. Available rooms (thousands)
0
5
10
15
20
25
2019201820172016201520142013201220112010
7.17.9 8 8.4 8.8
9.7
12.5
16
19.5
22.5
Sources: PricewaterhouseCoopers LLP, Wilkofsky Gruen Associates
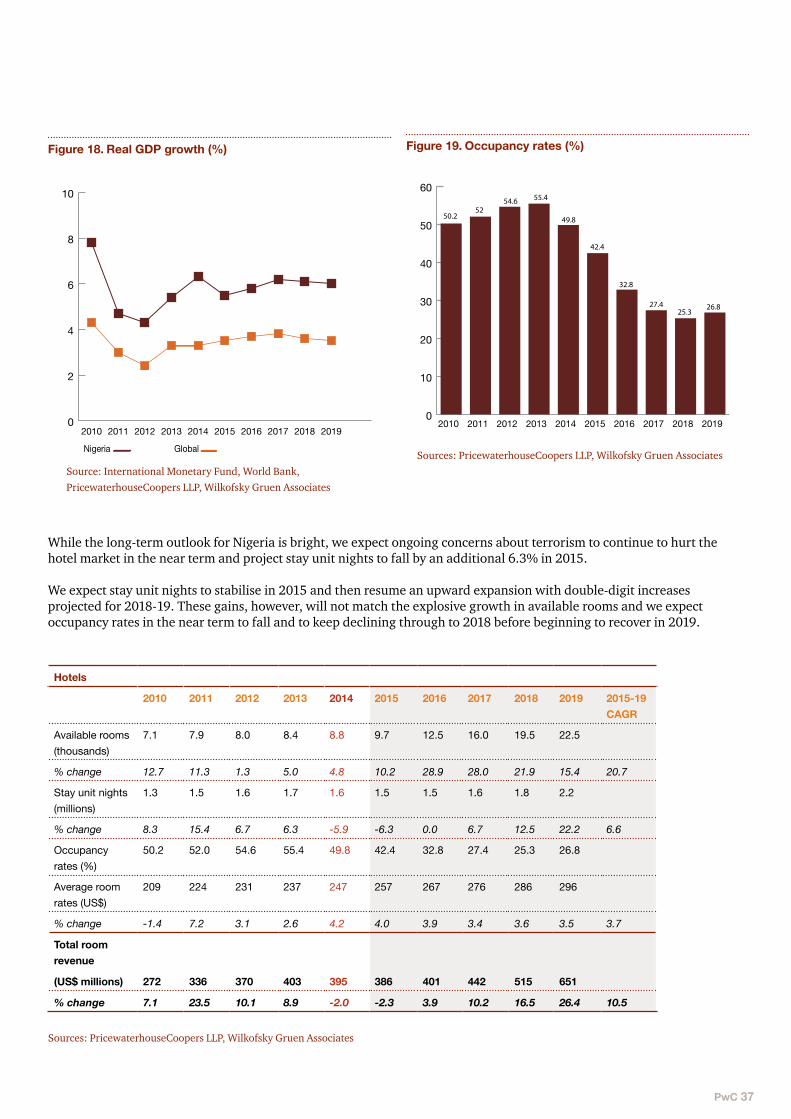
Real GDP growth (%)
2010 2011 2012 2013 2014 2015 2016 2017 2018 2019 2015-19 CAGR
Nigeria 7.8 4.7 4.3 5.4 6.3 5.5 5.8 6.2 6.1 6.0 5.9
Global 4.3 3.0 2.4 3.3 3.3 3.5 3.7 3.8 3.6 3.5 3.6
Sources: International Monetary Fund, World Bank, PricewaterhouseCoopers LLP, Wilkofsky Gruen Associates
PwC 37
Source: International Monetary Fund, World Bank, PricewaterhouseCoopers LLP, Wilkofsky Gruen Associates
Figure 18. Real GDP growth (%)
0
2
4
6
8
10
2019201820172016201520142013201220112010
Nigeria Global
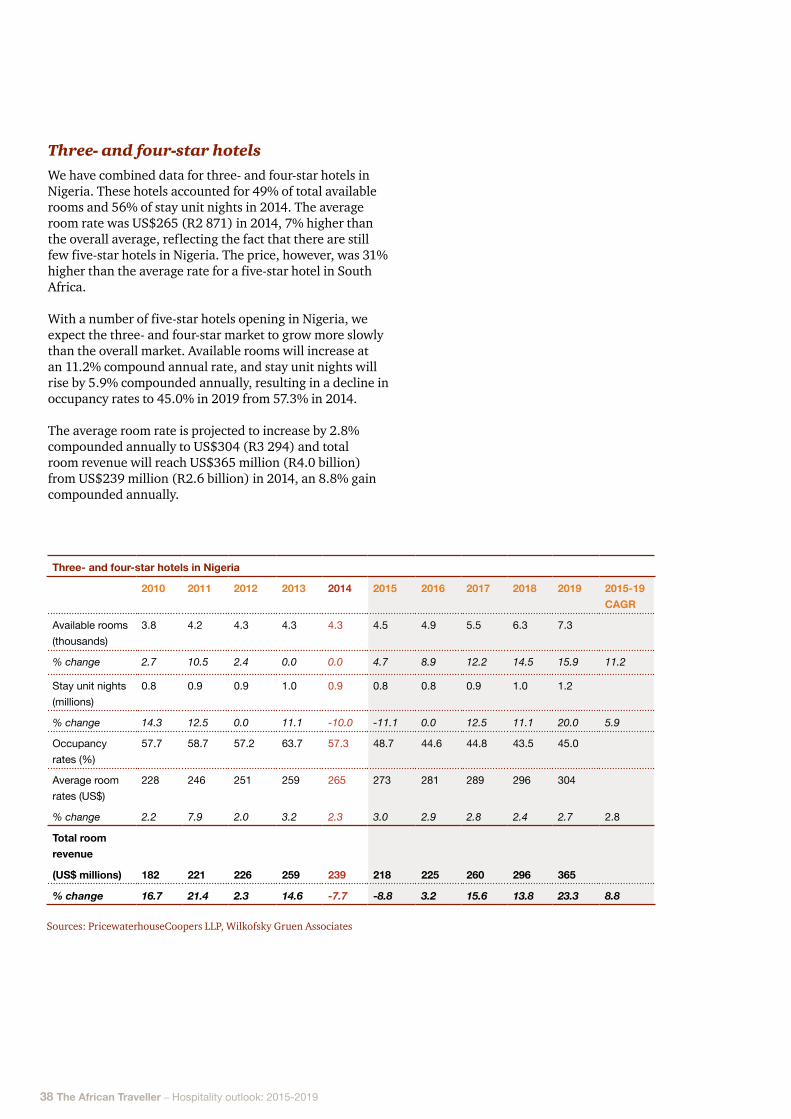
While the long-term outlook for Nigeria is bright, we expect ongoing concerns about terrorism to continue to hurt the hotel market in the near term and project stay unit nights to fall by an additional 6.3% in 2015.
We expect stay unit nights to stabilise in 2015 and then resume an upward expansion with double-digit increases projected for 2018-19. These gains, however, will not match the explosive growth in available rooms and we expect occupancy rates in the near term to fall and to keep declining through to 2018 before beginning to recover in 2019.
Hotels
2010 2011 2012 2013 2014 2015 2016 2017 2018 2019 2015-19 CAGR
Available rooms (thousands)
7.1 7.9 8.0 8.4 8.8 9.7 12.5 16.0 19.5 22.5
% change 12.7 11.3 1.3 5.0 4.8 10.2 28.9 28.0 21.9 15.4 20.7
Stay unit nights (millions)
1.3 1.5 1.6 1.7 1.6 1.5 1.5 1.6 1.8 2.2
% change 8.3 15.4 6.7 6.3 -5.9 -6.3 0.0 6.7 12.5 22.2 6.6
Occupancy rates (%)
50.2 52.0 54.6 55.4 49.8 42.4 32.8 27.4 25.3 26.8
Average room rates (US$)
209 224 231 237 247 257 267 276 286 296
% change -1.4 7.2 3.1 2.6 4.2 4.0 3.9 3.4 3.6 3.5 3.7
Total room revenue
(US$ millions) 272 336 370 403 395 386 401 442 515 651
% change 7.1 23.5 10.1 8.9 -2.0 -2.3 3.9 10.2 16.5 26.4 10.5
Sources: PricewaterhouseCoopers LLP, Wilkofsky Gruen Associates
Figure 19. Occupancy rates (%)
0
10
20
30
40
50
60
2019201820172016201520142013201220112010
50.252
54.6 55.4
49.8
42.4
32.8
27.425.3
26.8
Sources: PricewaterhouseCoopers LLP, Wilkofsky Gruen Associates
38 The African Traveller – Hospitality outlook: 2015-2019
Three- and four-star hotelsWe have combined data for three- and four-star hotels in Nigeria. These hotels accounted for 49% of total available rooms and 56% of stay unit nights in 2014. The average room rate was US$265 (R2 871) in 2014, 7% higher than the overall average, reflecting the fact that there are still few five-star hotels in Nigeria. The price, however, was 31% higher than the average rate for a five-star hotel in South Africa.
With a number of five-star hotels opening in Nigeria, we expect the three- and four-star market to grow more slowly than the overall market. Available rooms will increase at an 11.2% compound annual rate, and stay unit nights will rise by 5.9% compounded annually, resulting in a decline in occupancy rates to 45.0% in 2019 from 57.3% in 2014.
The average room rate is projected to increase by 2.8% compounded annually to US$304 (R3 294) and total room revenue will reach US$365 million (R4.0 billion) from US$239 million (R2.6 billion) in 2014, an 8.8% gain compounded annually.
Three- and four-star hotels in Nigeria
2010 2011 2012 2013 2014 2015 2016 2017 2018 2019 2015-19 CAGR
Available rooms (thousands)
3.8 4.2 4.3 4.3 4.3 4.5 4.9 5.5 6.3 7.3
% change 2.7 10.5 2.4 0.0 0.0 4.7 8.9 12.2 14.5 15.9 11.2
Stay unit nights (millions)
0.8 0.9 0.9 1.0 0.9 0.8 0.8 0.9 1.0 1.2
% change 14.3 12.5 0.0 11.1 -10.0 -11.1 0.0 12.5 11.1 20.0 5.9
Occupancy rates (%)
57.7 58.7 57.2 63.7 57.3 48.7 44.6 44.8 43.5 45.0
Average room rates (US$)
228 246 251 259 265 273 281 289 296 304
% change 2.2 7.9 2.0 3.2 2.3 3.0 2.9 2.8 2.4 2.7 2.8
Total room revenue
(US$ millions) 182 221 226 259 239 218 225 260 296 365
% change 16.7 21.4 2.3 14.6 -7.7 -8.8 3.2 15.6 13.8 23.3 8.8
Sources: PricewaterhouseCoopers LLP, Wilkofsky Gruen Associates
PwC 39
Looking back: 2014Actual vs forecast results for 2014
Forecast Actual
Occupancy (%) 54.8 49.8
Stay unit nights (millions) 1.8 1.6
Total hotel room revenue growth (%) 8.5 -2.0
Three- and four-star hotel room revenue growth (%)
6.0 -7.7
Sources: PricewaterhouseCoopers LLP, Wilkofsky Gruen Associates
The forecasts for Nigeria in last year’s Outlook did not anticipate the impact of Ebola and overestimated market growth. Stay unit nights were lower than we anticipated, 1.6 million vs the 1.8 million projection. The occupancy rate averaged 49.8%, below our 54.8% projection. Room revenue declined by 2.0% in 2014, compared to the projected 8.5% increase. The three- and four-star hotel market was particularly hurt as revenue fell 7.7%. We had projected a 6.0% increase.
Outlook: 2015-2019
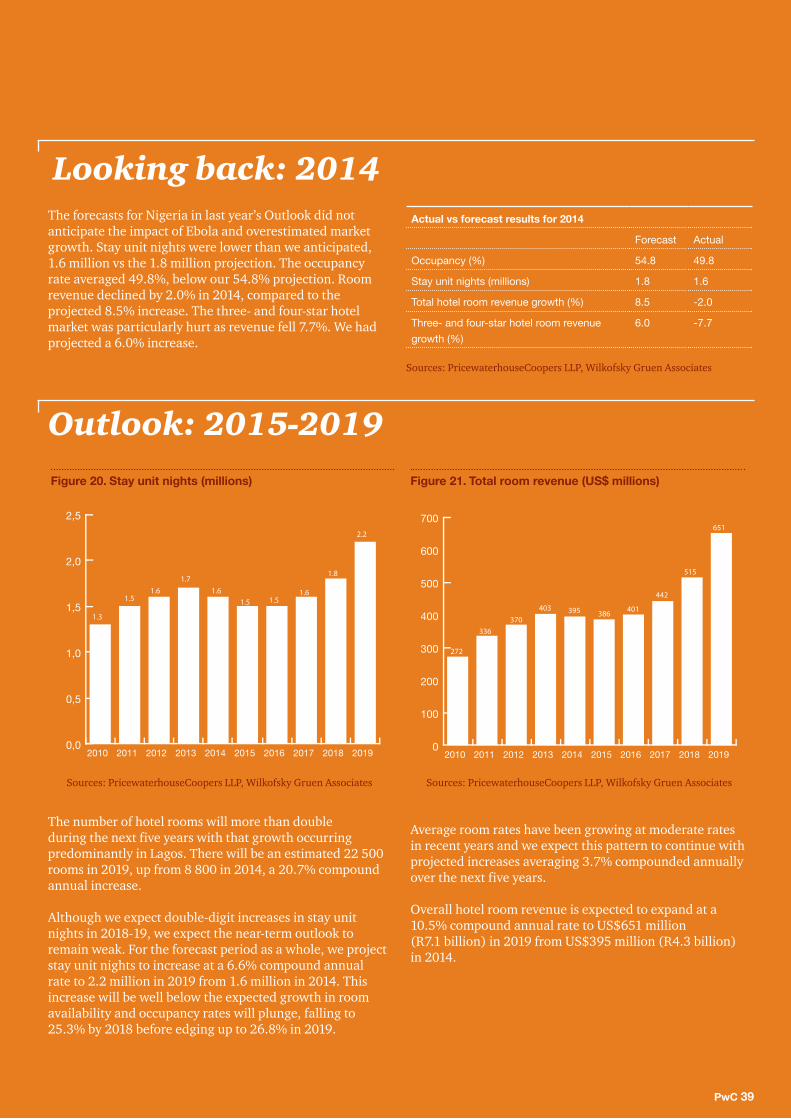
The number of hotel rooms will more than double during the next five years with that growth occurring predominantly in Lagos. There will be an estimated 22 500 rooms in 2019, up from 8 800 in 2014, a 20.7% compound annual increase.
Although we expect double-digit increases in stay unit nights in 2018-19, we expect the near-term outlook to remain weak. For the forecast period as a whole, we project stay unit nights to increase at a 6.6% compound annual rate to 2.2 million in 2019 from 1.6 million in 2014. This increase will be well below the expected growth in room availability and occupancy rates will plunge, falling to 25.3% by 2018 before edging up to 26.8% in 2019.
Figure 20. Stay unit nights (millions)
0,0
0,5
1,0
1,5
2,0
2,5
2019201820172016201520142013201220112010
1.3
1.51.6
1.71.6
1.5 1.51.6
1.8
2.2
Sources: PricewaterhouseCoopers LLP, Wilkofsky Gruen Associates Sources: PricewaterhouseCoopers LLP, Wilkofsky Gruen Associates
Figure 21. Total room revenue (US$ millions)
0
100
200
300
400
500
600
700
2019201820172016201520142013201220112010
272
336370
403 395 386 401
442
515
651
Average room rates have been growing at moderate rates in recent years and we expect this pattern to continue with projected increases averaging 3.7% compounded annually over the next five years.
Overall hotel room revenue is expected to expand at a 10.5% compound annual rate to US$651 million (R7.1 billion) in 2019 from US$395 million (R4.3 billion) in 2014.
40 The African Traveller – Hospitality outlook: 2015-2019
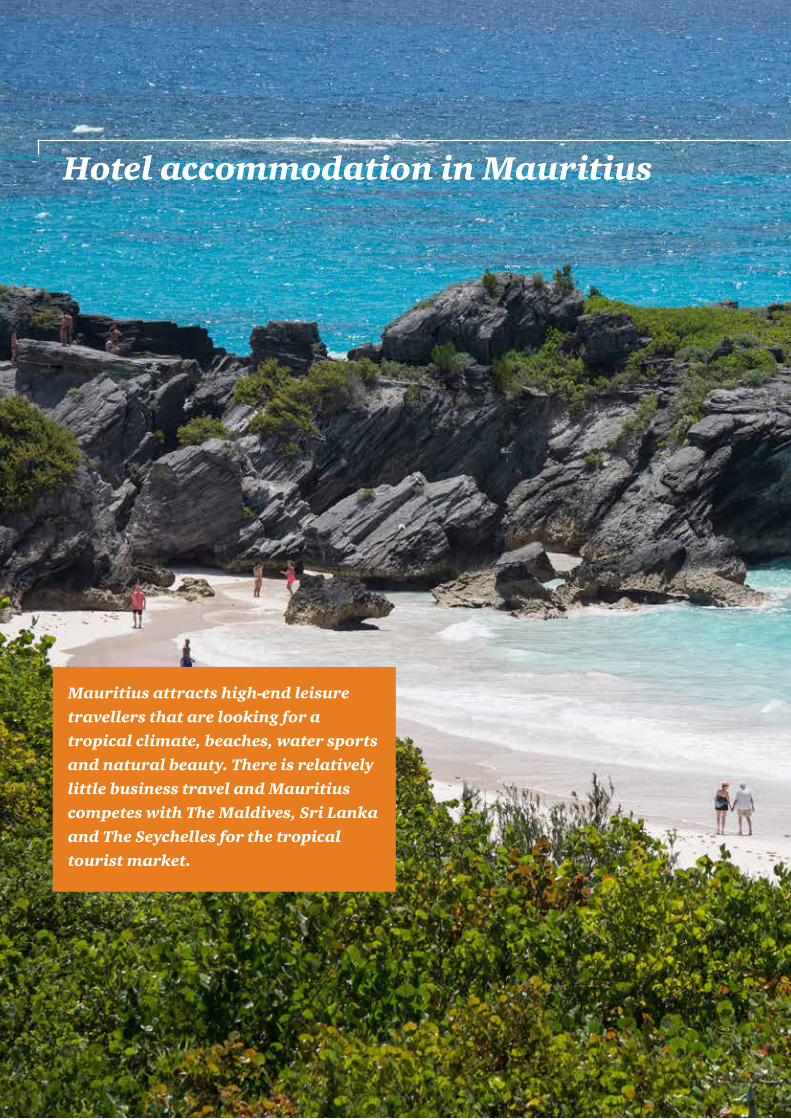
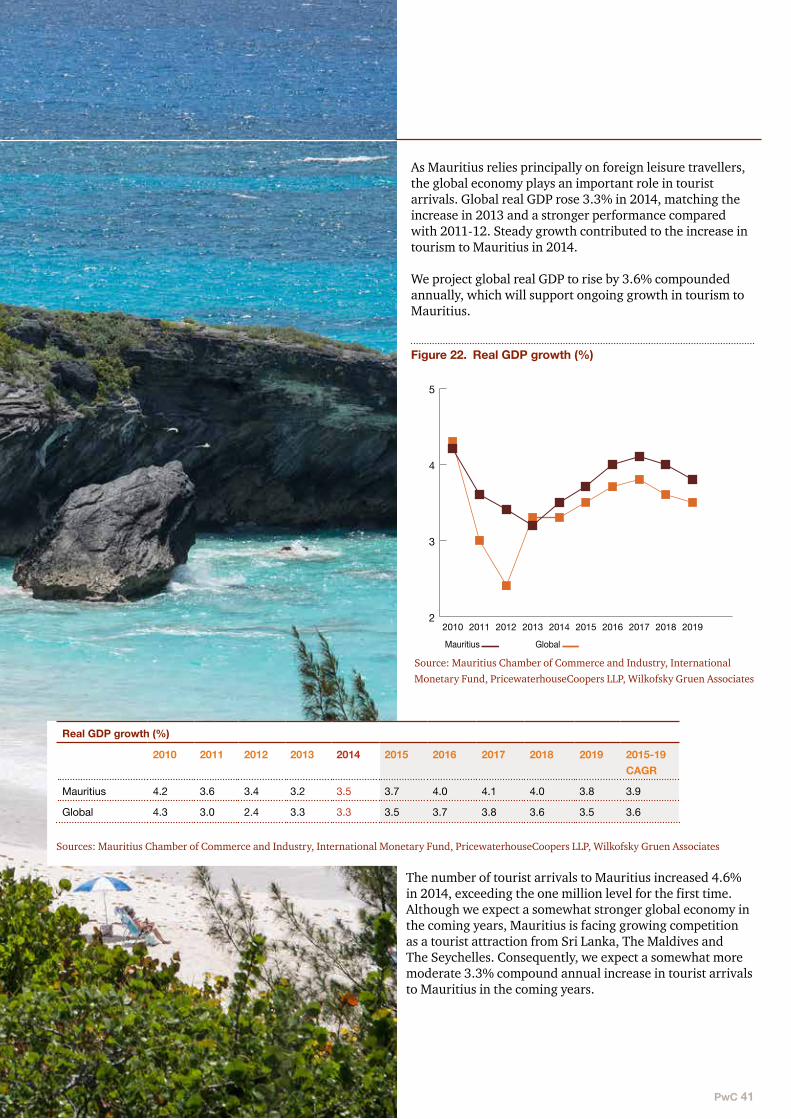
Mauritius attracts high-end leisure travellers that are looking for a tropical climate, beaches, water sports and natural beauty. There is relatively little business travel and Mauritius competes with The Maldives, Sri Lanka and The Seychelles for the tropical tourist market.
Hotel accommodation in Mauritius
PwC 41
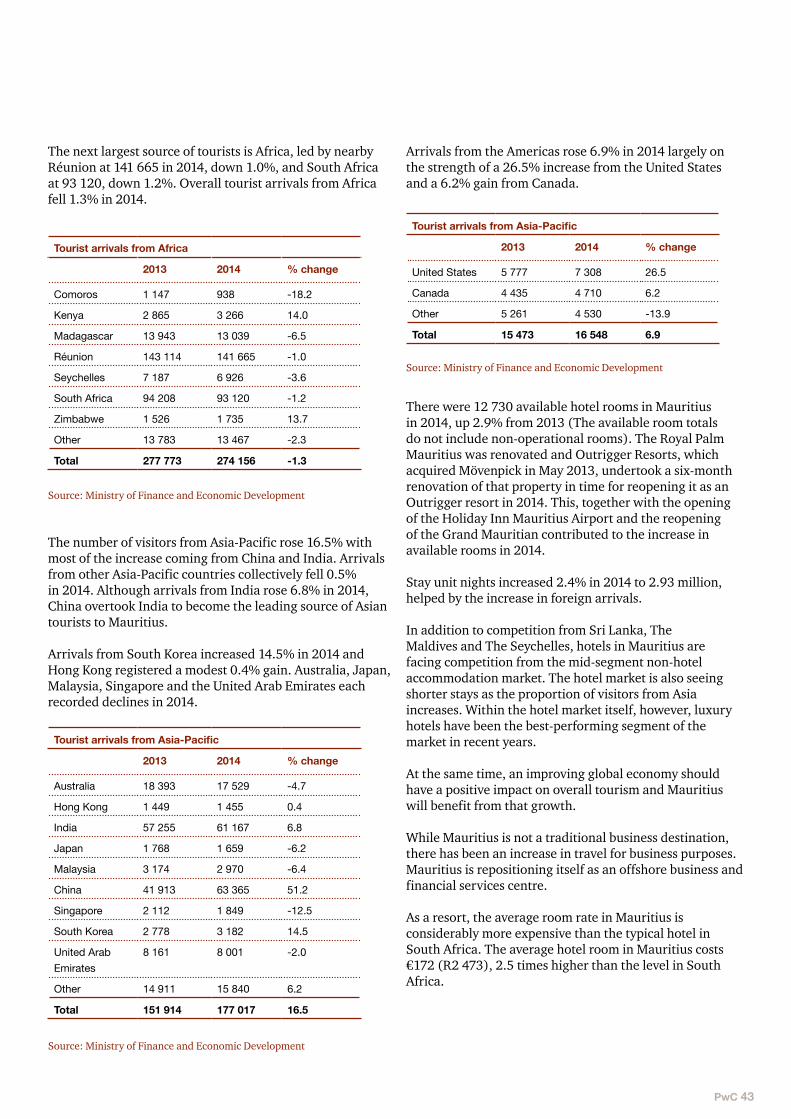
As Mauritius relies principally on foreign leisure travellers, the global economy plays an important role in tourist arrivals. Global real GDP rose 3.3% in 2014, matching the increase in 2013 and a stronger performance compared with 2011-12. Steady growth contributed to the increase in tourism to Mauritius in 2014.
We project global real GDP to rise by 3.6% compounded annually, which will support ongoing growth in tourism to Mauritius.
Real GDP growth (%)
2010 2011 2012 2013 2014 2015 2016 2017 2018 2019 2015-19 CAGR
Mauritius 4.2 3.6 3.4 3.2 3.5 3.7 4.0 4.1 4.0 3.8 3.9
Global 4.3 3.0 2.4 3.3 3.3 3.5 3.7 3.8 3.6 3.5 3.6
Sources: Mauritius Chamber of Commerce and Industry, International Monetary Fund, PricewaterhouseCoopers LLP, Wilkofsky Gruen Associates
The number of tourist arrivals to Mauritius increased 4.6% in 2014, exceeding the one million level for the first time. Although we expect a somewhat stronger global economy in the coming years, Mauritius is facing growing competition as a tourist attraction from Sri Lanka, The Maldives and The Seychelles. Consequently, we expect a somewhat more moderate 3.3% compound annual increase in tourist arrivals to Mauritius in the coming years.
Figure 22. Real GDP growth (%)
2
3
4
5
2019201820172016201520142013201220112010
Mauritius Global
Source: Mauritius Chamber of Commerce and Industry, International Monetary Fund, PricewaterhouseCoopers LLP, Wilkofsky Gruen Associates

42 The African Traveller – Hospitality outlook: 2015-2019
Tourist arrivals (thousands)
2010 2011 2012 2013 2014 2015 2016 2017 2018 2019 2015-19 CAGR
Tourist arrivals 934.8 964.6 965.4 993.1 1 039.0 1 070.0 1 100.0 1 135.0 1 175.0 1 220.0
% change 7.3 3.2 0.1 2.9 4.6 3.0 2.8 3.2 3.5 3.8 3.3
Note: Figures include arrivals from non-specified countries Sources: Ministry of Finance and Economic Development, PricewaterhouseCoopers LLP, Wilkofsky Gruen Associates
In addition to the state of the global economy, a key factor in tourism is the convenience of airline travel. The increased availability of seats to Mauritius has been a key contributor to the increase in tourism. Air Mauritius added a third weekly direct flight to Shanghai in January 2014 and a second weekly direct flight to Beijing was added in July. These new flights contributed to the 51.2% increase in tourist arrivals from China in 2014.
Emirates added a twice-daily A380 flight; which commenced in October 2014. It must be noted that there has been an overall increase in the number of seats from 1 738 504 in 2013 to 1 817 667 in 2014.
TUI, Europe’s largest tour operator, introduced regular direct flights from the United Kingdom beginning in May 2014. These new flights contributed to the 17.7% increase in visitors from the UK.
Air Mauritius is replacing its fleet of aircraft with A350-900 planes, which will provide greater passenger comfort and amenities. The first two planes are expected in 2017.
Europe is the principal source of tourist travel to Mauritius, accounting for 55% of total arrivals in 2014. Arrivals from Europe increased 4.3% in 2014. France is the leading country in travel to Mauritius with 243 665 visitors in 2014 making up 23% of all tourist arrivals.
The number of visitors from France dipped 0.4% in 2014. Travel from Italy declined 5.3% and Russia was down 10.8%, reflecting economic problems in those countries. Sweden recorded the largest increase in 2014 with a 41.0% gain. In addition to growth in the UK, the Netherlands, Austria, Switzerland, Germany and Spain all recorded increases.
The recent decline in the euro is not good for the majority of hotels, although growth in UK tourism helps. Tour operators are putting pressure on hotels to align rates in sterling with those in euros.
Figure 23. Tourist arrivals (thousands)
0
200
400
600
800
1000
1200
1400
2019201820172016201520142013201220112010
935965 965
19931039
1 070 1 1001135 1 175
1 220
Sources: Ministry of Finance and Economic Development, PricewaterhouseCoopers LLP, Wilkofsky Gruen Associates
Tourist arrivals from Europe
2013 2014 % change
Austria 7 937 8 303 4.6
Belgium 11 566 11 465 -0.9
France 244 752 243 665 -0.4
Germany 60 530 62 231 2.8
Italy 31 205 29 557 -5.3
Netherlands 4 499 4 796 6.6
Spain 8 441 8 633 2.3
Sweden 4 577 6 454 41.0
Switzerland 27 756 29 285 5.5
United Kingdom 98 017 115 326 17.7
Russia 14 905 13 289 -10.8
Other 32 861 37 544 14.3
Total Europe 547 046 570 548 4.3
Source: Ministry of Finance and Economic Development
PwC 43
The next largest source of tourists is Africa, led by nearby Réunion at 141 665 in 2014, down 1.0%, and South Africa at 93 120, down 1.2%. Overall tourist arrivals from Africa fell 1.3% in 2014.
Tourist arrivals from Africa
2013 2014 % change
Comoros 1 147 938 -18.2
Kenya 2 865 3 266 14.0
Madagascar 13 943 13 039 -6.5
Réunion 143 114 141 665 -1.0
Seychelles 7 187 6 926 -3.6
South Africa 94 208 93 120 -1.2
Zimbabwe 1 526 1 735 13.7
Other 13 783 13 467 -2.3
Total 277 773 274 156 -1.3
Source: Ministry of Finance and Economic Development
The number of visitors from Asia-Pacific rose 16.5% with most of the increase coming from China and India. Arrivals from other Asia-Pacific countries collectively fell 0.5% in 2014. Although arrivals from India rose 6.8% in 2014, China overtook India to become the leading source of Asian tourists to Mauritius.
Arrivals from South Korea increased 14.5% in 2014 and Hong Kong registered a modest 0.4% gain. Australia, Japan, Malaysia, Singapore and the United Arab Emirates each recorded declines in 2014.
Tourist arrivals from Asia-Pacific
2013 2014 % change
Australia 18 393 17 529 -4.7
Hong Kong 1 449 1 455 0.4
India 57 255 61 167 6.8
Japan 1 768 1 659 -6.2
Malaysia 3 174 2 970 -6.4
China 41 913 63 365 51.2
Singapore 2 112 1 849 -12.5
South Korea 2 778 3 182 14.5
United Arab Emirates
8 161 8 001 -2.0
Other 14 911 15 840 6.2
Total 151 914 177 017 16.5
Source: Ministry of Finance and Economic Development
Arrivals from the Americas rose 6.9% in 2014 largely on the strength of a 26.5% increase from the United States and a 6.2% gain from Canada.
Tourist arrivals from Asia-Pacific
2013 2014 % change
United States 5 777 7 308 26.5
Canada 4 435 4 710 6.2
Other 5 261 4 530 -13.9
Total 15 473 16 548 6.9
Source: Ministry of Finance and Economic Development
There were 12 730 available hotel rooms in Mauritius in 2014, up 2.9% from 2013 (The available room totals do not include non-operational rooms). The Royal Palm Mauritius was renovated and Outrigger Resorts, which acquired Mövenpick in May 2013, undertook a six-month renovation of that property in time for reopening it as an Outrigger resort in 2014. This, together with the opening of the Holiday Inn Mauritius Airport and the reopening of the Grand Mauritian contributed to the increase in available rooms in 2014.
Stay unit nights increased 2.4% in 2014 to 2.93 million, helped by the increase in foreign arrivals.
In addition to competition from Sri Lanka, The Maldives and The Seychelles, hotels in Mauritius are facing competition from the mid-segment non-hotel accommodation market. The hotel market is also seeing shorter stays as the proportion of visitors from Asia increases. Within the hotel market itself, however, luxury hotels have been the best-performing segment of the market in recent years.
At the same time, an improving global economy should have a positive impact on overall tourism and Mauritius will benefit from that growth.
While Mauritius is not a traditional business destination, there has been an increase in travel for business purposes. Mauritius is repositioning itself as an offshore business and financial services centre.
As a resort, the average room rate in Mauritius is considerably more expensive than the typical hotel in South Africa. The average hotel room in Mauritius costs €172 (R2 473), 2.5 times higher than the level in South Africa.
44 The African Traveller – Hospitality outlook: 2015-2019
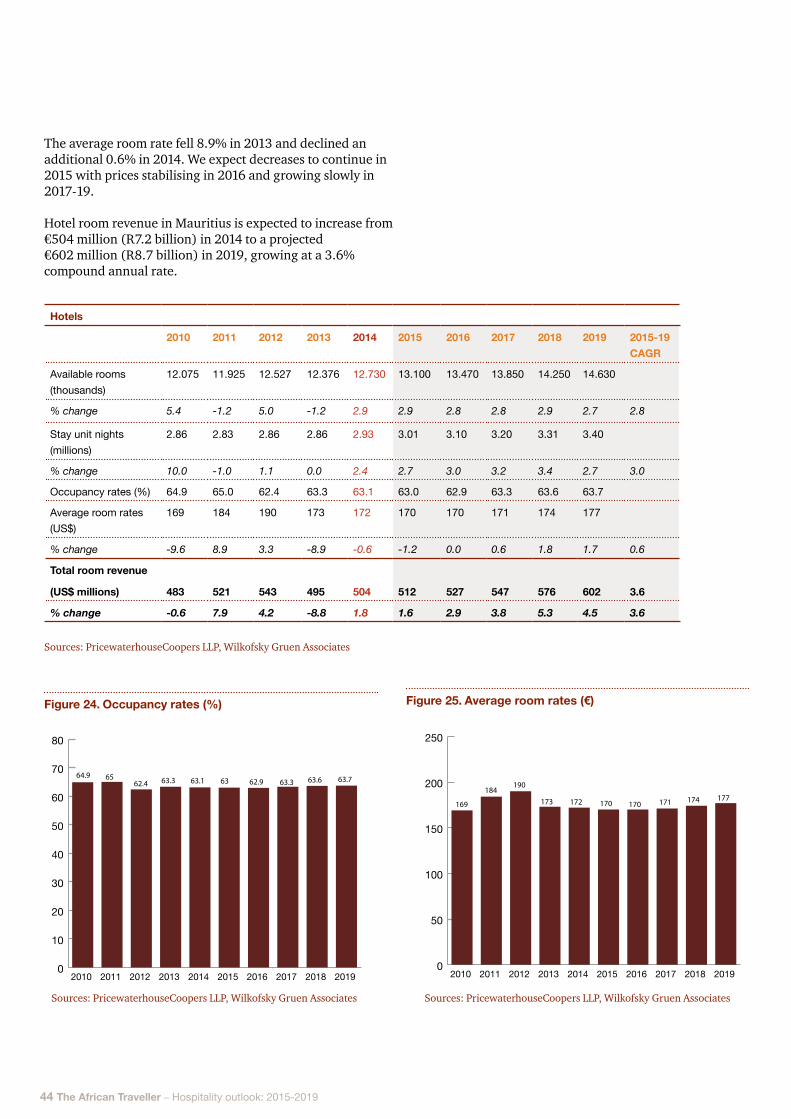
The average room rate fell 8.9% in 2013 and declined an additional 0.6% in 2014. We expect decreases to continue in 2015 with prices stabilising in 2016 and growing slowly in 2017-19.
Hotel room revenue in Mauritius is expected to increase from €504 million (R7.2 billion) in 2014 to a projected €602 million (R8.7 billion) in 2019, growing at a 3.6% compound annual rate.
Hotels
2010 2011 2012 2013 2014 2015 2016 2017 2018 2019 2015-19 CAGR
Available rooms (thousands)
12.075 11.925 12.527 12.376 12.730 13.100 13.470 13.850 14.250 14.630
% change 5.4 -1.2 5.0 -1.2 2.9 2.9 2.8 2.8 2.9 2.7 2.8
Stay unit nights (millions)
2.86 2.83 2.86 2.86 2.93 3.01 3.10 3.20 3.31 3.40
% change 10.0 -1.0 1.1 0.0 2.4 2.7 3.0 3.2 3.4 2.7 3.0
Occupancy rates (%) 64.9 65.0 62.4 63.3 63.1 63.0 62.9 63.3 63.6 63.7
Average room rates(US$)
169 184 190 173 172 170 170 171 174 177
% change -9.6 8.9 3.3 -8.9 -0.6 -1.2 0.0 0.6 1.8 1.7 0.6
Total room revenue
(US$ millions) 483 521 543 495 504 512 527 547 576 602 3.6
% change -0.6 7.9 4.2 -8.8 1.8 1.6 2.9 3.8 5.3 4.5 3.6
Sources: PricewaterhouseCoopers LLP, Wilkofsky Gruen Associates
Figure 24. Occupancy rates (%)
0
10
20
30
40
50
60
70
80
2019201820172016201520142013201220112010
64.9 6562.4 63.3 63.1 63 62.9 63.3 63.6 63.7
Figure 25. Average room rates (€)
0
50
100
150
200
250
2019201820172016201520142013201220112010
169
184190
173 172 170 170 171 174 177
Sources: PricewaterhouseCoopers LLP, Wilkofsky Gruen Associates Sources: PricewaterhouseCoopers LLP, Wilkofsky Gruen Associates
PwC 45
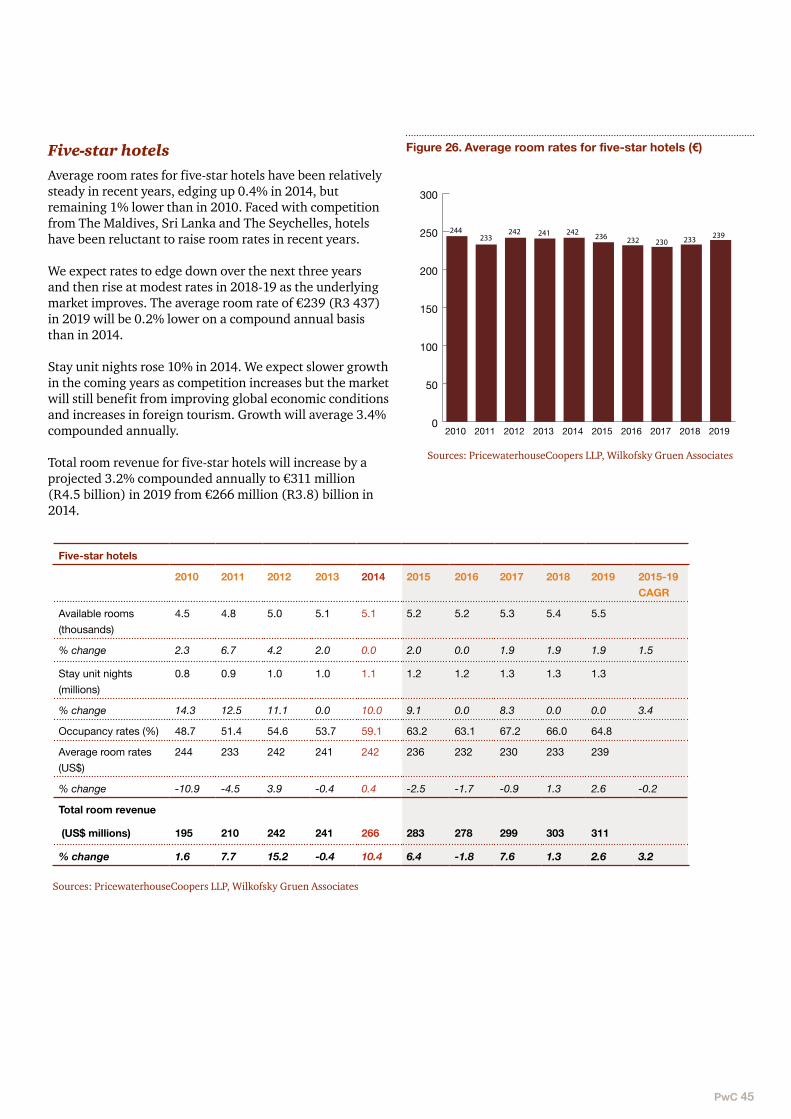
Five-star hotelsAverage room rates for five-star hotels have been relatively steady in recent years, edging up 0.4% in 2014, but remaining 1% lower than in 2010. Faced with competition from The Maldives, Sri Lanka and The Seychelles, hotels have been reluctant to raise room rates in recent years.
We expect rates to edge down over the next three years and then rise at modest rates in 2018-19 as the underlying market improves. The average room rate of €239 (R3 437) in 2019 will be 0.2% lower on a compound annual basis than in 2014.
Stay unit nights rose 10% in 2014. We expect slower growth in the coming years as competition increases but the market will still benefit from improving global economic conditions and increases in foreign tourism. Growth will average 3.4% compounded annually.
Total room revenue for five-star hotels will increase by a projected 3.2% compounded annually to €311 million (R4.5 billion) in 2019 from €266 million (R3.8) billion in 2014.
Figure 26. Average room rates for five-star hotels (€)
0
50
100
150
200
250
300
2019201820172016201520142013201220112010
244233
242 241 242 236 232 230 233 239
Five-star hotels
2010 2011 2012 2013 2014 2015 2016 2017 2018 2019 2015-19 CAGR
Available rooms (thousands)
4.5 4.8 5.0 5.1 5.1 5.2 5.2 5.3 5.4 5.5
% change 2.3 6.7 4.2 2.0 0.0 2.0 0.0 1.9 1.9 1.9 1.5
Stay unit nights (millions)
0.8 0.9 1.0 1.0 1.1 1.2 1.2 1.3 1.3 1.3
% change 14.3 12.5 11.1 0.0 10.0 9.1 0.0 8.3 0.0 0.0 3.4
Occupancy rates (%) 48.7 51.4 54.6 53.7 59.1 63.2 63.1 67.2 66.0 64.8
Average room rates(US$)
244 233 242 241 242 236 232 230 233 239
% change -10.9 -4.5 3.9 -0.4 0.4 -2.5 -1.7 -0.9 1.3 2.6 -0.2
Total room revenue
(US$ millions) 195 210 242 241 266 283 278 299 303 311
% change 1.6 7.7 15.2 -0.4 10.4 6.4 -1.8 7.6 1.3 2.6 3.2
Sources: PricewaterhouseCoopers LLP, Wilkofsky Gruen Associates
Sources: PricewaterhouseCoopers LLP, Wilkofsky Gruen Associates
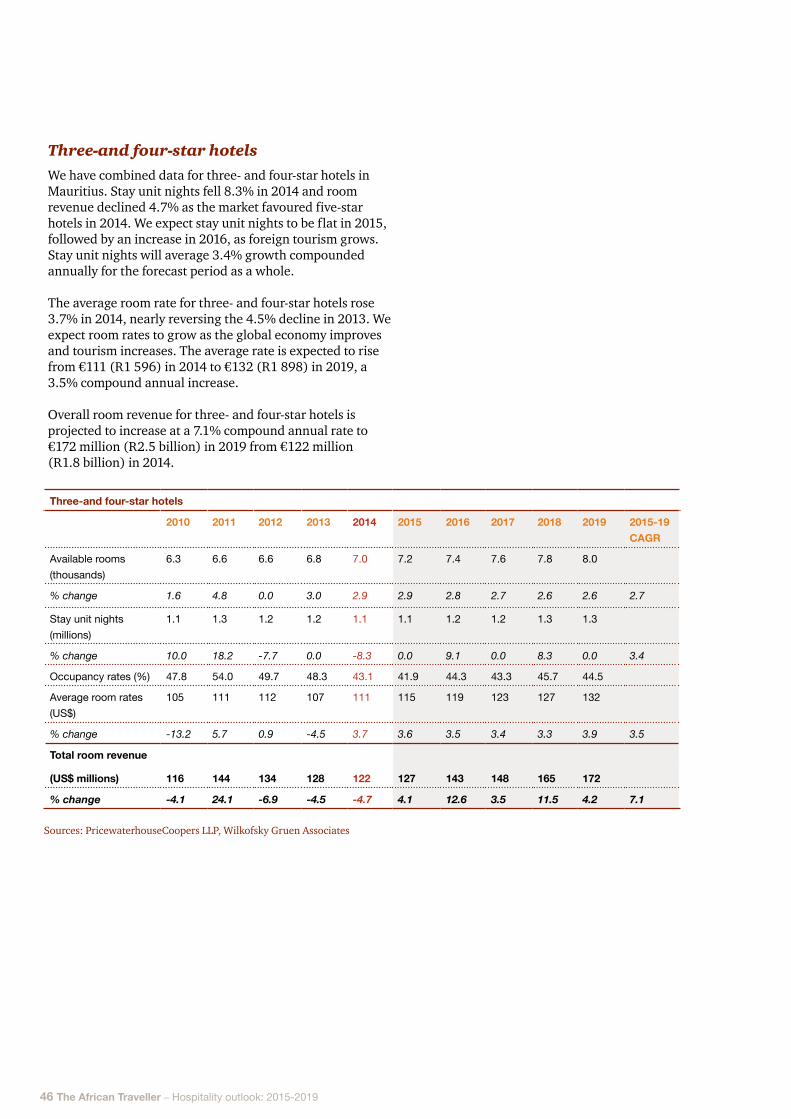
46 The African Traveller – Hospitality outlook: 2015-2019
Three-and four-star hotels
2010 2011 2012 2013 2014 2015 2016 2017 2018 2019 2015-19 CAGR
Available rooms (thousands)
6.3 6.6 6.6 6.8 7.0 7.2 7.4 7.6 7.8 8.0
% change 1.6 4.8 0.0 3.0 2.9 2.9 2.8 2.7 2.6 2.6 2.7
Stay unit nights (millions)
1.1 1.3 1.2 1.2 1.1 1.1 1.2 1.2 1.3 1.3
% change 10.0 18.2 -7.7 0.0 -8.3 0.0 9.1 0.0 8.3 0.0 3.4
Occupancy rates (%) 47.8 54.0 49.7 48.3 43.1 41.9 44.3 43.3 45.7 44.5
Average room rates(US$)
105 111 112 107 111 115 119 123 127 132
% change -13.2 5.7 0.9 -4.5 3.7 3.6 3.5 3.4 3.3 3.9 3.5
Total room revenue
(US$ millions) 116 144 134 128 122 127 143 148 165 172
% change -4.1 24.1 -6.9 -4.5 -4.7 4.1 12.6 3.5 11.5 4.2 7.1
Sources: PricewaterhouseCoopers LLP, Wilkofsky Gruen Associates
Three-and four-star hotelsWe have combined data for three- and four-star hotels in Mauritius. Stay unit nights fell 8.3% in 2014 and room revenue declined 4.7% as the market favoured five-star hotels in 2014. We expect stay unit nights to be flat in 2015, followed by an increase in 2016, as foreign tourism grows. Stay unit nights will average 3.4% growth compounded annually for the forecast period as a whole.
The average room rate for three- and four-star hotels rose 3.7% in 2014, nearly reversing the 4.5% decline in 2013. We expect room rates to grow as the global economy improves and tourism increases. The average rate is expected to rise from €111 (R1 596) in 2014 to €132 (R1 898) in 2019, a 3.5% compound annual increase.
Overall room revenue for three- and four-star hotels is projected to increase at a 7.1% compound annual rate to €172 million (R2.5 billion) in 2019 from €122 million (R1.8 billion) in 2014.
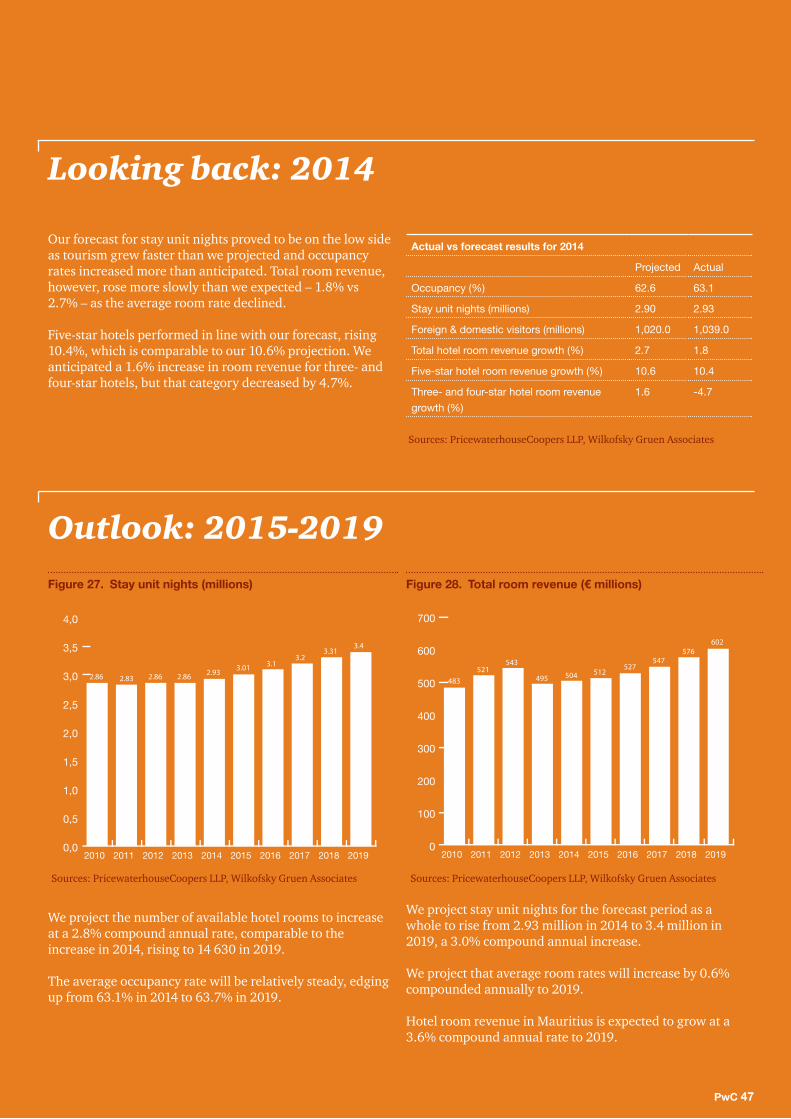
PwC 47
Looking back: 2014
Our forecast for stay unit nights proved to be on the low side as tourism grew faster than we projected and occupancy rates increased more than anticipated. Total room revenue, however, rose more slowly than we expected – 1.8% vs 2.7% – as the average room rate declined.
Five-star hotels performed in line with our forecast, rising 10.4%, which is comparable to our 10.6% projection. We anticipated a 1.6% increase in room revenue for three- and four-star hotels, but that category decreased by 4.7%.
Actual vs forecast results for 2014
Projected Actual
Occupancy (%) 62.6 63.1
Stay unit nights (millions) 2.90 2.93
Foreign & domestic visitors (millions) 1,020.0 1,039.0
Total hotel room revenue growth (%) 2.7 1.8
Five-star hotel room revenue growth (%) 10.6 10.4
Three- and four-star hotel room revenue growth (%)
1.6 -4.7
Sources: PricewaterhouseCoopers LLP, Wilkofsky Gruen Associates
Outlook: 2015-2019
We project the number of available hotel rooms to increase at a 2.8% compound annual rate, comparable to the increase in 2014, rising to 14 630 in 2019.
The average occupancy rate will be relatively steady, edging up from 63.1% in 2014 to 63.7% in 2019.
We project stay unit nights for the forecast period as a whole to rise from 2.93 million in 2014 to 3.4 million in 2019, a 3.0% compound annual increase.
We project that average room rates will increase by 0.6% compounded annually to 2019.
Hotel room revenue in Mauritius is expected to grow at a 3.6% compound annual rate to 2019.
Figure 27. Stay unit nights (millions)
0,0
0,5
1,0
1,5
2,0
2,5
3,0
3,5
4,0
2019201820172016201520142013201220112010
2.86 2.83 2.86 2.86 2.93 3.01 3.13.2
3.313.4
Sources: PricewaterhouseCoopers LLP, Wilkofsky Gruen Associates
Figure 28. Total room revenue (€ millions)
0
100
200
300
400
500
600
700
2019201820172016201520142013201220112010
483521
543
495 504 512527
547576
602
Sources: PricewaterhouseCoopers LLP, Wilkofsky Gruen Associates

48 The African Traveller – Hospitality outlook: 2015-2019
Hotel accommodation in Kenya
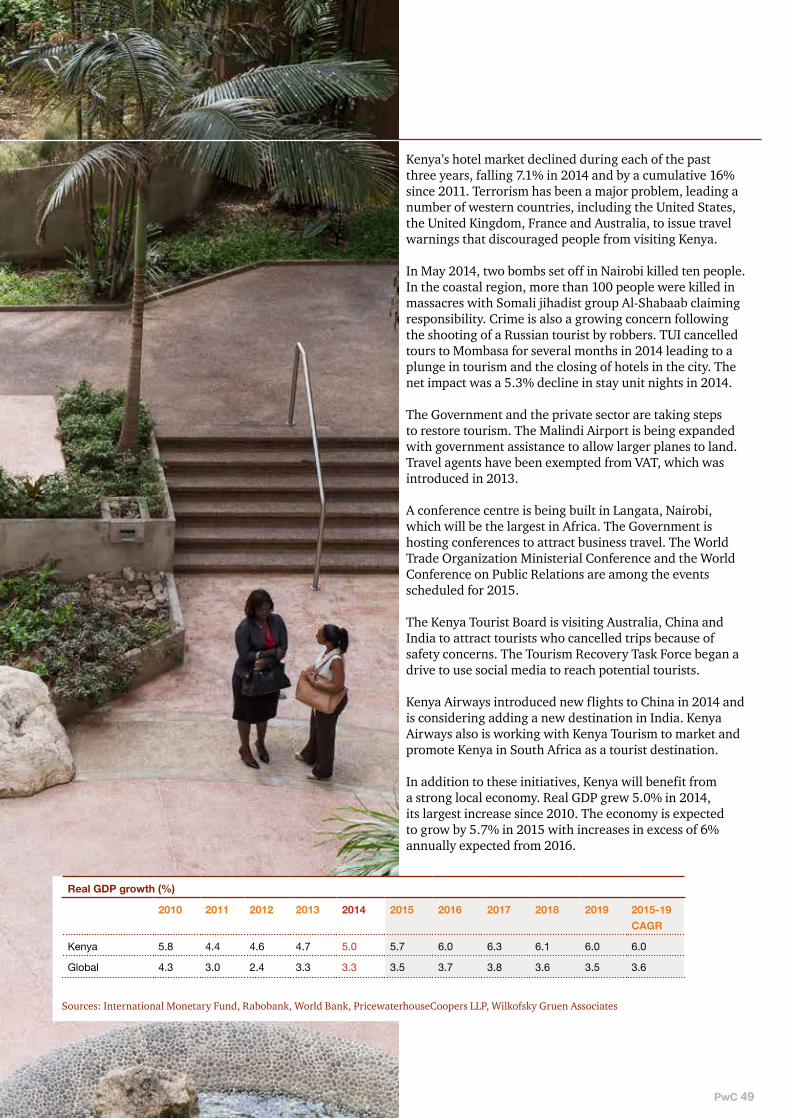
PwC 49
Kenya’s hotel market declined during each of the past three years, falling 7.1% in 2014 and by a cumulative 16% since 2011. Terrorism has been a major problem, leading a number of western countries, including the United States, the United Kingdom, France and Australia, to issue travel warnings that discouraged people from visiting Kenya.
In May 2014, two bombs set off in Nairobi killed ten people. In the coastal region, more than 100 people were killed in massacres with Somali jihadist group Al-Shabaab claiming responsibility. Crime is also a growing concern following the shooting of a Russian tourist by robbers. TUI cancelled tours to Mombasa for several months in 2014 leading to a plunge in tourism and the closing of hotels in the city. The net impact was a 5.3% decline in stay unit nights in 2014.
The Government and the private sector are taking steps to restore tourism. The Malindi Airport is being expanded with government assistance to allow larger planes to land. Travel agents have been exempted from VAT, which was introduced in 2013.
A conference centre is being built in Langata, Nairobi, which will be the largest in Africa. The Government is hosting conferences to attract business travel. The World Trade Organization Ministerial Conference and the World Conference on Public Relations are among the events scheduled for 2015.
The Kenya Tourist Board is visiting Australia, China and India to attract tourists who cancelled trips because of safety concerns. The Tourism Recovery Task Force began a drive to use social media to reach potential tourists.
Kenya Airways introduced new flights to China in 2014 and is considering adding a new destination in India. Kenya Airways also is working with Kenya Tourism to market and promote Kenya in South Africa as a tourist destination.
In addition to these initiatives, Kenya will benefit from a strong local economy. Real GDP grew 5.0% in 2014, its largest increase since 2010. The economy is expected to grow by 5.7% in 2015 with increases in excess of 6% annually expected from 2016.
Real GDP growth (%)
2010 2011 2012 2013 2014 2015 2016 2017 2018 2019 2015-19 CAGR
Kenya 5.8 4.4 4.6 4.7 5.0 5.7 6.0 6.3 6.1 6.0 6.0
Global 4.3 3.0 2.4 3.3 3.3 3.5 3.7 3.8 3.6 3.5 3.6
Sources: International Monetary Fund, Rabobank, World Bank, PricewaterhouseCoopers LLP, Wilkofsky Gruen Associates
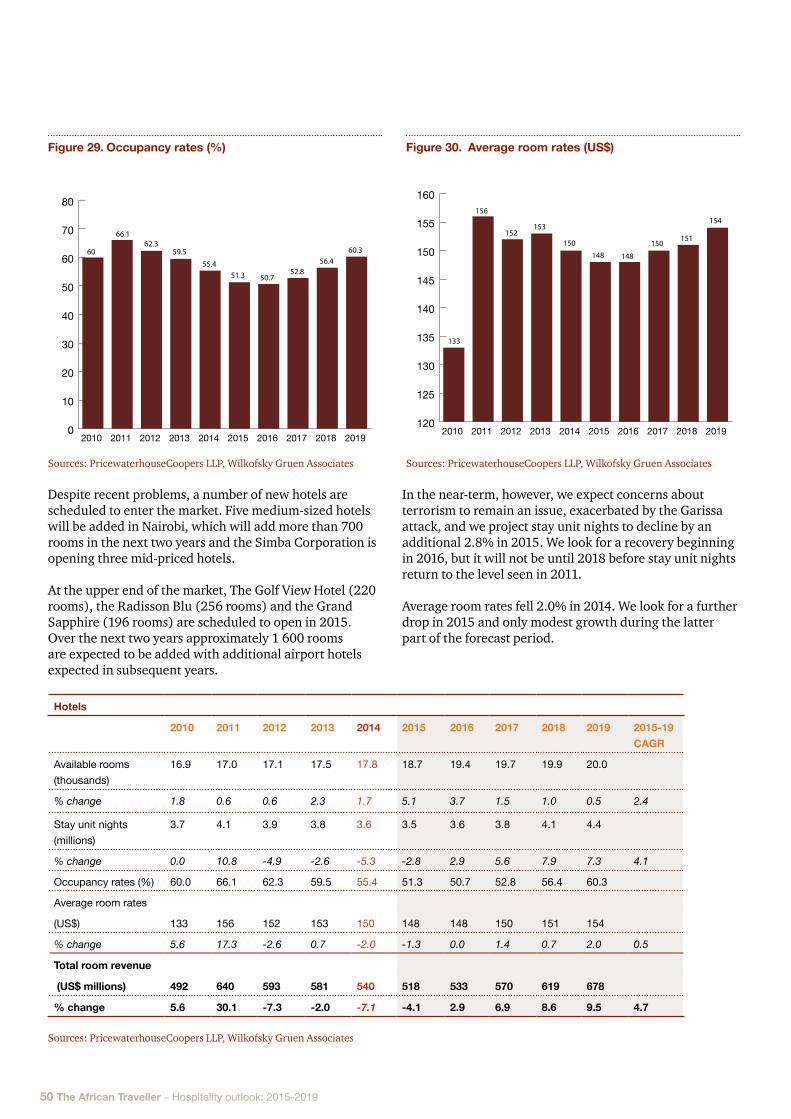
50 The African Traveller – Hospitality outlook: 2015-2019
Hotels
2010 2011 2012 2013 2014 2015 2016 2017 2018 2019 2015-19 CAGR
Available rooms (thousands)
16.9 17.0 17.1 17.5 17.8 18.7 19.4 19.7 19.9 20.0
% change 1.8 0.6 0.6 2.3 1.7 5.1 3.7 1.5 1.0 0.5 2.4
Stay unit nights (millions)
3.7 4.1 3.9 3.8 3.6 3.5 3.6 3.8 4.1 4.4
% change 0.0 10.8 -4.9 -2.6 -5.3 -2.8 2.9 5.6 7.9 7.3 4.1
Occupancy rates (%) 60.0 66.1 62.3 59.5 55.4 51.3 50.7 52.8 56.4 60.3
Average room rates
(US$) 133 156 152 153 150 148 148 150 151 154
% change 5.6 17.3 -2.6 0.7 -2.0 -1.3 0.0 1.4 0.7 2.0 0.5
Total room revenue
(US$ millions) 492 640 593 581 540 518 533 570 619 678
% change 5.6 30.1 -7.3 -2.0 -7.1 -4.1 2.9 6.9 8.6 9.5 4.7
Sources: PricewaterhouseCoopers LLP, Wilkofsky Gruen Associates
Despite recent problems, a number of new hotels are scheduled to enter the market. Five medium-sized hotels will be added in Nairobi, which will add more than 700 rooms in the next two years and the Simba Corporation is opening three mid-priced hotels.
At the upper end of the market, The Golf View Hotel (220 rooms), the Radisson Blu (256 rooms) and the Grand Sapphire (196 rooms) are scheduled to open in 2015. Over the next two years approximately 1 600 rooms are expected to be added with additional airport hotels expected in subsequent years.
In the near-term, however, we expect concerns about terrorism to remain an issue, exacerbated by the Garissa attack, and we project stay unit nights to decline by an additional 2.8% in 2015. We look for a recovery beginning in 2016, but it will not be until 2018 before stay unit nights return to the level seen in 2011.
Average room rates fell 2.0% in 2014. We look for a further drop in 2015 and only modest growth during the latter part of the forecast period.
Figure 29. Occupancy rates (%)
0
10
20
30
40
50
60
70
80
2019201820172016201520142013201220112010
60
66.162.3
59.5
55.451.3 50.7
52.856.4
60.3
Figure 30. Average room rates (US$)
120
125
130
135
140
145
150
155
160
2019201820172016201520142013201220112010
133
156
152153
150
148 148
150151
154
Sources: PricewaterhouseCoopers LLP, Wilkofsky Gruen Associates Sources: PricewaterhouseCoopers LLP, Wilkofsky Gruen Associates
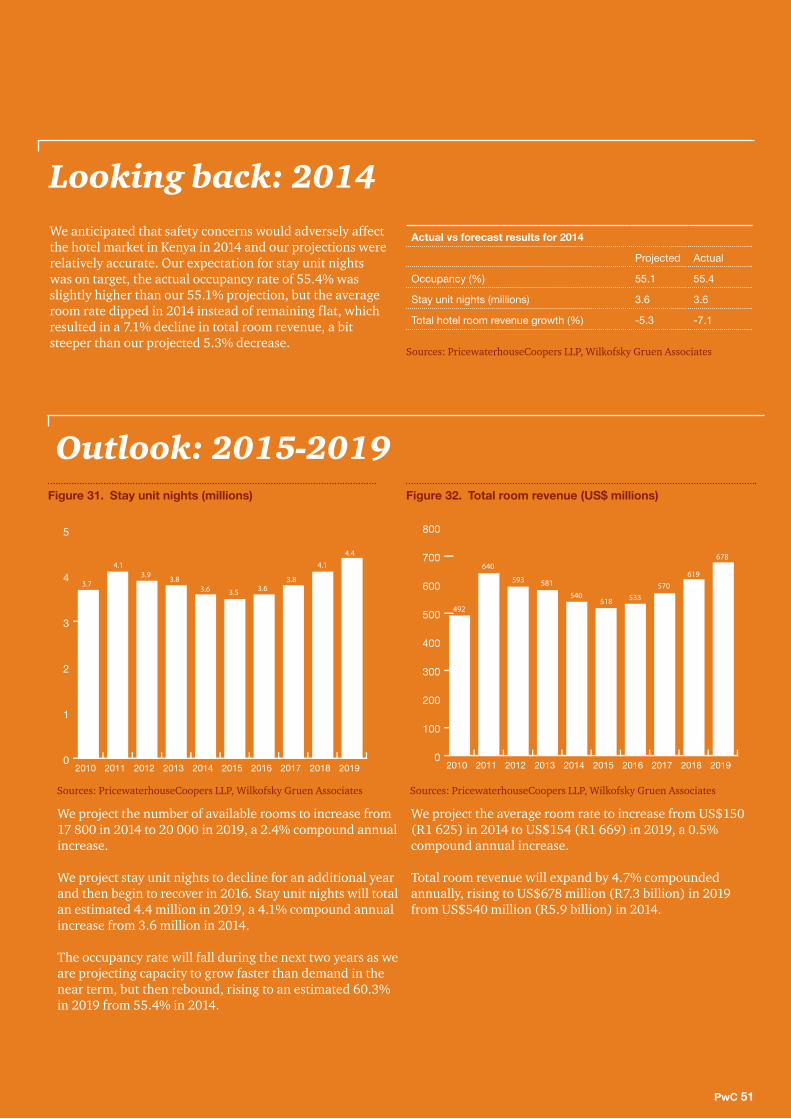
PwC 51
Figure 31. Stay unit nights (millions)
0
1
2
3
4
5
2019201820172016201520142013201220112010
3.7
4.13.9 3.8
3.6 3.5 3.63.8
4.1
4.4
Looking back: 2014We anticipated that safety concerns would adversely affect the hotel market in Kenya in 2014 and our projections were relatively accurate. Our expectation for stay unit nights was on target, the actual occupancy rate of 55.4% was slightly higher than our 55.1% projection, but the average room rate dipped in 2014 instead of remaining flat, which resulted in a 7.1% decline in total room revenue, a bit steeper than our projected 5.3% decrease.
Actual vs forecast results for 2014
Projected Actual
Occupancy (%) 55.1 55.4
Stay unit nights (millions) 3.6 3.6
Total hotel room revenue growth (%) -5.3 -7.1
Sources: PricewaterhouseCoopers LLP, Wilkofsky Gruen Associates
Outlook: 2015-2019
We project the number of available rooms to increase from 17 800 in 2014 to 20 000 in 2019, a 2.4% compound annual increase.
We project stay unit nights to decline for an additional year and then begin to recover in 2016. Stay unit nights will total an estimated 4.4 million in 2019, a 4.1% compound annual increase from 3.6 million in 2014.
The occupancy rate will fall during the next two years as we are projecting capacity to grow faster than demand in the near term, but then rebound, rising to an estimated 60.3% in 2019 from 55.4% in 2014.
Figure 32. Total room revenue (US$ millions)
0
100
200
300
400
500
600
700
800
2019201820172016201520142013201220112010
492
640
593 581
540518 533
570619
678
We project the average room rate to increase from US$150 (R1 625) in 2014 to US$154 (R1 669) in 2019, a 0.5% compound annual increase.
Total room revenue will expand by 4.7% compounded annually, rising to US$678 million (R7.3 billion) in 2019 from US$540 million (R5.9 billion) in 2014.
Sources: PricewaterhouseCoopers LLP, Wilkofsky Gruen Associates Sources: PricewaterhouseCoopers LLP, Wilkofsky Gruen Associates
52 The African Traveller – Hospitality outlook: 2015-2019
How safe is your hotel network?
By Veneta Eftychis
The security of guest information and operational technology has emerged as an enterprise-wide business risk for the hotel industry. These cyber risks are influenced by the growing strategic importance of technology and the increased value of intangible assets, such as guest information, created and managed on hotel technology platforms.
With the volume of credit card swipes at check-in, as well as at hotel bars, restaurants and shops, hotels offer ample opportunities for cyberattacks. Not only do they transact business through credit cards, but those cards are kept on file and often accessed multiple times during a guest’s stay. Each charge made at a spa, gift shop, bar or restaurant during the course of a stay is another opportunity for cybertheft.
Hackers have been infiltrating hotel networks over recent years and have infected both hotel-owned computers and guest computers in order to steal sensitive personal and confidential information. Hotel network have been attacked using mathematical techniques and crypto-analytical offensive capabilities. Hackers typically wait for guests to check in and log on to the hotel Wi-Fi by usually submitting their room number and surname. Thereafter, the hotel guest gets tricked into downloading and installing a so-called backdoor file, which pretends to be an update for legitimate software, such as the Google Toolbar or Adobe Flash.
The unsuspecting guest victim downloads this hotel ‘welcome package’, only to infect his/her machine with spying software. Once on a network, the backdoor may be used further to download more advanced tools such as an advanced key logger. Downloaded software may also looks for Twitter, Facebook and Google login credentials, as well as other private information.
The activities of hackers have been so strategic that they appear to have known the names, arrival and departure times, and room numbers of the targets in past attacks. After such attacks, the hackers delete their tools from the hotel network and go back into hiding.
The most widespread attacks experienced in the industry have been committed by the so-called DarkHotel group, believed to have been active for the past four years, which targets high-profile guests staying in hotels where there is free Wi-Fi that was assumed to be secure.
South Africa was hit by a massive cyber fraud attack during 2012 and 2013 in which the payment card systems of thousands of shops, restaurants and hotels were compromised. The attackers used malware known as Dexter and were linked to a series of attacks on point-of-sale systems worldwide. The malware skimmed and transmitted cards’ magnetic-strip information, allowing clones to be made that were used for fraudulent purchases.
There are a number of safeguards guests can put in place in order to mitigate the risk of attack:
• They should avoid updating software or clicking files when not on trusted networks;
• They should keep their antivirus software up-to-date, before they leave home; and
• They should use a virtual private network (VPN) to establish an encrypted communication channel when accessing public or semi-public Wi-Fi
• Hotels can also do more to mitigate the risk:
• Hotel executives should take the threat of computer security breaches seriously by implementing the most up-to-date prevention and risk management practices, creating an emergency response plan and securing sufficient insurance coverage.
• •Hotels should consider intentional acts of theft by employees. For example, food and beverage servers can use small devices, easily hidden in a pocket, to swipe customer credit cards over an extended period of time and then sell the data.
• Hotels can define roles, responsibilities and oversight. Responsibility for data security may fall to a chief information officer, chief security officer or a new position being created called chief privacy officer. Whoever is responsible, the person’s role should be clearly defined, including interactions with other
PwC 53
departments and relevant outside vendors. Board oversight should also be considered. Is there a board member or audit committee with the technical expertise to adequately review cybersecurity issues?
• Conduct a risk assessment. This assessment should be specific to guest privacy policies and data security. Hotels need to know how, why and where data is vulnerable and what safeguards are applied to each computer and device. You should see a network map that shows where data is stored and who controls it.
• Get expert help. These experts can offer valuable tools to help build the firewalls, data encryption and other safeguards necessary.
• Consider mobile and social media policies. Hotels can extend their policies across social media and mobile devices, and create enforceable employee policies.
• While effective safeguards can protect a hotel from many threats, hackers are becoming more sophisticated and often operate overseas. This makes it more difficult to investigate and prosecute suspected attacks – and essential to have privacy and data breach insurance coverage.
The impact of a cyberattackFirstly, there is a financial impact when any type of computer security breach occurs. Costs can include:
• Forensic computer investigations to confirm the breach and identify whose information has been put at risk. This can be a costly endeavour;
• Costs to draft and deliver notifications to individuals, the payment card industry or a regulator;
• Credit or identity protection services for affected individuals; and
• Crisis management and public relations specialists to help mitigate the potential fallout from a breach event.
Secondly, history does not provide a consistent picture of the impact of cybersecurity on a company’s performance. Until very recently, most of the long-term impact of cyber events was thought to be minimal. In most cases stock prices eventually recovered to pre-breach levels and very limited customer turnover occurred. More recent breaches have been seen to have an impact on customer loyalty and store traffic, which has the potential to have a more lasting impact on long-term profitability and share value.
Data breaches can also carry personal risk for hotel executives and board members. Attacks are drawing increased scrutiny from government regulators, including the US Securities and Exchange Commission (SEC), which want to ensure directors and officers are taking the necessary steps to prevent breaches.
54 The African Traveller – Hospitality outlook: 2015-2019
How PwC help can youPwC’s holistic approach to cyber security helps clients establish security fundamentals, formulate an executable and agile cyber security strategy, implement tools for cyber security, help them respond to cyber incidents and ensure the effectiveness of controls to prevent cyberattacks:
• Strategy & governance (policy, framework, certification) We help clients formulate a cyber security strategy to meet business objectives in the near and long term; and monitor and guide alignment to keep up with the changing threat landscape.
• Security architecture We assist clients to develop a business-driven security architecture keeping in mind current capabilities and focusing on remediating identified gaps.
• Threat and vulnerability management We help assess exposures for clients through comprehensive tests of controls and solutions for preventing intrusions or attacks.
• Security implementation We help clients leverage technology optimally to enhance cyber security.
• Security as a service We provide clients with end-to-end operational cyber security support.
• Risk and compliance We assist clients to ensure the effectiveness of compliance management to firm policies, regulatory requirements and industry standards.
• Identify and access management We help clients improve controls around access to information and improve the confidentiality, integrity and availability of critical data.
ReferencesPwC USA, “What investors need to know about cybersecurity”, June 2014. Accessed at http://www.pwc.com/en_US/us/pwc-investor-resource-institute/insights-for-the-investment-community/assets/pwc-cybersecurity-leading-practices-for-investors.pdf
Daily Mail, “Is it safe to use Wi-Fi on holiday? ‘Darkhotel’ campaign launches cyberattacks through hotel networks to steal personal information” \, Novembner 2014. Accessed at http://www.dailymail.co.uk/sciencetech/article-282860w6/Is-safe-use-Wi-Fi-holiday-Darkhotel-campaign-launches-cyberattacks-hotel-networks-steal-personal-information.html
Risk Management Monitor, “Darkhotel Cyber Attacks Are Targeting Traveling Executives”, November 2014. Accessed at http://www.riskmanagementmonitor.com/darkhotel-cyber-attacks-targeting-traveling-executives/
PwC India, “Cyber Security India” , December 2014. Accessed at https://pwc-spark.com/docs/DOC-369899
BBC News, “Dexter payment card malware strikes South Africa”, October 2013. Accessed at http://www.bbc.com/news/technology-24550505

PwC 55
PwC Africa
Hospitality industry group contacts
Technology, Information, Communications and Entertainment Industry Leader – South Africa
Berno Niebuhr [email protected] +27 (0)12 429 0050
Technology, Information, Communications and Entertainment Industry Leader – Nigeria
Osere Alakhume [email protected] +234 (1) 271 1700 Ext 4103
Technology, Information, Communications and Entertainment Industry Leader – Mauritius
Jean-Pierre Young
[email protected] +230 404 5028
Technology, Information, Communications and Entertainment Industry Leader – Kenya
Michael Mugasa
[email protected] +254 20 2855 688
Hospitality Leader and Assurance services – Southern African
Nikki Forster
[email protected] +27 (0)11 797 5362
Advisory services – Southern African
Marthie Crafford
[email protected] +27 (0)11 797 4555
Taxation services– Southern African
Louis Carney
[email protected] +27 (0)11 797 4715
Corporate finance – Southern African
Jan Groenewald
[email protected] +27 (0)11 797 5380
Transaction services – Southern African
Peter McCrystal
[email protected] +27 (0)11 797 5275
© 2015. PricewaterhouseCoopers “PwC”, the South African firm. All rights reserved. In this document, “PwC” refers to PricewaterhouseCoopers in South Africa, which is a member firm of PricewaterhouseCoopers International Limited (PwCIL), each member firm of which is a separate legal entity and does not act as an agent of PwCIL.
“PwC” is the brand under which member firms of PricewaterhouseCoopers International Limited (PwCIL) operate and provide services. Together, these firms form the PwC network. Each firm in the network is a separate legal entity and does not act as agent of PwCIL or any other member firm. PwCIL does not provide any services to clients. PwCIL is not responsible or liable for the acts or omissions of any of its member firms nor can it control the exercise of their professional judgment or bind them in any way.
Scan the QR code to download an electronic copy of this document.