hospitals' contribution to the high cost of u.s. health care
TRANSCRIPT

1
Nuoya Li Contributor: Jules Clark August 21, 2014
Hospitals Contribution to the High Cost of U.S. Health Care
Introduction
U.S health care costs have been burdening taxpayers and driving down the U.S. economy for
decades: they made up 17.2 percent of the Gross Domestic Product (GDP) in 2012 and are
projected to grow at an average rate of 5.8 percent from 2012-2022i, according to the Centers
for Medicare & Medicaid Services (CMS). The projected growth reflects coverage expansion and
Medicare payment adjustments implemented by the Affordable Care Act (ACA), as well as
general inflation in health care. In spite of its effort to improve access and quality of care, the
ACA or Obamacare, does not address the core problem of exceedingly high cost.
In the global context, the U.S. has taken a lead in total health cost since the middle 1990s.
Compared to other affluent countries, however, the U.S. fails to create a value-based system
with a positive return on its health care investment: in other words we spend more but do not
obtain better outcomes.
Comparing Health Care Metrics
Higher growth rates keep widening the gap between the U.S. and other developed countries,
most notably in terms of total and per capita health spending. Among the ten countries whose
GDP per capita are greater than the U.S., only Norway and Switzerland have higher health
expenditures per capita.

2
Table 1. A Lower Health “Return on Investment” in the U.S.
Source: World Bank Data, 2012
Table 1 compares the U.S. with both high income OECD and non-OECD countries by health
investment and selected outcomes in 2012. High income OECD countries outperform the U.S. in
life expectancy at birth and infant mortality rate. In sum, excessive spending on health care
puts a strain on the American consumer, without improving their personal health condition.
To understand this paradox, we examine where we are overspending and why the cost is not
enhancing value for patients.
Chart 1. Hospital care is the chief driver
Source: Haver, Centers for Medicare and Medicaid Services, 2013
Health expenditure per capita Health expenditure, total Mortality rate, infant Life expectancy at birth, total
(current US$) (% of GDP) (per 1,000 live births) (years)
U.S. 8895.115758 17.90905845 6 78.74146341
High income: OECD 5381.876661 12.9085045 4.437005221 80.68511915
High income: Non-OECD 967.2011977 4.891975581 8.87249661 73.44282465
Country
32%
21% 9% 2%
2% 2%
3%
4%
5%
3% 6%
1%
1%
6%
3%
U.S. Health care spending breakdown, 2013
Hospital CareExpenditures(Mil.$)
Physician And Clinical ServiceExpenditures(Mil.$)
Prescription DrugsExpenditures(Mil.$)
Research Expenditures(Mil.$)

3
Hospital care is the chief cost driver in the U.S. health care system. Other personal health care
expenditures like physician and clinical services, and prescription drugs also account for a big
portion of the total. Research on medical innovation to fight disease on the other hand is only a
small slice (2%) of the pie.
Chart 2. Hospital Care Weighs a Lot on Households
Source: 2014 Milliman Medical Index
The total annual cost of employer-sponsored health care for a typical family of four, measured
by the 2014 Milliman Medical Index (MMI) has more than doubled over the past 10 years. Its
growth rate is still well above that of the consumer price index (CPI). The MMI index takes
“utilization of care, the amount charged for each service, and the mix of services used” into
consideration while evaluating the cost under five separate categories: inpatient and outpatient
facility care, professional services, pharmacy and other services. These costs do not include
insurance premiums, but rather the medical expenses shared by employees and employers.
Since inpatient and outpatient care combined contribute to more than half of the MMI, hospital
Inpatient 31%
Outpatient 19%
Professional Services
31%
Pharmacy 15%
Other 4%
2014 MMI Components of Spending

4
cost plays a vital role in a family’s financial wellbeing. ii To help consumers resolve the puzzle, it
is time that we dive into the details of hospital cost, with a focus on utilization and pricing.
Overuse in Outpatient Care
Some argue that increased spending is caused by coverage expansion. It is indeed a positive
sign that the number of people covered by government or private insurance in the U.S. has
soared by 23.8 percent from 1987 to 2011. iii
In the meantime, hospitals are prompted to open new outpatient facilities for a growing
volume of visits. As a national trend, the number of outpatient visits rose more than 23 percent
from 2000 to 2009, whereas inpatient admission has flattened out in recent years. iv
Chart 3. Outpatient Spending Surpassing All Other Categories
Source: The 2012 Health Care Cost and Utilization Report
4.10% 4.00%
6.10%
3.80%
1.70%
4.00%
2.40%
6.50%
3.10% 3.80%
All categories Inpatient Outpatient Professional ProceduresPrescription Drugs
Annual Expenditure Per Capita by Catagories (2010-2012)
percent change 2010/2011 percent change 2011/2012

5
For individuals younger than 65 and covered by employer sponsored insurance (ESI), per capita
spending in outpatient care surged fastest from 2010 to 2012. The expansion in outpatient
visits to emergency rooms, outpatient surgery centers, and observation services was greatest
(7.2%). v
Table 2. Overuse in Outpatient Services
Source: 2012 OECD Health Data
OECD Health Data from 2012 reveals that the U.S. conducts way more Tonsillectomy (the
surgical removal of the tonsils), MRI (Magnetic resonance imaging) and CT exams than other
OECD countries. Notably, the U.S. ranked No.1 in knee replacements, and the total treatment
number in Medicare patients has increased by 162 percent in the past 20 years.vi As a
consequence, a debate about whether all tests are warranted has risen to the forefront. Karen
Sepucha, director of the Health Decision Sciences Center at Massachusetts General Hospital,
pointed out that the focuses of physicians and patients rarely overlap. She argues that effective
Items United States Rank compared with OECD countries OECD average
MRI units 31.6 2nd 12.5
per million population per million population
MRI exams 97.7 2nd 46.3
per 1 000 population per 1 000 population
CT scanners 40.7 3rd 22.6
per million population per million population
CT exams 265 3rd 123.8
per 1 000 population per 1 000 population
Tonsillectomy 254.4 1st 130.1
per 100 000 population per 100 000 population
Coronary bypass 79 3rd 47.3
per 100 000 population per 100 000 population
Knee replacements 226 1st 121.6
per 100 000 population per 100 000 population
Caesarean sections 32.9 6th 26.1
per 100 live births per 100 live births

6
communication with doctors as well as decision aids for different conditions will help patients
weigh the pros and cons of each treatment. vii
How we categorizer the use, and subsequent cost of each service is determined by whether a
person’s hospitals status is inpatient or outpatient. To be admitted as an inpatient patient, you
will need approvals from both your doctor and the hospital. Your hospital status in turn affects
how much you pay, including coinsurance, deductibles, and copayments, etc. viii
Therefore, to cope with the reimbursement shortfalls from Medicare and Medicaid inpatient
admissionsix , hospitals ease their financial pressures by enlarging the proportion of outpatient
services.
Physicians may exacerbate the condition by ordering as many tests as possible with less
emphasis on the patients’ individual needs. The perverse incentives stem from a system where
more and more types of services are covered, while prices are set by insurance companies, and
doctors are compensated for delivering each exam. This fee-for-service payment model is a far
cry from a fixed salary system, where doctor’s primary goal is to provide the patient with the
most effective and appropriate treatment.
Hospital Pricing Methodology
An overuse in outpatient services does not tell the whole story, however. Unit prices contribute
more to the waste of our health care expenditures than utilization does. According to an
analysis from the National Health Expenditure Accounts Team, 60 percent of the change in
personal health care spending from 2008 to 2009 can be attributed to general and medical
price inflation. As it relates to the price of hospital care, we propose that price discrimination

7
stems from hospital pricing methodologies for different payers —the government, private
insurers, and the uninsured.
Government
The U.S. government supports individuals’ health demand in several dimensions: Medicaid
provides health care for low-income and disabled people; The Children’s Health Insurance
Program (CHIP) covers low-income children; Medicare, which we will discuss in details below,
covers mostly those older than 65.x
The government has its own pricing formulas when it pays hospitals on behalf of individuals
insured by these federal programs. To calculate the exact amount of payment, Medicare adopts
the “case-based” payment system where all hospitals are reimbursed at fixed rates. Those rates
are pre-determined for each treated case in a given category, and are set for a group of
hospitals to reflect the average expected cost in an average-performing hospital, incentivizing
hospitals to reduce their operating cost.
To relate the type of treatment and patients to the costs incurred by hospitals, the government
provides unique classification schemes: Diagnosis-related groups (DRGs) for inpatient services
and Ambulatory Payment Classifications (APCs) for outpatient services. The monetary
conversion factors track changes in technology and market conditions.
To calculate the payment for an inpatient consumer, the base payment rate is first adjusted for
geographical factors that include a labor-related share, a wage index and a cost-of-living
adjustment (COLA). For example, places with higher cost of living will adopt a higher base rate.
Medicare then multiplies the adjusted base rate by the relative payment weights of DRGs and
APCs which capture the average cost of providing services per case. Exceptionally, hospitals are

8
given extra reimbursement under certain circumstances to cover indirect costs from medical
education, a higher portion of low-income patients, etc. xi
Unlike for private insurance, hospital’s pricing formulas adopted for government sponsored
insurance have recently become fairly transparent with the public release of DRGs and APCs
data from CMS. Hospitals do not wield any bargaining power because the rates are fixed ahead
of time.
Private insurers
Unlike the government, private insurers pay hospitals mainly on discounted charges, negotiated
per-diems, or diagnosis related groups (DRGs).
Payment negotiations happen annually based on the monetary conversion factors, DRG weights
and myriad of fees. xii Whatever the method, the negotiation process between each hospital
and insurer bears an impact on the discount off the chargemaster price across a range of
services and thus on how much consumers pay for their health plan premiums. On a case basis,
payments are also adjusted for case severity or for some standard procedures.
A natural byproduct of one-on-one negotiations between the insurer and the hospital is the
possibility for price discrimination. This means that charges for identical goods and services may
differ by hospital and insurer, and enormous price differentials are largely driven by the
negotiating leverages of hospitals and insurers.
While a provider’s leverage lies in the range of services it offers, a private insurer bargains
according to its market share, specifically its ability to send patients to providers. Hospitals are
in a stronger negotiating position than primary care providers and specialists due to an
9
irreplaceable combination of reputation, location, and services such as the emergency room.xiii
Despite tentative steps towards price transparency between insurers and hospitals, the
majority of actual payments remain undisclosed to the public.
Uninsured
The uninsured do not rely on any pricing methodology or structure when they are billed for
hospital services. In most cases, there is no legal or regulatory constraint imposed on hospitals
for charging lofty prices. This leaves the uninsured at the mercy of hospitals, with no bargaining
power for granted discounts off the chargemaster. Many hospitals don’t charge the uninsured
the full chargemaster price knowing that the patients cannot afford to pay.
As a result of extremely high variability in pricing and minimal cost transparency, the uninsured
are placed in a vulnerable position where they tend to face exceptionally higher costs for the
same service than insured patients. As a result, most uninsured have no choice but to
accumulate debt or compromise their credit ratings. xiv
Fluctuations in APCs and DRGs
One aspect of the highly variable hospital prices is the wide range in the cost weights of DRGs
and APCs, which intend to measure the resource requirement of certain services.
Since Medicare payments to hospitals vary enormously under a regulated pricing system, those
covered under private insurance are faced with greater uncertainty and an unintelligible pricing
negotiation process.

10
To list a few examples of price differences across hospitals within one state for the same
service, we analyze the “Provider Utilization & Payment Data” from CMS. xv
For hospitals in Texas in 2012, the APC “Magnetic Resonance Imaging and Magnetic Resonance
Angiography without Contrast (MRI)” has an average total payment of $332.16 and its range
($219.34) is 66 percent of the average and 75 percent of the lowest price ($293.27).
There appears to be a remarkable variation for some inpatient services. For hospitals in
California in 2102, “Major Joint Replacement or Reattachment Of Lower Extremity W MCC”, the
second most commonly used procedures in California, has an average total payment of
$17,422.28 and its range ($28,263.65) is 1.62 times the average and 1.86 times the lowest price
($15,193.82).
The DRG “Heart Failure & Shock W MCC”, the thirdly most commonly used procedures in
California, has an average total payment of $13,444.20 with a range ($23,555.75) 1.75 times
the average and 2.6 times the lowest price ($9,056.82).
Besides the DRGs and APCs weights, the costs of Tonsillectomy and knee replacements can be
complicated by age, overall health of the patient, the length of hospital stay, the type of
implant and the surgical approach, etc.xvi xvii In order to eliminate the tremendous price gap,
CalPERS introduced reference pricing for knee and hip replacement in 2011. xviii
Market Power: Insurance Companies vs. Hospitals
Dividing up hospital care by source of funds, we noticed that private insurance program
expenditures have been soaring faster than government sponsored ones. They have increased
by more than 20 percent in the past five years (2009-2013) and were highest in 2013. xix

11
Chart 4. Trends in Hospital Care by Source of Funds
Source: Haver, Centers for Medicaid and Medicare Services, 1965-2013
High and varying prices for privately insured patients underscore the relative bargaining power
of hospitals and insurance companies, in each instance.
Insurance companies include more hospitals for a broader provider networks so to fulfill the
demand from insurance plan purchasers. If insurance companies do not include must-have
providers in their plans, they may lose consumers to competitors. Larger insurance companies
are able to drive prices further down thanks to a comprehensive provider network. Industry
leaders like Cigna Corp. (CI) achieved a net profit margin of 6.3 percent in the second quarter of
2014xx, almost twice as much as the health insurance industry average (3.2%).xxi
It is an intuitive concept that fierce competition among health plans will drag revenues down
for insurance companies and force them to cut administrative and operating costs. Kate and
Robin found economically significant effects of health insurer competition on negotiated
hospital prices through their empirical investigation of the two largest commercial insurers in
0
50000
100000
150000
200000
250000
300000
350000
400000
19
65
19
67
19
69
19
71
19
73
19
75
19
77
19
79
19
81
19
83
19
85
19
87
19
89
19
91
19
93
19
95
19
97
19
99
20
01
20
03
20
05
20
07
20
09
20
11
20
13
Hospital Care Expenditures by Source of Funds
Private Health Insurance(Mil.$) Medicare(Mil.$) Medicaid(Mil.$)
12
California. The dataset contains insures’ transaction prices paid to hospitals along with their
provider networks.
Most hospitals will lower negotiated price if there is more competition between insurance
companies. For the most appealing hospitals, however, this does not hold true. They can take
advantage of increased competition by charging higher rates because consumers are disposed
to switch insurers when the most attractive hospital is dropped. This will allow hospitals to
bargain more aggressively and mitigate the original benefit of insurer competition. xxii
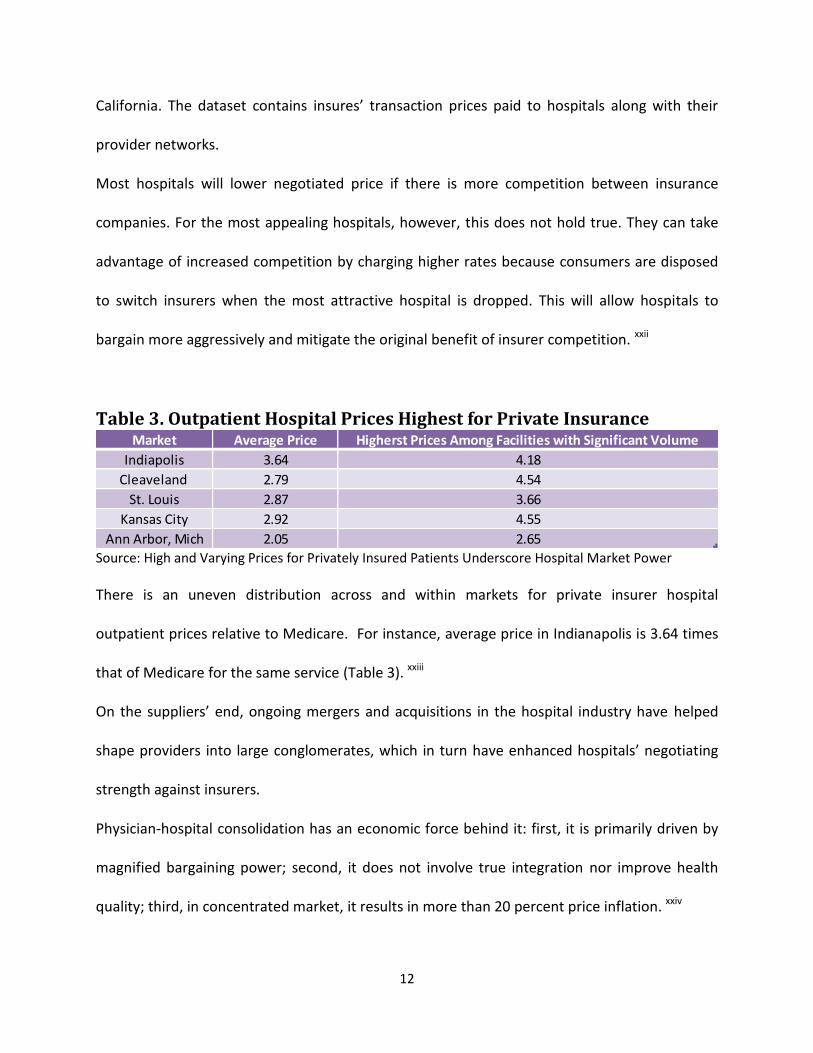
Table 3. Outpatient Hospital Prices Highest for Private Insurance
Source: High and Varying Prices for Privately Insured Patients Underscore Hospital Market Power
There is an uneven distribution across and within markets for private insurer hospital
outpatient prices relative to Medicare. For instance, average price in Indianapolis is 3.64 times
that of Medicare for the same service (Table 3). xxiii
On the suppliers’ end, ongoing mergers and acquisitions in the hospital industry have helped
shape providers into large conglomerates, which in turn have enhanced hospitals’ negotiating
strength against insurers.
Physician-hospital consolidation has an economic force behind it: first, it is primarily driven by
magnified bargaining power; second, it does not involve true integration nor improve health
quality; third, in concentrated market, it results in more than 20 percent price inflation. xxiv
Market Average Price Higherst Prices Among Facilities with Significant Volume
Indiapolis 3.64 4.18
Cleaveland 2.79 4.54
St. Louis 2.87 3.66
Kansas City 2.92 4.55
Ann Arbor, Mich 2.05 2.65

13
A Nevada patient’s original echocardiogram bill was $373 before the merger but jumped to
$1,605 after a hospital system purchased the physicians’ practice. xxv
Once a hospital gains a stronger market position, it is more likely to shift cost from public
payers to private insurers and the uninsured through price discrimination. In fact, while the
majority of doctors were self-employed a decade ago, a quarter of them have flocked to
hospitals and consolidated into practice groups. xxvi
Other Cost Drivers?
Medical Technology
Representing a sizable portion of health care in the U.S., hospitals serve as the crucial channel
through which technology pushes up total health spending. Mostly, cutting edge medical
technology leads to more expensive hospital treatment. Out of economic and legal incentives,
health care providers tend to form a strong cooperative relationship with equipment
manufacturers and drug producers. Consequently, hospitals conduct more tests, prescribe
more drugs and substitute low-cost services with high-cost options to generate significant
revenues.
An important subset of technological advancements in health care, are drugs in the
pharmaceutical industry. The price of prescription drugs in the U.S. is 50 percent higher than
that of comparable products in other developed countries.xxvii Both drug utilization and price
increased last year, with an overall drug trend reaching 3.8 percent per member, per month
compared to a moderate growth (0.8 percent) in traditional medications. xxviii

14
Chart 5. Average Profit Margin by Field
Source: Yahoo Finance; Aetna; American Hospital Association Resource Center Blog
Not surprisingly, major drug manufactures are the biggest winners, the single player with a
rising net profit margin from 2012 to 2014, as is exhibited by a simple comparison of industries.
xxix xxx xxxi
With more than 70 percent of Americans depending on at least one prescription drug, xxxii the
ACA does not tackle the problem of high drug costs but assists consumers by incorporating
prescription drug coverage as one of the 10 essential benefits in all individual and small group
health plans.
Administrative Cost
Insurance companies and hospitals can accrue high administrative costs and service fees, due to
the multitude of players in our health care system. Because hospitals and clinics lack a
standardized, transparent payment system, they incur substantial costs through interacting
with insurance providers, smaller associated facilities and other provider-owned subsidiaries.
0.00%
5.00%
10.00%
15.00%
20.00%
25.00%
Health CarePlans
Hospitals MedicalAppliances &Equipment
Biotechnology Major DrugManufactures
2012
2014

15
They process insurance-related (BIR) activities billing for each test, visit and procedure,
regardless of whether their patients are covered by private or public insurance. Without superb
management, the time, effort and personnel involved create additional redundancy and
inefficiency for hospitals.
The Prospect of Hospital Regulation and Consumer Empowerment
As the chief driver of the exorbitant cost of U.S. health care, hospitals contribute to the status
quo with an overuse in outpatient care, an inconsistent pricing method for various payers, an
enhanced leveraging position, as well as groundbreaking medical technology and an onerous
administrative structure. There is a variety of policy implications that could help eradicate these
defects.
On the quantity side, to avoid an overuse of outpatient services, the government should
partially cut off the economic alignment between hospitals and equipment producers. With
regard to price discrimination, we need hospitals to better inform patients on price, specifically
those who are billed from the chargemaster. To further contain costs, we should put a cap on
hospitals’ outsized profits. Other financial and legal means that empower the physicians could
also curb hospitals’ consolidation and thus their bargaining power over prices. For instance,
safe-harbor defenses will protect doctors from being sued for medical liability and reduce the
likelihood of overprescribing.
Considering the interest clout’s relentless lobbying, hospital regulation has an unpromising
prospect for the moment, but feasible solutions do exist for consumers to save money.

16
Most urgently, they should be offered clear, reliable information about the prices, quantities
and quality of hospitals’ services to do a cost-benefit analysis on their own. Once one set of
weights for DRGs and APCs are established nationwide and once hospitals reveal a monetary
conversions factor to the public, patients would be able to compare prices in the same region
and pick up the price differences among providers. If and when accomplished, we may attain
“reference pricing” and an all-payer system without extra regulation.xxxiii Building an IT platform
paves the way for consumer-directed health care which could maximize value for patients. xxxiv
The platform will bolster an integrated, multidisciplinary care system with a complete set of
aggregated data, a uniform interpretation standard, and a medical record accessible to all
parties. It will also give providers the incentive to perform better care for a larger market share
with higher profits.
IT platform is no longer merely a vague concept. FAIR Health and Colorado Medical Price
Compare, among others run free websites to boost cost transparency. Capable of estimating
their medical/dental expenditures and comparing prices in different regions, consumers benefit
from developing financial literacy on health care.
In conclusion, our takeaway from this research is how we perceive the future of a value-based
and less costly health care system. A comparison with other wealthy nations unveils our
spending to be less efficient. In a deeply flawed system, we are held back by overprescribed
tests and a lopsided hospital pricing structure. By getting rid of price discrimination or
inconsistent charges for different payers, we could prevent hospitals from shifting cost to

17
privately insured and uninsured patients. This is only possible if all providers, insurers, and the
government are actively engaged in reducing cost and resolving potential conflicts of interest.

18
Bibliography
i The Centers for Medicare & Medicaid Services (CMS), National Health Expenditures Projections 2012-2022 ii 2014 Milliman Medical Index, Christopher S. Girod, Lorraine W. Mayne, Scott A. Weltz, Susan K. Hart iii Author’s calculation from “Income, Poverty and Health Insurance Coverage in the United States: 2011.”, Table C-1, Carmen DeNavas-Walt, Bernadette D. Proctor, Jessica C. Smith, 2012 iv Assessment of Cost Trends and Price Differences for U. S. Hospitals, Margaret E. Guerin-Calvert and Guillermo Israilevich, 2011 v The 2012 Health Care Cost and Utilization Re-port, Health Care Cost Institute Inc., 2013 vi The Journal of the American Medical Association vii Do you really need a knee replacement?, The Boston Globe, Courtney Humphries, 2012 viii Are You a Hospital Inpatient or Outpatient, Centers for Medicare & Medicaid Services ix Assessment of Cost Trends and Price Differences for U.S. Hospitals, Margaret E. Guerin-Calvert and Guillermo Israilevich, 2011 x USA.gov, Citizens, Health Insurance, Nutrition, and Food Safety Health Insurance xi Acute Care Hospital Inpatient Prospective Payment System, Department of Health and Human Services, Centers for Medicare & Medicaid Services xii The Pricing Of U.S. Hospital Services: Chaos Behind A Veil Of Secrecy, Health Affairs, Uwe E. Reinhardt, 2006 xiii High and Varying Prices for Privately Insured Patients Underscore Hospital Market Power, Health System Change Research Brief, Chapin White, Amelia M. Bond And James D. Reschovsky, 2013 xiv Key Facts about the Uninsured Population, the Kaiser Family Foundation, 2013 xv Provider Utilization & Payment Data, The Centers for Medicare & Medicaid Services xvi How Much Does A Tonsillectomy Cost?, COSTEVALUATION.COM xvii Understanding Knee Replacement Costs: What's On the Bill?, Healthline, Samuel Greengard, Medically Reviewed by George Krucik, MD, 2012 xviii The Potential of Reference Pricing to Generate Health Care Savings: Lessons from a California Pioneer, Health System Change Research Brief, manda E. Lechner, Rebecca Gourevitch, Paul B. Ginsburg, 2013 xix High and Varying Prices for Privately Insured Patients Underscore Hospital Market Power, Health System Change Research Brief, Chapin White, Amelia M. Bond And James D. Reschovsky, 2013 xx Second Quarter 2014 Earnings News Release, Cigna Quarterly Reports And Sec Filings xxi Yahoo Finance, Industry Browser - Healthcare - Health Care Plans - Company List xxii Insurer Competition and Negotiated Hospital Prices, Kate Ho and Robin S. Lee, 2013 xxiii High and Varying Prices for Privately Insured Patients Underscore Hospital Market Power, Health System Change Research Brief, Chapin White, Amelia M. Bond And James D. Reschovsky, 2013 xxiv Robert Wood Johnson Foundation, The Impact of Hospital Consolidation, Gaynor M, and Town R, 2012 xxv Same Doctor Visit, Double the Cost, Wall Street Journal, 2012 xxvi Bureau of Labor Statistics xxvii McKinsey & Company xxviii Prescription Drug Trend Increased in 2013, 2014 Insights report, CVS Caremark xxix Yahoo Finance, Industry Browser - Healthcare - Health Care Plans - Company List xxx The Facts About Rising Health Care Costs, Aetna, 2010 xxxi US hospitals total margin 5.53%: TRUVEN 2012 data, American Hospital Association Resource Center Blog, posted by kmgarber, 2013

19
xxxii Nearly 7 in 10 Americans Take Prescription Drugs, Mayo Clinic, Olmsted Medical Center, 2013 xxxiii The Pricing Of U.S. Hospital Services: Chaos Behind A Veil Of Secrecy, Health Affairs, Uwe E. Reinhardt, 2006 xxxiv The Strategy That Will Fix Health Care, Harvard Business Review, Michael E. Porter and Thomas H. Lee, 2013