housing evidence base part 2
DESCRIPTION
Housing Evidence Base Part 2TRANSCRIPT

Better housing choices for people
• Doncaster’s population growth is growing albeit relatively low and is projected to remain low for the foreseeable future
• The overwhelming majority of the population is white British. There are higher levels of Gypsies and Travellers in Doncaster than are seen nationally.
• The level of older people in Doncaster is growing higher and faster than regional and national averages whilst the level of children under 15 is decreasing.
• The main difference between Doncaster and places with higher growing populations is that places with higher population growth are attracting and retaining more migrants through better economic performance. Improving economic performance will increase population growth.
• Whilst most people will be able to aspire to purchase a home of their own there are still many who cannot afford to step on the housing ladder.
• The housing needs study recognises a continuing housing need in the Borough. Given current and projected future supply the study estimates a shortfall of 223 affordable homes per year.
• There are many households waiting for social housing (Council and housing associations) recorded on the Housing Register. The majority of households on the register are aged over 60. There is a mismatch between available housing and current demand
• There is a need for housing related support for some people in order to help them gain the skills to achieve suitable and settled homes
• There are people who are homeless and/or threatened with homelessness
• The average household income in Doncaster is below National and regional averages.
• The number of households for whom the Council has a duty to secure accommodation is falling This is due to an increasingly pro active service that aims to prevent homelessness
(comparisons relate to National and Regional averages)
Population
Between 2001 and 2009 the population of Doncaster is estimated to have grown by 3,200 – a 1.12% increase. Over the same period the regions population grew by 5.66%.

Doncaster Population
285000
286000
287000
288000
289000
290000
291000
2001 2002 2003 2004 2005 2006 2007 2008 2009
Year
Nu
mb
er
of
Peo
ple
Doncaster
(NeSS, population estimates 2001 - 2009).
Population Projection
Over the next 25 years Doncaster’s pensioner population will increase four times as fast the working age population and six times as fast as young people. This will alter the overall population profile, and raises key issues with respect to age demographics:
• The decrease in working age population;
• The increase in people over 60;
• The decrease in persons aged 0-15 years;
• The role of migration in bringing working aged people into Doncaster
Although the number of working age people

Population Projections
275.0
280.0
285.0
290.0
295.0
300.0
305.0
310.0
315.0
2008
2010
2012
2014
2016
2018
2020
2022
2024
2026
2028
2030
2032
Year
Nu
mb
er
of
peo
ple
(000s)
Population Projections
AGE GROUP 2008 2015 2020 2025 2030 2033 0-4 17,700 18,300 18,300 17,900 17,600 17,700
5-9 16,300 18,300 18,400 18,400 18,100 17,900 10-14 17,900 16,300 18,200 18,300 18,300 18,200 15-19 19,300 16,400 15,700 17,500 17,600 17,600 20-24 18,100 16,900 15,200 14,600 16,200 16,400 25-29 16,800 20,100 18,900 17,300 16,600 17,800 30-34 15,400 18,400 20,400 19,500 17,900 17,100 35-39 19,700 15,700 18,500 20,600 19,700 18,800
40-44 22,200 18,100 15,900 18,800 20,800 20,600 45-49 21,600 21,100 18,000 15,900 18,800 20,400 50-54 19,200 21,900 20,800 17,900 15,800 17,500 55-59 18,000 19,500 21,400 20,400 17,600 15,400 60-64 18,100 16,900 18,700 20,600 19,800 18,500 65-69 13,700 17,400 15,900 17,700 19,600 19,600
70-74 12,300 13,200 16,100 14,800 16,500 17,700 75-79 10,200 10,900 11,700 14,400 13,300 14,200
as a percentage of all people is also projected to fall across the City Region, Yorkshire and Humberside, and nationally, the fall will be relatively more severe in Doncaster due to its current and projected demographic mix. This means that the gap between Doncaster and the national figure will widen. (LEA, 2010)

80-84 7,200 7,900 8,800 9,600 12,000 11,300 85-89 4,100 4,700 5,300 6,300 7,100 8,600 90+ 1,600 2,400 3,000 3,900 5,100 5,700 All ages 289,300 294,300 299,300 304,300 308,500 311,000
CLG population projections
Ethnicity
Ethnicity
0%
10%
20%
30%
40%
50%
60%
70%
80%
90%
100%
Doncaster Y&H
Area
% o
f p
op
ula
tio
n Chinese or Other Ethnic Group
Black or Black British
Asian or Asian British
Mixed
White
Doncaster Y&H
White 95.60% 90.60%
Mixed 0.90% 1.30%
Asian or Asian British 1.90% 5.70%
Black or Black British 0.90% 1.30% Chinese or Other Ethnic Group 0.60% 1.20%
290,100 people live in Doncaster. The majority of the population (96%) are white British with the next largest ethnic backgrounds being Asian. Gypsies and Travellers also make up a relatively large proportion of the population with estimates in the region of 4000 – 6000, around 2% of the population depending on the time of year (Doncaster G&T strategy)

Age profile
Profile breakdown 2006
proportion Change
2006-2031 % change 2031
proportion Profile change
All Persons 100% + 31,100 10.71% 100% - 0-15 Years 19.50% + 2,600 4.59% 18.42% -1.08%
Working age 60.97% + 12,500 7.06% 58.96% -2.01% Pension age 19.53% + 16,000 28.22% 22.62% 3.09%
Source: ONS Population projections by broad age groups 2006-2031. 2006 based
The age distribution of the population is a key factor in forward planning, as those of working age must generate the output and income to support both themselves and those too young or too old to work. If the proportion over younger people (under 15) continues to fall it will place a greater strain on the economy and those of working age.
Local Housing Assessment
• The housing needs study (2007) estimates current housing need as 10,396 households with newly arising need of 1,133 households a year.
• Given current and projected future supply the study estimates a shortfall of 223 affordable homes per year.
• Grant funded affordable housing completions / allocations have been less than half this amount in recent years.
• Comparing the gap between local house prices and incomes our analysis suggests that up to 6,000 households are unable to achieve owner occupation in the current market.
• First time buyer households would need to be in the £20 – 25k income bracket to afford the average terraced house. However some of the lower priced wards are among the least affordable based on lower wage levels in these areas.
More affordable housing is required. Low completion rates of new build affordable housing and continuing right to buy sales of social housing are resulting in a shortfall in the numbers of affordable homes available. This coupled with increasing unemployment and restriction of mortgage finance is exasperating this issue.
Breakdown of people on housing register Category of needs
Bronze Silver Gold Platinum General Total
7,882 516 424 32 2,295 11,149 Age
There are 11,149 households on the waiting list. Need is categorised from general to platinum. General is lowest priority and platinum highest. The majority of households on the waiting list in Doncaster are in the Bronze band which means “Applicants whose need does not fall into the priority bands but still wish to move and those whose priority award has expired or removed after they have refused a
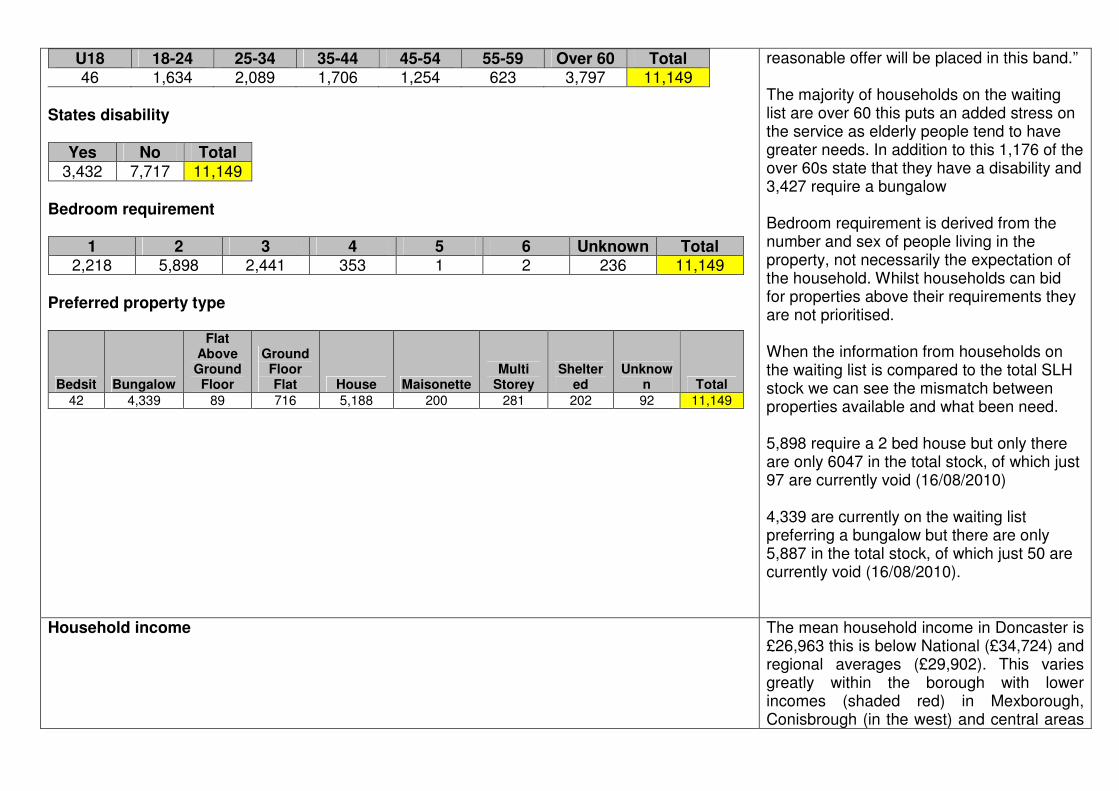
U18 18-24 25-34 35-44 45-54 55-59 Over 60 Total 46 1,634 2,089 1,706 1,254 623 3,797 11,149
States disability
Yes No Total
3,432 7,717 11,149
Bedroom requirement
1 2 3 4 5 6 Unknown Total 2,218 5,898 2,441 353 1 2 236 11,149
Preferred property type
Bedsit Bungalow
Flat Above Ground Floor
Ground Floor Flat House Maisonette
Multi Storey
Sheltered
Unknown Total
42 4,339 89 716 5,188 200 281 202 92 11,149
reasonable offer will be placed in this band.” The majority of households on the waiting list are over 60 this puts an added stress on the service as elderly people tend to have greater needs. In addition to this 1,176 of the over 60s state that they have a disability and 3,427 require a bungalow Bedroom requirement is derived from the number and sex of people living in the property, not necessarily the expectation of the household. Whilst households can bid for properties above their requirements they are not prioritised. When the information from households on the waiting list is compared to the total SLH stock we can see the mismatch between properties available and what been need. 5,898 require a 2 bed house but only there are only 6047 in the total stock, of which just 97 are currently void (16/08/2010) 4,339 are currently on the waiting list preferring a bungalow but there are only 5,887 in the total stock, of which just 50 are currently void (16/08/2010).
Household income
The mean household income in Doncaster is £26,963 this is below National (£34,724) and regional averages (£29,902). This varies greatly within the borough with lower incomes (shaded red) in Mexborough, Conisbrough (in the west) and central areas

Ward Average Household Income
Adwick £20,470
Armthorpe £28,711
Askern Spa £22,204
Balby £25,155
Bentley £21,097
Bessacarr and Cantley £29,748
Central £23,481
Conisbrough and Denaby £25,921
Edenthorpe, Kirk Sandall and Barnby Dun £31,213
Edlington and Warmsworth £20,381
Finningley £32,559
Great North Road £26,818
Hatfield £34,692
and more affluent areas in the suburban and rural areas (in the North and South). People tend to earn higher incomes in the south and north of the borough with lower incomes in central areas.

Mexborough £23,492
Rossington £32,610
Sprotbrough £33,467
Stainforth and Moorends £23,774
Thorne £28,727
Torne Valley £34,251
Town Moor £26,210
Wheatley £26,440 Acxiom 2009

Affordability
Housing affordability is a significant issue in Doncaster. This can be measured in a number of ways but is perhaps best demonstrated through the average house price to earnings ratio of 4.22:1. This means that in Doncaster the average house price is 4.9 times the average income. Whilst this is not as acute as the regional ratio of 5.7:1 it clearly indicates that there is an affordability issue. Although Doncaster does have a plentiful supply of low value houses these tend to be in the least sustainable neighbourhoods where people do not choose to live.
• Using Hometrack and CACI data, it is estimated that 23% of First Time Buyers are unable to purchase a terraced house, 37% are unable to buy a flat or a semi detached with over 70% unable to purchase a detached house. This clearly demonstrates that many people may never have the financial capacity to buy a house of their own
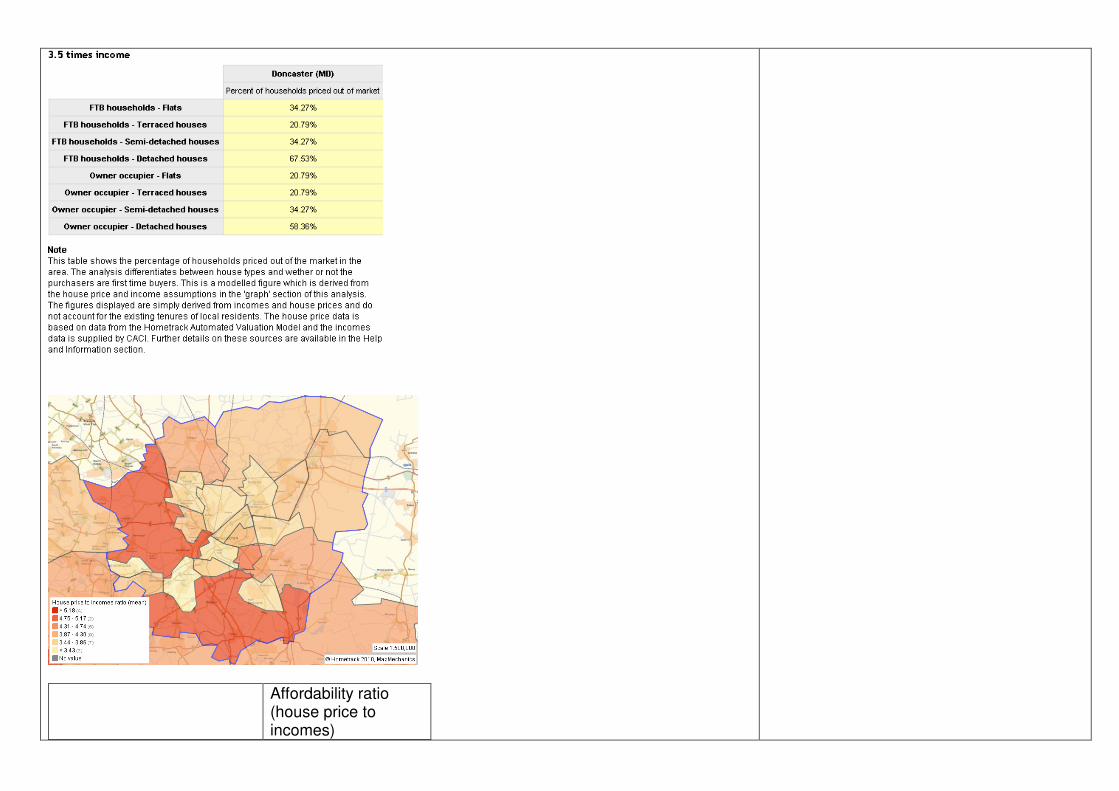
Affordability ratio (house price to incomes)

Doncaster (MD) 4.22
Adwick Ward 3.74
Armthorpe Ward 3.65
Askern Spa Ward 4.47
Balby Ward 3.69
Bentley Ward 3.46 Bessacarr and Cantley Ward 5.1
Central Ward (00CE) 3.28 Conisbrough and Denaby Ward 4.01
Edenthorpe, Kirk Sandall and Barnby Dun Ward 3.84 Edlington and Warmsworth Ward 3.4
Finningley Ward 4.73
Great North Road Ward 4
Hatfield Ward 4.05
Mexborough Ward 3.36
Rossington Ward 3.56
Sprotbrough Ward 5.26 Stainforth and Moorends Ward 4.23
Thorne Ward 4.13
Torne Valley Ward 5.61
Town Moor Ward 3.92
Wheatley Ward 3.59

Homelessness
Homelessness
0500
100015002000250030003500400045005000
2000
/01
2001
/02
2002
/03
2003
/04
2004
/05
2005
/06
2006
/07
2007
/08
2008
/09
2009
/10
Year
Nu
mb
er
of
ho
useh
old
s
Accepted as Homeless, no
duty to house owed
Accepted as Homeless,
Duty to house
Total Homeless Decisions
Made
Homeless Households
Accepted as Homeless, no duty to house owed
Accepted as Homeless, Duty to house
Total Homeless Decisions Made
2000/01 25 350 653
2001/02 27 187 3,303
2002/03 1,966 106 3,989
2003/04 1,416 270 4,472
2004/05 1,207 211 3,919
2005/06 1,200 230 3,694
2006/07 865 262 3,384
2007/08 389 201 2,096
2008/09 322 182 1,001
2009/10 52 77 342
The number of households accepted as homeless in Doncaster is falling this is due to an increasingly pro active service that aims to prevent homelessness.

Households accepted as eligible for assistance, unintentionally homeless, and in
priority need during the year
0200400600800
100012001400
Cra
ve
n
Rye
da
le
Ha
mb
leto
n
Se
lby
Ba
rnsle
y
Ric
hm
on
dsh
ire
Ca
lde
rda
le
Ha
rro
ga
te
Wa
ke
fie
ld
Sca
rbo
rou
gh
No
rth
Lin
co
lnsh
ire
Do
nca
ste
r
No
rth
Ea
st
Lin
co
lnsh
ire
Yo
rk
Ea
st R
idin
g o
f
Yo
rksh
ire
Bra
dfo
rd
Kin
gsto
n u
po
n
Hu
ll Le
ed
s
Sh
effie
ld
Ro
the
rha
m
Kir
kle
es
LA
Nu
mb
er
of
ho
us
eh
old
s
How Homeless was Prevented/Relieved 2008/09 2009/10
Total
Mediation Using External or Internal trained Family Mediators 0 0 0
Conciliation Including Home Visits for Family/Friend threatened Exclusions 12 10 22
Financial Payments from a Homeless prevention Fund 0 2 2
Debt Advice 4 3 7
Resolving Housing Benefit problems 10 19 29
Resolving rent or service charge arrears in the Social or Private Rented Sector 5 6 11
Sanctuary Scheme measures for Domestic Violence 0 0 0
Crisis Intervention - providing emergency support 2 0 2
Negotiation or Legal Advocacy to ensure that 5 7 12

someone can remain in the private or social sector
Providing other assistance that will enable someone to remain in accommodation in the Private or social rented sector 5 9 14
Mortgage arrears interventions or Mortgage rescue 13 33 46
Any Form of Hostel or HMO with or without support 25 53 78
Private Rented sector with Landlord incentive scheme 17 162 179
Private Rented sector without Landlord incentive scheme 215 299 514
Accommodation arranged with friends or relatives 14 14 28
Supported Accommodation 34 134 168
Social Housing - Management move of existing LA tenant 7 10 17
Social Housing - Part 6 offer of LA own accommodation or nomination to an RSL 170 177 347
Social Housing - Negotiation with an RSL outside Part 6 Nomination Agreement 2 4 6
Low cost Home ownership scheme, low cost market housing solution 1 0 1
Other 18 20 38
Total 559 962 1,52
1
Information taken from the P1E – homelessness provision return stored on the I-Form database. Prevention stats were only added to the P1E return for the start of Q1 2008/9, although homeless prevention has always happened within the service.
Rough sleeping
A rough Sleeper count was completed at the end of October 2009, it is widely accepted within the service that the majority of rough sleepers/sofa surfers don’t approach the service for assistance, however the last count took place in 2004 and so an updated figure was required.
•

The count managed to cover all area’s identified by neighbourhood team information and other sources and as a result 5 CLG defined ‘Rough Sleepers’ were identified, all were giving advice and assistance and a number were able to be accommodated by either M25 or through the housing Options team.
Older people
People aged
55-64 People
aged 65-74 People
aged 75-84 People aged 85 and over
Owned, with a limiting long-term illness 9,503 9,073 5,615 1,425
Owned, without a limiting long-term illness 15,623 9,861 3,695 452
Rented from council, with a limiting long-term illness 2,521 3,144 3,257 963
There are 58,400 people at retirement age in Doncaster (CLG, 2009). The distribution of older people varies across the borough; this could impact on care and support demands – with demand being concentrated in some areas. At the moment comparatively small numbers from BME communities fall in to the over 85’s group but it is clear that this is set to change particularly with the increasing numbers from the Asian and Asian British groups. Far more owner-occupiers have a long term illness than those living in some form of social rented accommodation. The implications are that more people will need higher levels of services and there is potential for very significant pressure increases on funding for Residential and Nursing Care. The National Housing Strategy identifies this as one of the key drivers for a shift towards preventative services and better use of specialist housing as an alternative to Residential and Nursing Care. It also recognises that this approach has to be adopted across all tenure if it is to succeed and that means that more services and particularly preventative service will be
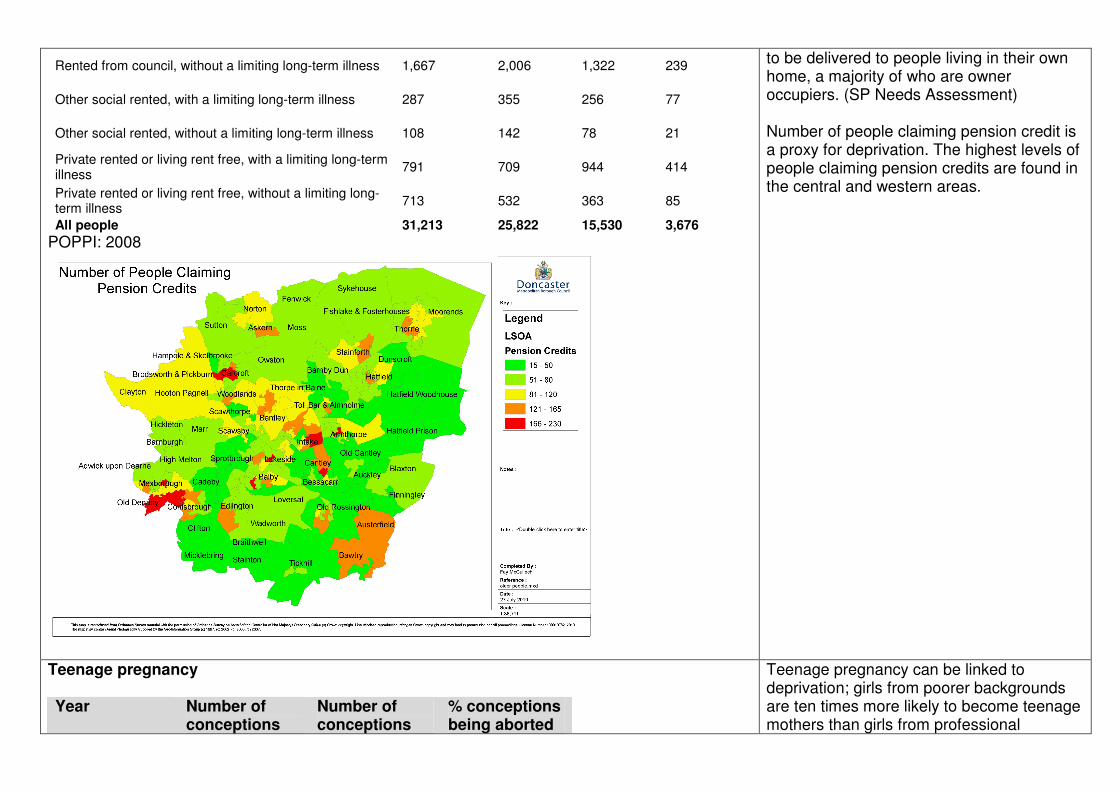
Rented from council, without a limiting long-term illness 1,667 2,006 1,322 239
Other social rented, with a limiting long-term illness 287 355 256 77
Other social rented, without a limiting long-term illness 108 142 78 21
Private rented or living rent free, with a limiting long-term illness
791 709 944 414
Private rented or living rent free, without a limiting long-term illness
713 532 363 85
All people 31,213 25,822 15,530 3,676
POPPI: 2008
to be delivered to people living in their own home, a majority of who are owner occupiers. (SP Needs Assessment) Number of people claiming pension credit is a proxy for deprivation. The highest levels of people claiming pension credits are found in the central and western areas.
Teenage pregnancy Year Number of
conceptions Number of conceptions
% conceptions being aborted
Teenage pregnancy can be linked to deprivation; girls from poorer backgrounds are ten times more likely to become teenage mothers than girls from professional
leading to abortion*
2006 327 160 49% 2005 358 147 41% 2004 381 156 41%
SP Needs Assessment 2008
backgrounds. One in every ten babies born in England is to a teenage mother, and one fifth of all births to mothers under the age of 18 are second pregnancies. The infant mortality rate for babies born to mothers aged under 18 is twice the national average. Doncaster achieved an 18.5% reduction in conceptions in 2005 and a 24.1% reduction in 2006. The target is to hit a 55% reduction in conceptions by 2010
Gypsies and Travellers The Council owns and manages four residential sites, and one transit site. The sites are:
• Sprotborough (New Travellers)
• Armthorpe
• Thorne
• Long Sandall
• Thorne (transit site)
There are also a number of authorised and privately managed sites owned by Gypsy and Traveller families which accommodate around 222 caravans, these can be found in:
• Armthorpe
• Intake
• Stainforth
• Dunscroft
• Bentley
• Mexborough
• Askern (Hacienda)
There are also wintering sites used by fairground and other travelling Showpeople:
• Branton
• Blaxton
• Mexborough
• Stainforth
For some people, a traditional home is not the solution to housing needs Gypsies and Travellers also make up a relatively large proportion of the population with estimates in the region of 4000 – 6000, around 2% of the population depending on the time of year (Doncaster G&T strategy) Doncaster is relatively well placed when the provision of Gypsy and Traveller sites is considered. In addition to these sites, Doncaster has an estimated 900 Gypsy and Traveller households who live in bricks and mortar housing. This is one of the largest populations of Gypsies and Travellers in England.

• Tickhill
• Supporting People
Client Group Current Provision Additional Units Required
Additional Floating Support Required
Substance Misuse and Alcohol Misuse
68 units of floating support and 20 units accommodation of based support
10-12 units focused on substance misuse but also covering Alcohol problems
40 to 90 units raising to 200 units for those who have complex but manageable needs
Offenders 50 units of floating support and 30 units of accommodation based support
30 to 50 units of floating support
Young People (16/17)
Consisting of care leavers, young offenders and teenage parents
100 units of floating support and 100 units of accommodation based support
Emergency access provision required
10 units of floating support for teenage parents to lead to access to stable accommodation
10-20 units of floating support for young people including specialist accommodation
Homelessness inc single homeless and rough sleepers
40 units of floating support and 73 units of accommodation based support
30/50 units of floating support to access specialist support for more complex needs
20 units of floating support aimed at preventative support
Victims of Domestic Violence 10 units of floating support for women exiting prostitution
10 units of floating support and 7 units of accommodation
Up to 5 units of short term accommodation for women who are homeless or leaving an abusive relationship
Up to 5 units for
20 – 30 units of floating support over the next 5 years to facilitate the remodelling of the refuge to meet greater needs and to increase provision outside the refuge
Key findings of the SP review in 2008 include; There is a concentration of accommodation based services which excluded the needs of some vulnerable people and which sometimes results in less flexible services than are needed. Supporting People services need to be a balance between some fixed, accommodation based services and a range of floating support services that can support vulnerable people in a range of different types of housing. The review tells us we need to re-address some services to establish that balance. Another key finding was the lack of move-on accommodation. This has resulted in people who had been helped to develop some independence through their support service are being held back because of limited opportunities to access general-purpose housing and continue to improve. The review found this was an issue for most vulnerable client groups. Future commissioning will need to ensure services build in opportunities for clients to move on to greater independence whilst still accessing floating support. The review highlighted that although some changes had taken place in local services, the overall pattern of provision remains essentially the same as those services inherited at the beginning of the Supporting People programme and since the

based support for women fleeing domestic violence
people leaving the sex industry
Generic 60 units floating support
Gypsies and Travellers No current support A pilot support service that may eventually offer up to 50 to 100 units of floating support
HIV/AIDS No current support A pilot service offering up to 10-20 units of floating support
BME Communities / Refugees 15 units of floating support and 15 units of accommodation based support
10 – 15 units of floating support to deal with the complex issues and challenges faced by refugees including language barriers
Older People 2 extra care schemes providing a total of 90 units
1116 units of RSL community alarm only and/or warden scheme manager
4000+ units of in-house warden service/intercom
54 units of floating support
500 – 1000 units of extra care
A reduction in outdated sheltered housing units is required
300 units of floating support and provision of community alarms
Also a shift from accommodation based support to floating support (20% by 2010) and (30% by 2011)
Physical Disability or Sensory Impairment
18 units accommodation of based support and 17 community alarms
20 units of a mix of floating support and assistive technology
Mental Health 207 units of floating support and 59 units of
An increase of at least 100 units of low level maintenance services and an increase of up to 50 units to support people with complex problems
development of the previous Supporting People Strategy in 2005. Another key finding of the review was the lack of specialist services for some client groups. However their needs are, at least in part, being addressed within existing services. This is particularly true of Drugs and Alcohol. A small number of people from BME1 communities are currently being supported but there are very few specialist services and no services are available for Gypsies and Travellers, who are by far the largest ethnic minority group in the borough. As described above, the largest gap between needs and supply identified by the review is in Substance Misuse and Alcohol Misuse services. This client group is expanding quickly across the country and has the potential to create most risk for plans to reduce crime and build stable communities.
1 Black and Minority Ethnic communities
accommodation based support
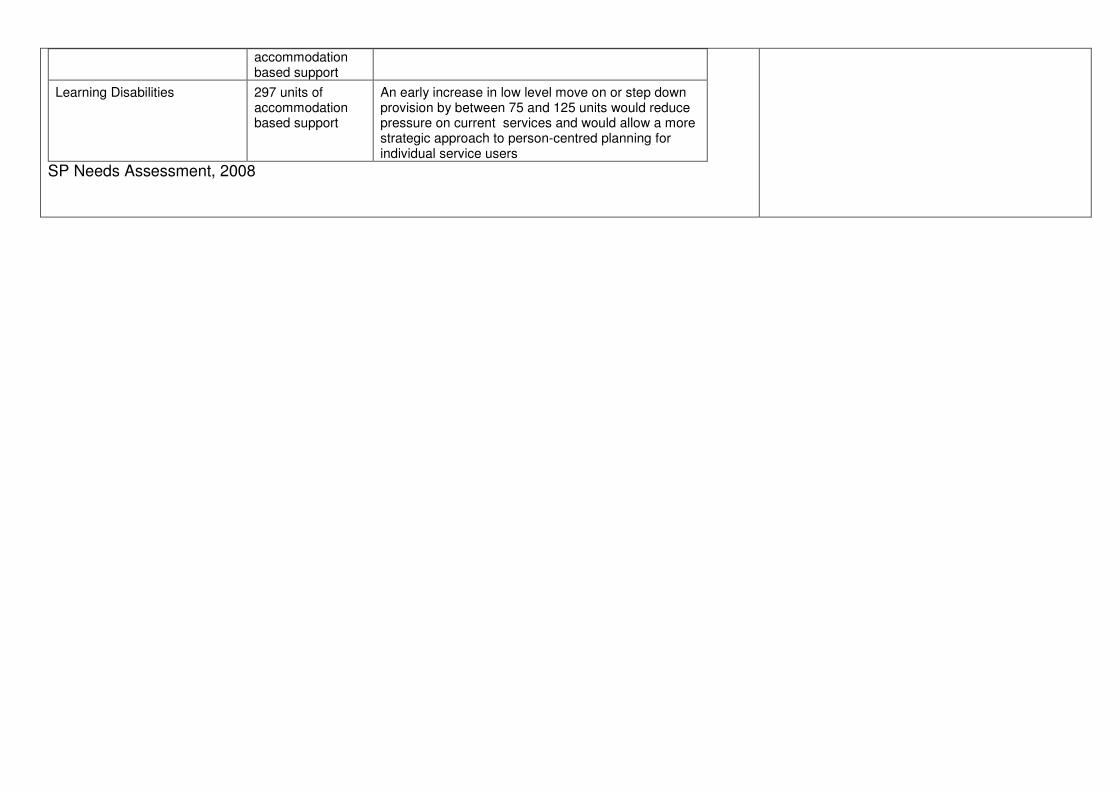
Learning Disabilities 297 units of accommodation based support
An early increase in low level move on or step down provision by between 75 and 125 units would reduce pressure on current services and would allow a more strategic approach to person-centred planning for individual service users
SP Needs Assessment, 2008