housing preferences in port stephens
TRANSCRIPT

HOUSING PREFERENCES IN PORT STEPHENS
FINAL Prepared for
OCTOBER 2019 Port Stephens Council

20190280 Housing Preferences in Port Stephens - Draft Report 20190910
© SGS Economics and Planning Pty Ltd 2019
This report has been prepared for Port Stephens Council. SGS Economics and Planning has taken all due care in the preparation of this report. However, SGS and its associated consultants are not liable to any person or entity for any damage or loss that has occurred, or may occur, in relation to that person or entity taking or not taking action in respect of any representation, statement, opinion or advice referred to herein.
SGS Economics and Planning Pty Ltd ACN 007 437 729 www.sgsep.com.au Offices in Canberra, Hobart, Melbourne, Sydney
Housing Preferences in Port Stephens 1
TABLE OF CONTENTS
EXECUTIVE SUMMARY 3
1. INTRODUCTION 7
1.1 Project brief 7 1.2 Strategic planning context 7 1.3 This housing preferences study 9
2. METHOD 10
2.1 Focus groups 10 2.2 Survey 10 2.3 Participants demographics 11
3. SURVEY RESULTS 13
3.1 Location preferences 13 3.2 Housing preferences 21
4. SUPPLY ANALYSIS 25
4.1 Profile of dwellings 25 4.2 New housing stock 27
5. CONCLUSIONS 29
APPENDIX 1 – POLICY REVIEW 31
APPENDIX 2- FOCUS GROUPS FINDINGS 42
APPENDIX 3 – SURVEY QUESTIONNAIRE 44
Housing Preferences in Port Stephens 2
LIST OF FIGURES
FIGURE 1: STRATEGIC PLANNING LINE OF SIGHT 8 FIGURE 2: AGE GROUPS 11 FIGURE 3: GENDER 11 FIGURE 4: HOUSEHOLD TYPE 12 FIGURE 5: TOP TEN LOCATIONS THAT PARTICIPANTS ARE CURRENTLY LIVING AT 12 FIGURE 6: WORD CLOUD - REASONS FOR MOVING INTO THE PORT STEPHENS AREA 14 FIGURE 7: WORD CLOUD - REASONS FOR LIVING IN YOUR CURRENT LOCATION 15 FIGURE 8: HOW LONG HAVE YOU LIVED IN THE PORT STEPHENS LGA 16 FIGURE 9: HOW LONG HAVE YOU LIVED IN YOUR CURRENT HOME 16 FIGURE 10: LIKELINESS TO MOVE WITHIN A CERTAIN PERIOD OF TIME 17 FIGURE 11: PLACES PARTICIPANTS WANT TO MOVE TO (EXCLUDING PARTICIPANTS THAT
WANTED TO STAY IN THE SAME LOCATION) 19 FIGURE 12: MAIN REASONS FOR CHOOSING THIS TYPE OF HOUSING 22 FIGURE 13: POTENTIAL BARRIERS IN SECURING PREFERRED TYPE OF HOUSING 24 FIGURE 14: PROPORTION OF DWELLING STRUCTURES BY SA2S 25 FIGURE 15: COMPARISON OF PREFERENCES AND ACTUAL STOCK FROM SURVEYS AND
CENSUS DATA 27 FIGURE 16: NEWLY CONSTRUCTED DWELLINGS, 2012 TO 2018 28 FIGURE 17: GREATER NEWCASTLE SETTLEMENT PATTERN 32 FIGURE 18: HOUSING OPPORTUNITIES 2018 34 FIGURE 19: PORT STEPHENS PLANNING STRATEGY 36
LIST OF TABLES
TABLE 1: MAIN REASONS FOR MOVING TO PORT STEPHENS 13 TABLE 2: MAIN REASON FOR CHOICE OF LOCATION 14 TABLE 3: CROSS TABULATION- THOSE 18 TO 49 YEARS 15 TABLE 4: CROSS TABULATION - THOSE LOOKING TO MOVE IN THE NEXT 5 YEARS AND AGE
GROUPS 17 TABLE 5: NUMBER OF PARTICIPANTS WHO WANT TO STAY IN THEIR CURRENT LOCATION 18 TABLE 6: MAIN REASONS TO MOVE TO THAT LOCATION 19 TABLE 7:IMPORTANT ASPECTS FOR THE CHOICE OF LOCATION WITHIN BUDGET 20 TABLE 8: HOUSING PREFERENCE COMPARED TO CURRENT HOUSING TYPE 21 TABLE 9: HOUSING PREFERENCE COMPARED TO CURRENT HOUSING TYPE (HOUSING ON A
SEPARATE LOT) 21 TABLE 10: RATINGS OF IMPORTANT ASPECTS IN CHOICE OF HOUSING 23 TABLE 11: 2016 PERCENTAGE OF DWELLING STRUCTURE BY HOUSEHOLD TYPES 26 TABLE 12: CENTRES HIERARCHY 37

Housing Preferences in Port Stephens 3
EXECUTIVE SUMMARY
Introduction SGS Economics and Planning has been commissioned to prepare a Housing Preference Report for Port Stephens Council. The Housing Preference Report will form part of the evidence base for Council’s Housing Strategy. The report reviews housing preferences, and issues that the residents of Port Stephens take into consideration when determining where and how they live. The housing preferences results are complemented by housing supply data to identify the gaps in housing diversity and affordable rental housing.
Policy overview The key strategic plans governing the Port Stephens Local Government Area (LGA) are the Port Stephens Planning Strategy (PSPS) 2011, the Hunter Regional Plan 2036 and the Greater Newcastle Metropolitan Plan 2036. These strategies encourage diverse housing types and higher density in centres. Council has released place specific strategies to guide the development of Nelson Bay, Fern Bay, North Stockton, Medowie, Raymond Terrace, Heatherbrae, Karuah and Anna Bay. The new Local Housing Strategy will repeal the PSPS.
Method The study used both qualitative and quantitative evidence to investigate housing preferences of Port Stephens residents. Three main sources of evidence were collected. A survey and focus groups were used to gain insights about housing preferences. Census data and Development Application data were used to understand existing housing stock and new supply. State and local strategies were analysed to understand current and future strategic directions. These three areas provide the base for a comprehensive understanding of housing preferences and gaps in specific needs.
SGS partnered with Myriad to carry out the focus groups and phone surveys. The focus groups were used to test the survey questionnaire. The survey questionnaire was modified based on focus group feedback. A total of 300 Port Stephens residents completed the phone survey and 16 participated in the focus groups.
Housing preferences The survey results show there is solid but latent demand for medium and higher density housing, especially among people aged 50 and above. People in that age group turn their minds to retirement and downsizing and may prefer housing that is low maintenance and accessible. People in the 18 to 49 age group overwhelmingly prefer houses on a separate lot and they are less concerned with retirement living arrangements and needs.
For location preferences, the survey found that:
Most participants viewed ‘nice environment and lifestyle’ as their main reason for moving to Port Stephens and for living in their current location
‘Nice environment and lifestyle’ are more important for participants aged 50 and above than younger participants
‘Close to family, friends, area where I grew up’ and ‘convenient for work’ are more important for younger participants than participants aged 50 and above
Port Stephens (the bayside areas), Newcastle and places outside of NSW are popular locations that participants want to move to (when they consider where else they would like to live from a relatively unconstrained perspective)

Housing Preferences in Port Stephens 4
Corlette, Raymond Terrace and Medowie are popular places where people currently live and want to stay
When considering moving within a realistic housing budget that they nominated, ‘safety and security’, ‘cost’, ‘health and medical services’, and ‘shops, shopping centres’ are considered more important than most other aspects
IMPORTANT ASPECTS FOR THE CHOICE OF LOCATION WITHIN BUDGET1
Choice of location aspects Very important or important (%)
Not important at all (%)
Work 38 36 Other family, friends, social network 58 17 Public transport 41 38 Main roads 39 30 Footpaths, walkways, cycle ways 48 26 Schools, childcare, other education 29 57 Shops, shopping centres 66 8 Restaurants, cafes, bars, pubs, clubs 35 28 Local markets 33 32 Business services and facilities 45 20 Health and medical services 78 6 Community centres and churches 21 51 Lake, beaches 59 21 Sporting and recreational facilities 28 40 Bushland 44 31 Views and general outlook 56 16 Local character and heritage 32 31 Community atmosphere 67 15 Safety and security 86 4 Cost and affordability 76 5 Investment potential 40 37
Source: SGS Economics and Planning; Myriad Research
For housing preferences, the survey found that:
Most people reported ‘size of yard’ and ‘size of house’ as their main reason for living in their current house, however these two attributes became less prevalent when they consider the important aspects in choice of housing within budget
Participants are willing to trade off ‘size of yard’ and ‘size of house’ for ‘price’ When considering the important aspects in choice of housing within budget, ‘price’,
‘onsite parking’, ‘garage and sheds’, ‘single level’ and ‘privacy’ are rated more important than size
The share of house on a separate lot is smaller in the preferred housing than in participants’ actual housing type, suggesting there is a preference towards more compact living
1 The dark green cells are the most common responses within that category (‘very important and important’ or ‘not important at all’).
Housing Preferences in Port Stephens 5
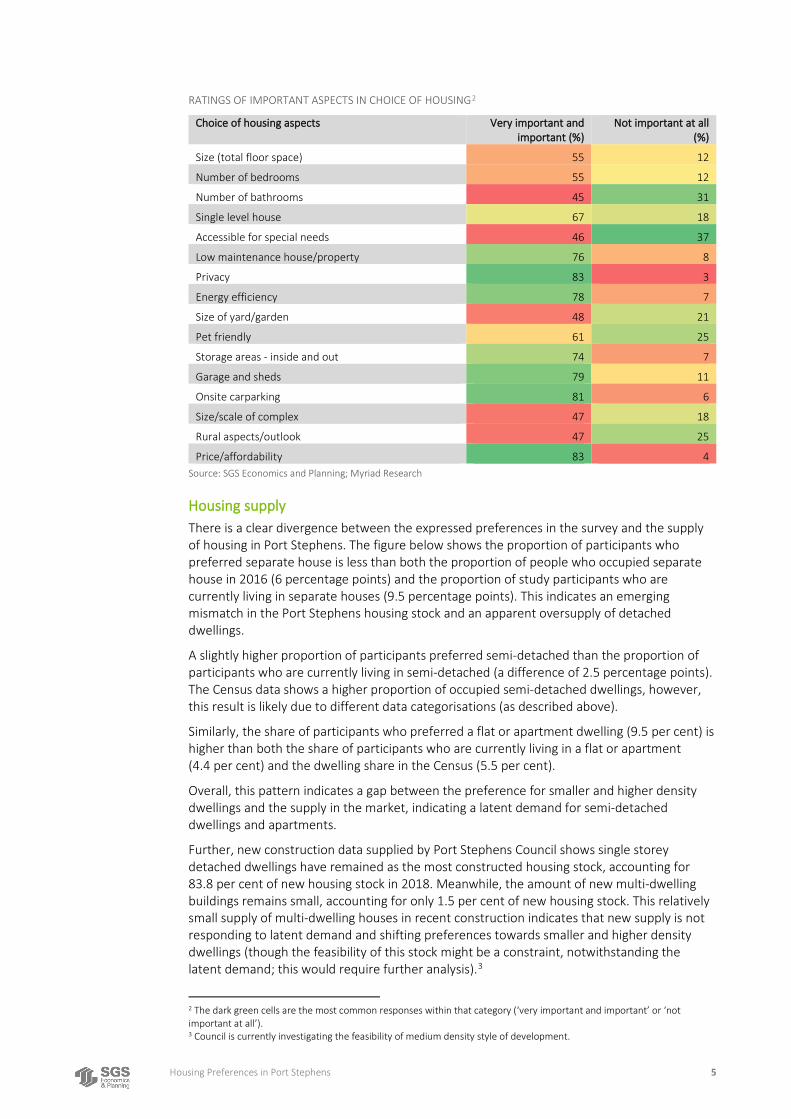
RATINGS OF IMPORTANT ASPECTS IN CHOICE OF HOUSING2
Choice of housing aspects Very important and important (%)
Not important at all (%)
Size (total floor space) 55 12
Number of bedrooms 55 12
Number of bathrooms 45 31
Single level house 67 18
Accessible for special needs 46 37
Low maintenance house/property 76 8
Privacy 83 3
Energy efficiency 78 7
Size of yard/garden 48 21
Pet friendly 61 25
Storage areas - inside and out 74 7
Garage and sheds 79 11
Onsite carparking 81 6
Size/scale of complex 47 18
Rural aspects/outlook 47 25
Price/affordability 83 4 Source: SGS Economics and Planning; Myriad Research
Housing supply There is a clear divergence between the expressed preferences in the survey and the supply of housing in Port Stephens. The figure below shows the proportion of participants who preferred separate house is less than both the proportion of people who occupied separate house in 2016 (6 percentage points) and the proportion of study participants who are currently living in separate houses (9.5 percentage points). This indicates an emerging mismatch in the Port Stephens housing stock and an apparent oversupply of detached dwellings.
A slightly higher proportion of participants preferred semi-detached than the proportion of participants who are currently living in semi-detached (a difference of 2.5 percentage points). The Census data shows a higher proportion of occupied semi-detached dwellings, however, this result is likely due to different data categorisations (as described above).
Similarly, the share of participants who preferred a flat or apartment dwelling (9.5 per cent) is higher than both the share of participants who are currently living in a flat or apartment (4.4 per cent) and the dwelling share in the Census (5.5 per cent).
Overall, this pattern indicates a gap between the preference for smaller and higher density dwellings and the supply in the market, indicating a latent demand for semi-detached dwellings and apartments.
Further, new construction data supplied by Port Stephens Council shows single storey detached dwellings have remained as the most constructed housing stock, accounting for 83.8 per cent of new housing stock in 2018. Meanwhile, the amount of new multi-dwelling buildings remains small, accounting for only 1.5 per cent of new housing stock. This relatively small supply of multi-dwelling houses in recent construction indicates that new supply is not responding to latent demand and shifting preferences towards smaller and higher density dwellings (though the feasibility of this stock might be a constraint, notwithstanding the latent demand; this would require further analysis).3
2 The dark green cells are the most common responses within that category (‘very important and important’ or ‘not important at all’). 3 Council is currently investigating the feasibility of medium density style of development.

Housing Preferences in Port Stephens 6
HOUSING PREFERENCES COMPARED TO ACTUAL
Source: SGS Economics and Planning; Myriad Research, ABS Census 2016
Implications The qualitative and quantitative evidence found that there is a gap between housing supply and housing preferences. Participants have identified a need for more affordable, adaptable and smaller housing types than are currently supplied by the market. Housing strategy should consider the following aspects:
There is a demand for more affordable, diverse housing stock in locations close to services and amenities, the data indicates that housing supply in Port Stephens lacks diversity for those seeking alternate options
Despite the latent demand in smaller and higher density dwellings, there is still a demand for separate houses
People aged 50 and above prefer smaller houses and properties with lower maintenance requirements, as existing residents downsize to these more suitable housing options, it will free up separate houses for those who need it
Housing preference is particularly influenced by the demographic characteristics of the resident population in Port Stephens, with older and younger people having different preferences for housing types and attributes
The bayside area of Port Stephens is attractive to residents (and would be an area to focus planning and policy for more diverse housing types)

Housing Preferences in Port Stephens 7
1. INTRODUCTION
Port Stephens Council commissioned SGS Economics and Planning to investigate housing preferences in its local government area. Knowledge of local housing preferences will inform Council’s Local Housing Strategy and ensure it can best meet the needs of residents into the future.
1.1 Project brief Local Housing Strategies are part of the local strategic planning process. Port Stephens Council is preparing a Local Housing Strategy to provide the strategic direction for future housing throughout Port Stephens. The Local Housing Strategy will encourage additional housing in suitable locations, improve housing affordability and support the ‘a great lifestyle in a treasured environment’ vision. The purpose of the Housing Preference Report is to form part of the evidence-base for the Housing Strategy.
This study aims to gain a greater understanding of housing preferences for existing residents and potential residents, to identify housing needs by knowing what makes people choose to live where they do.
1.2 Strategic planning context
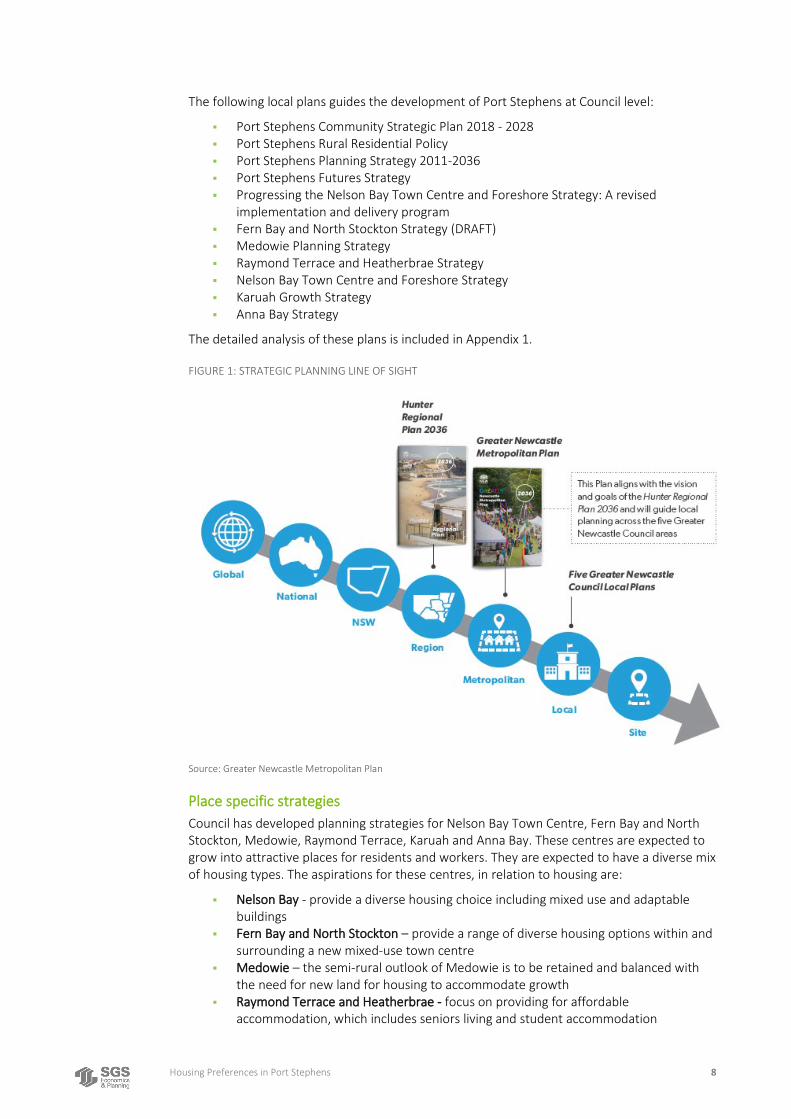
Current plans and studies The key strategic plans governing the Port Stephens Local Government Area (LGA) are the Hunter Regional Plan 2036 and Greater Newcastle Metropolitan Plan 2036. The Hunter Regional Plan 2036 guides strategic planning at a regional level, while the Greater Newcastle Metropolitan Plan 2036 guides strategic planning at a metropolitan level, see Figure 1.
Port Stephens Local Government Area (LGA) is part of the Greater Newcastle region as identified by the Metropolitan Plan. The Greater Newcastle Metropolitan Plan 2036 identifies Raymond Terrace and Medowie as part of the metro frame. New housing within the metro frame will be designed to maintain the coastal and green outlooks and retain the identity of places. The Hunter Regional Plan 2036 and the Greater Newcastle Metropolitan Plan 2036 identified Raymond Terrace and Nelson Bay as strategic centres that have unique roles. Raymond Terrace will continue to be the main service centre in the LGA. Nelson Bay will maintain its role as one of the primary tourist centres for the region and a hub for the Tomaree Peninsula. Nelson Bay is to investigate opportunities for high-density development.
Tomago and Williamtown are listed as catalyst areas in the Greater Newcastle Plan 2036. These two areas will bring new job opportunities for Greater Newcastle, it is important to provide housing close to these areas.
New housing will be built over the longer-term at Medowie and in the short-medium term in Raymond Terrace as it grows northwards. The total new dwellings for Port Stephens are projected in the Greater Newcastle Metropolitan Plan 2036 to be 11,050 by 2036, with 40 per cent greenfield and 60 per cent infill developments. The Plan suggests that the 60 per cent infill development target may be achieved via a variety of housing types, including secondary dwellings, apartments, townhouses and villas.4 Work undertaken by Council in preparing the Local Housing Strategy has indicated that demand for new dwellings is likely to be lower.
4 Hunter Regional Plan 2036 and Greater Newcastle Metropolitan Plan 2036
Housing Preferences in Port Stephens 8
The following local plans guides the development of Port Stephens at Council level:
Port Stephens Community Strategic Plan 2018 - 2028 Port Stephens Rural Residential Policy Port Stephens Planning Strategy 2011-2036 Port Stephens Futures Strategy Progressing the Nelson Bay Town Centre and Foreshore Strategy: A revised
implementation and delivery program Fern Bay and North Stockton Strategy (DRAFT) Medowie Planning Strategy Raymond Terrace and Heatherbrae Strategy Nelson Bay Town Centre and Foreshore Strategy Karuah Growth Strategy Anna Bay Strategy
The detailed analysis of these plans is included in Appendix 1.
FIGURE 1: STRATEGIC PLANNING LINE OF SIGHT
Source: Greater Newcastle Metropolitan Plan
Place specific strategies Council has developed planning strategies for Nelson Bay Town Centre, Fern Bay and North Stockton, Medowie, Raymond Terrace, Karuah and Anna Bay. These centres are expected to grow into attractive places for residents and workers. They are expected to have a diverse mix of housing types. The aspirations for these centres, in relation to housing are:
Nelson Bay - provide a diverse housing choice including mixed use and adaptable buildings
Fern Bay and North Stockton – provide a range of diverse housing options within and surrounding a new mixed-use town centre
Medowie – the semi-rural outlook of Medowie is to be retained and balanced with the need for new land for housing to accommodate growth
Raymond Terrace and Heatherbrae - focus on providing for affordable accommodation, which includes seniors living and student accommodation

Housing Preferences in Port Stephens 9
Karuah - potential to expand the village of Karuah Anna Bay - a small and vibrant town offering a mix of dwelling types and business
opportunities within a quality natural environment.
1.3 This housing preferences study SGS Economics and Planning partnered with Myriad to survey residents about their housing preferences, in terms of housing location and housing types. This report explores the results of the survey, compares stated preferences to the supply of housing in Port Stephens, and considers implications for the housing strategy.
The remainder of the report is set out as follows:
The Method section describes the survey method and sample characteristics The Survey Results section explores what study participants said about their location
preferences and housing preferences The Supply Analysis compares the preferences identified in the previous with the
current supply of housing. The Conclusions section draws together the results of the report and identifies the
implications for Council’s future housing strategy. The Appendices provide further background and detailed information about the
policy review, focus group findings and survey questionnaire.

Housing Preferences in Port Stephens 10
2. METHOD
Two focus groups and a survey of residents within the Port Stephens LGA have been conducted to assess housing and neighbourhood preferences (both current and future) as a key component of the Port Stephens Housing Preferences Study.
2.1 Focus groups A draft survey instrument was developed by Myriad Research and SGS Economics and Planning and tested at focus groups conducted at two locations in Port Stephens (Raymond Terrace and Nelson Bay) by SGS in June 2019. See Appendix 2 for the notes taken at the focus groups.
2.2 Survey Following the focus groups, a telephone survey of local residents living within the Port Stephens LGA was conducted in 2019. The purpose of the telephone survey is to get some insights about housing preferences. The survey questionnaire consists of three main parts: demographic questions, questions about locational attributes preferences and questions about housing attributes preferences.
The questionnaire includes open-ended questions, Likert scale questions and nominal questions. Open-ended questions were used for asking about people’s main reasons for living in the current location and type of housing and main reasons for moving to other locations. Likert scale questions were used for evaluating how people feel about certain locational attributes and housing attributes when considering moving. Appendix 3 shows the final survey instrument.
The survey follows the following parameters:
Interviews were conducted by Myriad’s field partner Q&A Research after a comprehensive briefing
All survey fieldwork was conducted in accordance with industry quality assurance standards for telephone survey (ISO 20252) and the Market and Social Research Privacy Code
Households were selected at random, with selected respondents being ‘the best person in the household to talk to’ about housing issues
Quotas for area, age group and gender were set to generally reflect the ABS Community Profile for the Port Stephens LGA
Calling times and call back protocols were adopted to ensure the sample comprised a broadly representative cross section of local residents
The total sample of 316 comprised 300 completes via telephone survey and an additional 16 completes via the focus groups.
The demographics of the sample largely reflect the population with some small variances. The population has a larger proportion of 18 to 29 years old (7.1 percentage points more) and a smaller proportion of 70 years and older group (5.4 percentage points less).

Housing Preferences in Port Stephens 11
2.3 Participants demographics The majority of the participants (25 per cent) were aged 70 and above, followed by 60 to 69 years (19 per cent), and 50 to 59 years (17 per cent), see Figure 2. There was a slight over representation in 70 and above years and 30 to 39 years and under presentation in 18 to 29 years compared to the 2016 Census data.
FIGURE 2: AGE GROUPS
Source: SGS Economics and Planning; Myriad Research
There were slightly more females (57 per cent) than males (43 per cent) which reflected the 2016 Census data, see Figure 3.
FIGURE 3: GENDER
Source: SGS Economics and Planning; Myriad Research

Housing Preferences in Port Stephens 12
Most participants were couple families with no children living at home (38 per cent), followed by couple families with children living at home (35 per cent), see Figure 4.
FIGURE 4: HOUSEHOLD TYPE
Source: SGS Economics and Planning; Myriad Research
Most participants reported Raymond Terrace as the area that they are currently living at (17 per cent) followed by Nelson Bay (12 per cent) and Corlette (11 per cent), see Figure 5.
FIGURE 5: TOP TEN LOCATIONS THAT PARTICIPANTS ARE CURRENTLY LIVING AT
Source: SGS Economics and Planning; Myriad Research
Housing Preferences in Port Stephens 13
3. SURVEY RESULTS
The following section provides a summary of the survey results. The survey results provide an overview of participants’ preferences over location attributes and housing attributes.
3.1 Location preferences
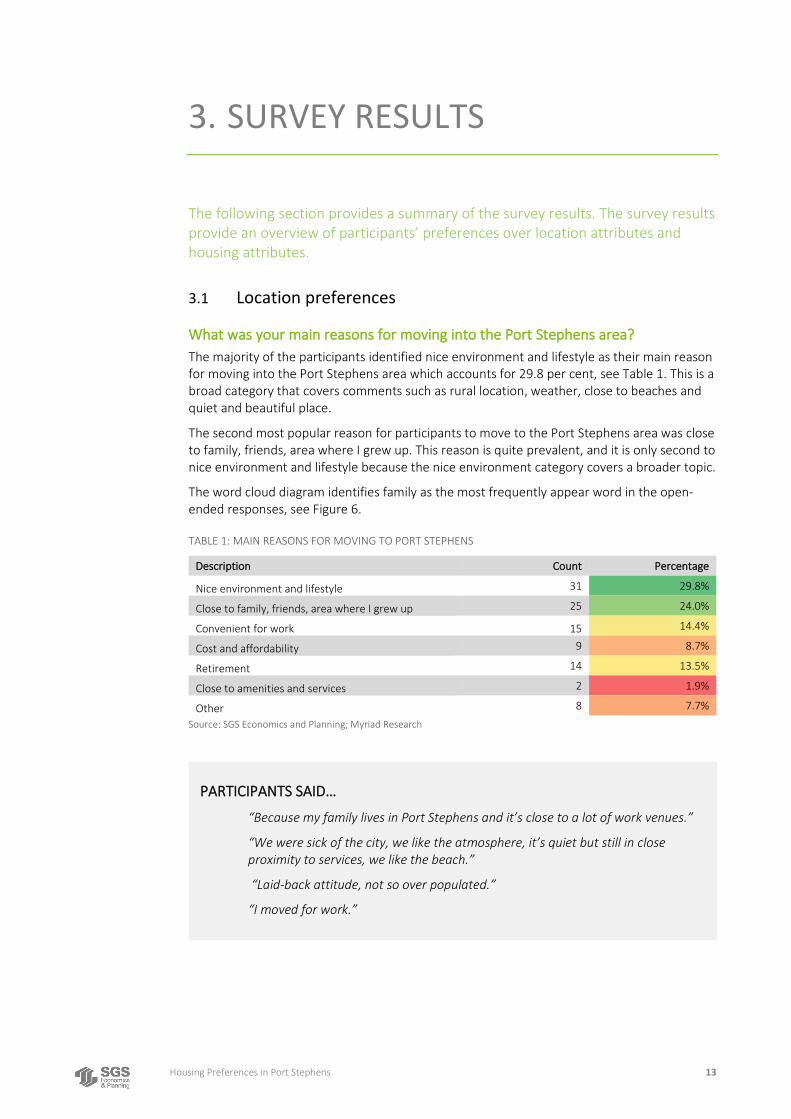
What was your main reasons for moving into the Port Stephens area? The majority of the participants identified nice environment and lifestyle as their main reason for moving into the Port Stephens area which accounts for 29.8 per cent, see Table 1. This is a broad category that covers comments such as rural location, weather, close to beaches and quiet and beautiful place.
The second most popular reason for participants to move to the Port Stephens area was close to family, friends, area where I grew up. This reason is quite prevalent, and it is only second to nice environment and lifestyle because the nice environment category covers a broader topic.
The word cloud diagram identifies family as the most frequently appear word in the open-ended responses, see Figure 6.
TABLE 1: MAIN REASONS FOR MOVING TO PORT STEPHENS
Description Count Percentage
Nice environment and lifestyle 31 29.8%
Close to family, friends, area where I grew up 25 24.0%
Convenient for work 15 14.4%
Cost and affordability 9 8.7%
Retirement 14 13.5%
Close to amenities and services 2 1.9%
Other 8 7.7% Source: SGS Economics and Planning; Myriad Research
PARTICIPANTS SAID…
“Because my family lives in Port Stephens and it’s close to a lot of work venues.”
“We were sick of the city, we like the atmosphere, it’s quiet but still in close proximity to services, we like the beach.”
“Laid-back attitude, not so over populated.”
“I moved for work.”

Housing Preferences in Port Stephens 14
FIGURE 6: WORD CLOUD - REASONS FOR MOVING INTO THE PORT STEPHENS AREA
Source: SGS Economics and Planning; Myriad Research
What is the main reason/s you live in your current location? The majority of the participants identified nice environment and lifestyle as the main reason for living in their current location, amounts for 48.5 per cent. The top three main reasons for moving to Port Stephens and living in your current location were consistent, see Table 1 and Table 2.
When asked about the main reasons for you to live in your current location, a larger proportion of participants reported close to amenities and services than when asked about the main reasons for moving into Port Stephens, see Table 2.
The word cloud diagram identifies family as the most frequently appear word in the open-ended responses, see Figure 7.
TABLE 2: MAIN REASON FOR CHOICE OF LOCATION
Source: SGS Economics and Planning; Myriad Research
Description Count Percentage
Nice environment and lifestyle 216 48.5%
Close to family, friends, area where I grew up 66 14.8%
Convenient for work 47 10.6%
Cost and affordability 33 7.4%
Retirement 17 3.8%
Close to amenities and services 41 9.2%
Rental, what was allocated to me 8 1.8%
Other 17 3.8%

Housing Preferences in Port Stephens 15
FIGURE 7: WORD CLOUD - REASONS FOR LIVING IN YOUR CURRENT LOCATION
Source: SGS Economics and Planning; Myriad Research
As would be expected, for those aged 18 to 49 years, no one reported retirement as their main reason for living in their current location. Nice environment and lifestyle, close to family and convenient for work were the top three most reported reasons.
TABLE 3: CROSS TABULATION- THOSE 18 TO 49 YEARS
Description Those 18 to 49 years Those 50 plus
Nice environment and lifestyle 36.1% 55.2%
Close to family, friends, area where I grew up 22.3% 10.8%
Convenient for work 16.3% 7.5%
Cost and affordability 9.0% 6.0%
Close to amenities and services 9.6% 9.0%
Retirement - 6.3%
Rental, what was allocated to me 3.0% 1.1%
Other 3.6% 4.1% Source: SGS Economics and Planning; Myriad Research
PARTICIPANTS SAID…
“Beautiful area, convenience to Newcastle, Sydney and an airport.”
“Because it’s quiet and I like the nature in the area.”
“I guess because it’s a good area, it’s clean, well maintained, safe area. It’s a good family area, reasonably priced.”
“Close to family and friends, near my work.”
“Can’t afford anywhere else.”
“Retirement and relaxing,”
Housing Preferences in Port Stephens 16
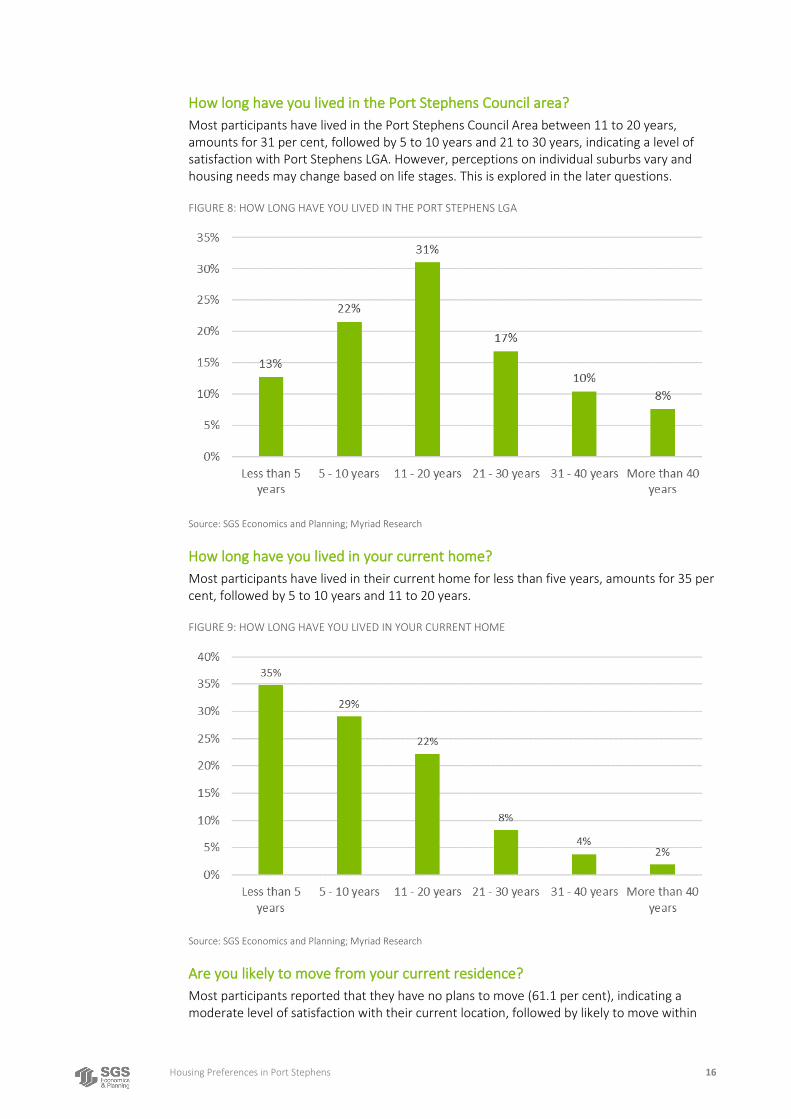
How long have you lived in the Port Stephens Council area? Most participants have lived in the Port Stephens Council Area between 11 to 20 years, amounts for 31 per cent, followed by 5 to 10 years and 21 to 30 years, indicating a level of satisfaction with Port Stephens LGA. However, perceptions on individual suburbs vary and housing needs may change based on life stages. This is explored in the later questions.
FIGURE 8: HOW LONG HAVE YOU LIVED IN THE PORT STEPHENS LGA
Source: SGS Economics and Planning; Myriad Research
How long have you lived in your current home? Most participants have lived in their current home for less than five years, amounts for 35 per cent, followed by 5 to 10 years and 11 to 20 years.
FIGURE 9: HOW LONG HAVE YOU LIVED IN YOUR CURRENT HOME
Source: SGS Economics and Planning; Myriad Research
Are you likely to move from your current residence? Most participants reported that they have no plans to move (61.1 per cent), indicating a moderate level of satisfaction with their current location, followed by likely to move within

Housing Preferences in Port Stephens 17
the next 12 months (11.1 per cent) and likely to move within the next five years ( 7.9 per cent) and likely to move within the next two years (6.3 per cent).
FIGURE 10: LIKELINESS TO MOVE WITHIN A CERTAIN PERIOD OF TIME
Source: SGS Economics and Planning; Myriad Research
For those looking to move within the next five years, 31.6 per cent were in the 30 to 39 age group, see Table 4. Most participants who wanted to move within the next five years were older than 50 years old. Most participants who wanted to move within the next five years, wanted to move to a house on separate lot.
TABLE 4: CROSS TABULATION - THOSE LOOKING TO MOVE IN THE NEXT 5 YEARS AND AGE GROUPS
Age Group Count Percentage
18 – 29 years 13 16.5%
30 - 39 years 25 31.6%
40 - 49 years 14 17.7%
50 - 59 years 9 11.4%
60 - 69 years 9 11.4%
70+ years 9 11.4%
Total 79 100%
Source: SGS Economics and Planning; Myriad Research
If you were to move from your current residence, where would you be likely to move to? When asked about where would you likely to move to, out of all the participants, 29 per cent indicated that they would like to stay in the same location that they are currently at. This is significantly lower than the percentage of participants who reported that they have no plans to move (61.1 per cent). This discrepancy indicates that the locations that participants chose to stay may not be their preferred locations or may not satisfy their needs, there are better places that they want to move to.
Table 5 shows the number of participants who wanted to stay in their current location. Participants living in Corlette, Raymond Terrace, Medowie and Nelson Bay were less likely to move to another location. This indicates a certain level of satisfaction with these locations.

Housing Preferences in Port Stephens 18
TABLE 5: NUMBER OF PARTICIPANTS WHO WANT TO STAY IN THEIR CURRENT LOCATION5
Suburbs No. people who want to stay
No. people currently living here
Share that wants to stay
Corlette 18 36 50.0%
Raymond Terrace 15 55 27.3%
Medowie 8 31 25.8%
Nelson Bay 8 38 21.1%
Salamander Bay 6 24 25.0%
Fern Bay 5 17 29.4%
Tanilba Bay 5 13 38.5%
Anna Bay 3 11 27.3%
Fingal Bay 3 4 75.0%
Lemon Tree Passage 3 12 25.0%
Soldiers Point 3 9 33.3%
Williamtown 3 6 50.0%
Boat Harbour 2 7 28.6%
Port Stephens 2 4 50.0%
Shoal Bay 2 5 40.0%
Wallalong 2 4 50.0%
Fullerton Cove 1 2 50.0%
Mallabula 1 4 25.0%
Nelsons Plain 1 3 33.3%
Salt Ash 1 6 16.7% Source: SGS Economics and Planning; Myriad Research
The most popular places that participants wanted to move to is Port Stephens, followed by Newcastle, then Outside of New South Wales, see Figure 11. It needs to be noted that when participants mention Port Stephens, they may be referring to the bay area of the Port Stephens LGA as opposed to inland area.6
Interestingly, when we took away the participants who wanted to stay in the same area, Corlette did not make it to the top ten list of most wanted to move to place. Most participants who reported Corlette were already living there. Only three participants who are living elsewhere reported Corlette as the place they would move to. Raymond Terrace is the current living location of many participants, however, only four participants who are living elsewhere wanted to move to Raymond Terrace.
Popular locations Participants identified Nelson Bay, Fingal Bay and Medowie as popular places to continue to stay and popular places to move to.
5 Some of the locations such as Fingal Bay and Wallalong only had small proportion of participants, whereas places like Corlette and Raymond Terrace had large number of participants. These location related results need to be read with caution. 6 Mentioned by participants in the focus group.

Housing Preferences in Port Stephens 19
FIGURE 11: PLACES PARTICIPANTS WANT TO MOVE TO (EXCLUDING PARTICIPANTS THAT WANTED TO STAY IN THE SAME LOCATION)7
Source: SGS Economics and Planning; Myriad Research
Why would you move to that locations (main reason)? Most participants reported that the main reason for them to move to their choice of location is nice environment and lifestyle. The second most popular reason was close to family, friends, area where I grew up.
TABLE 6: MAIN REASONS TO MOVE TO THAT LOCATION
Description Count Percentage
Nice environment and lifestyle 180 64.1% Close to family, friends, area where I grew up 25 8.9% Convenient for work 8 2.8% Cost and affordability - - Close to amenities and services 24 8.5% Retirement 24 8.5% Rental, what was allocated to me 4 1.4% Other 16 5.7%
Source: SGS Economics and Planning; Myriad Research
7 Where responses to this question was 'Port Stephens', it was unclear whether people were referring to the entire LGA, or specifically the area around the Port, eg. settlements within the Tomaree and Tillgerry peninsulas.
PARTICIPANTS SAID…
“To be closer to family.”
“We like it here very much, there’s no reason for us to move anywhere else.”
“I love the location with the beaches here.”
“It’s close to facilities like hospitals.”
“Because there are smaller units and still close to beach.”

Housing Preferences in Port Stephens 20
Within your budget if you were to move, how important are the following aspects in your choice of location on a scale of 1 (not important at all) to 5 (very important)? When asked about the important aspects for the choice of location within budget, most participants rated very important and important for ‘Safety and security’, followed by ‘Health and medical services’ and ‘Cost and affordability’.
Very few participants mentioned these three aspects in their main reasons to move to that location question. However, this may be due to how these questions have been framed; the open-ended question that asked about the main reasons to move that location did not mention budget. Therefore, the answers are aspirations rather than realistic considerations.
TABLE 7:IMPORTANT ASPECTS FOR THE CHOICE OF LOCATION WITHIN BUDGET8
Choice of location aspects Very important and
important (%) Not important at all
(%) Work 38 36 Other family, friends, social network 58 17 Public transport 41 38 Main roads 39 30 Footpaths, walkways, cycle ways 48 26 Schools, childcare, other education 29 57 Shops, shopping centres 66 8 Restaurants, cafes, bars, pubs, clubs 35 28 Local markets 33 32 Business services and facilities 45 20 Health and medical services 78 6 Community centres and churches 21 51 Lake, beaches 59 21 Sporting and recreational facilities 28 40 Bushland 44 31 Views and general outlook 56 16 Local character and heritage 32 31 Community atmosphere 67 15 Safety and security 86 4 Cost and affordability 76 5 Investment potential 40 37
Source: SGS Economics and Planning; Myriad Research
8 The dark green cells are the most common responses within that category (‘very important and important’ or ‘not important at all’).

Housing Preferences in Port Stephens 21
3.2 Housing preferences
What type of housing do you currently live in and, within your budget, what housing type would you choose? Participants that are currently living in house on a separate lot amount for 82.3 per cent of the sample, however only 72.8 per cent would choose this type of housing. A higher proportion of participants preferred semi-detached than the proportion of participants who are currently living in semi-detached houses. The same goes for a flat, unit or apartment Table 8. These results show that there is a shift of preference towards more compact living.
TABLE 8: HOUSING PREFERENCE COMPARED TO CURRENT HOUSING TYPE
Type of housing Preferred housing within
budget
Current housing Difference
House on separate lot 72.8% 82.3% -9.5%
Semi-detached 6.0% 3.5% 2.5%
A flat, unit or apartment 8.2% 3.5% 4.7%
Duplex/ villa unit 3.5% 3.5% 0.0%
Flat/unit/apartment - attached to a house 1.3% 1.6% -0.3%
Seniors retirement village 7.6% 3.8% 3.8%
Other dwelling type 0.6% 1.9% -1.3% Source: SGS Economics and Planning; Myriad Research
The preferred housing types for house on separate lot demonstrates a shift towards smaller houses. Compared with the type of housing that participants are currently living at, there was a higher proportion of participants who preferred small or small medium houses see Table 8. Less participants would like to live in medium, large or on a rural block than participants who are currently living in those types of housing.
Of the participants aged 18 to 49, 89.4 per cent preferred house on separate lot within the budget. Of the participants aged 50 and above, 62.3 per cent preferred house on separate lot within budget.
Of the participants 18 to 49 years old, 4.9 per cent preferred flat, unit or apartment, while 10.5 per cent of participants aged 50 and above preferred flat, unit or apartment. These results indicate that older people tend to prefer smaller dwellings while younger people tend to prefer bigger dwellings.
TABLE 9: HOUSING PREFERENCE COMPARED TO CURRENT HOUSING TYPE (HOUSING ON A SEPARATE LOT)
Type of housing Preferred house on a separate lot
Actual Difference
Small (up to 250 sqm) 12.6% 6.7% 5.9%
Small medium (250 - 500 sqm) 20.7% 13.4% 7.3%
Medium (500 - 800 sqm) 36.9% 43.7% -6.8%
Large (more than 800 sqm) 15.3% 18.9% -3.6%
Rural block/acreage 14.4% 17.3% -2.9% Source: SGS Economics and Planning; Myriad Research

Housing Preferences in Port Stephens 22
What is your main reason/s for choosing this type of housing (current housing type)? Most participants chose ‘Size of yard/ garden, acreage’ as their main reason for choosing their current housing type, second by ‘Size overall – larger’ and ‘Affordable’. When asked about important aspects in choice of housing if you were to move, ‘Price/ affordability’ received the most very important and important ratings, followed by ‘Privacy’ and ‘Onsite carparking’. ‘Size of yard/garden’, and ‘Size total floor space’ were not prominent reasons.
FIGURE 12: MAIN REASONS FOR CHOOSING THIS TYPE OF HOUSING
Source: SGS Economics and Planning; Myriad Research
PARTICIPANTS SAID…
“At the time we built it I had three sons, needed a backyard, cul-de-sac so they could play.”
“Country lifestyle.”
“Have always loved large areas and acreage.”
“I wanted to build and have a shed.”
“We wanted to live in a large home that would grow with the family and accommodate visitors when they came to stay.”
“We like the space of a house, in duplexes and units you don’t know who will be next to you.”
“Suits our lifestyle of downsizing in retirement.”

Housing Preferences in Port Stephens 23
How important are the following aspects in your choice of housing if you were to move on a scale of 1 (not important at all) to 5 (very important)? Price/ affordability has the highest percentage of very important and important ratings, followed by privacy and onsite parking. Attributes related to housing characteristics such as size of yard/ garden, number of bedrooms, size of complex and rural aspects received relatively less very important and important ratings.
TABLE 10: RATINGS OF IMPORTANT ASPECTS IN CHOICE OF HOUSING9
Choice of housing aspects Very important and important (%)
Not important at all (%)
Size (total floor space) 55 12
Number of bedrooms 55 12
Number of bathrooms 45 31
Single level house 67 18
Accessible for special needs 46 37
Low maintenance house/property 76 8
Privacy 83 3
Energy efficiency 78 7
Size of yard/garden 48 21
Pet friendly 61 25
Storage areas - inside and out 74 7
Garage and sheds 79 11
Onsite carparking 81 6
Size/scale of complex 47 18
Rural aspects/outlook 47 25
Price/affordability 83 4 Source: SGS Economics and Planning; Myriad Research
If you were to move, do you see any potential barriers in being able to secure your preferred type of housing in your preferred location? Price was seen as the biggest barrier (49 per cent) and the second biggest barrier was not enough availability of preferred housing type (24 per cent), see Figure 13. Those who prefer semi-detached dwellings said that availability was a barrier more frequently than those who prefer to live in detached housing. Affordability in desired location was more frequently an issue for those who prefer to live in a flat than those who prefer larger housing types.
9 The dark green cells are the most common responses within that category (‘very important and important’ or ‘not important at all’).

Housing Preferences in Port Stephens 24
FIGURE 13: POTENTIAL BARRIERS IN SECURING PREFERRED TYPE OF HOUSING
Source: SGS Economics and Planning; Myriad Research

Housing Preferences in Port Stephens 25
4. SUPPLY ANALYSIS
The following section provides an overall view of current and historical housing supply and compares it with the preferences stated in the survey.
4.1 Profile of dwellings Figure 14 below shows the proportion of occupied private dwelling based on dwelling structures in each Statistical Area (SA2) within the Port Stephens LGA. In 2016, almost all occupied private dwellings in Seaham- Woodville were separate houses (99.2 per cent). Nelson Bay Peninsula has relatively higher proportion of flat or apartments (9.7 per cent) and semi-detached houses (28.5 per cent). Raymond Terrace has relatively higher proportion of semi-detached houses, with 15.6 per cent out of all dwelling structures in Raymond Terrace.
Across all SA2s in the map, there were 78.8 per cent separate houses, 14.4 per cent semi-detached and 4 per cent flats or apartments.
Overall, Nelson Bay Peninsula has the most amount of private occupied dwellings, second by Raymond Terrace.
FIGURE 14: PROPORTION OF DWELLING STRUCTURES BY SA2S
Source: ABS Census 2016
In 2016, 62 per cent of separate houses were couple families with or without children (31 per cent without children and 31 per cent with children) and 19 per cent of lone person households were separate houses. The majority of lone person households were in flat/unit/apartments and semi-detached houses.

Housing Preferences in Port Stephens 26
TABLE 11: 2016 PERCENTAGE OF DWELLING STRUCTURE BY HOUSEHOLD TYPES
Source: ABS Census 2016
There is a clear divergence between the expressed preferences in the survey and the supply of housing in Port Stephens. Figure 15 compares the dwelling mix from the 2016 Census to the preferences stated in the survey and the actual dwellings of survey participants.
Some care should be taken when comparing dwelling types in the Census data and the preference survey results. The categorisation of separate houses and flats are consistent across both sources. This is indicated by the similarity in the dwelling share of these types across the Census actual dwellings occupied by study participants.
There is, however, some ambiguity in the categorisation of semi-detached dwellings and ‘other’ dwellings. In both the Census and the survey, the ‘other’ group includes improvised dwellings, cabins, houseboats, caravans and other dwelling types. However, in the preference survey, the ‘other’ group also includes aged care accommodation and retirement villages. In reality, these are likely to be semi-detached dwellings or flats but could not be appropriately categorised further without additional information. This mis-match accounts for the larger share of semi-detached dwellings in the Census than in the study results.
The proportion of participants who preferred separate house is less than both the proportion of people who occupied separate house in 2016 (6 percentage points) and the proportion of study participants who are currently living in separate houses (9.5 percentage points). This indicates a possible oversupply of detached dwellings in the Port Stephens housing market.
A slightly higher proportion of participants preferred semi-detached than the proportion of participants who are currently living in semi-detached. There is a difference of 2.5 percentage points. The Census data shows a higher proportion of occupied semi-detached dwellings, however, this result is likely due to different data categorisations (as described above).
Similarly, the share of participants who preferred a flat or apartment dwelling (9.5 per cent) is higher than both the share of participants who are currently living in flat or apartment (4.4 per cent) and the dwelling share in the Census (5.5 per cent).
Overall, this pattern in Figure 15 indicates a gap between the preference for smaller dwellings and the supply in the market. There appears to be a latent demand for semi-detached dwellings and apartments.

Housing Preferences in Port Stephens 27
FIGURE 15: COMPARISON OF PREFERENCES AND ACTUAL STOCK FROM SURVEYS AND CENSUS DATA10
Source: SGS Economics and Planning; Myriad Research, ABS Census 2016
4.2 New housing stock The supply of new housing stock in Port Stephens from 2012 to 2018 is shown below in Figure 16. This reflects new constructions in Council’s Development Approvals data.
The overall number of constructed dwellings has declined from 144 in 2012 to 68 in 2018. Single storey dwelling houses have remained as the most constructed housing stock, accounting for 83.8 per cent of new housing stocks in 2018. Meanwhile, the amount of new multi-dwelling houses remains small, accounting for only 1.5 per cent of new housing stock.
As shown above, the study has shown some evidence on a latent demand for semi-detached dwellings and apartments. The relatively small supply of multi-dwelling houses in recent construction indicates that new supply is not responding to latent demand and shifting preferences towards smaller dwellings (though the feasibility of a shift has not been tested).
10 Semi-detached dwellings in the Census covers semi-detached, row or terrace house, townhouse etc.

Housing Preferences in Port Stephens 28
FIGURE 16: NEWLY CONSTRUCTED DWELLINGS, 2012 TO 2018
Source: SGS Economics and Planning; Port Stephens Council

Housing Preferences in Port Stephens 29
5. CONCLUSIONS
The purpose of this study was to gain a greater understanding of the housing preferences of existing residents and potential residents, to identify housing needs by knowing what makes people choose to live where they do. The housing preference survey determines what people think about different aspects of both housing and location, along with how they rank these features and how they make trade-offs when given financial considerations.
To address this, SGS partnered with Myriad Research to carry out housing preferences focus groups and phone surveys. A review of relevant strategic plans, Census data and Development Application data has also been conducted to gain a more comprehensive understanding of the gap between housing preferences and housing supply.
The key trade-offs that could be inferred from the survey are: ‘affordable price’ over all other considerations, ‘safety and security’ and to be close to ‘health and medical services’ over other locational attributes,
For location preferences, the survey found that:
Most participants viewed ‘nice environment and lifestyle’ as their main reason for moving to Port Stephens and for living in their current location
‘Nice environment and lifestyle’ are more important for participants aged 50 and above than younger participants
‘Close to family, friends, area where they grew up’ and ‘convenient for work’ are more important for younger participants than participants aged 50 and above
Port Stephens (the bayside areas), Newcastle and places outside of NSW are popular locations that participants want to move
Corlette, Raymond Terrace and Medowie are popular places that people want to continue to stay
When considering moving within a self-nominated, realistic housing budget, ‘safety and security’, ‘cost’, ‘health and medical services’, and ‘shops, shopping centre’ were the most important aspects.
For housing preferences, the survey found that:
Most people reported ‘size of yard’ and ‘size of house’ as their main reason for living in their current house, however, these two attributes became less prevalent when they consider the important aspects in choice of housing within budget
Participants are willing to trade off ‘size of yard’ and ‘size of house’ for ‘price’ When considering housing within budget, ‘price’, ‘onsite parking’, ‘garage and sheds’,
‘single level’ and ‘privacy’ are rated more important than size The share of house on separate lot is smaller in the preferred housing than in
participants’ actual housing type, indicating a preference towards more compact living
Analysis of housing supply data has found that:
There is a gap between the preference for semi-detached dwellings and apartments and what is available in the Port Stephens housing market
New construction data shows that the supply of new housing is not responding to latent demand for more diverse housing types (though feasibility has not been tested).
Overall, the qualitative and quantitative evidence found that there is gap between housing supply and housing preferences. Participants have identified the need for more affordable, adaptable and smaller housing types. Housing strategy should consider the following aspects:
Housing Preferences in Port Stephens 30
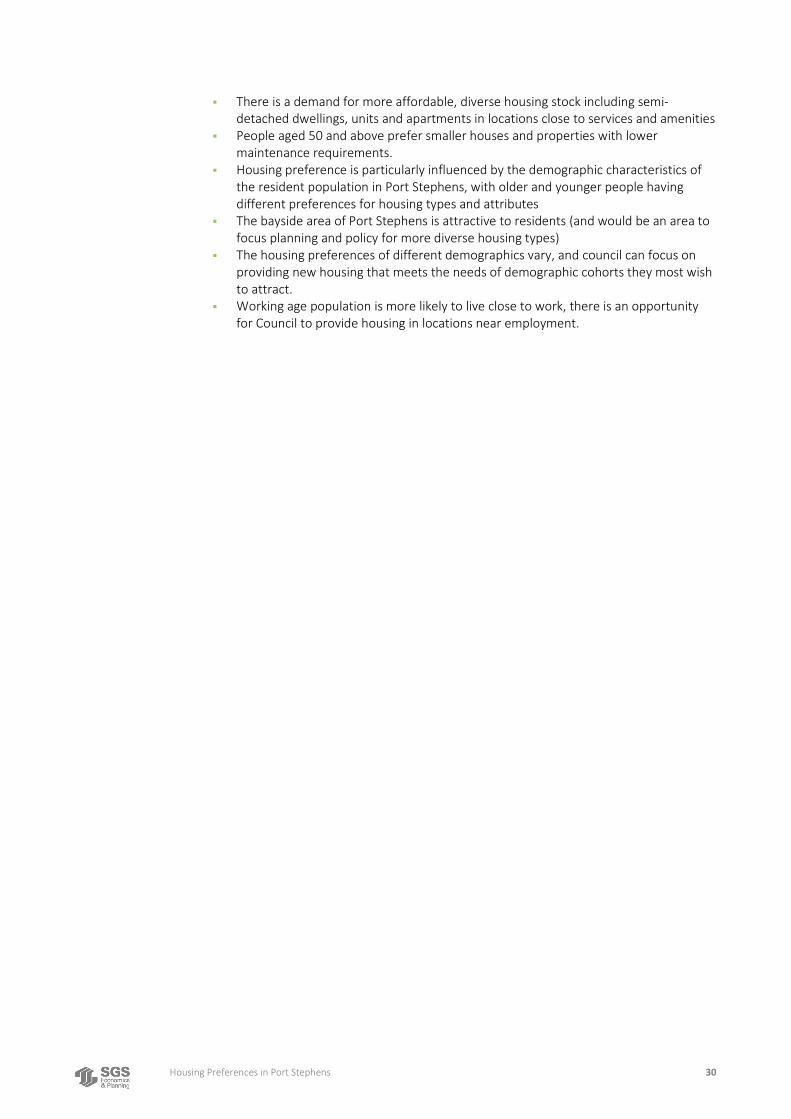
There is a demand for more affordable, diverse housing stock including semi-detached dwellings, units and apartments in locations close to services and amenities
People aged 50 and above prefer smaller houses and properties with lower maintenance requirements.
Housing preference is particularly influenced by the demographic characteristics of the resident population in Port Stephens, with older and younger people having different preferences for housing types and attributes
The bayside area of Port Stephens is attractive to residents (and would be an area to focus planning and policy for more diverse housing types)
The housing preferences of different demographics vary, and council can focus on providing new housing that meets the needs of demographic cohorts they most wish to attract.
Working age population is more likely to live close to work, there is an opportunity for Council to provide housing in locations near employment.

Housing Preferences in Port Stephens 31
APPENDIX 1 – POLICY REVIEW
The following section provides a summary of the different State and Local Government policies relevant to the Housing Preference Study. The review focuses on the diversity and types of housing, housing preferences, demographic trends relevant to housing provision and growth areas.
State Plans Hunter Regional Plan 2036
The Hunter Regional Plan 2036 was released by the NSW Government in 2016 to guide land use planning priorities and decisions over the next 20 years. It provides an overarching framework to guide more detailed land use plans, development proposals and infrastructure funding decisions.
The vision for the Hunter Region is the leading Regional economy in Australia with a vibrant new metropolitan city at its heart. The Plan identifies Newcastle City Centre as the heart of Greater Newcastle and the capital of the Hunter Region.
The population of the region is expected to grow from 732,400 in 2016 to 862,250 in 2036, with an additional 61,500 jobs. The Plan identifies that there will be a need for an additional 70,000 dwellings in the region by 2036. Much of this housing is expected to be delivered in established areas through infill development, though greenfield development will also continue. The Plan identifies greater housing choice and jobs as one of the four goals. The ageing population means that there would be more need for adaptive housing, the percentage of people aged over 65 years is projected to increase from 19 per cent to 25 per cent by 2036. The average household size is projected to decline from 2.41 to 2.28 by 2036.
One of the focus of the Plan is for compact settlement patterns in strategic and local centres and areas with established services and infrastructure, including planning for small-scale urban renewal through single-lot redevelopment. Urban release areas are predominantly located in the west of the region, with release areas in proximity of the existing rail line at Morisset, Wyee and around Cameron Park, as illustrated below. The Plan cautions against the encroachment of new housing into agricultural and extractive resource areas, industrial areas and transport infrastructure which would lead to increased management costs. The Plan notes that additional housing supply and diversity in centres should not comprise employment growth.
Housing diversity is important in meeting the needs of the changing demographics. Housing preferences of specific community groups need to be considered. Coastal locations will attract older people and weekend and seasonal visitors.

Housing Preferences in Port Stephens 32
FIGURE 17: GREATER NEWCASTLE SETTLEMENT PATTERN
Source: Hunter Regional Plan 2036
Implications for housing preferences
Decrease in household sizes and the ageing population mean that there would be more demand for accessible design, two – bedroom and less dwellings and good access to public transport and services
Coastal areas including Nelson Bay have potential for redevelopment and renewal
Discrete sectors of the community such as students, older people, short term visitors and low-income households may have specific needs for housing
The demand for short term accommodation and holiday homes will increase with the growth in the tourism sector.

Housing Preferences in Port Stephens 33
Greater Newcastle Metropolitan Plan 2036 The Greater Newcastle Metropolitan Plan 2036 was released by the NSW Government in 2018 to set out strategies and actions that will drive growth across Cessnock, Lake Macquarie, Maitland, Newcastle and Port Stephens Local Government Areas (LGAs). The Plan sits under Hunter Regional Plan 2036 and guides local planning across the five Greater Newcastle Council area.
The Plan identifies Greater Newcastle as an emerging metropolitan city with global appeal. The Plan outlines five elements that will shape Greater Newcastle into a dynamic and entrepreneurial city with a globally competitive economy and a great lifestyle, framed by wineries to the waterfront. These five elements are metro heart, metro core, metro frame, trading hubs and iconic tourism destinations.
The Plan identifies Newcastle City Centre as the metro heart that attracts residents, workers and students. Charlestown Strategic Centre, Kotara Strategic Centre, Cardiff Glendale Strategic Centre, Warners Bay Centre and Belmont Centre of Lake Macquarie LGA have been identified as part of the metro core. The Plan envisions the metro core to be a place with a cosmopolitan lifestyle with strong local communities, jobs, services and a range of recreational opportunities
The metro frame captures Central Maitland as a growing administrative and civic centre for the metro frame, and East Maitland as an emerging health and retail service centre. The metro frame captures Cessnock, Kurri Kurri, Morisset and Raymond Terrace as Strategic Centres that will provide local housing and jobs opportunities.
The population of Greater Newcastle is projected to grow from 576,000 residents to 692,000 residents by 2036. There is a need for 60,450 additional dwellings over the next 20 years. Figure 18 shows the housing opportunities for Greater Newcastle. New housing will be built over the longer-term at Medowie and in the short-medium term in Raymond Terrace as it grows northwards. The total new dwellings for Port Stephens are projected to be 11,050 by 2036, with 40 per cent greenfield and 60 per cent infill developments. The Plan suggests that the 60 per cent infill development target may be achieved a variety of housing types, including secondary dwellings, apartments, townhouses and villas. The focus of housing delivery in existing urban areas will be within strategic centres and along urban renewal corridors in the metro core.
Implications for housing preferences
Social and affordable housing requirements for Aboriginal people, and low and very low-income households need to be met
New housing in Raymond Terrace will need to cater to the changing population needs and a minimum residential density of 15 dwellings per hectare in housing release areas
Rural residential housing (large lot residential, primary production small lots, environmental living zones or minimum residential lots sizes greater than 2000 square metres) needs to be planned well to avoid conflicts with agricultural and environmental land

Housing Preferences in Port Stephens 34
FIGURE 18: HOUSING OPPORTUNITIES 2018
Source: Department of Planning & Environment 2018
Local Plans and Studies
Port Stephens Community Strategic Plan 2018 - 2028 The Strategic Plan was released by Port Stephens Council in 2018 to identify community aspirations and priorities over the next ten years and outline Council’s role in delivering these priorities.
Port Stephens is projected to have 92,800 residents by 2026. The largest population increase is projected to be older people aged 65 to 79 years. The vision for Port Stephens is a great lifestyle in a treasured environment. Community diversity is one of the key directions of the Plan. This would have implications for housing as well, as both inclusiveness and accessibility are important aspects of housing provision.

Housing Preferences in Port Stephens 35
Port Stephens Rural Residential Policy The purpose of the Policy is to provide a framework for Council to assess the appropriateness of rural residential development planning proposals in the short term. Rural residential development is defined by a combination of land use zone including R5 Large Lot Residential and E4 Environmental Living and lot sizes between 4000 square metres up to two hectares.
Port Stephens 2011 - 2036, Planning Strategy The Port Stephens Planning Strategy was released by Port Stephens Council in 2011 to guide the operations of Council and the future growth and sustainability of the LGA. The Strategy promotes Raymond Terrace as a regional centre and encourages mixed-use development in the centre, see Figure 19.
The Strategy identifies that Port Stephens has a dispersed settlement pattern with a high proportion of unoccupied dwellings, especially in the Tomaree Peninsula. Housing affordability has fallen, and it is exceedingly difficult for lower income households to purchase housing in Port Stephens. The Strategy identifies the uneven distribution of social housing as a key issue. Almost all Port Stephens’ public housing is in Raymond Terrace. The concentration of social housing has been associated with high levels of anti-social behaviour by the local community.
Implications for housing preferences
Housing provision needs to support the needs of an ageing population The housing needs of local Aboriginal and Torres Strait Islander people need to
be recognised and supported
Implications for housing preferences
Land within Karuah, Raymond Terrace, Medowie, Mallabula, Anna Bay, Nelson Bay and Fern Bay are proposed to be developed for urban purposes
The Rural Residential assessment criteria including Exclusionary Criteria and Management Criteria applies to land zoned RU1 – Primary Production, RU2 Rural Landscape, E3 Environmental Management, E4 Environmental Living, and land located a minimum of 800 metres from existing RU5 or R2 zones, or any part of the landholding that is within 800 metres of existing R5 zone

Housing Preferences in Port Stephens 36
FIGURE 19: PORT STEPHENS PLANNING STRATEGY
Source: Port Stephens Planning Strategy 2011
The table below illustrates the hierarchy of Centres within Port Stephens LGA. Nelson Bay has a dual role of serving the residents and the tourism industry. The Strategy identifies its tourism role as of regional importance.
Raymond Terrace North (Kings Hill) is a green field area that is yet to be developed. It is estimated to have a population of 11,000 people in 4,500 dwellings when developed.

Housing Preferences in Port Stephens 37
TABLE 12: CENTRES HIERARCHY
Centres Hierarchy Function Suburb
Regional Centre The hub for Port Stephens with a concentration of business, tier order retailing, employment, professional servcie3s and civic functions.
Raymond Terrace
Specialised Centres Areas containing airports, hospitals, universities, research or business activities
Salamander Bay (standalone retail) Williamtown (air services) Heatherbrae (Enterprise Corridor) Nelson Bay (Tourism)
Town Centres Contain shopping and business uses for the surrounding district and medium density housing
Nelson Bay Tanilba Bay Anna Bay Medowie Raymond Terrace North (Kings Hill)
Village Centres A strip or cluster if shops in a mostly residential area
Shoal Bay Karuah Salamander Bay (north) Raymond Terrace (Lake Side)
Smaller Village Centres A village centre on a smaller scale, services are limited to a pub or general store
Soldiers Point Lemon Tree Passage Salt Ash Fingal Bay Nelson Bay (Austral St and Armadale Ave) Fern Bay Corelette Hinton Woodville Seaham
Smaller Village Centres (other/ neighbourhoods)
No commercial zones or commercial floor space
Boat Harbour Mallabula Fullerton Cove One Mile Swan Bay Taylors Beach Wallalong
Source: Port Stephens Planning Strategy 2011
Implications for housing preferences
New residential areas such as Kings Hill have the potential to meet community needs
Areas with urban potential should be protected from large lot or rural residential development to ensure its viability

Housing Preferences in Port Stephens 38
Port Stephens Futures Strategy The Port Stephens Futures Strategy was adopted by Port Stephens Council in 2009. It expresses Council and the community’s aspirations for the future, provides a statement of strategic directions and actions to achieve them. The Future Strategy provides a foundation for the Port Stephens Local Environmental Plan.
The Strategy notes that housing in Port Stephens is comparatively affordable. Housing types and lot sizes are expected to tailor to demographic structure and community needs. The vision for housing, built form and character is housing that is sustainable; well designed; matched to demographic needs; considerate to the environment; integrated to meet planning and infrastructure and includes a component of affordability. Approval and delivery of housing is open sand transparent.
Place Specific Strategies
Progressing the Nelson Bay Town Centre and Foreshore Strategy: A revised implementation and delivery program The Implementation and Delivery Program was released by Port Stephens Council in 2018 to understand why limited private investment and economic development had occurred despite the significant growth of housing and how Nelson Bay town centre can be revitalised. The Program aims to support stakeholders to attract public and private investment.
Fern Bay and North Stockton Strategy (DRAFT) The Draft Strategy was developed in 2018 to guide future development and ensure sufficient community infrastructure is provided for the growing community. The vision for Fern Bay and North Stockton is a pedestrian focused place for people, which offers housing diversity, a mixed-use town centre, and connected open spaces and community facilities.
The goal for housing is to grow a resilient coastal community with access to liveable and diverse housing.
Implications for housing preferences
A range of housing options is required Need to consider accessibility, location and affordability Height and density need to be controlled do not dominate the existing or
planned character, for example the local village character of the foreshore areas

Housing Preferences in Port Stephens 39
Medowie Planning Strategy The Medowie Strategy was released by Council in 2016 to provide local direction for land use planning and sustainable growth over the next 20 years. Land is identified to accommodate 2,400 new dwellings in residential release areas and additional 180 in rural residential release areas.
The key principles applied are:
1. 1. Urban development is underpinned by infrastructure; 2. 2. The town centre is the focus for commercial and community activity; 3. 3. Rural residential character is balanced with urban development; 4. 4. Development will have a neutral or beneficial effect on water quality and no
increase in flooding impacts; and 5. 5. Key koala habitat and corridors are improved or maintained.
Raymond Terrace and Heatherbrae Strategy The Strategy was released by Port Stephens Council in 2015. It outlines an action plan for the development of Raymond Terrace and Heatherbrae. Goal two envisions a city of housing choice with homes that meet our needs and lifestyles with a focus on providing for affordable accommodation, which includes seniors living and student accommodation.
Implications for housing preferences
Housing densities surrounding mixed-town centres will be increased Diverse housing types will be provided to attract new people to move in Infill housing will be encouraged in Original Fern Bay The Beachfront Preinct has no population as of 2016, and it is expected to
accommodate housing growth of 300 new dwellings The envisaged housing types for Beachfront and North Stockton cover a variety
of types, including dwelling houses, detached dual occupancy, attached dual occupancy, terrace and townhouses, manor homes and residential flat buildings
Fullerton Cove and Bayway Village are to have dwelling houses Original Fern Bay and Seaside Estate are to have dwelling houses, detached
dual occupancy and attached dual occupancy
Implications for housing preferences
A semi-rural outlook is part of the character of Medowie is to be retained and balanced with the need for new land for housing to accommodate growth
The residential release areas will have 2,400 new dwellings (12 dwellings/ha), the rural residential release areas will have 180 new dwellings
The residential release areas is intended to be zoned R2 Low Density Residential

Housing Preferences in Port Stephens 40
Nelson Bay Town Centre and Foreshore Strategy The Nelson Bay Strategy was released by Port Stephens Council in 2012 to guide Nelson Bay towards becoming more attractive to tourists, the business community and residents. The Strategy covers the Nelson Bay Town Centre, Apex Park and Foreshore Area.
The Strategy identifies Nelson Bay as the most intensively developed area of Port Stephens LGA. The area is dominated by one and two storey developments with a number of multistorey residential and tourist accommodation buildings of up to five to seven storeys generally located on the periphery of the commercial core.
Karuah Growth Strategy The Karuah Growth Strategy was released by Port Stephens Council in 2011 to provide strategic level guidance for the future development of Karuah. The strategy indicates that there is considerable potential to expand the village of Karuah. The growth of Karuah is likely to be steady and not rapid and relatively little infrastructure investment is required
to cater for growth in the medium term.
Anna Bay Strategy The Anna Bay Strategy was released by Port Stephens Council in 2008 to guide the management of future population growth and the building of neighbourhoods in Anna Bay. The Strategy contains a number of Strategic Directions, relating to both land use and
Implications for housing preferences
Higher density at locations zoned R3 Medium Density Residential and B3 – Commercial Core is encouraged
For Raymond Terrace and Nelson Bay, there is limited potential for urban growth on the fringe (Greenfield) therefore planning for future housing must consider options to better utilise the existing urban area via infill and increased density
Implications for housing preferences
Since its adoption, there has been limited private investment in the town centre and foreshore
Implications for housing preferences
Future development of Karuah should be the expansion of the village by progressively rezoning Growth Areas South, East and West
An area of rural land for large holdings is retained to the north west of the village. A minimum subdivision lot size of 40 ha will ensure the land is not hampered by fragmented land ownership should the land be required for urban development beyond 2030
A small light industrial area is suggested to the west of the village to permit small light industrial enterprises to establish and provide services and employment to the residents of Karuah
The part of Karuah east of the river, within Great Lakes Shire, is identified for limited urban development and rural residential development

Housing Preferences in Port Stephens 41
recreation and community facilities, that will be implemented to achieve the vision for Anna Bay.
The vision for Anna Bay is: a small and vibrant town offering a mix of dwelling types and business opportunities and a quality natural environment. It will have a pleasant main street with a mix of retail and office space for local and visitor patronage, and shop top housing or tourist accommodation.
Implications for housing preferences
Low Density Residential land use will be facilitated by single dwellings on lot sizes from 400-700m2 and smaller lots where frontage is provided to a park or reserve area
Medium Density Residential land use will be facilitated by villas and townhouses with a minimum area per dwelling of 300m2 and concentrated around commercial uses or community facilities
Environmental Living will be facilitated by single dwellings with lot at least 1,000 square metres

Housing Preferences in Port Stephens 42
APPENDIX 2- FOCUS GROUPS FINDINGS
This section summarises the key findings from the two Port Stephens focus groups taken place at Raymond Terrace and Nelson Bay respectively.
Reasons for moving to Port Stephens
17 people participated in the focus groups. lifestyle and affordability were the most mentioned reasons for moving to Cessnock. Participants who were first homeowners noted that Raymond Terrace or Nelson Bay were the only affordable places that could give them the lifestyle they wanted. Participants who live in Raymond Terrace, praised Raymond Terrace for proximity to shops and services. Participants who live in Nelson Bay preferred to live close to water. The following are the main reasons for moving as mentioned by participants:
First home Lifestyle – on the coast, low density, lay back Cheaper housing Affordability Close to family/ relatives Work Relationship/ marriage breakdown Offered a place by Department of Housing
What for you are the most important housing and neighborhood attributes in your current/future housing choices and why? Raymond Terrace and Nelson Bay are quite different places, participants who live in either of these areas have expressed different needs.
Key housing attributes common to participants were adequate number of bedrooms, storage, pet friendly and a large backyard.
Key neighbourhood attributes common to participants were security, proximity to friends and family, and view.
How do you compare the various suburbs/towns/areas in the Cessnock/ Port Stephens/ Lake Macquarie LGA for appeal as a housing location and why? Participants noted that Raymond Terrace is the cheapest area in Port Stephens, because there is a large Housing Commission area there. Nelson Bay and other areas on the coast are more expensive.
Participants agreed that Raymond Terrace is the most convenient place, since it has a lot of shops and services. However, some participants were willing to trade off convenience with Nelson Bay’s beaches, ocean view and lifestyle.

Housing Preferences in Port Stephens 43
Do you see any potential barriers or impediments in being able to secure your preferred type of housing? For renters, the key barrier was whether the place allows for pets. Renters expressed concern over the lack of available properties. Participants noted that there is a lack of Department of Housing supply at Raymond Terrace.
Many mentioned affordability as the main barrier. Participants observed a rising housing price and stagnant salary.
Participants noted that there are not many houses that can accommodate people with special needs, for example, people on wheelchairs wouldn’t be able to access houses with stairs.

Housing Preferences in Port Stephens 44
APPENDIX 3 – SURVEY QUESTIONNAIRE
PORT STEPHENS HOUSING STUDY – RESIDENT SURVEY
Hello, my name is …. from Q&A Research, calling on behalf of the Port Stephens Council. Council is conducting an important study about future housing in the Port Stephens area and would like to hear your views. Can I firstly check that you live in the Port Stephens Council area? (close if no) Would you be the best person in your household to talk to about housing choices? (if no, ask to speak to appropriate person; re-introduce or arrange call back if necessary) And are you aged 18 years or over? (if no, ask for h’hold member who is, or close)
Start time: ………………………………………………………………………………………………
1. What is your town, suburb or area? check quotas
2a. How long have you lived in your current home? (total years)
2b. And how long have you lived in the Port Stephens Council area?
(total years)
(if more than 10 years go to 3a) 2c. Where did you move from?
(city/town/suburb/area)
2d. And what was your main reason/s for moving into the Port Stephens area?
………………………………………………………………………………………………

Housing Preferences in Port Stephens 45
3a. Do you rent, own or do you have a mortgage on your home? rent 1 mortgage 2 (go to Q4) own 3 (go to Q4) 3b. (if renting) Is that public (Government) or private housing? public 1 private 2 4. What is the main reason/s you live in your current location?
………………………………………………………………………………………………
5a. What type of housing do you currently live in? House on a separate lot 1
What is your land size? (approx. sq metres) small (up to 250m2) i small medium (250 – 500m2) ii medium (500 – 800m2) iii large (more than 800m2) iv rural block/acreage (specify) …………… acres/hectares
Semi-detached, row or terrace house, townhouse (one storey) 2 Semi-detached, row or terrace house, townhouse (two or more stories) 3 A flat, unit or apartment - in a one or two storey block
4 A flat, unit or apartment - in a three or more storey block 5 In a duplex/villa unit 6 Flat, unit or apartment – attached to a house, eg. granny flat 7 Seniors retirement village (independent living) 8 Aged care accommodation (independent living) 9 Aged care accommodation (dependent living) 10 Other dwelling type, eg, caravan, cabin, houseboat 11
5b. What is your main reason/s for choosing this type of housing? ………………………………………………………………………………………………

Housing Preferences in Port Stephens 46
6a. Are you likely to move from your current residence within the next …
12 months 1 2 years 2 5 years 3 10 years 4 More than 10 years 5 No plans to move 6 Unsure/don’t know 7
6b. And if you were to move from your current residence, where would you be likely to move to? (may be multiple)
(city/town/suburb/area)
6c. And why would you move to that location/s? (main reason)
6d. And would you expect to be renting or buying your home? rent 1 buy 2
6e. And if you were to move, what would be your budget – just approximate is OK. (don’t read out, record actual, then circle relevant code)
$................................................. if buying – house value
Under $200,000 1 $500,000 - $600,000 7 $200,000 - $250,000 2 $600,000 - $700,000 8 $250,000 - $300,000 3 $700,000 - $800,000 9 $300,000 - $350,000 4 $800,000 - $900,000 10 $350,000 - $400,000 5 $900,000 - $1,000,000 11 $400,000 - $500,000 6 Over $1,000,000
specify $………………………..
if renting – weekly rental Under $200 1 $400 - $500 4 $200 - $300 2 $600 - $700 5 $300 - $400 3 $700 - $800 6 More than $800
specify $........................
Housing Preferences in Port Stephens 47
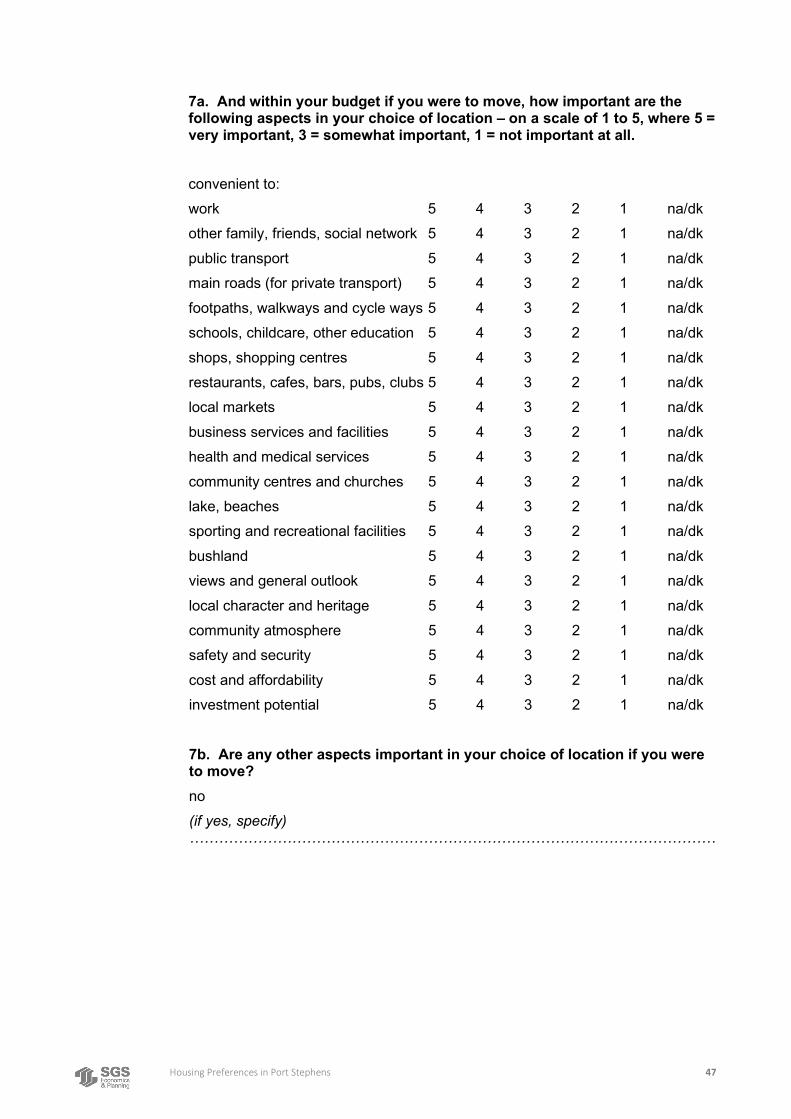
7a. And within your budget if you were to move, how important are the following aspects in your choice of location – on a scale of 1 to 5, where 5 = very important, 3 = somewhat important, 1 = not important at all.
convenient to: work 5 4 3 2 1 na/dk other family, friends, social network 5 4 3 2 1 na/dk public transport 5 4 3 2 1 na/dk main roads (for private transport) 5 4 3 2 1 na/dk footpaths, walkways and cycle ways 5 4 3 2 1 na/dk schools, childcare, other education 5 4 3 2 1 na/dk shops, shopping centres 5 4 3 2 1 na/dk restaurants, cafes, bars, pubs, clubs 5 4 3 2 1 na/dk local markets 5 4 3 2 1 na/dk business services and facilities 5 4 3 2 1 na/dk health and medical services 5 4 3 2 1 na/dk community centres and churches 5 4 3 2 1 na/dk lake, beaches 5 4 3 2 1 na/dk sporting and recreational facilities 5 4 3 2 1 na/dk bushland 5 4 3 2 1 na/dk views and general outlook 5 4 3 2 1 na/dk local character and heritage 5 4 3 2 1 na/dk community atmosphere 5 4 3 2 1 na/dk safety and security 5 4 3 2 1 na/dk cost and affordability 5 4 3 2 1 na/dk investment potential 5 4 3 2 1 na/dk 7b. Are any other aspects important in your choice of location if you were to move? no (if yes, specify) ………………………………………………………………………………………………

Housing Preferences in Port Stephens 48
8a. And within your budget, what housing type would you choose?
House on a separate lot 1 And what land size? (approx. sq metres) small (up to 250m2) i small medium (250 – 500m2) ii medium (500 – 800m2) iii large (more than 800m2) iv rural block/acreage (specify) …………… acres/hectares
Semi-detached, row or terrace house, townhouse (one storey) 2 Semi-detached, row or terrace house, townhouse (two or more stories) 3 A flat, unit or apartment - in a one or two storey block
4 A flat, unit or apartment - in a three or more storey block 5 In a duplex/villa unit 6 Flat, unit or apartment – attached to a house, eg. granny flat 7 Seniors retirement village (independent living) 8 Aged care accommodation (independent living) 9 Aged care accommodation (dependent living) 10 Other dwelling type, eg, caravan, cabin, houseboat 11
8b. And how important are the following aspects in your choice of housing if you were to move – on a scale of 1 to 5, where 5 = very important, 3 = somewhat important, 1 = not important at all. (rotate, mark first mention)
size (total floor space) 5 4 3 2 1 na/dk number of bedrooms 5 4 3 2 1 na/dk number of bathrooms 5 4 3 2 1 na/dk single level house 5 4 3 2 1 na/dk accessible for special needs, eg. disability, elderly, other mobility issues 5 4 3 2 1 na/dk low maintenance house/property 5 4 3 2 1 na/dk privacy 5 4 3 2 1 na/dk

Housing Preferences in Port Stephens 49
energy efficiency 5 4 3 2 1 na/dk size of yard/garden 5 4 3 2 1 na/dk pet friendly (including approval if renting) 5 4 3 2 1 na/dk storage areas – inside and out 5 4 3 2 1 na/dk garage and sheds 5 4 3 2 1 na/dk onsite carparking – availability/number of spaces
5 4 3 2 1 na/dk size/scale of complex (if not house on separate block)
5 4 3 2 1 na/dk rural aspect/outlook 5 4 3 2 1 na/dk price/affordability 5 4 3 2 1 na/dk
8c. Are any other aspects important in your choice of housing? no (if yes, specify) ………………………………………………………………………………………………
9. If you were to move, do you see any potential barriers in being able to secure your preferred type of housing in your preferred location – not enough availability of preferred housing type (to buy or rent) 1 price/affordability in desired location 2 houses are available but not of good enough standard (eg. age, state of repair) 3
other (specify) ……………………………………………………….
And just to finish, to make sure we have a good cross section of people in the survey, can I just check …
10a. How many people usually live in your household? ………………………
10b. Which of the following best describes your household type? Couple family with children living at home 1 Couple family with no children living at home 2 One parent family with children living at home 3 One parent family with no children living at home 4 Other family 5 Group household 6 Single household 7
other ……………………………………………….. 8

Housing Preferences in Port Stephens 50
10c. (if currently renting) What is your current weekly rental? $........................ (go to 4)
10d. (if mortgaged/own) What would you estimate to be the current market value of your home? $......................... 10e. And may I have your age? ………………………………………….
prefer not to say 1
10f. Gender (record automatically code 1 or 2 for telephone survey)
male 1 female 2 other 3 prefer not to say 4 10g. Your occupation (previous if retired/home duties) ………………………………………………………………………………………………
10h. What is the highest level of education you have reached so far? Primary school 1 Undergraduate degree 5 Year 10 2 Post graduate degree 6 Year 11/12 3 Refused 7 Trade certificate/diploma 4 Other …………………………..
10i. And your total annual household income before tax (approximate is OK)? Up to $20,000 1 $125,000 to $150,000 6 $20,000 - $50,000 2 $150,000 to $200,000 7
$50,000 to $80,000 3 other ……………………… 8 $80,000 to $100,000 4 Unsure 9 $100,000 to $125,000 5 Declined 10
And may I record your first name and phone number to verify the survey? Name: ……………………………………………… Phone: ……………………………………………
That completes the survey today. If you have any questions about this project you may contact our office or the Port Stephens Council – would you like the contact numbers?
Port Stephens 02 4988 0251 Q&A
Thankyou for your time and help today. In case you missed it, my name is … from Q&A Research, calling on behalf of the Port Stephens Council. Thanks again. Goodbye. Finish time: ………………… Length: ……… mins ID No: ………… Date: ……. / …… / 2019 Audited by …………………………………….…….……… Date: …………..……… / …… / 2019

Contact us
CANBERRA Level 2, 28-36 Ainslie Place Canberra ACT 2601 +61 2 6257 4525 [email protected]
HOBART PO Box 123 Franklin TAS 7113 +61 421 372 940 [email protected]
MELBOURNE Level 14, 222 Exhibition St Melbourne VIC 3000 +61 3 8616 0331 [email protected]
SYDNEY 209/50 Holt St Surry Hills NSW 2010 +61 2 8307 0121 [email protected]