housing prices project eeb
TRANSCRIPT
Predicting Prices in the Iowa Housing Market (Regularized Linear
Regression)
Erik Bebernes
Introduction
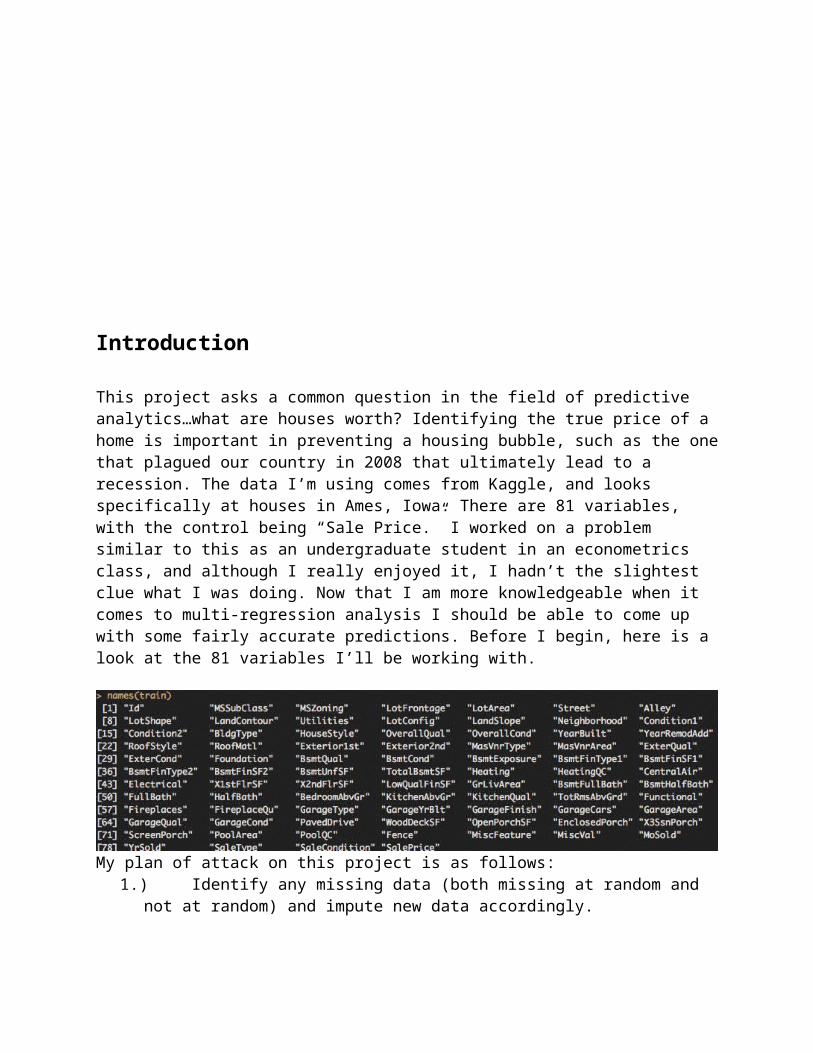
This project asks a common question in the field of predictive analytics…what are houses worth? Identifying the true price of a home is important in preventing a housing bubble, such as the one that plagued our country in 2008 that ultimately lead to a recession. The data I’m using comes from Kaggle, and looks specifically at houses in Ames, Iowa. There are 81 variables, with the control being “Sale Price.” I worked on a problem similar to this as an undergraduate student in an econometrics class, and although I really enjoyed it, I hadn’t the slightest clue what I was doing. Now that I am more knowledgeable when it comes to multi-regression analysis I should be able to come up with some fairly accurate predictions. Before I begin, here is a look at the 81 variables I’ll be working with.
My plan of attack on this project is as follows:1.) Identify any missing data (both missing at random and not at random) and impute new
data accordingly.2.) Remove any outliers to reduce model complexity and avoid overfitting.3.) Run a multi-regression model, using backward selection until the p-value for model as a
whole is below .05.4.) Try a “regularized” linear model.
Identifying Missing Data and Cleaning It
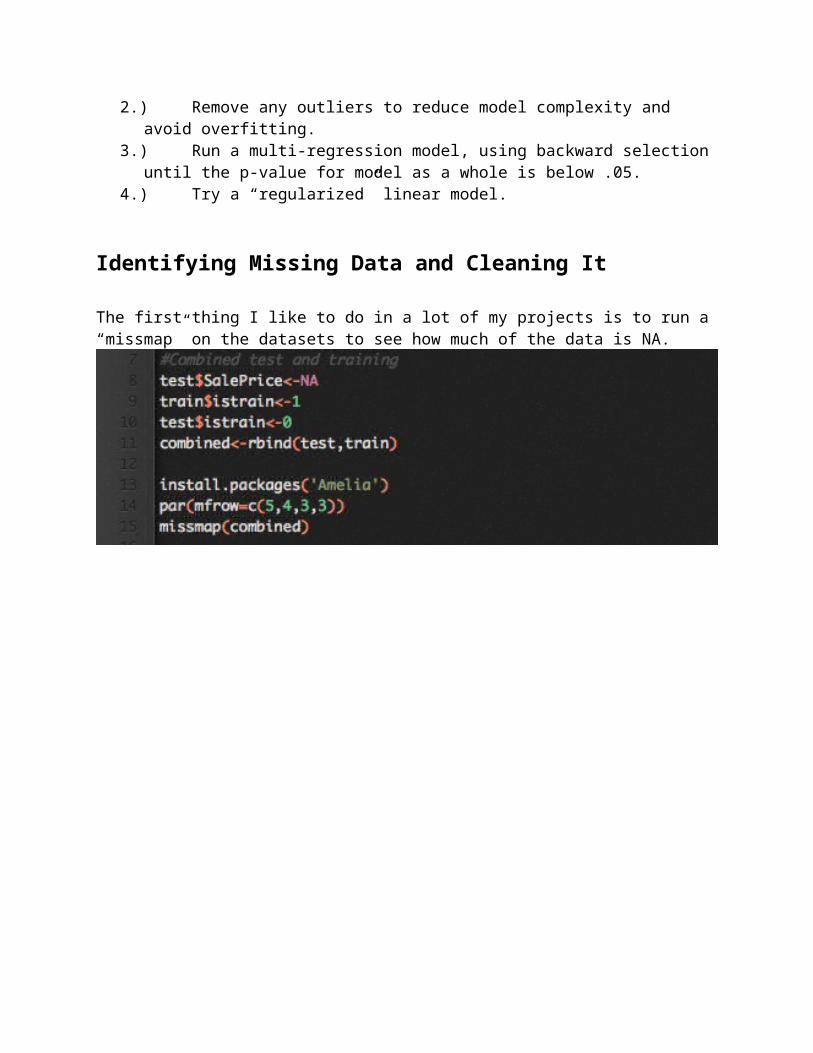
The first thing I like to do in a lot of my projects is to run a “missmap” on the datasets to see how much of the data is NA.
A handful of variables are nearly completely missing, let’s see what they are and why.
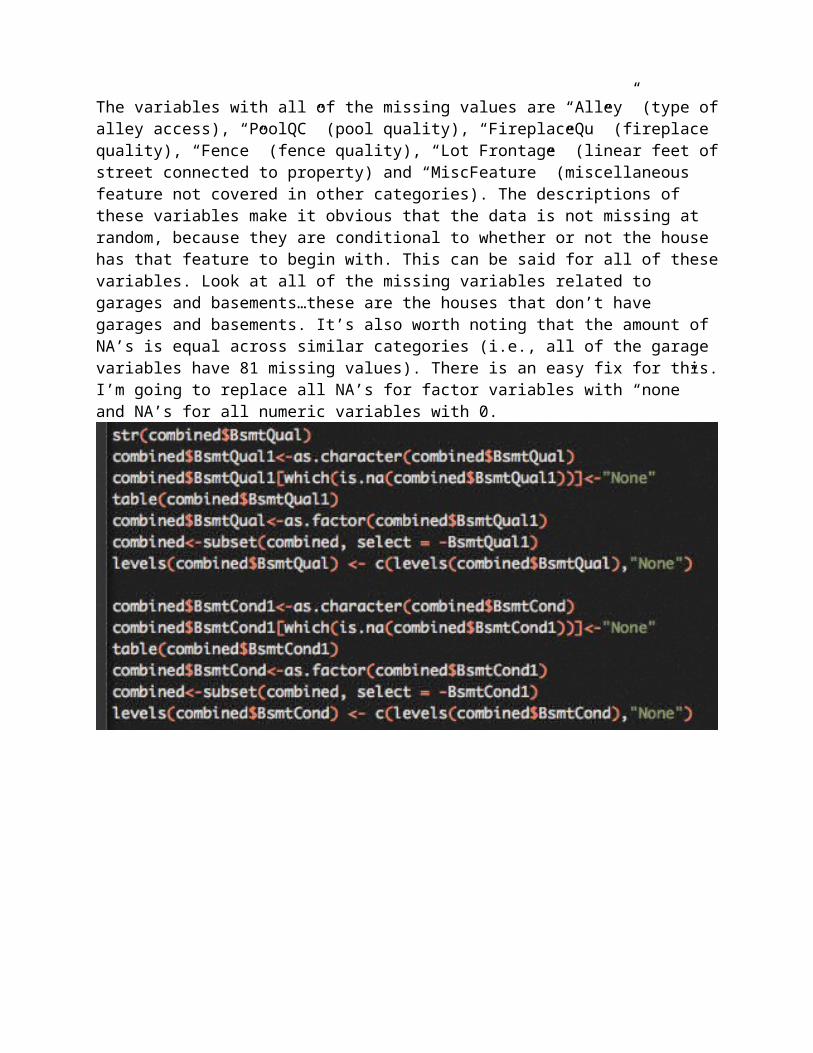
The variables with all of the missing values are “Alley” (type of alley access), “PoolQC” (pool quality), “FireplaceQu” (fireplace quality), “Fence” (fence quality), “Lot Frontage” (linear feet of street connected to property) and “MiscFeature” (miscellaneous feature not covered in other categories). The descriptions of these variables make it obvious that the data is not missing at

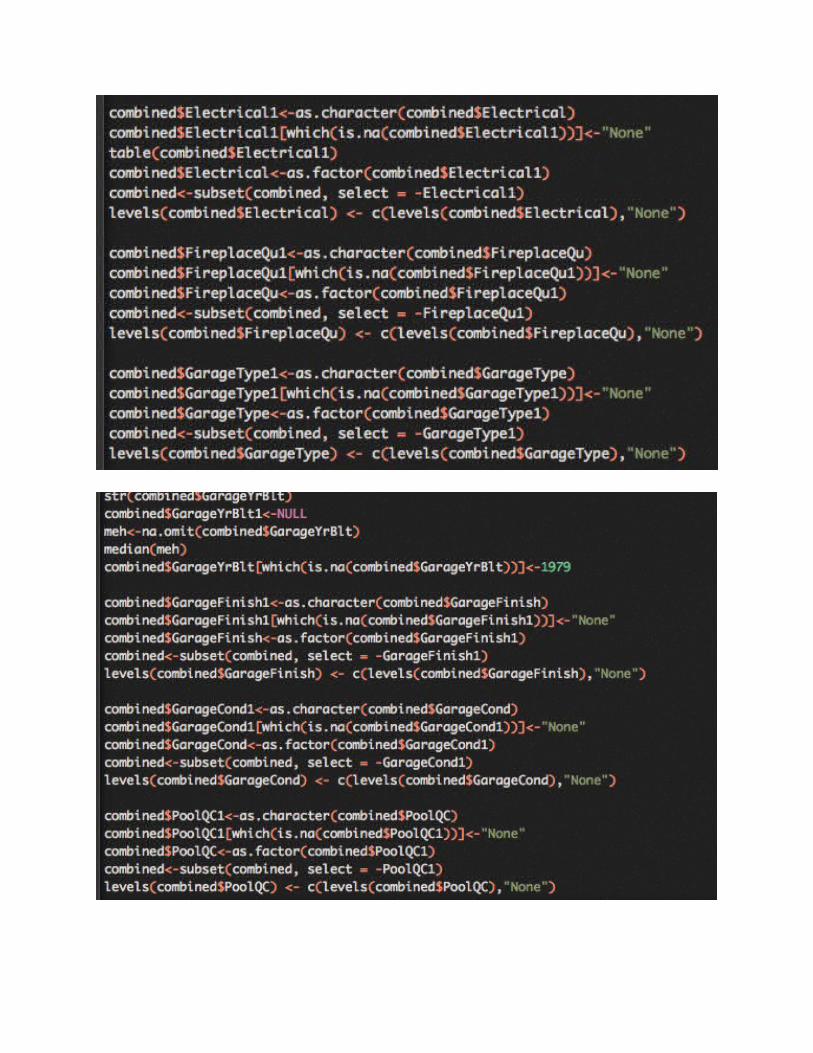
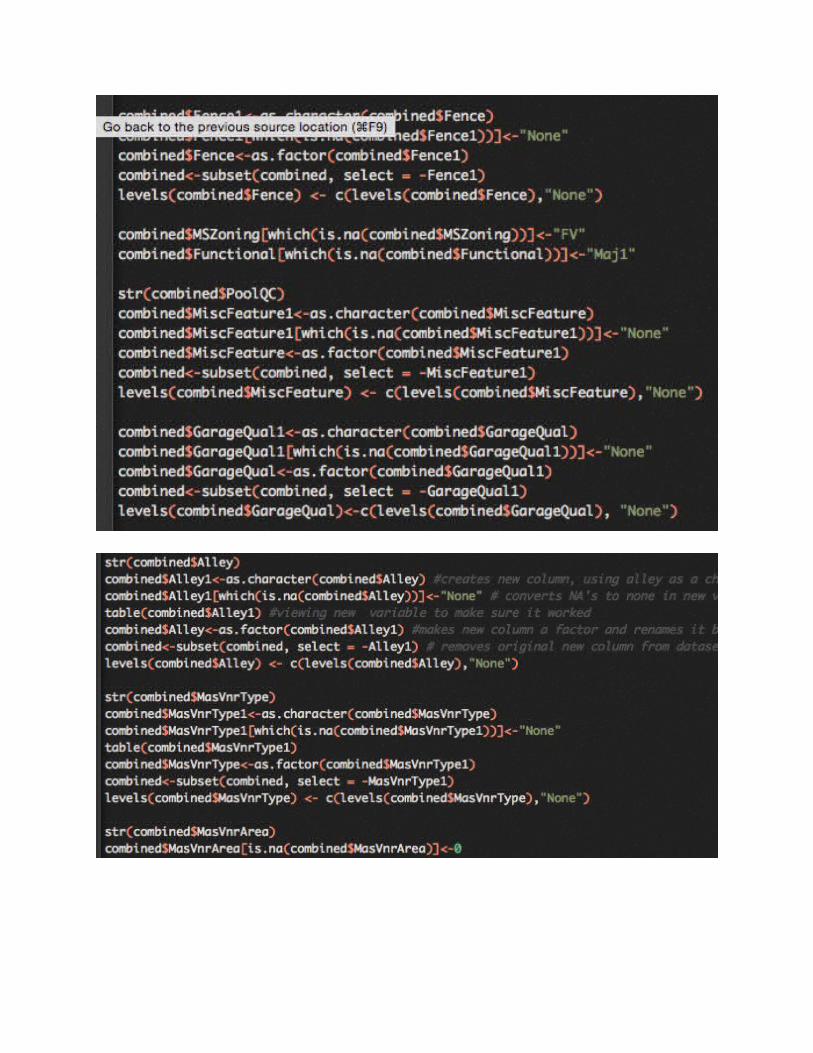
random, because they are conditional to whether or not the house has that feature to begin with. This can be said for all of these variables. Look at all of the missing variables related to garages and basements…these are the houses that don’t have garages and basements. It’s also worth noting that the amount of NA’s is equal across similar categories (i.e., all of the garage variables have 81 missing values). There is an easy fix for this. I’m going to replace all NA’s for factor variables with “none” and NA’s for all numeric variables with 0.
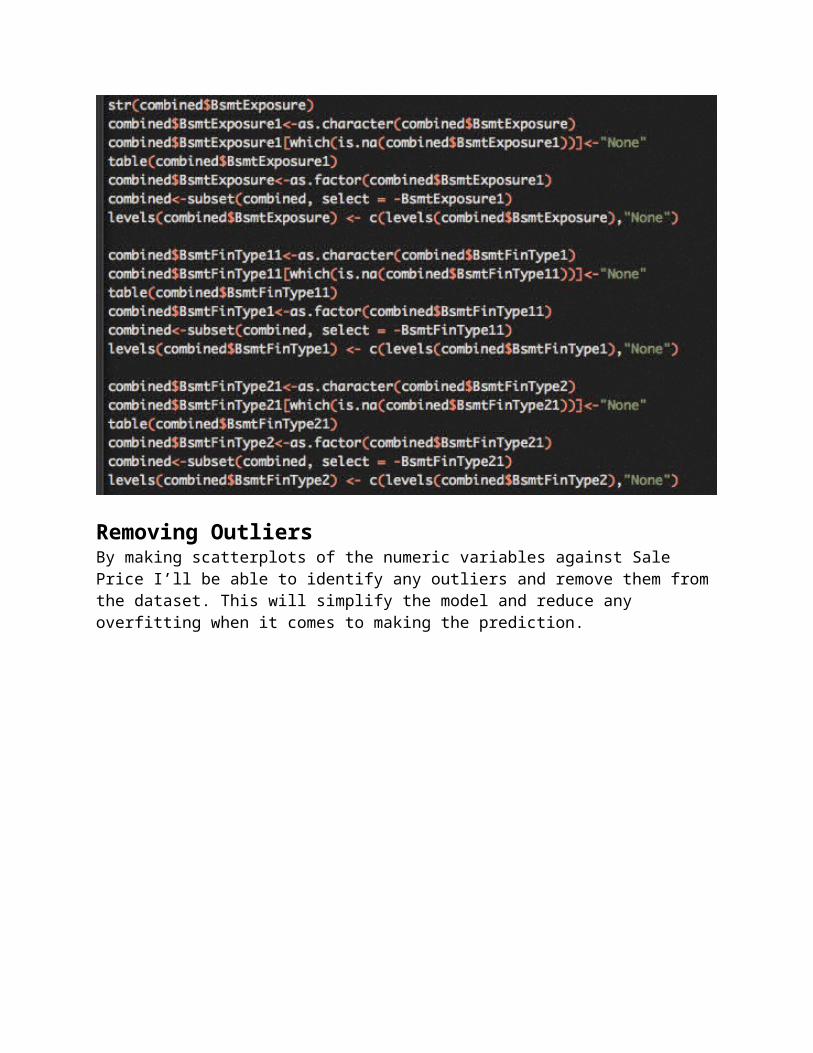
Removing OutliersBy making scatterplots of the numeric variables against Sale Price I’ll be able to identify any outliers and remove them from the dataset. This will simplify the model and reduce any overfitting when it comes to making the prediction.
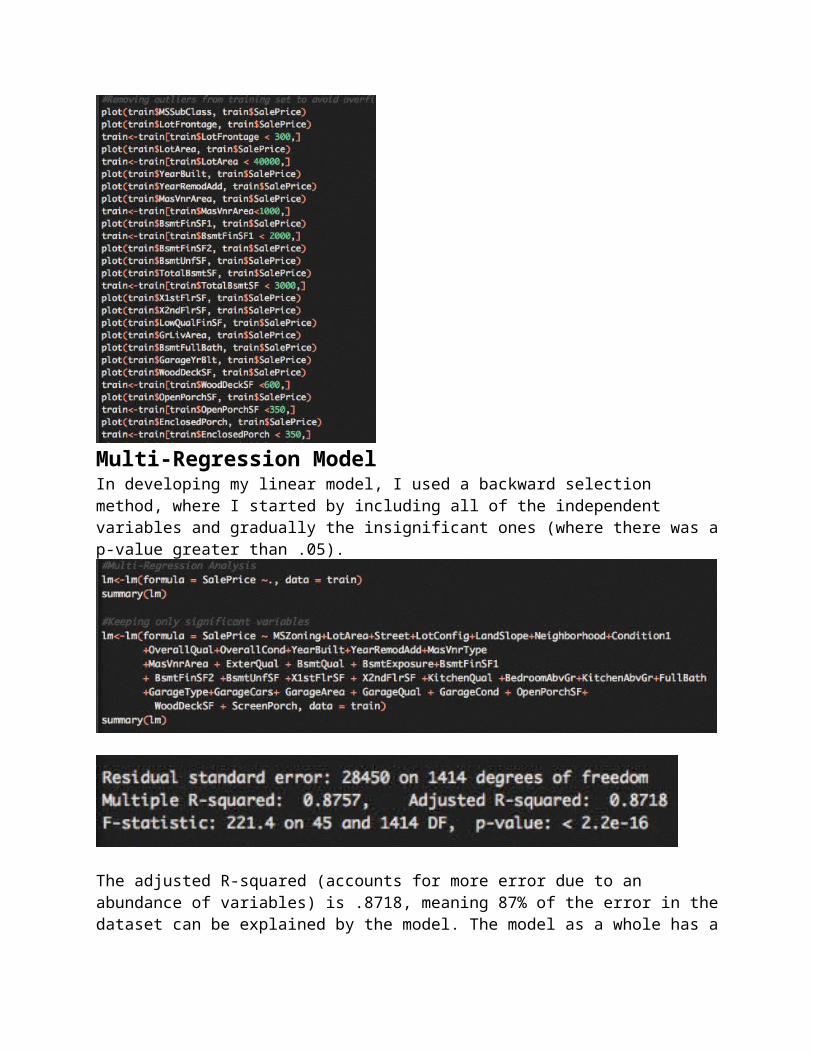
Multi-Regression ModelIn developing my linear model, I used a backward selection method, where I started by including all of the independent variables and gradually the insignificant ones (where there was a p-value greater than .05).
The adjusted R-squared (accounts for more error due to an abundance of variables) is .8718, meaning 87% of the error in the dataset can be explained by the model. The model as a whole has a p-value of < 2.2e-16, making it significant. Time to make my prediction and see how it stands up on the kaggle rankings.
After submitting my prediction, I was only in the 13th percentile of most accurate. This is due to the fact that there is a high variable to observation ratio, leading to overfitting. To account for this I will attempt to make a “regularized” linear model using the caret package in R, but in order to do so I need to convert factors of two into dummy variables.
Regularized Linear Model
Regularizing my model greatly improved my accuracy (now I’m in the 59th percentile on kaggle’s leaderboard).