housing support and independencestrategy-v1 2
TRANSCRIPT

1
DRAFT - Staffordshire Housing Support and Independence Strategy 2010-2015

2
Version: 1.1 Status: Draft
Document Summary: County wide Strategy for Housing Support and Independence.
Author: Emily Skeet/ Clare Harvey
Sponsor: Helen Trousdale
Source of Approval: JCE
Date of Approval:
Document Date: 16 Sept 2010
Review Date:
POLICY AWARENESS
People who need to know this guide in detail
Everyone involved in providing and developing Housing support, Independent living services/ accommodation, people involved in care and support of people with disabilities, District Councils.
People who need to have a broad understanding of this guide
Health and care professionals. Local planners
People who need to know that this guide exists
General Public.
CHANGE CONTROL DETAILS
Date Version Description Reason for changes
16 Sept 2010 V1.0 Original Draft n/a
30 Nov 2010 V1.1 Format document , completion of missing data and appendices
Document incomplete – additional information required prior to consultation.
9 Dec 2010 V1.2 Formatting, page numbers, Appendices Changes to text changed page numbers

3
Contents
Introduction…………………………………………………………………………………………..……………………………………………………. 5
Executive Summary ……………………………………………………………………………………………………………………………………… 6
Where are we now? ………………………………………………………………………………………………………………………………………. 9 Background: ………………………………………………………………………………………………………………………………………………… 9 Local Context - Staffordshire profile ……………………………………………………………………………………………………………………… 10 Policy Context ………………………………………………………………………………………………………………………………………………. 10 The Current Financial Position ………………………………………………………………………………………………………………………….... 11 The Capital Programme……………………………………………………………………………………………………………………………………. 13
What do we need? ………………………………………………………………………………………………………………………………………... 14 Current Supply of Services by User Group ……………………………………………………………………………………………………………… 14 Funding of existing services ………………………………………………………………………………………………………………………………. 15 Existing and Planned provision of Flexi Care Units........................................................................................................................................... Disabled Facilities Grants (DFG's) and Minor Adaptations…………………………………………………………………………………………...... Identifying Need: ……………………………………………………………………………………………………………………………………………
16 17 17
Type and changing patterns of need ……………………………………………………………………………………………………………………. 19 Actual/ Predicted level of Need …………………………………………………………………………………………………………………………… 21 Changing expectations – What people say they want and need ……………………………………………………………………………………… 25 Challenges faced by identified need - Understanding the gaps ………………………………………………………………………………………. 28 Understanding the needs and Priorities of our key Partners ………………………………………………………………………………………….. 29
Where do we want to be? ……………………………………………………………………………………………………………………………….. 31 Our Vision and Aims ……………………………………………………………………………………………………………………………………….. 31 Strategic Objectives: ……………………………………………………………………………………………………………………………………….. 32 Focus on prevention and early intervention …………………………………………………………………………………………………………….. 32 Modernise the commissioning process and models of support ………………………………………………………………………………………. 34 Increase choice and control ………………………………………………………………………………………………………………………………. 35 Active and effective partnerships …………………………………………………………………………………………………………………………. 37 Improve customer experience …………………………………………………………………………………………………………………………….. 39 Financial Planning and Investment ………………………………………………………………………………………………………………………. 41 Future Investment in Housing Support …………………………………………………………………………………………………………………... 41 Capital Investment …………………………………………………………………………………………………………………………………………. 43

4
How are we going to get there? ………………………………………………………………………………………………………………………... 45 Making best use of reduced resources ………………………………………………………………………………………………………………….. 45 Delivering more housing options for people with disabilities ………………………………………………………………………………………….. 46 Supporting people with disabilities to make informed choices about where and how they live …………………………………………………… 47 Keeping Service users at the heart of what we do ……………………………………………………………………………………………………... 47
How will we know when we’ve got there? ……………………………………………………………………………………………………………. 49 The Impact we hope to achieve ………………………………………………………………………………………………………………………….. 49 How will we measure success? …………………………………………………………………………………………………………………………... 49
Appendices Appendix 1 – Key Strategic Documents and Partner Priorities. Appendix 2 – Needs and Supply Information Appendix 3 – Housing Support Contract, Performance and Outcomes Information
Appendix 4 – Consultation Feedback report
Appendix 5 – Housing Support Financial Plan 2011/15
Appendix 6 – Equality Impact Assessment

5
Introduction
As we come to the end of a successful five year strategy and investment plan for housing support services the Prevention and Independence Team are faced with new challenges and need to reflect these through a new strategy. The wider remit of the Prevention and Independence Team requires greater integration into the Social Care and Health sector through evidencing how housing and support services are of mutual benefit, whilst maintaining and enhancing the strong partnership links with District Councils and the Third Sector.
Our central vision in relation to housing and independence is “To enable every citizen in Staffordshire to live as independently as possible”
To achieve this we need to ensure a holistic lifestyle approach which joins things up and helps people take control of their lives enabling them to live the life they choose. The success of this approach will be measured in part by the number of partner agencies to join this new 'whole system' approach, but also by changes to the way we commission services which respond to identified needs.
The “Staffordshire Cares” Whole systems model is in direct response to this agenda and the need to progress personalisation. It recognises that the individual is best placed to make decisions about their life with access to information and advice irrespective of whether they are ‘self’ funded or publicly funded. This agenda requires us to find new collaborative ways of working and developing local partnerships, which produce a range of services for people to choose from and opportunities for social inclusion.
For the Prevention and Independence Team the key element of this model is a focus on the “front end” in relation to advice, information, prevention, early intervention, reablement and use of technology.
Whilst we are experiencing difficult times financially, with difficult decisions around funding having to be made, this is also an opportunity for the housing and support sector to re-focus and re-align services to meet the needs of a greater range of people, ensuring strategic fit and creating greater efficiencies and value for money.
The work required to make our vision a reality will not begin and end with a strategy, but through this strategy we have the structure and direction required to make it happen.
Ian James Director of Joint Commissioning Unit

6
Executive Summary
This Strategy builds on the success of the 2005 - 2010 Supporting People Strategy, in continuing to deliver high quality and outcome focussed support services. However this strategy covers the broader agenda of the Prevention and Independence Team and is aimed at meeting wider objectives including personalisation, integration, modernisation, Staffordshire Cares, neighbourhood regeneration and sustainable communities.
The strategy provides a framework for commissioning activity in relation to housing support and the enablement of individuals to remain independent for as long as possible. Whilst it will not, and cannot, answer all the questions posed in the light of funding cuts and policy review it will provide the context for this commissioning activity and the opportunities and constraints we operate within. It gives a clear direction of travel and a vision for Staffordshire based on an assessment of needs and priorities identifying service models and requirements to meet these. The format of the strategy is not to look back at the journey travelled so far but to consider the current position and the journey ahead of us in order to achieve positive outcomes.
Where are we now?
The financial Climate - As with all public services, funding is reducing and our services are not immune to the unprecedented financial pressures faced by local authorities over the coming years. In real terms over 4 years, Housing Support funding will reduce by 12% on top of the admin grant cut announced earlier this year.
In addition to this the spending review announced a 27% cut to local government funding, along with likely freezes in council tax which will place pressure on the wider authorities finances. Therefore we have to ensure services are efficient and value for money whilst making the greatest positive impact on service users wellbeing.
Identification of Need - The cornerstone of a robust commissioning strategy is the identification and analysis of the needs of its target population. The range of vulnerable groups supported through housing support services and the extended remit of the Prevention and Independence Team has necessitated that a new approach is adopted. This looks at needs across three specific needs groups which brings together those groups with some areas of commonality, whilst recognising that each group may well overlap at certain points in time dependent upon circumstances. The data capture for this study looks at needs on two fronts:
♦♦♦♦ Type of need and changing patterns of need and intensity acrossthree specific needs groups.
♦♦♦♦ Actual or predicted need in the short to medium term based onknown forthcoming events e.g. Home closures and application ofcase study findings to prevalence data.
By using this approach we are able to look at the types of needs presented across all groups and identify potential themes and key issues which could be addressed by suitably focussed housing, care and support services and allows us to recognise the fact that people very rarely fit into a specific category. It has become apparent during the needs analysis process and service user consultation that it would be difficult to be specific and give absolute numbers or even a range in relation to housing support service needs due to the diversity of the groups involved. What we can be clear about however, are the types of needs presenting across these groups and how these can be met through a redirection of existing services or commissioning of new models of housing and support which address these needs.
Where do we want to be?
The strategy clearly identifies the vision, aims and objectives against which all new and existing services will be assessed to ensure

7
strategic relevance which in turn will influence investment and decommissioning decisions. Vision - To enable every citizen in Staffordshire to live as independently as possible” Aims
♦♦♦♦ To ensure people have access to a range of services and options that maximise their independence and choice of tenure
♦♦♦♦ To make best use of resources to ensure accommodation and support services offer quality outcomes and value for money
♦♦♦♦ To modernise the commissioning process to ensure activity is reflective of what people say they need and want.
♦♦♦♦ To meet the challenges and strategic direction brought about through local and national policy.
Objectives
♦♦♦♦ Focus on prevention and early intervention
♦♦♦♦ Modernise commissioning process and models of support
♦♦♦♦ Increase choice and control
♦♦♦♦ Active and effective partnerships
♦♦♦♦ Improve customer experience
How are we going to get there? Make the best use of reduced resources In the light of large cuts to public sector funding money for investment in new services is unlikely to be available until 2012/13 at the earliest and to enable investment in new services there may well be the necessity to make savings in funding existing services. We plan to do this in the following ways:
♦♦♦♦ Making efficiency savings through tendering, review, restructure and decommissioning of services not deemed strategically relevant.
♦♦♦♦ Bringing in new money through Pooled budgets and joint commissioning of services
Work with Partners to deliver more housing options for people with disabilities. In the current economic climate it is becoming increasingly necessary to work smarter and in collaboration with our partners. To do this we need to build on already strong links as well as identify where capital investment is required to stimulate the market. We will do this by:
♦♦♦♦ Investing through our Supported Living and Flexi Care Capital programmes
♦♦♦♦ Looking at other innovative models to lever in capital or increase accommodation options at reduced cost
We will support people with disabilities to make informed choices about where and how they live People in the statutory sector or in residential care are often considered to be appropriately housed. Our needs analysis identified a gap in relation to housing advice and options being discussed with this group in any great detail. To address this we will:
♦♦♦♦ Establish the Independent Living Service
♦♦♦♦ Introduce approved Housing models and quality standards
Keep Service users at the heart of what we do We aim to do this by collating information on their wants, needs and aspirations which in turn will influence service design and commissioning decisions. To enable us to do this we have developed a consultation toolkit which involves three key methods of collating feedback which can be added to creating a menu of service user involvement options in the future.

8
How will we know we’ve arrived? The impact we hope to achieve
♦♦♦♦ People who need care and/or support will be living in the most independent and best accommodation that they can.
♦♦♦♦ People will be living in accommodation with access to services that enhances their connection to their community, makes them feel safe and secure whilst helping them to take positive steps to maintain their independence.
♦♦♦♦ People who need care and support will be using a range of services (for both prevention and more complex interventions) which they will be accessing from a single point of contact.
♦♦♦♦ People will have a choice about how the services they receive are commissioned using direct payments and personal budgets.
♦♦♦♦ As their needs change fewer people will have to move from their current home to residential care to receive the support they need.
♦♦♦♦ People will be supported by a range of services working together to help them to be as independent as possible.
How will we measure success?
♦♦♦♦ Outcomes Monitoring - Positive outcomes for service users are at the heart of both national and local policy and are integral to the commissioning of housing and support services. Therefore outcome monitoring is to become a central pillar of our commissioning process in line with the existing outcome measures, to ensure continuous improvement. Ultimately this approach requires commitment from all partners to ensure outcomes are geared towards a common direction of travel which in turn leads to greater joint commissioning and service user satisfaction.
♦♦♦♦ Implementation Action Plans - Individual implementation action plans will be produced giving the detail in relation to the key actions to be pursued in relation to our aims and strategic objectives and our success in achieving these will be tracked in relation to completion of these actions to timescale.
Conclusion The housing support and independence agenda is fundamentally linked to many of the major issues faced in Staffordshire around poverty, deprivation, ill health, worklessness, crime, community safety and environmental sustainability. In order to meet these challenges and to achieve better outcomes for communities a more ‘joined up’ approach is needed. The Prevention and Independence Team has a key role in promoting links between partners, including Health, Housing, Probation and Social Care. Supporting partners to work together to achieve the actions in the strategy’s implementation plans will be vital to make things happen. The future success of this strategy will depend upon a number of factors including the need to introduce new ways of delivering services. Thinking innovatively and developing new ideas will not be achieved in isolation. Partners, service users, carers, staff all need to be involved in moving housing support and independence services forward. Only by working together will bring positive changes to the prosperity and well being of Staffordshire’s residents.

9
1. Where are we now? Background Housing Support and Independence is all about providing services that help vulnerable citizens improve their quality of life and well- being so that they can live independently. Whether helping a person to remain living in their own home or providing support so that individuals can engage positively within their community it is vital that support is given at the right time. The aim of Staffordshire’s Housing Support and Independence agenda is to ensure that services are delivered at the right time to help reduce, delay or prevent situations which affect someone’s ability to live independently. Staffordshire County Council recognise that there is a need to make a fundamental shift from “screening out” through eligibility criteria to the “screening in” through prevention and well being at lower levels of need. Referring to Staffordshire Unites – Our Strategic Plan (2010-2015), Prevention is named as a core value which needs to be at the centre of everything the County Council delivers. The Prevention and Independence Team have embraced this core value and are implementing new initiatives to support prevention and early intervention. From developing new Flexi Care housing schemes, which support frail older people to maintain their independence, to delivering mediation services that aim to stop young people becoming homeless due to family breakdown, housing support and independence services are crucial in delivering on prevention and early intervention. This document will build on the success of the 2005 - 2010 Supporting People Strategy, in continuing to deliver high quality and outcome focussed support services but with the broader agenda encompassing housing, social care and health, there will be a move towards meeting a wider remit of objectives including personalisation, integration, modernisation, Staffordshire Cares, neighbourhood regeneration and sustainable communities.
During the preparation of this strategy a change of government was announced. Although the coalition government have set out proposals on a comprehensive range of domestic, foreign, economic, social, environmental and political challenges it is how the government intends to address the country’s deficit which gives organisations most concern. The need to deliver services on increased efficiencies presents organisations with many challenges, especially when tough decisions need to be taken about which services to continue delivering and which to de-commission.
The Prevention and Independence Team are aware of what lies ahead and are geared up towards working in an environment where budgets are limited and reducing. In order to manage resources more effectively we are looking at new ways of working to increase efficiency and ensure better value for money as well as bringing in funding from other sectors. In line with the Total Staffordshire approach we will work with partners to combine resources which will be used more effectively to potentially deliver efficiencies. There are a number of reasons why the housing support and independence programme is important to the residents of Staffordshire including:
♦♦♦♦ It is fundamental to delivering a high proportion of outcomes in local strategies and impacting on delivery agents, for example, the programme influences many of the 35 indicators in Staffordshire’s Local Area Agreement relating to independent living, promoting social inclusion, community safety, sustainability and health inequalities. Staffordshire’s performance against NI141 and NI142 continues to exceed regional and national averages.
♦♦♦♦ Since the implementation of the Supporting People programme in 2005 there has been increased recognition for

10
the valuable role good quality housing and support plays in improving quality of life and life chances for vulnerable people.
♦♦♦♦ As a preventative programme financial benefits to the ‘public purse’ can be gained. Discussed in a later section of this document a benefits realisation study carried out by Cap Gemini has shown that for every £1 Staffordshire spend on housing support services it saves another £4.29 to the wider public purse.
♦♦♦♦ A robust value for money methodology is applied across commissioning processes including good quality and monitoring systems to measure providers’ performance.
Local Context - Staffordshire profile Staffordshire County Council directly fund services throughout the County which provide help and support to 26,000 adults who are vulnerable because of their age, disability, mental or physical health.
Staffordshire has the 8th largest population of the shire counties in England with an estimated 825,800 people living in the County, which is projected to rise to approximately 909,000 people by 2026. The number of the population aged over 85 is set to almost double by 2025 in Staffordshire (Source: Staffordshire Observatory). This coupled with an increase in prevalence of people with disabilities and dementia means that people are living longer with serious debilitating illnesses. Staffordshire covers an area of 2,623km2 in size with 80% of the land in Staffordshire being rural yet three quarters of our population live in urban centres. According to the 2001 census, 3.8% of our residents are from black and minority ethnic communities (BME), i.e. not ‘White British’. Overall the BME population in Staffordshire is very low. It is much lower (less than a third) of the regional and national figures, which
are both around 13%. The mix and profiles of BME communities across the county varies from very small communities in the more rural areas to greater density of population groups in some of the more urban areas. Policy Context There are a number of national, regional and local policy documents which relate to housing, support and independent living services and this strategy has been shaped to varying degrees by all of these policies and strategies which outline priorities for meeting specific needs, how services should be delivered and the differences which should be made to the individual’s quality of life. When considering the policy context within which we are working the following three key policy areas will have the biggest impact on the direction of the strategy and will ultimately shape the aims, objectives and impact we wish to make. National Housing Strategy and Policy The general drive of national housing strategy and policy is the assertion that everyone should have the opportunity of a decent home at a price they can afford, in sustainable communities where they want to live and work.
Whilst the strategic housing duty lies clearly with the eight district councils across the County, the Local Government White Paper, Strong and Prosperous Communities, identified the need for local authorities to take a more strategic approach to housing as part of their place shaping role.
This approach is backed up by the Housing Green Paper, Homes for the future: more affordable, more sustainable, which calls on all Local Authorities to play a stronger role in addressing the housing needs of all residents by ensuring the delivery of new and affordable housing whilst making best use of existing stock.

11
The Place Shaping Agenda This agenda promotes wellbeing for all by delivering real improvements for local people and making more efficient use of resources. The delivery vehicle for this agenda locally is through the Staffordshire LAA which is also the administering body for Staffordshire’s Housing Support Grant which will be paid as part of the Area Based Grant. Delivering housing support is measured by two key performance indicators; NI141 and NI142 but also overlaps with indicators associated with PSA16 on socially excluded adults in settled accommodation and employment, education or training.
Whilst neither indicator is currently included in Staffordshire’s 35 priorities, Housing support services impact on many of the 35 priorities. The Modernisation Agenda The Green Paper highlights the challenges faced by current social care system and the need for radical reform, to develop a service that is fair, simple and affordable for everyone. The “Staffordshire Cares” Whole systems model is in direct response to this agenda and the need to progress personalisation. It recognises that the individual is best placed to make decisions about their life with access to information and advice irrespective of whether they are ‘self’ funded or publicly funded. This agenda requires us to find new collaborative ways of working and developing local partnerships, which produce a range of services for people to choose from and opportunities for social inclusion.
The current financial position Housing Related Support Funding As with all public services, the allocation of revenue funding through the Area Based Grant for housing support services (formerly through the Supporting People programme) is entering a time of unprecedented financial pressure over the coming years.
In real terms over 4 years, taking into account 2.5% annual inflation, the cuts announced in the comprehensive spending review equate to a 12% cut on top of the admin grant cut announced earlier this year. Uncertainty still remains however for housing support funding, as with any other non ring-fenced grant. Due to the spending review announcing a 27% cut to local government funding, along with likely freezes in council tax, pressure on non ring-fenced funding is inevitable and with spending decisions now being taken at a local level it is likely that further changes are to come.
Also, not yet clear is what the impact will be from welfare reforms, and in particular the 10% cut in Housing Benefit to people who have been jobseekers for in excess of 12 months and the extension of single room rate in Local Housing Allowance up to the age of 35.
The following graph summarises spending review cuts in relation to housing support and specifically outlines implications for Housing Support funding for indicative purposes.

12
NH
S (
He
alt
h)
Ed
uca
tio
n
Inte
rna
tio
na
l D
eve
lop
me
nt
Wo
rk a
nd
Pe
nsi
on
s
Sco
tla
nd
Re
serv
e
De
fen
ce
Wa
les
No
rth
ern
Ire
lan
d
Sin
gle
In
tellig
en
ce A
cco
un
t
Ca
bin
et
Off
ice
Sup
po
rtin
g P
eo
ple
La
w O
ffic
ers
' De
pa
rtm
en
ts
HM
Tre
asu
ry
Fo
reig
n a
nd
Co
mm
on
we
alt
h O
ffic
e
En
erg
y a
nd
Clim
ate
Ch
an
ge
HM
Re
ven
ue
an
d C
usto
ms
Cu
ltu
re,
Me
dia
an
d S
po
rt
Sma
ll a
nd
In
de
pe
nd
en
t B
od
ies
En
viro
nm
en
t, F
oo
d a
nd
Ru
ral A
ffa
irs
Sp
eci
al R
ese
rve
Tra
nsp
ort
CLG
Co
mm
un
itie
s
Just
ice
Ho
me
Off
ice
Bu
sin
ess
, In
no
vati
on
an
d S
kills
CLG
Lo
cal G
ove
rnm
en
t
£11.1
£3.1
£0.8
-£0.1
-£0.4
-£0.046
(-£45.8M) -£5.6
-£6.0
-£4.0
-£2.0
£0.0
£2.0
£4.0
£6.0
£8.0
£10.0
£12.0N
HS (
He
alt
h)
Ed
uca
tio
n
Inte
rna
tio
na
l D
eve
lop
me
nt
Wo
rk a
nd
Pe
nsi
on
s
Sco
tla
nd
Re
serv
e
De
fen
ce
Wa
les
No
rth
ern
Ire
lan
d
Sin
gle
In
tellig
en
ce A
cco
un
t
Ca
bin
et
Off
ice
Sup
po
rtin
g P
eo
ple
La
w O
ffic
ers
' De
pa
rtm
en
ts
HM
Tre
asu
ry
Fo
reig
n a
nd
Co
mm
on
we
alt
h O
ffic
e
En
erg
y a
nd
Clim
ate
Ch
an
ge
HM
Re
ven
ue
an
d C
usto
ms
Cu
ltu
re,
Me
dia
an
d S
po
rt
Sma
ll a
nd
In
de
pe
nd
en
t B
od
ies
En
viro
nm
en
t, F
oo
d a
nd
Ru
ral A
ffa
irs
Sp
eci
al R
ese
rve
Tra
nsp
ort
CLG
Co
mm
un
itie
s
Just
ice
Ho
me
Off
ice
Bu
sin
ess
, In
no
vati
on
an
d S
kills
CLG
Lo
cal G
ove
rnm
en
t
Cash difference, 2014-15 to 2010-11 (£ billion)
This real term reduction in the grant has necessitated that the actions and intentions within this strategy are both prudent and realistic to ensure we do not raise false expectations or over commit resources to the detriment of other service areas.
Housing Related Support Funding – Medium Term Financial Model 2010/11.
2009/10 2010/11 Two Yr Total
Resources £'000 £'000 £'000
Grant - Main 13,495 13,601 27,096
Grant - Handyperson 150 220 370
Other Income 161 134 295
Under spend B/F 2,603 2,447 2,603
Total Available Funds 16,409 16,402 30,364
Expenditure
Base 11,753 12,556 24,309
Developments 2,209 1,951 4,160
Inflation Provision - - -
Total Expenditure 13,962 14,507 28,469
Surplus/ (Deficit) in Funding 2,447 1,895 1,895
The financial forecast for 2011/12 is reliant on carrying forward an under spend from previous years of £1.4m. This provides a financial safety net over the next year to balance resources to financial commitments. Once used this will not be available for future years and the programme is faced with making significant savings in order to balance resources. DFG’s/ Equipment Each district/borough council receives a DFG allocation from the Department of Communities and Local Government (CLG). The chart below provides details on the budget allocation by district/borough area for the current financial year, 2010/2011. Referring to the districts’ contributions there used to be a requirement to top up the allocation by 40% but this is no longer applicable. National and local

13
reductions in public spending will make it harder for local authorities to identify discretionary funding in the future.
The Capital Programme To support its commitment to increasing independent living options in Staffordshire the County council has invested, through its capital programme, in both Flexi Care and supported living schemes across Staffordshire. To date the majority of activity has been with regards to Flexi Care schemes with the County committing capital, land or assets to the value of £1.392m over the last 3 years, which in turn has levered in an addition £17.446m worth of investment from other organisations such has the HCA, District Councils, Department of health and RSL developers. This has enabled the development of 217 units of Flexi Care across the county.
The capital programme for supported living currently stands at £4.185 million over a 4 year period from 2010/11 – 2013/14. This funding is in place to support people with learning disabilities, currently living in our in house residential care homes, to move into independent living by providing capital subsidy to partners on our development framework to provide alternative accommodation. The level of subsidy will be capped but the actual level of subsidy required will be established through the mini tender process linked to the framework. The Joint Commissioning Unit has project managed the re-provision programme for people living in NHS campus accommodation, on behalf of Staffordshire County Council, Stoke-on-Trent City Council and the three PCT’s, as per a central government requirement to do so. This has involved an extensive development programme, due for completion in March 2012, to provide 67 units of supported living accommodation bespoke for people with complex learning and physical disabilities, costing in the region of £12 million. Funding for this project has been provided by all key partners including the Department of Health, PCT, RSL partners and Staffordshire and Stoke local Authorities highlighting the true partnership nature of this programme.

14
2. What do we need? The cornerstone of any robust commissioning strategy is the identification and analysis of the needs of its target population. This enables us to identify gaps in provision and the service models and delivery mechanisms required to ensure positive outcomes for those using the services in question. This section clearly identifies current supply set against identified needs which can then be utilised in the development of a commissioning plan for housing support and independent living services. Current Supply of Services by User Group This section of the strategy gives an analysis of the current supply of housing support and independent living services across Staffordshire. The current supply for accommodation based units and floating support units (as at May 2010) is 18,527, of which 5,370 are accommodation based, 2,636 floating support, with the remaining 10,449 community alarms and 72 HIA/handyperson services. The presentation of this information in a pie chart clearly illustrates that older people with support needs have the most provision of services followed by people with learning disabilities and the frail elderly. It must be noted though that a high proportion of the units included in ‘Older people with support needs’ are for community or social alarm services.
The only service user group which does not have a specific service is ‘travellers’. Any services required by travellers are usually delivered through generic floating support. This approach caters for many of the other low provision service user groups’ e.g. rough sleepers, people with HIV/AIDs, mentally disordered offenders etc.

15
Funding of existing services
From 2009 funding for Supporting People services has been allocated to authorities through area based grants. The grant allocated to Staffordshire for housing support funds approximately 268 services which are delivered to various different service user groups. As illustrated in the pie chart below there is an unequal distribution of funds to primary service user groups with some receiving very little funding compared to other groups where grant expenditure is high. It must be noted that a greater number of units does not necessarily mean a higher percentage of grant expenditure.
For example, funding for the 525 units of accommodation based services for ‘frail elderly’ is £532,227. This is £592,813 less than funding for 184 units of accommodation based services for people with mental health problems (£1,125,040). The pie chart below shows that older people with support needs receive the highest amount of grant as well as delivering the most units. People with mental health problems receive the second highest amount of grant but only deliver 1% of the total units. This is due to the service users for this group requiring more intensive support. Generic services receive the third highest amount of grant for delivering 3% of the total units.
Staffordshire’s annual budgeted funding (2010/2011) for housing-related support services is £15.27m. Breaking this down into the three new groups this means that 43% is spent on services for people at risk of social exclusion, followed by 36% on housing with support services and 21% housing with care and support.
16
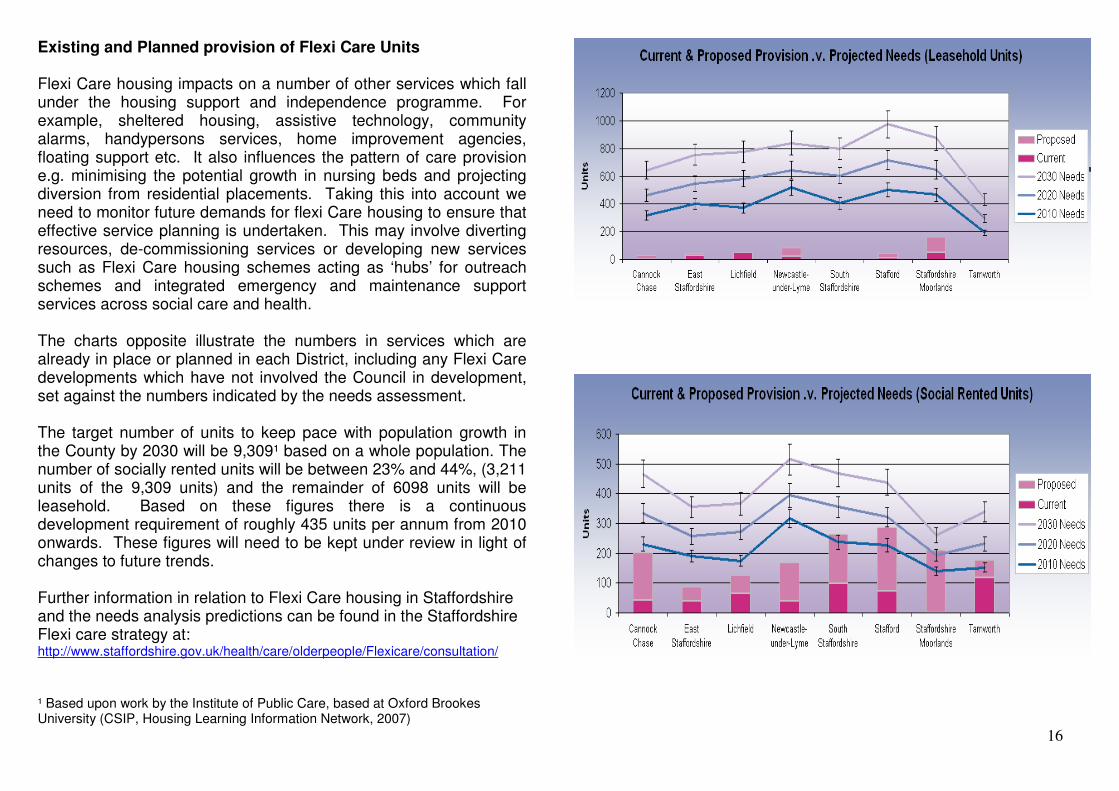
Existing and Planned provision of Flexi Care Units Flexi Care housing impacts on a number of other services which fall under the housing support and independence programme. For example, sheltered housing, assistive technology, community alarms, handypersons services, home improvement agencies, floating support etc. It also influences the pattern of care provision e.g. minimising the potential growth in nursing beds and projecting diversion from residential placements. Taking this into account we need to monitor future demands for flexi Care housing to ensure that effective service planning is undertaken. This may involve diverting resources, de-commissioning services or developing new services such as Flexi Care housing schemes acting as ‘hubs’ for outreach schemes and integrated emergency and maintenance support services across social care and health. The charts opposite illustrate the numbers in services which are already in place or planned in each District, including any Flexi Care developments which have not involved the Council in development, set against the numbers indicated by the needs assessment. The target number of units to keep pace with population growth in the County by 2030 will be 9,309¹ based on a whole population. The number of socially rented units will be between 23% and 44%, (3,211 units of the 9,309 units) and the remainder of 6098 units will be leasehold. Based on these figures there is a continuous development requirement of roughly 435 units per annum from 2010 onwards. These figures will need to be kept under review in light of changes to future trends. Further information in relation to Flexi Care housing in Staffordshire and the needs analysis predictions can be found in the Staffordshire Flexi care strategy at: http://www.staffordshire.gov.uk/health/care/olderpeople/Flexicare/consultation/
¹ Based upon work by the Institute of Public Care, based at Oxford Brookes University (CSIP, Housing Learning Information Network, 2007)
17
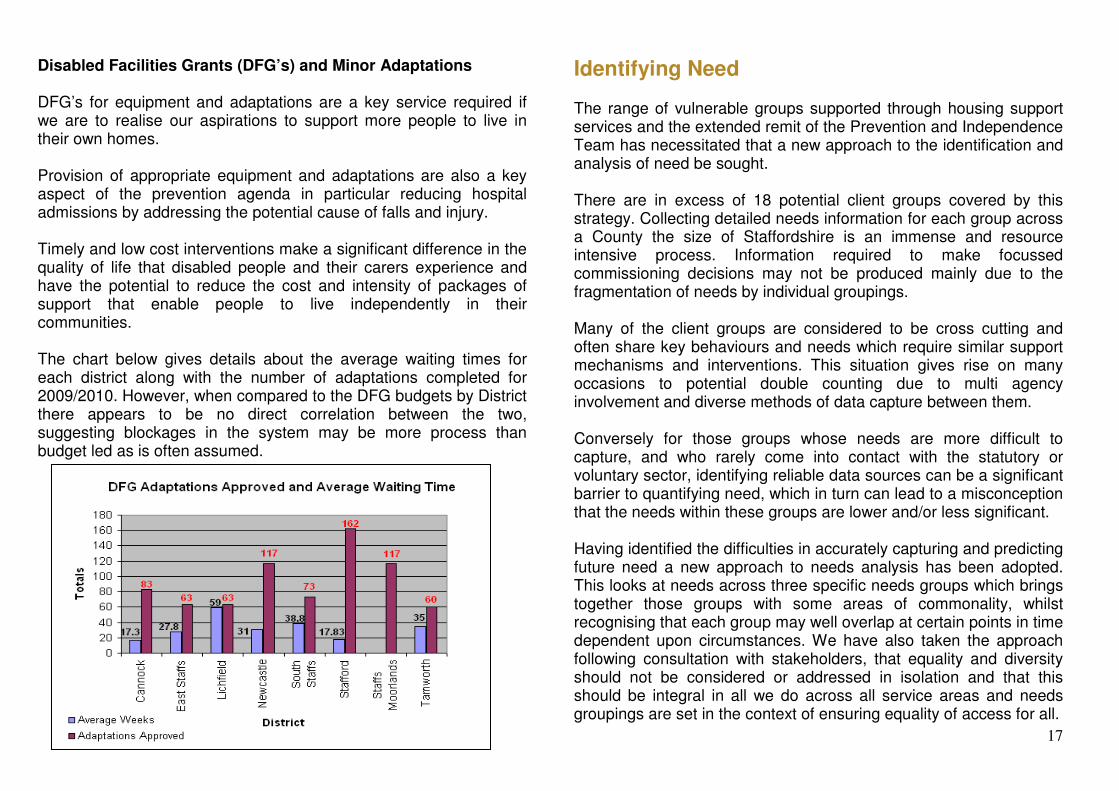
Disabled Facilities Grants (DFG’s) and Minor Adaptations DFG’s for equipment and adaptations are a key service required if we are to realise our aspirations to support more people to live in their own homes. Provision of appropriate equipment and adaptations are also a key aspect of the prevention agenda in particular reducing hospital admissions by addressing the potential cause of falls and injury. Timely and low cost interventions make a significant difference in the quality of life that disabled people and their carers experience and have the potential to reduce the cost and intensity of packages of support that enable people to live independently in their communities. The chart below gives details about the average waiting times for each district along with the number of adaptations completed for 2009/2010. However, when compared to the DFG budgets by District there appears to be no direct correlation between the two, suggesting blockages in the system may be more process than budget led as is often assumed.
Identifying Need The range of vulnerable groups supported through housing support services and the extended remit of the Prevention and Independence Team has necessitated that a new approach to the identification and analysis of need be sought. There are in excess of 18 potential client groups covered by this strategy. Collecting detailed needs information for each group across a County the size of Staffordshire is an immense and resource intensive process. Information required to make focussed commissioning decisions may not be produced mainly due to the fragmentation of needs by individual groupings. Many of the client groups are considered to be cross cutting and often share key behaviours and needs which require similar support mechanisms and interventions. This situation gives rise on many occasions to potential double counting due to multi agency involvement and diverse methods of data capture between them. Conversely for those groups whose needs are more difficult to capture, and who rarely come into contact with the statutory or voluntary sector, identifying reliable data sources can be a significant barrier to quantifying need, which in turn can lead to a misconception that the needs within these groups are lower and/or less significant. Having identified the difficulties in accurately capturing and predicting future need a new approach to needs analysis has been adopted. This looks at needs across three specific needs groups which brings together those groups with some areas of commonality, whilst recognising that each group may well overlap at certain points in time dependent upon circumstances. We have also taken the approach following consultation with stakeholders, that equality and diversity should not be considered or addressed in isolation and that this should be integral in all we do across all service areas and needs groupings are set in the context of ensuring equality of access for all.
18
The actual data capture for this study looks at needs on two fronts:
♦♦♦♦ Type of need and changing patterns of need and intensity across three specific needs groups.
♦♦♦♦ Actual or predicted need in the short to medium term based on known forthcoming events e.g. Home closures and application of case study findings to prevalence data.
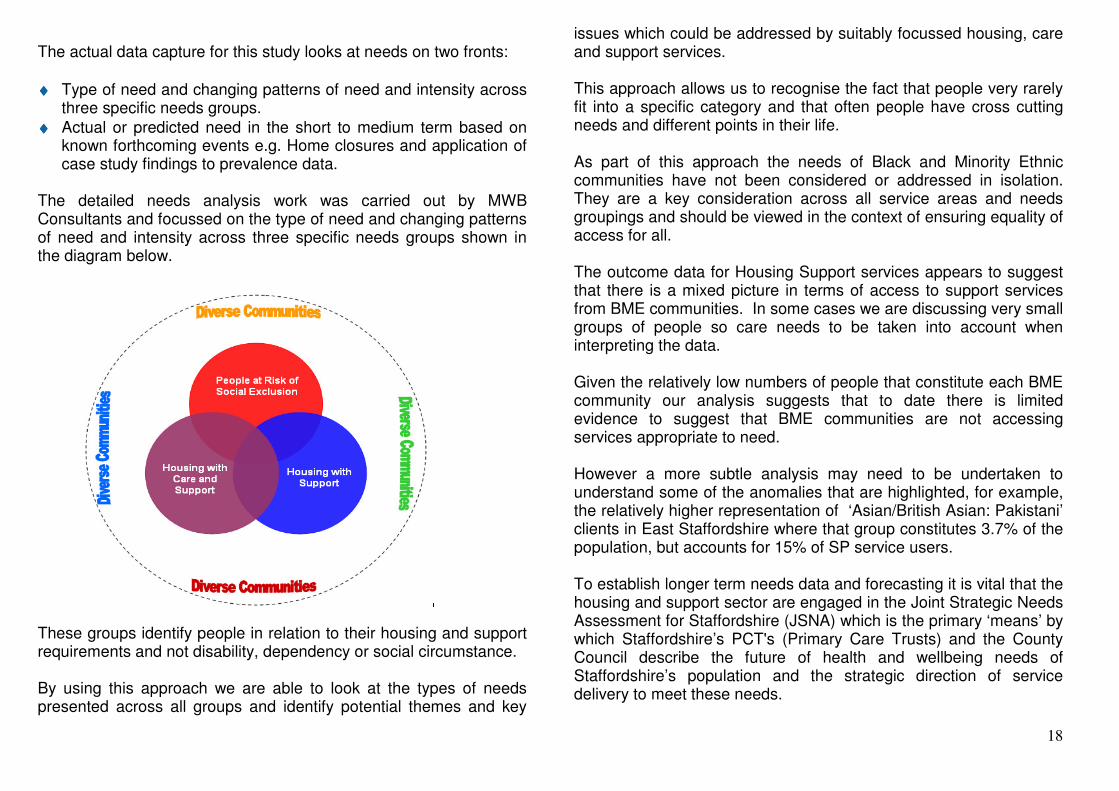
The detailed needs analysis work was carried out by MWB Consultants and focussed on the type of need and changing patterns of need and intensity across three specific needs groups shown in the diagram below.
These groups identify people in relation to their housing and support requirements and not disability, dependency or social circumstance. By using this approach we are able to look at the types of needs presented across all groups and identify potential themes and key
issues which could be addressed by suitably focussed housing, care and support services. This approach allows us to recognise the fact that people very rarely fit into a specific category and that often people have cross cutting needs and different points in their life. As part of this approach the needs of Black and Minority Ethnic communities have not been considered or addressed in isolation. They are a key consideration across all service areas and needs groupings and should be viewed in the context of ensuring equality of access for all. The outcome data for Housing Support services appears to suggest that there is a mixed picture in terms of access to support services from BME communities. In some cases we are discussing very small groups of people so care needs to be taken into account when interpreting the data. Given the relatively low numbers of people that constitute each BME community our analysis suggests that to date there is limited evidence to suggest that BME communities are not accessing services appropriate to need. However a more subtle analysis may need to be undertaken to understand some of the anomalies that are highlighted, for example, the relatively higher representation of ‘Asian/British Asian: Pakistani’ clients in East Staffordshire where that group constitutes 3.7% of the population, but accounts for 15% of SP service users. To establish longer term needs data and forecasting it is vital that the housing and support sector are engaged in the Joint Strategic Needs Assessment for Staffordshire (JSNA) which is the primary ‘means’ by which Staffordshire’s PCT's (Primary Care Trusts) and the County Council describe the future of health and wellbeing needs of Staffordshire’s population and the strategic direction of service delivery to meet these needs.

19
It is aimed at commissioners, providing analysis of data to show the health and wellbeing status of local communities, including where inequalities exist. Using local knowledge and evidence of effectiveness of current interventions helps identify gaps in service provision, and supports commissioning of services and interventions, which, in turn achieve better health and well being outcomes and reduce inequalities With the shift to join up housing, health and social care, it will be beneficial to engage the housing sector in future JSNA’s. Housing contributes significantly to the planning and delivery of services that impact on health and wellbeing as well as having established links with communities. Local housing departments and housing providers collect and analyse wellbeing of communities data so incorporating this information into JSNA’s would provide opportunity for a wider ranging influence on commissioning of joint housing, health and social services.
Type and changing patterns of need Whilst the quantification and prediction of needs has proved difficult to evidence there has been an abundance of information collated through case studies, stakeholder and service user feedback which has enabled us to get a clear picture of the types and changing patterns of need within each of the three groupings. This allows us to look at the types of needs presented across all groups and identify potential themes and key issues which could be addressed by suitably focussed housing, care and support services. Group 1: People in need of housing with support This grouping show a preference for receipt of care and support services in their home to either help them sustain that accommodation or reduce the need to move on to other specialist services. This group are deemed to be at the lower level end of support services where prevention and early intervention are of paramount importance to avoid or delay a move into either of the
other two needs groups. Housing and support for this group should be focussed on the following key areas:
♦♦♦♦ Daily living skills – to help sustain accommodation and increase independence over time
♦♦♦♦ Emotional and social needs – access the local community and reduce isolation/loneliness
♦♦♦♦ Access to suitable accommodation that promotes a sense of personal worth, value and social inclusion
♦♦♦♦ Practical day to day support to help people stay in their own home – e.g. Gardening, home maintenance
♦♦♦♦ Access to financial inclusion advice and products
♦♦♦♦ Support to access DFG’s, Handy persons service and assistive technology to help people remain in/ move to their own home
♦♦♦♦ Accommodation options that are flexible enough to cope with changing physical needs

20
Group 2: People in need of housing with Care and Support Within this grouping there is a clear need to improve the consistency of housing options advice and a need to develop a wider range of housing options. This is partly due to a shift in demand patterns as well as increased expectation about the quality and type of accommodation, with the shared house model no longer popular. The need for greater independence is also a key issue with increases in the number of people wanting to leave home at an earlier age. This grouping has also seen increased complexity of need such as an increased impact of substance misuse, increases in diagnosis of personality disorders as well as Aspergers or similar issues needing access to specialist services. The evidence shows that housing and support for this group should be focussed on the following key areas:
♦♦♦♦ Improved housing needs assessment and option plans
♦♦♦♦ Access to suitable accommodation that promotes a sense of personal worth, value and social inclusion
♦♦♦♦ Access to employment and training opportunities
♦♦♦♦ Support focussed on practical daily living skills and on emotional and social needs
♦♦♦♦ Promoting positive social networks
♦♦♦♦ Promoting resilience
♦♦♦♦ Pre tenancy support work
♦♦♦♦ Debt/money advice and access to financial inclusion advice and products
♦♦♦♦ Support to access DFG’s, Handy persons service and assistive technology to help people remain in/ move to their own home
♦♦♦♦ Accommodation options that are flexible enough to cope with changing physical needs
Group 3: People at risk of social exclusion Research suggests an increase in the complexity of needs within this group which include complex debt issues, mental health problems, substance and alcohol misuse that may be compounding situations and creating multiple layers of need. There is convincing evidence of increased demand for move on accommodation from supported accommodation and significant number of people moving through multiple providers and being serially excluded. Also within this group there are a significant number of people who will not approach the local authorities for help which may be unclear as to how they can access services. The evidence shows that housing and support for this group should be focussed on the following key areas:
♦♦♦♦ Accessing accommodation that promotes sense of personal worth & value and social inclusion
♦♦♦♦ Providing support focussed on regaining practical daily living skills and on emotional and social needs
♦♦♦♦ Promoting positive social networks
♦♦♦♦ Promoting resilience
♦♦♦♦ Promoting future safety
♦♦♦♦ Access to training and work
♦♦♦♦ Debt/money advice and access to financial inclusion advice and products
♦♦♦♦ Access to safe and sustainable move on accommodation
♦♦♦♦ Promoting effective parenting

21
Actual/Predicted level of Need (Quantifiable)
People in need of Housing with Support Older People with Support needs Based on the broadest of estimates taken from a range of national and regional studies the numbers of older people who might benefit from prevention focused housing support ranges from 10% to 15%1 of the population of people aged 65 and over. The older people become the higher the potential impact of support services in helping to maintain independence. Based on these conservative figures in the region of 14,000 and 20,000 older people across Staffordshire may benefit from some preventative service input.
People in need of Housing with Care and Support Older People with Mental Health Problems The data suggests that by 2010 upwards of 10,000 older people will be experiencing difficulties as a result of dementia and between 4,500 and 7,700 adults over the age of 65 will experience severe depression. These figures are set to rise consistently in the foreseeable future. Adult social care outturn data 08/09 suggests that 329 older people with dementia received home care packages (substantial and non substantial combined). The same data indicates that a further 169 older people with mental health issues received home care packages (substantial and non substantial combined). Frail Elderly The number of people aged 85 and over in Staffordshire is estimated to increase by 25,700 (139%) by 2030. In addition to this it is estimated that 119,551 people aged 65 and over in Staffordshire will suffer from a limiting long-term illness by 2030, an increase of
1 Using a mixture of sources including the Wanless report, health
prevalence data etc. These are probably an under estimate of potential need.
46,374, as well as 19,673 people aged 65 and over in Staffordshire will suffer from dementia by 2030, an increase of 9,710.
Our Flexi Care needs analysis estimates an indicative need for 9,541 Flexi Care units by 2030, with FCH at social rents accounting for between 23%-44% of the above. The remainder would be leasehold, due to the high level of owner occupation amongst this group. This roughly equates to an additional 435 units per annum from 2010 onwards.
People with Mental Health Problems The evidence from mental health professionals suggests that approximately a third of clients involved with secondary mental health services could achieve significant outcomes if they were able to access housing related support services. Our analysis of the numbers of people with mental health problems that may require accommodation, including those already housed, but where a move would improve their mental health, suggests that at least 20% of clients are likely to have some unmet housing need. The JSNA for mental health estimates that 1,060 people with mental health problems are likely to require support to live at home. Based on our assessment and the JSNA figures we would expect in the region of 1,000 people with mental health problems to require some form of housing related support.
People with Learning Disabilities Using the JSNA2 data as a starting point there are 2,429 people with a learning disability on the register. The same document suggests that 1,360 people are likely to require support to remain at home. Our initial analysis suggests that up to 80% of people with a learning difficulty will require housing options and the bulk of them will require some form of housing related support. This figure is higher than that suggested by the JSNA and maybe less reliable given the smaller sample worked from (100 cases). There are 114 people currently living in in-house residential care homes; initial assessments suggest approximately 78 of these people could live independently in
2 Draft JSNA mental health and learning disabilities 2009

22
supported living or Flexi Care environment, although this cannot be confirmed until individual Person Centred Plans (PCPs) and Housing Options Plans (HOP's) have been completed. In addition there are approximately 187 living outside of the County. Through the Local Choices programme we estimate 40% of these people will express a preference to return to the County. Physical disability & sensory impairment In 2008, there were 21,000 people with a moderate personal care disability and 4,600 people with a serious personal care disability. By 2015, in Staffordshire there will be 20,600 people with a moderate personal care disability and 4,600 people with a serious personal care disability, with numbers of people with personal care disabilities higher in older age groups. In 2008, 330 adults aged 18-64 are predicted to have a serious visual impairment in Staffordshire. These numbers will remain around 330 in 2015. As at 31 March 2007, there were 1,350 people registered as deaf in Staffordshire. This is similar to the numbers registered in March 2004. There were in addition 1,800 people registered as hard of hearing. In 2008 the number of people aged 18-64 with a physical or sensory disability who were helped to live at home, was 420, taken from Adult Social Care outturn data 2008/09. The evidence from the case files we reviewed (sample 50 for people with a physical disability) suggests that roughly half of them had a housing issue related to their current housing or lack of housing. Our estimate is that up to 20% of the cases we reviewed had some needs that would be suitably addressed by housing support services.
People at risk of social exclusion Single homeless with support needs Traditionally single homeless people, in particular men aged over 25, have not been treated as being in priority need and therefore have found it harder to access sustainable housing options. Lone men and
women make up 28% of acceptances under the homelessness legislation; they make up a more significant percentage of those approaching for help. 17% of all those approaching authorities are found to be homeless but not in priority need, and lone men and women make up a very high proportion of this group. Based on current data for the districts of the 350 households likely to be accepted as homeless in a year, roughly 100 will be single people with no children and more than half of the predicted 200 people regarded as homeless but not in priority need or intentionally homeless. Not all of the above will require housing related support but a significant number will; we would estimate at least 75% will require some input. There are a significant number of people who do not approach the local authorities for help that will also appear in some services. Homeless Families with Support On current data from the districts within the county as many as 350 households are likely to be accepted as homeless in a year and a further 200 households will be either regarded as homeless but not in priority need or intentionally homeless. Of the 350 households noted above, roughly 100 will be single people with no children and of those regarded as homeless, but not in priority need, more than half will be single people with no children. Not all of these will require housing related support but a significant number, at least 75%, will require some input. Acceptances for homelessness are on the decline in the region3, if at a somewhat slower rate now as a result of the current economic situation. There has been an increased, and successful, focus on prevention of homelessness and on reducing the numbers of people in temporary accommodation (TA). People with alcohol problems
3 The P1E data for the 3rd quarter of 2009 is yet to be released and there maybe a slight rise in acceptances.

23
Evidence from local providers that suggests a slightly lower figure with approximately 5% of people accessing their service having a housing related issue linked to alcohol misuse; with an estimated 19,000 people expected to have significant issues related to alcohol misuse by 2010 in the county. If we apply the 5% estimate of this group requiring some housing related support this translates to a county wide figure of 950 people with alcohol related issues that may require some form of housing related support. People with drug problems The figures suggest that there were at least4 224 people exiting treatment in 2008/09 with either no fixed abode or a housing related issue. This is not necessarily the same thing as requiring housing related support but there is likely to be a high level of cross over between housing issues and the need for housing related support. There are likely to be a further 937 people “not known to treatment” (based on Glasgow estimates of Problematic Drug users, using a 95% confidence interval); we assume that at least 15% of them have some housing issues which equates to a further 140 people. In total the likely minimum figure for the numbers requiring some form of housing related support rises to 360+. Offenders or People at Risk of Offending The data from probation assessment material suggests 43% of clients had some/significant problems with permanence of accommodation and 39% of clients had some/significant problems with suitability of accommodation - there will be overlap between the two groups. This equates to approximately 850 people. 27% of clients identified some link between accommodation issues and offending behaviour. This equates to approximately 560 people of which the bulk are likely to benefit from some form of housing related support.
4 The data is based on 80% + return of information.
Mentally Disordered Offenders Current figures suggest that there are 6 clients of probation who have a mental health treatment requirement in their order. Current levels of usage of the existing service, as tracked by primary and secondary client group definition, suggests that the current service is well utilised. We had no feedback on the changing needs for this group and the current level of investment appears to be adequate until further evidence is forthcoming. Young People at Risk/Young people Leaving Care The wide range of young people in this category, and the overlaps between groups, makes identifying specific numbers for those in need quite a challenge. The Youth Offending Service figures suggest that there are in the region of 200 young people at any one time where their accommodation and housing options have a link to their offending behaviour. The figures from Connexions suggests that at least a further 320 young people are experiencing a significant housing crisis that is likely to mean they require some short term housing related support. There are currently 733 looked after children in care placements across Staffordshire 73% of whom are aged between 13-18 years old. On the whole these placements are clustered around the main towns within the county of Newcastle, Cannock, Tamworth and Burton, which is also the case when looking at the originating home addresses of these looked after children. Feedback from professionals suggests that very few of these young people will continue in foster placements after the age of 21 and those in registered care homes also require alternative accommodation thus indicating a real pressure on accommodation resources from this service user group over the next 5 years. In addition to this, based on case study work, at least 10% of these young people are at risk of being excluded from services and therefore at risk of not being able to access other supported accommodation.
24
The needs analysis has identified some convincing evidence of increased demand for move on accommodation from supported accommodation and a small but significant number of young people moving through multiple providers and being serially excluded. Women at Risk of Domestic Violence There is reportedly an increase in the complexity of needs women are facing with complex debt issues becoming increasingly common. The national data suggests that 1 in 4 women will experience some form of domestic abuse and that the majority of those women will experience significant and recurrent abuse. It is harder to identify the numbers of women who might benefit from housing related support but a pragmatic approach would suggest that a significant number will need some form of intervention. People with HIV/Aids The prognosis for people with HIV has changed quite dramatically and the profile of people who now have the virus has changed to include newcomers to the UK from areas such as Somalia. It is too early to identify if the current needs are being met by the recent investment but evidence from the needs analysis suggests that similar factors are affecting those with HIV AIDS as other groups, so we can expect to see increased debt and financial issues playing a part in people’s support needs. Teenage parents The prevalence and other data suggest that in 2007/08 there were 681 recorded conceptions to under 18s. Nearly 50% of the conceptions ended in a termination which suggests that 340 young women went on to become potential teenage parents. Not all these young parents will require support with housing and housing related support. The contextual evidence does not suggest however that there is a significant unmet need at present. The needs analysis leads us to conclude that focused work on young people at risk needs to be strengthened and that this could include focused work on teenage parents, in particular work to increase the housing options and links to parenting support networks.
Rough Sleepers There is currently a relatively low level of investment in rough sleepers’ services across the county when considering the number of people identified as rough sleepers by the housing support client records which capture information in relation to people accessing services. In 2009/10, 104 rough sleepers accessed housing support services although the actual figure may be much higher as these records only measures those clients who were successful in accessing support and Staffordshire has little provision of first stage direct access supported housing to accommodate this group. In addition to this there are 111 clients identified as being in “unsettled” living situations immediately prior to accessing support which may also be prone to rough sleeping. Rough sleeper counts reported to CLG are considerably lower in number than those identified above suggesting that only Newcastle had 2 people in 2009 and East Staffordshire with 7 people in 2008 (no 2009 count). However there are some difficulties in carrying out rough sleeper counts in particular due to disincentives to identify too many rough sleepers in any given area and specific definitions used. Refugees The investment in refugee specific services is relatively recent and take up appears to be low at this point, further analysis will need to be carried out as the contract develops. Any future development should be based on evidence collected from the emerging service delivery. Gypsies and Travellers We received very few comments from stakeholders about the emerging or established needs of Gypsies and Travellers and the level of service investment is currently nil, although at least two clients who have identified themselves as Gypsies and Travellers have used other services. Studies carried out in 2007 in the north and south housing market areas identify the potential need for up to a further 55 ‘pitches’ in the north of the county (excluding Stoke on Trent) by 2012 and 86 in the south of the county by the same date.

25
Changing expectations – What people say they want and need The County’s Corporate Plan highlights that involving the community is at the heart of its approach and the aims and priorities within it have been developed through consulting with our communities. The Prevention and Independence team has always taken a pro active and innovative approach to involving service users across all activities and has undertaken a number of initiatives to gather service user feedback on needs and preferences to inform our commissioning priorities and future service design. A great deal of service user and stakeholder consultation has been carried to inform this strategy and is summarised below. ‘Share Your View’ Service User Consultation The “Share Your View” website was developed to give individuals the chance to have their say about housing, care and support services. To help reach as wide an audience as possible the web based questionnaire was promoted to service users. We had 115 responses to date (August 2010), which have provided valuable feedback about issues such as where people would like to live, their current care and support needs and what services they would like to receive in the future. The majority of the respondents at 51.3% were male, and nearly half of the respondents (47.8%) were in the age range of 26 – 49. 89.6% indicated that they were White British. There was good representation from people with learning disabilities taking part in the survey at 51.3%, with 27.8% of respondents indicating they had more than one disability. The majority of the respondents indicated that they were long term sick/disabled with only 8.7% suggesting that they were seeking work. The key findings from this exercise were:
♦♦♦♦ With regard to what facilities/services respondents needed, being close to the shops appeared to be the most popular choice.
♦♦♦♦ The most popular housing option for respondents was living with friends/family (41.7%).
♦♦♦♦ 67% of respondents did not want to change where they lived compared to 26.1% who suggested that they would like alternative accommodation.
♦♦♦♦ Friends/family was the option selected most by respondents (78) as their main support provider, although 73% opted for 2 or more services/providers.
♦♦♦♦ The majority of participants were content with who provided their care and support and did not express an interest in changing the service/provider.
♦♦♦♦ Assistance with shopping was the most popular choice for respondents selecting tasks for managing their home.
♦♦♦♦ 31.3% of respondents implied they wanted help with the security of their property.
♦♦♦♦ Help with claiming benefits was considered by 44.3% of respondents as being important to them when managing their money.
♦♦♦♦ At 47% the most popular option chosen by respondents for support to manage their health and well being was someone to accompany them to hospital appointments.
♦♦♦♦ The majority of respondents (32.2%) revealed that they needed help to understand and fill in paperwork, forms etc, to gain training and job opportunities.
♦♦♦♦ Gaining access to external services e.g. register with a dentist, was considered to be important for 31.3% of respondents.
♦♦♦♦ Having access to housing advice was viewed to be more essential than having legal advice or mediation services.
♦♦♦♦ The type of help and support people need for personal growth and self improvement highlighted that 33.9% of respondents need help coping with anxiety and stress.

26
♦♦♦♦ Out of 115 respondents 90.4% currently accessed care services.
♦♦♦♦ Results showed that having someone to prepare/cook meals was the most popular choice for respondents.
♦♦♦♦ 65.4% of respondents chose their spouse/family member/friend as the main provider of their care.
“Me, Myself & I” Board game The Joint Commissioning Unit has designed ‘Me, Myself & I’, an interactive toolkit for providers, support workers or carers to use with service users to help them identify what they need to live independently. The game looks at someone’s needs by focussing on six different areas of a person’s life – My Health, My Safety, My Home, My Life, My Money and My Choice. The resource is in the format of a fun board game and can be played either in a group session or with individuals, possibly as part of their support session or to help with care and support planning. This consultation method has appealed to a wide and varied audience through simplistic and easy to use design which can be easily adapted by producing the cards in different formats. To date 19 organisations have booked the game out and we have received feedback on the needs and aspirations of 74 service users with many more in the process of playing the game. Feedback from those playing the game has enabled us to put together “life maps” for our service users, helping us gain a clearer understanding of what people want and need to live independently as well as ensure our commissioning priorities and service design remain faithful to that feedback. The following gives a summary of the key messages around needs that this exercise has uncovered in relation to the 6 life areas.
Service users overall, and within each needs category, chose this card as their top priority with 50% of people choosing it. This shows that location and established social networks as well as the infrastructure of communities are a key consideration and should not be considered as an optional Flexi when designing housing and support services.
Whilst priority cards varied amongst the different needs groups, the top priority card overall was card A with 32% and this was also top priority for those in the social exclusion grouping. This result could be considered symptomatic of the current economic climate but along side the second priority card, which highlights peoples concerns regarding personal safety and the fear of crime, shows an underlying need for services offering reassurance, support, practical help and good quality advice.
Card B was most popular (31%) but interestingly a clear split has been identified between those requiring traditional care and support services whose priority is around access to welfare benefits, and socially excluded groups whose priority is centred around money management. This supports the findings of MWB needs research around emerging needs and again indicates a need for advice and signposting.

27
This information supports the findings of the MWB needs work and the ideology that commissioning should be around a common set of
needs and outcomes, not single issue or user group based services. The direction of travel this strategy takes is supported by this service user feedback as it is of paramount importance that as commissioners we listen to the experts – our customers. Stakeholder Feedback At a stakeholder event in March 2010 a wide range of organisations came together to discuss the proposed strategic objectives. As well as using the feedback to refine the wording and focus of the objectives we also identified common themes and good practice which, once cross referenced with the needs analysis and service user consultation findings, identified a number of key themes for inclusion in the strategy and are identified below:
♦♦♦♦ Encourage prevention focussed support models.
♦♦♦♦ Re-brand/better communication and expansion of existing services which carry out preventative work.
♦♦♦♦ Create a diverse marketplace which is inclusive of 3rd sector and smaller organisations.
♦♦♦♦ Take a more personalised approach, ensuring information and advice is easily accessible to enable people to make informed choices.
♦♦♦♦ Promoting the benefits of partnership working and ensure positive impacts made are visible and well promoted.
♦♦♦♦ Simplify/modernise our processes; treat the customer as the expert to inform this change.
♦♦♦♦ Be realistic – funding is reducing don’t raise false expectation.
Not surprisingly responses to this life area were more mixed. Overall the priority card was D with 40% The general feel however in relation to this area was that people want to feel supported within their communities and have access to local facilities and yet again knowing how to access them, as well as more specific advice on issues such as employment.
Overall the top card picked was simply stating that people want to be asked, what they want and not be told what they need. This was a particular issue for those who access more traditional residential and day services. Another key theme was for people to have the right to take their own risks and make choices and thus enable people to take control of their lives.
The importance of access to health services and support for people to utilise them was clear in the priority cards chosen with card B selected as top priority by 38% of players. Access to health services is also key to socially excluded groups whose top priority was around healthy lifestyles which, if tackled early on, can have major preventative benefits and reduce need for costly health interventions further down the line.

28
Challenges faced by identified need - Understanding the gaps It has become apparent during the needs analysis process and service user consultation that it would be difficult to be specific and give absolute numbers or even a range in relation to housing support service needs due to the diversity of the groups involved. In addition, inconsistency of data collection across the County gives rise to the double counting and over projection of needs. In the current economic climate we have to be realistic about the level of investment that will be available to invest in new services and therefore to set unachievable targets would be misleading. What we can be clear about however, are the types of needs presenting across these groups and how these can be met through a redirection of existing services or commissioning of new models of housing and support which address these needs. Overall the key messages from this textural data are that clients are now more likely than previously to demonstrate:
♦♦♦♦ Increased5 complexity of need across most client groups e.g. more often they appear to have multiple types of need and dependency.
♦♦♦♦ Increased occurrence of substance misuse across client groups’ e.g. mental health, older people (this maybe increased impact of the same volume of substance misuse – alcohol and drugs).
♦♦♦♦ Increased intensity of support needs in some groups.
5 Increased; so what does that mean in this context? We have been unable to establish that there are x more clients with y level of greater need but the weight of evidence from case studies and from providers suggests that they are now working with clients with higher levels of need and complexity. Our assessment is that this is not the whole client group but a significant number of them.
♦♦♦♦ Increased occurrence of debt issues, often multiple debt and at more serious levels.
♦♦♦♦ Increased pressure on move on accommodation and first time affordable accommodation.
♦♦♦♦ Changing aspirations for clients in terms of quality and type of accommodation.
♦♦♦♦ Increased need for emotional and practical support to enable them to take part in their local communities.
♦♦♦♦ Preference for receipt of care and support services in their home, especially amongst older people.
The new focus on positive outcomes and the changing economic and social environment has also highlighted that there are now new areas of need or work not previously highlighted such as:
♦♦♦♦ Access to training and employment options.
♦♦♦♦ Money advice and debt management.
♦♦♦♦ Work with private sector landlords.
♦♦♦♦ Parenting support and child protection issues.
♦♦♦♦ Housing assessment and options planning for groups previously accommodated in residential care settings.

29
Understanding the Needs and Priorities of our Key Partners Delivering housing support and independence services is not something done in isolation. Joint working arrangements and effective partnerships with neighbouring district/borough councils, housing associations, private developers, PCT's and the Third Sector are essential when commissioning and delivering services. The County Council recognise that in order to achieve better health and well being outcomes, reduce inequalities and promote stronger links to the community, there is a need to improve partnership working. Housing Examining each of the borough and district councils’ housing priorities there are a number of common themes including the need to:
♦♦♦♦ Develop housing pathways for young people.
♦♦♦♦ Minimise the use of temporary accommodation for homelessness people and improve existing move-on arrangements.
♦♦♦♦ Increase the numbers of suitable types of affordable new housing.
♦♦♦♦ Establish a homeless prevention culture.
♦♦♦♦ Introduce initiatives to allow people to remain living in their own home.
♦♦♦♦ Provide desirable alternatives/specialist accommodation in order to meet the current and future needs of older people.
♦♦♦♦ Improve housing standards across all tenures.
♦♦♦♦ Identify and examine the needs of gypsies and travellers to gain a better understanding.
To help achieve these priorities we will:
♦♦♦♦ Work towards achieving the strategic housing objectives of Staffordshire’s Local Area Agreement.
♦♦♦♦ Continue to review land holdings to assess the potential for releasing land for new and affordable housing.
♦♦♦♦ Develop services which meet the prevention and early intervention agenda.
Health Both PCT's in the North and South of the County support investment into prevention and well being in particular to help reduce hospital admissions and progression to nursing care placements. The need to improve mental health and well being at individual and community level is of high importance for the PCT’s. Research has indicated that many benefits can be gained from health and social care having joint approaches to delivering services for people with mental health needs. Developing new initiatives which deliver rapid and flexible response services, especially for people with dementia, will be needed to capitalise on the benefits. Another priority PCT’s are working towards is the need to support people to have more choice and control over services to help them remain independent regardless of circumstances. Housing support and independence services contribute significantly in helping people stay independent so improved joint working with health partners should gain further achievements, for example, providing nursing care services at Flexi Care schemes should allow people to plan their future to ensure they have a home for life. The County’s Joint Commissioning Unit and the two PCT’s have developed together four strategies which set out the commissioning intentions for the people of Staffordshire and there are common themes which run through each one, namely:
♦♦♦♦ Early intervention and prevention
♦♦♦♦ Personalisation
♦♦♦♦ Move towards more community based services

30
Third Sector There are currently 3400 Third Sector organisations listed on the on-line Communities Together Group Directory all of which provide a diverse range of services, including advice, education, training, health and social care and leisure, sport and healthy living. The Prevention and Independence team recognise the “added value” that the Third Sector can bring to public service provision and the big part they play in the housing support and independence agenda. With the big shift towards services based upon what an individual wants the Third Sector are aware of the need to understand new commissioning arrangements for personalisation and self directed support. In order to ensure that third sector providers have capacity to deliver services in the changing environment the Prevention and Independence Team will work with partners to support the Third Sector. Providing and facilitating training and assisting in promoting services to ensure maximum take up, are examples of a couple of ways Third Sector providers will be supported. The development of a Third Sector Strategy will include a systematic review of service provision, identifying what services need to be developed and ‘purchased’ through procurement and where services need to be funded to meet less complex needs and prevention. The needs analysis and supply section of this strategy identify several areas where there are gaps in service provision. With the voluntary and community sector having specialist knowledge and experience and well established links with the wider community they are well placed to supply additional services needed.

31
3. Where do we want to be? – Meeting Identified Needs
Aim:To ensure people
have access to a range of services and options
that maximise their independence and
choice of tenure
Aim: To make best use of resources to ensure accommodation and support services offer quality outcomes and
value for money
Aim: To meet the challenges and strategic direction brought about through
local and national policy
Aim: To modernise
commissioning process to ensure activity is reflective of what
people say they need and want
Our Vision
To enable every citizen in Staffordshire to live as
independently as possible.

32
Strategic Objectives
1. Focus on prevention and early intervention
What does this objective mean?
Preventative work can take many forms but in the context of this strategy is focussed on support and interventions to stop or slow down the deterioration of a person’s health, wellbeing or social circumstances and reduce the need for high level and intensive interventions at a point of crisis. To target preventative work effectively it is important to gain an understanding of the triggers which deem a person vulnerable, such as bereavement, homelessness, debt, unemployment, domestic abuse, periods of ill health and institutionalisation and plan preventative services accordingly.
Following needs research and stakeholder and service user consultation it is widely agreed that the key to understanding and implementing this objective is to:
A. Understand what are we preventing
♦♦♦♦ Loss of settled accommodation
♦♦♦♦ Distress/disruption for service users
♦♦♦♦ Breakdown of informal care arrangements leading to crisis interventions
♦♦♦♦ Preventing unnecessary/unplanned admissions to hospital, residential care, hostel accommodation
♦♦♦♦ Deterioration of health and social circumstances
B. What form prevention takes?
♦♦♦♦ Life skills training – giving people the “tools” for independence
♦♦♦♦ Pre tenancy support and resettlement support to smooth the transition from one type of accommodation to another
♦♦♦♦ Information and education to understand cause and effect so barriers to independence can be understood and overcome
♦♦♦♦ Access to education, training and employment to reduce future dependency
♦♦♦♦ Promoting effective parenting to increase life chances of future generations
♦♦♦♦ Access money advice and financial inclusion products e.g. credit union loans and savings schemes
♦♦♦♦ Wellbeing models which increase community participation and improved health
♦♦♦♦ Enablement based service to reduce dependence and increase likelihood of move on to independent living or to stay in own home
C. Understand and publicise the impact of prevention work
♦♦♦♦ Improved quality of life and empowerment for individuals
♦♦♦♦ Reduced numbers relying on crisis services
♦♦♦♦ Signpost people quicker; reduce waiting time
♦♦♦♦ Savings to wider public purse – spend to save

33
How can it be achieved?
i. Encourage prevention focussed support models which ensure:
♦♦♦♦ Access to advice/support services at a low level to prevent crises occurring
♦♦♦♦ Stable, settled living in quality accommodation
♦♦♦♦ Day to day help to stop things getting “too much” e.g. older person moving to residential due to problems with home/garden maintenance
♦♦♦♦ Focus on cause e.g. clients facing eviction/repossession proceedings get support to overcome the cause through debt advice, financial management information etc
♦♦♦♦ Long term prevention e.g. Children’s works in refuges, preventative domestic abuse packages for teenagers in schools
♦♦♦♦ Support is available to people whilst still in institutional settings prior to release or move on to build resilience and ease the transition
ii. Re-brand/ better communication/expansion of existing services which carry out preventative work
♦♦♦♦ Better more widespread use of telecare/ telehealth/ assistive technology
♦♦♦♦ Wider availability and information in relation to agencies that provide practical support such as: Furniture Mine, Credit Union
♦♦♦♦ Link in with existing wellbeing services such as befriending schemes and HIA's which support wellbeing of older people by early identification of problems, maintain people in own homes longer
♦♦♦♦ Resettlement and pre tenancy support services to ensure tenancies do not fail
♦♦♦♦ Signposting other services
♦♦♦♦ Use of resources more widely and creatively – e.g. use of handyperson service to help people move on
iii. Good partnership working needed
♦♦♦♦ Clear communication networks are needed to succeed
♦♦♦♦ Joined up services - reduce duplication/avoid cross-funding
♦♦♦♦ Single points of access through the “Staffordshire Cares” information infrastructure
♦♦♦♦ Joint commissioning and joined up approach to service delivery
♦♦♦♦ More involvement by service users Strategic fit This objective offered the best match (74%) to the aims/objectives of stakeholders following our consultation with no one claiming that it did not match at all. The majority of the stakeholder feedback linked prevention to early intervention with independent living a presumed outcome if achieved. The following services are just two of many good practice examples cited which highlight the effect of preventative work:
♦♦♦♦ County handyperson service – one point of contact is good. Helps older people maintain independence by carrying out small repairs, odd jobs around the home. Clients pay for it so does not feel it is charity. Falls pilot is also part of county handyperson service.
♦♦♦♦ Contact and connect – ensures that older people and others are assisted to be put in touch with community activities and services.

34
2. Modernise the commissioning process and models of support What does this objective mean?
This objective is about making changes in two important areas:
1. Changing the way services are commissioned
♦♦♦♦ To ensure a person-centred approach and easy fit in with the person centred planning process
♦♦♦♦ Involve service users in the commissioning process - ask people what they want
♦♦♦♦ Must ensure that outcomes are specific to those who use services and local communities and capture these in contracts
♦♦♦♦ Change in culture of procurement - move away from large block contracts
2. Challenging traditional service models
♦♦♦♦ Appraisal/feasibility of current models – floating support/accommodation based services - do these offer best service at best price
♦♦♦♦ Freedom and flexibility offered to encourage innovation as long as positive outcomes and strategic fit can be demonstrated
♦♦♦♦ Consider ability and willingness to pay for some services
♦♦♦♦ Look at ways of providing care and support through one provider to reduce duplication and multiple visits as service users often don’t understand where one service ends and another starts
♦♦♦♦ Challenge blockages in system which limit access to and move on from supported living services. How can it be achieved?
i. Work towards Outcomes based contracting
This action requires considerable work before it can be introduced to ensure it makes a real impact on the outcomes achieved by service users. This can be achieved by:
♦♦♦♦ Ensuring outcomes match services and reflect each individual’s starting point as well as locality needs
♦♦♦♦ Following up on outcomes since a person left the service e.g. do they still live independently, are they in work etc.
♦♦♦♦ Create a flexible outcomes tool kit - mixed approach of input and outcomes needed
♦♦♦♦ Run as a pilot and pull together a steering group to test out how to decide on measures and how they can be measured
♦♦♦♦ Ensure outcomes expected to be achieved are explicit in service specifications
♦♦♦♦ Balance needed to measure outcomes with increased bureaucracy i.e. don’ t want less support hours because more time spent on administration

35
ii. Create a diverse marketplace which is inclusive of 3rd sector and smaller organisations
♦♦♦♦ Consider use of Consortia bidding and creating umbrella services to pool expertise and funding to create efficiencies
♦♦♦♦ Hub services rather than direct commissioning
♦♦♦♦ Encourage innovation to find new ways of meeting needs
♦♦♦♦ Take a Community commissioning approach through the “total place” initiative
♦♦♦♦ Greater service user involvement in commissioning of services – provide what people say they want and need
iii. New and responsive models of Housing, care & support
♦♦♦♦ Inclusion of low level support in personalised budget
♦♦♦♦ Support should be about enablement and choice
♦♦♦♦ Person focused support plans that are portable and owned by service users so they can share with other supporting agencies
♦♦♦♦ Change culture from doing for people to doing with
♦♦♦♦ Explore integrating services which provide similar or mutual benefits to create seamless access and reduced waiting times
♦♦♦♦ Increased use of Assistive Technology/ telehealth
Strategic fit The focus of this objective has changed considerably as a result of consultation feedback as people were unclear what was meant by some of the terminology used and didn’t easily reconcile it with their own agenda’s and needs. Therefore, for clarity, this objective allows us to outline our response to national policy in two ways by:
♦♦♦♦ Creating services that are fair, simple and affordable for everyone
♦♦♦♦ Ensuring that there are a range of services for people to choose from and opportunities for social inclusion
3. Increase choice and control
What does this objective mean?
It is widely recognised that local authorities need to make a shift away from the traditional paternalistic approach to service delivery by transferring choice and control to the individual. However sustained effort needs to be made to ensure we have a market place within which choice can be exercised and the information and support networks available to enable people to exercise choice and control.
Key themes in relation to increasing choice in control were as follows:
♦♦♦♦ Recognise who is best placed to give specialist advice and how it can be accessed
♦♦♦♦ Having a wider variety of resources and options to choose from
♦♦♦♦ Increasing awareness of existing services – can be difficult for organisation to be clear about what is out there, so likely to be problematic for a service user.

36
How can it be achieved?
Personalised approach
♦♦♦♦ Choice and control through personalisation - open up more creative ideas
♦♦♦♦ Advocacy is key to making sure people are heard
♦♦♦♦ Understand risks but don’t use them as a barrier to choice
♦♦♦♦ Move away from one size fits all services
♦♦♦♦ Ensuring housing options are integral to individual assessments – fit place to people rather than people to places
♦♦♦♦ Promote self advocacy, personal responsibility and resilience
Increased Housing and Support Options
♦♦♦♦ Increase availability of Move On accommodation to release supply in specialist supported accommodation
♦♦♦♦ Increase supply through targeted work with District Councils and the private sector e.g. leasing, and empty property schemes, section 106 planning gains specifically to accommodation for people with disabilities
♦♦♦♦ Building relationships with housing partners to identify housing stock and options
Information and Communication – making informed choices
♦♦♦♦ Involve clients in a meaningful way
♦♦♦♦ Ensure information is clear and easily accessible
♦♦♦♦ Be realistic about choices available
♦♦♦♦ Information available about services/providers, e.g. services directory
♦♦♦♦ Making ‘informed choices’ - does the client understand the implications of their ‘choice’ and identifying risk
♦♦♦♦ Need to ensure people are given skills to make and understand choices and limitations/realities of choices Strategic fit This objective is in line with the principles of the modernisation agenda and the County’s “Living My Life My Way” policy direction. In general consultation feedback supported this as a concept and identified it as being key to continued success of services but that this needed to be pursued in a context of realism both in relation to the availability and suitability of the choices identified.
The key to this objective is undoubtedly less about establishing support for the concept and more about stimulating the market to provide the options and ensure good quality information, advice and support are easily accessible to enable choice and control to be exercised.

37
4. Active and effective partnerships
What does this objective mean?
To create holistic models of housing and support, which meet the personalisation agenda, active and effective partnerships must be established to ensure best use of resources to benefit the end user. There are different types of partnerships which need different approaches, ranging from Strategic Partnerships which identify what is required in the community and they can deliver it (place shaping) to Service Level Partnerships which can realise economies of scale and smarter way of working.
What makes partnership work?
♦♦♦♦ Needs to be fair and not disadvantage anyone
♦♦♦♦ All key partners are around the table but identify someone to lead and own agenda
♦♦♦♦ Open information sharing
♦♦♦♦ Pooled partnerships budgets and sharing risk
♦♦♦♦ No silo working
♦♦♦♦ Realistic, common standards
♦♦♦♦ Energy and commitment required. Need to give time to it
♦♦♦♦ Make sure not partnership in name only
How do we know if partnerships are effective?
♦♦♦♦ Working in partnership can only further enhance the good package of support for service users
♦♦♦♦ Seamless working across boundaries
♦♦♦♦ Same level of service and eliminate postcode lottery
♦♦♦♦ Providers working in partnership to deliver what customer wants – making it work
How can it be achieved?
Need to create strong partnerships by:
♦♦♦♦ Strong governance arrangements
♦♦♦♦ Realistic tendering deadlines for consortia bids - takes time to build trust/break down barriers between parties
♦♦♦♦ Timing of organisational strategies which need to be linked to ensure strategic fit
♦♦♦♦ Being aware of each organisation’s constraints, e.g. governance arrangements and work these through
♦♦♦♦ Need to think about process for partnerships and time it takes to cultivate
♦♦♦♦ Higher level of ownership of objectives e.g. Chief Executive level
♦♦♦♦ Joint training/master classes on key areas e.g. the development of Flexi Care

38
Promoting the benefits of partnership working
♦♦♦♦ Need to promote benefits of housing support to partners, e.g. outcomes data/case studies/benefits realisation (£’s)
♦♦♦♦ Need to measure impact/success of partnership activity.
♦♦♦♦ Better communication about activity and effective partnerships
♦♦♦♦ Need to link Staffordshire partnerships with local district partnerships – model of how we come together as partnerships
Visible achievements as a result of Partnership working
♦♦♦♦ Consortia bids and umbrella services established
♦♦♦♦ Single point of access, referral arrangements, common assessment. Hub services via Staffordshire Cares
♦♦♦♦ Common standards and training needs re certain specialist issues
♦♦♦♦ Economies/efficiency savings through joint working/reducing duplication of services
♦♦♦♦ Joint working protocols/service level agreements e.g. to share information, meeting housing needs
♦♦♦♦ Co-location/multi disciplinary teams which provide holistic services to meet needs plus reduces overheads
♦♦♦♦ Pooled budgets/Joint commissioned services
♦♦♦♦ Peer support/mentoring for organisations who need help in accessing funding, writing bids etc
♦♦♦♦ Increased investment/development through active involvement in Local Investment Plans (LIP's) and Local Enterprise Partnerships (LEP's)
Strategic fit
In the current economic climate the need for partnership working is even more pressing as the pooling of resources and information will become necessary as budgets are shrinking. There are already several good examples of partnership working across the County, as follows, which should be used as positive examples of the benefits of partnership working:
♦♦♦♦ LSP Housing theme groups in Lichfield, South Staffs and Tamworth bring partners together through shared action plans
♦♦♦♦ HIA alliance was successful in their Consortia bid to provide Handyperson services across Staffordshire.

39
5. Improve customer experience
What does this objective mean?
For a service user their first contact with support services needs to be a positive one to ensure continued engagement and increase their chances of greater independence through appropriate and targeted services. To ensure this is achieved this objective aims to highlight key areas relating to improved customer experience and how these can be addressed in the housing and support sector as follows:
Good customer service
♦♦♦♦ Always trying to ensure that the customer is put first and the experience is first to none
♦♦♦♦ Understand who our customer is - listen to what people have to say
♦♦♦♦ Customers must be involved in decisions about the services they have/need
♦♦♦♦ Reduce bureaucracy and delay
♦♦♦♦ Don’t force the pace of change – people need time to make important decisions
♦♦♦♦ Services which are structured around the individual and their needs
Information and advice
♦♦♦♦ Easy access/point of entry and single access route
♦♦♦♦ Information about what services/facilities they could have
♦♦♦♦ Improved housing needs assessments and housing plans for individuals
Break down barriers
♦♦♦♦ Understanding people’s expectations – can be both too high and too low based on their experiences
♦♦♦♦ Listen to what people say they want but bring realism/expertise - you can’t have everything
♦♦♦♦ Remove stigma from asking for help
♦♦♦♦ Accessibility of services
How can it be achieved?
Treat the customer as the expert
♦♦♦♦ Seeing the customer as the expert in their own experiences/circumstances - what do customers feel would have met their needs?
♦♦♦♦ Capture customer experiences through meaningful and effective client engagement
♦♦♦♦ Service users share experience of services - peer support/mentoring schemes
♦♦♦♦ Introduction of self-assessment where appropriate
♦♦♦♦ Use the feedback we receive to influence commissioning decisions and service design
Be realistic – don’t raise false expectation
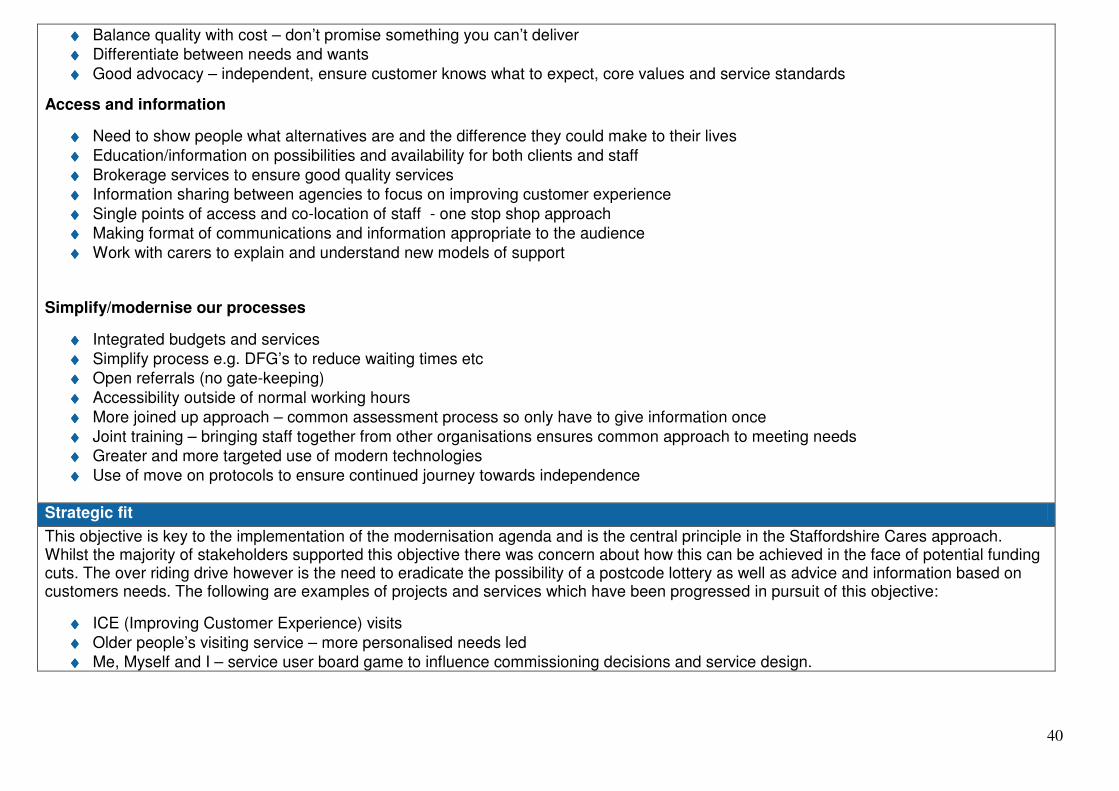
40
♦♦♦♦ Balance quality with cost – don’t promise something you can’t deliver
♦♦♦♦ Differentiate between needs and wants
♦♦♦♦ Good advocacy – independent, ensure customer knows what to expect, core values and service standards
Access and information
♦♦♦♦ Need to show people what alternatives are and the difference they could make to their lives
♦♦♦♦ Education/information on possibilities and availability for both clients and staff
♦♦♦♦ Brokerage services to ensure good quality services
♦♦♦♦ Information sharing between agencies to focus on improving customer experience
♦♦♦♦ Single points of access and co-location of staff - one stop shop approach
♦♦♦♦ Making format of communications and information appropriate to the audience
♦♦♦♦ Work with carers to explain and understand new models of support
Simplify/modernise our processes
♦♦♦♦ Integrated budgets and services
♦♦♦♦ Simplify process e.g. DFG’s to reduce waiting times etc
♦♦♦♦ Open referrals (no gate-keeping)
♦♦♦♦ Accessibility outside of normal working hours
♦♦♦♦ More joined up approach – common assessment process so only have to give information once
♦♦♦♦ Joint training – bringing staff together from other organisations ensures common approach to meeting needs
♦♦♦♦ Greater and more targeted use of modern technologies
♦♦♦♦ Use of move on protocols to ensure continued journey towards independence Strategic fit
This objective is key to the implementation of the modernisation agenda and is the central principle in the Staffordshire Cares approach. Whilst the majority of stakeholders supported this objective there was concern about how this can be achieved in the face of potential funding cuts. The over riding drive however is the need to eradicate the possibility of a postcode lottery as well as advice and information based on customers needs. The following are examples of projects and services which have been progressed in pursuit of this objective:
♦♦♦♦ ICE (Improving Customer Experience) visits
♦♦♦♦ Older people’s visiting service – more personalised needs led
♦♦♦♦ Me, Myself and I – service user board game to influence commissioning decisions and service design.

41
Financial Planning and Investment
Revenue Funding Cost benefit analysis of Housing Support service The Communities and Local Government (CLG) commissioned the research into the impact of the SP programme on other public services. Cap Gemini developed a tool that is designed to calculate an estimate of the financial benefits of SP funded services. It does this by considering two alternative scenarios: a baseline scenario where clients of the group are supported with packages that involve SP funding, and a counterfactual scenario, where clients are supported with packages that do not involve SP funding. This allows the net benefit/cost of providing provision to be calculated taking into account a range of other factors including, health, housing, crime, social care etc.
Applying this methodology in Staffordshire has suggested that the local Supporting People programme results in a net benefit of £48.9 million to the wider public purse. Breaking this down for the three groups (see chart below) has resulted in £21.9 million net financial benefits linked to the ‘people at risk of social exclusion’ client groups, £20.6 million to the ‘housing with care and support’ client groups and £6.4 million to the ‘housing with support’ client groups. It must be noted that the financial benefits illustrated are under-estimated due to the tool not modelling all client groups’ e.g. rough sleepers, refugees, people with HIV/AIDs, Gypsies and Travellers, Community Alarms and Home Improvement Agencies (HIA’s). In relation to Staffordshire this means for every £1 Staffordshire spends results in a saving to the wider public purse of £4.29.
Future Investment in Housing Support In the current economic climate funding for new services will not be readily available. The scheduling of growth will need to take account of when funding is likely to become available in future years, but it is considered unlikely that funding for reinvestment will become available before 2012/13 onwards, and thus the major re-commissioning of new services will not be feasible until this time. The following graph indicates the projected impact on future financial resources when applying three different scenarios of percentage efficiency savings. In all of the scenarios there is a substantial deficit in available funding predicted in 2012/13 and future years, unless the spending programme is brought into balance with the resources available. This is based upon current contract exposure and does not take account of any reductions in public spending anticipated. It is therefore critical that future contract commitments match available resources. This we see being achieved through attracting additional income, making efficiency gains through future procurement and

42
contract negotiation and the consideration of decommissioning services which do not meet the strategic priorities determined in the revised Strategy.
Financial Position where various cuts in grant are modelled if current spend levels maintained
Cash Freeze
Spend
3% Grant Cut
5% Grant Cut
10% Grant Cut0
2,000
4,000
6,000
8,000
10,000
12,000
14,000
16,000
18,000
2008/09 2009/10 2010/11 2011/12 2012/13 2013/14 2014/15
Year
£0
00
's
Cash Freeze
Spend
3% GrantCut5% Grant
Therefore, efforts will be focussed on making efficiency savings to reduce this deficit and money for new services will only be forthcoming once we have been able to balance the budget. The decision making process around investment in new services will also see significant changes by moving towards a business case model based on proof of need and proven contribution to our strategic aims and objectives, as well as proof of quality and value for money. To support the decision making process we will be looking to invest in services which offer the biggest impact in relation to the level of investment made based on the cost benefit realisation model
devised by Cap Gemini, which highlights the benefits of the programme to other organisations. Some work has already been undertaken in Staffordshire to identify the benefits of investment in two specific service areas which increase independence as outlined below. Cost benefit analysis of Flexi Care In July 2009, as part of our ongoing commitment to developing Flexi Care services in Staffordshire a study was carried out to identify the extent of the savings that can be made by utilising Flexi Care provision as opposed to the more traditional models of care. This study looked at the gross costs in relation to 22 service users living in Flexi Care schemes, comparing:
♦♦♦♦ Costs before they moved into the scheme - original gross costs as identified on CISS for the service user group (respite, day care, home care, luncheon clubs, other additional care services).
♦♦♦♦ Cost after the move to the scheme (Flexi Care package) - revised gross costs as identified on CISS for the same service user group.
♦♦♦♦ The packages they might have received if they had not moved into Flexi Care - notional costs provided by Social Work teams based on estimated additional costs if service users were not relocated into Flexi Care services and ‘remained’ in the community.
Whilst it was identified that net savings will be minimal, the potential financial benefits to be gained by local authorities in relation to “cost avoidance” are significant both in financial terms, but also in terms of positive outcomes for the service users. The total gross cost avoidance figure (difference between the new care costs and the ‘notional’ or alternative cost of supporting the service user to remain in their current care arrangements) for the 22

43
service users in the study was £117,570.00 per annum, which equates to a gross cost avoidance figure of £5,418 per service user per annum. This confirmation of the financial benefits of this model along with the known social and wellbeing benefits for individuals reinforces this as the future care model of choice to ensure Staffordshire is well placed to meet the challenges the demographic profile of an ageing Society presents. Cost benefit analysis of DFG’s When comparing DFG budgets by District to average waiting times, there appears to be no direct correlation between the two suggesting blockages in the system may be more process than budget led as is often assumed. In June 2009 a project began in the Newcastle under Lyme district of Social Care and Health in partnership with Newcastle Borough Council and the Revival Home Improvement Agency to try and understand and resolve the failings of the current system for providing major adaptations to people with disabilities through the DFG process.
The project team built a detailed understanding of the customers’ experience of the process; they looked at end to end times from initial referral to completion; the number of contacts with customers, including when they had to chase for an update; the number of times things went wrong with the building work; and the waste that exists within the current system that causes the lengthy time frames. As a result of this project significant savings were made in relation to pilot cases and in relation to the time that the new process is saving as detailed in the following table.
Cost of Providing a Level Access Showers
Old System
New System
Saving on old system (above)
Average cost of Level Access Shower (LAS)
works £5,490 £5,250 £240
SC&H Staff Resource £206 £86* £120**
NBC Staff Resource £155 £128 £27
HIA Staff Resource £233 £96 £137
Total administrative cost to all agencies
involved
£594 (10% of works)
£310* (6% of works)
£284**
* Likely to be reduced further ** Likely to increase further
The pilot has now become the normal way of working in Newcastle with all OT’s and Technical Officers being involved in the new process. Much of the learning from Newcastle Under Lyme can be transferred to the other seven districts and it is suggested that work continues to ensure that DFG’s are significantly improved across the whole of Staffordshire. Recently meetings have taken place in some of the districts to discuss how learning can be transferred without losing sight of the differences that exist in the partnership arrangements and the demographics. Recognising that more work needs to be done to improve the DFG process the Prevention and Independence Team are working with districts to remove some of the barriers preventing people getting their adaptations carried out sooner.
Capital Investment To support its commitment to increasing independent living options in Staffordshire the County Council has already invested heavily, through its capital programme in Flexi Care, and has significant capital spend planned in relation to supported living schemes across Staffordshire.

44
However, this commitment is set to continue with an additional £3.403m capital funding earmarked by Staffordshire County Council via capital, land or Assets over the next 2-3 years which will lever in an additional £40.597m investment from a range of organisations, creating a further 330 units. The County Councils capital programme for supported living, to re-provide for people with a learning disability currently living in residential care but who have expressed a desire to move on to more independent living, has been calculated and profiled to ensure identified needs can be met. This programme currently stands at £4.185 million capital investment over a 4 year period and will be allocated as subsidy per service user re-provided with an expectation that the majority funding will be secured by the chosen development partners from our framework. All decisions in relation to County Council investment have or will require agreement via the property panel and strategic property board, with more recent development decisions underpinned by District Strategic Property Reviews that have collected and aggregated Social Care and Health district aspirations for property development based on current and projected service needs. The reviews follow a standard format and ensure a consistent approach to development planning. One of the most important elements of the review process was the locality Value Management Workshop stage, where existing and potential partners were invited to consider the draft report and identify collaborative, mutually beneficial development opportunities. The capital programme, whilst helping to stimulate the market, will not be enough to meet the identified housing needs and therefore we must look increasingly to the private sector and our RSL partners to bridge the gap through new and innovative ways of working.
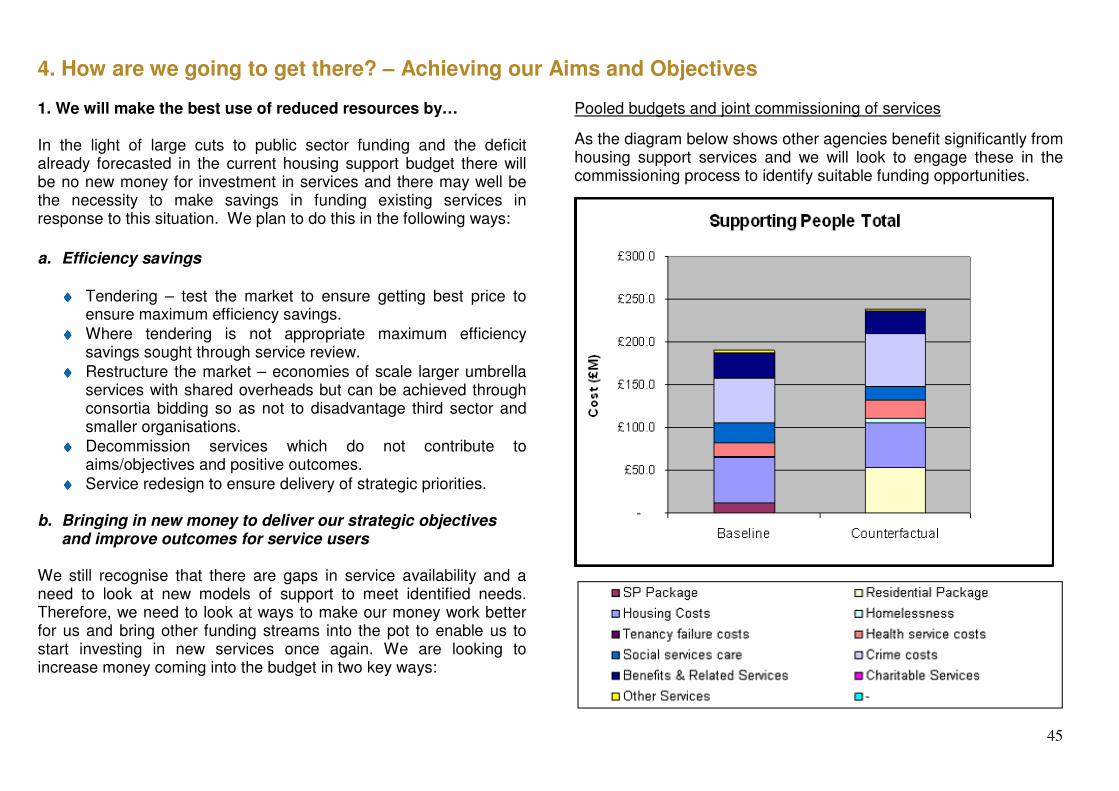
45
4. How are we going to get there? – Achieving our Aims and Objectives 1. We will make the best use of reduced resources by… In the light of large cuts to public sector funding and the deficit already forecasted in the current housing support budget there will be no new money for investment in services and there may well be the necessity to make savings in funding existing services in response to this situation. We plan to do this in the following ways:
a. Efficiency savings
♦♦♦♦ Tendering – test the market to ensure getting best price to ensure maximum efficiency savings.
♦♦♦♦ Where tendering is not appropriate maximum efficiency savings sought through service review.
♦♦♦♦ Restructure the market – economies of scale larger umbrella services with shared overheads but can be achieved through consortia bidding so as not to disadvantage third sector and smaller organisations.
♦♦♦♦ Decommission services which do not contribute to aims/objectives and positive outcomes.
♦♦♦♦ Service redesign to ensure delivery of strategic priorities. b. Bringing in new money to deliver our strategic objectives
and improve outcomes for service users
We still recognise that there are gaps in service availability and a need to look at new models of support to meet identified needs. Therefore, we need to look at ways to make our money work better for us and bring other funding streams into the pot to enable us to start investing in new services once again. We are looking to increase money coming into the budget in two key ways:
Pooled budgets and joint commissioning of services
As the diagram below shows other agencies benefit significantly from housing support services and we will look to engage these in the commissioning process to identify suitable funding opportunities.
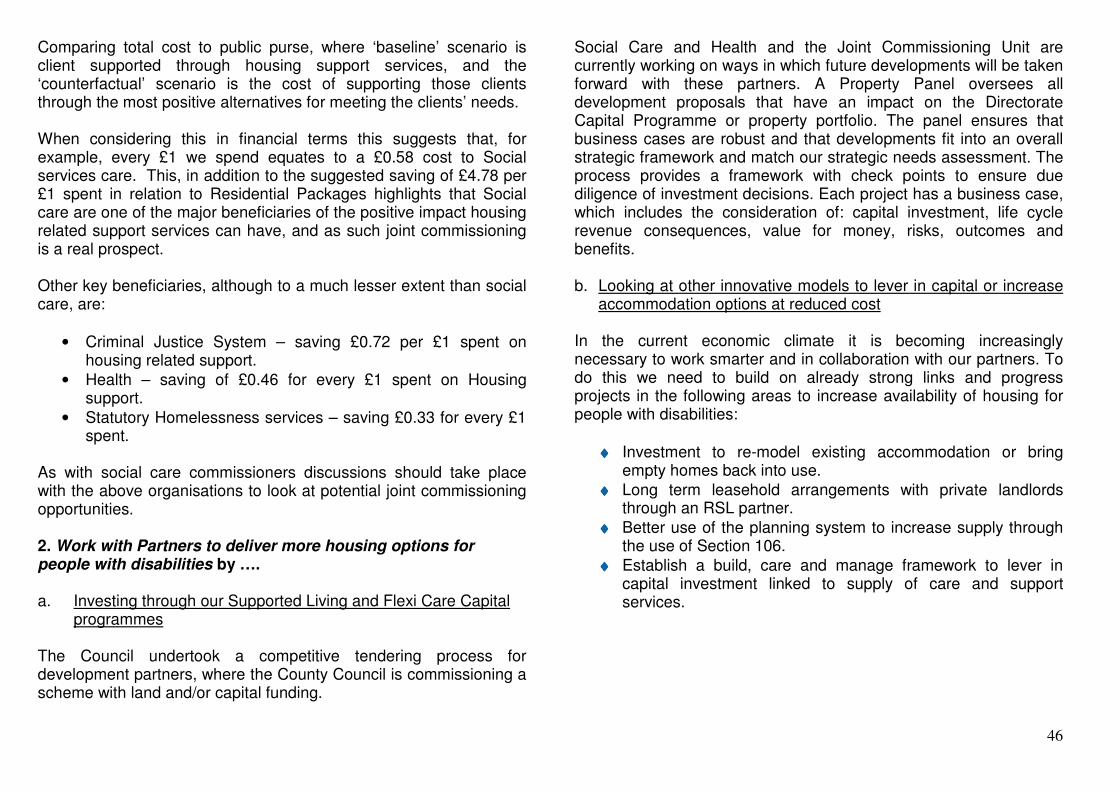
46
Comparing total cost to public purse, where ‘baseline’ scenario is client supported through housing support services, and the ‘counterfactual’ scenario is the cost of supporting those clients through the most positive alternatives for meeting the clients’ needs. When considering this in financial terms this suggests that, for example, every £1 we spend equates to a £0.58 cost to Social services care. This, in addition to the suggested saving of £4.78 per £1 spent in relation to Residential Packages highlights that Social care are one of the major beneficiaries of the positive impact housing related support services can have, and as such joint commissioning is a real prospect. Other key beneficiaries, although to a much lesser extent than social care, are:
• Criminal Justice System – saving £0.72 per £1 spent on housing related support.
• Health – saving of £0.46 for every £1 spent on Housing support.
• Statutory Homelessness services – saving £0.33 for every £1 spent.
As with social care commissioners discussions should take place with the above organisations to look at potential joint commissioning opportunities.
2. Work with Partners to deliver more housing options for people with disabilities by ….
a. Investing through our Supported Living and Flexi Care Capital
programmes
The Council undertook a competitive tendering process for development partners, where the County Council is commissioning a scheme with land and/or capital funding.
Social Care and Health and the Joint Commissioning Unit are currently working on ways in which future developments will be taken forward with these partners. A Property Panel oversees all development proposals that have an impact on the Directorate Capital Programme or property portfolio. The panel ensures that business cases are robust and that developments fit into an overall strategic framework and match our strategic needs assessment. The process provides a framework with check points to ensure due diligence of investment decisions. Each project has a business case, which includes the consideration of: capital investment, life cycle revenue consequences, value for money, risks, outcomes and benefits. b. Looking at other innovative models to lever in capital or increase
accommodation options at reduced cost
In the current economic climate it is becoming increasingly necessary to work smarter and in collaboration with our partners. To do this we need to build on already strong links and progress projects in the following areas to increase availability of housing for people with disabilities:
♦♦♦♦ Investment to re-model existing accommodation or bring empty homes back into use.
♦♦♦♦ Long term leasehold arrangements with private landlords through an RSL partner.
♦♦♦♦ Better use of the planning system to increase supply through the use of Section 106.
♦♦♦♦ Establish a build, care and manage framework to lever in capital investment linked to supply of care and support services.

47
3. We will support people with disabilities to make informed choices about where and how they live by … a. Establishing the Independent Living Service
This team is part of the Prevention and Independence Team within the JCU and offers an exciting new service which aims to increase the housing options available for vulnerable people and to assist people with disabilities, primarily those with Learning and/or Physical Disabilities and Sensory Impairments, to find and move into alternative accommodation, with a view to:
♦♦♦♦ increasing independence
♦♦♦♦ giving choice of who to live with i.e. with others or to live alone, with support
♦♦♦♦ allowing more choice in the type and location of the accommodation
The main part of the process is the completion of a Housing Options Plan which is completed for each person. This tool helps the Independent Living Advisor to be aware of and to act upon the needs of the individual. It enables the Advisor to operate from a person-centred approach and also provides consistency across the County. When the Housing Options Plan is complete, the ILA's can then begin the process of looking for suitable properties with a view to meeting needs, wishes and aspirations where possible which is critical to increasing people’s independence, choice and control and facilitating appropriate care and support packages. b. Introduce approved Housing models and quality standards
It is important to ensure that not only the quantity of housing increases but also that the quality meets the needs and aspirations of our users. Faced with increased choice and personalised packages of support in the community, service users need a clear way to identify good quality housing through the assessment of
quality to agreed standards. This quality mark will consider a number of key factors in relation to the physical built environment, location, community and strategic fit to the personalised approach to the provision of care and support. To support this we will produce a supported housing design guide to inform service and design specifications and outline the key criteria to be used in the assessment and award of the Flexi Care and supported housing quality mark. This exercise cannot be carried out in isolation and needs the input and commitment of all key partners to succeed.
4. Keep Service users at the heart of what we do by …. a. Involving people who use or may use the services we fund at the
very heart of our commissioning processes
We aim to do this by collating information on their wants, needs and aspirations which in turn will influence service design and commissioning decisions. To enable us to do this we have developed a consultation toolkit which involves three key methods of collating feedback, as shown below, but which can be added to this creating a menu of service user involvement options in the future. i. Me, Myself & I
This is an interactive toolkit for providers, support workers or carers to use with service users to help them identify what they need to live independently. The game looks at someone’s needs by focussing on six different areas of a person’s life – My Health, My Safety, My Home, My Life, My Money and My Choice. The results of this consultation exercise will provide us with valuable feedback on what people feel they need to live independently on an ongoing basis rather than as a one off exercise. Consultation in this format provides us with a new and innovative way of involving a broad spectrum of service users:

48
♦♦♦♦ To gain a clear understanding of what service users want to live independently
♦♦♦♦ So we can use service user feedback to influence commissioning intentions and service design
♦♦♦♦ To identify appropriate “outcome measures” based on service users own perspective of success
By continuing to utilise this innovative format we will not only ensure that consultation is fun for those involved, making involvement a positive experience, but will make consultation accessible and flexible to accommodate a broad range of needs/abilities. ii. Share your view This online questionnaire has been developed to give individuals the chance to have their say about housing, care and support services. The feedback to date has provided valuable information about issues such as where people would like to live, their current care and support needs and what services they would like to receive in the future which have influenced the key recommendations in this strategy. We will continue to utilise this resource and collate cumulative feedback to identify key issues and trends to influence future commissioning decisions. iii. ICE Visits
In addition to the above the wider JCU have adopted a structured approach to customer engagement, where senior managers routinely seek feedback from customers about their experience of accessing and using Housing and Support services to inform commissioning processes. Each team is asked to complete two ICE visits per month. These tend to be undertaken by the head of service or service managers and are focussed on: the customer’s journey through a commissioned service, service design, unmet need and outcomes As part of our drive to ensure service users are at the heart of everything we do it is also important to continue to drive up
standards across Staffordshire’s services through use quality monitoring tools which stimulate continuous improvement in services. Quality processes will focus on client involvement and adopt a wider view of safeguarding. We will ensure quality is validated through contract reviews and on site visits and supported by the views of clients.

49
5. How will we know when we’ve got there?
The impact we hope to achieve
1. People who need care and/or support will be living in the most independent and best accommodation that they can.
2. People will be living in accommodation with access to services
that enhances their connection to their community, makes them feel safe and secure whilst helping them to take positive steps to maintain their independence.
3. People who need care and support will be using a range of
services (for both prevention and more complex interventions) which they will be accessing from a single point of contact.
4. People will have a choice about how the services they receive
are commissioned using direct payments and personal budgets.
5. As their needs change fewer people will have to move from their current home to residential care to receive the support they need.
6. People will be supported by a range of services working
together to help them to be as independent as possible.
How will we measure success? Outcomes Based contracting Positive outcomes for service users are at the heart of both national and local policy and are integral to the commissioning of housing and
support services. Therefore outcome monitoring is to become a central pillar of our commissioning process in line with the existing outcome measures, to ensure continuous improvement. In the longer term we hope to make outcome measures relate specifically to service types and locality needs, although this will take some time to come to fruition it will fit easily with the idea of “Total Place” and the wider place shaping agenda.
Outcomes based commissioning and contracting provides challenging agendas for local government and its statutory, community and voluntary partner organisations. It is about moving from commissioning, for volume and price, to commissioning for quality and outcomes.
A PSSRU Discussion Paper (June 2010 ref: 2699) clearly identifies that outcomes are the valued consequences of support for service users. Outcome-based commissioning focuses not on activities and processes, but on results. The key point is shifting thinking from how a service operates - what it does - to the good that it accomplishes - what it achieves for the service user. Ultimately this type of approach should result in the improvement in wellbeing or quality of life that people experience.
For housing and support services the starting point is that outcomes
are the results of support activity or interventions, not the activity
itself. For example, commissioners may seek to help service users to
achieve planned and positive outcomes e.g. to enable someone to
continue living at home despite failing health or change outcomes
e.g. where people experience improvements in the quality of their life
that leads to greater community involvement and/or less dependency
on services.

50
In addition, regardless of what type of outcome, it makes sense to
group similar outcomes together that relate to a particular aspect of a
person’s life. This is usually referred to as domains of outcomes.
There are various different domains of outcomes with several
frameworks already in existence for Supporting People, Every Child
Matters, and the seven outcome domains in the White Paper Our
health, our care, our say.
In Staffordshire we will agree a common approach to achieving better outcomes for our service users and carers – an approach that has, at its core, an assessment of need and a commitment to improve wellbeing and quality of life through targeted commissioning activity. This approach will ensure efficient commissioning of effective services, with less likelihood of service duplication because of its evidence base and the involvement of service users, carers and practitioners in its development. Ultimately this approach requires commitment from all partners to ensure outcomes are geared towards a common direction of travel which in turn leads to greater joint commissioning and service user satisfaction. Implementation Action Plans Individual implementation action plans will be produced giving the detail in relation to the key actions to be pursued in relation to our aims and strategic objectives and our success in achieving these will be tracked in relation to completion of these actions to timescale. These plans will be delivered by the Prevention and Independence team and identified partners.

51
Appendix 1 – Key Strategic Documents and Partner Priorities. 1.1 National Policy and Strategy There are a number of national, regional and local policy documents which relate to housing support and independent living services. The priorities outlined in these strategies need to be considered to ensure housing support services are strategically relevant and that they assist in delivering the priorities. Delivering housing support services is not something done in isolation, it is a cross cutting programme to meet the support needs of vulnerable people. The development of this strategy has been shaped by a number of key policy documents which outline priorities for services provided for specific groups relevant to the delivery of housing support services. This section also highlights how housing support services deliver the priorities of key overarching strategies. 1.1.1 Independence and Opportunity – National Strategy for Supporting People In 2007 the national strategy for Supporting People was published with the focus being on four main areas:
1. Keeping service users at the heart of the programme and of the local delivery of service; 2. Building on the already successful partnerships in the Third Sector; 3. Delivering effectively the new local government landscape; and 4. Working towards better efficiency and less bureaucracy.
The main aim of the strategy is to help end social exclusion by preventing crisis and more costly service intervention, and enabling vulnerable people to live independently both in their own homes and within their community, through the provision of housing support services. This includes ensuring that individuals:
• Are involved in the development and planning of services.
• Have support to gain the life skills they need to live independently.
• Receive support in gaining and maintaining settled accommodation.
• Receive help to identify training and job opportunities.
• Can readily access the services they need.
• Have the help to ensure their existing accommodation continues to meet their needs. 1.1.2 Strong and Prosperous Communities (2008) The national strategy for Supporting People places the programme in the new local government landscape outlined in the White Paper Strong and Prosperous Communities. This White Paper empowers local authorities to act as ‘place shapers’ within their community through Sustainable

52
Communities Strategies. The approach relies on partnerships between statutory organisations to meet objectives that they cannot fulfil on their own e.g. improvements in public health, supporting people with complex needs and promoting economic development. The major themes are:
• Responsive services and empowered citizens
• Effective, accountable and responsible local government
• Stronger cities and strategic regions
• Local government as a strategic leader and place shaper
• A new performance framework
• Efficiency – transforming local services 1.1.3 Our Health, Our Care, Our Say: a new direction for community services (2006) This White Paper sets out the intention to achieve a new direction in service delivery to ensure a sustainable future for health and care, responding both to changing expectations of the public and the implication of the changing demography. It set out several specific high level goals:
• Better prevention and early intervention to achieve improved health, independence and well being.
• More choice and a stronger voice for individuals and communities
• Tackle inequalities, improving access to services
• Give more support to people with long term needs
1.1.4 Putting People First – a shared vision and commitment to the transformation of Adult Social Care (2008) This ministerial concordat announced funding to support system-wide developments to improve health and wellbeing. It sets out the shared aims and values which will guide the transformation of adult social care, recognising the need to work across agendas with users and carers to transform people’s experience of local support and services. The emphasis is to ensure that services provided are focused on individual outcomes and servicer users’ quality of life. Supporting this agenda a pilot programme commenced to allow service users to purchase and access the services they want through individual budgets. Introducing individual budgets has implications on housing support services especially the need to bring together the various sources of support for people in a more integrated way. Services will need to be readily accessible to individuals so that they have choice and control over the support they receive. 1.1.5 Valuing People Now: from progress to transformation (2008) This consultation paper follows on from the white paper Valuing People (2001) and sets out the Government’s vision for people with a learning disability. The key policy drivers are:
53
• personalisation – providing real choice over individuals’ lives and services
• community inclusion – helping people become active members of communities through daytime activities and paid work
• health – ensuring that the health needs of this group are fully met
• housing – providing desirable housing with emphasis on home ownership and tenancies
• delivery – ensuring that delivery agencies are able to execute the above and improving the work of partnership boards. 1.1.6 Shaping the Future of Care Together (2009) This green paper sets out a government vision for a new National Care Service. This would incorporate a universal framework for care and support that is simple to understand. Its aim would be to support people to stay independent, and to provide services based on individual circumstances and need. In order to make the National Care Service reform work the paper outlines three main changes which are:
• Joined up working – there is an expectation that there will be better joined up working between health, housing and social care services.
• Wider range of services in care and support – this includes the expectation that local government should play an important role in supporting providers to shift their focus to assisting in the achievement of outcomes for individuals.
• Better quality and innovation – to ensure high quality, cost-effective services based on dignity and respect. 1.2 Local Policy and Srategy 1.2.1 A Sustainable Community Strategy for Staffordshire 2008 – 2013 This strategy highlights the priorities for Staffordshire and identifies the issues which need to be addressed in order to improve the quality of life for people living in Staffordshire and how to contribute to the sustainable development of the County. It is the overarching strategy for the delivery of services for the people of Staffordshire and housing support and independent living services are fundamental players in contributing to the success of the strategy.
The vision is to “improve the quality of life for all our people, by increasing economic prosperity, improving local services, and developing partnership working” and four main priorities of the strategy are:
� A protected and respected environment � A vibrant, prosperous and sustainable economy � Improved health and sense of well being � Strong, safe and cohesive communities
1.2.2 Staffordshire Joint Commissioning Strategies
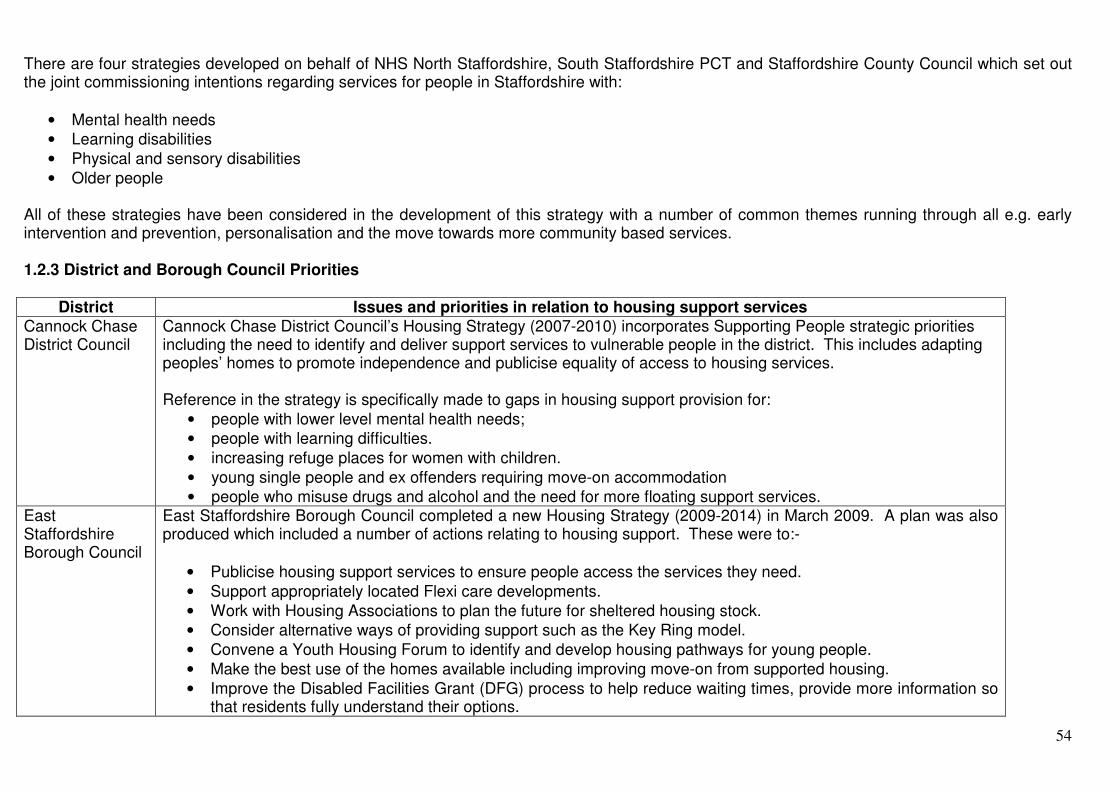
54
There are four strategies developed on behalf of NHS North Staffordshire, South Staffordshire PCT and Staffordshire County Council which set out the joint commissioning intentions regarding services for people in Staffordshire with:
• Mental health needs
• Learning disabilities
• Physical and sensory disabilities
• Older people All of these strategies have been considered in the development of this strategy with a number of common themes running through all e.g. early intervention and prevention, personalisation and the move towards more community based services. 1.2.3 District and Borough Council Priorities
District Issues and priorities in relation to housing support services Cannock Chase District Council
Cannock Chase District Council’s Housing Strategy (2007-2010) incorporates Supporting People strategic priorities including the need to identify and deliver support services to vulnerable people in the district. This includes adapting peoples’ homes to promote independence and publicise equality of access to housing services. Reference in the strategy is specifically made to gaps in housing support provision for:
• people with lower level mental health needs;
• people with learning difficulties.
• increasing refuge places for women with children.
• young single people and ex offenders requiring move-on accommodation
• people who misuse drugs and alcohol and the need for more floating support services. East Staffordshire Borough Council
East Staffordshire Borough Council completed a new Housing Strategy (2009-2014) in March 2009. A plan was also produced which included a number of actions relating to housing support. These were to:-
• Publicise housing support services to ensure people access the services they need.
• Support appropriately located Flexi care developments.
• Work with Housing Associations to plan the future for sheltered housing stock.
• Consider alternative ways of providing support such as the Key Ring model.
• Convene a Youth Housing Forum to identify and develop housing pathways for young people.
• Make the best use of the homes available including improving move-on from supported housing.
• Improve the Disabled Facilities Grant (DFG) process to help reduce waiting times, provide more information so that residents fully understand their options.

55
• Improve housing services to meet the needs of the BME population in East Staffs.
• Work with partners to promote housing support services more effectively to Gypsies and Travellers. Lichfield District Council
Lichfield District Council’s Strategic Plan 2008-2012 identifies one of the main priorities being to ‘help people to access a home that’s right for them and to live independently’ as well as the need to increase the variety of housing available, including housing with support for vulnerable groups. The key aims are is to:
• Help for local people including young people to get onto the housing ladder.
• A variety of housing which meets the needs of our growing elderly and disabled population.
• Help to prevent people from becoming homeless.
• More supported housing for vulnerable people
The Homelessness Strategy 2008-2013 identifies shortages in the following areas:
• Floating support to assist vulnerable households specifically for young people
• Victims of domestic violence
• People with mental health problems
• Single person households
The main priorities of the strategy are:-
• Prevent homelessness
• Provide more settled homes and increase the supply of affordable housing
• Improved access to services particularly for vulnerable people.
• Reduce the use of and length of stay in Temporary Accommodation.
• Improve partnership work and enable effective joint working. Newcastle under Lyme Borough Council
Newcastle’s Housing Strategy (2005-2010) includes as a priority the need to prevent homelessness and ensure support is available to vulnerable people. In order to meet this objective and others identified in the Homelessness Strategy (2008-2010) a number of actions need to be taken. These are:
• To increase the availability of financial advice accessible to residents in order to prevent homelessness.
• Working with partners to increase the numbers of suitable types of affordable new housing.
• The need for more move-on accommodation
• To reduce the use of temporary accommodation.
• To monitor the impact support services have on tenancy sustainment.
• Having an active role in the commissioning of new projects and services
• Improving working relationships and joining up with organisations, especially the Health service, that provide support which is not covered by Staffordshire’s Housing Support and Independence programme.
• Investigate ways to increase homelessness prevention initiatives for younger people including developing supported accommodation.

56
Stafford Borough Council
Referring to the Housing Strategy 2008-2013 (Homes for our Community) five strategic priorities have been identified. These are: • Improve the physical condition of the housing stock across all tenures • Preventing homelessness • Increasing the supply of affordable housing • Promoting independent living • Partnership working The strategy action plan outlines various outcomes for the different priorities as follows:
• Reducing the number of vulnerable households living in non-decent housing.
• Decreasing the number of homelessness presentations and the number of homeless cases.
• Reducing the use of Bed and Breakfast accommodation
• Increasing the supply of new affordable housing in the Borough, particularly in rural locations.
• Identifying and providing the evidence base for addressing the needs of gypsies and travellers.
• Increasing the availability of adapted homes and opportunities for people who prefer to live in their own home.
• Improving the disabled facilities grant process and developing a register of adapted properties.
• Establishing a homeless prevention culture. Staffordshire Moorlands District Council
Referring to the Housing Strategy, Strategic Framework (September 2009) a number of priorities are identified. These are:
• Increasing the provision of Affordable Housing.
• Ensuring all residents have access to a Decent Home.
• Ensuring all communities have a choice in meeting their housing needs
• Supporting People to remain in their own home
To support the priorities a number of aims have been developed including: 1) Maximise available resources to ensure affordable housing of the correct type, tenure and location is available to
meet local needs. 2) Improve housing standards across all tenures and ensure vulnerable residents live in decent homes. 3) Provide a range of supported accommodation and housing services to meet specific housing needs and allow
people to remain in their own home. 4) Provide high quality, accessible advice services to assist people in exploring housing options and preventing
homelessness.
In order to assist in moving the housing support and independence agenda forward the council have identified a number of work areas which include:
• Playing an active role in the governance of Housing Support and Independence

57
• Seeking maximimum government funding for disabled facilities based on projected future need
• Developing new Flexi care housing schemes for older people in Leek as part of the affordable housing joint venture with Harvest Housing.
• Setting performance targets to maximise homelessness prevention and minimise use of temporary accommodation.
• Introducing choice based lettings (CBL) combined with a new approach to housing advice
• Investing funds from the Government homelessness prevention grant of £125,000 (2009 – 2011) in services directly aimed at the main causes of homelessness
• Targeting Housing Renewals Assistance and Kickstart, towards vulnerable people
Tamworth Borough Council
The Housing Strategy 2007-2010 (Amended April 08) identified the priorities for Tamworth as being: 1) Increase the supply of Affordable Housing, widen housing choice and prevent homelessness 2) Address the housing needs of vulnerable people 3) Address the housing needs generated by an ageing population 4) Encourage sustainable communities and improve the condition of the Housing Stock in the Public Sector 5) Improve housing and environmental conditions in the private sector It goes on to identify a number of actions which need to be taken including:
• Increasing the provision of hostel accommodation with an element of direct access for young people.
• Setting out a comprehensive approach for the delivery of supported housing in the Borough.
• Improving existing move-on arrangements.
• Reviewing the Disabled Facilities Grant (DFG) process to ensure delivery is efficient and effective.
• Providing desirable alternatives / specialist accommodation in order to meet the current and future needs of older people.
• Working with partners to deliver support and services which enable older people to remain in their own homes
• Carrying out collaborative research to gain a better understanding of the housing needs of the gypsy and traveller community.
Referring to the homelessness agenda a number of strategic priorities were highlighted in the Homelessness Strategy (2009-2012). These include:
• Improve and enhance homelessness prevention activities
• Reduce the use of and time spent in temporary accommodation
• Improve joint working to ensure effective partnerships are in place
• Increase the supply of affordable housing and provide more settled homes

58
• Improve access to accommodation and services, particularly for vulnerable people and those at risk of becoming homeless
Appendix 2 – Needs and Supply Information This section of the strategy gives an analysis of the current supply of housing support funded services across Staffordshire. The information collected has been used to help identify any gaps in service provision. The current supply for accommodation based units and floating support units (as at May 2010) is 18527: This is broken down as follows:
Total Number of Units Primary Service User Group Accommodation
Based Floating Support Total
Older people with support needs including:- � Community or Social Alarm Service � Home Improvement Agency and Handyperson Service
4047 784 4831 10449
72
Older people with mental health problems/dementia 0 65 65 Frail elderly 525 0 525 People with mental health problems 184 74 258 People with learning disabilities 140 577 717 People with a physical or sensory disability 0 9 9 Single homeless with support needs 81 30 111 People with alcohol problems 27 52 79 People with drug problems 24 48 72 Offenders or people at risk of offending 19 109 128 Mentally disordered offenders 6 0 6 Young people at risk 188 24 212 Young people leaving care 1 0 1 Women at risk of domestic violence 79 155 234 People with HIV/AIDs 0 10 10 Homeless families with support needs 20 36 56 Refugees 0 30 30 Teenage parents 29 0 29 Rough sleeper 0 12 12 Travellers 0 0 0 Generic (DV perpertrator) 0 8 8 Generic (Male domestic abuse) 0 20 20 Generic 0 593 593 Totals 5370 2636 18527

59
An analysis of the supply in the County has been carried out to compare Staffordshire’s provision per head of population against the West Midlands regional figure and the national average. In addition a number of comparator authorities have been identified to provide an average for similar county councils. Although a lot of factors need to be considered when using comparative data e.g. variances in demographic and geographic profiles, demand for services, diverse needs, deprivation and differences in monitoring methods etc., it is useful to examine the provision in other similar sized authorities. Results from the analysis highlighted the following:
• Staffordshire has a higher percentage of support services for ‘Older People with Support Needs’, at 86.1%. Compared to the counties group average Staffordshire’s housing support provision for this service user group was 5.2% more. The difference was substantially more when compared to the national figure at 74.5%.
• The number of household units for ‘People with Learning Disabilities’ is in line with the comparator authorities/averages. Although Staffordshire’s supply of 2.8% is slightly higher than the regional average of 2.4% comparison to the national average of 2.9 % and the counties group figure of 3.1% indicates that there is not an over supply.
• Although this service user group in Staffordshire receives the third highest amount of housing support funding provision for ‘Frail Elderly’ is the lowest when compared to other authorities included in the analysis. The West Midlands average showed the highest supply at 3.5% compared to the counties group average of 2.7%. Bearing in mind some of the authorities included in the West Midlands region, for example Birmingham, have a much bigger population sizes, more accommodation based services, such as Flexi care, will be included in the percentage figure.
• It is evident from the analysis that Staffordshire has fewer generic services with the percentage number of units, 1.4%. This is low in comparison to the other authorities which range from 3.7% (Counties Group average) to 4% (National).
• It appears that Staffordshire has fewer support services for ‘People with Mental Health Problems’. Comparing to the national figure of 3.4% Staffordshire is 2% lower at 1.4%. Although additional services have been procured for this service user group the number of units is not in line with the regional figure of 2.8% or the counties group average of 2.5%.
• Staffordshire has a very low number of household units for ‘People with a physical or sensory disability’. When comparing against the other authorities Staffordshire did not show a percentage figure with only having 6 units. Although the counties group average was marginally higher at 0.4% comparisons regionally and national showed greater variances of 1.3% and 1.1 %.
• Staffordshire are in the same situation as the other comparator authorities for providing services to ‘Mentally disordered offenders’. The number of units supplied is limited regionally and nationally.

60
• Provision of services for ‘Homeless Families with Support Needs’ is in line with the regional and county group average figures. The national figure is higher at 1.4% compared to 0.6% for Staffordshire and the West Midlands region.
• The figure shown for Staffordshire for ‘People at risk of Offending’ is in line with regional and national percentages. The counties group average was lower at 0.4% which may indicate a slight over supply in Staffordshire.
• Staffordshire has fewer support services for ‘Single homeless with support needs’ when compared to other county, regional and national figures. The percentage figure for Staffordshire is 0.7% which is 2.9% lower than the national figure of 3.6%. Although this figure does seem high in comparison to the county group average of 2.3% further work is needed to examine whether there is a need to increase supply for this service user group.
• There were slight variances in the comparisons for ‘Young people at risk’ and Young people leaving care’. Percentages for Staffordshire indicated lower support services for these service users when compared to regional, national and county figures. Staffordshire were more in line with the county group averages only showing differences of 0.4% and 0.1%.
• All of the other service user groups not mentioned above showed no significant variances when compared regionally, nationally and to the county group average.
Supply and Needs Information An analysis of supply and needs information identifies increases in service provision as well as highlighting any gaps in supply. Key factors identified from the analysis include:
• The increase in provision for ‘Frail Elderly’ service users and plans to extend this with more developments planned in every district.
• The introduction of eight new floating support services has led to increased provision of services for ‘Older People with Support Needs’. Additionally the introduction of the handyperson’s service has increased provision for services which help older people maintain their independence.
• The provision for people with drug/alcohol problems has increased and more work is being carried out with the Substance Misuse Commissioning team to jointly commission services to meet both housing support and treatment needs of individual service users within the same service.
• Although there has been a reduction in some specialist services for service user groups e.g. single homeless and young people at risk, the provision for generic services, which targets all ‘social exclusion’ service user groups, has increased.

61
• Provision for domestic violence units has increased in particularly the number of floating support services. Gaps in Supply In order to identify any areas where there are gaps in supply the following approaches were taken:-
• An analysis of service reviews was carried out.
• Information collected from consultation workshops with providers was examined.
• Results from a questionnaire sent to Third Sector providers were analysed. Findings from Service Reviews A number of service reviews have been undertaken highlighting the following issues: Accommodation Based Support to Homeless People, Young People at Risk and Teenage Parents
• There is a relatively low provision of supported housing to young people at risk and single homeless people in Staffordshire Moorlands and South Staffordshire. Both districts have a rural and dispersed geography that may be better served by more flexible models of support such as the night stop model.
• The need to increase provision of floating support attached to independent accommodation across all social exclusion client groups.
• There is no supported housing specific to teenage parents in Lichfield, Newcastle, South Staffordshire or Staffordshire Moorlands.
•••• Most (not all) districts identified a lack of suitable accommodation for people moving-on from supported housing, largely connected to a lack of one-bed accommodation but also some issues surrounding peoples expectations when leaving good quality RSL supported housing and being reluctant to move into older local authority/LSVT properties.
•••• A lack of affordable housing was seen to be a priority. Average house prices are highest in Lichfield, South Staffs and Stafford.
•••• There is a perceived need for direct access provision in some districts, though not all districts. More work needs to be undertaken to examine the need to commission this type of provision especially as there was no clear consensus on what support function is delivered by direct access. The key argument for more provision was to meet immediate housing needs rather than support needs.
People at Risk of Domestic Violence
• South Staffordshire is the only district with no refuge provision. In 2008, discussions were held with key stakeholders in South Staffordshire and, at the time, there was no clear evidence base of need for a refuge in the district. Current discussions are exploring whether a replacement refuge in Stafford might also help meet need in South Staffordshire.

62
• There is a lack of floating support services in Newcastle and Tamworth. The review recommended that floating support resources should be allocated according to:
o Population (55% weighting) o Levels of domestic violence recorded crime (30% weighting) o The level of population living in rural communities (15% weighting)
• There is a need to introduce resettlement work (supporting the client’s transition from accommodation based support to more settled housing) to accommodation based services.
Sheltered Housing and Floating Support Services for Older People
• The need for services to be aimed at sustaining or developing the independence of older people, irrespective of the type of property/tenancy in which they live.
• Developing services to support older people who choose to remain in (or return to) their existing home.
• More consideration is necessary regarding the needs of older people in rural areas.
• Provision should be weighted towards districts with a low level of sheltered housing provision, e.g. Staffordshire Moorlands.
• Services should be integrated or aligned with wider services to older people, including those delivered by health, social care, housing and the
voluntary sector. Opportunities to jointly commission services should be explored.
• Further development of home improvement agencies and handyperson schemes Flexi Care Housing
• Staffordshire’s Flexi Care Needs Analysis estimated that there is a need for a further 9,541 Flexi care units by 2030. Tenure trends will not impact on the total requirement for flexi care units but may in future reduce the number of socially rented units required. More tenure options need to be developed to reflect the fact that in Staffordshire 77% of people aged over the age of 55 are owner occupiers and will have equity to invest in their future housing and care needs.
• Flexi Care Schemes will often have the potential to act as ‘hubs’ for innovative outreach schemes or part of the development of a blanket of
integrated emergency and maintenance support services, which may be across social care and health.
• Specific services need to be developed for people with dementia (early stages) and their carers.

63
• There is a need to develop services that are sensitive and supportive to a range of specific needs including learning disability and physical
disability. Information from Providers A number of consultation workshops were held in 2009 with a number of providers identifying the following gaps in supply:
• Services for people with Mental Health problems.
• Services for people with HIV/Aid’s.
• Family inclusive projects.
• No funding available for supporting children who are involved in domestic violence situations.
• Lack of services for young people in Lichfield.
• Social isolation e.g. low level needs i.e. mentoring/befriending.
• Transitional arrangements for people moving to independent living i.e. service users with learning disabilities/out of county.
• Services for people with other addictions such as gambling, eating disorders, obsessive compulsive disorder (OCD) etc.
• Services for people with complex needs in particularly young people with chaotic lifestyles.
• Limited services for young people with drug/alcohol problems.
• Low level services for people with learning disabilities.
• Support services for people with Attention Deficit Hyperactivity Disorder (ADHD).
• Provision of services for gypsies and travellers.
• Support for young parents.
• Specialist support for victims of domestic violence who have alcohol problems.
• Young people in need of accommodation.
• Support for parents with disabilities.
• Services for re-offenders.
• Services for longer periods i.e. not limited to 2 years, especially for service users with learning disabilities and people with mental health problems.
Results from Third Sector Provider questionnaire A hundred questionnaires were sent to Third Sector organisations to gain viewpoints about the current situation of housing support provision in Staffordshire. This included identifying areas where support is needed but services are not being delivered. Although the number of organisations who completed the questionnaire was low at 19.8% those taking part were from a broad spectrum, from a theatre group providing a wide range of create arts for mental health and well being to a transport service helping people to get out and about.

64
Through the consultation Third Sector providers were asked a number of questions which included the following feedback:- Does your organisation have service users with housing support needs? 16 out of 20 organisations said that they have service users with housing support needs. What services does your organisation provide? 75% provided services relating to emotional support, counselling and advice and help in gaining access to other services. Other services which the majority (11 or 12) of organisations offered included:
• Access to local community organisations
• Developing domestic/life skills
• Developing social skills/behaviour management
• Help in establishing social contacts and activities
• Help in managing finances and benefit claims Who are the main users of your services? Results from the questionnaire indicated that the majority of organisations (68.75%) provided services to people experiencing mental health problems. Between 37% and 44% of the organisations delivered services to:
• Older people with support needs
• People with physical disabilities and sensory loss
• People with learning disabilities
• Women at risk of domestic violence Service users where provision of services appeared to be very low included:
• Vulnerable families (12%)
• People with HIV/AID’s (12%)
• Rough Sleepers (12%)
• Refugees (6%)
• Gypsies and Travellers (6%)
• Teenage parents (6%) Are there any groups of people that you believe need support services but are not being helped at the moment?

65
Two organisations participating in the survey felt that People with Asperger Syndrome (AS) and High Functioning Autism (HFA) were not being helped at the moment. It was suggested that the reason for this might be due to people with this disability being directed to services for people with learning disabilities or mental health services with the limited availability of specialist services for people with AS/HFA. One organisation put forward the argument that most groups of people have services but is it the right service? It was felt that boundaries for groups of people and services needed to be less rigid as individuals’ needs do not always fit existing groups or services. Other comments made about people needing support services but not being helped at the moments included:
• The difficulties experienced when identifying support for older homeless people.
• People being cared for in the community who cannot advocate for themselves and who are cared for by a team of carers who have no responsibility other than providing personal care.
• Young people in particularly 16 to 17 year olds with mental health needs.
• Women with multiple and complex needs (under and over 18).
• Some of new migrant communities.
• People with MS (Multiple Sclerosis).
• Women suffering domestic abuse with complex needs do not always get the level of service that they require because it is very time intensive and specialist which is therefore more costly to provide.
What gaps in services delivery have you spotted? Feedback suggested that some parts of the county have better provision of services than others. Results from this survey suggested that there are more services in the north of the county i.e. Newcastle and Staffordshire Moorlands than the south i.e. South Staffs and Cannock. Organisations made the following comments relating to gaps in service delivery:-
• People from Cheadle and the surrounding areas mainly have to travel to Leek to make homelessness application. There is limited availability for homelessness appointments in Cheadle with no drop-in surgery services.
• As mentioned earlier there are very few services available to people with autistic spectrum, in particular Aspergers Syndrome. Of the services that are available most only cater for people over the age of 16. Additionally it was felt that Social Housing organisations need to be made aware of tenants who have AS/HFA so that awareness training can be put into place. It was felt that some issues could not be addressed and dealt with due to staff not having the specialist skills/knowledge.
• Housing for women with complex needs; modern housing support for people with learning disabilities; housing support for young people; move on accommodation for people leaving hostels; appropriate housing for people with an offending history and at risk of re offending; housing for people misusing drugs or alcohol in particularly housing support for women.

66
• Lack of clarity over who is responsible for dealing with issues other than those related to personal care for people living in semi sheltered accommodation.
• Low cost car service for non essential journeys.
• Lack of culturally sensitive support.
• Limited availability of respite care for people with disabilities requiring specialist care and support. What funding sources do you currently use to finance service delivery? Only two organisations said that they receive housing support (formerly supporting people) funding and three mentioned that they had submitting bids for Staffordshire County Council’s housing support contracts. Apart from contributions from Social Care and Health, South Staffordshire Primary Care Trust and Borough/District Councils there were a variety of other funding sources including:
• Give it Sum
• Awards for All
• Big Lottery
• Community and Learning Partnerships
• Self funding
• Personal charges
• Coalfields Regeneration Trust
• Housing Associations
• Ministry of Justice
• Comic Relief
• Department of Health
• Community Safety Partnerships
• The Police

67
Appendix 3 – Housing Support Contract, Performance and Outcomes information The Value for money snapshot is produced by the prevention and Independence team to provide a snapshot analysis of Staffordshire services commissioned through Housing support grant. The snapshot is reproduced annually to help evaluate the SP partnership’s progress in improving value for money. It also provides a useful source of benchmarking information. Provider organisations can calculate VFM measures for their services using information taken from SP contracts, or can request (in writing or email) that the SP team provide the data specific to their services. The following information has been Flexicted from this report due to its relevance to the strategy.
Table 1: Value for money measures - floating support by client group (as at September 2010)
Staffing Input per unit per
week (hours) Staffing Ratio (adjusted to a
37 hr week) Price per unit per week (£) Price per unit per support
hour delivered (£)
Total number
of services
Number of
providers
Total number of units Average Highest Lowest Average Highest Lowest Average Highest Lowest Average Highest Lowest
All floating support services 60 30 2232 3.10 7.97 1.00 0.084 0.215 0.027 £53.66 £118.41 £17.10 £17.77 £34.05 £9.61
Floating support to socially excluded groups (single homeless, homeless families, teenage parents, young people at risk, generic) 13 8 686 2.98 5.19 1.33 0.081 0.140 0.036 £56.53 £108.48 £36.02 £19.03 £27.04 £12.06
Floating Support for Older people 10 5 696 1.30 1.78 1.00 0.035 0.048 0.027 £21.58 £24.32 £17.10 £17.01 £20.14 £13.70
Floating support to women at risk of domestic violence 12 6 171 4.22 7.97 2.02 0.114 0.215 0.056 £69.92 £118.41 £32.17 £16.85 £23.10 £16.85
Floating support to people with learning disabilities 8 5 289 2.89 5.33 2.03 0.078 0.144 0.055 £48.54 £94.72 £24.45 £15.77 £27.27 £12.04
Floating support to people with mental health problems 4 3 74 4.91 7.44 2.26 0.133 0.201 0.061 £72.46 £107.69 £53.24 £16.73 £23.57 £9.61
Table 2: Value for money - accommodation based services by client group (as at September 2010)
Staffing Input per unit per
week (hours) Staffing Ratio (adjusted to a
37 hr week) Price per unit per week (£) Price per unit per support
hour delivered (£)
Total number
of services
Number of
providers
Total number of units Average Highest Lowest Average Highest Lowest Average Highest Lowest Average Highest Lowest
All accommodation based services 164 40 5263 2.85 16.80 0.16 0.077 0.454 0.004 £50.44 £312.12 £3.50 £19.05 £42.73 £4.82
Very sheltered housing to Frail Elderly 10 8 574 1.01 1.45 0.27 0.027 0.039 0.007 £18.72 £27.34 £5.61 £19.44 £27.39 £9.50
Refuge for women at risk of domestic violence 9 6 79 12.80 16.35 8.93 0.346 0.442 0.241 £251.58 £312.12 £199.49 £20.17 £27.89 £14.32
Sheltered housing to older people with support needs 111 17 4008 0.81 5.43 0.16 0.022 0.147 0.004 £14.14 £26.13 £3.50 £18.97 £29.05 £4.82

68
Supported housing to socially excluded groups (single homeless, homeless families, teenage parents, young people at risk) 14 10 294 7.14 12.77 3.57 0.193 0.345 0.097 £123.07 £236.50 £55.21 £27.39 £17.33 £12.70
Supported housing to people with alcohol or drug problems 4 2 58 11.73 16.80 6.46 0.317 0.454 0.175 £150.15 £289.90 £60.85 £11.92 £17.26 £9.42
Supported housing to people with learning disabilities 5 3 41 2.96 6.38 1.05 0.080 0.172 0.028 £79.29 £146.36 £40.86 £32.85 £42.73 £19.26
Supported housing to people with mental health problems 8 6 184 7.58 10.84 2.63 0.205 0.293 0.071 £123.05 £179.04 £43.43 £16.57 £23.09 £8.66
Table 3: Annual Contract Exposure (based on contracts in place at September 2010)
Full contract exposure, at
100% on subsidy contracts
Full contract exposure, at 65%
on subsidy contracts
Older People with support needs (see below for breakdown)* £5,296,867 £4,303,275
Older people with mental health problems/dementia £184,408 £184,408
Frail Elderly £608,023 £405,088
People with Mental Health Problems £1,428,931 £1,197,949
People with Learning Disabilities £794,772 £709,579
People with a Physical or Sensory Disability £46,464 £46,464
Single Homeless with Support Needs £577,593 £577,593
People with Alcohol Problems £339,204 £339,204
People with Drug Problems £285,034 £285,034
Offenders or People at risk of Offending £494,993 £494,993
Mentally Disordered Offenders £70,974 £70,974
Young People at Risk £1,160,927 £1,160,927
Young People Leaving Care £9,364 £6,087
Women at Risk of Domestic Violence £1,429,496 £1,429,496
People with HIV / AIDS £47,192 £47,192
Homeless Families with Support Needs £261,202 £261,202
Refugees £49,991 £49,991
Teenage Parents £150,210 £150,210
Rough Sleeper £37,040 £37,040
Travellers £0 £0
Generic £1,584,505 £1,584,505
Totals** £14,857,191 £13,341,211
Notes:
1. * subsidy level for leaseholders assumes 20% rather
than 65%
2. ** Source data based on contract exposure at
September 2010, but projected to October to take
account of changes in floating support and new
SPIINS Projects.

69
Breakdown of contract exposure for older people with support needs*
Sheltered Housing for older people £2,838,835 £1,845,243
Community or Social Alarm Service £1,011,106 £1,011,106
Home Improvement Agency (HIA) Service £655,955 £655,955
Floating support for older people £790,971 £790,971
Total for older people with support needs £5,296,867 £4,303,275
Chart 1: Staffing Ratio against Weekly unit cost
a. Floating Support services: b. Accommodation Based Services:
Floating support - all client groups
£0.00
£20.00
£40.00
£60.00
£80.00
£100.00
£120.00
£140.00
0.000 0.050 0.100 0.150 0.200 0.250
Staff ratio (i.e.0.1= 1staff to 10 services users)
We
ek
ly u
nit
co
st
All accommodation based services
£0.00
£50.00
£100.00
£150.00
£200.00
£250.00
£300.00
£350.00
0.000 0.100 0.200 0.300 0.400 0.500
Staff ratio (i.e.0.1= 1staff to 10 services users)W
ee
kly
un
it c
os
t

70
Chart 2: District Analysis
Units (all service types)
Cannock Chase,
2897, 16%
East
Staffordshire,
2165, 12%
Lichfield, 2004,
11%
Newcastle-under-
Lyme, 3171,
17%
South
Staffordshire,
2294, 13%
Stafford, 2475,
14%
Staffordshire
Moorlands, 1511,
8%
Tamworth, 1694,
9%
Units (excluding alarms, HIAs and sheltered housing)
Cannock Chase,
399, 11%
East Staffordshire,
534, 14%
Lichfield, 487, 14%
Newcastle-under-
Lyme, 527, 15%
South
Staffordshire, 354,
10%
Stafford, 467, 13%
Staffordshire
Moorlands, 416,
12%
Tamworth, 398,
11%

71
Table 4: Key Performance Indicators
a. KPI1 (NI142) KPI1 measures the % service users who are supported to establish and maintain independent living. This covers current service users and departures from long term/permanent accommodation-based services or support only services (such as floating support). For example, a 98% performance means that all but 2% of current service users and those that departed during the quarter are maintaining independent living. Failing to maintain independent living includes where the persons: committed suicide, taken into custody, entered long stay hospital, moved into a care home or evicted from their tenancy.
NI 142 Vulnerable people maintaining independent living
90.2%
82.3%
85.2%
88.8%89.5%
85.6%
78.0%79.8%
50.0%
60.0%
70.0%
80.0%
90.0%
100.0%
Q1 08/09 Q2 08/09 Q3 08/09 Q4 08/09 Q1 09/10 Q2 09/10 Q3 09/10 Q4 09/10
< W
ea
ke
r :
Be
tte
r >
Staffordshire West Midlands All England
Service Type
Quarter Administering
Authority Name Accommodation Based Service
Floating Support Service
Overall
National 98.92% 97.33% 98.38%
West Midlands 99.09% 97.51% 98.36% Quarter 1, 2009/10
Staffordshire 98.90% 97.04% 98.46%
National 98.92% 97.30% 98.34%
West Midlands 99.09% 96.99% 98.12% Quarter 2, 2009/10
Staffordshire 99.03% 97.46% 98.61%
National 99.00% 97.39% 98.44%
West Midlands 99.08% 96.90% 98.10% Quarter 3, 2009/10
Staffordshire 98.74% 98.01% 98.51%
National 98.95% 97.54% 98.44%
West Midlands 99.22% 97.71% 98.51% Quarter 4, 2009/10
Staffordshire 99.11% 97.02% 98.36%

72
b. KPI2 (NI141) KPI2 measures the % of service users who have moved on in a planned way from temporary living arrangements. Whereas KPI1 covers long term services and includes departures and existing service users, KPI2 looks at departures from short-term accommodation based services. For example, an 80% performance measure implies that 20% of all departures from the services were unplanned. That might include: committed suicide, sleeping rough, taken into custody, evictions or where the tenancy was abandoned.
N 141 Vulnerable people achieving independent living
98.4%
98.5%98.6%98.5%
98.6%98.6%98.7%
98.9%
95.0%
96.0%
97.0%
98.0%
99.0%
100.0%
Q1 08/09 Q2 08/09 Q3 08/09 Q4 08/09 Q1 09/10 Q2 09/10 Q3 09/10 Q4 09/10
Staf fordshire West Midlands All England
Service Type
Quarter Administering
Authority Name Accommodation Based Service
Overall
National 75.58% 75.73%
West Midlands 77.15% 76.14% Quarter 1, 2009/10
Staffordshire 88.72% 88.81%
National 75.34% 75.70%
West Midlands 75.71% 75.84% Quarter 2, 2009/10
Staffordshire 84.89% 85.17%
National 76.67% 77.60%
West Midlands 77.27% 76.87% Quarter 3, 2009/10
Staffordshire 83.76% 82.26%
National 76.09% 76.90%
West Midlands 82.01% 81.64% Quarter 4, 2009/10
Staffordshire 90.38% 90.23%
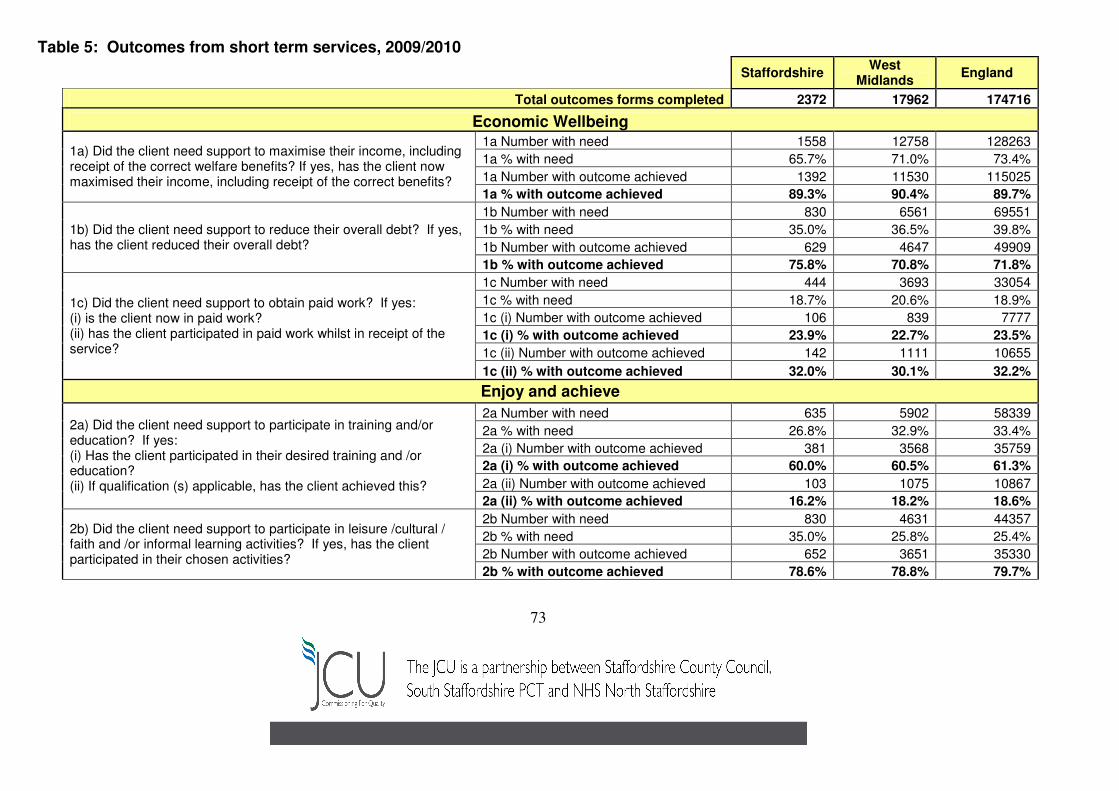
73
Table 5: Outcomes from short term services, 2009/2010
Staffordshire
West Midlands
England
Total outcomes forms completed 2372 17962 174716
Economic Wellbeing 1a Number with need 1558 12758 128263
1a % with need 65.7% 71.0% 73.4%
1a Number with outcome achieved 1392 11530 115025
1a) Did the client need support to maximise their income, including receipt of the correct welfare benefits? If yes, has the client now maximised their income, including receipt of the correct benefits?
1a % with outcome achieved 89.3% 90.4% 89.7%
1b Number with need 830 6561 69551
1b % with need 35.0% 36.5% 39.8%
1b Number with outcome achieved 629 4647 49909
1b) Did the client need support to reduce their overall debt? If yes, has the client reduced their overall debt?
1b % with outcome achieved 75.8% 70.8% 71.8%
1c Number with need 444 3693 33054
1c % with need 18.7% 20.6% 18.9%
1c (i) Number with outcome achieved 106 839 7777
1c (i) % with outcome achieved 23.9% 22.7% 23.5%
1c (ii) Number with outcome achieved 142 1111 10655
1c) Did the client need support to obtain paid work? If yes: (i) is the client now in paid work? (ii) has the client participated in paid work whilst in receipt of the service?
1c (ii) % with outcome achieved 32.0% 30.1% 32.2%
Enjoy and achieve
2a Number with need 635 5902 58339
2a % with need 26.8% 32.9% 33.4%
2a (i) Number with outcome achieved 381 3568 35759
2a (i) % with outcome achieved 60.0% 60.5% 61.3%
2a (ii) Number with outcome achieved 103 1075 10867
2a) Did the client need support to participate in training and/or education? If yes: (i) Has the client participated in their desired training and /or education? (ii) If qualification (s) applicable, has the client achieved this?
2a (ii) % with outcome achieved 16.2% 18.2% 18.6%
2b Number with need 830 4631 44357
2b % with need 35.0% 25.8% 25.4%
2b Number with outcome achieved 652 3651 35330
2b) Did the client need support to participate in leisure /cultural / faith and /or informal learning activities? If yes, has the client participated in their chosen activities?
2b % with outcome achieved 78.6% 78.8% 79.7%

74
2c Number with need 369 2730 29576
2c % with need 15.6% 15.2% 16.9%
2c Number with outcome achieved 217 1555 17290
2c) Did the client need support to participate in any work-like activities, e.g. unpaid work /work experience /work-like experience / voluntary work? If yes, has the client participated in their chosen work-like activities? 2c % with outcome achieved 58.8% 57.0% 58.5%
2d Number with need 1383 8504 88738
2d % with need 58.3% 47.3% 50.8%
2d (i) Number with outcome achieved 1218 7353 76921
2d (i) % with outcome achieved 88.1% 86.5% 86.7%
2d (ii) Number with outcome achieved 856 5179 50480
2d) Did the client need support to establish contact with external services /groups /friends /family? If yes: (i) Has the client established contact with external services /groups? (ii) Has the client established contact with friends/family?
2d (ii) % with outcome achieved 61.9% 60.9% 56.9%
Be Healthy
3a Number with need 900 6440 64448
3a % with need 37.9% 35.9% 36.9%
3a Number with outcome achieved 747 5331 52723
3a) Did the client need support to better manage their physical health? If yes, is the client managing their physical health better?
3a % with outcome achieved 83.0% 82.8% 81.8%
3b Number with need 740 5038 57658
3b % with need 31.2% 28.1% 33.0%
3b Number with outcome achieved 560 3906 44040
3b) Did the client need support to better manage their mental health? If yes, is the client managing their mental health better?
3b % with outcome achieved 75.7% 77.5% 76.4%
3c Number with need 586 3791 47593
3c % with need 24.7% 21.1% 27.2%
3c Number with outcome achieved 426 2399 29222
3c) Did the client need support to better manage their substance misuse issues? If yes, is the client managing their substance misuse issues better?
3c % with outcome achieved 72.7% 63.3% 61.4%
3d Number with need 147 1164 11405
3d % with need 6.2% 6.5% 6.5%
3d Number with outcome achieved 136 1033 10300
3d) Is assistive technology / aids and adaptations helping the client to maintain independence? If yes, is the client now able to manage independent living better as a result of the assistive technology/aids and adaptations? 3d % with outcome achieved 92.5% 88.8% 90.3%

75
Stay Safe
4a Number with need 1009 8568 94257
4a % with need 42.5% 47.7% 54.0%
4a Number with outcome achieved 832 6484 70388
4a) Did the client need support to maintain their accommodation and avoid eviction? If yes, has the client maintained their accommodation?
4a % with outcome achieved 82.5% 75.7% 74.7%
4b Number with need 260 2026 23544
4b % with need 11.0% 11.3% 13.5%
4b Number with outcome achieved 204 1548 17717
4b) Did the client need support to comply with statutory orders and related processes in relation to offending behaviour? If yes, has the client complied with their statutory orders/related processes? 4b % with outcome achieved 78.5% 76.4% 75.3%
4c(i) Number with need 169 1254 14581
4c(i) % with need 7.1% 7.0% 8.4%
4c(i) Number with outcome achieved 122 974 11474
4c(i) % with outcome achieved 72.2% 77.7% 78.7%
4c(ii) Number with need 205 1136 13349
4c(ii) % with need 8.6% 6.3% 7.6%
4c(ii) Number with outcome achieved 149 841 9619
4c(ii) % with outcome achieved 72.7% 74.0% 72.1%
4c(iii) Number with need 706 4035 36612
4c(iii) % with need 29.8% 22.5% 21.0%
4c(iii) Number with outcome achieved 556 3313 30328
4c) (i) Did the client need support to better manage self harm? If yes, is the client better managing self harm? (ii) Did the client need support to avoid causing harm to others? If yes, has the client avoided harm to others? (iii) Did the client need support to minimise harm / risk of harm from others? If yes, is the client minimising the harm/ risk of harm from others?
4c(iii) % with outcome achieved 78.8% 82.1% 82.8%
Making a positive contribution
5 Number with need 1677 10384 104705
5 % with need 70.7% 57.8% 59.9%
5 Number with outcome achieved 1432 9034 89894
5) Did the client need support in developing confidence and ability to have greater choice and / or control and / or involvement?
5 % with outcome achieved 85.4% 87.0% 85.9%

76
Appendix 4 – Consultation Feedback Report ** To be added **
Appendix 5 – Housing Support Financial Plan 2011- 15 ** To be added **
Appendix 6 – Equality Impact Assessment ** To be added **