how are landlords faring during the covid-19 pandemic?
TRANSCRIPT

How Are Landlords Faring During the COVID-19 Pandemic?AUGUST 2021 | ELIJAH DE LA CAMPA, V INCENT J. REINA,
CHRISTOPHER HERBERT

1
Joint Center for Housing Studies Harvard University
How Are Landlords Faring During the COVID-19 Pandemic? Evidence from a National Cross-Site Survey
Elijah de la Campa Bloomberg Harvard City Leadership Initiative
Research Affiliate, The Joint Center for Housing Studies of Harvard University
Vincent J. Reina The Housing Initiative at Penn, University of Pennsylvania
Christopher Herbert
The Joint Center for Housing Studies of Harvard University
August 2021 ©2021 President and Fellows of Harvard College. The Housing Crisis Research Collaborative aims to address the longstanding inequities in access to safe, stable, and affordable rental housing that have been laid bare by the COVID-19 pandemic. We provide policymakers at all levels of government with the data and analysis they need to design, implement, and evaluate more equitable and effective rental housing and community development responses to pandemic and the ongoing rental housing affordability crisis. For more visit: www.housingcrisisresearch.org. The Housing Crisis Research Collaborative is supported by JPMorgan Chase & Co. and the Wells Fargo Foundation, and managed by the Urban Institute. We are grateful to them for allowing the Collaborative to advance its goals. The Annie E. Casey Foundation generously supported this research through the Housing Initiative at Penn. We thank them for their support but acknowledge that the findings and conclusions presented in this paper are those of the authors alone, and do not necessarily reflect the opinions of these funders. Any opinions expressed in this paper are those of the author(s) and not those of the Joint Center for Housing Studies of Harvard University, The Housing Initiative at Penn, or of any of the persons or organizations providing support to them. For more information on the Joint Center for Housing Studies, visit our website at www.jchs.harvard.edu. For more information on the Housing Initiative at Penn, visit www.housinginitiative.org.

2
Summary
This paper uses a survey of over 2,500 rental property owners in ten cities across the United States to determine the impact of the COVID-19 pandemic on landlords’ rent collection and business behavior. Below are several key findings:
1) Yearly rent collection was down significantly in 2020 relative to 2019—both within and across rental markets—and an increasing number of owners have a large share of their portfolio behind on rent.
a. The share of landlords collecting 90 percent or more of yearly rent fell 30 percent from 2019 to 2020.
b. Ten percent of all landlords collected less than half of their yearly rent in 2020, with smaller landlords (1-5 units) most likely to have tenants deeply behind on rental payments.
c. While instances of severe non-payment grew the most for mid-sized owners, small owners had the highest exposure to deep tenant arrears because they were more likely to face this challenge prior to the pandemic.
d. In each of the study cities, we observe three- to fourfold increases in the proportion of landlords owed 10 percent or more of charged rent by 2020’s end.
e. A larger share of landlords in the coastal cities of our sample reported being owed 50 percent or more of charged 2020 rent.
2) Owners of all sizes adjusted their practices during the pandemic, with dramatic increases in the share of landlords granting tenants rent extensions or forgiving back rent.
a. The share of all landlords granting rental extensions and forgiving back rent increased in 2020 relative to 2019 (15 to 48 percent and 3 to 21 percent, respectively).
b. These findings cannot be fully explained by decreased 2020 rental collection, indicating the pandemic affected landlord behavior above and beyond its impact on tenants’ ability to make rent.
c. Larger landlords exhibited the most adaptability in managing their rental business in 2020, which likely reflects the more proactive role they took in managing their business prior to the pandemic.
3) Many owners also deferred maintenance to their properties, and those facing challenges around non-payment were more likely to list their properties for sale.
a. The share of landlords deferring maintenance and listing their properties for sale also increased in 2020 (5 to 31 percent and 3 to 13 percent, respectively), both of which have implications for long-term rental market stability and affordability.
4) Renters of color have disproportionately borne the negative impact of landlord decisions during the COVID-19 pandemic.
a. Rental properties in communities of color were more likely to be moderately and severely behind on rent in 2020.
b. Conditional on these rental payment rates, landlords were more likely to take punitive actions against these tenants in the form of late rental fees, evictions, and lack of rental forgiveness.
Combined, these findings highlight the strain the pandemic has placed on the housing stock, which has implications for the long-term viability and affordability of many of these units. More concerningly, our results show that households of color—which have been disproportionately affected by the pandemic in other domains—have been more likely to face punitive action from landlords, suggesting the pandemic has only exacerbated existing racial inequality in housing markets.

3
Acknowledgements
We are indebted to our partners in the City of Akron Mayor’s Office and Office of Integrated Development; City of Albany Department of Buildings and Regulatory Compliance; City of Indianapolis Mayor’s Office; City of Los Angeles Mayor’s Office and Department of Housing and Community Investment Department; City of Minneapolis Department of Regulatory Services; City of Philadelphia Department of Planning and Development; City of Racine Mayor’s Office and Department of Management Information Systems; City of Rochester Department of Neighborhood and Business Development; and City of Trenton Mayor’s Office and Department of Housing and Economic Development for their support and promotion of this work. We are also grateful to Kate Bischoff, Andrew Kieve, Bolek Kurowski, and Glen Nuckols from Tolemi for providing feedback on early iterations of the survey, assisting with data access, and assisting with survey coding. Jessica Creighton, Tanya Dall, and Sydney Goldstein provided excellent project management. Eleanor Dickens, Raheem Hanifa, and Ashley Marcoux provided exceptional research assistance. Corinna Anderson and Eric Idsvoog provided outstanding editing support. Andrew Bacher-Hicks, Jorrit de Jong, Nat Decker, Ingrid Gould Ellen, Emma Foley, Austin Harrison, Reed Jordan, Monique King-Viehland, Elizabeth Kneebone, David Luberoff, Alan Mallach, Kathy O’Regan, Snapper Poche, and Rebecca Yae provided many useful comments throughout survey and report development, as did members of the Rental Research Community of Practice. The findings and conclusions presented in this paper are those of the authors alone.

4
Introduction
The COVID-19 pandemic has had a profound impact on US renter households’ ability to make rent.
According to the Census Bureau’s Household Pulse Survey, nearly one in five US renter households were
behind on rent by late December 2020 (Airgood-Obrycki et al. 2021), fueling a rent arrears crisis estimated
to range between $7 billion (Reed & Divringi 2020) and $57 billion (Parrot & Zandi 2021).
Yet less is known about how rental property owners have responded to and are managing this
financial strain. While there have been several efforts to understand the pandemic’s impact on landlords,
they have typically been limited to specific contexts (Reina & Goldstein 2021; de la Campa 2021) or
focused on certain segments of the landlord population (Decker 2021b; National Multifamily Housing
Council 2020; Choi & Goodman 2020). Given preexisting variation in the strength of US rental markets
(e.g., JCHS 2020) and business practices of different property owners (e.g., Choi & Young 2020), it remains
uncertain whether these findings generalize to other settings and among more diverse groups of landlords.
This working paper describes the results of a survey of landlords in ten cities across the US,
conducted by researchers from the Bloomberg Harvard City Leadership Initiative, the Harvard Joint Center
for Housing Studies, and the Housing Initiative at Penn. From February to April 2021, we asked rental
property owners to assess the financial health of their pre- and post-COVID rental business.1 We also asked
landlords about the tools they have relied on to manage their rental properties during these two time periods.
Over 2,500 landlords shared information about their rental property portfolios, as well as about individual
rental properties in their portfolio.
We find that landlords’ yearly rent collection was down significantly in 2020 relative to 2019. The
share of landlords who collected 90 percent or more of their charged, yearly rent fell 30 percent from 2019
to 2020 (89 to 62 percent). For a set of landlords, the pandemic has severely limited the amount they collect
in rent: 9 percent of landlords received less than half of their yearly rent in 2020. Correspondingly, landlords
have modified their business practices during the pandemic. The shares of landlords who reported granting
rental extensions and deferring property maintenance—the two most common steps landlords took to
manage their portfolios in 2020—increased from 15 to 48 and from 5 to 31 percent, respectively. Other
actions that were relatively uncommon prior to the pandemic, such as forgiving a portion of back rent and
decreasing monthly rents, were reported by roughly one-fifth of landlords in 2020. And finally, despite
local and federal eviction moratoria and decreased rent collection, an equal share of landlords indicated
they began eviction proceedings against at least one tenant in both 2019 and 2020 (15 percent). An analysis
of the relationship between landlords’ pre- and post-COVID rent collection and business practices shows
1 Throughout this paper, we will use the term “pre-COVID” to refer to the 2019 calendar year, while “post-COVID” will refer to the 2020 calendar year. Similarly, “pre-pandemic” will refer to 2019, while “during the pandemic” will refer to 2020.
5
that decreased rental revenue alone cannot fully explain the change to landlords’ business practices:
increases to deferred property maintenance and sale listings, in particular, are only partially due to
challenges around rental payment.
In an analysis of rental market heterogeneity, we find consistent three- to fourfold increases in the
proportion of landlords owed 10 percent or more of charged rent by year’s end across all cities. However,
we also find more substantial increases in the share of landlords owed 50 percent or more of charged rent
for the East and West Coast cities of our sample compared to the non-coastal ones. This difference may be
due to the pandemic having a particularly devastating impact on the economies of our sample’s coastal
cities (Chetty et al. 2020), and to renters in these cities being more likely to be cost-burdened prior to the
pandemic (JCHS 2019).
While variation in cities’ mean rental collection rates appears to be the primary driver of cross-city
differences in landlords’ tendency to grant rental extensions, this is not true for all business practices.
Conditional on landlords’ rent received, the shares of landlords pursuing rental fees and evictions in 2020
fell on average by 10.8 and 12.6 percentage points, respectively, across the cities in our sample, while the
share deferring maintenance increased by 11.7 percentage points. Finally, though rental losses were
unrelated to the rate at which landlords listed properties for sale prior to the pandemic, in 2020, we observe
a robust, positive relationship between city-level rental non-payment and property sale listings. Combined,
these actions raise concerns about the potential impacts of the pandemic – and owner responses to it – on
the housing stock and longer-term housing affordability.
We also find that landlords of all sizes struggled to collect rent in 2020. In fact, exposure to rental
non-payment increased more significantly for mid-sized (6-19 units owned) and larger landlords (20+ units
owned) than for smaller ones (1-5 units owned), a disparity which may reflect the fact that, as the number
of rental units in one’s portfolio increases, so too does the chance of at least one unit falling behind on rent.
However, 10 percent of small and 8 percent of mid-sized landlords reported being owed 50 percent or more
of charged rent by 2020’s end compared to only 3 percent of larger landlords, leading us to conclude that,
while rent arrears were up for landlords of all sizes in 2020, small and mid-sized landlords were operating
under more dire financial conditions relative to larger ones. Despite these differences, we also find that
during the pandemic larger landlords were more adaptable in their business practices, leading to relatively
higher rates of rental extensions, deferred maintenance, and property sale listings among this group.
Our study shows that rental non-payment was up disproportionately at rental properties in lower-
income neighborhoods and in communities in which a majority of residents are people of color. In 2020,
roughly 40 percent of properties in lower-income neighborhoods had rent shortfalls of 10 percent or more
compared to roughly 30 percent of properties in higher-income ones, with effects of a similar magnitude
observed in majority versus non-majority resident of color communities. The financial strain experienced

6
by renters in communities of color, in particular, has likely been exacerbated by landlords’ tendency to
pursue business practices in these communities that increase housing instability. For example, properties
located in neighborhoods with a higher share of residents of color were significantly less likely to have
tenants experiencing rental forgiveness, and significantly more likely to have tenants facing rental late fees
or eviction.2 Taken as a whole, these findings provide evidence that renters of color have disproportionately
borne the negative impacts of landlord decisions during the COVID-19 pandemic.
This paper makes several contributions. First, we add to an emerging though somewhat disjointed
literature that explores COVID’s impact on renters, property owners, and rental markets. For example,
Parrot and Zandi (2021) rely on US Census Pulse data to provide a critical estimate of the magnitude of the
national rent arrears crisis, but due to the nature of these data, the authors are unable to explore local
variation in rental non-payment or impacts among landlords. On the other hand, several notable studies
have focused on single cities to provide important context to owners’ exposure to losses and responses to
the pandemic, but these results cannot necessarily be generalized across other markets (Reina et al. 2020;
Reina & Goldstein 2021).3 Our study builds on this work by employing an original survey across multiple
cities to explicitly estimate the impact of COVID-19 on landlords and rental markets and explore variation
therein. Crucially, we put this information together to show that the pandemic has led to consistent year-
over-year declines in rental payment across markets, that these changes have corresponded to changes in
landlords’ business practices, and that the pandemic has also altered the degree to which landlords have
pursued certain actions at their properties and for tenants (holding constant rental collection rates).
Second, this paper provides insight into the different conditions under which smaller- and larger-
scale landlords operate. While it is well documented that, prior to the pandemic, there were significant
differences between these types of investors—from the properties they own (e.g., Immergluck & Law
2014), to their rent-setting policies (e.g., Decker 2021a), to their individual demographics (e.g., Choi &
Young 2020)—few studies have been able to examine the relative differences in the rental business
practices of these populations in a single, unified context.4 During the pandemic, research on these
populations has been similarly disjointed, with data from the National Multifamily Housing Council (2020)
suggesting that rental payments have been down only slightly for large, institutional investors, and national
2 For example, moving from a property located in a neighborhood at the 25th percentile of a city’s resident of color distribution to one located in a 75th percentile neighborhood is associated with a 20 percent decrease in landlords’ property-level rental forgiveness rate, a 30 percent increase in their property-level late rent fee incidence rate, and a 40 percent increase in their property-level eviction rate. 3 Other studies have more explicitly estimated the value of tenant and landlord rental assistance need in specific markets, but these studies have relied on secondary data sources to approximate these findings (Kneebone and Murray 2020; Kneebone and Reid 2020). 4 A notable exception is the work of Raymond et al. (2017) in Fulton County, Georgia. Using parcel-level eviction records, the authors show that corporate landlords are more likely than small landlords to file for tenant eviction, conditional on property and neighborhood characteristics.

7
survey data focused on smaller-scale landlords suggesting this population has struggled significantly with
rent collection (Decker 2021b; Choi & Goodman 2020). Additional work in Albany and Rochester, New
York has shown that mom-and-pop landlords, through their responses to the pandemic, have likely
exacerbated existing housing inequalities in communities of color, though it is uncertain whether the same
holds true for larger landlords (de la Campa 2021). Our survey, offered to thousands of landlords of all
sizes across ten rental markets, unifies these disparate strands of research and highlights small landlords as
a group that—compared to larger landlords—generally take a less active approach in managing their
properties despite greater exposure to rental non-payment.
Finally, this paper provides additional evidence of the pandemic’s outsized impact on Americans
of color (and to a lesser extent, low-income Americans). These findings add to a literature that documents
a long history of discrimination in the rental housing market for Black and Hispanic Americans (Hanson &
Hawley 2011; Reina, Pritchett, & Wachter 2020; Hepburn, Louis, & Desmond 2020), and highlight the
need for current housing responses to be centered around and proactively promote racial equity (Ellen et al.
2021).
The remainder of this paper proceeds as follows. Section 2 describes the survey implementation
and methodology, Section 3 reviews the key findings for landlords’ rent collection and business practices,
Section 4 explores heterogeneity by property characteristics, and Section 5 concludes.
Survey Implementation
The following section describes the design of the COVID-19 Landlord Survey; when, where, and how it
was implemented; and the characteristics of respondents.
Survey Design and Setting The COVID-19 Landlord Survey is an extension of two prior survey efforts designed by members of the
research team: one targeted owners of three or fewer rental properties in Albany and Rochester, New York
and was distributed in June and October 2020 (de la Campa 2021), while the other was offered to landlords
in Philadelphia (September 2020) and Los Angeles (December 2020) who had at least one tenant apply for
pandemic-related emergency rental assistance (Reina et al. 2020; Reina & Goldstein 2021).
Both efforts offered insight into the pandemic’s impact on landlords’ rental business, but they were
also limited in scope. Accordingly, in December 2020, the research team began reaching out to cities and
counties across the US to participate in a larger survey designed to explore the pandemic’s impact across
different types of rental markets, landlords, and properties. Municipalities were recruited through the
Bloomberg Harvard City Leadership Initiative network, as well as through ongoing rent-relief evaluations

8
being conducted by the Housing Initiative at Penn, and were asked to partner with the research team by
sharing landlords’ contact information and facilitating outreach.5 Conversations with municipalities that
maintained significant contact information for landlords—specifically, mobile phone number or email—
were prioritized. Overall, the research team had conversations with nearly forty US cities and counties and
partnered with ten cities to implement the COVID-19 Landlord Survey: Akron, Ohio; Albany and
Rochester, New York; Indianapolis, Indiana; Los Angeles, California; Minneapolis, Minnesota;
Philadelphia, Pennsylvania; Racine, Wisconsin; San Jose, California; and Trenton, New Jersey.6
While these municipalities were chosen with an eye towards achieving geographic spread, we
caution that our sample is not necessarily representative of all cities in the US.7 Nonetheless, our sample of
survey cities resembles the universe of US cities along several dimensions. Table 1 reports descriptive
statistics for residents and renter households of the pooled survey sample cities as well as the population of
all US cities.8 Data come from the 2018 ACS 5-year sample, with means and medians calculated from
pooled population totals (across all cities within each sample).
The median age of residents across the cities in our sample is identical to that of residents in US
cities as a whole (34.9). Just over half of all households in both survey and US cities are renter-occupied.
The distribution of rental properties is also similar across the two groups, though survey cities have a
slightly higher share of large apartment buildings (32.3 percent of rental units are located in 20+ unit
buildings in survey cities compared to 27.2 percent in US cities as whole). The median income of renter
households is also similar across the two groups ($38,577 vs. $36,691), as is the share of cost-burdened
renters, defined as those who spend 30 percent or more of their income on rent (53.8 vs. 48.7.6 percent).
There are also some key differences. Relative to US cities, survey cities are, on average, less white
(34.7 vs. 48.1 percent) and more Hispanic (31.9 vs. 23.2 percent). The rental housing stock in survey cities
is slightly older than that of US cities overall (built 65 vs. 54 years ago), and median rents are slightly higher
($1,186 vs. $1,027). Overall, 1.7 million of the nation’s 21.8 million city-based rental units are located in
the ten cities in our survey sample.
5 The Bloomberg Harvard City Leadership Initiative conducts research on the use of data and evidence in city government and leads trainings for mayors and city leaders in how to use data to make more equitable, effective, and efficient decisions. 6 The two most common reasons cities did not participate are that they did not maintain sufficient landlord contact data and/or did not have internal capacity to collaborate. 7 Notably, we were not able to secure the participation of any Southern US cities. 8 Appendix Table 1 presents these descriptive statistics separately for each city in the survey sample.
9
Outreach, Response, and Respondents In eight of the ten sample cities, we obtained landlord contact information from rental dwelling registries.
In general, these registries exist to ensure safe living conditions for renters, and they typically require
owners of residential properties with rental dwelling units to obtain a permit and pass an interior inspection
before units can be legally leased to tenants.9 In San Jose, only owners of properties built before 1979 that
contain three or more rental units are required to register.10 These older and larger rental buildings tend to
be located in lower-income areas of the city, leading to a San Jose sample that has a disproportionate number
of landlords who operate at the lower end of the rental market (though these landlords may also own
properties in higher-income areas of the city). Compliance rates on rental registries vary from a low of
around 10 percent in Indianapolis, to upwards of 70 percent in Trenton, to nearly 95 percent for San Jose’s
more limited registry.11
Landlord contact information for the remaining two cities—Los Angeles and Philadelphia—was
obtained from emergency rental assistance (ERA) applications. In each city, it was incumbent upon tenants
to apply for ERA, meaning the owners represented in this sample did not actively select into the process
for receiving funds. Previous research finds that these properties include many landlords who are not
traditionally engaged in ownership or trade organizations and/or any federal or local housing assistance
programs (Reina & Goldstein 2021; Reina et al. 2020).
We distributed the COVID-19 Landlord Survey on a rolling basis across all sites from February
through April 2021. In each city, every landlord for which contact information was obtained was invited—
either via email or text message—to participate in the online survey. Table 2 shows response rates for each
city. Overall, we sent out nearly 58,000 survey invites and received 2,930 partial or complete responses for
9 Typically, owners must pay a small fee to register their rental properties with their city, which covers the cost of a housing habitability inspection. For example, the rental inspection fee in Albany, New York is $50 per rental property unit. Examples of common inspection criteria include working smoke and carbon monoxide detectors; open means of egress; clean, running water; and basic unit security. Owners who fail their initial inspection must remedy any habitability issues and then pass a re-inspection. In most municipalities, though owners are subject to monetary penalties for lapsed rental registrations, they are often given the opportunity to rectify the situation prior to the issuance of fees. 10 These types of properties represent 8.2 percent of all San Jose rental properties, while the units therein represent 35.4 percent of all San Jose rental units. 11 While we cannot adequately explore landlord characteristics for registry compliers and non-compliers, we can explore the characteristics of rental properties by registry compliance status (Appendix Table 2). Properties in compliance with the rental registry tend to be older, have more units, and are more likely to be owned by a landlord registered as a limited liability corporation or partnership. They also tend to have lower per-unit property values and have slightly less residential area. Rental registry properties tend to be located in neighborhoods with a higher share of residents of color, though we do not observe any meaningful differences across compliance status in neighborhood median household income or gross rent. Note that landlords with properties in compliance with their city’s rental registry may also own properties not in compliance. Unfortunately, our survey is not equipped to explore this issue.
10
an average response rate of 5.1 percent. This response rate ranged from a low of 1.4 percent in Los Angeles
to a high of 9.3 percent in San Jose.
The survey was designed to collect information at two levels: for the landlord’s entire city-specific
portfolio, and for an individual property representative of the landlord’s portfolio.12 For each level, we
asked landlords about their pre- and post-COVID rental income, as well as the various actions they have
taken to manage their rental business. The survey also asked for basic demographics on the landlord,
including race, age, and percent of income derived from their rental business. We also asked landlords
general questions about their rental business, such as whether they rely on a property manager or have
tenants who use Housing Choice Vouchers (also referred to as Section 8).
In Table 3, we present descriptive statistics for survey respondents. 61.4 percent of respondent
landlords are male. Two-thirds are white, 11.5 percent are Black, 6.3 percent are Hispanic, and 8.6 percent
are Asian. Nearly 40 percent of respondents are over the age of 60, the most common age range represented
in the survey. 12.4 percent of owners own at least one property as a limited liability corporation (LLC) or
partnership (LLP/LP), which is typically considered a proxy for non-individual investors. One-fifth of
landlords have at least one tenant who uses Section 8, and 27.7 percent rely on a property manager at some
or all their properties.
Survey respondents manage a variety of rental property types. Fifty percent own at least one single-
family home (attached or detached), and 50 percent own at least one two- to four-family home.13 An
additional 22 percent own apartment buildings of any type, with 12.4 percent owning 5-9 unit buildings,
5.1 percent owning 10-19 unit buildings, and 4.5 percent owning 20+ unit buildings. Finally, 7 percent of
landlords own condominium rental units. With a high share of respondents owning one- to four-unit rental
properties, nearly two-thirds of landlords manage a total of 1-5 rental units; an equal share of the remainder
own 6-19 or 20+ units. Appendix Table 3 shows there is considerable variation in these demographics
across cities, though most of the landlords that responded to our survey tend to be male, over the age of 50,
disproportionately white compared to the racial composition of their city, and own fewer than 20 rental
units.14
12 Specifically, landlords were instructed to choose a property whose profitability prior to the pandemic was typical of their portfolio’s pre-pandemic profitability. Asking questions at the rental property level allows us to explore variation according to property and neighborhood characteristics. 13 Landlords could select multiple types of rental properties owned. Thus, results will not sum to 100. 14 In each city, with the exception of Los Angeles and San Jose, over 60 percent of landlords own five or fewer rental units.
11
The Impact of the Pandemic on Landlords’ Rental Business
We now explore the impact of the pandemic on landlords’ rental business in 2020 and investigate the steps
landlords have taken in response to pandemic-induced financial uncertainty.
Landlords’ rent collection decreased significantly in 2020 Figure 1 reports the overall impact of the pandemic on landlords’ rental collection rates. Landlords were
asked to report their rental collections for both 2019 and 2020 as a percentage of total rent charged (across
their portfolio), and separated into four categories: 100, 90 to 99, 50 to 89, and less than 50 percent of yearly
rent received.
Prior to the pandemic, the vast majority (88.9 percent) of landlords reported collecting 90 percent
or more of their charged yearly rent.15 In 2020, this share fell by nearly a third, to just over 60 percent,
while the share reporting collection of 50 to 89 percent of rent rose from 8.2 percent in 2019 to 28.6 percent
in 2020. We also see a substantial share of landlords experiencing serious financial strain during the
pandemic, with the share of landlords collecting less than 50 percent of charged rent by year’s end
increasing from 2.9 percent in 2019 to 9.1 percent in 2020.
Given that the Los Angeles and Philadelphia survey participants had at least one tenant who applied
for local ERA, we may be concerned that this selection is mechanically biasing downwards our results for
rent collection (in 2020 in particular). We offer several pieces of evidence to suggest this is not the case.
First, Appendix Figure 1 presents a version of Figure 1 that excludes both Los Angeles and Philadelphia
from the sample; rental payment rates for both 2019 and 2020 are nearly identical when including or
excluding these cities from the analysis. Second, despite higher rates of tenant ERA participation in these
cities (roughly 60 percent), nearly one-quarter of landlords in the other cities sampled based on rental
registries also indicated they had tenants who participated in ERA during the pandemic.16 Finally, in
Appendix Figure 2, we present rental collection results solely among landlords with at least one tenant
participating in emergency rental assistance, separately for the ERA cities of Los Angeles and Philadelphia
(Panel A) and the rental registry cities (Panel B). While we observe modest pre-pandemic variation in the
share of landlords collecting 100 vs. 90-99 percent of rental revenue, findings are qualitatively similar
15 A lack of data on landlords’ pre-pandemic rental collection makes it difficult to contextualize this figure, though our results generally align with those from two prior survey efforts. First, pre-pandemic rental payment data from the National Multifamily Housing Council (2020) show that around 95 percent of units pay rent in full by the end of an average month. Though slightly higher than our estimates, these figures are derived from units owned by large, professionally managed landlord organizations, which are more likely to be higher-income relative to the units in our sample. Second, the pre-pandemic share of landlords reporting 90 percent of more of rent received in our study is nearly identical to that reported by a large survey of landlords in Los Angeles (Reina & Goldstein 2021). 16 Note that even though all Los Angeles and Philadelphia landlords had at least one tenant apply for local ERA, this need not imply that the tenant participated in the program and/or received funds.

12
across the two samples. Moreover, in 2020, landlords’ mean collection rates by rental revenue category are
virtually identical in ERA and rental registry cities. Thus, we conclude that differences among the ERA and
rental registry samples are not substantially biasing our results for landlords’ rental collection.
Landlords have changed their business practices during the pandemic In Figure 2, we explore year-over-year changes in landlords’ rent collection, tenant, and ownership policies.
We present results for 2019 in dark gray and 2020 in light gray. Landlord responses are shown on the x-
axis, while the percent of landlords who reported taking these actions is displayed on the y-axis. Results
will not sum to 1 because landlords could report taking multiple steps to manage their rental property
portfolio.
Overall, the pandemic has led to a sharp increase in certain types of actions and a decrease in
others.17 For example, 15 percent of landlords reported granting rental extensions to at least one of their
tenants prior to the pandemic—in the pool of nine actions, this was the third most common that landlords
reported taking in 2019. In 2020, nearly 50 percent of landlords reporting taking this action, making it by
far landlords’ most common practice during the pandemic. At the same time, while charging tenants late
rent fees and increasing rents were the two most common actions reported by landlords prior to the
pandemic (23 and 30 percent, respectively), during the pandemic, the prevalence of these actions fell by 12
and 9 percentage points, respectively. The decline in rental fees is particularly noteworthy given the lower
amount of rent, on average, collected during the pandemic.18
Some landlord practices that were relatively uncommon prior to the pandemic became widespread
in 2020. Around one-fifth of landlords reported forgiving outstanding rent and decreasing rents, compared
to 3 and 4 percent, respectively, in 2019. We also observe a 15 percentage point increase in the share of
landlords who reported missing at least one mortgage, utility, and/or property tax payment in 2020, as well
as a 10 percentage point increase in the proportion of landlords who listed a property for sale at some point
during the year. And perhaps most strikingly, while only 5 percent of landlords reported delaying property
repairs in 2019, 31 percent reported deferring maintenance in 2020, a sixfold increase.
Despite declining rental collection, the share of landlords who brought eviction proceedings against
at least one tenant is nearly identical for both 2019 and 2020 (15 percent). This implies that the eviction
rate conditional on not receiving rent in full was lower in 2020 than in 2019 (23.2 versus 29.4 percent),
which may be a reflection of bans placed on eviction at the local and federal level; indeed, recent research
17 Of course, these actions may be changing precisely because rental collection was down in 2020 relative to 2019. We explore this possibility in further detail in Table 4 below. 18 Part of this decline is almost certainly a reflection of the fact that late fees for past-due rent were prohibited in many of our study cities during the pandemic (Raifman et al. 2020).
13
has estimated 1.5 million evictions were prevented during the pandemic due to these eviction moratoria
(Hepburn et al. 2021). At the same time, it may be surprising that an equivalent share of landlords in 2020
and 2019 indicated that they had brought eviction proceedings against at least one tenant. However, we
offer two potential reasons this may be the case. First, our survey asked landlords about the initiation of
eviction proceedings rather than their conclusion. Second, despite the aforementioned reduction in
evictions, an estimated 1.1 million tenants were evicted in 2020, and it may be the case that landlords who
moved forward with evictions during the pandemic—which were relatively more difficult to execute—are
those more familiar with the eviction system. While our study cannot speak to this phenomenon more
broadly, 45 percent of the landlords in our study who brought eviction proceedings against at least one
tenant in 2020 did so in 2019 as well.19
Decreased rent collection cannot fully explain landlords’ changing rental business practices It may be the case that changing rental business practices during the pandemic are a reflection of landlords’
decreased rental collection, as observed in Figure 1. To further explore this possibility, we estimate the
following OLS regression:
𝑃𝑃𝑃𝑃𝑃𝑃𝑃𝑃𝑃𝑃𝑃𝑃𝑃𝑃𝑒𝑒𝑖𝑖𝑖𝑖𝑖𝑖𝑝𝑝 = 𝛽𝛽0 + 𝛽𝛽1𝑅𝑅𝑒𝑒𝑅𝑅𝑃𝑃𝐿𝐿𝐿𝐿90𝑖𝑖𝑖𝑖𝑖𝑖 + 𝛽𝛽22020𝑖𝑖 + 𝛽𝛽3𝑅𝑅𝑒𝑒𝑅𝑅𝑃𝑃𝐿𝐿𝐿𝐿90𝑖𝑖𝑖𝑖𝑖𝑖 ∗ 2020𝑖𝑖 + 𝛾𝛾𝑖𝑖 + 𝜀𝜀𝑖𝑖𝑖𝑖𝑖𝑖 . (1)
𝑃𝑃𝑃𝑃𝑃𝑃𝑃𝑃𝑃𝑃𝑃𝑃𝑃𝑃𝑒𝑒𝑖𝑖𝑖𝑖𝑖𝑖𝑝𝑝 is an indicator for whether landlord 𝑃𝑃 in city 𝑃𝑃 and year 𝑦𝑦 implemented rental business practice
𝑝𝑝. We estimate Equation (1) separately for each of the nine rental business practices 𝑝𝑝 reported in Figure
2. 𝑅𝑅𝑒𝑒𝑅𝑅𝑃𝑃𝐿𝐿𝐿𝐿90𝑖𝑖𝑖𝑖𝑖𝑖 indicates whether landlord 𝑃𝑃 in city 𝑃𝑃 collected at most 90 percent of their rental revenue
in year 𝑦𝑦, and 2020𝑖𝑖 is an indicator for the 2020 (i.e., post-COVID) time period. We include city fixed
effects (𝛾𝛾𝑖𝑖) to control for the time-invariant characteristics of the cities in our sample.
Table 4 presents results from Equation (1), with heteroskedastic-robust standard errors reported in
parentheses. Coefficient 𝛽𝛽1 captures the relationship, in 2019, between rental non-payment and business
practice 𝑝𝑝. Apart from listing one’s properties for sale, prior to the pandemic, the intensity with which
landlords pursued their rental business practices was highly correlated with yearly rental collection. For
example, column (4) shows that collecting at most 90 percent of 2019 rent was associated with a 12.3
percent decrease in the share of landlords’ increasing tenants’ rents (in that year). Conversely, relative to
collecting 90 percent or more of yearly rental revenue, partial collection is associated with a 13.7 percent
increase in landlords’ eviction initiation rate (column 6).
The coefficient β2 instead reports the effect of the pandemic on landlords’ rental business practices
solely among those who received 90 percent or more of their rental revenue. Even for this group of
19 In general, research for mid-sized US cities shows that, in a given year, a small number of landlords are responsible for the majority of tenant evictions (Rutan and Desmond 2021).

14
landlords, the pandemic has had an impact on nearly every rental business practice, with particularly large
increases (relative to 2019) in the share of landlords granting rent extensions (22.6 percent), forgiving rent
(11.8 percent), and deferring property maintenance (16.4 percent). There have also been steep decreases in
the share of landlords charging late rent fees (14.4 percent), increasing rents (21.5 percent), and evicting
tenants (6.5 percent). Taken together, these findings imply that the observed changes from 2019 to 2020 in
landlords’ business practices were not driven exclusively by decreased rent collection from the pandemic
and likely reflect a variety of other factors including local policies and restrictions (i.e., eviction moratoria),
weakened demand in the rental market, COVID-related limitations on building access, and supply-side
challenges for maintenance and repair.
Finally, the coefficient on the interaction term (β3) sheds light on how the relationship between
rental payment and business practices has changed, if at all, in 2020 (post-COVID) compared to 2019 (pre-
COVID). In addition to shifting the levels of nearly all business practices in 2020, the pandemic has also
intensified the rate at which landlords have taken certain actions in response to partial rent payment. This
is particularly evident for the implementation of rental payment plans. In 2019, collecting at most 90 percent
of rental revenue was associated with an 8.3 percent increase in landlords’ implementation of rental
payment plans; during the pandemic, the strength of that relationship roughly tripled, such that partial
payment was associated with a 31.7 percent increase in this business practice (𝛽𝛽1 + 𝛽𝛽3). The amplification
of this relationship may be a result of the restrictions placed on landlords’ traditional responses to rental
non-payment—such as late fees and evictions—during the pandemic (e.g., Raifman et al. 2020).20 Indeed,
in 2020, there was no significant relationship between partial rental payment and the implementation of late
rent fees, and that between rental payment and evictions was significantly weakened.
Other actions that have been significantly altered during the pandemic are those related to property
ownership, such as missing financial payment obligations, deferring property maintenance, and listing one’s
properties for sale. For example, while there was no statistically significant relationship between rental non-
payment and listing properties for sale in 2019, collecting at most 90 percent of rental revenue in 2020 was
associated with a 12.5 percent increase in the probability of listing one’s property for sale.
The pandemic’s impact has been widespread across rental markets While no region of the US has been spared by the COVID-19 pandemic, there has been significant variation
in the timing and intensity of the crisis (e.g., Shrawder & Aguilar 2020). Accordingly, in Figure 3, we
20 Of course, there may be other reasons this is the case. For example, the pandemic may have caused landlords to develop an increased desire to assist tenants through their financial hardships, thus making rental payment plans a preferred response to rental non-payment.

15
present the share of landlords collecting less than 90 percent of charged rent separately for each city in our
study, for both 2019 and 2020.
We observe considerable heterogeneity across cities in the share of landlords who were owed 10
percent or more of charged rent by the end of 2019—from a low of 6 percent of Minneapolis to a high of
18 percent in Rochester and Trenton. In general, we find that landlords in the Upper Midwestern cities of
Minneapolis and Racine collected the most rent pre-COVID; those in the Industrial Midwestern cities of
Indianapolis and Akron as well as the West Coast cities of San Jose and Los Angeles collected slightly less;
and those in the East Coast cities of Rochester, Albany, Philadelphia, and Trenton collected the least. In
each city, however, we observe a consistent three- to fourfold increase from 2019 to 2020 in the share of
landlords owed 10 percent or more of charged rent. These findings support the notion that the pandemic
has had a significant impact on the rental business of landlords across a variety of rental markets and
political contexts and underscore the importance of looking at relative changes when examining the impact
of COVID-19 on rental markets.21
In Figure 4, we present year-over-year changes in the percent of landlords reporting less than 50
percent of rental revenue received. Once again, a higher share of landlords in the coastal cities of our study
reported facing financial difficulty with their rental properties prior to the pandemic, and the share of
landlords collecting less than 50 percent of charged rent in 2020 was up significantly across all rental
markets. Contrary to Figure 3, however, the year-over-year increase in severe rental non-payment was
steeper in the coastal cities. Two potential explanations for this finding may be because pandemic
unemployment rates were higher in the coastal cities of our sample relative to the Midwestern ones (Chetty
et al. 2020), and renters were more likely to be cost-burdened in these regions prior to the pandemic (JCHS
2019).
Table 5 explores cross-city, cross-year heterogeneity among five key landlord business practices.
Each cell of this table reports the share of landlords in city 𝑃𝑃 (row) pursuing business practice 𝑝𝑝 (column),
for year 𝑦𝑦 (sub-column). Column (1) shows that, prior to the pandemic, a substantial share of landlords in
each city reported granting rental extensions—from a low of around 10 percent in Los Angeles to a high of
nearly 20 percent in Albany. In 2020, these proportions increased by 20 to 50 percentage points (column
2), with the most significant increases concentrated among cities where landlords collected less rent during
the pandemic.22 Columns (3) and (4) show an opposite trend for rental fees: though they were common in
21 For instance, Parrot and Zandi (2021) use the Census Bureau Household Pulse Survey to demonstrate that renters are further behind on rent in West and East Coast urban areas; our results show that, proportionally, renters are behind on rent at relatively consistent rates across the geographic regions in our study. 22 Indeed, it may be the case that decreased rent collection within each city is driving the changes to landlords’ rental extension rates. We explore this possibility in further detail in Table 6 below.
16
all cities prior to the pandemic, landlords in each city reported significantly lower rates of this rental
business practice in 2020.
Results are more mixed for evictions (columns 5 and 6). The proportion of landlords initiating
eviction proceedings fell by several percentage points for half the cities in our sample—specifically, the
West Coast cities of Los Angeles and San Jose and the Midwestern cities of Minneapolis, Racine, and
Akron. At the same time, evictions were up slightly in all East Coast cities and the Midwestern city of
Indianapolis. While this finding, like that for the granting of rental extensions, may in part be explained by
cross-city variation in landlords’ rental collection rates, it may also be a function of the differing intensities
and duration of renter protections for the cities in our sample.23
Fewer than 10 percent of landlords in any of our sample’s cities reported deferring maintenance at
one or more of their rental properties prior to the pandemic (column 7). Yet, in 2020, roughly one-quarter
of Midwestern, one-third of West Coast, and two-fifths of East Coast landlords indicated they had delayed
necessary property upkeep for at least one of their rental properties (column 8). Property sales were even
less common prior to the pandemic (column 9), but this action increased dramatically in 2020 (column 10).
During the pandemic, over 15 percent of landlords in Akron, Albany, Indianapolis, Philadelphia, Rochester,
and Trenton reported listing at least one rental property for sale.
As mentioned above, several of the year-over-year changes to landlords’ business practices are
most striking in cities where declines to rent collection were most severe. At the same time, variation in
local rules, regulations, and politicians’ response to the pandemic (e.g., Raifman et al. 2020) might lead to
an independent impact on landlords’ rental businesses, irrespective of rental payment. To better explore
this issue, in Table 6, we present weighted OLS estimates from a version of Equation (1) collapsed to the
city-year level.24 Estimates from this regression shed light on: 1) the average, pre-pandemic relationship
between city-level rent collection and business practices (𝛽𝛽1), 2) the average impact of the pandemic on
landlords’ rental business practices, conditional on city-level collection rates (𝛽𝛽2), and 3) whether the
pandemic has, on average, altered the relationship between rental collection and business practice
implementation across cities (𝛽𝛽3).
Column (1) of Table 6 shows that, in 2019, a 1-unit increase in the share of landlords collecting at
most 90 percent of rental revenue was associated with a statistically significant 0.58 unit increase, on
23 In general, the cities of our study with stronger eviction moratoria experienced greater reductions in late fees and landlord eviction filing rates, the latter of which aligns with the findings of Hepburn et al. (2021). For example, in Minneapolis, a ban on all phases of the eviction process has been in place since March 2020, whereas in Rochester and Albany, landlords could serve tenants eviction notices from July through December 2020 (Raifman et al. 2020). 24 Specifically, we estimate 𝑃𝑃𝑃𝑃𝑃𝑃𝑃𝑃𝑃𝑃𝑃𝑃𝑃𝑃����������𝑒𝑒𝑖𝑖𝑖𝑖
𝑝𝑝 = 𝛽𝛽0 + 𝛽𝛽1𝑅𝑅𝑒𝑒𝑅𝑅𝑃𝑃𝐿𝐿𝐿𝐿90𝑖𝑖𝑖𝑖���������������� + 𝛽𝛽22020𝑖𝑖 + 𝛽𝛽3𝑅𝑅𝑒𝑒𝑅𝑅𝑃𝑃𝐿𝐿𝐿𝐿90𝑖𝑖𝑖𝑖�������������� ∗ 2020𝑖𝑖 + 𝜀𝜀𝑖𝑖𝑖𝑖 for the five key business practices 𝑝𝑝 reported in Table 5. 𝑃𝑃𝑃𝑃𝑃𝑃𝑃𝑃𝑃𝑃𝑃𝑃𝑃𝑃����������𝑒𝑒𝑖𝑖𝑖𝑖
𝑝𝑝 represents the mean share of landlords pursuing business practice 𝑝𝑝 in city 𝑃𝑃 in year 𝑦𝑦. 𝑅𝑅𝑒𝑒𝑅𝑅𝑃𝑃𝐿𝐿𝐿𝐿90𝑖𝑖𝑖𝑖���������������� represents the mean share of landlords collecting at most 90 percent of rental revenue in city 𝑃𝑃 in year 𝑦𝑦. 2020𝑖𝑖 is a binary indicator for the post-COVID time period.

17
average, in the share of landlords granting rental extensions. If we assume effects are linear throughout the
distribution, this implies a 5.8 percentage point increase in the city-level rental extension rate for a 10
percentage point increase in city-level partial rental revenue collection rate. With coefficients on the
pandemic (i.e., 2020) indicator and interaction term statistically indistinguishable from 0, we thus conclude
that the primary driver of cross-city differences in landlords’ rental extension rates is indeed cross-city
variation in their rental collection rates.
This is not the case when examining the relationship between rent collection and the incidence of
late rent fees (column 2) and tenant evictions (column 3). While we once again observe a strong, positive
relationship in 2019 between a city’s share of landlords who collected at most 90 percent of their rental
revenue and pursued tenant late rent fees and/or evictions, these proportions fell by 10.8 and 12.6 percentage
points, respectively, during the pandemic (holding constant rental collection). We also find suggestive
evidence that the pandemic has attenuated the relationship between rent collection and the pursuance of
evictions. Taken together, these results imply that cross-city variation beyond that observed in rental
collection rates—perhaps arising from different pandemic rules, regulations, and responses across cities,
among other factors—contributed to the observed variation in the issuance of rental fees and tenant
evictions in 2020.
Finally, in columns (4) and (5) we see that the pandemic has altered city-level rates of deferred
property maintenance and rental property sale listings, albeit in slightly different ways. Prior to the
pandemic, there was no robust relationship between landlords’ rental collection and deferred maintenance
rates; though the share of landlords reporting this practice was up significantly during the pandemic, there
remains no significant relationship between citywide rent collection and deferred maintenance in 2020. For
property sales, on the other hand, listings were up more dramatically in 2020 in cities with lower rental
collection rates. These responses in particular raise concerns about the potential impact of the pandemic
on both long-term housing stock quality and affordability.
Smaller and mid-sized landlords are experiencing more significant financial strain while larger landlords are exhibiting greater business adaptability A central question of our study is: how has the impact of the pandemic varied according to the size of a
landlords’ portfolios? While data from the National Multifamily Housing Council (2020) has shown that
rental collection rates during the pandemic have been down 3 to 4 percentage points for large, professionally
managed organizations, others have found substantial declines in rent collection for smaller, mom-and-pop
landlords (Choi & Goodman 2020; de la Campa 2021). Additionally, though two notable studies have
focused on individual markets to provide important context to owners’ exposure to losses and responses to

18
the pandemic (Reina & Goldstein 2021; Reina et al. 2020), there are no studies we are aware of that have
deployed a common survey instrument across multiple cities and multiple types of property owners.
Figure 5 presents year-over-year changes in the proportion of landlords owed 10 percent or more
of charged rent (Panel A) and 50 percent or more of charged rent (Panel B), by the number of rental units
in landlords’ portfolios. Panel A shows that, prior to the pandemic, landlords who own fewer units collected
less of their rental revenue relative to larger ones—12 percent of small (1-5 units) and mid-sized (6-19
units) landlords reported less than 90 percent of rent received in 2019 compared to 7 percent of large (20
or more units) landlords—which may be a reflection of the types of renters and markets these landlords
serve (Choi & Young 2020). However, the year-over-year change in this proportion is monotonically
increasing with landlord portfolio size, with small, mid-sized, and large landlords experiencing increases
of 22, 32, and 43 percentage points, respectively. This finding is likely a reflection of the fact that, as the
number of rental units in one’s portfolio increases, so too does the chance of at least one unit falling behind
on rent.
Prior to the pandemic, smaller and mid-sized landlords were also more likely to be owed 50 percent
or more of charged rent, again likely a reflection of the more vulnerable populations housed by these
owners. However, contrary to the findings in Panel A, the year-over-year change in this proportion was
larger for these groups relative to larger landlords (6 vs. 3 percentage points), leading to significantly higher
rates of severe rental non-payment for smaller and mid-sized landlords in 2020. In particular, one-tenth of
small landlords and one-twelfth of mid-sized landlords were owed 50 percent or more of charged rent by
year’s end compared to fewer than one in twenty large landlords. Though perhaps surprising given that
larger landlords were significantly more likely to be missing 2020 rental payments in general, the
disproportionate impact of severe rental non-payment on small and mid-sized landlords generally supports
the findings of Reina and Goldstein (2021) in Los Angeles.
In Table 7, we compare yearly variation in landlords’ rental business practices according to the size
of their rental property portfolios. Specifically, we present results from an OLS regression of yearly rental
business practices on landlord portfolio size indicators, an indicator for 2020, and the interaction of these
variables. We additionally control for yearly rent collection—to account for the differences by portfolio
size observed in Figure 5—and city fixed effects. For reference, we report the regression constant term,
which represents the share of large landlords reporting this business practice in 2019 (conditional on our
control variables).
The coefficients on the variables Small Landlord and Medium Landlord in column (1) show that,
in 2019, there were no significant differences among small and mid-sized landlords relative to larger ones
in the rate at which tenants were put on rental repayment plans. The coefficient on the variable 2020
indicates that the share of larger landlords pursuing this practice during the pandemic increased by 46.1
19
percentage points (relative to 2019). Finally, the coefficients on the interaction terms show that, for small
and mid-sized landlords, the pandemic is associated with comparatively smaller increases in the rental
extension rate, though the year-over-year change is still positive in absolute value for these two groups.25
Because these results condition on yearly rental collection, the disproportionate increase in the share of
larger landlords’ granting rental extensions in 2020 is not solely a function of these landlords’ higher
likelihood of receiving 90 percent or less of rental revenue.
Column (2) instead shows that, prior to the pandemic, small and mid-sized landlords were
significantly less likely to charge late rent fees relative to larger landlords, with the share of small landlords
pursuing this practice, in particular, less than half that for the largest ones. Though the incidence of this
rental practice fell among all landlords in 2020, smaller and mid-sized landlords experienced smaller
decreases relative to owners of 20+ rental units. Results are similar for evictions (column 3), though relative
to rental fees, the share of landlords of all sizes pursuing tenant evictions in 2020 fell much less
dramatically.
Deferred maintenance was up significantly for all landlords in 2020 (column 4), though increases
were more dramatic for mid-sized and larger landlords relative to smaller ones (29.0 and 25.0 percentage
point increase, respectively, vs. 16.2 percentage point increase). This finding is interesting given that
smaller landlords were more likely to pursue this practice prior to the pandemic. Finally, column (5) shows
that property sale listings were up for all landlords in 2020, though small and mid-sized landlords were
more likely to hold onto their properties: while the share of large landlords listing properties for sale
increased by 17.3 percentage points in 2020, this association was attenuated by 11.4 and 8.1 percentage
points, respectively, for small and mid-sized landlords.
Our analysis shows that, though smaller and mid-sized landlords struggled more with 2020 rent
collection relative to larger landlords, the latter group of owners were more adaptable in their business
practices. This greater adaptability is reflected in both relatively larger increases in the granting of rental
extensions, as well as in relatively larger decreases in the charging of late rent fees for larger owners relative
to smaller ones. In general, these results align with our pre-pandemic findings on the positive correlation
between the intensity with which landlords pursue business practices and their portfolio size. Overall, these
results unify and confirm findings from disparate studies about the financial impact of the pandemic on
both larger and smaller landlords (National Multifamily Housing Council 2020; Choi & Goodman 2020),
while at the same time providing important context to our limited understanding of how landlords—smaller
ones, in particular—have adapted their business practices during the pandemic (de la Campa 2021; Decker
2021b).
25 Specifically, smaller landlords experienced a 19.5 percentage point increase in their rental extension rate during the pandemic (46.1-26.6), while mid-sized landlords experienced a 34.0 percentage point increase (46.1-12.1).
20
The Pandemic’s Impact on Individual Rental Properties and Communities
Because we also asked landlords to report on the pandemic’s impact at a single property in their portfolio,
we can examine heterogeneity according to salient property and neighborhood characteristics. In the
following section, we change the unit of analysis from the landlord to the landlord-owned rental property
and explore whether certain types of properties and communities, if any, were more likely to fall behind on
rent, and how this may have affected landlords’ business management.
Renters in economically and socially vulnerable communities are further behind on rent Emerging research has shown that, across a variety of domains, low-income, Black, and Hispanic
Americans have disproportionately borne the impact of the COVID-19 pandemic. This has been true not
only in terms of exposure to the virus (Reitsma et al. 2021; Zelner et al. 2021) and job loss (Lee, Park, &
Shin 2021), but also in other less obvious contexts, such as access to remote education (Bacher-Hicks,
Goodman, & Mulhern 2021). Studies have also found that these more socially and economically vulnerable
groups were further behind on rent in 2020 compared to higher-income and white Americans (Airgood-
Obrycki et al. 2021).
In Figure 6, we explore yearly changes in property-level rent collection rates separately for
properties in neighborhoods whose median household income falls above or below the citywide median.26
To construct this figure, we first demean the rental payment and above-median neighborhood income
indicators by city, and then add back the mean of each variable to its demeaned value to aid in
interpretability.27 In so doing, we control for inter-city differences in rental payment and neighborhood
racial composition which might affect the pooled analysis of the relationship between these two variables.
In both above- and below-median income neighborhoods, the share of rental properties behind 10
percent or more on rent roughly tripled from 2019 to 2020 (Panel A). However, the proportion of properties
behind on rent in 2020 was significantly larger in lower-income neighborhoods compared to higher-income
ones (38 vs. 28 percent). Correspondingly, Panel B shows that these properties were also more likely to be
behind 50 percent or more on rent by the end of 2020 compared to properties in higher-income communities
(14 vs. 8 percent).
This basic pattern is also observed when examining changes in rental payment rates by a
neighborhood’s share of residents of color, specifically comparing neighborhoods with a majority of
26 To get neighborhood income classifications, we first match each property in our rental property sample to its census block group (CBG). We then use the 2018 ACS to obtain the median household income for that CBG and classify the CBG according to whether its median household income falls above or below the citywide median. We perform this exercise separately for the ten cities in our sample. 27 In practice, this means that the mean rental collection rate for city 𝑃𝑃 is subtracted from each observation for city 𝑃𝑃 (and similarly for the mean above-median neighborhood income share).

21
residents of color with those where white residents are the majority (Figure 7).28 In fact, the share of
properties behind 10 percent or more on rent by the end of 2020 was nearly identical for both majority
resident of color and lower-income neighborhoods, as well as for non-majority resident of color and higher-
income ones. Similarly, properties in communities with more residents of color were more likely to fall
deeply behind on rent, with 14 percent owing 50 percent or more of charged rent in 2020 compared to 9
percent in communities with fewer residents of color.
Figures 6 and 7 show that, while the pandemic had a significant negative impact on overall rent
collection across a variety of communities, properties in lower income and majority resident of color
communities experienced greater struggles in making rent in 2020.
Landlords’ responses to the pandemic may be increasing housing instability in vulnerable communities Prior to the pandemic, low-income, Black, and Hispanic Americans have faced discrimination in the rental
housing market in numerous ways—from housing search (Hanson & Hawley 2011; Fang, Guess, &
Humphreys 2019), to securing affordable housing via Section 8 (Cunningham et al. 2018), to evictions
(Hepburn, Louis, & Desmond 2020). Given this history, a natural question to pose is: how have landlords
managed their rental properties in communities of color and low-income neighborhoods, particularly given
the relatively higher rates of rental non-payment observed in these communities?
In Figure 8, we explore variation in landlords’ 2020 rental business practices according to
neighborhood income. Specifically, we present nine binned scatter plots of landlords’ rental property
business practices (y-axis) versus the natural log of neighborhood median income (x-axis). To construct
these plots, we first demean both landlords’ rental business practices and neighborhood median income by
city and average rent collection. We then divide the observations into 20 equal-sized groups (vigintiles)
based on the natural log of neighborhood median income and plot the share of landlords pursuing the
indicated rental practice within each bin. The solid lines show the best linear fit estimated on the underlying
micro data using OLS regression, and Appendix Table 4 presents these regression estimates.
For certain business practices, such as decreasing rents and listing properties for sale, we observe
no meaningful relationship between the intensity with which landlords pursued these actions and the
neighborhood median income of their rental properties. For others, such as charging late rent fees and
28 A neighborhood’s share of residents of color is defined as the sum of individuals who identify as Black, Hispanic, Asian, Native American, multiracial and/or other races. In practice, due to the cities in our study, communities of color are primarily comprised of Black and Hispanic residents. To get neighborhood racial and ethnic composition classifications, we first match each property in our rental property sample to its census block group (CBG). We then use the 2018 ACS to obtain the mean share of residents of color for that CBG, and classify the CBG according to whether this share is above or below 50 percent. We perform this exercise separately for the 10 cities in our sample.
22
evicting tenants, there appears to be a weak correlation between business practice intensity and
neighborhood income though results are imprecisely estimated and inconclusive. The one exception is for
the rate at which landlords have missed at least one mortgage, property tax, and/or utility payment, which
is strongly and statistically significantly decreasing in neighborhood median income.
Results are starker when examining landlords’ 2020 business practices according to a
neighborhood’s share of non-white residents (Figure 9). In this instance, nearly all of landlords’ practices
are statistically significantly related to the neighborhood racial and ethnic composition of their rental
properties. Typically, properties in communities with more residents of color are more susceptible to
business actions that likely contribute to housing instability. For example, a 1-unit increase in a
neighborhood’s share of residents of color (i.e., moving from a neighborhood with no residents of color to
one with exclusively residents of color) was associated with an 8.3 percentage point reduction in the share
of landlords offering rental forgiveness, 9.0 percentage point reduction in the share decreasing monthly
rents, and a 5.7 percentage point increase in the share charging late rent fees (Appendix Table 4). Put
differently, moving from a neighborhood at the 25th percentile of the city-demeaned resident of color
distribution to one at the 75th percentile is associated with a roughly 25 percent decrease in landlords’ rent
forgiveness rate, 30 percent decrease in their monthly rent decrease rate, and 30 percent increase in their
late fee implementation rate.29 These findings, which indicate relatively greater landlord-induced financial
strain for renters of color, are particularly relevant given the pandemic’s outsized financial impact in these
communities (e.g., Lee, Park, & Shin 2021).
We also observe a disproportionate share of landlords reporting tenant evictions at properties in
communities of color. In this case, moving from the 25th to 75th percentile of the neighborhood resident of
color distribution is associated with a nearly 40 percent increase in the tenant eviction rate. The higher rate
of displacement in these communities aligns with emerging research on the unequal rate at which Black
and Hispanic renters have been evicted during the pandemic (Hepburn et al. 2021; Stein et al. 2021). While
landlords have been more likely to miss financial payments in neighborhoods with more residents of color,
there once again is no meaningful relationship between neighborhood racial composition and deferred
maintenance or property sales.
In sum, landlords’ tendency to pursue business practices differentially according to neighborhood
racial composition, even conditional on rental collection rates, has resulted in tenants in more marginalized
communities—i.e., tenants more likely to be adversely affected by the pandemic in other ways (Bacher-
Hicks, Goodman, and Mulhern 2021; Bambra et al. 2020; Lee, Park, and Shin 2021)—disproportionately
bearing the consequences of rental non-payment. Ultimately, this serves to exacerbate and reinforce the
29 Moving from the 25th to 75th percentile of the city-demeaned resident of color distribution is associated with a 41percentage point change in a neighborhood’s share of residents of color.

23
many historical rental market discriminations facing renters of color (Hanson & Hawley 2011; Cunningham
et al. 2018; Hepburn, Louis, & Desmond 2020).
Conclusion In this paper, we explore the impact of the COVID-19 pandemic on the rental business of landlords in ten
cities across the US. We find that landlords’ rental properties generated a significantly lower share of their
potential rental revenue in 2020 relative to 2019. Despite preexisting, cross-city variation in rental market
strength, we observe proportionate three- to fourfold increases in rental non-payment during the pandemic
for all cities in our sample. Critically, 9 percent of all landlords received less than half of their yearly rent
in 2020. While landlords modified their business practices—such as the granting of rental extensions—in
response to this decrease in rental revenue, business impacts alone cannot explain landlords’ behavioral
responses.
The pandemic also amplified the relationship between rental collection and actions such as rent
forgiveness and deferred property maintenance, perhaps due to constraints in 2020 on landlords’ traditional
responses to rental non-payment, such as late rent fees and evictions (Raifman et al. 2020). This suggests
that many owners modified their practices to recover funds and attempted to cut costs by reducing
investments in their properties. The latter trend raises the possibility of a concerning repercussion, which is
that many properties will need further investment post-pandemic to remain viable, and can have two distinct
negative effects. First, in the short term, it may imply that renters are residing in units of substandard quality,
thus affecting their health and well-being. Second, absent owners finding the means to pay for these deferred
investments, it may result in rental units exiting the housing stock earlier than they previously would have.
For the markets in our study, both outcomes may contract the local housing stock and further exacerbate
housing affordability issues.
Our findings show that small owners had the highest exposure to rental non-payment both prior to
and during the pandemic, but mid-sized owners saw the largest increase in non-payment. These findings
highlight the preexisting financial precarity of small property owners, as well as the tenuous financial
position of mid-sized owners in 2020. Many small and medium-sized owners face challenges accessing
credit to invest in their properties generally, which means that absent concerted efforts to bridge these credit
gaps, owners of these properties will have difficulty restructuring their financing to ensure their property is
viable (Local Housing Solutions 2021).
These challenges are clearly affecting owner behavior, with city-level rental non-payment
positively associated with property sale listings. Such sales could place further strain on the overall stock
of affordable housing, although they also present an opportunity for localities to actively broker the sale

24
and purchase of these properties to ensure their long-term viability. This approach could also serve as an
opportunity for localities to provide subsidy support, with coterminous affordability restrictions, to increase
the affordability of these units. Cities may be well positioned to pursue such a strategy given the
unprecedented federal funds currently being deployed.
Among the many concerning findings in our study is the disproportionate impact of the pandemic
on the renters in and housing stock of communities of color. By showing that owners are more likely to
exercise punitive actions on renters in markets with a majority of residents of color, we demonstrate that
the ways in which owners are engaging with challenges around rental collection are racialized. Numerous
notable works have documented persistent and pernicious racial discrimination in rental housing markets
and investments (e.g., Reina, Pritchett & Wachter 2020), and our findings suggest that these prejudicial
actions have only intensified during the pandemic. Thus, it is essential that cities ensure households of color
are able to access rent relief as well as legal protections and recourse against discriminatory owner behavior.
Further, cities must acknowledge that the ramifications of the pandemic will persist post-pandemic if they
do not connect such targeted responses to longer-term efforts to address racial inequality in housing
markets.
While this study offers robust evidence as to the pandemic’s negative impact on landlords’ rental
collection and their corresponding business practice adaptation, it also has limitations. Our limited sample
size and response rate, coupled with a dearth of information on property owners from national sources,
makes it difficult to assess the representativeness of our respondents relative to all owners in our markets,
as well as the generalizability of our findings to owners nationally. Of the pandemic’s many important
lessons, one is that we still know little about who owns rental properties and how these owners behave.
Thus, the results of our paper are critical to filling this gap but should be considered in concert with other
local and national owner studies.

25
References Airgood-Obrycki, Whitney, Ben Demers, Solomon Greene, Chris Herbert, Alexander Hermann, David
Luberoff, and Sophia Wedeen. 2021. “Renters’ Responses to Financial Stress During the Pandemic.” The Joint Center for Housing Studies of Harvard University. https://www.jchs.harvard.edu/sites/default/files/research/files/harvard_jchs_renter_responses_covid_airgood-obrycki_etal_2021.pdf.
Bacher-Hicks, Andrew, Josh Goodman, and Christine Mulhern. 2021. “Inequality in Household Adaptation
to Schooling Shocks: COVID-Induced Online Learning Engagement in Real Time.” Journal of Public Economics 193, no. 104345 (January).
Bambra, Clare, Ryan Riordan, John Ford, and Fiona Matthews. 2020. "The COVID-19 Pandemic and
Health Inequalities." Journal of Epidemiology and Community Health 74, no. 11: 964–68. Chetty, Raj, John N. Friedman, Nathaniel Hendren, Michael Stepner, and The Opportunity Insights Team.
2020. “The Economic Impacts of COVID-19: Evidence from a New Public Database Built Using Private Sector Data.” National Bureau of Economic Research Working Paper 27431.
Choi, Jung Hyun, and Laurie Goodman. 2020. “Mounting Pressures on Mom and Pop Landlords Could
Spell Trouble for the Affordable Rental Market.” Urban Wire: Housing and Housing Finance (blog). Urban Institute. November 10. https://www.urban.org/urban-wire/mounting-pressures-mom-and-pop-landlords-could-spell-trouble-affordable-rental-market.
Choi, Jung Hyun, and Caitlin Young. 2020. “Owners and Renters of 6.2 Million Units in Small Buildings
Are Particularly Vulnerable during the Pandemic.” Urban Wire: Housing and Housing Finance (blog). Urban Institute. August 10. https://www.urban.org/urban-wire/owners-and-renters-62-million-units-small-buildings-are-particularly-vulnerable-during-pandemic.
Cunningham, Mary, Martha M. Galvez, Claudia Aranda, Robert Santos, Douglas A. Wissoker, Alyse D.
Oneto, Rob Pitingolo, and James Crawford. 2018. “A Pilot Study of Landlord Acceptance of Housing Choice Vouchers.” Washington, DC: US Department of Housing and Urban Development, Office of Policy Development and Research.
Decker, Nathaniel. 2021a. “Affordable Housing Without Public Subsidies: Rent-Setting Practices in
Small Rental Properties.” Journal of the American Planning Association 87, no. 1: 62-72. Decker, Nathaniel. 2021b. “The Uneven Impact of the Pandemic on the Tenants and Owners of Small
Rental Properties.” Terner Center for Housing Innovation, UC Berkeley. July 13. https://ternercenter.berkeley.edu/wp-content/uploads/2021/07/Small-Rental-Properties-Decker-July-2021.pdf.
de la Campa, Elijah. 2021. “The Impact of COVID-19 on Small Landlords: Survey Evidence from
Albany and Rochester, New York.” The Joint Center for Housing Studies of Harvard University. https://www.jchs.harvard.edu/sites/default/files/research/files/harvard_jchs_small_landlord_survey_de_la_campa_2021_0.pdf.
Ellen, Ingrid Gould, Brittany Mazzurco Muscato, Claudia Aiken, Vincent Reina, Andrew Aurand, and
Rebecca Yae. 2021. “Advancing Racial Equity in Emergency Rental Assistance Programs.” NYU
26
Furman Center, Housing Initiative at Penn, and the National Low Income Housing Coalition. https://furmancenter.org/files/Advancing_Racial_Equity_in_Emergency_Rental_Assistance_Programs_-_Final.pdf.
Fang, Albert, Andrew Guess, and Macartan Humphreys. 2019. "Can the Government Deter Discrimination?
Evidence from a Randomized Intervention in New York City." The Journal of Politics 81, no. 1: 127-41.
Hanson, Andrew, and Zackary Hawley. 2011. "Do Landlords Discriminate in the Rental Housing Market?
Evidence from an Internet Field Experiment in US Cities." Journal of Urban Economics 70, no. 2-3: 99-114.
Hepburn, Peter, Renee Louis, and Matthew Desmond. 2020. "Racial and Gender Disparities among Evicted
Americans." Sociological Science 7: 649-62. Hepburn, Peter, Renee Louis, Joe Fish, Emily Lemmerman, Anne Kat Alexander, Timothy A. Thomas,
Robert Koehler, Emily Benfer, and Matthew Desmond. 2021. "US Eviction Filing Patterns in 2020." Socius 7: 1-18.
Immergluck, Dan, and Jonathan Law. 2014. “Investing in Crisis: The Methods, Strategies, and
Expectations of Investors in Single-Family Foreclosed Homes in Distressed Neighborhoods.” Housing Policy Debate 24, no. 3: 568-93.
JCHS (The Joint Center for Housing Studies of Harvard University). 2019. “The State of the Nation’s
Housing.” Harvard University. https://www.jchs.harvard.edu/sites/default/files/reports/files/Harvard_JCHS_State_of_the_Nations_Housing_2019%20%281%29.pdf.
___. 2020. “The State of the Nation’s Housing.” Harvard University.
https://www.jchs.harvard.edu/sites/default/files/reports/files/Harvard_JCHS_The_State_of_the_Nations_Housing_2020_Report_Revised_120720.pdf.
Kneebone, Elizabeth, and Cecile Murray. 2020. “Estimating COVID-19’s Near-Term Impact on Renters.”
Terner Center for Housing Innovation, UC Berkeley. April 24. https://ternercenter.berkeley.edu/blog/estimating-covid-19-impact-renters.
Kneebone, Elizabeth, and Caroline Reid. 2020. “COVID-19 and California’s Vulnerable Renters.” Terner
Center for Housing Innovation, UC Berkeley. August 4, 2020. https://ternercenter.berkeley.edu/research-and-policy/covid-19-and-californias-vulnerable-renters/.
Lee, Sang Yoon Tim, Minsung Park, and Yongseok Shin. 2021. “Hit Harder, Recover Slower? Unequal
Employment Effects of the Covid-19 Shock.” National Bureau of Economic Research Working Paper 28354.
Local Housing Solutions. 2021. “Expanded Access to Capital for Owners of Unsubsidized Affordable
Rental Properties.” LHS Policy Brief. https://localhousingsolutions.org/housing-policy-library/expanded-access-to-capital-for-owners-of-unsubsidized-affordable-rental-properties/.
National Multifamily Housing Council. 2020. “NMHC Rent Payment Tracker.” NMHC.
https://www.nmhc.org/research-insight/nmhc-rent-payment-tracker/.

27
Parrot, Jim, and Mark Zandi. 2021. “Averting an Eviction Crisis.” Urban Institute.
https://www.urban.org/sites/default/files/publication/103532/averting-an-eviction-crisis.pdf. Raifman, Julia, Kristen Nocka, David Jones, Jacob Bor, Sarah Ketchen Lipson, Jonathan Jay, and Philip
Chan. 2020. “COVID-19 US State Policy Database.” Available at www.tinyurl.com/statepolicies. Raymond, Elora, Richard Duckworth, Ben Miller, Michael Lucas, and Shiraj Pokharel. 2016. “Corporate
Landlords, Institutional Investors, and Displacement: Eviction Rates in Single-Family Rentals.” Federal Reserve Bank of Atlanta. Community and Economic Development Discussion Paper 04-16.
Reed, Davin, and Eileen Divringi. 2020. “Household Rental Debt During COVID-19.” Federal Reserve
Bank of Philadelphia. https://www.philadelphiafed.org/-/media/frbp/assets/community-development/reports/household-rental-debt-during-covid-19.pdf
Reina, Vincent, and Sydney Goldstein. 2021. “Ongoing Challenges for Rental Business Owners in the City
of Los Angeles during the COVID-19 Pandemic.” Housing Initiative at Penn. Reina, Vincent, Sydney Goldstein, Emily Dowdall, Ira Goldstein, and Elizabeth De Young. 2020.
“Residential Rental Property Owner Perspectives and Practices in Philadelphia: Evaluating Challenges during the COVID-19 Pandemic.” Housing Initiative at Penn.
Reina, Vincent, Wendell E. Pritchett, and Susan M. Wachter, eds. 2020. Perspectives on Fair
Housing. Philadelphia: University of Pennsylvania Press. Reitsma, Marissa, et al. 2021. “Racial/Ethnic Disparities in COVID-19 Exposure Risk, Testing, and Cases
at the Subcounty Level in California.” Health Affairs 40, no. 6: 870-78. Rutan, Devin Q., and Matthew Desmond. 2021. “The Concentrated Geography of Eviction.” Annals of the
American Academy of Political and Social Science 693, no. 1: 64-81. Shrawder, Kevin, and Ricardo Aguilar. 2020. “Local Area Unemployment Statistics: An Economic
Analysis of COVID-19.” National Association of Counties. https://www.naco.org/resources/featured/local-area-unemployment-statistics-economic-analysis-covid-19.
Stein, Sarah, Victor Haley, Jr., Elora Lee Raymond, Erik Woodworth, and Jessica Dill. 2021. “Special
Briefing: Despite CDC Eviction Moratorium, Atlanta-Area Eviction Filings Hit Low-Income, Minority Neighborhoods.” Federal Reserve Bank of Atlanta.
Zelner, Jon, Rob Trangucci, Ramya Naraharisetti, Alex Cao, Ryan Malosh, Kelly Broen, Nina Masters, and
Paul Delamater. 2021. “Racial Disparities in Coronavirus Disease 2019 (COVID-19) Mortality are Driven by Unequal Infection Risks.” Clinical Infectious Diseases 72, no. 5: e88-e95.

28
Tables and Figures
Table 1: COVID-19 Landlord Survey Cities in Comparison with US Cities
Survey Cities
US Cities
Panel A: Resident Characteristics White 34.7 48.1 Black 18.4 17.7 Hispanic 31.9 23.2 Asian 11.9 7.5 Other race 3.1 3.5 Median age (y) 34.9 34.9 N Residents 8,500,786 114,703,389 Panel B: Renter Household Characteristics Renter-occupied (among all households) 55.0 50.1 Reside in 1-unit property 27.7 27.9 Reside in 2-4 unit property 16.6 19.0 Reside in 5-9 unit property 11.6 12.5 Reside in 10-19 unit property 11.3 12.1 Reside in 20+ unit property 32.3 27.2 Median income ($) 38,577 36,961 Cost-burdened 53.8 48.7 Median gross rent ($) 1,186 1,027 Median age of housing structure (y) 65 54 N Renter Households 1,688,205 21,799,773
Notes: This table reports descriptive characteristics of residents and renter households for the ten, pooled COVID-19 Landlord Survey cities as well as for the universe of all US cities. Data come from the 2018 ACS 5-year sample, with means and medians calculated from pooled population totals (across all cities within each sample). Unless otherwise indicated, the variables above are expressed as percentages. Categorical variables may not sum to 100 due to rounding. Cost-burdened renters are defined as those who spend 30 percent or more of their yearly income on yearly rent.

29
Table 2: COVID-19 Landlord Survey Response Rates Overall Akron Albany Indianapolis Los
Angeles Minneapolis Racine Rochester Philadelphia San Jose Trenton
N Survey Recipients 57,994 3,440 1,971 7,615 18,810 10,540 2,294 2,190 6,156 3,476 1,502
N Survey Respondents 2,930 265 116 462 256 683 174 181 333 323 137
Response Rate 5.1 7.7 5.9 6.1 1.4 6.5 7.6 8.3 5.4 9.3 9.1
Notes: This table reports, both overall and separately for each participating city, the number of survey invites (less outbound bounces), number of survey respondents, and survey response rate to the COVID-19 Landlord Survey. These figures include responses from property managers (N=80) who were not asked questions about rental business profitability or practices as they were routed to the end of the survey; we include these individuals when computing response rates as we do not know how many property managers received the survey invitation but chose not to participate. Respondents were not asked questions about rental business profitability and actions if they indicated they did not own at least one overlapping rental property in 2019. In Albany, Indianapolis, Los Angeles, Minneapolis, Racine, Philadelphia, San Jose, and Trenton, participants were invited to participate in the survey via email. In Akron and Rochester, participants were invited via text message (SMS). Data come from the COVID-19 Landlord Survey.

30
Table 3: Descriptive Statistics of Survey Respondents
N Mean SD
Male 2255 61.4 48.7 Missing gender 2850 20.9 40.7 White 2338 66.3 47.3 Black 2338 11.5 31.9 Hispanic 2338 6.3 24.3 Asian 2338 8.6 28.0 Missing race 2850 18.0 38.4 30–39 years old 2380 14.7 35.5 40–49 years old 2380 17.8 38.3 50–59 years old 2380 25.6 43.6 60+ years old 2380 39.6 48.9 Missing age 2850 16.5 37.1 LLC or LLP/LP owner 2255 12.4 32.9 Missing owner name 2850 20.9 40.7 Uses a property manager 2703 27.7 44.8 Missing property manager 2850 5.2 22.1 Accepts Section 8 2709 20.8 40.6 Missing Section 8 2850 4.9 21.7 Owns single-family home(s) 2536 50.7 50.0 Owns 2-4 family home(s) 2536 50.6 50.0 Owns small apartment building(s) 2536 12.4 32.9 Owns mid-sized apartment building(s) 2536 5.1 22.1 Owns large apartment building(s) 2536 4.5 20.7 Owns condominium unit(s) 2536 7.2 25.9 Missing types of properties owned 2850 1.3 11.5 Owns 1-5 rental units 2803 65.6 47.5 Owns 6-19 rental units 2803 17.2 37.7 Missing number of rental units owned 2850 1.6 12.7
Notes: This table reports descriptive statistics for the COVID-19 Landlord Survey respondents. The variables above are expressed as percentages. The omitted category for race is “Other Race.” The omitted category for age is “20–29 years old.” No respondents reported being less than 20 years old. The omitted category for number of rental units owned is “Owns 20+ rental units.” “Small apartment building” indicates a 5-9 unit building. “Mid-sized” indicates 10 to 19 rental units. “Large” indicates 20+ rental units. Respondents could indicate owning multiple types of properties, and thus, property ownership will not sum to 100. Categorical variables may not sum to 100 due to rounding. Data come from city administrative records and the COVID-19 Landlord Survey.

31
Table 4: Relationship between Rental Collection and Business Practices
Grant Rent Ext.
Forgive Rent
Charge Rent Fee
Inc. Rents
Dec. Rents
Evict Tenants
Miss Payments
Defer Maint.
List Props. for
Sale
(1) (2) (3) (4) (5) (6) (7) (8) (9)
< 90% Rent Received 0.083*** 0.037** 0.064** -0.123*** 0.052*** 0.137*** 0.066*** 0.088*** 0.019
(0.028) (0.016) (0.030) (0.023) (0.015) (0.028) (0.020) (0.022) (0.014)
2020 0.226*** 0.118*** -0.144*** -0.215*** 0.115*** -0.065*** 0.053*** 0.164*** 0.058***
(0.014) (0.010) (0.011) (0.011) (0.009) (0.009) (0.008) (0.011) (0.008)
< 90% Rent Received*2020 0.234*** 0.138*** 0.029 0.102*** 0.057** 0.099*** 0.209*** 0.181*** 0.106***
(0.034) (0.023) (0.033) (0.025) (0.022) (0.032) (0.026) (0.029) (0.021)
N Landlord-Years 4,808 4,808 4,808 4,808 4,808 4,808 4,808 4,808 4,808
Notes: This table reports OLS estimates of the relationship between landlords’ business practices and rental collection, prior to and during the pandemic. Each column presents results from a separate OLS regression, where the indicated business practice is the dependent variable. “Grant Rent Ext.” indicates rental extensions and/or putting tenants on repayment plans. “Forgive Rent” indicates rental forgiveness (either in full or a portion). “Charge Rent Fee” indicates charging fees for late rent. “Inc. Rents” indicates increases to monthly rents. “Dec. Rents” indicates decreases to monthly rents. “Evict Tenants” indicates the commencement of eviction procedures (and potentially, the conclusion). “Miss Payments” indicates missed mortgage, property tax, and/or utility payments. “Defer Maint.” indicates delayed property repairs or maintenance. “List Props. For Sale” indicates one or more properties were listed for sale. Landlords could choose multiple actions. Models include city fixed effects. Heteroskedastic-robust standard errors are reported in parentheses. *** p < 0.01, ** p < 0.05, * p < 0.1. Data come from the COVID-19 Landlord Survey.

32
Table 5: Changes in Five Key Landlord Rental Business Practices, by City
Grant Rent Extensions
Charge Rent Fees
Evict Tenants
Defer Maintenance
List Props. for Sale
2019 2020 2019 2020 2019 2020 2019 2020 2019 2020
(1) (2) (3) (4) (5) (6) (7) (8) (9) (10)
Akron 17.5 49.3 24.5 20.1 19.2 17.9 3.9 29.7 2.2 16.6 Albany 19.6 45.1 27.5 9.8 17.6 21.6 9.8 46.1 3.9 22.5 Indianapolis 18.1 53.1 26.0 17.9 17.3 19.1 3.6 25.8 4.1 15.3 Los Angeles 9.5 59.5 26.5 4.5 8.5 6.5 6.5 35.0 1.0 11.5 Minneapolis 10.2 29.2 14.5 6.6 5.5 3.0 2.5 24.2 2.7 8.2 Philadelphia 19.0 68.6 29.1 15.9 17.8 25.6 5.4 35.7 3.5 20.9 Racine 13.9 43.8 20.1 9.0 11.1 9.7 9.7 24.3 2.1 5.6 Rochester 14.6 53.2 22.8 12.7 25.3 31.6 5.1 43.0 3.8 17.7 San Jose 11.4 50.4 26.0 3.5 11.4 5.5 5.9 32.7 1.2 6.7 Trenton 22.2 57.4 24.1 17.6 20.4 38.9 9.3 36.1 2.8 15.7
Notes: This table reports the share of landlords’ pursuing five key rental business practices in 2019 and 2020, for each city in the study. “Grant Rent Extensions” indicates rental extensions and/or putting tenants on repayment plans. “Charge Rent Fees” indicates charging fees for late rent. “Evict Tenants” indicates the commencement of eviction procedures (and potentially, the conclusion). “Defer Maintenance” indicates delayed property repairs or maintenance. “List Props. For Sale” indicates one or more properties were listed for sale. Responses do not sum to 100 (within a city-year) because landlords could choose multiple actions. 10.5 percent of respondents are from San Jose, 8.6 from Los Angeles, 23.3 from Minneapolis, 6.2 from Racine, 16.2 from Indianapolis, 9.3 from Akron, 6.4 from Rochester, 4.2 from Albany, 10.9 from Philadelphia, and 4.5 from Trenton. The total number of survey respondents in the sample is 2,525. Data come from the COVID-19 Landlord Survey.

33
Table 6: Relationship between City-Level Rental Collection and Business Practices
Grant Rent
Ext. Charge
Rent Fees Evict
Tenants Defer Maint.
List Props. for Sale
(1) (2) (3) (4) (5)
Share < 90% Rent Received 0.583** 0.756* 1.173*** 0.236 0.041
(0.208) (0.395) (0.204) (0.152) (0.051)
2020 0.072 -0.108* -0.126** 0.117*** -0.004
(0.068) (0.059) (0.045) (0.037) (0.024)
Share < 90% Rent Received*2020 0.280 -0.561 -0.483* 0.198 0.253***
(0.272) (0.400) (0.228) (0.174) (0.084)
N City-Years 20 20 20 20 20
Notes: This table reports OLS estimates of the relationship between landlords’ rental collection and business practice implementation rates, at the city-level, prior to and during the pandemic. To generate these estimates, data are first collapsed on means to the city-year level, and all regressions are weighted by the number of survey respondents within the city. “Grant Rent Ext.” indicates rental extensions and/or putting tenants on repayment plans. “Charge Rent Fees” indicates charging fees for late rent. “Evict Tenants” indicates the commencement of eviction procedures (and potentially, the conclusion). “Defer Maint.” indicates delayed property repairs or maintenance. “List Props. For Sale” indicates one or more properties were listed for sale. Landlords could choose multiple actions. Heteroskedastic-robust standard errors are reported in parentheses. *** p < 0.01, ** p < 0.05, * p < 0.1. Data come from the COVID-19 Landlord Survey.
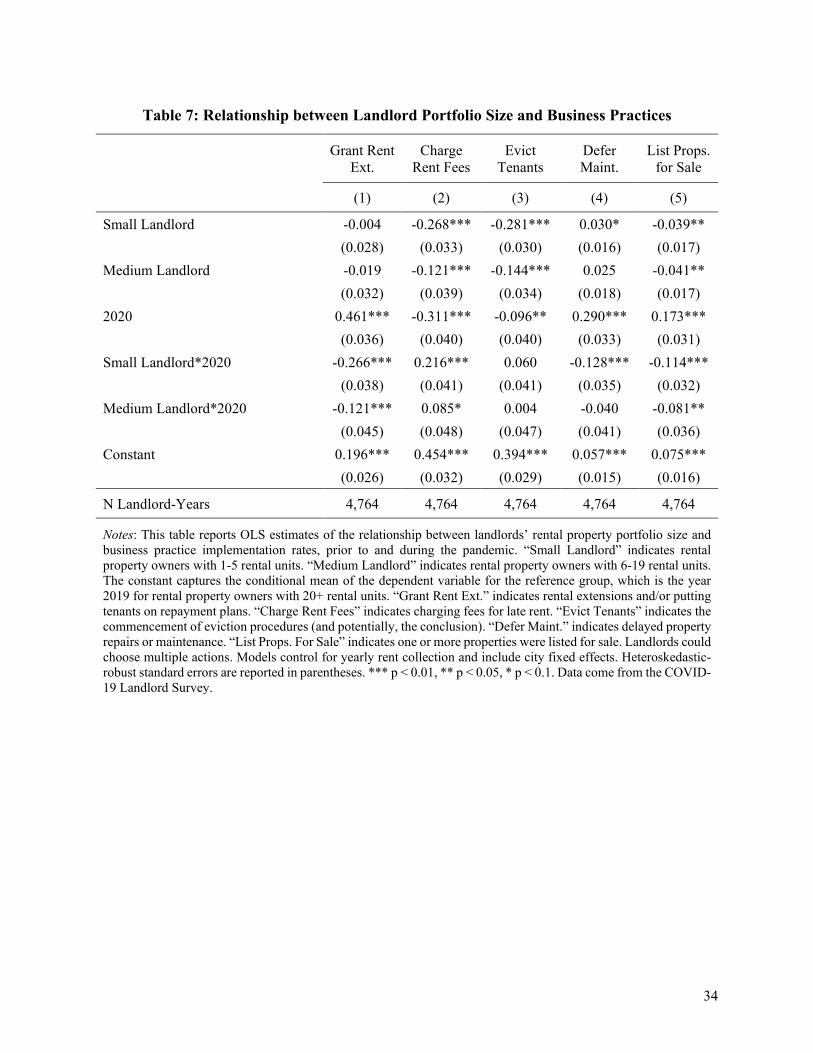
34
Table 7: Relationship between Landlord Portfolio Size and Business Practices
Grant Rent
Ext. Charge
Rent Fees Evict
Tenants Defer Maint.
List Props. for Sale
(1) (2) (3) (4) (5)
Small Landlord -0.004 -0.268*** -0.281*** 0.030* -0.039** (0.028) (0.033) (0.030) (0.016) (0.017) Medium Landlord -0.019 -0.121*** -0.144*** 0.025 -0.041** (0.032) (0.039) (0.034) (0.018) (0.017) 2020 0.461*** -0.311*** -0.096** 0.290*** 0.173*** (0.036) (0.040) (0.040) (0.033) (0.031) Small Landlord*2020 -0.266*** 0.216*** 0.060 -0.128*** -0.114*** (0.038) (0.041) (0.041) (0.035) (0.032) Medium Landlord*2020 -0.121*** 0.085* 0.004 -0.040 -0.081** (0.045) (0.048) (0.047) (0.041) (0.036) Constant 0.196*** 0.454*** 0.394*** 0.057*** 0.075*** (0.026) (0.032) (0.029) (0.015) (0.016)
N Landlord-Years 4,764 4,764 4,764 4,764 4,764
Notes: This table reports OLS estimates of the relationship between landlords’ rental property portfolio size and business practice implementation rates, prior to and during the pandemic. “Small Landlord” indicates rental property owners with 1-5 rental units. “Medium Landlord” indicates rental property owners with 6-19 rental units. The constant captures the conditional mean of the dependent variable for the reference group, which is the year 2019 for rental property owners with 20+ rental units. “Grant Rent Ext.” indicates rental extensions and/or putting tenants on repayment plans. “Charge Rent Fees” indicates charging fees for late rent. “Evict Tenants” indicates the commencement of eviction procedures (and potentially, the conclusion). “Defer Maint.” indicates delayed property repairs or maintenance. “List Props. For Sale” indicates one or more properties were listed for sale. Landlords could choose multiple actions. Models control for yearly rent collection and include city fixed effects. Heteroskedastic-robust standard errors are reported in parentheses. *** p < 0.01, ** p < 0.05, * p < 0.1. Data come from the COVID-19 Landlord Survey.

35
Figure 1: Landlords’ Rental Collection Prior to and During the Pandemic
Notes: This figure plots landlords’ rental collection rates in 2019 and 2020. Rental payment is expressed as a percentage of total rent charged, in a given year, for a landlord’s rental portfolio. The number of survey respondents in the sample is 2,548. Data come from the COVID-19 Landlord Survey.
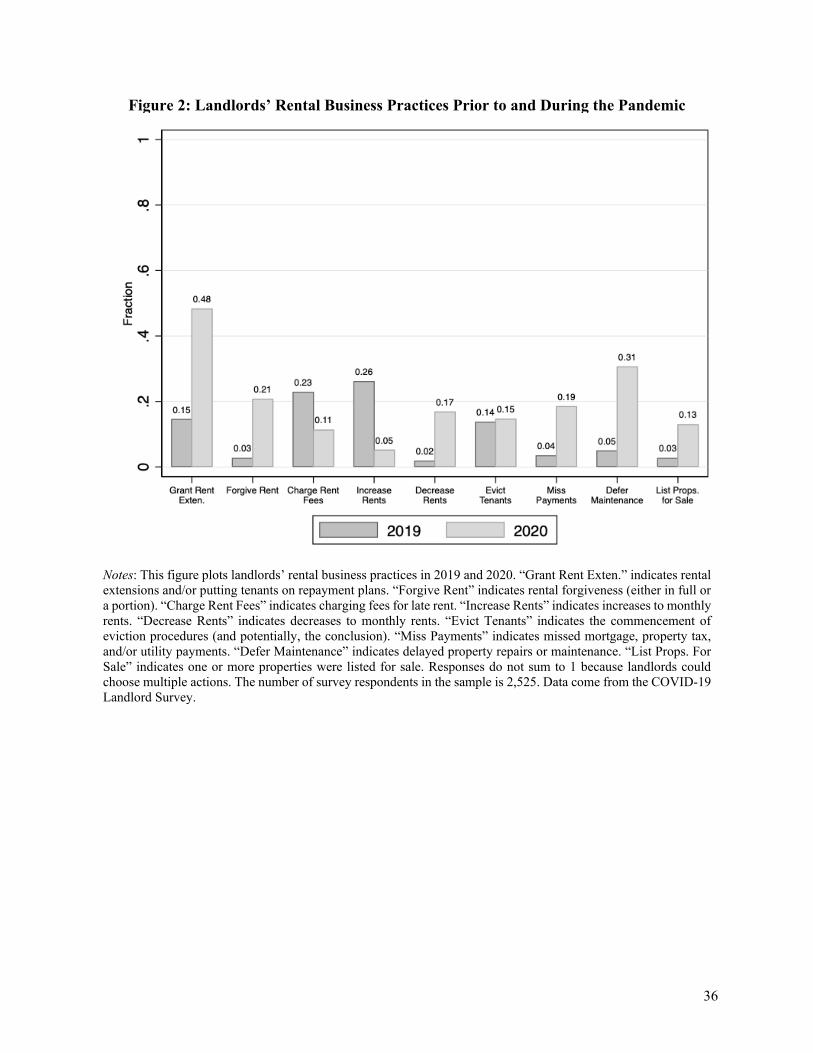
36
Figure 2: Landlords’ Rental Business Practices Prior to and During the Pandemic
Notes: This figure plots landlords’ rental business practices in 2019 and 2020. “Grant Rent Exten.” indicates rental extensions and/or putting tenants on repayment plans. “Forgive Rent” indicates rental forgiveness (either in full or a portion). “Charge Rent Fees” indicates charging fees for late rent. “Increase Rents” indicates increases to monthly rents. “Decrease Rents” indicates decreases to monthly rents. “Evict Tenants” indicates the commencement of eviction procedures (and potentially, the conclusion). “Miss Payments” indicates missed mortgage, property tax, and/or utility payments. “Defer Maintenance” indicates delayed property repairs or maintenance. “List Props. For Sale” indicates one or more properties were listed for sale. Responses do not sum to 1 because landlords could choose multiple actions. The number of survey respondents in the sample is 2,525. Data come from the COVID-19 Landlord Survey.

37
Figure 3: Share of Landlords Receiving Less than 90 Percent of Rent Charged, by City
Notes: This figure plots the share of landlords reporting less than 90 percent of total rent received in 2019 and 2020, by city. Rent received is expressed as a percentage of total rent charged, in a given year, for a landlord’s rental portfolio. 10.5 percent of respondents are from San Jose, 8.6 from Los Angeles, 23.3 from Minneapolis, 6.2 from Racine, 16.2 from Indianapolis, 9.3 from Akron, 6.4 from Rochester, 4.2 from Albany, 10.9 from Philadelphia, and 4.5 from Trenton. The total number of survey respondents in the sample is 2,548. Data come from the COVID-19 Landlord Survey.
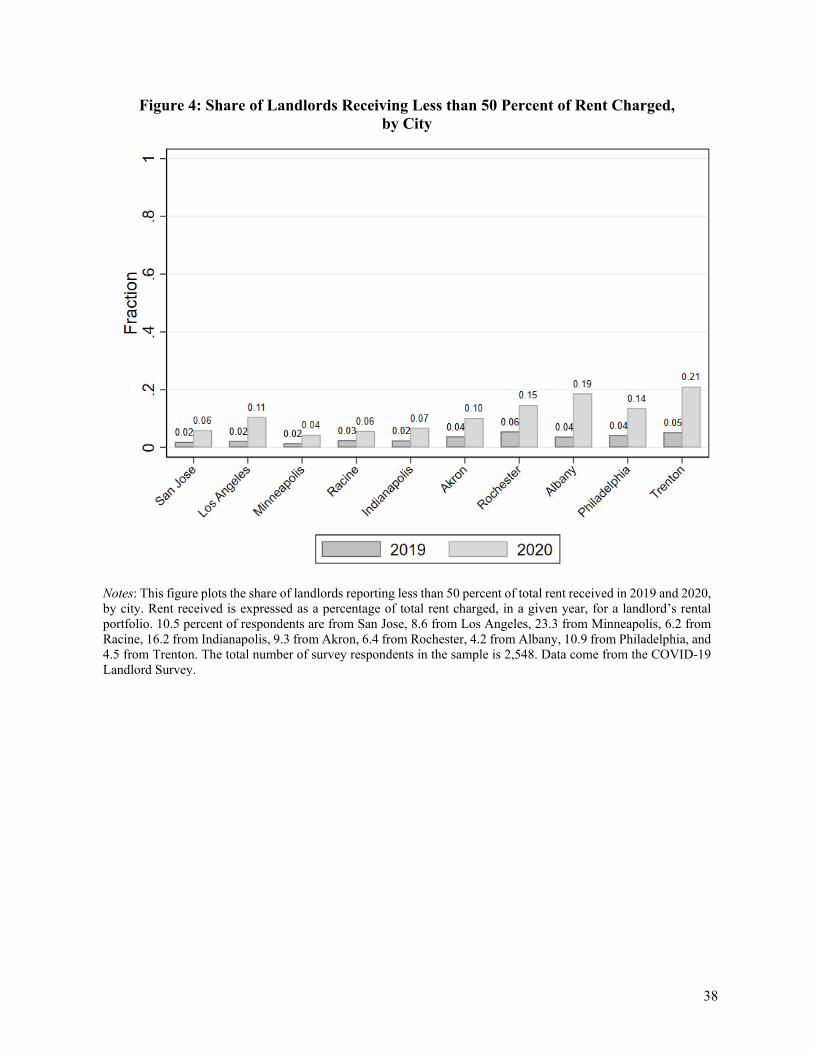
38
Figure 4: Share of Landlords Receiving Less than 50 Percent of Rent Charged, by City
Notes: This figure plots the share of landlords reporting less than 50 percent of total rent received in 2019 and 2020, by city. Rent received is expressed as a percentage of total rent charged, in a given year, for a landlord’s rental portfolio. 10.5 percent of respondents are from San Jose, 8.6 from Los Angeles, 23.3 from Minneapolis, 6.2 from Racine, 16.2 from Indianapolis, 9.3 from Akron, 6.4 from Rochester, 4.2 from Albany, 10.9 from Philadelphia, and 4.5 from Trenton. The total number of survey respondents in the sample is 2,548. Data come from the COVID-19 Landlord Survey.

39
Figure 5: Landlord Rental Collection Rates, by Size of Landlord Rental Portfolio
Notes: This figure plots the share of landlords reporting less than 90 percent of total rent received (Panel A) and less than 50 percent of total rent received (Panel B) in 2019 and 2020, by the size of landlords’ rental portfolios. Rental payment is expressed as a percentage of total rent charged, in a given year, for a landlord’s rental portfolio. 71.1 percent of landlords in the sample own 1-5 rental units, 18.2 percent own 6-19 rental units, and 10.7 percent own 20 or more rental units. Models include city fixed effects. The number of survey respondents in the sample is 2,524. Data come from the COVID-19 Landlord Survey.
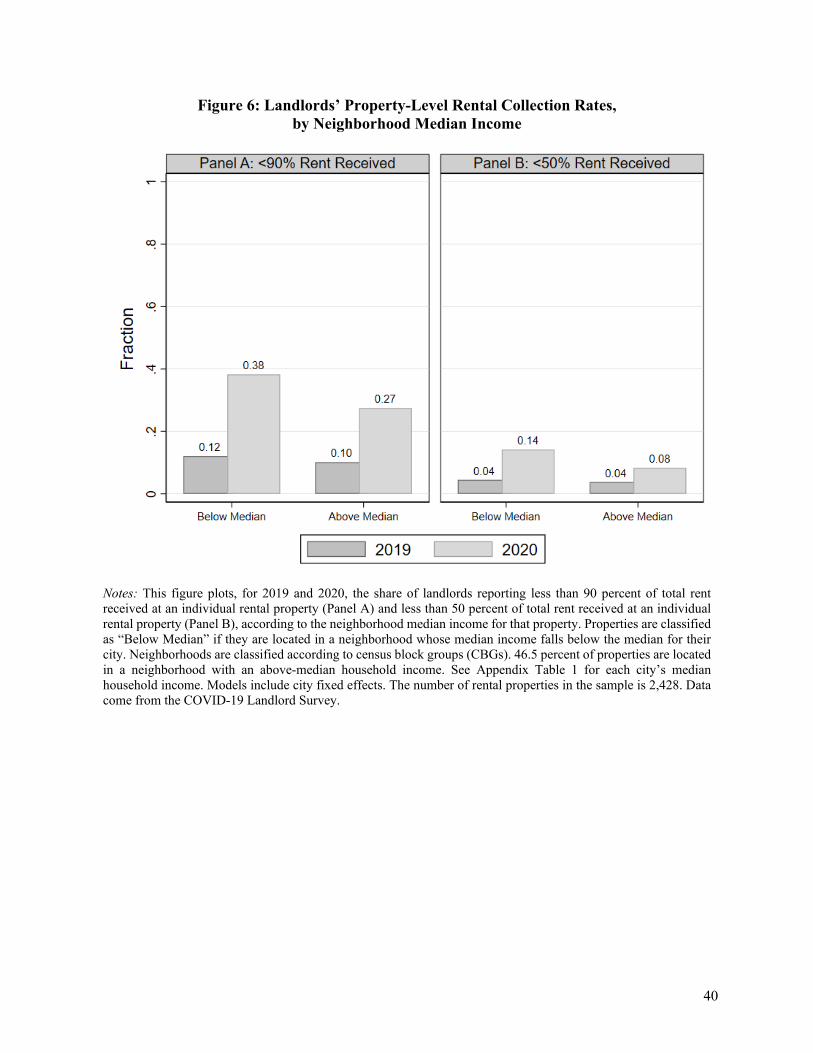
40
Figure 6: Landlords’ Property-Level Rental Collection Rates, by Neighborhood Median Income
Notes: This figure plots, for 2019 and 2020, the share of landlords reporting less than 90 percent of total rent received at an individual rental property (Panel A) and less than 50 percent of total rent received at an individual rental property (Panel B), according to the neighborhood median income for that property. Properties are classified as “Below Median” if they are located in a neighborhood whose median income falls below the median for their city. Neighborhoods are classified according to census block groups (CBGs). 46.5 percent of properties are located in a neighborhood with an above-median household income. See Appendix Table 1 for each city’s median household income. Models include city fixed effects. The number of rental properties in the sample is 2,428. Data come from the COVID-19 Landlord Survey.
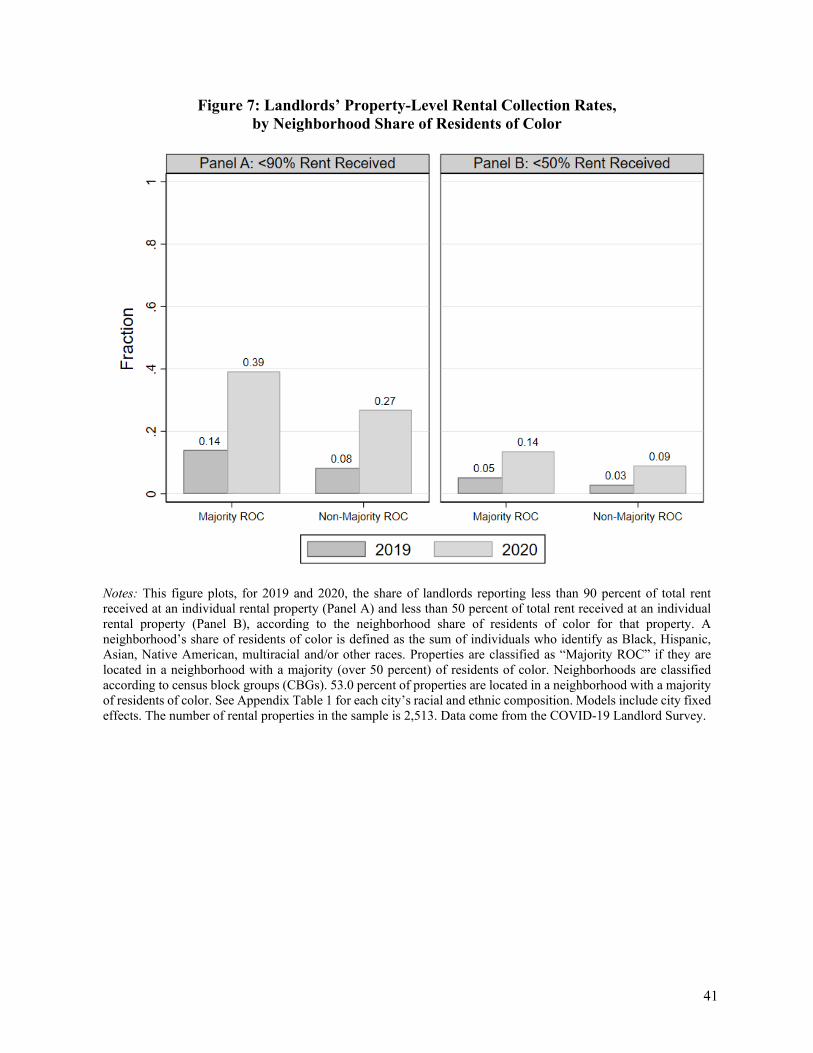
41
Figure 7: Landlords’ Property-Level Rental Collection Rates, by Neighborhood Share of Residents of Color
Notes: This figure plots, for 2019 and 2020, the share of landlords reporting less than 90 percent of total rent received at an individual rental property (Panel A) and less than 50 percent of total rent received at an individual rental property (Panel B), according to the neighborhood share of residents of color for that property. A neighborhood’s share of residents of color is defined as the sum of individuals who identify as Black, Hispanic, Asian, Native American, multiracial and/or other races. Properties are classified as “Majority ROC” if they are located in a neighborhood with a majority (over 50 percent) of residents of color. Neighborhoods are classified according to census block groups (CBGs). 53.0 percent of properties are located in a neighborhood with a majority of residents of color. See Appendix Table 1 for each city’s racial and ethnic composition. Models include city fixed effects. The number of rental properties in the sample is 2,513. Data come from the COVID-19 Landlord Survey.

42
Figure 8: Landlords’ Property-Level Business Practices (y-axis), by Neighborhood Income (x-axis)
Notes: This figure presents nine binned scatter plots of landlords’ 2020 property-level rental business practices versus the neighborhood median income (for the property). For each plot, the share of landlords reporting the practice is reported on the y-axis while the natural log of neighborhood median income is presented on the x-axis. To construct these plots, we first demean both landlords’ rental business practices and neighborhood median income by city and average rent collection. We then divide the observations into 20 equal-sized groups (vigintiles) based on the natural log of neighborhood median income and plot the share of landlords pursuing the indicated rental practice within each bin. The solid lines show the best linear fit estimated on the underlying micro data using OLS regression, and Appendix Table 4 presents these regression estimates. The indicated actions took place at some point during 2020. “Grant Rent Exten.” indicates rental extensions and/or putting tenants on repayment plans. “Forgive Rent” indicates rental forgiveness (either in full or a portion). “Charge Rent Fees” indicates charging fees for late rent. “Increase Rents” indicates increases to monthly rents. “Decrease Rents” indicates decreases to monthly rents. “Evict Tenants” indicates the commencement of eviction procedures (and potentially, the conclusion). “Miss Payments” indicates missed mortgage, property tax, and/or utility payments. “Defer Maintenance” indicates delayed property repairs or maintenance. “List Prop. For Sale” indicates the property was listed for sale. The number of rental properties for each plot is 2,322. Data come from the COVID-19 Landlord Survey.
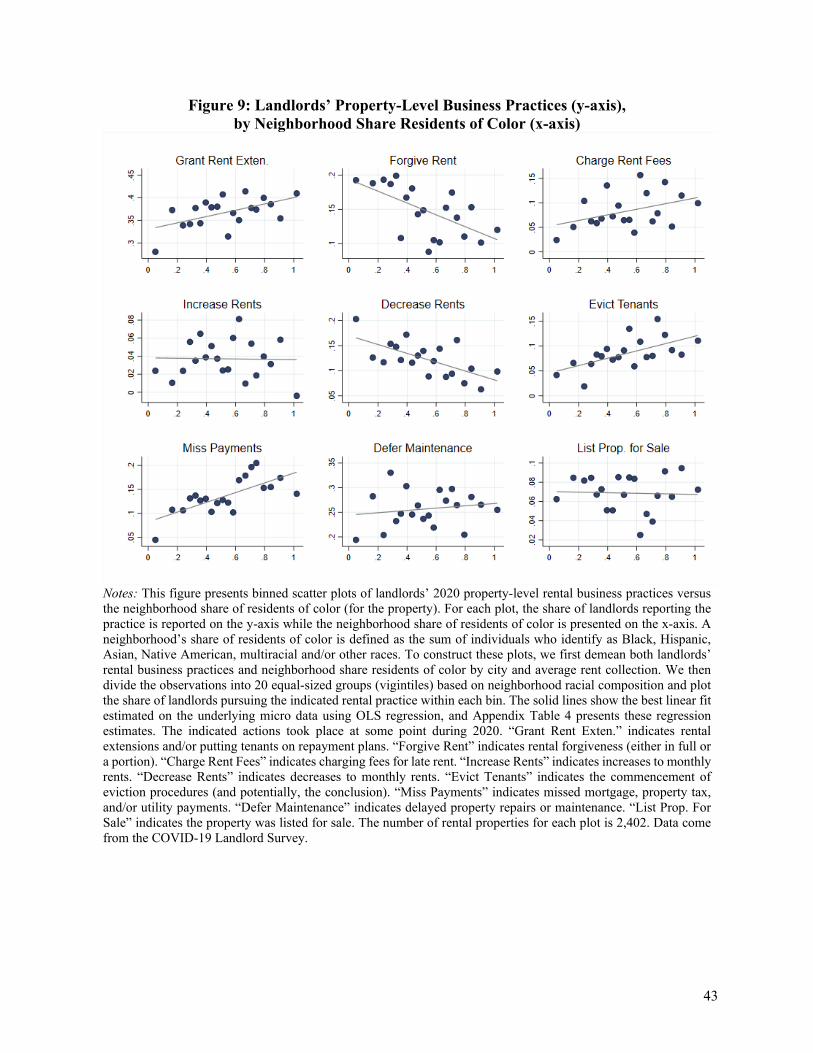
43
Figure 9: Landlords’ Property-Level Business Practices (y-axis), by Neighborhood Share Residents of Color (x-axis)
Notes: This figure presents binned scatter plots of landlords’ 2020 property-level rental business practices versus the neighborhood share of residents of color (for the property). For each plot, the share of landlords reporting the practice is reported on the y-axis while the neighborhood share of residents of color is presented on the x-axis. A neighborhood’s share of residents of color is defined as the sum of individuals who identify as Black, Hispanic, Asian, Native American, multiracial and/or other races. To construct these plots, we first demean both landlords’ rental business practices and neighborhood share residents of color by city and average rent collection. We then divide the observations into 20 equal-sized groups (vigintiles) based on neighborhood racial composition and plot the share of landlords pursuing the indicated rental practice within each bin. The solid lines show the best linear fit estimated on the underlying micro data using OLS regression, and Appendix Table 4 presents these regression estimates. The indicated actions took place at some point during 2020. “Grant Rent Exten.” indicates rental extensions and/or putting tenants on repayment plans. “Forgive Rent” indicates rental forgiveness (either in full or a portion). “Charge Rent Fees” indicates charging fees for late rent. “Increase Rents” indicates increases to monthly rents. “Decrease Rents” indicates decreases to monthly rents. “Evict Tenants” indicates the commencement of eviction procedures (and potentially, the conclusion). “Miss Payments” indicates missed mortgage, property tax, and/or utility payments. “Defer Maintenance” indicates delayed property repairs or maintenance. “List Prop. For Sale” indicates the property was listed for sale. The number of rental properties for each plot is 2,402. Data come from the COVID-19 Landlord Survey.
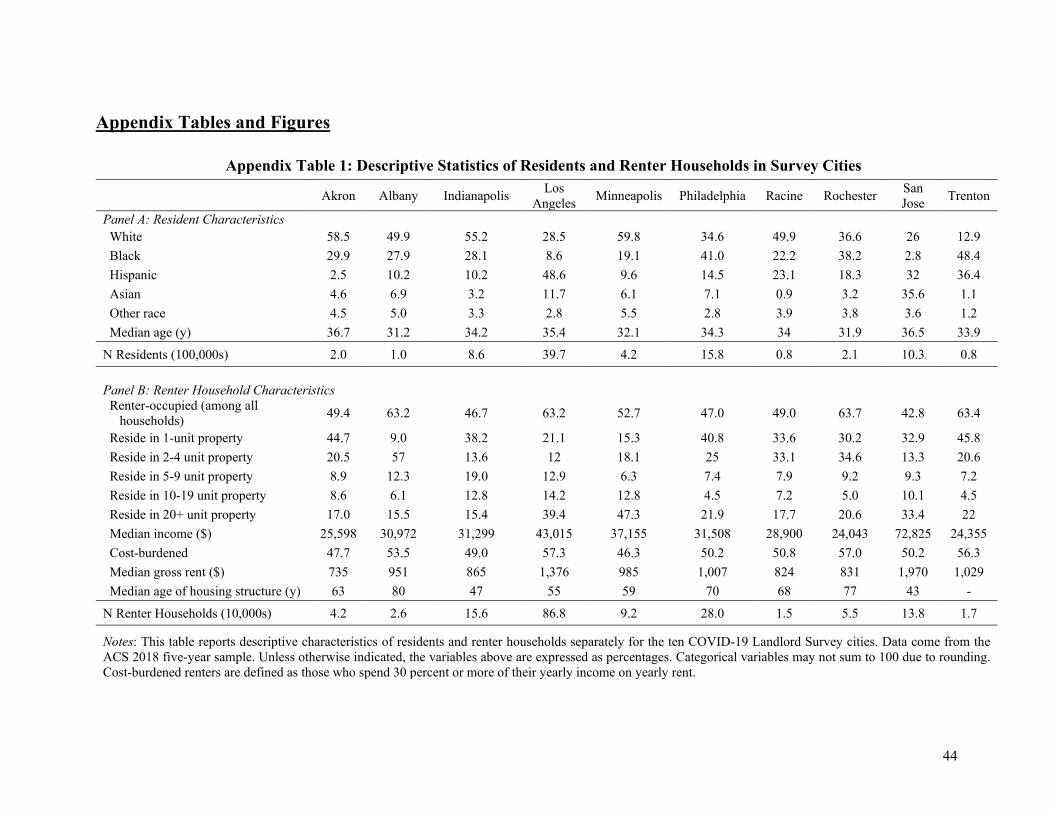
44
Appendix Tables and Figures
Appendix Table 1: Descriptive Statistics of Residents and Renter Households in Survey Cities
Akron Albany Indianapolis Los
Angeles Minneapolis Philadelphia Racine Rochester San Jose Trenton
Panel A: Resident Characteristics White 58.5 49.9 55.2 28.5 59.8 34.6 49.9 36.6 26 12.9 Black 29.9 27.9 28.1 8.6 19.1 41.0 22.2 38.2 2.8 48.4 Hispanic 2.5 10.2 10.2 48.6 9.6 14.5 23.1 18.3 32 36.4 Asian 4.6 6.9 3.2 11.7 6.1 7.1 0.9 3.2 35.6 1.1 Other race 4.5 5.0 3.3 2.8 5.5 2.8 3.9 3.8 3.6 1.2 Median age (y) 36.7 31.2 34.2 35.4 32.1 34.3 34 31.9 36.5 33.9
N Residents (100,000s) 2.0 1.0 8.6 39.7 4.2 15.8 0.8 2.1 10.3 0.8 Panel B: Renter Household Characteristics Renter-occupied (among all households) 49.4 63.2 46.7 63.2 52.7 47.0 49.0 63.7 42.8 63.4
Reside in 1-unit property 44.7 9.0 38.2 21.1 15.3 40.8 33.6 30.2 32.9 45.8 Reside in 2-4 unit property 20.5 57 13.6 12 18.1 25 33.1 34.6 13.3 20.6 Reside in 5-9 unit property 8.9 12.3 19.0 12.9 6.3 7.4 7.9 9.2 9.3 7.2 Reside in 10-19 unit property 8.6 6.1 12.8 14.2 12.8 4.5 7.2 5.0 10.1 4.5 Reside in 20+ unit property 17.0 15.5 15.4 39.4 47.3 21.9 17.7 20.6 33.4 22 Median income ($) 25,598 30,972 31,299 43,015 37,155 31,508 28,900 24,043 72,825 24,355 Cost-burdened 47.7 53.5 49.0 57.3 46.3 50.2 50.8 57.0 50.2 56.3 Median gross rent ($) 735 951 865 1,376 985 1,007 824 831 1,970 1,029 Median age of housing structure (y) 63 80 47 55 59 70 68 77 43 -
N Renter Households (10,000s) 4.2 2.6 15.6 86.8 9.2 28.0 1.5 5.5 13.8 1.7
Notes: This table reports descriptive characteristics of residents and renter households separately for the ten COVID-19 Landlord Survey cities. Data come from the ACS 2018 five-year sample. Unless otherwise indicated, the variables above are expressed as percentages. Categorical variables may not sum to 100 due to rounding. Cost-burdened renters are defined as those who spend 30 percent or more of their yearly income on yearly rent.
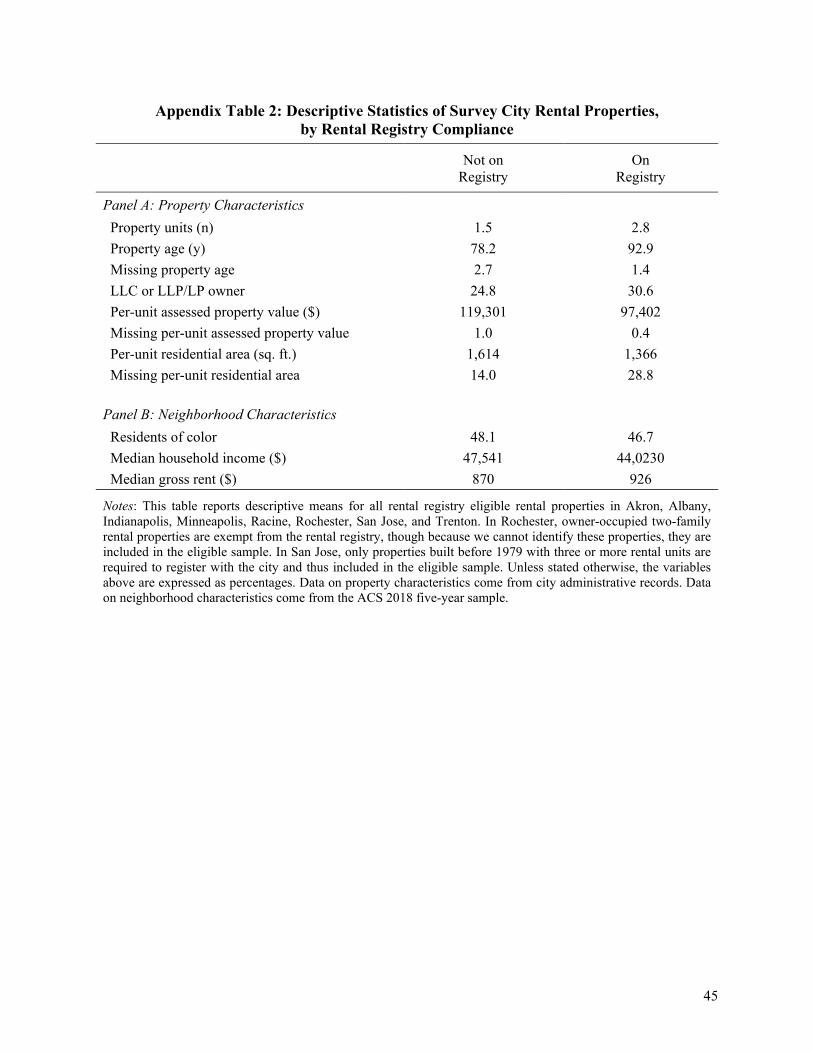
45
Appendix Table 2: Descriptive Statistics of Survey City Rental Properties, by Rental Registry Compliance
Not on Registry
On Registry
Panel A: Property Characteristics
Property units (n) 1.5 2.8 Property age (y) 78.2 92.9 Missing property age 2.7 1.4 LLC or LLP/LP owner 24.8 30.6 Per-unit assessed property value ($) 119,301 97,402 Missing per-unit assessed property value 1.0 0.4 Per-unit residential area (sq. ft.) 1,614 1,366 Missing per-unit residential area 14.0 28.8 Panel B: Neighborhood Characteristics
Residents of color 48.1 46.7 Median household income ($) 47,541 44,0230 Median gross rent ($) 870 926
Notes: This table reports descriptive means for all rental registry eligible rental properties in Akron, Albany, Indianapolis, Minneapolis, Racine, Rochester, San Jose, and Trenton. In Rochester, owner-occupied two-family rental properties are exempt from the rental registry, though because we cannot identify these properties, they are included in the eligible sample. In San Jose, only properties built before 1979 with three or more rental units are required to register with the city and thus included in the eligible sample. Unless stated otherwise, the variables above are expressed as percentages. Data on property characteristics come from city administrative records. Data on neighborhood characteristics come from the ACS 2018 five-year sample.

46
Appendix Table 3: Descriptive Statistics of Survey Respondents, by City
Akron Albany Indianapolis Los
Angeles Minneapolis Philadelphia Racine Rochester San Jose Trenton
Male 63.9 75.8 65.5 51.6 60.4 56.7 54.3 63.8 61.5 68.7 Missing Gender 12.0 16.7 23.2 25.8 16.4 23.1 18.6 14.6 32.2 27.2 White 78.4 76.8 74.9 50.8 80.2 42.9 83.4 57.4 47.3 39.6 Black 12.5 8.1 9.8 14.1 3.7 27.2 8.3 20.6 0.9 31.1 Hispanic 2.2 5.1 3.1 18.3 3.1 11.0 3.4 4.5 11.5 6.6 Asian 1.3 5.1 4.7 8.9 6.5 8.7 2.1 6.5 31.4 15.1 Missing race 10.1 13.2 20.3 23.0 15.4 18.6 15.7 12.9 26.4 22.1 20-29 Years Old 1.3 2.0 3.3 0.0 3.7 2.7 1.4 1.3 0.9 1.9 30-39 Years Old 11.5 22.0 15.2 7.2 20.4 18.4 11.6 14.5 3.9 15.7 40-49 Years Old 12.8 18.0 19.8 12.4 19.8 24.2 14.3 18.9 11.2 23.1 50-59 Years Old 34.6 19.0 24.8 23.2 21.6 25.4 32.7 25.2 23.3 37.0 60+ Years Old 39.7 39.0 36.9 57.2 34.4 29.3 40.1 40.3 60.8 22.2 Missing age 9.3 12.3 19.2 21.8 13.2 17.9 14.5 10.7 24.4 20.6 LLC or LLP/LP Owner 19.8 20.2 7.5 - 4.1 - 14.2 23.2 11.8 33.8 Missing owner name 0.4 0.0 1.6 100.0 2.1 100.0 1.7 0.6 1.0 4.4 Uses a property manager 23.5 25.7 39.2 36.1 24.3 22.4 16.5 16.8 36.6 22.5 Missing property manager 4.3 4.4 5.1 6.0 5.2 5.4 8.1 2.8 4.9 5.1 Accepts Section 8 31.6 27.3 13.1 20.4 10.5 23.5 19.6 32.2 33.7 22.5 Missing Section 8 4.3 3.5 4.9 5.2 5.3 4.5 8.1 2.2 5.2 5.1 Owns single-family home(s) 77.0 19.8 81.0 21.3 34.1 68.0 51.3 58.8 20.8 76.3 Owns 2-4 family home(s) 33.1 85.8 33.7 42.7 59.5 48.9 56.6 70.9 56.2 36.0 Owns small apart. building(s) 3.8 16.0 3.5 37.8 5.8 14.8 5.3 13.3 27.2 9.6 Owns mid-sized apart. building(s) 2.1 6.6 1.7 16.9 4.6 1.4 2.0 3.6 12.1 0.9 Owns large apartment building(s) 0.4 0.9 4.5 16.4 2.6 1.8 0.0 1.8 10.9 4.4 Owns condominium unit(s) 1.3 1.9 7.7 10.2 15.0 3.5 3.9 1.8 5.3 2.6 Missing types of properties owned 7.4 7.0 10.7 9.3 13.2 9.0 11.6 7.3 13.7 16.2 Owns 1-5 rental units 72.3 67.5 72.2 40.7 73.3 60.9 78.9 68.0 45.7 69.4 Owns 6-19 rental units 14.5 20.2 12.0 31.1 12.3 17.9 9.4 14.0 34.1 11.2 Missing # rental units owned 0.8 0.0 1.6 2.8 1.3 1.6 0.6 0.0 4.6 1.5 N Respondents 258 114 449 248 676 312 172 178 307 136
Notes: This table reports descriptive statistics for the COVID-19 Landlord Survey respondents, by city. The variables above are expressed as percentages. The omitted category for race is “Other Race.” The omitted category for age is “20–29 years old.” No respondents reported being less than 20 years old. The omitted category for number of rental units owned is “Owns 20+ rental units.” “Small apartment building” indicates a 5-9 unit building. “Mid-sized” indicates 10 to 19 rental units. “Large” indicates 20+ rental units. Respondents could indicate owning multiple types of properties, and thus, property ownership will not sum to 100. Categorical variables may not sum to 100 due to rounding. Data come from city administrative records and the COVID-19 Landlord Survey.

47
Appendix Table 4: Relationship Between Landlords’ Property-Level Rental Business Practices and the Neighborhood Demographics of those Rental Properties
Grant
Rent Ext. Forgive
Rent Charge
Rent Fee Inc.
Rents Dec. Rents
Evict Tenants
Miss Payments
Defer Maint.
List Prop. for Sale
(1) (2) (3) (4) (5) (6) (7) (8) (9)
Unconditional 2020 Mean 0.37 0.15 0.08 0.04 0.12 0.09 0.14 0.26 0.07 Panel A: Neighborhood Income Log Median Income -0.027 -0.010 -0.016 0.004 0.005 -0.014 -0.027** -0.016 -0.004 (0.020) (0.015) (0.011) (0.008) (0.015) (0.010) (0.013) (0.019) (0.011) N Rental Properties 2,322 2,322 2,322 2,322 2,322 2,322 2,322 2,322 2,322 Panel B: Neighborhood Race Share Residents of Color 0.069** -0.083*** 0.057*** -0.003 -0.090*** 0.076*** 0.104*** 0.022 -0.005 (0.035) (0.028) (0.021) (0.013) (0.026) (0.020) (0.026) (0.033) (0.021) N Rental Properties 2,402 2,402 2,402 2,402 2,402 2,402 2,402 2,402 2,402
Notes: This table reports OLS regression estimates of the relationship between landlords’ property-level rental business practices and the neighborhood demographics of those rental properties. Each column presents results from a separate OLS regression, where the indicated business practice is the dependent variable. These estimates represent the slopes of the best fit lines, for the indicated rental business practice, presented in the binned scatter plots of Figures 8 and 9. The indicated actions took place at some point during 2020. “Grant Rent Ext.” indicates rental extensions and/or putting tenants on repayment plans. “Forgive Rent” indicates rental forgiveness (either in full or a portion). “Charge Rent Fee” indicates charging fees for late rent. “Inc. Rents” indicates increases to monthly rents. “Dec. Rents” indicates decreases to monthly rents. “Evict Tenants” indicates the commencement of eviction procedures (and potentially, the conclusion). “Miss Payments” indicates missed mortgage, property tax, and/or utility payments. “Defer Maint.” indicates delayed property repairs or maintenance. “List Prop. For Sale” indicates the property was listed for sale. Landlords could choose multiple actions. Models control for 2020 rent collection and include city fixed effects. Heteroskedastic-robust standard errors are reported in parentheses. *** p < 0.01, ** p < 0.05, * p < 0.1. Data come from the COVID-19 Landlord Survey.
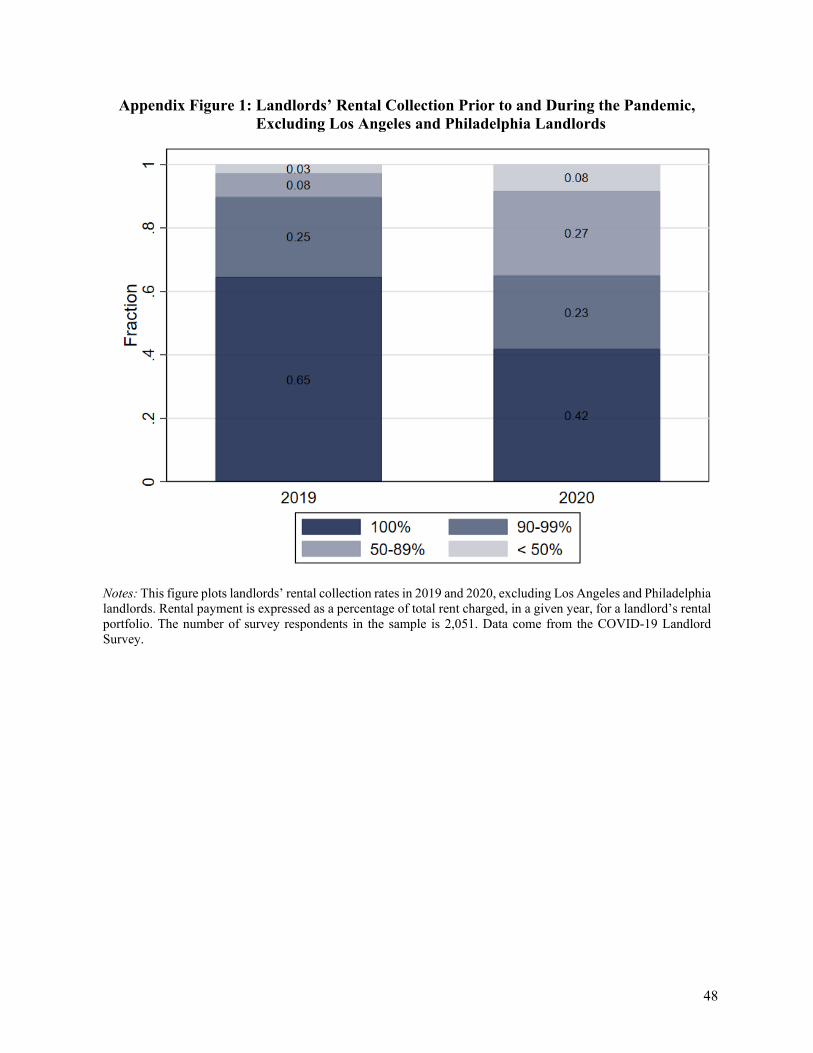
48
Appendix Figure 1: Landlords’ Rental Collection Prior to and During the Pandemic, Excluding Los Angeles and Philadelphia Landlords
Notes: This figure plots landlords’ rental collection rates in 2019 and 2020, excluding Los Angeles and Philadelphia landlords. Rental payment is expressed as a percentage of total rent charged, in a given year, for a landlord’s rental portfolio. The number of survey respondents in the sample is 2,051. Data come from the COVID-19 Landlord Survey.
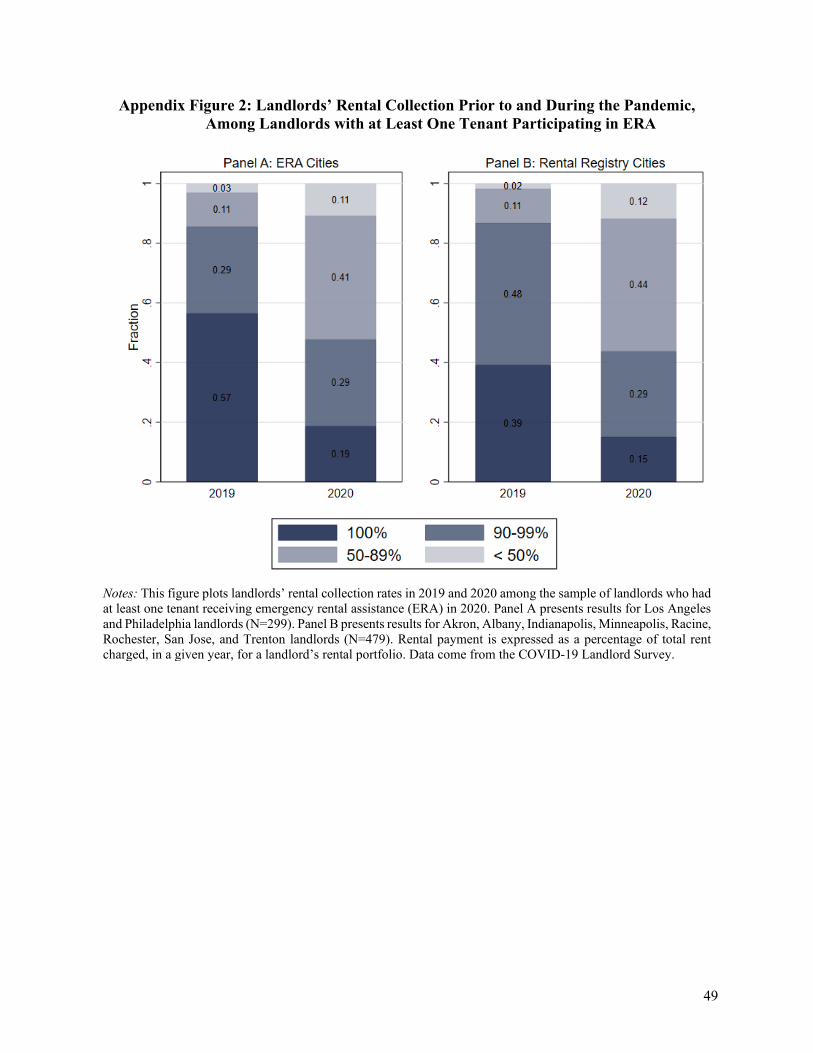
49
Appendix Figure 2: Landlords’ Rental Collection Prior to and During the Pandemic, Among Landlords with at Least One Tenant Participating in ERA
Notes: This figure plots landlords’ rental collection rates in 2019 and 2020 among the sample of landlords who had at least one tenant receiving emergency rental assistance (ERA) in 2020. Panel A presents results for Los Angeles and Philadelphia landlords (N=299). Panel B presents results for Akron, Albany, Indianapolis, Minneapolis, Racine, Rochester, San Jose, and Trenton landlords (N=479). Rental payment is expressed as a percentage of total rent charged, in a given year, for a landlord’s rental portfolio. Data come from the COVID-19 Landlord Survey.