how artist space matters: impacts and insights from three case
TRANSCRIPT

How Artist Space Matters
Impacts and Insights from Three Case Studies drawn from
Artspace Projects’ Earliest Developments
March 2010

How Artist Space Matters: Impacts and Insights
from Three Case Studies drawn from Artspace Project’s Earliest Developments
By Anne Gadwa, Metris Arts Consulting with contributions from:
Ann Markusen and Nathaniel Walton
March 2010 Metris Arts Consulting provides data, analysis and planning support to help commu-nities strengthen the arts and arts activity strengthen communities. For more infor-mation about our work or to access our other research and publications visit www.metrisarts.com or contact:
Anne Gadwa, Principal Master of Urban and Regional Planning
1911 E. 35th St. Minneapolis MN 55407 612.709.0232 [email protected]
© Metris Arts Consulting 2010
Cover photos © Sean Smuda, seansmuda.com, 2009 Top: Teena Janay Roberson, Tilsner artist Bottom left: Andrea Cole, Tim White, Tilsner artists Bottom right: Frank Brown, Northern guest artist for Fall 2009 St. Paul Art Crawl

CONTENTS Acknowledgements ............................................................................................ 1
Preface: A Letter from Artspace .........................................................................3
Executive Summary ...........................................................................................5
Introduction........................................................................................................9 Project Objectives..................................................................................................................... 9 Methods.................................................................................................................................. 9 Key Findings.........................................................................................................................10
Context and Evolution ..................................................................................... 12 A Tale of Two Warehouse Districts......................................................................................12
St. Paul’s Lowertown – It Takes a Village to Build an Urban Village ................13 Minneapolis’ North Loop – “Where have all your artists gone?” .......................18
The Northern, Tilsner, and Traffic Zone...............................................................................25 Northern Warehouse Artists’ Cooperative: The Model, the Guinea Pig ...........25 Tilsner Artists’ Cooperative: From Pigeon Droppings to Cups of Sugar ..........29 Traffic Zone: Experiment in Artist Ownership .....................................................31
Impacts and Insights........................................................................................ 34 Benefits to In-house Artists ...................................................................................................34
The Space “Works” – Affordability and Meeting Artists’ Needs........................35 Fostering Synergies .....................................................................................................37 Strengthening Reputations and Identities ...............................................................40 Enhancing Ability to Create Art ...............................................................................41 Limited Income Benefits............................................................................................43
Benefits to In-house Arts Organizations ................................................................................47 Insights: Factors Affecting Tenant Satisfaction ......................................................................49
Stability and Affordability ..........................................................................................49 Opportunities for Shared Governance ....................................................................50 Bricks and Mortar – “Your environment sets the tone” ......................................51 Location, Location, Location ....................................................................................53
Neighborhood and Regional Impacts......................................................................................53 Expanding Arts Offerings .........................................................................................54 The Buildings – Transforming Eyesores and Tax Rolls .......................................57 Neighborhood Effects: Catalyzing Change, Adding Value ..................................58 Few “Red Flags” on Gentrification-led Displacement .........................................62 Strengthening, Attracting and Retaining Artist Entrepreneurs............................68 Bolstering Area Businesses ........................................................................................68 Social Benefits: Civic Engagement, Gathering Places and Safety........................70
Insights: Factors Influencing Spillover Benefits .......................................................................74 Artists’ Vested Interests .............................................................................................75 A Critical Mass – Live/Work, Size and Surrounding Artist Density ..................76 Place Matters – Physical Links to Neighborhood..................................................76 Open Doors – Making Time and Space to Let the Public In ..............................77 Needing One’s Own House in Order......................................................................78
Conclusions and Next Steps ............................................................................ 79
References ........................................................................................................ 82
People Interviewed........................................................................................... 84
Appendix A: Arts Tenant Survey Results ......................................................... 85
Appendix B: Hedonic Analysis .......................................................................112


1
ACKNOWLEDGEMENTS Metris Arts Consulting thanks LINC (Leveraging Investments In Creativity) for its financial support of this work; the City of Minneapolis; Lincoln Land Institute of Land Policy; and the Humphrey Institute’s George A. Warp In-ternship Grant Fund for supporting the earlier methodology research under-pinning this effort; Ann Markusen, director of the Project on Regional and Industrial Economics, for guiding and helping shape the project from its ear-liest inception; Nathaniel Walton, principal of Overview, for spearheading the hedonic analysis and mapping; Cassie Mazilly Moen for providing critical in-terview support; Roy Close for editing and layout; and Stephen Sheppard of the Center for Creative Community Development for providing hedonic analysis training and guidance. Over one hundred artists, residents, business owners, government officials, arts organization representatives and others contributed to this research through surveys and interviews. We thank you for your time and insights and hope this report honors your contributions and increases understanding of the role artist spaces play for artists, arts organizations and the larger commu-nity. Lastly, we thank Kelley Lindquist, Wendy Holmes, and the entire staff and board at Artspace Projects for commissioning this research, engaging with tough questions, and connecting us to essential resources.
www.artspace.org www.lincnet.net


3
PREFACE: A LETTER FROM ARTSPACE As the nation’s leading nonprofit developer for the arts, Artspace Projects is often asked how we measure the impact of our work. With 24 completed pro-jects in a dozen states, we have a great deal of experience in planning, devel-oping, and operating arts facilities, and we know that our projects provide many benefits not only to the artists who live and work in them but also to their surrounding neighborhoods and the larger communities of which they are a part. But this knowledge is based mainly on observation and anecdotal evidence, and given the vital importance of the arts in American life, we have long sought a way to supplement our empirical observations with more quan-tifiable measurements. With this in mind, and with generous support from Leveraging Investments in Creativity (LINC), Artspace invited Metris Arts Consulting to conduct How Artist Space Matters, a unique study of the economic, social, and physical im-pacts of our arts facilities. What follows are case study impact evaluations of three early Artspace pro-jects: the Northern Warehouse Artists’ Cooperative, the Tilsner Artists’ Co-operative, both located in St. Paul, and the Traffic Zone Center for Visual Art in Minneapolis. Ultimately, we hope to expand this study to include other Artspace projects around the country. How will we use the information we learn? Our first priority will be to make our projects better. To be good stewards of the buildings we operate, and to keep the rents affordable for the artists who live and work in them – these are important ongoing objectives, but they are not enough. One of the outcomes of this study will be a new set of Artspace strategies to address the concerns of our tenants in meaningful ways. In addition, we plan:
• To improve the ways in which we communicate the impacts of our projects to our primary stakeholders – cities, funders, political leaders, artists, and others.
• To report more accurately our project impacts to a larger audience,
beginning with LINC and other national leaders in the field. By shar-ing what we learn, we believe we can help strengthen the case at the national level for creating and maintaining affordable space for the arts and creative sector.
We will also share information about how we adapt our practices in response to what we learn. For example, one of the findings of How Artist Space Matters is that while the artists who have studios at the Traffic Zone Center for Visual Art in Minneapolis’ North Loop are more satisfied with their facility than the artists who live and work at the Northern and Tilsner buildings in St. Paul’s Lowertown, for a variety of reasons – including its relative isolation relative to

4
other arts facilities – the Traffic Zone has had less economic impact on its surrounding area than the Northern and Tilsner. If a project’s location can significantly influence its impacts, we can use this information to help com-munities that seek Artspace projects choose their sites more effectively. We look forward to expanding this analysis to other Artspace projects across the country. By looking at a wider cross-section of our projects, including our more recent developments and those outside of urban centers, we will gain an even fuller understanding of the concrete impacts of artist spaces for artists and communities. How Artist Space Matters, however, represents a critical jumping off point, not only for the research process, but also for Artspace’s internal learning and the field’s greater understanding.
Kelley Lindquist President, Artspace Projects

5
EXECUTIVE SUMMARY Do artist spaces matter, and if so, how? To address this research question, Metris Arts Consulting took an in-depth look at how three case study artist spaces benefit in-house artists and arts organizations, their neighborhoods and regions. Artspace Projects, a leading national nonprofit real estate devel-oper for the arts, developed each case study space: the Northern Warehouse Artists’ Cooperative, Tilsner Artist Cooperative, and Traffic Zone Center for Visual Art. Artspace commissioned this study, with funding from LINC (Lev-eraging Investments in Creativity), for two aims. First, it plans to use findings to shape service delivery to more effectively meet its core mission of creating, fostering, and preserving affordable space for artists and arts organizations, as well as to support broad community objectives. Secondly, Artspace seeks to provide artists, funders, local governments, and communities with objective data on the impacts of artist spaces. By drawing on a range of research methods, we documented the artist spaces’ contributions to neighborhood change and their perceived social, physical, and economic value. Our mixed method approach combined interviewing artists, residents, business owners, government officials, and others; surveying arts tenants; analyzing tenant income records and historical trends in socio-economic data (Census, County and Zip Code Business Patterns); and meas-uring property value impacts through hedonic modeling, a statistical method used to calculate appreciation in property values and estimate the portion of the change that is attributable to the artist space. Overall, these artist spaces have produced clear benefits for in-house arts ten-ants and the surrounding neighborhood and region. However, community members perceived the Northern and Tilsner to have contributed relatively more towards revitalization in St. Paul’s Lowertown than the Traffic Zone has done for Minneapolis’ North Loop, whereas the Traffic Zone artists demon-strated the highest levels of satisfaction. We not only detail impacts, but also synthesize which factors appear to enhance or limit benefits. Much of the variation between projects stems from differing neighborhood contexts, the specific objectives for each project and alternate physical designs and operational structures. In Lowertown, Artspace developed the Tilsner and Northern in conjunction with broad-based revitalization efforts. In con-trast, rising rents and condo conversions in the North Loop propelled the Traffic Zone artists to secure space. The Tilsner is solely artist live/work space, whereas the Northern also hosts commercial tenants. Due to Low In-come Housing Tax Credit financing, Northern and Tilsner artists must meet income restrictions to become tenants. The Traffic Zone provides studio-only space to 23 mid-career artists who co-own the building with Artspace. Through a survey, interviews and an analysis of artist income records, we found strong evidence that the Northern, Tilsner, and Traffic Zone benefit arts tenants. Majorities of artists indicated their spaces “worked” for them, physically meeting their needs and with respect to affordability. The North-

6
ern, Tilsner and Traffic Zone fostered synergies between artists by facilitating networking, collaborations and their sharing equipment, knowledge and skills. Artists reported boosts to their professional reputations and identities as art-ists. The spaces help artists increase productivity and the amount of time they devote to art making; however, artists’ abilities to transform these career en-hancements into income gains varied. Arts organization tenants at the North-ern also appear to benefit from affordability and reap synergies from close proximity to artists and other arts organizations, but limited data restricts our ability to generalize about these effects. Arts tenants communicated what they sought in an artist space, including stability, affordability, specific physical characteristics, good maintenance, and shared governance. By enhancing arts tenant satisfaction, we theorize that the benefits artist spaces offer to in-house artists and arts organization will be maximized. By analyzing historical trends in socio-economic data, estimating property value impacts through hedonic analysis, and interviewing residents, business owners, and government officials, we documented the artist spaces’ neigh-borhood and regional impacts. For all three spaces, artists and a range of community members gave high marks to “art crawl” and open studio events for providing high-quality cultural experiences and attracting visitors to the neighborhood. In each case, community members viewed Artspace’s redevel-opment of underutilized historic structures as a community enhancement. Community members credited the Northern and Tilsner with catalyzing the redevelopment of neighboring properties and providing Lowertown with last-ing artist cachet. Our estimations showed both the Tilsner and Traffic Zone increased surrounding property values, but due to data limitations we could not perform this analysis for the Northern. We found few red flags suggesting that the Northern, Tilsner, or Traffic Zone contributed to gentrification-led displacement – Lowertown’s gradual revitalization continued to include af-fordable housing, and the Traffic Zone helped preserve artist space in re-sponse to strong, pre-existing gentrification pressures. We also found evi-dence that these artist spaces support, attract, and help retain artist entrepre-neurs who enhance the regions’ economic competitiveness. The Northern and Tilsner’s artist residents bolster area businesses with increased demand for services, and all three spaces draw visitors to the area who then engage in ancillary spending. Lastly, these spaces spur additional social benefits ranging from increased civic involvement and safety to providing new spaces open to the public. Artists and community members identified which attributes and conditions influenced neighborhood and regional outcomes. They felt that artists with vested interests in the space and neighborhood increased their community involvement, whether achieved through a literal ownership stake, residential ties, or length of tenure. They thought that only a critical mass of arts activity triggered broad physical, economic, and social benefits; larger artist spaces and those with residential components, and/or a surrounding density of art-ists or arts activity helped generate the necessary threshold. Spaces physically isolated from the fabric of the surrounding neighborhood had less potential than those with linkages. Community members highly valued spaces offering

7
more opportunities for the public to access the space’s arts and/or physical assets, particularly through community-centered cafes, arts businesses and organizations, and arts events. Lastly, individual and internal challenges deter artists (individually and collectively) and Artspace itself from greater commu-nity involvement, but by having one’s house in order, they are more posi-tioned to think and act with an outward focus. Although this study breaks new ground in articulating how artist spaces mat-ter, for whom and why, only three case studies inform our findings. We cau-tion that neither the impacts nor insights on factors driving outcomes will ex-tend to all artist spaces, or even to all of Artspace’s developments. Artspace and Metris Arts Consulting envision this study as the first in a series. We seek additional resources to extend this analysis to other Artspace projects across the country, particularly those outside of urban areas, without cooperative structures, and featuring new construction. This larger, comparative sample will allow us to more fully address the questions of which factors influence impacts and which outcomes hold across different environments. Despite these limitations, our results increase understanding of the impacts artist spaces yield and will help Artspace foster the success of projects. We hope our findings resonate with the diverse array of community members whose insights helped shape them.


9
INTRODUCTION Project Objectives This report offers a detailed answer to a relatively straightforward question: Do artist spaces matter, and if so how? More specifically, do they make it pos-sible for artists to increase the amount of time they devote to art making, share equipment, engage in collaborations, and/or increase income? Do they help arts organizations financially stabilize or grow? Do they bolster neigh-borhood businesses? Are they linked to physical upgrades in the surrounding area? Do they help increase or stabilize property values without displacement? Are they associated with increased civic involvement, safety, or new commu-nity gathering places? Artist space proponents, including artists, developers, funders, and municipalities, presume that artist spaces generate these kinds of returns, with goals varying from stakeholder to stakeholder. To determine the degree to which these expectations are realized, Metris Arts Consulting took an in-depth look at how three case study artist spaces benefit both in-house artists and arts organizations and the surrounding neighborhood and region. Artspace Projects developed each of our three case studies: the Northern Warehouse Artists’ Cooperative, the Tilsner Artists’ Cooperative, and the Traffic Zone Center for Visual Art. Founded in 1979, Artspace has grown into a leading nonprofit real estate developer for the arts, with 24 completed artist live/work and non-residential buildings in 12 states with an additional 11 projects currently in development or predevelopment (planning). Art-space’s mission is to create, foster, and preserve affordable space for artists and arts organizations. Our case study spaces, all located in the Twin Cities, represent three of Artspace’s earliest developments. Artspace commissioned this study with funding from LINC (Leveraging In-vestments in Creativity). Artspace’s objectives for the research are twofold. First, Artspace plans to use the findings to shape its ongoing work in these three spaces, other projects in operation, and future projects to better meet its core mission and foster broad community benefits. Second, Artspace seeks to provide artist space proponents and critics, including artists, funders, gov-ernment officials, and neighboring residents and business owners, with objec-tive data on the impacts of artist spaces.
Methods To determine how the artist spaces have affected arts tenants and the larger neighborhood and region, we:
• Interviewed 22 community informants, including Artspace staff, art-ists, government officials, and neighborhood residents and business owners1
• Held four group interviews with 21 artist and arts organization tenants
1 For a list of interviewees and their affiliations, see People Interviewed

10
• Surveyed tenant artists and arts organizations (60 returns, 38% overall response rate)2
• Analyzed tenant income records • Analyzed historical trends in socio-economic data (Census, County
and Zip Code Business Patterns) • Estimated property value impacts through hedonic modeling, a statis-
tical method used to calculate appreciation in property values and es-timate the portion of the change that is attributable to the artist space
• Photographed artists, arts events, and building and neighborhood fea-tures
By combining a range of qualitative and quantitative research techniques, we approached the methodologically challenging task of determining how a single physical intervention affects its immediate users and its environment.3
Key Findings Our data provide ample evidence that the three case study artist spaces do matter, both for in-house arts tenants and for surrounding neighborhoods and regions. Artists have accessed career boosts through shared synergies with others in their buildings, enhanced reputations, and time and productivity gains. The general public and members of the larger arts communities have increased access to arts offerings. Interviewees not only saw the direct reha-bilitation of historic warehouses as a benefit, they also credited the artist spaces with catalyzing other development and providing their neighborhoods with ongoing cachet. Although our data suggests the artist spaces helped in-crease property values in the surrounding neighborhood, we found few red flags that these spaces spurred gentrification-led displacement. The buildings strengthened, attracted, and helped retain artist entrepreneurs. Spending by artist residents and visitors provide boosts to neighborhood businesses. Inter-viewees also credited the artist spaces with modest social benefits including spurring artists’ civic involvement, providing the public with new places to gather and helping increase safety. However, not all artists, spaces or neighborhoods experienced these benefits to the same degree. The Traffic Zone artists’ high satisfaction rates stood out. Community members credited the Northern and Tilsner with helping spur neighborhood revitalization in St. Paul’s Lowertown and anchoring it as a home for working artists, whereas they perceived the Traffic Zone’s spillover impacts to be much more limited. Through our research we not only present impacts, highlighting different out-comes; we also probe why variations occur. Distinct neighborhood contexts, specific objectives for each project, and differences in physical design and op-
2 For full survey results, including response rates for each artist space, see Appendix A: Arts Ten-ant Survey Results 3 For a full discussion of the inherent methodological challenges to place-based evaluation and how this study builds on limited past research efforts, refer to Gadwa and Markusen's, “Defining, Meas-uring, and Comparing Place-Based Public Investment Outcomes” (2009).

11
erational structure account for many of the variations. The Northern and Tilsner’s development occurred part and parcel with Lowertown’s broad revi-talization efforts, and a range of public and private leaders prioritized artist space as an integral, long-term component of Lowertown’s future. In con-trast, Artspace developed the Traffic Zone as a means of securing studio space for artists at risk of dislocation in Minneapolis’ rapidly gentrifying North Loop. The non-residential Traffic Zone serves 23 mid-career artists who co-own the building in 50/50 partnership with Artspace. The Northern and Tilsner provide 52 and 66 live/work rental units, respectively, to artists who meet income restrictions mandated by Low Income Housing Tax Credit financing. The mixed-use Northern also hosts cafes, arts businesses and orga-nizations, and other commercial tenants, whereas the Tilsner is entirely live/work. Artists and a range of other community members provided invaluable insights as to what drove different outcomes. We synthesize these findings by benefi-ciary – arts tenants and the larger neighborhood and region. Artists and arts organizations value stability and affordability, specific physical attributes (such as large, flexible, light-filled spaces and shared workspace and meeting areas), good maintenance, and the opportunity to share governance responsibilities. We theorize that by increasing arts tenants’ satisfaction, Art-space and art tenants can maximize both the breadth of beneficiaries and the depth of the impacts themselves. Community members postulate another suite of factors that enhance or deter artist spaces’ spillover benefits. They see links between artists’ investments in their spaces and the extents to which they are civically involved and/or pro-vide arts offerings to the public. Literal ownership, length of tenure, and resi-dential components all foster artists’ vested interests in their space and the surrounding neighborhood. Many interviewees feel broad community impacts do not occur absent a critical threshold of artists or arts activity. Live/work spaces and larger projects more effectively tip the balance, as does developing a project in a neighborhood with an existing density of artists and/or arts or-ganizations. Community members also point out that physical links to a sur-rounding neighborhood foster broad arts-related, economic, social, and physi-cal impacts, whereas isolated spaces face handicaps. Interviewees see links between an artist space’s broad community value and the number and fre-quency of public events it hosts, as well as the presence of arts and/or com-munity-oriented commercial tenants. Lastly, we caution that artists (individu-ally and collectively) and Artspace face internal challenges that damper their ability to affect broad community goals. Although, as our research demon-strates, artist spaces do yield neighborhood and regional benefits, we feel their primary purpose and value is to the immediate artists and arts organization users. We caution those seeking to use artist spaces as a means to an end of achieving other revitalization do so in concert with other efforts. Although this research breaks new ground in articulating how artist spaces matter, to whom and why, both Artspace and its external stakeholders, rang-

12
ing from artists to funders to prospective communities, should not lose sight of the fact that only three case studies inform our findings. Both Artspace and Metris Arts Consulting envision this study as the first in a series. We see a need to look at other Artspace projects from across the country, particularly non-urban spaces, those without artist coop structures, and Artspace’s more recent developments, which benefited from later organizational learning. By expanding our research, we will be better equipped to address the critical questions of which outcomes occur across different environments and what causal factors enhance or limit benefits. In this report, we first examine neighborhood change in both Lowertown and the North Loop, revealing factors working in tandem with the Northern, Tilsner, and Traffic Zone to strengthen neighborhood outcomes or limit their success. We next describe how each project came to be and convey their pre-sent-day attributes. We then present the artist spaces’ benefits to in-house art-ists and arts organization, and share insights surrounding arts tenants’ satisfac-tion. Next, we detail the artist spaces’ neighborhood and regional impacts and synthesize which factors appear to drive successful outcomes. Lastly, we summarize the conclusions we may draw based on these three case studies and outline avenues for future research.
CONTEXT AND EVOLUTION Artspace developed the Northern, Tilsner and Traffic Zone in neighborhoods with unique histories, which continued to evolve after the artist space’s crea-tion. The spaces’ different initial project objectives, sizes, tenant-mixes, gov-ernance structures, and physical neighborhood connections also critically in-form their varied outcomes. In this section, we first describe neighborhood change, unpacking contemporaneous dynamics at play. By examining the art-ist spaces within their greater context, we set the stage to explore their singu-lar contributions and significance. Next, we offer outsiders a snapshot of each project – how it came to be, and present day features ranging from physical characteristics and neighborhood siting, to the kinds of artists and other ten-ants in each building. We provide this necessary background so that readers may be better equipped to interpret the spaces’ impacts, presented subse-quently.
A Tale of Two Warehouse Districts In the late 19th and early 20th century, a warehouse district emerged in each of the Twin Cities. In both cases – St. Paul’s Lowertown and Minneapolis’ North Loop – the district’s ascent and decline was directly linked to that of the railroad. By the 1970s, artists flocked to both areas, adapting under-utilized warehouse spaces, with their cheap rents, high ceilings, good light, and large doors and elevators, into studios. Despite these parallels, the two neighborhoods’ paths diverged. Minneapolis’ North Loop saw a more dra-matic and accelerated increase in population, residential construction, and rental and ownership costs. Lowertown experienced a more gradual and so-cially inclusive transformation, stewarded by a range of public, philanthropic,

13
and private entities. Many of these players viewed affordable, sustained artist live/work space as core to Lowertown’s identity. In contrast, the North Loop’s working artists all but disappeared, with a prominent exception of the founding artists of the Traffic Zone. St. Paul’s Lowertown – It Takes a Village to Build an Urban Village St. Paul’s Lowertown comprises the eastern portion of the city’s downtown district. Jackson Street bounds Lowertown on the west, I-94 on the north, railroad tracks on the east, and the Mississippi River on the south (Figure 1). The area’s name hails from the Mississippi’s Lower Landing, the historic “end of the line” for steamboats and St. Paul’s main supply hub until the railroad era of the 1880s (National Park Service 2009). St. Paul ascended with the rise of railroads; by 1900 an estimated 25% of all freight track mileage passed through St. Paul (Earhart 1992, 7). Lowertown’s close proximity to the rail center resulted in the area’s unique building stock, as wealthy industrialists, such as railroad mogul James J. Hill, built highly ornamented, massive struc-tures to serve as warehouses and wholesale houses for businesses dependent on the railroad (Moe 1997, 203). Although by 1983 Lowertown’s architectur-ally significant building stock earned it a designation on the National Register of Historic Places, the area suffered severe disinvestment after the railroad’s heyday. Road and highway improvements allowed production and warehouse companies to abandon inner city sites for wide, cheaper parcels of land and single story layouts. John Mannillo, a commercial real-estate broker and inves-tor specializing in Lowertown, explains:
Back in the ‘70s Lowertown was a very underutilized, tired part of the city and had been that way for two-three decades…. It was a drab, dreary, not very populated old warehouse district that was here because of the railroads.
Interviewees, including government officials and long-time Lowertown resi-dents and business owners, used descriptors like “dead-zone,” “forlorn,” and “wasteland” to portray Lowertown up through the 1980s. By the 1970s, artists gradually began moving in to Lowertown’s underutilized warehouses. Long-time resident artist Marla Gamble recalls the majority of artist spaces functioning as unsanctioned live/work spaces:
People were living in their studios…when they heard the inspectors were coming, all the mattresses got put in the basement. No one had water. There were no kitchens. Artists just had hotplates and refrigerators.

14
Figure 1 Lowertown, St Paul and Vicinity
Sources: Census 2000 boundary files, ESRI nation-wide databases, Google Earth, http://minnesota.publicradio.org/tools/maps/transit/central/ A number of converging factors gradually turned the tide for Lowertown – grassroots artist organizing, changing market forces, public sector leadership and vision, and a unique public-private partnership. Mayor George Latimer, elected in 1976, prioritized boosting population downtown as a way to attract commercial investment. In 1978, Latimer persuaded the McKnight Founda-tion to dedicate $10 million to Lowertown’s revitalization by establishing and funding the Lowertown Redevelopment Corporation (Moe 1997, 204-205).
The Lowertown Redevelopment Corporation, an independent tax-exempt agency, stewarded Lowertown’s redevelopment for nearly three decades by designing, marketing and financing physical investments. In 1983 the Lower-town Redevelopment Corporation secured Lowertown’s designation on the National Register of Historic Places, enabling developers to access historic preservation tax credits and fueling redevelopment. In 1984 Lowertown earned a local historic designation, allowing the City to impose consistent de-sign standards for development in the area (Moe 1997, 208). The St. Paul Farmers’ Market also moved to its current Lowertown location at 5th and Wall Street in the early 1980s (The St. Paul Farmers' Market 2009). The Farmers’ Market and Mears Park continue to serve as neighborhood focal points, and much of the redevelopment radiated out from those two amenities.
St. PaulMinneapolis
Hennepin Ramsey
#
Northern Warehouse Artists' Cooperative
# Tilsner Artists' CooperativeLowertownCensus Tract 342St. Paul Central Business DistrictPlanned Light Rail Transit
’ St. Paul Farmer's Market
’ Mears Park
¯0 10 205 Miles
¯
X
X
X
X
X
X#
#’’10
Fort R
d
Lafayette Fwy
Lafayette Rd
Robert St
University Ave 52
10
Fort Rd
!"#94
!"#94 Kellogg Blvd
Jackson St
9th St
5th St
7th St
Wall St
7th Pl
7th Pl
7th St
5th St9th St
9th St
7th S
t
0 0.2 0.4 0.60.1 Miles
Map created by Overview for Metris Arts Consulting - 12/20/2009

15
Three early residential apartment conversions, the Cosmopolitan, The Park-side, and Lowertown Commons, initiated in 1982 by Historic Landmarks for Living, propelled artists living and working in Lowertown to get organized. According to Marla Gamble, artists convened a town hall style meeting and 100 artists joined an artist housing committee. Although Gamble claims the Historic Landmarks for Living projects may have displaced 250 artists, the developments sowed the seeds for artists to stake a claim for stable, afford-able housing in Lowertown.
The artists found a surprising array of allies for their grassroots efforts. Art-space Projects’ Cheryl Kartes served as an integral consultant in the develop-ment of the Lowertown Lofts’ Artist Cooperative, a limited equity ownership artist cooperative, which opened in 1985 (Lowertown Lofts Artists Cooperative 2009). Artspace then took an organizational leap, directly devel-oping both the Northern Warehouse Artists’ Cooperative (completed in 1990) and the Tilsner Artists’ Cooperative (completed in 1993). Both the Lower-town Redevelopment Corporation and the City of St. Paul embraced artist housing, not as a transitional instrument to attract higher-end development, but as a fundamental aspect of their long-term plan for Lowertown to be-come an urban village serving a heterogeneous mix of people and uses (Moe 1997, 207). John Mannillo recalls, “[Mayor] Latimer was a man with vi-sion…one of his visions was retaining the artist population in Lowertown.”
As Gary Peltier, a retired St. Paul Planning and Economic Development staffer, recalls:
City staff and council people and mayors were receptive to artists – they [art-ists] were begging to do something in Lowertown, and we wanted something done in Lowertown.
The Lowertown Redevelopment Corporation directly supported artist-housing efforts through gap financing and by promoting the cause to devel-
Left:
The Cosmopolitan
Right: Lowertown Lofts Artist
Cooperative
Photos © Metris Arts Consulting, 2010

16
opers and the city. Director Weiming Lu even took the St. Paul planning di-rector on a tour of artist housing in Washington, D.C., and Boston. Gradually, Lowertown experienced a transformation. As Sara Remke, owner of the Black Dog Café, describes, “Slowly each new thing that came helped to create something. Each new thing helped create confidence.” Census data re-veals that from 1980 to 2000, Lowertown’s population grew 372%, greatly outpacing population growth for the City of St. Paul as a whole and area counties (Figure 2). The population climbed from 1980 levels of 522 people, to 1,285 in 1990 and to 1,941 in 2000. The housing stock increased 560% be-tween 1980 and 2000 (Figure 3). Over 1,200 units were added to the 1980 baseline of 268 units, bringing totals to 1,407 units in 1990 and 1,502 in 2000. Weiming Lu, former director of the Lowertown Redevelopment Corporation, estimates Lowertown’s current population and housing stock now has reached 5,000 people and 2,600 units. However, due to concerted efforts by the public and philanthropic sectors and nonprofit developers, Lowertown’s resurgence did not eradicate affordable housing. Weiming Lu estimates that 25% of Lowertown’s current housing stock is designated for low and moder-ate-income households. John Mannillo explains, “They never shied away from affordable housing...they all co-exist and it hasn’t hurt the values of the condo owners around it.” Census data reveals that although inflation- adjusted resi-dential rents increased between 1980 and 2000 in downtown St. Paul/Lowertown they have done so much more moderately than in Minnea-polis’ North Loop (Figure 4). Downtown/Lowertown’s inflation- adjusted median residential gross contract rents rose from $424 in 1980 to $619 in 1990 and $645 in 2000 (in 2000 dollars). As of 2000, rents surpassed St. Paul’s citywide average, but remained below averages for area counties (Figure 4). Other evidence of improved quality of life in Lowertown abounds. Starting in the 1990s during a dip in the condo market, a number of arts organizations set up shop in Lowertown, including the Jerome Foundation, Theatre Mu, Saint Paul City Ballet and Zeitgeist.4 During summers, Mears Park is home to outdoor music festivals like Concrete and Jazz. Saint Paul’s largest park, the Vento Sanctuary, opened in 2005 just to the east of Lowertown and now connects 85 miles of regional trails (Lower Phalen Creek Project 2009). Folks living in Lowertown walk downtown to access employment. Robyn Priestley, director of the St. Paul Art Collective, notes, “People say St. Paul is dead, but there are always people walking around unless it’s a million degrees below zero.” And as population and activity increased, so did perceptions of safety. Although analyzing crime statistics exceeded the scope of this analysis, Marla Gamble notes, “the more people that came, the less crime we saw. There were fewer transients.”
4 Marla Gamble, interview by Metris Arts Consulting, St. Paul, MN, September 21, 2009.

17
Figure 2 Population Growth: Lowertown vs. St. Paul and Hennepin and Ramsey Counties
Source: Census data Figure 3 Housing Growth: Lowertown vs. St. Paul and Hennepin and Ramsey Counties
Source: Census data
100%
246%
372%
101% 106%
109% 116%
50%
100%
150%
200%
250%
300%
350%
400%
1980 1990 2000
Lowertown St. Paul Hennepin & Ramsey Counties
1980=100%, Project Completed: Northern 1990, Tilsner 1993
100%
525%
560%
106% 104%
116% 121%
50%
150%
250%
350%
450%
550%
650%
1980 1990 2000
Hou
sing
Uni
ts C
hang
e (%
)
1980=100%, Projects Completed: Northern 1990, Tilsner 1993
Lowertown St. Paul Hennepin & Ramsey Counties

18
Figure 4 Change in Rents: Downtown/Lowertown vs. St. Paul and Hennepin and Ramsey Counties
Source: Census data Lowertown faces dramatic land-use changes on the horizon. Lowertown will be the terminus for the metro region’s new light rail transit line, the Central Corridor. The historic Union Depot will function as the rail station, and many community members have high hopes that Amtrak may also resume service at the station. Along with concerns about the potential negative impacts of the construction phase, many residents have voiced opposition to the slating of a large former manufacturing plant in Lowertown as the LRT’s maintenance facility (Combs and Minnesota Public Radio 2009). The Saint Paul Saints, a minor league baseball team, also have their sights set on Lowertown as a pre-ferred site for a new stadium. Despite the City of Saint Paul’s track record of commitment to affordable live/work space for artists in Lowertown, many artists fear these impending land-use changes threaten the continued survival of Lowertown’s artist spaces. Minneapolis’ North Loop – “Where have all your artists gone?” Even today, what residents consider and the City of Minneapolis officially designate as the North Loop neighborhood is often known simply as the Warehouse District, an area which bleeds south of the neighborhood’s official boundaries. Interstate 94 bounds the North Loop on the west, Plymouth
424
619 645
315
892 896
474 581 565 587
694 690
0
100
200
300
400
500
600
700
800
900
1000
1980 1990 2000
Med
ian
Res
iden
tial G
ross
Con
trac
t Ren
t (20
00 $
)
Projects Completed: Northern 1990, Tilsner 1993
Downtown/Lowertown (Census Tract 342)
North Loop
St. Paul
Hennepin & Ramsey Counties

19
Avenue on the north, the Mississippi River on the east, and Hennepin Ave-nue, Third Avenue, and I-394 on the south (Figure 5). Facilitated by rail con-nections to the agrarian economies of the Northwest, the area functioned as a hub for farm implementation warehouses and wholesalers through the 1920s. However, the area’s architecturally significant building stock increasingly fell into disrepair as the Great Depression took its toll and rail lost importance as a transportation system.
Figure 5 North Loop Minneapolis and Vicinity
Sources: Census 2000 boundary files, City of Minneapolis CPED, Google Earth, ESRI nation-wide databases
Through the 1970s and 1980s, two very different types of economic actors began to take advantage of depressed rents, proximity to downtown, and the historic warehouse building stock. Owners of adult-entertainment businesses began buying up area real estate for their enterprises, to comply with a zoning ordinance that confined these activities to downtown, away from schools, churches, and residential areas. On the other side of the spectrum, artists adapted the open, flexible spaces into studios and galleries. Minneapolis artists can still rattle off a litany of former artist buildings both within the North Loop’s neighborhood boundaries and just to the southeast on First Avenue North between Sixth and Third Streets. The area functioned as the epicenter
St. PaulMinneapolis
Hennepin Ramsey
# Traffic Zone Center for Visual Art
North Loop
55401 Zip Code
Minneapolis Central Business District
Light Rail Transit
’ Target Field
’ Target Center
¯0 10 205 Miles
¯
’
’
X
X
X
X
X
X
X
#
52
10th St8th St
Cent
ral A
ve
University Ave
4th St
65
122
4th
Ave
Ced
ar A
ve
55
15th
Ave
Washington Ave
4th St
!"#94
!"#394
!"#94
7th St 5th St
3rd St
1st St
3rd
Ave
1st Ave
5th
Ave
9th St
7th Ave
9th
Ave
1st A
ve 7th St
7th Ave
9th St
9th Ave
3rd Ave
9th A
ve
7th St
3rd Ave
7th St
9th Ave
5th Ave
9th St
5th
Ave
3rd
Ave
7th
Ave
3rd St
3rd St
1st A
ve
5th St 3rd Ave
5th Ave
3rd
Ave
5th St
7th Ave
0 0.25 0.5 0.750.125 Miles
Map created by Overview for Metris Arts Consulting - 12/20/2009

20
of the Minneapolis art scene in the 1980s. Nick Legeros, a sculptor and the former president of the North East Minneapolis Arts Association, recalls that downtown office workers would knock off work on Friday evenings, hit a couple of happy hours, and go to gallery opening after gallery opening, drink-ing wine and buying art. In keeping with the go-go ‘80s, “artists were making great money and successful business people were finding artists they liked.”
However, the residents, business owners and government officials we inter-viewed perceived a boom in townhouse and condominium construction and conversion, which peaked in the mid-to-late 1990s, as the most dramatic change the North Loop neighborhood experienced since the 1970s. From 1980 to 2000, the North Loop’s population increased 448%, spiking from 338 in 1980 to 647 in 1990 and 1,515 people in 2000 (Figure 6); the housing stock grew 807%, soaring from 84 units in 1980 to 403 in 1990 and 678 in 2000 (Figure 7).
Photo: 700 block of First Street North, Minneapolis, 1921 Source: Minnesota Historical Society
Former artist buildings, Minneapolis Warehouse District: Left: Lumber Exchange Right: Ford Center Photos © Metris Arts Consulting, 2010

21
Figure 6 Population Growth: North Loop vs. Minneapolis and Hennepin & Ramsey Counties
Source: Census data Figure 7 Housing Growth: North Loop vs. Minneapolis and Hennepin and Ramsey Counties
Source: Census data
100%
191%
448%
99% 103%
109% 116%
50%
100%
150%
200%
250%
300%
350%
400%
450%
500%
1980 1990 2000
1980=100%, Traffic Zone completed 1997
North Loop Minneapolis Hennepin & Ramsey Counties
100%
480%
807%
102% 100%
116% 121%
0%
100%
200%
300%
400%
500%
600%
700%
800%
900%
1980 1990 2000
Hou
sing
Uni
ts C
hang
e (%
)
1980=100%, Traffic Zone completed 1997
North Loop Minneapolis Hennepin & Ramsey Counties

22
As far as which factors triggered this residential surge, interviewees pointed to the proximity to Minneapolis’ central business district and the Mississippi River and the appeal of the historic building stock (portions of which have been recognized as historic districts locally and by the National Register of Historic Places). Some acknowledged the cachet lent by visual artist pioneers as an important influence, while others downplayed their significance. For instance, David Frank, a North Loop resident and chair of the North Loop Neighborhood Association, felt that although arts activity accelerated the process, the market would have figured that proximity to downtown made sense, regardless. “You can throw a rock to the IDS tower. Everyone’s feeling the rising price of gas.” North Loop developer Chuck Leer felt that the neigh-borhood never reached the critical threshold of artist density required to gen-erate the “lively community” characteristic of artist enclaves, although he ac-knowledged their important role in cycle of adaptive-reuse: “They do identify cool spaces, but the social value in that is in turn-over to next higher and bet-ter use, which in this case has been residential.”
Above: Renaissance on the River
Right, top to bottom:
River Station, The Itasca , The Landings
Photos © Metris Arts Consulting, 2010

23
Regardless of how much of a catalytic effect the artist presence had in spark-ing the residential surge, few artist studio or gallery buildings survived in the North Loop. The Traffic Zone founding artists may constitute the area’s only holdouts. Recently, however, a handful of galleries have opened in the vicin-ity, including Form + Content and the Circa Gallery, joining a small presence of theaters and arts organizations, such as the Lab Theater, Interact Center, and the offices of Minnesota Opera. Artists faced dramatic rent increases, and developers converted many artist buildings into condos. Census data reveals residential rents increased 184% in the North Loop from 1980 to 2000, ad-justing for inflation. The median residential gross contract rent climbed from $315 in 1980 to $892 in 1990 and $896 in 2000 (in 2000 dollars) (Figure 8). Just southeast of the North Loop neighborhood, the galleries and studio buildings lining First Avenue North failed to harmonize with the massive Target Center sports arena constructed in 1989, which occupies 1.5 square blocks (Munsey and Suppes). Landlords turned instead to nightclubs, sports bars, and office tenants, which offered higher rents.
North Loop performing venues and galleries: Top: The Lab Theater Bottom: Cira Gallery Photos © Metris Arts Consulting

24
Figure 8 Change in Rents: North Loop vs. Minneapolis and Hennepin and Ramsey Counties
Source: Census data Construction on yet another sports facility in the neighborhood, Target Field (home to major league baseball’s Twins) just concluded in winter 2009. In conjunction with the stadium, light rail transit now services the North Loop, with connections to a new commuter railroad, the North Star Line. North Loop workers and residents also gained improved stadium-initiated pedestrian amenities including sidewalk widening and pedestrian concourses. Although it’s too soon to tell what economic and social impacts the public-infrastructure upgrades, improved connectivity, and visits from baseball fans will yield, they may reinforce the North Loop’s gentrification trend. The similarities between Lowertown and the North Loop make their alternate re-vitalization trajectories all the more strik-ing. Two historic railroad-generated warehouse districts fell on hard-times. Enterprising artists played important early roles in adaptive reuse in each area. Both neighborhoods experienced dra-matic increases in population and resi-dential housing stock. However, because of concerted planning efforts and differ-ent market dynamics, the North Loop’s revitalization was more extreme and ac-
315
892 896
479 559 575
587
694 690
0
100
200
300
400
500
600
700
800
900
1000
1980 1990 2000
Med
ian
Res
iden
tial G
ross
Con
trac
t Ren
t (20
00 $
)
Traffic Zone Completed 1997
North Loop Minneapolis Hennepin & Ramsey Counties
Target Field Photo © Metris Arts Consulting, 2010
25
celerated than that of Lowertown. Minneapolitans no longer recognize the North Loop as an artist or arts hub. Through Lowertown’s more gradual re-newal, public, philanthropic, and private sector entities continued to prioritize affordable housing and artist live/work space. Today, the North Loop hosts a shiny new baseball stadium and a light rail station. Light rail looms near for Lowertown and a stadium may also be in the cards. Artspace Projects con-verted three historic warehouses into artist spaces in these different contexts. Remaining mindful of the unique factors working in tandem with the artist spaces to strengthen or limit outcomes, better equips us to understand the artist spaces’ significance and singular contributions.
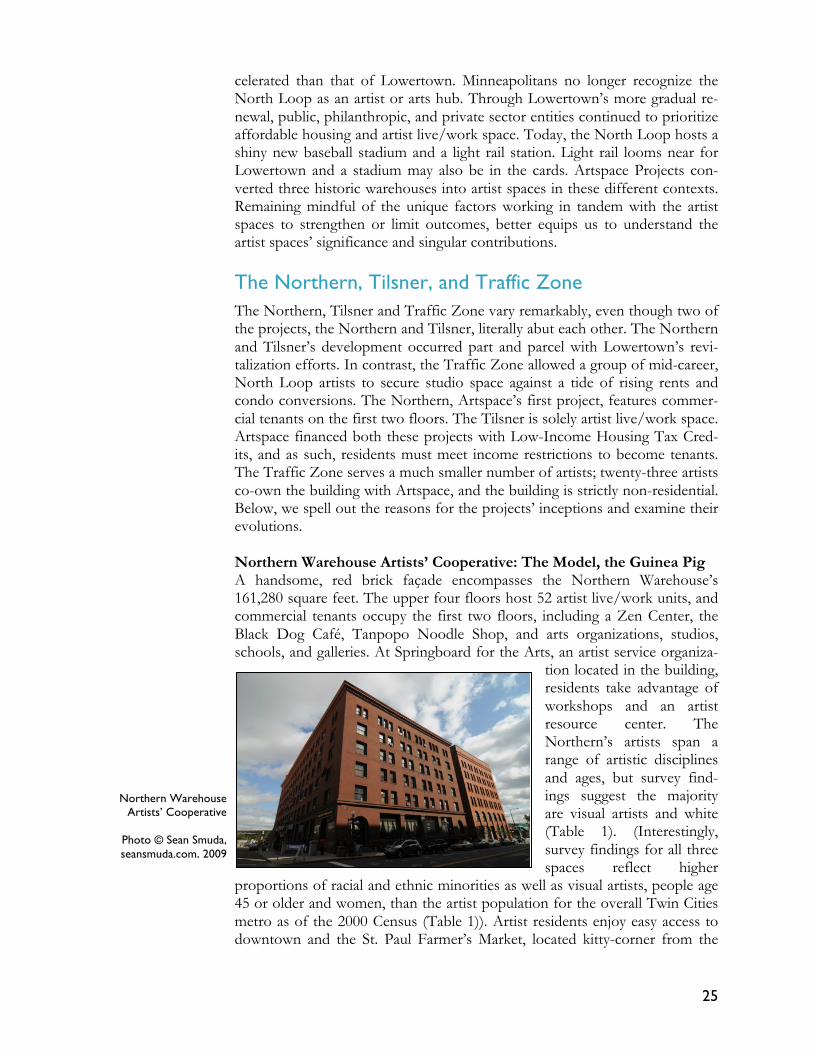
The Northern, Tilsner, and Traffic Zone The Northern, Tilsner and Traffic Zone vary remarkably, even though two of the projects, the Northern and Tilsner, literally abut each other. The Northern and Tilsner’s development occurred part and parcel with Lowertown’s revi-talization efforts. In contrast, the Traffic Zone allowed a group of mid-career, North Loop artists to secure studio space against a tide of rising rents and condo conversions. The Northern, Artspace’s first project, features commer-cial tenants on the first two floors. The Tilsner is solely artist live/work space. Artspace financed both these projects with Low-Income Housing Tax Cred-its, and as such, residents must meet income restrictions to become tenants. The Traffic Zone serves a much smaller number of artists; twenty-three artists co-own the building with Artspace, and the building is strictly non-residential. Below, we spell out the reasons for the projects’ inceptions and examine their evolutions. Northern Warehouse Artists’ Cooperative: The Model, the Guinea Pig A handsome, red brick façade encompasses the Northern Warehouse’s 161,280 square feet. The upper four floors host 52 artist live/work units, and commercial tenants occupy the first two floors, including a Zen Center, the Black Dog Café, Tanpopo Noodle Shop, and arts organizations, studios, schools, and galleries. At Springboard for the Arts, an artist service organiza-
tion located in the building, residents take advantage of workshops and an artist resource center. The Northern’s artists span a range of artistic disciplines and ages, but survey find-ings suggest the majority are visual artists and white (Table 1). (Interestingly, survey findings for all three spaces reflect higher
proportions of racial and ethnic minorities as well as visual artists, people age 45 or older and women, than the artist population for the overall Twin Cities metro as of the 2000 Census (Table 1)). Artist residents enjoy easy access to downtown and the St. Paul Farmer’s Market, located kitty-corner from the
Northern Warehouse Artists’ Cooperative
Photo © Sean Smuda, seansmuda.com, 2009

26
Northern. A garden behind the buildings, secured in part by artists’ fund-raising efforts, provides residents with green space. Table 1 Artist Demographics
Percentage Respondents
Northern Tilsner Traffic
Zone All
Twin Cities (2000)
What is your primary art form/arts occupation? Visual artist 75 60 100 74 38 Theater/dance artist 10 8 0 7 21 Musician 10 0 0 4 19 Literary artist 5 20 0 11 22 Other, please specify 0 12 0 5 0
Is your artistic work associated with a specific ethnic or cultural tradition or community? Yes 10 17 0 11 0 No 90 83 100 89 0
What is your age? 18-24 5 0 0 2 10 25-34 16 38 0 22 26 35-44 26 21 0 18 27 45-54 42 29 25 33 23 55-64 11 8 42 16 9 65 and over 0 4 33 9 5
What is your gender identity? Man 47 38 25 38 53 Woman 53 62 75 62 47
What is your primary race/ethnic identity? African American/African Descent 5 4 8 5 3 Asian, Asian American, Pacific Is-lander
0 8 8 5 1
Latino, Hispanic, Chicano 0 4 0 2 1 Native American, Native Alaskan 0 4 0 2 NA Caucasian, White 90 79 83 84 92 Other races, including multiracial 5 0 0 2 3 Sources: Arts-Tenant Survey, Census data5 The artists of the Northern take pride in the fact that it served as a model for future artist spaces created across the country. But they also experience both the benefits and the pitfalls of being the guinea pig. With the Northern, Art-space took an organizational leap from advocate for artists’ space needs, a
5 Minnesota Census data calculations by Ann Markusen, Greg Schrock, Sara Thompson & Anne Gadwa for Markusen Economic Research Services, based on Population Census PUMS data (2000, 5% file) from Integrated Public Use Microdata Series, Minnesota Population Center, University of Minnesota. Census estimates are based on a sample of people reporting their major occupation as artists.

27
mission it had fulfilled for nearly a decade, to hands-on developer. The orga-nization realized that by being proactive and gaining expertise in the devel-opment and financing process, it could help artists meet their space needs most effectively. Artspace pioneered the use of Low Income Housing Tax Credits (LIHTCs) as a means of financing affordable artist housing. (Created by Congress in 1986, LIHTCs offer federal tax credits to private investors in exchange for their equity investments in affordable housing.) As Will Law, Artspace’s chief operations officer, describes, Artspace realized it could use LIHTCs combined with “soft money” (government loans with favorable terms and philanthropic grants) to help artists lock in control of their real es-tate needs. Artspace patched together funding for the $5.6 million develop-ment from a total of 16 lenders and funders (Table 2). Artspace repays lenders with interest, although some government and nonprofit lenders forgive the principal and/or charge below-market interest rates, whereas funders provide grants. Artspace staff estimates private sector grants paid for approximately 10% of the Northern’s total development cost. Table 2 Northern Warehouse Financing and Funders Financing Amount ($)* Local Initiatives Support Corporation Metropolitan Low-Income Housing Partnership Minnesota Housing Finance Authority 1,808,310 Minnesota Nonprofit Assistance Fund Neighborhood Partnerships Program Saint Paul Department of Planning and Economic Development 904,000 TCF Bank
Funders
Bush Foundation City of Saint Paul (Cultural STAR Program) Dayton's and Target Stores
Jerome Foundation 112,500 Metro Regional Arts Council NEA 200,000 Northwest Area Foundation 90,000 Saint Paul Department of Planning and Economic Development St. Paul Companies 105,000
Total development cost 5.6 million *if available
As an early LIHTC project, the Northern Warehouse came online before many of the program’s restrictions became established. In later developments, Artspace struggled to replicate the Northern Warehouse’s open, flexible floor plans, for instance having to include bedroom doors and walls because of new LIHTC regulations. Will Law also recalls local flexibility on zoning issues in this early instance of residential adaptive reuse in St. Paul. However St. Paul’s

28
Planning and Economic Development department required that Artspace partner with a for-profit developer, Hawthorne Management, since it did not yet consider Artspace a developer of sufficient experience. Hawthorne Management, Artspace, prospective artist tenants, neighboring residents, the Minnesota Housing Finance Agency, and St. Paul’s government officials all held discrete objectives for the Northern. Hawthorne sought to reap likely returns upon selling the building at the end of the 15-year compli-ance period. Artspace wanted to directly meet artists’ space needs. A core group of founding artists, from Lowertown and all around Twin Cities, signed on, attracted by affordable space and the chance to live with like-minded art-ists. For a year and a half prior to the building’s opening, they worked with Artspace to help secure financing, map out a governance structure, and design the development.6 The neighboring artists of the Lowertown Lofts Coopera-tive hoped the Northern would anchor Lowertown as an artists’ community, and so they also assisted the project in many ways – letting bankers tour their building, selecting the original residents of the Northern, and holding coop trainings. As Lowertown Lofts artist Marla Gamble recalls, “many, many peo-ple helped in different aspects to support the Northern Warehouse.” The state housing authority and City realized they could support affordable hous-ing that simultaneously might spark broader neighborhood revitalization. Gary Peltier describes the City of St. Paul’s goals for the Northern:
It has to have a positive external impact…If it was an eyesore, boarded up, a nuisance, whatever, that has to be corrected…It has to look good. It has to be attractive. For heaven sakes, it has to be decent housing; the units have to meet all the codes. Yes, we also want it to have an impact in the immediate surrounding neighborhood. The city is always hoping that if we put a dollar of public funds in then maybe something will happen next door that we don’t have to put public funds into. We want the units to be a good live/work space for the artists. We expected and wanted the project to be a viable artist project because we saw all the positives the projects and the art-ists bring to Lowertown and that could only happen if units provided what the artists wanted...
As our research details, a range of community members feel the Northern benefited both tenants and the Lowertown neighborhood, and quantitative data support these perceptions. Yet artists, commercial tenants, and Artspace also point to specific ways in which the building could have been an even greater success, and Artspace adopted many of these changes in future pro-jects. For instance, the Northern lacks community space, now a standard de-sign element in Artspace’s developments. Limited resources made arriving at a shared set of priorities more challenging. For instance, financing challenges meant that dollars set aside for soundproofing evaporated, leading to some friction between neighbors. Artspace never again partnered with a for-profit developer. Artist tenants rent space from Artspace via a master lease with a distinct legal entity, the Northern Warehouse Artists Cooperative. The lease gives artists unusually wide latitude, such as the power to fire the residential
6 Connell Johnston, interview by Metris Arts Consulting, St. Paul, MN, November 12, 2009.

29
property management company and give substantial input on the budget and rent levels. The Northern artists value the coop tremendously as a vehicle for community building and the master lease for the greater autonomy it pro-vides. However, both the coop master lease and Hawthorne Management’s profit motive have led to some challenges refinancing the building as the tax-credit compliance period comes to an end. Nevertheless, Artspace anticipates the refinancing process to conclude in 2010, which will secure the Northern as affordable artist space for another 30 years. Tilsner Artists’ Cooperative: From Pigeon Droppings to Cups of Sugar Right next door to the Northern, the Tilsner devotes another 128,223 square feet to 66 artist live/work units. Artist and neighbor Marla Gamble observes that the Northern and Tilsner demarcate the edge of Lowertown. She says, “They are the line that says, ‘We [artists] are not going anywhere. We’re here to stay.’…They have strength because they are big buildings.” Inside the Tilsner’s 1895 Victorian Romanesque exterior is a mix of units, from studios to three-bedroom apartments, with community space on ground floor and basement levels. Two seven-story atriums let light penetrate the interior. Un-
like the Northern and Traffic Zone, the Tilsner has no commercial space because of flood-plain restrictions for the lower levels. Of the three Art-space projects, sur-vey findings suggest that the Tilsner’s population is the
most diverse in terms of artistic discipline, age, and race/ethnicity (Table 1). Compared to the Northern and Traffic Zone, fewer Tilsner survey respondents selected visual arts as their primary art form and more indicated their artistic work is associated with a particular ethnic or cultural tradition. Survey find-ings also indicated the Tilsner has the largest rela-tive minority population of the three spaces. In terms of age, 38% of Tilsner respondents fell within the 25-34 year old cohort, higher than either the Northern or Traffic Zone, although survey data indicate older artists also call the Tilsner home. The Tilsner’s design features attract younger house-holds. In particular, three-bedroom apartments and
a children’s playroom in the building appeal to artists with young children; in 2008, 18% of households had children. In terms of gender split, interviewees report 30 women and 52 men make up the cooperative, suggesting that re-
Tilsner Artists’ Cooperative
Photo from Artspace collection
Tilsner Atrium Photo © Sean Smuda, seansmuda.com, 2009

30
sponse bias severely skewed the survey findings of 62% women and 38% men. (In general, women are more likely than men to complete surveys). “The Tilsner was a bombed-out wreck,” recalls Artspace’s Will Law about the Tilsner’s redevelopment process. Former St. Paul Planning and Economic Development staffer Gary Peltier corroborates that it had no roof and pigeon droppings everywhere. Next door in the Northern, artist residents knew their homes would be less likely to catch fire if artists replaced the transient popula-tion sheltering in the Tilsner ruins. Artspace and the City of St. Paul saw an opportunity to carve out more artist live/work space in an area with a grow-ing critical mass of arts activity. Peltier explains, “There was still a demand and need for artist housing and it [the Tilsner] was sitting there in Lowertown, but it was going to cost a ton of money.” These circumstances propelled Art-space, its 50/50 partner Twin Cities Housing Development Corporation, the state housing authority and the City of St. Paul to rally together and rehabili-tate the Tilsner into artist housing. Artspace financed the project using low-income housing and historic preservation tax credits and assembled the $7.1 million dollars from a combination of bank, government and nonprofit loans and philanthropic grants (Table 3). Artspace staff members estimate that pri-vate sector grants made up about 10% of the Tilsner’s total development costs. Table 3 Tilsner Financing and Funders
*if available
Financing Amount ($)* City of St. Paul Family Housing Fund of Minneapolis and St. Paul 650,000 Lowertown Redevelopment Corporation 200,000 Minnesota Housing Finance Agency Minnesota State Housing Preservation Office National Equity Fund Saint Paul Department of Planning and Economic Development Saint Paul Historic Preservation Commission St. Paul Housing and Redevelopment Authority 970,000 U.S. Bank 1,064,000 Funders Bush Foundation 256,000 City of St. Paul (Cultural STAR Program) Local Initiatives Support Corporation McKnight Foundation 120,000 Northwest Area Foundation 200,000 St. Paul Companies 105,000 St. Paul Foundation 15,000 Total development cost 7.1 million

31
Despite challenges during construction that ranged from an unearthed arte-sian well triggering a 30-foot geyser to a massive internal restructuring and staff reduction within Twin Cities Housing Development Corporation, the Tilsner opened its doors to 66 artists and their families in 1993. Today, artists view the internal community as the Tilsner’s strongest suit. Artist Teena Janay Roberson explains that at the Tilsner kids really do stop by and ask to borrow baking ingredients, as well as giving impromptu violin recitals upon request. Another Tilsner artist shares:
Last winter, I probably would have starved if it weren’t for my neighbors. That’s how it is here. People care for one another.
However, as we detail in Benefits to In-house Artists, both interview and survey findings reveal that Tilsner artists are less satisfied than those at the Northern or Traffic Zone on issues ranging from affordability to maintenance. Traffic Zone: Experiment in Artist Ownership In a unique model, 23 visual artists co-own and operate the Traffic Zone building through a for-profit corporation, in 50/50 partnership with Artspace. Their studios, complete with hardwood floors, high ceilings, exposed brick and large windows, make up the first, second and third floors. The building’s main lobby doubles as an exhibition space. Commercial tenants including a wine bar, architecture firm, social service nonprofits, and Artspace itself, fill the upper three floors and a space on the ground level. The building’s distinc-tive limestone exterior harkens back to its 1886 origins as a farm implement warehouse. Nearby, an onramp for I-394 and the prominent pink façade of the Déjà Vu adult entertainment venue contribute to a challenging sense of physical isolation.
Traffic Zone Center for Visual Art
Photo from Art-space collection

32
The Traffic Zone serves mid-career artists, who also tend to be older. Artist Jim Dryden shares, “Internally, we ask how do we get more diversity? It really tends to be an age thing; we all tend to be the same age.” Survey results sup-port this observation (Table 1). Seventy-five percent of artist respondents from the Traffic Zone indicated they are over age 55. Survey data suggests women and Caucasians also comprise a larger share of Traffic Zone’s mem-bership than men and racial and ethnic minorities (Table 1).
The impetus to create the Traffic Zone came about in the early 1990s, when a group of visual artists working out of a North Loop warehouse building feared their studio space might be under threat. In the last 10 years, they’d wit-nessed dramatic rent increases, and all around them developers were con-structing townhouses and converting warehouses into condos (Figure 7-8). The artists knew Artspace successfully developed live/work spaces in St. Paul financed with Low Income Housing Tax Credits. However, because many of these mid-career artists exceeded in-come restrictions, they needed an alter-nate model to secure workspace in the North Loop. In the limited-equity model they struck up, the artists co-own the Traffic Zone via a for-profit corporation in 50/50 partnership with Artspace. In the unlikely event that Artspace and the artists decided to sell the entire building, individual artists would recoup a portion of the building’s appreciated value. However, when individual artists leave the Traffic Zone, they must sell to an-other artist and can only recoup the value of improvements made to their space. Founding artists also dedicated countless hours and took considerable personal risks to make the Traffic Zone a reality. Artist Harriet Bart explains, “The artists involved in the beginning risked everything to put their name on a $1 million mortgage; so we were not just relying on grants.” However TCF bank, the City of Minneapolis, and a few local foundations, most significantly the McKnight Foundation, provided critical grants and loans with favorable terms (Table 4). Law explained that these key supporters believed the project would benefit the cultural health of the larger community by retaining artists downtown. However, because the project did not serve low-income artists, the partners faced challenges attracting philanthropic sup-port. As a result, they incrementally phased in the $4.3 million redevelopment from 1992 to 1997, one floor at a time. Early commercial tenants in the mixed-use building made improvements in their space in exchange for favor-able lease terms. Although the 1886 structure is listed on the National Regis-
Top: Déjà Vu Bottom: I-394 onramp Photos © Metris Arts Consulting, 2010

33
ter of Historic Places, the redevelopment’s incremental nature put Historic Preservation Tax Credits out of reach. Zoning restrictions also made live/work space prohibitively expensive, so the partners opted for a studio-only project, despite some artists’ initial interest in combined residential and studio space. Table 4 Traffic Zone Financing and Funders Financing Amount ($)* Greater Metropolitan Minneapolis Housing Corporation Minneapolis Community Development Agency 500,000 Minnesota Nonprofit Assistance Fund TCF Bank 1,450,000 Funders Dayton Hudson Foundation 24,000 General Mills Foundation 13,000 McKnight Foundation 325,000 Minneapolis Heritage Preservation Commission Piper Jaffray Foundation 2,000 Winthrop & Weinstine Total development cost 4.3 million
*if available Traffic Zone’s phased redevelopment tried both Artspace and the artists. Har-riet Bart recalls, “There were many times we thought we would never see the day that this place was up and running…They [Artspace] pulled rabbits out of hats.” Will Law attests that the artists hung in, volunteered a ton of time and sweat equity to build out their spaces, and worked really hard for the oppor-tunity. Artspace also donated countless hours of staff time, subsidizing the project considerably by forgoing a developer’s fee. Artspace now benefits by maintaining its office in the building, with favorable rent terms. Traffic Zone’s 23 artist members still co-own the building and directly influence its day-to-day management. As we detail in Impacts and Insights, interviewees see differences between neighborhood contexts, project objectives, physical designs, and operational structures for the Northern, Tilsner and Traffic Zone as directly linked to variations in outcomes. Neither Artspace, founding artists or the City held high hopes that the Traffic Zone would re-anchor the North Loop as an arts hub or spur broad physical or economic development; they saw the gentrifica-tion pressures as too extreme and advanced and the Traffic Zone as physically isolated. Instead, the Traffic Zone succeeded at preserving studio space for a group of mid-career North Loop artists at risk of dislocation. In contrast, the timing of the Northern and Tilsner’s development, which occurred in concert with other revitalization efforts, and the projects’ larger sizes, live/work de-sign, and LIHTC-prescribed affordability allowed them to help anchor Low-ertown’s revitalization and secure the neighborhood as a lasting home for working artists. Alternate governance approaches (artist co-ownership at the

34
Traffic Zone and a high degree of autonomy at the Northern) seem to influ-ence artist satisfaction. The projects’ distinct tenant mixes (mid-career artists at the Traffic Zone, artists meeting income restrictions at the Northern and Tilsner, younger artists at the Tilsner, community-oriented cafes and arts businesses and organizations at the Northern) also contribute to perceived differences in the benefits arts-tenants and neighborhoods experience.
IMPACTS AND INSIGHTS Benefits to In-house Artists Regardless of the occupation’s intrinsic value, being an artist is a tough nut to crack. In Economics of Arts and Culture, Heiburn and Gray found that U.S. art-ists on average only earn 64% of the mean for all professional workers, with dancers and musicians earning only about one third (1993). As sculptor Nick Legeros notes, “very few people come out of college and make a living as an artist. They struggle to find the time to make their art and try to make a living, or they get pulled away by the lure of a solid paycheck.” And in particular, artists need space, often with unique features, to create their work. Many visual artists require good light and high ceilings, large doors and elevators, or access to specialized equipment from kilns to floor drains. Musicians need soundproofing, dancers need sprung floors. Juggling the costs of living space and artistic workspace strains most artists’ already tight budgets. Combined live/work space “pro-vides a real boost to have a career in the arts, to get that foot in the door,” Legeros ob-serves. Even beyond directly addressing artists’ physical space needs and helping reign in their associated costs, many supporters of artist space presume that by co-locating art-ists in a single building, the sum will be larger than its parts. Neighboring artists should more readily collaborate, network, and share equipment, knowledge, and skills. Being surrounded by other working artists also reduces artists’ isolation and may instill them with the confidence that they, too, can and should keep at it. Likewise, the public often treats an artist with a designated workspace more seriously, helping to enhance his or her reputation. Gary Peltier articu-lates the City of St. Paul’s hopes that these effects would translate into eco-nomic returns for the Northern and Tilsner: “We all thought that these single artists, if we gave them the opportunity with a place to do their work, some of them could build it up to a real business, if you will, and create jobs, and ex-pand out of their unit.” We surveyed and interviewed artists at the Northern, Tilsner, and Traffic Zone to determine the degree to which these assumptions held for these in-
Bob Calton, Tilsner Artist, Photo © Metris Arts Consulting, 2010

35
house artists. (For full survey data, see Appendix A: Arts Tenant Survey Re-sults.) Our findings were striking. Our evidence indicates that these spaces:
• Meet a majority of artists’ needs, overall and with respect to afforda-bility
• Promote synergies between artists (collaborations, networking and sharing equipment, resources, knowledge, and skills)
• Strengthen artists’ reputations and validate their identities • Enhance artists’ ability to create art through time and productivity
gains
However, artists varied regarding their ability to convert these enhancements to their artistic careers into increased income. Below, we detail these findings and highlight important variations across spaces. The Space “Works” – Affordability and Meeting Artists’ Needs On the most fundamental levels, majorities of in-house artists indicated their space works for them. Eighty-six percent of artist survey respondents felt their space and building was appropriate to their needs and 62% considered their space affordable (Table 5). Whereas 30% of the nation’s renters move annually, the Tilsner experienced turnover rates of 26% and 27% in 2008 and 2009, respectively, and the Northern’s pre-2009 rates spanned 19% to 23%, although 2009 levels rose to 33% due to uncertainty surrounding the build-ing’s refinancing after the expiration of tax credits (U.S. Census Bureau 2007).
As Days Pass by Kara Hendershot
(Northern Artist), 2007

36
Table 5 Artist Survey Results: Meeting Needs and Affordability
Respondents selecting yes (%)
All Northern Tilsner Traffic Zone
Overall, do you perceive your space and the building as appropriate to your needs?
86 90 76 100
Do you consider your space afford-able? 62 70 42 92
Most of us would say that we have the studio of our dreams.
– Harriet Bart, Traffic Zone artist The space has been a godsend for me. I would not be able to live and work like this anywhere else. Especially for this price, even though it is difficult to afford as is.
– Northern artist survey respondent
I am amazed at how much space we do have…I have enough space that I can choreograph dancers no problem…the consistency of space available here is so important. Every day do I go rehearse? No. But every day do I have the option to? Yes.
– Matthew Hodge, Tilsner artist The differences between spaces stand out – in particular, the Traffic Zone’s and Tilsner’s relatively high and low satisfaction rates, overall (100% vs. 76%) and with respect to affordability (92% vs. 42%). However, the extreme struc-tural differences between the non-residential Traffic Zone, which serves mid-career artists, and the live/work, LIHTC-financed Northern and Tilsner pre-vent direct comparisons between these artist satisfaction rates. Some very dif-ferent economic dynamics underpin these results. As residents of live/work buildings financed with LIHTC, artists at the Northern and the Tilsner benefit from capped rent levels, but applicants must also meet income requirements. To qualify, prospective residents’ income must fall at or below 60% of area median income (for 2009, $35,220, $40,260 and $45,300 for households of one, two, and three individuals, respectively). The program dictates caps on rent set to 30% of 60% of area median income, but these rent levels strain individuals’ budgets if they earn less than 60% of area median income. Unlike most landlords who maximize profits, Artspace set rents to the minimum levels needed to meet financial responsibilities and ensure upkeep. Bill Mague, Artspace’s portfolio director, explains that ideally Artspace would set rents at levels affordable to those making 30-50% of area median income, but it has not been able to secure the necessary subsidies. Artist live/work units at the Northern range from 1,005 to 1,735 square feet, and current monthly rents range from $735 to $900. At the Tilsner, units range from 905 to 2,191 square feet and from $654 to $1,194 a month. In ad-dition to slightly higher average monthly rents/square foot ($0.75/square foot for the Tilsner vs. $0.59 for the Northern), the Tilsner artists’ median income

37
is lower than at the Northern (in 2008 $21,581 vs. $27,878). However, both spaces feature rents far below Lowertown’s current average market rental rate of $1.35/square foot (US Condo Exchange, LLC 2010). Although the artists at the Northern and Tilsner benefit from being able to combine living and studio expenses, they vary regarding their ability to pay:
I can count 50% towards my business and 50% to living; that makes them both cheap.
– Bob Calton, Tilsner artist
STOP RAISING RENT ON POOR ARTISTS ALREADY!!!! – Tilsner artist survey respondent
It's affordable, however I do believe that the rent is pretty high when you also have to be under certain income requirements.
– Tilsner artist survey respondent
$800 is a good chunk of change, especially for an artist, and the rents have been going up.
– Justin Busch, Northern artist In contrast, the non-residential Traffic Zone serves mid-career artists who have a greater relative capacity to afford their spaces and who have met their living space needs through other means. To gain membership, a Traffic Zone artist pays a $5,000 membership fee (refunded upon exit) and covers the costs of prior improvements made to their individual units, the value of which ranges from $500 to $20,000. Subsidized by commercial tenants, artists’ monthly rents range from $296 for 651 square feet to $900 for a spacious 1,979 square foot studio. Some Traffic Zone members also share their studios with other artists, further defraying costs. In addition to affordability and meeting needs, Traffic Zone artists demon-strated relatively higher satisfaction levels on a number of metrics, as detailed below. We attribute some of the variation to inherent differences between the artist populations served at the Traffic Zone and the residential, LIHTC pro-jects. Since the Traffic Zone targets mid-career artists, these individuals are more likely to be content – economically, professionally, and, by extension, with their working space. However, by interviewing and surveying artists in all three spaces, we also extrapolated factors that influence tenant satisfaction. We highlight these determinants subsequently in Insights: Factors Affecting Ten-ant Satisfaction. Fostering Synergies Our findings affirm that living and/or working at the Northern, Tilsner, and Traffic Zone facilitates artists’ networking and collaborations and enables them to share equipment, resources, knowledge, and skills. Artist survey re-spondents showed the most consensus around artist space’s benefits with re-spect to networking, with 83% of artist respondents agreeing that living and/or working in the Artspace building facilitated networking, followed by

38
sharing equipment and/or resources (68%), sharing one’s skills or knowledge with others (63%), facilitating collaborations (59%), and learning skills or knowledge from others (57%) (Table 6). Table 6 Artist Survey Results: Connecting with Others in the Building
Living and/or working in the Artspace building has… Respondents selecting agree to strongly agree (%)
All Northern Tilsner Traffic Zone
enabled me to share equipment and/or resources with others in the building. 68 55 64 100
facilitated my collaborations with others in the building. 59 45 60 83
facilitated my networking with others in the building. 83 75 80 100
allowed me to learn new artistic or business skills/knowledge from others in the building.
57 47 60 67
allowed me to share my artistic or busi-ness skills/knowledge with others in the building.
63 55 64 75
Through interviews and free responses on the survey, artists spoke directly to the types of synergies they’ve accessed due to the artist space and how they value these exchanges:
Being here has fostered lots of collaborations – very simple ones and some that are very elaborate or really big projects…Unlike a regular apartment building, there is sort of an instant camaraderie. When you meet in the eleva-tor, you ask them what they’re working on…In the building, we all know each other by sight and by art form.
– Besty Dollar, Northern artist
It has given me opportunities to network and a fellowship I got would not have happened if I was not there, just because of the people who I met.
– Northern artist survey respondent
My drill gets loaned out all the time because I’ve got a decent drill. My sander. My ladder gets loaned out. I also borrow Shane’s ladder because his goes all the way to the ceiling.
– Lisa Mathieson, Tilsner artist These exchanges take place through concerted, building-wide efforts as well as informally. The Tilsner’s website and Facebook profile drive traffic to indi-vidual artist pages. Traffic Zone artists engage in building-wide marketing ef-forts. To promote their semi-annual Open Studios event, they send press kits to 50 media organizations and each artist taps his or her individual mailing list. Artist Jim Dryden invited 250 people and benefits from other artists’ invitees

39
visiting his studio in turn. “Being able to access the combined efforts of mul-tiple artists,” he says, “is one of the true advantages of working in a setting like this.” But organic exchanges also happen at the Traffic Zone. As artist
Jodi Reeb-Myers notes, “We’re always asking each other, ‘Could you come across the hall and look at this?’ ” Not all artists or artist spaces have experienced these synergies to the same degree, however. Northern artist Angie Sandifer acknowl-edges, “I expected there to be this energy or synergy. That’s not there, at least not for me, because my work is so different [millinery], and I work a full-time job.” Tilsner artist Bob Calton ex-presses, “Oddly, there’s not an awful lot of collaboration going on in the building. People think it’s like we all live in a big coffee shop; it’s not like that. Everyone is doing their own thing. We all have day jobs.”
In particular, compared to the Tilsner and Traffic Zone, smaller proportions of Northern artist respondents agreed or strongly agreed that living and/or working at the Northern fostered network-ing, collaborations, and exchanges of equipment, knowledge and skills (Table 6). No more than 20% of Northern artist respon-dents disagreed on these metrics; rather they selected the neutral category “neither agree nor dis-agree” more than Tilsner and Traffic Zone respondents (see
Appendix A: Arts Tenant Survey Results). However, through interviews with Tilsner artists we learned many residents viewed the internal community and the connections and support the receive from their Tilsner neighbors as the space’s strongest suit, which may explain the variation between the Northern and Tilsner artists’ survey responses.
Flame Dance dress by Betsy Dollar
www.betsydollar.com
Performed by Amye Scharlau at the Textile Center, August 2008.
Photo © Michael A.
Shapiro, 2008
(Betsy, Amye, and Michael are Northern
artists)
Traffic Zone artists Jim Conaway and
Lisa Colwell installing an exhibition.
Photo © Metris Arts
Consulting, 2010

40
Strengthening Reputations and Identities Evidence from the artist interviews and survey indicate that the Tilsner, Northern, and Traffic Zone benefit in-house artists by strengthening their professional reputations and identities as artists. Seventy-two percent of artist respondents felt that their association with the Art space building helped vali-date them as artists and 55% indicated it helped them attain recognition or prominence within their field (Table 7). Table 7 Artist Survey Results: Reputation and Identity as an Artist
Living and/or working in the Artspace building has… Respondents selecting agree to strongly agree (%)
All Northern Tilsner Traffic Zone
helped validate me as an artist. 72 75 64 84 helped me attain recognition/prominence within my field.
55 45 44 92
Artists in all three spaces expressed that their affiliation with the Northern, Tilsner or Traffic Zone improved how the public, clients, critics and other artists perceived them:
Having the space legitimizes me as a working, professional artist vs. a "starv-ing artist" or "hobbyist." The public's response is remarkably different in this kind of setting.
– Traffic Zone artist survey respondent It’s about the exposure…If you are just starting out you can say, “I’m at the Northern,” and people take you more se-riously.
– Matthew Rucker, Northern artist
Being at the Tilsner lends credibility that I’m serious. There a lot of people who call themselves artists that aren’t dedi-cated to it. If you want to get up, roll out of bed and start throwing on your wheel, this is the place to do it.
– Lisa Mathieson, Tilsner artist I think an artist getting to say “my stu-dio” just changes things. Since I have been here, I have been in a book and a magazine. I don’t think before I would have had the confidence to be in those kinds of projects. It is hard as a photographer. Having the Tilsner helps people to take you seriously.
– Tilsner artist As the last quote illustrates, being taken more seriously by others boosts art-ists’ self-esteem. Additionally, artists spoke to peer effects benefits – these
Lisa Mathieson, Tilsner Artist Photo © Metris Arts Consulting, 2010

41
artist spaces cultivate a culture of artistic professionalism, which further moti-vates individuals:
I am surrounded by individuals who are committed to the pursuit of their art forms. Just being a part of this group has driven me to continue building on my career as an artist.
– Northern artist survey respondent
Comparing spaces, higher proportions of Traffic Zone artists agreed that the Traffic Zone helped them attain recognition or prominence (92% vs. 45% and 44% for the Northern and Tilsner) and validated them as artists (84% vs.
75% and 64% for the Northern and Tilsner) (Table 7). Since the Traffic Zone serves mid-career artists, more of them have at-tained prominence than at the Northern and Tilsner, partially explaining these dif-fering results. Fur-thermore, Traffic Zone’s reputation
differs from that of the Northern and Tilsner. As Nick Legeros observes, “I don’t want to call it a country club, but if you’re there, you’re known as kind of a successful artist. It has that swagger to it.” These results point to inherent trade-offs between equity (serving artists of diverse career stages within a sin-gle building) and prestige. Enhancing Ability to Create Art Findings suggest all three buildings enhance artist’s ability to create art. Sixty-nine percent of artist respondents felt living and/or working in the artist space helped them increase the amount of time they devote to artistic work and 67% agreed that it helped them increase their productivity (Table 8). Table 8 Artist Survey Results: Ability to Create Art
Living and/or working in the Artspace building has… Respondents selecting agree to strongly agree (%)
All Northern Tilsner Traffic Zone
helped me increase the amount of time I devote to my artistic work. 69 75 64 73
helped me increase my productivity. 67 70 60 75
Teena Janay Roberson, Tilsner Artist
Photo © Sean Smuda, seansmuda.com, 2009

42
Through interviews and survey free responses, artists revealed how they per-sonally experience these benefits:
I get a chance to work everyday. It was never like that before. Having the ability to live and work together has been remarkably productive.
– Tilsner artist survey respondent When the muse strikes, you’ve got to act. This space means not having to get up at 4AM and drive to my studio…I work in more than one medium, and being able to have it all in one space really made a difference for me.
– Teena Janay Roberson, Tilsner artist Although solid majorities of artist respondents from all three spaces credited the Northern, Tilsner and Traffic Zone with time and productivity gains, the Tilsner’s lower rates of agreement stand out (64% and 60% vs. 75% and 70% for the Northern and 73% and 75% for the Traffic Zone, respectively) (Table 8). When probed, interviewees attributed this variation to differences with relative affordability. Only 42% of Tilsner respondents felt their space was affordable, vs. 70% and 92% of Northern and Traffic Zone respondents, re-spectively (Table 5). Tilsner artists reported they were less able to access time and productivity gains because they worked extensively in other employment to cover living costs.
Artists also spoke to other tangible ways in which artist spaces support their ability to create and sell their work, from providing a professional setting for client viewings to being able to barter for art show spots in other venues:
Having a studio away from home has enabled me to have perspective clients and established clients come and view my work in a professional setting.
– Traffic Zone artist survey respondent
Sleep by Matthew Rucker, 1997 Photo © Matthew Rucker, 1999

43
Now I’m here, I’m not off in some house in Woodbury. This puts me at a certain table. Before, I had cards to play, but I wasn’t sitting at a table. Now I’m sitting at the table. If I want to be in Art-A-Whirl, I can trade space with an artist for Art Crawl.
– Lisa Mathieson, Tilsner artist
My loft has done so much for my career. The front I’ve made into my gal-lery and the back is my living area. It has helped tremendously with sales – people come in and say, “Wow, this is great!” I have parties constantly and I’ve made so many sales and connections because of it…It’s just a lot harder to get the same kind of energy going at a house.
– Matthew Rucker, Northern artist Limited Income Benefits Examining how these career enhancements translate into individual economic returns requires a nuanced interpretation. Although 51% of artist respondents acknowledged that the artist space helped them increase the percentage of income they earn from their artistic work, only 35% credited living and/or working in the artist space with helping them increase their overall income (Table 9). The survey sample does not capture any high-income earning artists that may have left the artist spaces. Table 9 Artist Survey Results: Income
Living and/or working in the Artspace building has… Respondents selecting agree to strongly agree (%)
All Northern Tilsner Traffic Zone
helped me increase the percentage of income I earn from my artistic work. 51 50 52 50
helped me increase my overall income. 35 35 36 34 These findings and those indicating time and productivity gains suggest that the artist spaces allow half of artists to substitute time spent and money earned on artistic work for that stemming from other sources, but only slightly more than a third are able to increase their overall income. In one art-ist’s own words:
Living in the Northern helped me to make a living off of what I do, rather than doing something else and trying to steal time to do what I love to do…Everyone here is striving to that, even if only a few do it.
– Connell Johnston, Northern artist Artist space advocates and those concerned with economic development may be disappointed that more artists do not experience boosts to their overall income. However, these findings do suggest artist spaces help highly skilled individuals concentrate their talents in relevant work, thereby freeing up less apropos “day jobs” to others in the labor market, a phenomenon in keeping with the job-chain model of economic development advanced by Timothy Bartik (1993), and Daniel Felsenstein and Joseph Persky (2007).

44
To further probe possible income effects, we conducted a statistical analysis of Northern and Tilsner tenant income records, which must be supplied an-nually for LIHTC recertification. Taking steps to ensure confidentiality, we created a sample of households who stayed in the building three or more years with no changes to household size. Due to data availability, we were lim-ited to 65 households that moved into their spaces in 2000 or later, (32 from the Northern and 33 from the Tilsner). After controlling for inflation, we found artists’ household income dropped an average of $2,264 from move-in year to the second year of residence and increased an average of $73 from move-in year to the third year of residence, in 2008 dollars (Figures 9-10). We found slight differences between the Northern and Tilsner subgroups. North-ern artists’ household income decreased by an average of 10.1% from move-in year to year two and increased by an average of .35% from move-in year to year three. Tilsner artists experienced modest gains in both years – an average of .65% from move-in year to the second year of residence and .56% from move-in year to the third year of residence. These findings are descriptive; although they reveal trends about the artist populations served, they do not isolate the artist space’s influence or control for changes in artists’ levels of experience or ups and downs in the larger economy. Results include overall household income, so art related earnings are combined with other sources of income, including earnings from non-artist roommates or family members. The artists most able to increase their incomes may have siphoned out of the sample group, potentially obscuring a more robust trend of income growth.
Art
ist H
ouse
hold
s (#
)
Change in Income (Year 1-2)
Mean= $-2,264 Std Dev.= $16,278
N=65
Figure 9 Changes to Northern and Tilsner Household Income: Year 1-2

45
However once tenants, Tilsner and Northern residents’ income may surpass the 60% of area median income cap without jeopardizing their lease standing, making this scenario less likely. In LIHTC projects in which all tenants must initially meet low-income restrictions, as opposed to those with a mix of mar-ket rate and subsidized units, households’ income may grow to exceed income caps (U.S. Department of Housing and Urban Development 2010). One should also place modest income effects in a larger context. We adminis-tered the survey in the fall of 2009, in the midst of the worst economic reces-sion since the Great Depression. Although some income sampling extends as far back as 2000, small sample sizes prevented us from breaking out cohorts by year. A recent national artist survey, commissioned by LINC, found slightly more than half of artist respondents experienced a drop in income from 2008 to 2009 (Kennedy 2009). Artist spaces may strengthen artists’ earn-ing power, but not enough to overcome larger macro-economic forces. How-ever, many artists face challenges generating an artistic livelihood, period. As Traffic Zone artist Harriet Bart also astutely observed:
It’s a commentary on the poor economic support of the arts…A lot of peo-ple here teach or have another job…what this building does well is that it gives us artists a nice staging platform and influences how you are perceived in the community, but that doesn’t necessarily have an impact on your sales.
Figure 10 Changes to Northern and Tilsner Household Income: Year 1-3
Art
ist H
ouse
hold
s (#
)
Change in Income (Year 1-3)
Mean= $73 Std Dev.= $16,335
N=65

46
Interview data suggests some artists treat their time at the artist space as an equity-investment in their career, pay-offs (both economic and non-economic) only to be reaped in the long term:
When I moved here...I had set aside year and a half to two years worth of savings to be able to just concentrate on my art work…It helped immensely, the entire focus of just being an artist for three years in a place like this where my studio is open on a regular basis and having an image of my work on the Art Crawl postcard last Spring. With the economy being what it is, I’ve had some sales but I’m not making a living off of my work, at this point.
– Betsy Dollar, Northern artist Income effects aside, by providing stable, below market rate living and/or working space, artist spaces do enhance artists’ financial well-being and quality of life. Market rates for large spaces suitable for studios or live/work arrangements would exceed many artists’ budgets. Below, Northern artists express how artist space driven cost-of-living savings allows them to in-crease their financial investments in their artistic businesses:
I got rid of my car because I can walk everywhere I want to go. For me, that has allowed me to put more money back into my art.
– Kara Hendershot, Northern artist
Extra money I have goes into supplies and materials…I’m putting money back into the business.
– Angie Sandifer, Northern artist Increasing artists’ income may exceed the scope of what one can reasonably expect place-based intervention to deliver. These spaces provide artists with stable, below market rate living and/or working space and offer artists career boosts through enhanced professional reputations, synergies with others in the building and time and productivity gains. However, artists’ motivations to pursue their work are frequently non-economic, and artist spaces fail to counter larger economic dynamics at play. Consequently, we remain unsur-prised that individuals’ abilities to translate artist-space driven career en-hancements into increased income vary. Overall, the Northern, Tilsner and Traffic Zone produce clear benefits to in-house artists. Survey results indicate the spaces “work” overall and with re-spect to affordability for a majority of artist respondents. The artist spaces facilitate artists’ networking, collaborations and sharing equipment, knowl-
Live Here by Kara Hendershot, 2008 (Northern artist)

47
edge, and skills. The spaces enhance artists’ professional reputations and iden-tities as artists. Artists reported the spaces help them increase productivity and the amount of time they dedicate to their artistic work. Although drawn from only three case studies, these findings substantiate many of the intuitive claims proponents make about artist spaces’ benefits to in-house artists. As we ex-pand our research, we will refine these conclusions to include the experiences of groups of artists in other spaces.
Benefits to In-house Arts Organizations Arts groups, organizations, and businesses face challenges similar to inde-pendent artists, albeit on different scales. Small coops of visual artists need good light and large, flexible spaces, just like individual artists. Organizations presenting or teaching music struggle with noise transference issues, as much as solo musicians do. Many arts organizations struggle financially as patron’s entertainment dollars shrink and competition from new media grows. Non-profit organizations vie for limited philanthropic grants and individual dona-tions. Presumably, artist spaces also provide advantages to arts organization tenants. Below market-rate rents may help organizations financially grow or stabilize. By co-locating near one another and individual artists, arts organizations may
gain better access to artist markets and/or build a critical mass of activity to draw in the general pub-lic. Arts organizations may also gain efficiencies by networking and shar-ing resources. To investigate the degree to which arts organiza-tions experienced such gains, we surveyed and
interviewed the Northern’s arts commercial tenants. The Northern hosts 15 arts commercial tenants including studios for individual artists and groups of artists, nonprofit arts organizations, for-profit music and painting schools, and photography, design, and marketing businesses. (The Tilsner exclusively provides artist live/work space, and during our research the Traffic Zone served no arts commercial tenants with the exception of Artspace itself.) Low survey response rates (only three out of 15 Northern arts organizations re-sponded, or 20%) limited our ability to generalize about the impacts of artist spaces for in-house arts organizations. We see this as a critical avenue for fur-ther research in the expanded study. However, below we offer some illumi-nating views held by the Northern’s arts organizations, gleaned from our group and one-on-one interviews with six tenants and the commercial prop-erty manager, as well as free responses to the survey.
Springboard for the Arts
Photo © Scott Streble, 2009

48
Nonprofit artist service organization Springboard for the Arts has maintained offices and an artist resource center at the Northern for 15 years. Executive director Laura Zabel states, “This space and the affordable rent are a huge part of our stability as an organization and our ability to grow and change to serve our mission.” She goes on to say, “When I look at my rent as opposed to what other arts organi-zations are paying, for us, the space we have for the price we pay is really incredible.” In fact Springboard’s staff and board so valued their space at the Northern, that as the organization grew they invested $65,000 to renovate their space rather than move to a new location. Springboard actively cultivates connections with art-ists from the Northern and Tilsner and shares resources with neighboring arts groups:
Artists use our technology center and are here on a daily basis. We have a good relationship with other local businesses down the hall. The Art Crawl is housed in our office and over the years we’ve shared space with a number of other organizations.
– Laura Zabel, Springboard for the Arts Some arts commercial tenants also viewed proximity to in-house artists as one of the Northern’s greatest assets:
We really enjoy the space and building along with other tenants. It is exciting to be in such a vital art saturated space. Without other artists in close prox-imity, the co-op would not be the same.
– Cheryl LeClair-Sommer, AZ Gallery
However, others saw unrealized potential to expand connections to artist and other arts commercial tenants or saw their internal community as less vibrant in reality than some tenants and outsiders perceived:
On my floor, we are ten individual things. We are very friendly enough to greet others in the hallway, but that is really the extent of our relationship… Every time we do an Art Crawl it bothers me so much to walk down this hall and see all of these blank walls. Why don’t the artists from upstairs hang some of their work? There is so much room for collaboration and since we don’t know each other it doesn’t happen.!
– Ben Krywosz, Nautilus Music-Theater
We moved in with the illusion that there was a big community here, but in fact there was not. We’ve created it in a lot of ways…Artists feel they supply
Springboard for the Arts Photo © Scott Streble, 2009

49
the scene, but we’re the one providing space for people to come from out-side and hang here and have their groups here.
– Sara Remke, Black Dog Café Although limited data restricts our ability to draw conclusions about the bene-fits of artist spaces for in-house arts organizations, arts commercial tenants offered insights into what they specifically value and deem lacking with their space, the Northern and its management. Below, we synthesize these observa-tions with those of artist tenants from all three spaces.
Insights: Factors Affecting Tenant Satisfaction Artist tenants in all three spaces and arts organization tenants at the Northern identified four main areas influencing their satisfaction with their space and building:
• Stability and affordability • Opportunities for shared governance • Characteristics and maintenance of the physical space • Location
By increasing tenant satisfaction, in-house artists and arts organizations should be better able to realize the benefits artist spaces offer. As our research expands, the different experiences of artists and arts organizations from a broader range of projects will shape these preliminary conclusions. Stability and Affordability Artists and arts organizations viewed sustainability, in terms of the artist space’s enduring presence and their individual ability to continue to afford to live and/or work within it, as core to their definition of a successful artist space. Traffic Zone artist Jim Dryden explains:
Stability for artists is really important. Artists tend to be working in spaces that aren’t being used for anything else at the time, but they don’t have a sense of what’s happening next year or next month.
Similarly, artists struggling to afford rental rates are less able to reap the bene-fits living and/or working in an artist space provides. As Tilsner artist Mat-thew Hodge experienced:
Working four jobs, I was working 75 hours a week, the last thing I was thinking about was rehearsal.
We found notable differences between spaces. Artists at the Traffic Zone felt secure in their space’s stability. Artist Jodi Reeb-Myers shares, “We’re part owners so we know the building can’t be taken away from us, developed, or used for other purposes.” In contrast, artists’ uncertainty surrounding the Northern’s refinancing due to the expiration of LIHTC contributed to in-creased turnover rates during 2009. Current residents keenly await the com-pletion of Northern Warehouse’s refinancing in 2010. As Northern artist Connell Johnston shares:

50
With the refinancing, occupancy here will be assured for another 15-30 years…Can you imagine artists living in one place for a combined 50 years, what that potential of that is? That’s an institution. With more and more sta-bility, people produce more and more.
Opportunities for Shared Governance Lastly in all the spaces, artists have greater latitude to influence operations than tenants typically have within tenant-landlord arrangements. Owners still assume financial and physical responsibility for the building, making sure the utilities and mortgage get paid and preserv-ing the physical asset. Property management companies deal with day-to-day maintenance issues and rent collections. But artists also share responsibilities and control. Traffic Zone artists’ co-ownership arrangement pro-vides them with the most auton-omy, followed by the Northern’s artist cooperative’s master-lease agreement, which allows tenants to weigh-in on rent levels and fire the residential property man-ager. Even at the Tilsner, Artspace and the Twin Cities Housing Development Corpora-tion, which serves as the manag-ing partner for the building, empower artists to shape elective governance ar-eas, such as arts programming, addressing conflicts between residents and de-ciding how to use common areas.
There’s a permanence that you feel. It’s like staying in a hotel vs. buying your own home…you know you are in control.
– Jodi Reeb-Myers, Traffic Zone artist
Our monthly meetings, the planning that we do, we may stand alone in that as an Artspace project. That needs to be preserved, it’s part of our strength, and it’s our fiber here – our sense of self-destiny that we control our own destiny as a cooperative. It’s a much different picture elsewhere.
– Connell Johnston, Northern artist It almost seemed like we’re a coop, but we couldn’t implement decisions, for instance each floor wanted to paint the walls a different color, but it wasn’t allowed.
– Teena Janay Roberson, Tilsner artist
Jodi Reeb-Myers’ Studio, Traffic Zone Photo © Metris Arts Consulting, 2010

51
However, tenants emphasized the importance of open lines of communica-tion with management and sought more clarity on how Artspace and its man-agement partners and subsidiaries divide responsibilities and what tenants could and could not control:
Molasses was leaking from our ceiling [the Northern's prior uses included molasses storage] and nothing happen for what seemed like forever. But one day they caught a kid smoking in the bathroom and the next day there were locks on the doors…It just seems like they could approach it in a different way…There is no channel for communicating; there is no go-to person…It just seems like a real missed opportunity.
– Ben Krywosz, Nautilus Music-Theater Management said they can’t decide whether or not we should have a security camera, that the coop had to decide. So, the coop did all kinds of research and determined that it’s not exorbitant, but it fell through. It kind of became pass the buck…People don’t know the hierarchy to get things done.
– Teena Janay Roberson, Tilsner artist Artists also identified a number of factors which strengthen or handicap their ability to work together as a group and hold up their end of shared govern-ance, including morale levels, group size, and individual members’ knowledge, attitudes, and abilities:
We’ve all made a commitment as a co-op to keep the building up and it isn’t working...I think that has to do with the uncertainty people feel about the building. And it shows – the back garden hasn’t been kept up; there is trash in the halls.
– Laura Nichols, Northern artist
The Traffic Zone is a smaller community, so people feel like they have more control…Group size determines involvement, having a voice, having con-trol.
– Jim Dyrden, Traffic Zone artist
You can’t expect new people to understand the way this thing works, all of the underlying tentacles.
– Northern artist !
In any group there will be a small number that will rise to top as leaders and some people that will be actively involved, knocking on doors, doing the footwork. It’s important to pull yourself out of that and make room for other people to come in and experience that inner group. You have to be very encouraging of other people to get involved; they won’t just sit there and follow.
– Lisa Mathieson, Tilsner artist Bricks and Mortar – “Your environment sets the tone” We also identified common threads in terms of what artist and arts organiza-tions physically valued (or deemed lacking) about their buildings and spaces.

52
All tenants stressed the importance of good maintenance. Artist Jim Dryden explains how at the Traffic Zone:
Your time isn’t taken up worrying about, “Is the elevator working today?” It’s nice to work in a space where things work, where things are in good condition…Your environment sets the tone for how you feel about what you’re doing.
However artists at the Northern and Tilsner voiced complaints about mainte-nance, including drafty windows, roof leaks, and even a multi-month elevator outage at the Northern. At the Tilsner, artists felt common areas could benefit from displays of artwork, new carpets, and more vigilant upkeep. In the case of the Northern, tenants face shared responsibility for maintenance deferrals, since historically the Northern Warehouse Artists’ Cooperative restricted rent increases instead of set rents at levels needed to fully fund reserves for main-tenance. Both the Tilsner and Northern do fully comply with strict federal safety mandates, due to LIHTC status. Jim Thielen, the property manager for the commercial spaces at the Northern proudly notes the contrast to past, unsanctioned live-work spaces in the area: “The old Rossmore, you might re-member, was a fire trap. People got killed there, allegedly.” In terms of individual units, artists prized large, light-filled, flexible spaces with tall ceilings, doors and elevators. Northern artists Betsy Dollar and Angie Sandifer share:
The beauty of this building is how flexible the spaces are. The openness does have practical impact.
– Betsy Dollar, Northern artist Being wide-open feels freeing. It feels a lot better.
– Angie Sandifer, Northern artist Physical needs also varied between the three buildings. At the Northern, commercial tenants balance their needs for consistent public access with art-ists’ desires to keep their homes secure. At the live/work Tilsner and North-ern, which serve artists of a variety of disciplines, artists emphasized the im-portance of soundproofing to minimize noise transference and ease neigh-borly relations. Northern residents saw their lack of a community meeting space, in contrast to the Tilsner, as a deficiency. Residents of both the Tilsner and Northern envisioned benefits to a common facility for “messy” work or shared equipment:
A shared studio space, even if it were just a tool repository or place for messy, messy work, would be great. When you work in wide-open spaces…everything you own gets covered with plaster dust, saw dust, or what have you.
– Betsy Dollar, Northern artist
In a perfect world it would be nice to have more shared common space, like for the kilns. There are issues around venting. My neighbor asked my advice

53
on hooking up her kiln. If we had shared common space, maybe we both wouldn’t need our own.
– Teena Janay Roberson, Tilsner artist
Location, Location, Location Artists and arts organizations also spoke to the importance of access on a va-riety of fronts. Although artists lamented the lack of a close grocery store, they and community members touted the Tilsner’s and Northern’s proximity to the St. Paul Farmers’ Market and employment centers in downtown St. Paul:
Lowertown and downtown provide a lot of jobs for these artists – restau-rants, offices. It’s a very convenient place…It’s a very walkable, healthy neighborhood. So, it’s a mutually complementary thing.
– Weiming Lu, Lowertown Redevelopment Corp. (formerly)
Northern arts organizations and Tilsner and Northern artists valued the den-sity of artists and arts organizations found in their own buildings and in the
larger Lowertown neighborhood. In particular, many Northern and Tilsner artists participate in the area-wide, semi-annual St. Paul Art Crawl. However, some Northern arts organiza-tions wished the building were located more centrally, within the Twin Cities metro, to im-prove access to patron access. Arts tenants in the Northern, Tilsner and Traf-fic Zone emphasized the importance of stabil-ity, affordability, opportunities for shared gov-ernance, good maintenance, specific physical attributes, and location as key factors affecting their satisfaction. We theorize that by increas-
ing arts tenant satisfaction, more artists and arts organizations should be able to experience the benefits artist spaces offer and those that do should feel the effects more deeply. We welcome the opportunity to expand these conclu-sions as we extend our research to other projects across the country.
Neighborhood and Regional Impacts Desired goals for an artist space’s neighborhood and regional impacts vary widely, given different neighborhood contexts and personal world views. Many are content to see vacant, neglected historic structures rehabbed, placed back on the tax rolls, and supporting artists. For some communities, as with Lowertown, government officials and funders hope that the artist spaces will spur other redevelopment and help stabilize or increase property values. In other situations, as with the Traffic Zone in the North Loop, goals center around preserving space for an artist population at risk of dislocation due to gentrification. Some envision expanded arts and cultural offerings for the public or larger arts community, as a primary benefit of intrinsic value. Others focus on the prospects of boosting population or drawing visitors from the
Angie Sandifer, Northern Artist
Photo © Metris
Arts Consulting, 2010

54
surrounding region to patronize area businesses. For others still, the possibil-ity of infusing a challenged neighborhood with a population of highly edu-cated, active artist “good citizens” holds strong appeal. By interviewing a range of community members, estimating property value impacts through hedonic analysis, and analyzing trends in socio-economic data, we documented the Northern’s, Tilsner’s, and Traffic Zone’s neighbor-hood and regional impacts. Although outcomes varied across spaces, our findings suggest they:
• Expanded the public’s arts offerings • Repurposed and restored underutilized historic structures • Catalyzed redevelopment and increased surrounding property values,
with little evidence of contributing to gentrification-led displacement • Support, attract, and help retain artist entrepreneurs, who enhance re-
gional economic competitiveness • Bolster area businesses through increased demand by visitors and art-
ist residents • Spur social benefits ranging from increased civic involvement and
safety to providing new spaces open to the public Only three case studies inform these findings. When we expand our research to include other projects, including Artspace’s more recent developments, those outside of urban areas, featuring new constructions, and those without artist cooperative structures, we will be better able to generalize about which outcomes hold across different environments.
Expanding Arts Offerings Artists and a range of community members in both the North Loop and Lowertown named increased arts offerings, for the public and larger arts communities, as a significant community benefit of the artist spaces. For in-stance, 88% of artist survey respondents felt the artist space served as a hub for arts events open to the public. All spaces partake in semi-annual open stu-dio events, the Northern and Tilsner in the St. Paul Art Crawl and the Traffic Zone’s in its own Open Studios. In addition, the Northern’s commercial spaces provide the general public and artists from the larger arts community with consistent access to arts events and resources. Tilsner artists recently spearheaded a Lowertown First Fridays exhibition initiative. The Traffic Zone regularly presents exhibitions in its lobby gallery, and Traffic Zone artists teach classes in their studios. The St. Paul Art Crawl and Open Studios serves as each space’s flagship event. Coordinated by the St. Paul Art Collective, the St. Paul Art Crawl draws a reported 20,000 people twice a year, 3,000-4,000 at the Northern and 2,000 at the Tilsner. Executive director Robyn Priestley notes:
As much as the Lowertown Lofts are the founders of the Art Crawl, these two buildings are the anchors. The Northern consistently shows the highest attendance of any of buildings in Art Crawl.

55
Attendees take in visual art, listen to live music, and even attend theatrical performances by the Upright Egg Theatre Company in the Tilsner’s base-ment. Volunteer Art Crawl coordinators at the Northern and Tilsner program
guest artists, augmenting in-house offer-ings and broadening access to outside art-ists. The Traffic Zone’s Open Studio Events bring 1,200-1,400 people to the North Loop twice a year. Both Art Crawl and Open Studios offer the public a chance to interact with artists in an infor-mal setting, dispelling the mystery sur-rounding how artists create their work.
We've created an experience for peo-ple to see working artists. People come in all the time and say, “Oh, so this is how it works.” We can show people that.
– Kathy Wismar, Traffic Zone Artist A wide-range of community members also called out the Northern’s arts-related commercial spaces for providing the gen-eral public and artists from the larger arts communities with opportunities to consis-tently access arts offerings at the Northern, including rotating art exhibitions at the Black Dog Café and AZ Gallery, artist ca-reer resources at Springboard for the Arts, guitar and painting lessons at the St. Paul Guitar School, and Hurinenko Paquet Stu-dio and performances at Nautilus Music Theater:
The Northern has commercial spaces, a gallery, and the Black Dog Café, so it is a hub for Lowertown…Nautilus does performances every week or month…The Black Dog is big, big contributor; they host artists and mu-sic events…If they left, it would be a disaster.
– Robyn Priestley, St. Paul Art Collective Although the Tilsner lacks the Northern’s arts commercial tenants, community members credited them with recently initi-ating the Lowertown First Friday’s exhibi-
tion event, acknowledged the contributions of in-house performances by the Upright Egg Theatre Company (a Tilsner resident’s theater company), and
Top two: 2009 Fall Art Crawl at the Northern and
Tilsner
Middle: Weight of the World
by Upright Egg Theatre Company,
www.uprightegg.com
Photos © Sean Smuda seansmuda.com, 2009
Bottom two:
Traffic Zone Fall 2009 Open Studio
Photos © Metris Arts
Consulting, 2010

56
perceived Tilsner artists’ Art Crawl enthusiasm and involvement to be build-ing:
First Fridays, Tilsner was a big part of starting that…There seems to be a new bubbling up of something over there.
– Sara Remke, Black Dog Café In addition to their twice-yearly Open Studios event, Traffic Zone artists regularly mount exhibitions of not only in-house, but also regional and even international artists in their lobby gallery, sometimes augmented by extensive outreach activities. For instance in Fall 2008, Traffic Zone artists hosted Maine artist Rob Shetterly’s Americans Who Tell the Truth, featuring portraits of political dissenters:
We flew the artist here for five days. He went out to eight different schools and talked about heroic Americans who made a difference; people that aren’t very well known but had huge impacts…Coleen Rowley did a portrait sitting for him while he was here. She was an FBI whistle blower during the Bush administration. It took us a whole year to raise the money to bring him here. We had multiple events geared towards inviting the public to hear him speak, and see the artwork.
– Jodi Reeb-Myers, Traffic Zone artist Some interviewees expressly appreciated the Traffic Zone’s Open Studio events, rotating exhibitions, and classes taught by artist members, but many community members we spoke to dismissed or remained unaware of these offerings:
The neighborhood loves the open houses that artists do…They also have a rotating gallery display in lobby managed by the artists, so office tenants get to interact with art on a daily basis.
– David Frank, North Loop Resident
If I lived in a beautiful condo in that part of town, I could go around the corner and buy the beautiful art from famous artists that I want to have on my walls. It’s a beautiful convergence of clients and high-end artwork.
– Nick Legeros, North East Minneapolis Arts Assoc. The Traffic Zone feels more internally focused and much less engaged in the broader community. Right now I don’t see a whole lot of reason for the public to go over there. I bet a lot of people don’t have a clue what’s in there.
– Jackie Cherryhomes, former Minneapolis City Council member
Traffic Zone artists acknowledge they struggle with a reputation for being in-sular. Since their building falls on the perimeter of the North Loop neighbor-hood on a block flanked by a freeway on-ramp and adult entertainment venue, they face additional hurdles around accessibility. However, within the last three years artists have increased their energies and attention to reaching out to the North loop, larger metro, and greater arts communities.

57
The Buildings – Transforming Eyesores and Tax Rolls Community members spanning residents, artists, government officials and real estate developers all pointed to Artspace’s rehabilitation of derelict, va-cant or under-utilized historic buildings as a direct positive impact for all three of the artist spaces. Each property is now listed on the National Register His-toric Places and falls within locally and federally recognized historic districts (Minnesota Historical Society 2009a; Minnesota Historical Society 2009b; Minnesota Historical Society 2009c).
They redeveloped a marginally occupied property, the Appliance Parts Building [The Traffic Zone] which…was sitting vacant like a hulk…It brought the property back on the tax roll in a different way and breathed new life in a building that had not been there.
– Jackie Cherryhomes, former Minneapolis City Council member Just completing it [the Northern and the Tilsner] was a physical impact; Put-ting in new windows and cleaning up the outside. It’s recycling.
– John Mannillo, Lowertown real estate broker and investor
Some interviewees, like real estate developer Chuck Leer, who conceded, “For me as a developer, they took out of play a building that was a great candidate
for residential conver-sion...but this is a good use,” expressed surprise that the artist spaces pay property taxes. Although Art-space is a nonprofit, it owns all three proper-ties with investment partners via for-profit limited liability partnerships and pays property taxes.
The Northern, Tilsner, and Traffic Zone’s property values and tax contribu-tions have all appreciated dramatically since Artspace purchased and rehabili-tated the buildings. Acquired in 1988, the Northern Warehouse’s assessed value climbed from $715,000 in 1987 to $4,057,000 in 2008 (199% increase over 21 years, after adjusting for inflation). In 1987, local jurisdictions col-lected $39,080 in tax revenues, $25,360 of which the state paid rather than the property owner. In 2008, tax revenues totaled $97,676. When acquired in 1993, the Tilsner had an assessed value of $286,000, showed tax delinquencies for all the previous five years, and was in appalling physical condition:
When Artspace started to do the Tilsner, a couple of developers had tried previously and fallen flat on their faces. One put in huge skylights in roof and then went bankrupt and walked away. It rained into the building for two years.
– Will Law, Artspace Projects
Tilsner construction
Photo from Artspace collection

58
The Tilsner’s 2008 value stands at $4,068,000 (an increase of 855% over 15 years, after adjusting for inflation). 2008 tax revenues totaled $35,268. Ac-quired in 1992, the Traffic Zone’s assessed value increased from $405,000 to $3,200,000 in 2008 (415% increase over 16 years after adjusting for inflation). Tax revenues climbed from $23,207 to $113,955. Although we do not present tax rate change, due to limited data availability and complexities in taxation stemming from regional fiscal disparity legislation, tax revenues for all three properties increased despite reductions in the effective tax rate for the areas and/or property types. Although a detailed fiscal impact analysis exceeds the scope of this study, the Northern and Tilsner residential conversions likely increased the need for some public services, such as police and firefighters, although as in-fill developments they would not require new roads or sewer services, unlike residential development occurring on the urban periphery. Increased need for services may offset gains in tax revenues.7 Neighborhood Effects: Catalyzing Change, Adding Value Government officials, artists and Lowertown residents and business owners credited the Northern and Tilsner with anchoring the neighborhood and help-ing spur other redevelopment. In contrast, community members perceived the Traffic Zone’s neighborhood contributions as fairly limited. Through he-donic analysis we quantify the increases to area property values stemming from the investments at the Tilsner and Traffic Zone site. Both models reveal robust increases to property values, but surprisingly the Traffic Zone’s esti-mated impact exceeds that of the Tilsner. As we previously describe in St. Paul’s Lowertown – It takes a Village to Build an Urban Village, the Northern and Tilsner’s development occurred within broader revitalization efforts initiated by a range of public, philanthropic, and private entities. However, community members affirm that the Northern and Tilsner made distinct contributions:
I really think that it was the beginning of the turnaround. I’m not saying it’s all done and I’m not going to attribute every positive impact to the Northern and Tilsner, but they were definitely part of the start of it and integral to its continued maintenance.
– Gary Peltier, St. Paul Planning and Economic Development (formerly) The Northern and Tilsner were important to making the neighborhood feel complete.
– Marla Gamble, Lowertown resident
They brought the first feeling of a neighborhood to Lowertown. Since then it’s expanded.
– John Mannillo, Lowertown real estate broker and investor Interviewees specifically saw the two buildings as playing a role in catalyzing 7 Sources: Hennepin County, Ramsey County and City of Minneapolis Assessors’ Offices; 2008 individual property tax statements for Northern residential units; Twin Cities Housing Develop-ment Corporation internal records.

59
other redevelopment in the neighborhood:
The James J. Hill wouldn’t have been rehabbed without these two buildings. They contributed majorly to those things…anchoring the neighborhood so other development could and would come.
– Sara Remke, Black Dog Café
These two buildings and the Lowertown Lofts building have been the an-chor to pull all the other stuff in. They did a survey of Great Northern resi-dents and the top reasons they gave for moving to the neighborhood were art and shopping, which is ironic because there really isn’t any shopping here.
– Robyn Priestley, St. Paul Art Collective
As Priestly suggests in the previous quote, beyond the Northern and Tilsner’s physical rehabilitation, many interviewees perceive that the artists served as an added draw, helping increase Lowertown’s cachet: !
I see us [the Northern] as the absolute pivotal building because we did that Art Crawl for 20 long years and everybody and their fricken’ brother came through and said, “Oh my god, I love your space!”…People came in, they saw what we had, and they wanted one. The general public was salivating for beams and brick.
– Northern artist The cachet of artists living down there seems to have been appealing to resi-dents of Lot 270 and Great Northern…The Northern and Tilsner have been very important for the revitalization of Lowertown…If they weren’t there they’d be no identity of Lowertown as an arts place.
– Larry Englund, CapitolRiver District Council
During the last Art Crawl, there was an article that said Lowertown is the place to be…Artists make desirable communities. They clean up what was once tarnished. They make it nice again in a unique way.
– Connell Johnston, Northern Artist In comparison to the Northern and Tilsner, community members perceive the Traffic Zone’s neighborhood impacts as much more limited:
The Traffic Zone is successful for the people who are there. It appears to serve the artists’ needs very well. They seem to be happy there. In respect to what it’s done for city building, I don’t know. I don’t think it’s been a dy-namic force.
– Chuck Leer, North Loop Real Estate Developer For spurring physical improvements I give them fine marks for doing as well as they could be expected to do.
– David Frank, North Loop resident

60
As we subsequently detail in Insights: Factors Influencing Spillover Benefits, inter-viewees saw a range of characteristics as impeding the Traffic Zone’s potential for larger neighborhood impacts – its physical isolation and non-residential nature, the smaller number of artists being served, and lack of surrounding artist density. As Artspace’s Will Law points out, Artspace and artists created the Traffic Zone in response to rapid gentrification pressures rather than in an attempt to spur area revitalization:
The project came out of recognizing that the economic upswing was coming and they had better stake a claim now because they won’t be able to afford to later. But the Traffic Zone didn’t hurt re-development effort, either. It added an enhancement in permanent way to what was attracting a lot of re-development in the first place.
Increasing Property Values To quantify the artist spaces’ contributions to surrounding area property val-ues, we used hedonic analysis. Hedonic analysis uses a statistical process (mul-tivariate regression analysis) to estimate out how much change can be attrib-uted to the artist space versus other factors such as characteristics of the property, overall ups and downs in the housing market, and proximity to amenities. We control for market variations by analyzing property sale data prior to and after the artist space development and control for spatial varia-tion by drawing data from a sizable surrounding area. To capture the artist space effects, we attempt to isolate the change the neighborhood experienced in space and time. We selected the year prior to the artist space’s opening and its geographical coordinates to estimate when and from where property values most likely experienced a “bump” due to increased investment in the artist space. For a more detailed discussion of the underlying theory and our analy-sis process and results, see Appendix B. We obtained striking results. We found that, within a three-mile radius, the 1992 investment in the Tilsner site led to an estimated one-time average in-crease of $13,827 per residential housing unit. The 1996 investment in the Traffic Zone site yielded an estimated one-time average increase of $40,325 per residential unit within a three-mile radius (both in 2009 dollars). Both models show more pronounced impacts closer to the artist spaces (Figures 11-12). Due to insufficient sales data prior to 1990, we were unable to model the Northern’s impacts on property values. Given community members’ perceptions of limited spillover impacts from the Traffic Zone’s versus the Tilsner and Northern, the differences in impact findings are surprising. The Tilsner’s estimated average increase per residential property unit is slightly more than a third of the Traffic Zone’s. This may point to an underlying weakness of the model. Although we include the dis-tance from the artist space’s coordinates to geographically isolate the invest-ment, the model may capture other concurrent investments in the immediate vicinity (within a few square blocks). Former Minneapolis City Council mem-ber Jackie Cherryhomes recalls Union Plaza, a commercial building abutting the Traffic Zone, being redeveloped during the same period, which would

61
Estimated Average Value AddedPer Residential Unit (2009 Dollars)
$55,000$45,000$35,000$25,000
# Traffic Zone Center for Visual Art
0 1 20.5 Miles
Map created by Overview for Metris Arts Consulting - 12/12/2009
#
¯
Estimated Average Value AddedPer Residential Unit (2009 Dollars)
$20,000$15,000$10,000
# Tilsner Artists' Cooperative0 1 20.5 Miles
Map created by Overview for Metris Arts Consulting - 12/12/2009
#
¯
Figure 11 Estimated Property Value Impact due to 1992 investment at Tilsner site Sources: ESRI nation-wide databases, Google Earth, Ramsey County Assessor’s Office Figure 12 Estimated Property Value Impact due to 1996 investment at the Traffic Zone site Sources: ESRI nation-wide databases, Google Earth, Minneapolis City Assessor’s Office

62
compound the results. In contrast, many interviewees conflate the Tilsner and Northern’s impacts, understandably since Artspace developed both projects, and they abut one another. Our model, however, isolates the Tilsner’s impacts from that of the Northern, which opened three years prior. Few “Red Flags” on Gentrification-led Displacement Like two sides of a coin, artist space proponents frequently benefit from the commonly held perception that artists’ cachet spurs area development and investment, while simultaneously facing critics who fear gentrification dis-places existing populations. As we outline in the preceding Context and Evolu-tion section, rapid increases in popula-tion, number of housing units, and rental increases do suggest a pattern of gentrification in the North Loop in effect prior to the Traffic Zone’s creation (Fig-ures 6-8). In contrast, Lower-town’s redevelop-ment phased in more gradually, and leadership continu-ing prioritizing art-ist space and af-fordable housing. Beyond curbing artist dislocation, we find little quali-tative or quantita-tive evidence that the Northern, Tils-ner, or Traffic Zone contributed to gentrification-led displacement, with the likely exception of displacing some transients in Lowertown. The 1980 official census tallies for both the Lowertown and the North Loop show extremely small populations (522 and 338 people, compared to 1,941 and 1,515 in 2000, respectively). Census tallies most likely undercounted art-ists living in their studios without certificates of occupancy and Lowertown’s anecdotally reported high populations of transients and squatters. As the fol-lowing quote by long-time Lowertown resident Marla Gambles quote sug-gests, rehabilitating Lowertown’ vacant warehouses, including the Northern and Tilsner, did repurpose facilities used by transients for shelter:
SoHo Building, North Loop. © Metris Arts Consulting, 2010

63
For the first nine years [1985-1994] Lowertown Loft artists shared their parking lot with homeless people. They were getting kicked out of their places, too, until they were pushed out of town completely. The empty warehouses provided space for transients and pigeons.
Presumably, much of Lowertown’s homeless population shifted to other ar-eas, although some may have found housing in the estimated 25% of Lower-town’s housing stock considered affordable, including some facilities specifi-cally designated for formerly homeless individuals.8 Some may consider dis-placing transients problematic on equity grounds, but concentrated pockets of homeless individuals raise safety concerns for others living and working in the area and deter neighborhood investment. Many see reducing or shifting tran-sient populations as a desirable end. For instance, Laura Zabel, executive di-rector of Springboard for the Arts, offers, “The return on investment for this building [the Northern] is that people aren't squatting down here anymore. Now, there are restaurants and galleries.” The Northern, Tilsner, and Traffic Zone each provided space for artists who feared dislocation. The Northern and Tilsner initially attracted artists from both Lowertown and the larger region. Even beyond securing space for indi-vidual Lowertown artists, artist Marla Gamble shares how these two spaces signaled to the larger community that Lowertown would remain a home to artists:
We were all here in the central core of Lowertown and 250 artists and busi-nesses got kicked out. The artists went down to the edge of Lowertown, the far buildings on the very corner of Lowertown, and said here’s where we are going to make our stand.
Artspace and founding artists developed the Traffic Zone as a way to preserve space for a rapidly dwindling population of artists working in Minneapolis’ warehouse district. As Artspace’s Will Law recalls, “these artists came to Art-space because they saw the writing on the wall.” Former Minneapolis City Council member, Jackie Cherryhomes also expressed the City’s view that pre-serving an existing group of artists was a key goal for the project. Unfortu-nately, these efforts did not extend beyond the 23 artists served by the Traffic Zone.
The Traffic Zone alone stands as the exception to the rule. Condos moved in. Restaurants moved in. Sports stadiums moved in. The studios and the artists moved out.
– Nick Legeros, North East Minneapolis Arts Assoc. I can’t say Traffic Zone has attracted artists to the area. If they can’t get space in the Traffic Zone building, good luck with that. They’re not going to be able to find other space two blocks away.
– David Frank, North Loop resident
8 Weiming Lu, phone interview by Metris Arts Consulting, September 18, 2009.

64
By other metrics, we found no evidence that the Northern, Tilsner, or Traffic Zone contributed to gentrification-led displacement. Although high, the per-centage of households that moved in the last five years decreased one per-centage point in both neighborhoods between the 1990 and 2000 census (pre-ceding and following the artist space developments). The North Loop de-creased from 88% to 87% and downtown St. Paul/Lowertown decreased from 75% to 74%. Although the North Loop experienced huge gains in me-dian household income and dramatic declines in the percentage of people liv-ing in poverty, both trends precede the Traffic Zone’s creation in 1997 (Fig-ures 13-14). Lowertown’s poverty rates held constant between 1980 and 2000, apparently unaffected by the Northern or Tilsner’s addition in 1990 and 1993 (Figure 15). Figure 13 Income Change: North Loop vs. Minneapolis
Source: Census data
16,994
50,323 50,602
33,101 33,897 37,974
10,000
20,000
30,000
40,000
50,000
60,000
70,000
1979 1989 1999 Med
ian
Hou
seho
ld I
ncom
e (1
999
$)
Traffic Zone completed 1997
North Loop Minneapolis

65
Figure 14 Poverty Change: North Loop vs. Minneapolis and Hennepin and Ramsey Counties
Source: Census data Figure 15 Poverty Change: Downtown/Lowertown vs. St. Paul and Hennepin and Ramsey Counties
Source: Census data
Each neighborhood also became more racially and ethnically diverse as its population increased (Figures 16-17). These trends are consistent with larger
45%
25%
18% 14%
19% 17%
8% 10% 9%
0% 5%
10% 15% 20% 25% 30% 35% 40% 45% 50%
1980 1990 2000
Pers
ons
Livi
ng b
elow
the
Pove
rty
Line
(%)
Traffic Zone completed 1997
North Loop Minneapolis Hennepin & Ramsey Counties
22% 21% 22%
11% 17% 16%
8% 10% 9%
0% 5%
10% 15% 20% 25% 30% 35% 40% 45% 50%
1980 1990 2000
Pers
ons
Livi
ng b
elow
the
Pove
rty
Line
(%)
Proects completed: Northern 1990, Tilsner 1993
Downtown/Lowertown (Census Tract 342) St. Paul Hennepin & Ramsey Counties
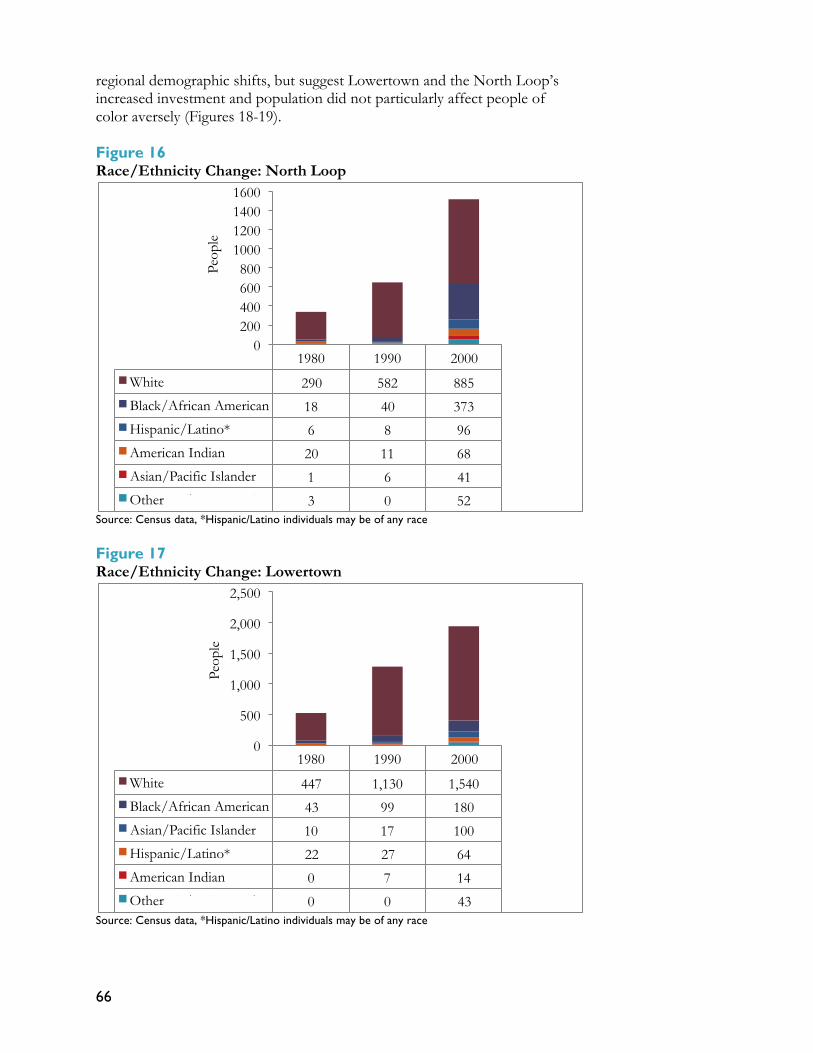
66
regional demographic shifts, but suggest Lowertown and the North Loop’s increased investment and population did not particularly affect people of color aversely (Figures 18-19). Figure 16 Race/Ethnicity Change: North Loop
Source: Census data, *Hispanic/Latino individuals may be of any race Figure 17 Race/Ethnicity Change: Lowertown
Source: Census data, *Hispanic/Latino individuals may be of any race
1980 1990 2000
White 290 582 885
Black/African American 18 40 373
Hispanic/Latino* 6 8 96
American Indian 20 11 68
Asian/Pacific Islander 1 6 41
Other 3 0 52
0 200 400 600 800
1000 1200 1400 1600
Peop
le
*Hispanic/Latino may be
1980 1990 2000
White 447 1,130 1,540
Black/African American 43 99 180
Asian/Pacific Islander 10 17 100
Hispanic/Latino* 22 27 64
American Indian 0 7 14
Other 0 0 43
0
500
1,000
1,500
2,000
2,500
Peop
le
*Hispanic/Latino may be

67
Figure 18 Racial Composition Change: North Loop vs. Minneapolis and Hennepin and Ramsey Counties
Source: Census data Figure 19 Racial Composition Change: Lowertown vs. St. Paul and Hennepin & Ramsey Counties
Source: Census data
86%
90%
58%
87%
78%
63%
93%
88% 78%
50% 55% 60% 65% 70% 75% 80% 85% 90% 95%
100%
1980 1990 2000
Perc
ent W
hite
Traffic Zone Completed 1997
North Loop Minneapolis Hennepin & Ramsey Counties
86%
88%
79%
89%
81%
64%
93%
88%
78%
50% 55% 60% 65% 70% 75% 80% 85% 90% 95%
100%
1980 1990 2000
Perc
ent W
hite
Projects Completed: Northern 1990, Tilsner 1993
Lowertown St. Paul Hennepin & Ramsey Counties

68
Strengthening, Attracting and Retaining Artist Entrepreneurs As Robyn Priestley, executive director of the St. Paul Art Collective notes, artist spaces such as the Northern and Tilsner function as incubators for small businesses:
Some people stay, but a lot of people who are really serious move in, get started, become successful and expand or move out to a place where they can expand. There are a lot of creative businesses in the Northern – photog-raphers, graphic designers.
As previously detailed in Benefits to In-house Artists, survey and interview data indicate the Northern, Tilsner, and Traffic Zone strengthen artists’ careers through time and productivity gains, increased networking opportunities, en-hanced reputations, and by facilitating sharing equipment, knowledge, and skills.
Even beyond directly supporting artistic businesses, supporters of artist space also perceive economic benefits to drawing and keeping artists in a region. With high rates of self-employment (45% vs. 8% of workers overall, as of 2002), many artists are relatively footloose (Markusen, Schrock, and Cameron 2004, 15-16). Markusen and King make the case that artists help regions re-main competitive by helping firms attract highly skilled workers, generating work for others who supply or distribute their work, producing innovations, and providing a pool of talent available for firms’ design, organizational, and marketing efforts (2003). Our findings indicate these artist spaces help attract and retain artist entrepre-neurs in the Twin Cities metro. Twenty-one percent of artist survey respon-dents’ previous residence or artistic workspace fell outside the Twin Cities metro. Forty-two percent of artist respondents indicated they would be un-likely to have an artistic workspace (live/work or work only) if the Artspace building did not exist, suggesting these artist businesses would not continue absent the Northern, Tilsner, or Traffic Zone. However, of those likely to acquire an alternate artistic workspace, 94% of respondents would stay within the greater Twin Cities metropolitan region, suggesting artists’ commitment to the region extends beyond their attachment to their artist space. Bolstering Area Businesses Artists and other community members also credited the artist spaces with bolstering area businesses. Fifty-eight percent of arts tenant survey respon-dents agreed that activity in the building has bolstered neighborhood busi-nesses, with wide margins feeling ill-informed to make an opinion (selecting “neither agree nor disagree” or “don’t know”). Seventy-eight percent of arts tenant respondents felt more people have come to the neighborhood to expe-rience cultural events because of the artist spaces.
Interviewees indicated the Northern and Tilsner’s artist residents stimulated demand for services by increasing Lowertown’s population:

69
I think that there is no doubt that this building [the Northern] has been a major hub for attracting businesses…there were no businesses here 20 years ago. Look at Golden’s Deli – they have grown tremendously in concert with the growth of this community. You can’t underestimate the collective eco-nomic power of people who patronize the businesses in this area. For ten long years I had lunch at Golden’s Deli every single day, so we are talking tens of thousands of dollars from just us, going to these places.
– Northern artist
Downtown St. Paul has had issues with quality of life in the past. This neighborhood has been one piece of that economic revitalization of bringing people down here to live, and all of the economic ripples that causes…The larger community has become more stable because of our presence here.
– Laura Zabel, Springboard for the Arts The Tilsner brought a critical mass; it started to create real business oppor-tunities. That’s when we got the Black Dog Café and the Tanpopo Noodle Shop restaurant in Northern; the second floor commercial spaces in North-ern started to fill…There was a critical mass of households in Lowertown that needed services.
– Will Law, Artspace All three spaces attract patrons to the neighborhood for arts offerings who then engage in ancillary spending. Most prominently, twice a year the North-ern and Tilsner draw 4,000 and 2,000 people for the St. Paul Art Crawl, and the Traffic Zone’s Open Studios attracts 1,400 visitors. Many interviewees valued capturing attendees’ associated spending in the neighborhood and boosting area visibility:
[The Traffic Zone] brings people that want to be involved with artists and the arts to the neighborhood. People teach classes here. It brings people in general to the area and those people spend money in the area.
– Mary Larson, LHB Architects & Engineers (Traffic Zone commercial tenant)
[The Northern and Tilsner] brought people to Lowertown, who we know spent money in Lowertown…Art Crawl brought all kinds of people to Low-ertown…The coffee shop on first floor [of the Northern] is there and bring-ing people to it. I see in the paper that they have weekly jazz nights, or something.
– Gary Peltier, St. Paul Planning and Economic Development (formerly) Unfortunately, few additional quantitative data sources are available to exam-ine the artist space’s contributions to neighborhood business growth. Using County and Zip Code Business Patterns data on business establishment levels, we examined how the greater North Loop area (55401 zip code) fared com-pared to Hennepin County, both prior to and after the Traffic Zone’s creation (Figure 20). Due to lack of data prior to 1994, we could not complete this analysis for Lowertown. Although the greater North Loop did outpace the county’s growth trend in the year in which the Traffic Zone opened, for the most part changes at the neighborhood level matched the greater region. In-terviewees also perceived the Traffic Zone’s economic impacts to be relatively

70
more limited than that of the Northern and Tilsner, because the space is non-residential and somewhat geographically isolated. So, although the Traffic Zone supports area businesses by attracting visitors and through artists and other commercial tenant’s spending, these effects appear to be modest. Figure 20 Change in Number of Businesses Traffic Zone's Zip Code & Hennepin County
Source: County and Zip Code Business Patterns data Social Benefits: Civic Engagement, Gathering Places and Safety For some, the appeal of artist spaces lies in their perceived social benefits – creating new spaces for community members to gather, helping deter crime through increased activity and more “eyes on the street,” and, in particular, infusing a neighborhood with socially conscious art-ist zealots. Although often cash-poor, artists have a reputation for being highly educated and active in the civic realm:
Artists bring a certain culture to a commu-nity that is unique… They are people that don’t have a whole lot of money, but invest their time in their community. They need to, to survive because that’s their thing. That’s what they have to do.
– John Mannillo, Lowertown real estate broker and investor
95%
100%
105%
110%
115%
120%
1994 1996 1998 2000 2002 2004 2006
55401 Hennepin County Traffic Zone Completed
1994=100%
Mears Park. Lowertown Photo © Metris Arts Consulting, 2010

71
These artists are very active in the community – with community organiza-tions; other civic things…For the most part artists are educated, enthusiastic, very good people, which is very positive for the community.
– Gary Peltier, St. Paul Planning and Economic Development (formerly) Below, we present our findings indicating the Northern, Tilsner, and Traffic Zone help increase artists’ civic engagement, foster neighborhood volunteer-ism, provide community gathering spaces, and enhance perceptions of safety. These impacts appear modest and vary across spaces. Boosting Artists’ Civic Involvement Artists and community informants affirm the Northern, Tilsner and Traffic Zone have contributed to increased volunteerism and civic engagement. Fifty-eight percent of all arts tenant survey respondents indicated artists and/or other community members have been more civically active because of the building (Table 10). Respondents from the Northern and Tilsner, the two live/work spaces, showed even higher rates of agreement, 70% and 60%, re-spectively. The buildings’ contributions to neighborhood volunteerism appear more modest; 39% of arts tenant survey respondents agreed artists and/or other community members have volunteered more in the neighborhood be-cause of the artist space, with high margins of artists selecting “neither agree nor disagree” or “don’t know.” Again, the live/work Northern and Tilsner spaces showed higher rates of agreement, 43% and 44%, respectively. The differing results between the live/work spaces and non-residential Traffic Zone, suggest artists become more involved in communities in which they not only work, but also live.
Table 10 Arts Tenant Survey Results: Neighborhood Civic Life
Please rank ways in which the building has socially affected the surrounding neighborhood.
Respondents selecting agree to strongly agree (%)
All Northern Tilsner Traffic Zone
Artists and/or other community members have been more civically active (i.e. worked for a greater voice in policies affecting them and/or their communities).
58 70 60 33
Artists and/or other community members have volunteered more in the neighbor-hood.
39 43 44 18
Community informants Marla Gamble and Robyn Priestley relay how artists’ civic engagement plays out in Lowertown:
Artists started participating in the community. They joined the district coun-cil, placemaking meetings, the caucuses. They got involved in politics…By being on the board of Friends of the Central Library, they got a small library

72
to open up in Galtier Plaza…They once got a city ordinance passed that every development committee had to have an artist on it…Artists were in-strumental to the development of the Poetry Park.
– Marla Gamble, Lowertown resident
A lot of people volunteer. They work with the city, other nonprofits, their churches, and help out with Art Crawl. We had tons of people go to the City Council meetings around the LRT maintenance facility.
– Robyn Priestley, St. Paul Art Collective When asked to rate the artist space’s effect on their own community involve-ment, 58% of arts tenant respondents indicated they had been more civically active, and 41% agreed they have volunteered more in the neighborhood (Table 11). Northern and Tilsner respondents again showed higher rates of agreement than Tilsner respondents. Only 37% of all arts tenant respondents indicated they have volunteered more in general, suggesting that nearly two thirds of artists did not consider living and/or working in the artist space as a factor influencing their rates of volunteerism. We expected more robust find-ings, given that each space’s selection committee considers an applicant’s community involvement as one entry criterion, and artists agree to volunteer within their coop. Table 11 Arts Tenant Survey Results: Individual Community Involvement
Please rank ways in which living and/or working in the building has affected your own community involvement:
Respondents selecting agree to strongly agree (%)
All Northern Tilsner Traffic Zone
I have been more civically active (i.e. worked for a greater voice in policies affecting me and/or my community).
58 61 64 41
I have volunteered more in the surrounding neighborhood. 41 43 52 17
I have volunteered more, generally. 37 26 44 41 Interviewees and survey respondents helped contextualize these seemingly modest results. Tilsner writer Chamath Perera points out, “artists are stretched in too many directions – working on their art, writing grants, second jobs.” Degree of community involvement also varies from artist to artist, with a small few likely to be highly involved in civic life, an insight made by Larry Englund, who serves on the District Council (St. Paul’s neighborhood repre-sentation system):
Artists need to find a way to be more integrated and involved in community concerns. I understand it can be hard because of how much time it requires and that it might even deaden one’s creativity by going to too many meet-ings. Those who are involved tend to get involved in a couple of different things. I would like to see it spread out more. We often have to go out and recruit artists to serve on District Council, sometimes without success.

73
Sometimes they only last one term or one year, because it ends up being too much for them. It’s hard to find that balance.
– Larry Englund, CapitolRiver District Council Providing New Gathering Places Artists and other community members also valued the Northern, Tilsner, and Traffic Zone for providing the public with new community spaces. Sixty per-
cent of arts tenant re-spondents indicated community members have used space in the building to gather or meet. Tilsner residents have made their base-ment community meet-ing room available to the light rail transit’s Operational and Main-tenance Facility Task Force, yoga classes, and
a writers group. The public enjoys unrestricted access to the Traffic Zone’s lobby gallery during business hours. Neighboring residents enjoy the garden area behind the Northern and Tilsner:
People from all around come and walk their dogs…It’s another hangout space in the back there.
– Robyn Priestley, St. Paul Art Collective Interviewees touted the Northern’s commercial spaces, in particular, for pro-viding public gathering spots:
The Black Dog Café and Tanpopo have succeeded and added a lot to the neighborhood as gathering places. There’s Springboard for the Arts on the second floor.
– John Mannillo, Lowertown real estate investor
Simply the fact that Black Dog is there means that every couple of weeks I have lunch or coffee there and sooner or later someone I know comes in and we sit down together or I sit down with the owners. It’s a way to find out what’s going on in the community.
Larry Englund, CapitolRiver District Council Increasing Safety Lastly, we learned artists and other community members awarded the artist spaces credit for helping increase safety. Thirty-five percent of arts tenant survey respondents felt activity associated with the building has increased neighborhood safety or decreased crime, with high margins of respondents selecting “neither agree nor disagree” or “don’t know.” Lowertown resident Marla Gamble and worker Robyn Priestley offer their perceptions of how the Northern and Tilsner have helped deter crime:
Black Dog Café
Photo © Sean Smuda, seansmuda.com, 2009

74
People watch out for each other. People in the commercial spaces and resi-dents watch out the windows for activity in the parking lot. It definitely has an effect on crime. There are always exceptions, but if there’s someone act-ing suspicious or if there’s something that isn’t right in the street, it’s no-ticed.
– Robyn Priestley, St. Paul Art Collective The more people that came, the less crime we saw, and there were fewer transients…This is a rather safe neighborhood…When Northern and Tilsner were developed crime decreased dramatically.
–Marla Gamble, Lowertown resident Overall, the Northern, Tilsner, and Traffic Zone not only support in-house artists and arts organizations, but also yield broad neighborhood and regional benefits. Artists and a range of community members valued art crawl and open studio events for attracting visitors to the neighborhood and providing high-caliber cultural experiences. For all three spaces, interviewees felt Art-space’s restoration and repurposing of underutilized historic structures enhanced the community. The Northern and Tilsner helped catalyze area rede velopment and provide last-ing artist cachet to Lowertown. Esti-mations suggest both the Tilsner and Traffic Zone increased surrounding property values. We found scant evidence to suggest the Northern, Tilsner, or Traffic Zone contributed to gentrification led displacement. But findings indi-cate that these artist spaces support, attract and help retain artist entrepre-neurs, who strengthen regional economic competitiveness. All three spaces attract visitors to the neighborhood who then engage in ancillary spending, and the Northern and Tilsner’s artist residents bolster area businesses with increased demand for services. These spaces also spur social benefits ranging from increased civic involvement and safety to providing new spaces open to the public. In our conversations with artists, government officials, community leaders, residents, and business owners, we not only learned how these individuals perceived the Northern, Tilsner, and Traffic Zone to have impacted the neighborhood and larger region, but also their views on why – what factors enhanced spillover benefits, what limited impacts and why findings varied be-tween spaces. Below, we synthesize these insights.
Insights: Factors Influencing Spillover Benefits As we present above in Neighborhood and Regional Impacts, the degree to which the Northern, Tilsner, and Traffic Zone benefit the larger neighborhood and region varies across spaces. Artists showed higher levels of community en-gagement at the live/work Northern and Tilsner. These Lowertown spaces attract more visitors through the area-wide St. Paul Art Crawl than Traffic
Northern and Tilsner garden Photo © Metris Arts Consulting, 2010

75
Zone artists do through their Open Studio event. Community members praised the Northern’s Black Dog Café and arts organizations for providing consistent opportunities for the public to experience rich arts offerings and gather. Why do these variations occur and how might Artspace and commu-nities proactively shape outcomes? Interviewees identified a number of factors that increase an artist space’s spillover impacts:
• Artists’ vested interests in the space and neighborhood • A critical mass of arts activity, such as is fostered by live/work and
larger projects and/or sighting projects within an area of surrounding artist/arts density
• Physical connections to the surrounding neighborhood • Consistent public access through events and commercial spaces • Successfully meeting internal challenges
Again, we caution that we drew these findings from only three of Artspace’s 24 projects currently in operation. As our research expands, so will our con-clusions about how to increase the odds that an artist space will yield com-munity benefits, beyond its core function of providing affordable, sustained space to artists and arts organizations. Artists’ Vested Interests A number of interviewees articulated a strong link between an artist space’s broader community impacts and the degree to which in-house artists have a vested interest in their space and the surrounding neighborhood:
They need to have an ownership in the buildings and an ownership feeling in the neighborhood. As people stay longer, they become more involved. Even when I’ve lived in neighborhoods where people own the houses, I’ve never felt this kind of ownership. It’s a really interesting, unusual thing, es-pecially because it [the Northern] is rental property.
– Robyn Priestley, St. Paul Art Collective No matter what project it is, artists need to be engaged in it so that it’s a vested interest on their behalf – they create the style, the rules; they create the base that things grow out of, because then they stay committed…Artists need to be initiators…When that happens, then they automatically want to thank the community; they want the grantors to see their spaces; they host open houses and special events; they organize art crawls and collaborate in the community as a way to give back, because they’re invested already.
– Marla Gamble, Lowertown Lofts artist
As Priestley and Gamble relay in the previous quotes, cultivating artists’ vested interests does not necessarily hinge on their having a literal ownership stake. Other factors, such as their degree of self-determination, length of ten-ure, and the residential component of live/work space also increase artists’ commitment to the artist space and/or the larger neighborhood. We, for in-stance, attribute the Northern and Tilsner artists’ higher reported rates of

76
community engagement to the fact that these artists not only work, but also live in the neighborhood. A Critical Mass – Live/Work, Size and Surrounding Artist Density Interviewees also spoke to the importance of scale. They perceived that live/work and larger spaces more effectively build a critical mass of arts activ-ity than smaller, studio-only projects. In addition, artists in spaces that aug-ment areas with an existing density of artists and/or arts organizations can reap mutual benefits, such as area-wide art crawls.
The residential component and larger number of artists served (118 total units) amplified the Northern and Tilsner’s community impacts, whereas their absence at the Traffic Zone limited that space’s potential:
Their quantity of people makes them a huge impact – economically and so-cially. The two of them [the Northern and Tilsner] represent the largest mass of a block. Often two people are involved in each studio. We ended up with enough mass to need a park, playground, and a grocery store. Those were the things that helped define the rest of the neighborhood. The Tilsner was for artists and their families, so there were kids. We worked for and got a pocket children’s park.
– Marla Gamble, Lowertown resident
I’m not a believer that you get enough density from a commercial building to really drive new retail opportunities, safety increases, in anything close that you get with residential. Okay, maybe you get coffee shop and wine bar business, but it takes residential development to really drive retail opportuni-ties.
– David Frank, North Loop resident
I don’t think there are enough artists in Traffic Zone to be a draw. You need a critical mass to make a dramatic impact.
– Nick Legeros, North East Minneapolis Arts Assoc. Similarly, because Traffic Zone artists constitute one of the North Loop’s few arts holdouts in the face of gentrification pressures, they are unable to tap synergies available in areas of arts density:
We are the last downtown artists, like the last artists on a desert island. – Harriet Bart, Traffic Zone artist
I miss the galleries that used to be in the Warehouse District. I was just talk-ing to this business exec who has a wife who is an artist and he said, "Where have all your artists gone?" I think they've gone over to Northeast. I wish we still had a strong base here.
– Fritz Kroll, North Loop realtor and resident Place Matters – Physical Links to Neighborhood Interviewees painted a stark contrast between the Traffic Zone’s and Lower-town spaces’ connections to the surrounding neighborhood, a factor they saw as closely tied to the space’s ability to affect broader neighborhood impacts.

77
Community members described the Northern and Tilsner as having com-pleted the neighborhood and linking larger areas of St. Paul:
Because of the Northern and Tilsner, we have the whole feeling of wanting to connect Lowertown to the East Side. They’re the connector to the east…The Northern and Tilsner are almost a jump-off point for how to get down to the river, the East Side and Swede Hollow.
– Marla Gamble, Lowertown resident In comparison, interviewees viewed the Traffic Zone as cut off from the North Loop neighborhood and downtown core, due to the I-394 onramp, neighboring adult entertainment venue, and the lack of through streets. They perceived the Traffic Zone’s modest neighborhood and regional impacts to be closely tied to its physical isolation:
Most people have no clue what it is, where it is. It’s really not a generator of activity, because it’s cut off almost completely.
– Chuck Leer, North Loop developer
They took an abandoned building and put it into use. But, it’s kind of in the middle of nowhere, so nothing else has really happened around it.
– Jackie Cherryhomes, former Minneapolis City Council member However, the picture for the Traffic Zone is shifting. A new light rail station opened two blocks away in the winter of 2009, in conjunction with the com-pletion of the Twin’s Target Field. Related streetscaping improvements, such as sidewalk widening, make immediate neighborhood more pedestrian friendly. Several community members viewed these changes as an opportunity to knit the Traffic Zone into the neighborhood’s fabric. Open Doors – Making Time and Space to Let the Public In Frequently, artists and other community members threw out the phrase, “just an artists’ apartment building” to illustrate a base line they felt successful artist spaces should surpass. By creating opportunities for the general public and larger arts community to access the building’s arts and physical assets, one goes far towards reaching that goal. As Northern commercial tenants Robyn Priestley and Sara Remke express, exchanges between artists and the larger community seldom just happen or-ganically:
There isn’t necessary a big social interaction between artists and non-artists…Maybe the lack of social interaction is partly because of the eco-nomic divide; maybe it’s because of the scheduling of people’s lives.
– Robyn Priestley, St. Paul Art Collective Having people like Springboard and the Guitar Studio is really key. Things that bring people in and out of the building, like the gallery downstairs, make it [the Northern] more than an apartment building. Yes you want artists to have cheap rent and workspace, but you also need to connect them to the world…It’s crucial to create traffic and interchange, community. It allows

78
people to experience more. It creates something when you have people coming in and out for different things.
– Sara Remke, Black Dog Café As the previous quote illustrates, commercial tenants, ranging from cafes to arts organizations, offer the public consistent ways to access a building’s arts offerings and provide spaces to gather and meet. Interestingly, we heard no comparable praise for the commercial spaces housed at the Traffic Zone, most of which are office tenants, suggesting that particular kinds of tenants (arts businesses and organizations and community centered cafes) and their individual efforts make the difference. Art crawls and open studio events also provide critical opportunities to con-nect the public to the artist space, and specifically the artists within. Artists benefit from increased exposure and sales, and the public gets an up close look at a variety of art, seeing who created it and how. Unfortunately, mount-ing open studio events requires extensive work, much of which the artists provide without direct compensation. Time and coordination requirements confine the St. Paul Art Crawl and Traffic Zone Open Studios to twice a year, although the recently initiated monthly Lowertown First Friday series may buck the trend. Needing One’s Own House in Order Lastly, artists, the artist spaces collectively and Artspace may have limited abilities to devote time and energy to greater community involvement, be-cause of individual and/or internal challenges. One artist shares that his struggles to afford rent translates to decreased vol-unteerism:
With the continual rent increases, I have to spend MORE time earning in-come, and thus have LESS time to volunteer, both in the building and the surrounding community.
– Tilsner artist survey respondent
Collectively, the Traffic Zone artists stepped up their efforts to offer more arts programming to the public only within the last three years, after the building gained surer financial footing:
A huge amount of energy had to go into figuring out how to make the space work for artists, so it left very little time to devote to anything but keeping the doors open.
– Jantje Visscher, Traffic Zone artist
The initial thing is having a safe, secure and stable workspace. Then moving forward, there’s attempting to engage the community.
– Jim Dryden, Traffic Zone artist A wide-spectrum of artists and other community members seek Artspace’s organizational involvement on issues ranging from coordinating responses to

79
local land-use changes to developing more local artist spaces. They view Art-space as a necessary steward of broader participation by the artists and arts organizations within their projects. Ben Krywosz of Nautilus Music Theater shares:
We want to acknowledge the value Artspace has brought by way of this building…But we see an enormous opportunity for them to take more of an active role here…They have been seduced by larger projects elsewhere and have fallen into the trap that bigger is better. They are sitting on this gold mine here, and they don’t even realize it.
To Artspace, these orders may appear tall, as it works to fulfill its core mission of preserving, fostering, and creating affordable artist space, while accepting the risk but not profits available to for-profit developers.
As we outline above in Neighborhood and Regional Impacts, artist spaces yield broad benefits ranging from expanded arts offerings to increased property values. But we view their core purpose as housing and supporting artists and arts organizations. We encourage those who look to artist spaces as a means to an end of reaching broader neighborhood revitalization objectives to re-main cognizant that artists, artist spaces and Artspace all face challenges which damper their ability to simultaneously serve as community builders.
CONCLUSIONS AND NEXT STEPS This research breaks new ground in articulating how artist spaces matter, for whom, and why. However, only three case studies inform both the impact findings and our inferences on the causal factors driving and limiting success. We hope to hone these preliminary conclusions by expanding this research to other Artspace projects, particularly those outside of urban areas, without co-operative structures, and featuring new construction. A larger, comparative sample will enable us to more fully address the crucial questions of which fac-tors influence successful outcomes and which impacts hold across different environments. Our research does allow us to share the Northern’s, Tilsner’s, and Traffic Zone’s impacts, highlight different outcomes, and probe why variations occur. Arts tenants, neighborhoods, and regions reap an array of benefits. These spaces strengthen artists’ careers through time and productivity gains, enhanc-ing reputations and identities, and by facilitating networking, sharing equip-ment, knowledge, and skills. They expand arts offerings for both the public and larger arts communities. The artist spaces not only transformed vacant eyesores and restored historic structures; community members also credit them with helping spur area redevelopment and providing lasting artist ca-chet. Our data indicates these spaces increase area property values, but we found few red flags that they triggered gentrification-led displacement. The spaces support, attract, and help retain artist entrepreneurs, who in turn en-hance regional economic competitiveness. Neighborhood businesses receive boosts from spending by artist residents and visitors. The spaces also contrib-

80
ute modest social benefits, including fostering artists’ civic involvement, pro-viding public gathering spots, and increasing safety. Not all artists, spaces, or neighborhoods experienced these benefits equally. Community members credited the Northern and Tilsner with helping revital-ize Lowertown and anchor it as a home for working artists, but viewed the Traffic Zone’s spillover contributions to be much more limited. Traffic Zone artists’ high satisfaction levels stood out. Differences in neighborhood context, specific project objectives, and each space’s physical design and operational structure account for much of the variation. Whereas the Northern’s and Tilsner’s development occurred within Lowertown’s broad-based revitalization efforts, the Traffic Zone secured art-ist space against a rising tide of gentrification. The Traffic Zone serves the smallest number of artists and is non-residential. These artists also differ from those at the Northern and Tilsner because they are all mid-career and co-own the building in 50/50 partnership with Artspace. The live/work Northern and Tilsner serve artists meeting income qualifications, because of Low Income Housing Tax Credit Financing. Whereas the Tilsner is entirely live/work, the Northern also hosts commercial tenants ranging from cafes to arts businesses and organizations. Noting these differences, a range of community members weighed in as to what factors enhance and limit artist spaces’ benefits to arts tenants and the surrounding neighborhood and region.
When arts tenants’ satisfaction levels are high, a larger number of arts tenants should benefit, and those that do should experience greater gains. Artists and arts organizations prized affordability, stability, good maintenance, specific physical characteristics ranging from flexible spaces to community meeting space, and opportunities to share governance responsibilities. Interviewees also inferred which factors helped or hindered broad neighbor-hood and regional outcomes. They thought artists with greater senses of in-vestment in their spaces and neighborhoods would be more civically active and offer more frequent arts offerings to the public. They viewed spaces with a residential component, literal ownership, and long artist tenures as factors that increase artists’ vested interests. Some community members thought a critical threshold of artists or arts activity must be reached to trigger spillover benefits. They perceived live/work spaces, larger spaces and projects devel-oped in areas with a pre-existing density of artists or arts activity as effectively adding to the requisite critical mass. Physical links to the surrounding neigh-borhood were thought to help leverage the economic, physical, and social benefits a neighborhood might experience, as opposed to isolated spaces. In-terviewees thought higher frequencies of arts events and the presence of arts or community-oriented commercial tenants provide relatively greater public benefits. Lastly, we heard artists and other community members articulate that the challenges artists and Artspace face limit their ability to affect broad community goals. By getting their own house in order, they are better posi-tioned to turn their focus and energies outward. Although, as our evidence illustrates, artist spaces can and do provide neighborhood and regional bene-

81
fits, we view an artist space’s core function as supporting in-house artists and arts organizations. We encourage those seeking to use artist space as a means of achieving revitalization objectives, do so in concert with other efforts.
Although drawn from only three case studies, these findings increase the un-derstanding of artists, funders, local governments, and communities with re-spect to how artist spaces can benefit in-house artists and arts groups and the surrounding neighborhood and region. We hope our analysis rings true for the artists and other community members whose insights helped to shape it. Just as this is a first step in a larger research process, Artspace’s staff and board will use this report as a jumping-off point, as they continue exploring how they may more effectively meet their core mission of creating, fostering and preserving affordable space for artists and arts organizations, and also support broad community objectives.

82
REFERENCES Bartik, Timothy. 1993. Who benefits from
local job growth: Migrants or the original residents? Regional Studies 27, no. 4: 297-312.
City of Minneapolis Planning Department, Research and Strategic Planning Divi-sion. 2001. North Loop - Minneapolis Neighborhood Profile. October. http://www.ci.minneapolis.mn.us/neighbor-hoods/northloop_profile_home.asp#TopOfPage.
City of Minneapolis. Community Planning and Economic Development (CPED). 2006. North Loop Base Map. August. http://www.ci.minneapolis.mn.us/neighbor-hoods/northloop_base_map.pdf.
Combs, Marianne, and Minnesota Public Ra-dio. 2009. St. Paul chooses Lower-town building for LRT garage. Minne-sota Public Radio NewsQ. March 19. http://minnesota.publicradio.org/display/web/2009/03/19/lowertown_light_rail_garage/.
Earhart, Andrew. 1992. The Buildings of Saint Paul. The Mears Park Area. Saint Paul, MN.
ESRI nation-wide databases. U.S. Counties (Generalized) Shapefile. counties-metadata.htm.
———. U.S. MapData Water Boundaries SDC Feature Database. watermeta-data.htm.
———. U.S. Streets SDC Feature Database. streetsmetadata.htm.
———. U.S. Tracts Shapefile. tractsmeta-data.htm.
Felsenstein, Daniel, and Joseph Persky. 2007. Evaluating Local Job Creation: ‘A Job Chains’ Perspective. Journal of American Planning 73, no. 1: 23-34.
Gadwa, Anne, and Ann Markusen. 2009. De-fining, Measuring, and Comparing Place-Based Public Investment Out-comes. In . Cambridge, MA: Lincoln
Institute of Land Policy, September. www.metrisarts.com.
GeoLytics, Inc. CensusCD Blocks. E. Bruns-wick, NJ: GeoLytics.
GeoLytics, Inc., and U.S. Bureau of the Cen-sus. CensusCD 1980 Long Form in 2000 Boundaries. E. Brunswick, NJ: GeoLyt-ics.
———. CensusCD 1990 Long Form in 2000 Boundaries. E. Brunswick, NJ: GeoLyt-ics.
———. CensusCD 2000 Long Form SF3. E. Brunswick, NJ: GeoLytics.
———. CensusCD 2000 Short Form Blocks. E. Brunswick, NJ: GeoLytics.
GeoLytics, Inc., Urban Institute, and U.S. Bu-reau of the Census. CensusCD Neigh-borhood Change Database (NCDB) 1970-2000 Tract Data: Selected Variables for US Census Tracts for 1970, 1980, 1990 and 2000 and Mapping Tool. E. Bruns-wick, NJ: GeoLytics.
Google Inc. 2009. Google Earth. Mountain View, CA: Google Inc. http://earth.google.com/intl/en/download-earth.html.
Heilburn, James, and Charles Gray. 1993. Eco-nomics of Art and Culture. New York: Cambridge University Press.
Kennedy, Randy. 2009. A Survey Shows Pain of Recession for Artists - NY-Times.com. New York Times, Novem-ber 24, New York edition.
Lower Phalen Creek Project. 2009. Vento Sanctuary. Lower Phalen Creek Project. http://www.mepartnership.org/sites/LOWERPHALENCREEK/sub_page6.asp.
Lowertown Lofts Artists Cooperative. 2009. Lowertown Lofts Artists Cooperative - About Us. lowertownlofts.org. http://lowertownlofts.org/index.php.
Markusen, Ann, and David King. 2003. The Artistic Dividend: The Arts' Hidden Con-tributions to Regional Development. Min-neapolis, MN: Project on Regional

83
and Industrial Economics. Humphrey Institute of Public Affairs. University of Minnesota., July. http://www.hhh.umn.edu/projects/prie/aei.html.
Markusen, Ann, Greg Schrock, and Martina Cameron. 2004. The Artistic Dividend Revisited. Minn: Project on Regional and Industrial Economics. Humphrey Institute of Public Affairs. University of Minnesota., March. http://www.hhh.umn.edu/projects/prie/aei.html.
Minnesota Historical Society. 2009a. National Register Property Details: National Register of Historic Places: mnhs.org. http://nrhp.mnhs.org/NRDetails.cfm?NPSNum=75000986.
———. 2009b. National Register District Property Details: National Register of Historic Places: mnhs.org. http://nrhp.mnhs.org/DistrictPropDetails.cfm?DistrictID=3875.
———. 2009c. National Register District Property Details: National Register of Historic Places: mnhs.org. http://nrhp.mnhs.org/DistrictPropDetails.cfm?DistrictID=3864.
Minnesota Public Radio NewsQ. Central Cor-ridor LRT route map (proposed). Minnesota Public Radio NewsQ. http://minnesota.publicradio.org/tools/maps/transit/central/.
Moe, Richard. 1997. Changing Places: Rebuilding Community in the Age of Sprawl. 1st ed. New York: Henry Holt & Co.
Munsey, Paul, and Corey Suppes. Target Cen-ter. ballparks.com. http://basketball.ballparks.com/NBA/MinnesotaTimberWolves/index.htm.
National Park Service. U.S. Department of the Interior. 2009. Mississippi National River and Recreation Area - Lambert's Landing. nps.gov. January 27. http://www.nps.gov/miss/planyourvisit/lambland.htm.
Ruggles, Steven, Matthew Sobek, Trent Alex-ander, Catherine, A. Fitch, Ronald
Goeken, Patricia Kelly Hall, Miriam King, and Chad Ronnander. 2009. In-tegrated Public Use Microdata Series. Min-neapolis, MN: Minnesota Population Center. http://usa.ipums.org/usa/.
The St. Paul Farmers' Market. 2009. History of the St. Paul Farmer's Market. stpaul-farmersmarket.com. http://www.stpaulfarmersmarket.com/about/.
U.S. Census Bureau. 1981. 1980 Census of Popu-lation and Housing Block Statistics, Min-neapolis-St. Paul, Minn.-Wis., Standard Metropolitan Statistical Area. November.
———. 2007. Geographic Mobility between 2004 and 2005. In Population Profile of the United States, 3. Dynamic Version 3. U.S. Census Bureau. http://www.census.gov/population/www/pop-profile/files/dynamic/Mobility.pdf.
U.S. Census Bureau. Economic Planning and Coordination Division. U.S. Census Bureau's County Business Patterns. http://www.census.gov/econ/cbp/download/index.htm.
U.S. Census Bureau. Geography Division, Cartographic Products Management Branch. 2001. Census 2000: Incorpo-rated Places/Census Designated Places Cartographic Boundary Files. July 18. http://www.census.gov/geo/www/cob/pl2000.html.
U.S. Census Bureau. Neighborhood Statistics Program, and Minneapolis (Minn). City Planning Department. 1983. 1980 Minneapolis Neighborhood Statistics. Min-neapolis, MN, September.
U.S. Census Bureau. User Defined Areas Pro-gram, and Minneapolis (Minn.). City Planning Dept. 1993. 1990 Minneapolis Neighborhood Statistics. Vol. 1. 2 vols. Minneapolis, MN: Released through the City of Minneapolis Planning Dept.
U.S. Department of Housing and Urban De-velopment. 2010. Community Plan-

84
ning & Development: Over-Income Tenants. Community Planning & Devel-opment: Over-Income Tenants. http://www.hud.gov/offices/cpd/affordablehous-ing/training/web/lihtc/eligibility/ove
rincome.cfm. US Condo Exchange, LLC. 2010. Lowertown
Apartment Rentals. condo.com. http://minneapolis.condo.com/ForRent/United-States/Minnesota/St-Paul-Condos/Lowertown.
PEOPLE INTERVIEWED Northern Artists Anonymous, November 12, 2009 Justin Busch, November 12, 2009 Betsy Dollar, September 30, 2009 Kara Hendershot, November 12, 2009 Connell Johnston, November 12, 2009 Laura Nichols, November 12, 2009 Matthew Rucker, November 12, 2009 Angie Sandifer, November 12, 2009 Northern Commercial Tenants Michael Bhal, November 12, 2009 Ben Krywosz, Nautilus Music-Theater, No-
vember 12, 2009 John Smaby, AZ Gallery, November 12, 2009 Robyn Priestley, St. Paul Art Collective, Tri-
pod Support Services, October 20, 2009
Sara Remke, Black Dog Café, November 12, 2009
Laura Zabel, Springboard for the Arts, No-vember 12, 2009
Traffic Zone Artists Harriet Bart, November 17, 2009 Jim Dryden, October 20, 2009 Jodi Reeb-Myers, October 26, 2009 Jon Neuse, November 17, 2009 Steve Ozone, November 17, 2009 Jantje Visscher, November 17, 2009 Kathy Wismar, November 17, 2009 Tilsner Artists Anonymous (2), October 22, 2009 Bob Calton, October 22, 2009 Amelia Gluba, October 22, 2009 Matthew Hodge, October 22, 2009 Teena Janay Roberson, October 21, 2009
Lisa Mathieson, November 12, 2009 Chamath Perera, October 22, 2009 Joel Thingvall, October 22, 2009 Other Informants Jackie Cherryhomes, Minneapolis City Coun-
cil (formerly), September 16, 2009 Larry Englund, CapitolRiver District Council,
October 20, 2009 David Frank, North Loop Neighborhood As-
sociation, North Loop resident, Sep-tember 15, 2009
Marla Gamble, Lowertown Lofts Artists Co-operative resident, September 21, 2009
Fritz Kroll, Edina Realty, North Loop resi-dent, October 29, 2009
Mary Larson, LHB Engineers & Architects, November 5, 2009
Will Law, Artspace, August 20, 2009 Chuck Leer, North First Ventures, November
4, 2009 Nick Legeros, North East Minneapolis Arts
Association, November 5, 2009 Weiming Lu, Lowertown Redevelopment
Corporation (formerly), September 18, 2009
Bill Mague, Artspace Projects, February 8, 2010
John Mannillo, John Mannillo and Associates, CapitolRiver Council, October 19, 2009
Gary Peltier, St. Paul Planning and Economic Development (formerly), September 21, 2009.
Jim Thielen, Performance Property Manage-ment, November 12, 2009

85
APPENDIX A: ARTS TENANT SURVEY RESULTS Survey Dates: September 8-October 5, 2009 Mode: Internet survey delivered online via Zoomerang and supplemental paper surveys. We emailed invitations to complete the survey to artist tenants and representatives of all Northern arts commercial tenants (137 individuals), from lists compiled by Artspace and artist cooperative representatives. We also delivered paper surveys and self-addressed stamped envelopes to 22 indi-viduals known to have limited computer access. To encourage participation, we sent two email re-minders, posted fliers with the survey url in prominent locations within the buildings and offered respondents an opportunity to enter a drawing for six $50 prizes. Response Rate (%) Responses
Overall 37.7 60 (59 complete, 1 partial)
Northern Warehouse 32.9 23 (20 artists, 3 arts groups) Tilsner 37.3 25 Traffic Zone 54.5 12 Survey findings may not be representative of the entire population of arts tenants, due to selection bias. Respondents may be among those most content with their spaces and/or Artspace, or alterna-tively, dissatisfied.
Q1: In which Artspace building do you live and/or work?
# %
Northern Warehouse Artists’ Cooperative 23 38 Tilsner Artists’ Cooperative 25 42 Traffic Zone Center for Visual Arts 12 20
Q2: What best describes you?
# %
An artist living and working in the building 45 75
An artist only working in the building 12 20
An artist’s family member 0 0
A member of an arts group/organization/business renting space 3 5
A non-arts commercial/nonprofit tenant 0 0
Other 0 0

86
Q3: In what year did you move into the building? Northern # % Tilsner # % Traffic Zone # %
1989 1 5 1993 1 4 1993 3 25
1990 2 10 1999 1 4 1994 1 8
1993 1 5 2001 3 13 1995 2 17
1996 1 5 2003 1 4 1996 1 8
1997 1 5 2004 2 8 2003 1 8
2002 1 5 2005 1 4 2007 2 17
2004 1 5 2006 1 4 2008 1 8
2005 1 5 2007 7 29 2009 1 8
2006 3 15 2008 2 8
2007 3 15 2009 5 21 2008 4 20
2009 1 5
Q4: If you had a previous artistic workspace (including live/work space), where was it located?
Traffic Zone* # % In the same neighborhood as the Artspace building 5 45 In a different neighborhood in the same city 3 27 Elsewhere in the Twin Cities 2 18 In the greater Twin Cities metropolitan region 1 9 Outside of the Twin Cities metropolitan region 0 0 *Question 4 answered only by Traffic Zone artists
Q5: Where did you previously live? # % Northern*
In the same neighborhood as the Artspace building 1 5
In a different neighborhood in the same city 4 20
Elsewhere in the Twin Cities 7 35
In the greater Twin Cities metropolitan region 2 10
Outside of the Twin Cities metropolitan region 6 30
Tilsner*
In the same neighborhood as the Artspace building 2 8
In a different neighborhood in the same city 5 20
Elsewhere in the Twin Cities 11 44
In the greater Twin Cities metropolitan region 2 8
Outside of the Twin Cities metropolitan region 5 20 *Questions 5-7 answered only by Northern and Tilsner artists

87
Q6: Did your previous residence include artistic workspace? # % Northern* Yes 8 40 No 12 60
Tilsner* Yes 7 28 No 18 72 *Questions 5-7 answered only by Northern and Tilsner artists
Q7: If you had a previous artistic workspace, separate from your residence, where was it located? # % Northern
In the same neighborhood as the Artspace building 1 12
In a different neighborhood in the same city 2 25
Elsewhere in the Twin Cities 3 38
In the greater Twin Cities metropolitan region 1 12
Outside of the Twin Cities metropolitan region 1 12
Tilsner
In the same neighborhood as the Artspace building 2 15
In a different neighborhood in the same city 4 31
Elsewhere in the Twin Cities 2 15
In the greater Twin Cities metropolitan region 0 0
Outside of the Twin Cities metropolitan region 5 38 *Questions 5-7 answered only by Northern and Tilsner artists
Q8: If the Artspace building did not exist, how likely is it that you would have an artistic workspace (live/work or work only)?
# % All
Very unlikely 15 26 Somewhat unlikely 9 16 Somewhat likely 10 18 Very likely 23 40
Northern Very unlikely 6 30 Somewhat unlikely 4 20 Somewhat likely 5 25 Very likely 5 25

88
Q8 (cont.): If the Artspace building did not exist, how likely is it that you would have an artistic workspace (live/work or work only)?
Tilsner Very unlikely 6 24 Somewhat unlikely 5 20 Somewhat likely 3 12
Very likely 11 44
Traffic Zone Very unlikely 3 25 Somewhat unlikely 0 0 Somewhat likely 2 17 Very likely 7 58 *Questions 8-20 answered by all artists
Q9: If you would be likely to have an artistic workspace (live/work or work only), where would it most likely be located? # % All
In the same neighborhood as the Artspace building 20 40
In a different neighborhood in the same city 7 14
Elsewhere in the Twin Cities 17 34
In the greater Twin Cities metropolitan region 3 6
Outside of the Twin Cities metropolitan region 3 6
Northern
In the same neighborhood as the Artspace building 5 29
In a different neighborhood in the same city 2 12
Elsewhere in the Twin Cities 7 41
In the greater Twin Cities metropolitan region 1 6
Outside of the Twin Cities metropolitan region 2 12
Tilsner
In the same neighborhood as the Artspace building 11 50
In a different neighborhood in the same city 1 5
Elsewhere in the Twin Cities 8 36
In the greater Twin Cities metropolitan region 1 5
Outside of the Twin Cities metropolitan region 1 5

89
Q9 (cont.): If you would be likely to have an artistic workspace (live/work or work only), where would it most likely be located?
Traffic Zone
In the same neighborhood as the Artspace building 4 36
In a different neighborhood in the same city 4 36
Elsewhere in the Twin Cities 2 18
In the greater Twin Cities metropolitan region 1 9
Outside of the Twin Cities metropolitan region 0 0 *Questions 8-20 answered by all artists
Q10: What is your primary art form/arts occupation (primary by the average weekly time you devote to it)? # % All
Visual artist (inc. craft artist, painter, sculptor, illustrator, photographer, multi-media, ani-mator, filmmaker, video-maker, new media, digital media) 42 74
Theater/dance artist (inc. actor, director (inc. stage, film), dancer, choreographer, perform-ance artist) 4 7
Musician (inc. composer, instrumentalist, singer, conductor, DJ/mixing) 2 4
Literary artist (inc. fiction and non-fiction writers, playwrights, screenwriter, poet) 6 11
Other, please specify 3 5
Northern
Visual artist (inc. craft artist, painter, sculptor, illustrator, photographer, multi-media, ani-mator, filmmaker, video-maker, new media, digital media) 15 75
Theater/dance artist (inc. actor, director (inc. stage, film), dancer, choreographer, perform-ance artist) 2 10
Musician (inc. composer, instrumentalist, singer, conductor, DJ/mixing) 2 10
Literary artist (inc. fiction and non-fiction writers, playwrights, screenwriter, poet) 1 5
Other, please specify 0 0
Tilsner
Visual artist (inc. craft artist, painter, sculptor, illustrator, photographer, multi-media, ani-mator, filmmaker, video-maker, new media, digital media) 15 60
Theater/dance artist (inc. actor, director (inc. stage, film), dancer, choreographer, perform-ance artist) 2 8
Musician (inc. composer, instrumentalist, singer, conductor, DJ/mixing) 0 0
Literary artist (inc. fiction and non-fiction writers, playwrights, screenwriter, poet) 5 20
Other, please specify 3 12

90
Q10 (cont.): What is your primary art form/arts occupation (primary by the average weekly time you devote to it)?
Traffic Zone
Visual artist (inc. craft artist, painter, sculptor, illustrator, photographer, multi-media, ani-mator, filmmaker, video-maker, new media, digital media) 12 100
Theater/dance artist (inc. actor, director (inc. stage, film), dancer, choreographer, perform-ance artist) 0 0
Musician (inc. composer, instrumentalist, singer, conductor, DJ/mixing) 0 0
Literary artist (inc. fiction and non-fiction writers, playwrights, screenwriter, poet) 0 0
Other, please specify 0 0 *Questions 8-20 answered by all artists
Q11: Is your artistic work associated with a specific ethnic or cultural tradition or community? All # % Northern # % Tilsner # % Traffic Zone # % Yes 6 11 Yes 2 10 Yes 4 17 Yes 0 0 No 50 89 No 18 90 No 20 83 No 12 100 *Questions 8-20 answered by all artists
Q12: What is your age? All # % Northern # % Tilsner # % Traffic Zone # % under 18 0 0 under 18 0 0 under 18 0 0 under 18 0 0 18-24 1 2 18-24 1 5 18-24 0 0 18-24 0 0 25-34 12 22 25-34 3 16 25-34 9 38 25-34 0 0 35-44 10 18 35-44 5 26 35-44 5 21 35-44 0 0 45-54 18 33 45-54 8 42 45-54 7 29 45-54 3 25 55-64 9 16 55-64 2 11 55-64 2 8 55-64 5 42 65 and over 5 9 65 and over 0 0 65 and over 1 4 65 and over 4 33 *Questions 8-20 answered by all artists
Q13: What is your gender identity? All # % Northern # % Tilsner # % Traffic Zone # % Man 21 38 Man 9 47 Man 9 38 Man 3 25 Woman 34 62 Woman 10 53 Woman 15 62 Woman 9 75 Transgender 0 0 Transgender 0 0 Transgender 0 0 Transgender 0 0 *Questions 8-20 answered by all artists

91
Q14: What is your primary race/ethnic identity? # %
All
African American/African Descent 3 5
Asian, Asian American, Pacific Islander 3 5
Latino, Hispanic, Chicano 1 2
Native American, Native Alaskan 1 2
Caucasian, White 47 84
Other races, including multiracial 1 2
Northern
African American/African Descent 1 5
Asian, Asian American, Pacific Islander 0 0
Latino, Hispanic, Chicano 0 0
Native American, Native Alaskan 0 0
Caucasian, White 18 90
Other races, including multiracial 1 5
Tilsner
African American/African Descent 1 4
Asian, Asian American, Pacific Islander 2 8
Latino, Hispanic, Chicano 1 4
Native American, Native Alaskan 1 4
Caucasian, White 19 79
Other races, including multiracial 0 0
Traffic Zone
African American/African Descent 1 8
Asian, Asian American, Pacific Islander 1 8
Latino, Hispanic, Chicano 0 0
Native American, Native Alaskan 0 0
Caucasian, White 10 83
Other races, including multiracial 0 0 *Questions 8-20 answered by all artists

92
Q15: Please rank how the space has affected your ability to connect with others in the building. Living and/or working in the Artspace building has...
Strongly
Disagree Disagree
Neither Agree nor Disagree Agree
Strongly Agree
All
enabled me to share equipment and/or resources with others in the building. # 4 7 7 19 20 % 7 12 12 33 35
facilitated my collaborations with others in the building. # 6 3 14 19 15 % 11 5 25 33 26
facilitated my networking with others in the building.
# 4 1 5 25 22
% 7 2 9 44 39
allowed me to learn new artistic or business skills/knowledge from others in the building.
# 5 2 17 22 10
% 9 4 30 39 18
allowed me to share my artistic or business skills/knowledge with others in the building.
# 3 3 15 21 15
% 5 5 26 37 26
Northern
enabled me to share equipment and/or resources with others in the building. # 2 2 5 8 3 % 10 10 25 40 15
facilitated my collaborations with others in the building. # 3 1 7 4 5 % 15 5 35 20 25
facilitated my networking with others in the building. # 2 0 3 11 4 % 10 0 15 55 20
allowed me to learn new artistic or business skills/knowledge from others in the building.
# 3 0 7 8 1 % 16 0 37 42 5
allowed me to share my artistic or business skills/knowledge with others in the building. # 1 1 7 8 3 % 5 5 35 40 15
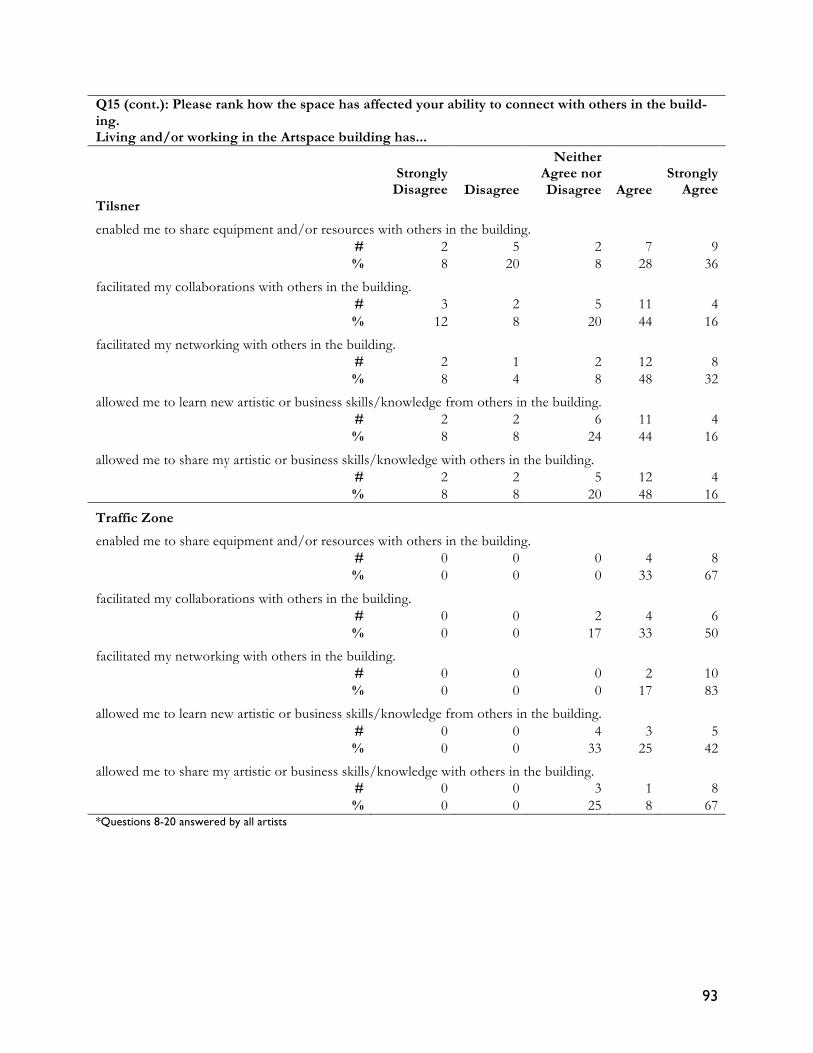
93
Q15 (cont.): Please rank how the space has affected your ability to connect with others in the build-ing. Living and/or working in the Artspace building has...
Strongly
Disagree Disagree
Neither Agree nor Disagree Agree
Strongly Agree
Tilsner
enabled me to share equipment and/or resources with others in the building. # 2 5 2 7 9 % 8 20 8 28 36
facilitated my collaborations with others in the building. # 3 2 5 11 4 % 12 8 20 44 16
facilitated my networking with others in the building. # 2 1 2 12 8 % 8 4 8 48 32
allowed me to learn new artistic or business skills/knowledge from others in the building. # 2 2 6 11 4 % 8 8 24 44 16
allowed me to share my artistic or business skills/knowledge with others in the building. # 2 2 5 12 4 % 8 8 20 48 16
Traffic Zone
enabled me to share equipment and/or resources with others in the building. # 0 0 0 4 8 % 0 0 0 33 67
facilitated my collaborations with others in the building. # 0 0 2 4 6 % 0 0 17 33 50
facilitated my networking with others in the building. # 0 0 0 2 10 % 0 0 0 17 83
allowed me to learn new artistic or business skills/knowledge from others in the building. # 0 0 4 3 5 % 0 0 33 25 42
allowed me to share my artistic or business skills/knowledge with others in the building. # 0 0 3 1 8 % 0 0 25 8 67
*Questions 8-20 answered by all artists

94
Q16: Please rank how the building has affected your ability to create your art and your financial well-being. Living and/or working in the Artspace building has...
Strongly
Disagree Disagree
Neither Agree nor Disagree Agree
Strongly Agree
All
helped me increase the amount of time I devote to my artistic work. # 4 4 9 17 22 % 7 7 16 30 39
helped me increase my productivity. # 4 2 13 20 18 % 7 4 23 35 32
helped me increase the percentage of income I earn from my artistic work. # 4 9 15 21 8 % 7 16 26 37 14
helped me increase my overall income. # 6 11 20 12 8 % 11 19 35 21 14
helped me increase my financial assets. # 7 15 23 8 4 % 12 26 40 14 7
Northern
helped me increase the amount of time I devote to my artistic work. # 1 1 3 7 8 % 5 5 15 35 40
helped me increase my productivity. # 1 1 4 8 6 % 5 5 20 40 30
helped me increase the percentage of income I earn from my artistic work. # 1 2 7 7 3 % 5 10 35 35 15
helped me increase my overall income. # 2 4 7 4 3 % 10 20 35 20 15
helped me increase my financial assets. # 2 6 6 4 2 % 10 30 30 20 10

95
Q16 (cont.): Please rank how the building has affected your ability to create your art and your finan-cial well-being. Living and/or working in the Artspace building has...
Strongly
Disagree Disagree
Neither Agree nor Disagree Agree
Strongly Agree
Tilsner
helped me increase the amount of time I devote to my artistic work. # 3 2 4 8 8 % 12 8 16 32 32
helped me increase my productivity. # 3 1 6 8 7 % 12 4 24 32 28
helped me increase the percentage of income I earn from my artistic work. # 3 6 3 10 3 % 12 24 12 40 12
helped me increase my overall income. # 4 5 7 6 3 % 16 20 28 24 12
helped me increase my financial assets. # 4 6 10 3 2 % 16 24 40 12 8
Traffic Zone
helped me increase the amount of time I devote to my artistic work. # 0 1 2 2 6 % 0 9 18 18 55
helped me increase my productivity. # 0 0 3 4 5 % 0 0 25 33 42
helped me increase the percentage of income I earn from my artistic work. # 0 1 5 4 2 % 0 8 42 33 17
helped me increase my overall income. # 0 2 6 2 2 % 0 17 50 17 17
helped me increase my financial assets. # 1 3 7 1 0 % 8 25 58 8 0
*Questions 8-20 answered by all artists

96
Q17: Please rank how the building has affected your reputation and identity as an artist. Living and/or working in the Artspace building has...
Strongly
Disagree Disagree
Neither Agree nor Disagree Agree
Strongly Agree
All
helped me attain recognition/prominence within my field. # 2 8 16 21 10 % 4 14 28 37 18
helped validate me as an artist. # 5 4 7 25 16 % 9 7 12 44 28
Northern
helped me attain recognition/prominence within my field. # 1 4 6 7 2 % 5 20 30 35 10
helped validate me as an artist. # 2 2 1 10 5 % 10 10 5 50 25
Tilsner
helped me attain recognition/prominence within my field. # 1 4 9 8 3 % 4 16 36 32 12
helped validate me as an artist # 3 2 4 10 6 % 12 8 16 40 24
Traffic Zone
helped me attain recognition/prominence within my field. # 0 0 1 6 5 % 0 0 8 50 42
helped validate me as an artist. # 0 0 2 5 5 % 0 0 17 42 42
*Questions 8-20 answered by all artists
Q18: Overall, do you perceive your space and the building as appropriate to your needs? All # % Northern # % Tilsner # % Traffic Zone # % Yes 49 86 Yes 18 90 Yes 19 76 Yes 12 100 No 8 14 No 2 10 No 6 24 No 0 0 *Questions 8-20 answered by all artists

97
Q19: Do you consider your space affordable? All # % Northern # % Tilsner # % Traffic Zone # % Yes 35 62 Yes 14 70 Yes 10 42 Yes 11 92 No 21 38 No 6 30 No 14 58 No 1 8 *Questions 8-20 answered by all artists
Q20: Please feel free to tell us more about how your space and the building have worked for you, including opportunities for improvement. If the situation has improved or worsened over time, how and why? *Questions 8-20 answered by all artists Q21: In what year did your group, business or organization move to the building? # % 1993 1 33 1997 1 33 2006 1 33 *Questions 21-28 answered only by Northern Warehouse arts commercial tenants
Q22: If your group, business or organization had a previous space, where was it located? # %
In the same neighborhood as the Artspace building 0 0
In a different neighborhood in the same city 1 50
Elsewhere in the Twin Cities 1 50
In the greater Twin Cities metropolitan region 0 0
Outside of the Twin Cities metropolitan region 0 0 *Questions 21-28 answered only by Northern Warehouse arts commercial tenants
Q23: If the Artspace building did not exist, where would your group, business or organization most likely have space? # %
Not applicable. We would not be in existence without the Artspace building. 1 33
In the same neighborhood as the Artspace building 1 33
In a different neighborhood in the same city 0 0
Elsewhere in the Twin Cities 1 33
In the greater Twin Cities metropolitan region 0 0
Outside of the Twin Cities metropolitan region 0 0 *Questions 21-28 answered only by Northern Warehouse arts commercial tenants

98
Q24: Please rank how the space has affected your group’s, business’ or organization’s ability to con-nect with others in the building. Renting space in the Artspace building has...
Strongly
Disagree Disagree
Neither Agree nor Disagree Agree
Strongly Agree
enabled us to share equipment and/or resources. # 0 0 0 3 0 % 0 0 0 100 0
facilitated our collaborations. # 0 0 0 3 0 % 0 0 0 100 0
facilitated our networking. # 0 0 1 2 0 % 0 0 33 67 0
allowed us to learn new artistic or business skills/knowledge. # 0 1 1 1 0 % 0 33 33 33 0
allowed us to share our artistic or business skills/knowledge. # 0 1 0 1 1 % 0 33 0 33 33
*Questions 21-28 answered only by Northern Warehouse arts commercial tenants
Q25: Please rank how the building has affected your group’s, business’ or organization’s financial health. Renting space in the Artspace building has...
Strongly Disagree Disagree
Neither Agree nor Disagree Agree
Strongly Agree
helped us financially stabilize. # 0 0 1 1 1 % 0 0 33 33 33
helped us grow financially. # 0 0 2 0 1 % 0 0 67 0 33
*Questions 21-28 answered only by Northern Warehouse arts commercial tenants
Q26: Overall, do you perceive your space and the building as appropriate to your group’s, business’ or organization’s needs? # % Yes 3 100 No 0 0 *Questions 21-28 answered only by Northern Warehouse arts commercial tenants

99
Q27: Do you consider your space affordable? # % Yes 2 67 No 1 33 *Questions 21-28 answered only by Northern Warehouse arts commercial tenants
Q28: Please feel free to tell us more about how your space and the building work for your group, organiza-tion or business, including opportunities for improvement. If the situation has improved or worsened over time, how and why? *Questions 21-28 answered only by Northern Warehouse arts commercial tenants
Q29: Please rank ways in which the building has affected the larger arts community. The building has...
Strongly
Disagree Disagree
Neither Agree nor Disagree Agree
Strongly Agree
Don’t Know
All
served as a hub for arts events open to the public. # 0 1 5 23 30 1 % 0 2 8 38 50 2
served as a gathering place for the larger arts community. # 1 9 14 25 9 2 % 2 15 23 42 15 3
contributed to particular artistic innovations, movements or trends. # 2 5 24 18 5 6 % 3 8 40 30 8 10
attracted other arts facilities/events, unaffiliated with the building, to the vicinity. # 1 4 14 23 12 6 % 2 7 23 38 20 10
attracted other artists, unaffiliated with the building, to live and/or work in the neighborhood. # 1 3 10 21 20 5 % 2 5 17 35 33 8

100
Q29 (cont.): Please rank ways in which the building has affected the larger arts community. The building has...
Strongly
Disagree Disagree
Neither Agree nor Disagree Agree
Strongly Agree
Don’t Know
Northern
served as a hub for arts events open to the public. # 0 0 2 6 14 1 % 0 0 9 26 61 4
served as a gathering place for the larger arts community. # 0 3 5 13 1 1 % 0 13 22 57 4 4
contributed to particular artistic innovations, movements or trends. # 2 1 8 5 3 4 % 9 4 35 22 13 17
attracted other arts facilities/events, unaffiliated with the building, to the vicinity. # 1 1 2 13 4 2 % 4 4 9 57 17 9
attracted other artists, unaffiliated with the building, to live and/or work in the neighborhood. # 0 0 3 9 9 2 % 0 0 13 39 39 9
Tilsner
served as a hub for arts events open to the public. # 0 1 2 13 9 0 % 0 4 8 52 36 0
served as a gathering place for the larger arts community. # 1 4 7 9 3 1 % 4 16 28 36 12 4
contributed to particular artistic innovations, movements or trends. # 0 3 11 7 2 2 % 0 12 44 28 8 8
attracted other arts facilities/events, unaffiliated with the building, to the vicinity. # 0 3 10 6 2 4 % 0 12 40 24 8 16
attracted other artists, unaffiliated with the building, to live and/or work in the neighborhood. # 1 2 3 11 6 2 % 4 8 12 44 24 8

101
Q29 (cont.): Please rank ways in which the building has affected the larger arts community. The building has...
Strongly
Disagree Disagree
Neither Agree nor Disagree Agree
Strongly Agree
Don’t Know
Traffic Zone
served as a hub for arts events open to the public. # 0 0 1 4 7 0 % 0 0 8 33 58 0
served as a gathering place for the larger arts community. # 0 2 2 3 5 0 % 0 17 17 25 42 0
contributed to particular artistic innovations, movements or trends. # 0 1 5 6 0 0 % 0 8 42 50 0 0
attracted other arts facilities/events, unaffiliated with the building, to the vicinity. # 0 0 2 4 6 0 % 0 0 17 33 50 0
attracted other artists, unaffiliated with the building, to live and/or work in the neighborhood. # 0 1 4 1 5 1 % 0 8 33 8 42 8
Q30: Please rank ways in which the building has affected the surrounding neighborhood’s economy.
Strongly
Disagree Disagree
Neither Agree nor Disagree Agree
Strongly Agree
Don’t Know
All
More people have come to the neighborhood to experience cultural events. # 0 2 5 27 20 6 % 0 3 8 45 33 10
The building has attracted new businesses to the neighborhood. # 2 5 15 14 10 13 % 3 8 25 24 17 22
Activity in the building has bolstered neighborhood businesses. # 1 1 12 24 11 11 % 2 2 20 40 18 18

102
Q30 (cont.): Please rank ways in which the building has affected the surrounding neighborhood’s economy.
Strongly
Disagree Disagree
Neither Agree nor Disagree Agree
Strongly Agree
Don’t Know
Northern
More people have come to the neighborhood to experience cultural events. # 0 0 1 15 5 2 % 0 0 4 65 22 9
The building has attracted new businesses to the neighborhood. # 0 1 6 8 3 5 % 0 4 26 35 13 22
Activity in the building has bolstered neighborhood businesses. # 0 0 7 8 5 3 % 0 0 30 35 22 13
Tilsner
More people have come to the neighborhood to experience cultural events. # 0 2 2 8 9 4 % 0 8 8 32 36 16
The building has attracted new businesses to the neighborhood. # 2 3 7 3 4 6 % 8 12 28 12 16 24
Activity in the building has bolstered neighborhood businesses. # 1 1 3 12 2 6 % 4 4 12 48 8 24
Traffic Zone
More people have come to the neighborhood to experience cultural events. # 0 0 2 4 6 0 % 0 0 17 33 50 0
The building has attracted new businesses to the neighborhood. # 0 1 2 3 3 2 % 0 9 18 27 27 18
Activity in the building has bolstered neighborhood businesses. # 0 0 2 4 4 2 % 0 0 17 33 33 17

103
Q31: Please rank ways in which the building has socially affected the surrounding neighborhood.
Strongly
Disagree Disagree
Neither Agree nor Disagree Agree
Strongly Agree
Don’t Know
All
Community members have participated in more events and programs. # 1 1 12 30 10 6 % 2 2 20 50 17 10
Community members have used space in the building to gather/meet. # 5 2 11 24 11 6 % 8 3 19 41 19 10
Artists and/or other community members have volunteered more in the neighborhood. # 2 4 20 20 3 10 % 3 7 34 34 5 17
Artists and/or other community members have been more civically active (i.e. worked for a greater voice in policies affecting them and/or their communities).
# 1 5 13 29 6 6 % 2 8 22 48 10 10
Programs and events in the building have benefited youth development. # 5 7 21 13 4 10 % 8 12 35 22 7 17
Activity associated with the building has increased neighborhood safety/decreased crime. # 2 6 20 13 8 11 % 3 10 33 22 13 18
Neighborhood confidence/desirability/cachet has increased. # 1 0 13 24 15 6 % 2 0 22 41 25 10

104
Q31 (cont.): Please rank ways in which the building has socially affected the surrounding neighbor-hood.
Strongly
Disagree Disagree
Neither Agree nor Disagree Agree
Strongly Agree
Don’t Know
Northern
Community members have participated in more events and programs. # 0 0 3 13 5 2 % 0 0 13 57 22 9
Community members have used space in the building to gather/meet. # 0 0 5 10 4 4 % 0 0 22 43 17 17
Artists and/or other community members have volunteered more in the neighborhood. # 0 2 6 9 1 5 % 0 9 26 39 4 22
Artists and/or other community members have been more civically active (i.e. worked for a greater voice in policies affecting them and/or their communities).
# 0 1 4 13 3 2 % 0 4 17 57 13 9
Programs and events in the building have benefited youth development. # 1 0 8 6 3 5 % 4 0 35 26 13 22
Activity associated with the building has increased neighborhood safety/decreased crime. # 1 3 7 4 4 4 % 4 13 30 17 17 17
Neighborhood confidence/desirability/cachet has increased. # 0 0 6 10 4 3 % 0 0 26 43 17 13

105
Q31 (cont.): Please rank ways in which the building has socially affected the surrounding neighbor-hood.
Strongly
Disagree Disagree
Neither Agree nor Disagree Agree
Strongly Agree
Don’t Know
Tilsner
Community members have participated in more events and programs. # 1 0 6 13 2 3 % 4 0 24 52 8 12
Community members have used space in the building to gather/meet. # 4 1 6 8 4 1 % 17 4 25 33 17 4
Artists and/or other community members have volunteered more in the neighborhood. # 2 1 8 10 1 3 % 8 4 32 40 4 12
Artists and/or other community members have been more civically active (i.e. worked for a greater voice in policies affecting them and/or their communities).
# 1 3 4 13 2 2 % 4 12 16 52 8 8
Programs and events in the building have benefited youth development. # 4 5 9 3 1 3 % 16 20 36 12 4 12
Activity associated with the building has increased neighborhood safety/decreased crime. # 1 3 9 5 2 5 % 4 12 36 20 8 20
Neighborhood confidence/desirability/cachet has increased. # 1 0 6 9 6 2 % 4 0 25 38 25 8

106
Q31 (cont.): Please rank ways in which the building has socially affected the surrounding neighbor-hood.
Strongly
Disagree Disagree
Neither Agree nor Disagree Agree
Strongly Agree
Don’t Know
Traffic Zone
Community members have participated in more events and programs. # 0 1 3 4 3 1 % 0 8 25 33 25 8
Community members have used space in the building to gather/meet. # 1 1 0 6 3 1 % 8 8 0 50 25 8
Artists and/or other community members have volunteered more in the neighborhood. # 0 1 6 1 1 2 % 0 9 55 9 9 18
Artists and/or other community members have been more civically active (i.e. worked for a greater voice in policies affecting them and/or their communities).
# 0 1 5 3 1 2 % 0 8 42 25 8 17
Programs and events in the building have benefited youth development. # 0 2 4 4 0 2 % 0 17 33 33 0 17
Activity associated with the building has increased neighborhood safety/decreased crime. # 0 0 4 4 2 2 % 0 0 33 33 17 17
Neighborhood confidence/desirability/cachet has increased. # 0 0 1 5 5 1 % 0 0 8 42 42 8

107
Q32: Please rank ways in which the building has physically affected the surrounding neighborhood.
Strongly
Disagree Disagree
Neither Agree nor Disagree Agree
Strongly Agree
Don’t Know
All
The building has catalyzed the development/redevelopment of other neighborhood properties. # 0 4 14 15 16 11 % 0 7 23 25 27 18
Commercial and/or residential vacancies have decreased in the neighborhood. # 3 13 14 9 6 15 % 5 22 23 15 10 25
Maintenance of private property has increased in the neighborhood. # 1 8 18 12 6 15 % 2 13 30 20 10 25
Public spaces have been upgraded (streetscaping, etc). # 0 10 14 14 12 10 % 0 17 23 23 20 17
Northern
The building has catalyzed the development/redevelopment of other neighborhood properties. # 0 2 4 8 7 2 % 0 9 17 35 30 9
Commercial and/or residential vacancies have decreased in the neighborhood. # 1 7 2 5 0 8 % 4 30 9 22 0 35
Maintenance of private property has increased in the neighborhood. # 0 5 6 4 1 7 % 0 22 26 17 4 30
Public spaces have been upgraded (streetscaping, etc). # 0 7 5 5 2 4 % 0 30 22 22 9 17

108
Q32 (cont.): Please rank ways in which the building has physically affected the surrounding neigh-borhood.
Strongly
Disagree Disagree
Neither Agree nor Disagree Agree
Strongly Agree
Don’t Know
Tilsner
The building has catalyzed the development/redevelopment of other neighborhood properties. # 0 2 7 7 3 6 % 0 8 28 28 12 24
Commercial and/or residential vacancies have decreased in the neighborhood. # 2 4 9 2 3 5 % 8 16 36 8 12 20
Maintenance of private property has increased in the neighborhood. # 1 2 10 5 1 6 % 4 8 40 20 4 24
Public spaces have been upgraded (streetscaping, etc). # 0 2 8 6 3 6 % 0 8 32 24 12 24
Traffic Zone
The building has catalyzed the development/redevelopment of other neighborhood properties. # 0 0 3 0 6 3 % 0 0 25 0 50 25
Commercial and/or residential vacancies have decreased in the neighborhood. # 0 2 3 2 3 2 % 0 17 25 17 25 17
Maintenance of private property has increased in the neighborhood. # 0 1 2 3 4 2 % 0 8 17 25 33 17
Public spaces have been upgraded (streetscaping, etc). # 0 1 1 3 7 0 % 0 8 8 25 58 0

109
Q33: Please rank ways in which living and/or working in the building has affected your own com-munity involvement.
Strongly
Disagree Disagree
Neither Agree nor Disagree Agree
Strongly Agree
All
I have volunteered more in the surrounding neighborhood. # 4 14 17 17 8 % 7 23 28 28 13
I have volunteered more, generally. # 2 12 24 15 7 % 3 20 40 25 12
I have been more civically active (i.e. worked for a greater voice in policies affecting me and/or my commu-nity).
# 1 11 13 26 9 % 2 18 22 43 15
I have worked more to benefit youth development. # 5 15 25 12 3 % 8 25 42 20 5
Northern
I have volunteered more in the surrounding neighborhood. # 2 5 6 9 1 % 9 22 26 39 4
I have volunteered more, generally. # 1 3 13 3 3 % 4 13 57 13 13
I have been more civically active (i.e. worked for a greater voice in policies affecting me and/or my commu-nity).
# 1 2 6 11 3 % 4 9 26 48 13
I have worked more to benefit youth development. # 3 5 11 4 0 % 13 22 48 17 0

110
Q33 (cont.): Please rank ways in which living and/or working in the building has affected your own community involvement.
Strongly
Disagree Disagree
Neither Agree nor Disagree Agree
Strongly Agree
Tilsner
I have volunteered more in the surrounding neighborhood. # 1 4 7 6 7 % 4 16 28 24 28
I have volunteered more, generally. # 0 6 8 8 3 % 0 24 32 32 12
I have been more civically active (i.e. worked for a greater voice in policies affecting me and/or my commu-nity).
# 0 4 5 11 5 % 0 16 20 44 20
I have worked more to benefit youth development. # 1 6 12 4 2 % 4 24 48 16 8
Traffic Zone
I have volunteered more in the surrounding neighborhood. # 1 5 4 2 0 % 8 42 33 17 0
I have volunteered more, generally. # 1 3 3 4 1 % 8 25 25 33 8
I have been more civically active (i.e. worked for a greater voice in policies affecting me and/or my commu-nity).
# 0 5 2 4 1 % 0 42 17 33 8
I have worked more to benefit youth development. # 1 4 2 4 1 % 8 33 17 33 8
Q34: Please feel free to tell us more about how the building has affected the arts community, the neighbor-hood and civic life, including opportunities for improvement. If the situation has changed over time, how and why?
Q35: Have you collaborated, shared resources, networked, or volunteered with any individuals, groups, orga-nizations or businesses within the building? Please specifically list them and briefly describe the nature of the connection. Remember, we will not publish or release any names of individuals.

111
Q36: Please name specific businesses or organizations outside of the building where you volunteer, sit on the board, or are employed.
Q37: If you wish to enter the lottery for six $50 prizes, or receive follow up information on the results of this research, please check the boxes that apply and provide contact information below.
Q38: Optional contact information for lottery and/or mailing list:

112
APPENDIX B: HEDONIC ANALYSIS To address the question of whether the Northern, Tilsner or Traffic Zone increased or stabilized the surrounding neighborhood’s property values and by how much, we applied a theoretical model, the hedonic model, in conjunction with a statistical method, Box-Cox regression, to past residential property sales in St. Paul and Minneapolis. The results allow us to estimate the developments’ con-tribution to residential property prices. Below, we briefly describe the underlying theory and our analysis. Economists view residential properties as bundles of other economic goods, goods that people think of as a property's attributes. In hedonic modeling, prices of a property's at-tributes, such as bathrooms, bedrooms and proximity to the nearest park, sum together to produce the overall price of the property. Al-though rarely directly observable, researchers can estimate the price of these attributes using a statistical process, regression analysis, if they obtain enough property sales data. The analy-sis requires information on the sale (date, price) and the property (location, number of various kinds of rooms, square footage of liv-ing area and plot, etc). The county or city as-sessor's office can provide much of the re-quired property sales data, which researchers then merge with additional neighborhood and distance-to measures. Researchers rely on regression as the central statistical method when applying hedonic modeling. Researchers use regression to measure a group of variables’ capacity to ex-plain why another single variable changes value. In other words, a regression is a mathematical way of testing which variables explain why one house is worth $100,000 and another $500,000. In a hedonic model regres-sion, the left-hand-side variable, or dependent variable, is the sale price of the residential unit at the sale date. The right-hand-side variables, or independent variables, are the attributes of
the property (including neighborhood charac-teristics) at a particular sale date. For our analysis, we used a Box-Cox regres-sion. Box-Cox regressions fit a model to data better than simple regressions. Unlike simple regressions, Box-Cox first estimates the curva-ture (or general shape) of the data. Box-Cox regressions try to (roughly) answer the ques-tion: With the Y-axis as residential unit price, and the X-axis an independent variable, does the graph y = f(x) look like y = ln(x), y = x, y = 1/x or something in-between? Again, using a simple regression we could only assume the data looked like y = ln(x), or y = x, etc, with-out actually testing to see whether the as-sumption is correct. In our Box-Cox regres-sions, we calculate two separate estimates of curvature: one estimate of the curvature of the dependent variable, and another estimate of the curvature of all the independent variables combined. One only applies the Box-Cox regression’s estimated curvature to variables that are strictly positive (no negative or zero values) – these are the transformed variables. One still includes independent variables that are not strictly positive in the regression, but they are left untransformed. Researchers must also decide which variables to include, based on several factors operating in concert. First, variables must be admissible given theoretical constraints. For instance, hedonic theory dictates that independent vari-ables be property attributes. In addition, the independent variables need to interact well with one another. Researchers exclude highly correlated (collinear) variables, even if the he-donic theory allows them, because they may cause inaccuracies in the estimated impact (coefficient) of each individual collinear vari-able. For instance, collinearity occurred when we included the distance to the St. Paul cen-tral business district and the distance to Tilsner Artists' Cooperative in the same re-gression; the geographical locations' proximity

113
to each other caused their estimated impacts to expand wildly as the computer attempted to handle the nearly identical values the two variables had for each property. Further, re-searchers only include variables that contrib-ute to the model's ability to describe the varia-tion in residential unit prices (i.e., increase goodness-of-fit or R2). Lastly, limiting the overall number of variables helps avoid collinearity issues and produces a model that captures the essential factors affecting the housing market. We applied these considera-tions in selecting variables for the Traffic Zone and Tilsner models, described below. The Traffic Zone and Tilsner Models For our analysis, we obtained housing data from the Minneapolis City and Ramsey County assessor's offices for the Traffic Zone and Tilsner, respectively. Unfortunately, due to insufficient sales data prior to 1990, we could not estimate impacts for Northern Warehouse. We gathered additional neighbor-hood metrics from the 2000 Census Summary File 3 and calculated distance-to measures with data from the Minnesota Geospatial In-formation Office and the National Center for Education Statistics.
Our initial data sets included 45,761 property sales for Minneapolis and 176,779 for Ramsey County, both spanning 1991 to 2009. Because we determined, through comparative models, that the residential property market surround-ing St. Paul’s central business district did not extend to the edges of Ramsey County, we further restricted this dataset to those proper-ties within a 3-mile radius from the Tilsner. In addition, for both datasets we eliminated property sales lower than $10,000 or greater than $1 million, for being unrepresentative of the larger area housing market.9 We also ex-cluded obvious data entry errors, property types other than residential, and residential properties with addresses unrecognized by Geographic Information Systems (GIS) soft-ware. We present summary statistics for vari-ables included in the local housing market models for the Traffic Zone and Tilsner in Tables 12 and 13, respectively, followed by definitions of variables.
9 All dollar values are in 2009 dollars

114
Table 12 Summary Statistics – Traffic Zone Model
Variable Name Num Obs Mean Std. Dev. Min Max Residential Unit Sale Price 42,707 $178,388 $100,136 $10,024 $998,362 Age at Sale 42,707 63 32 -10 188 Gross Building Area 42,707 1,289 489 364 7,857 Number of Bathrooms 42,707 1.46 0.54 0.50 7.50 Total Number of Rooms 42,707 6.30 2.23 1.00 70.00 Stories 42,707 1.42 0.45 1.00 3.50 Condominium 42,707 0.19 0.39 0.00 1.00 Commute Cost 42,707 5.86 3.46 0.26 24.59 (Dist to Minn CBD) * GBA 42,707 5,475 2,898 106 27,364 Distance to Mississippi 42,707 1.54 0.88 0.01 3.60 Distance to Nearest Other Water 42,707 1.17 0.58 0.04 2.56 Median Household Income 42,707 $22,870 $7,231 $6,502 $105,790 Percentage White in 1999 42,707 0.59 0.26 0.01 0.98 Percentage Diff House in 1995 42707 0.54 0.14 0.27 0.95 Percentage Unemployed in 1999 42,707 0.05 0.04 0.00 0.16 Pop Growth per Sq Mile '00-'04 42,707 0.04 0.18 -0.37 1.04 Post96 * (Dist to Traffic Zone) 42,707 2.79 2.24 0.00 8.02 Pre96 * (Dist to Traffic Zone) 42,707 0.97 1.94 0.00 8.01 Post96 42,707 0.76 0.43 0.00 1.00
Table 13 Summary Statistics – Tilsner Artists' Cooperative
Variable Name Num Obs Mean Std. Dev. Min Max Residential Unit Sale Price 26,707 $151,021 $91,228 $19,966 $991,941 Age at Sale 26,707 80 36 -10 157 Square Footage of Living Area 26,707 1379 571 318 7745 Number of Bathrooms 26,707 1.55 0.61 1.00 7.50 Total Number of Rooms 26,707 6.44 2.20 1.00 98.00 Stories 26,707 1.39 0.42 1.00 3.00 Commute Cost 26,707 3.06 1.45 0.12 8.63 (Dist to Paul CBD) * SFLA 26,707 3098 1521 61 20205 Distance to Mississippi 26,707 1.65 0.81 0.03 3.34 Distance to Nearest Other Water 26,707 1.85 0.62 0.45 3.49 Distance to Nearest Park* 26,707 1.19 0.57 0.01 2.49 Distance to Nearest LRT Station* 26,707 9.56 1.69 6.42 12.41 Median Household Income 26,707 $20,976 $5,410 $6,706 $37,397 Percentage White in 1999 26,707 0.57 0.19 0.06 0.96 Percentage Diff House in 1995 26,707 0.54 0.12 0.30 0.82 Percentage Unemployed in 1999 26,707 0.05 0.04 0.00 0.43 Pop Growth per Sq Mile '00-'04 26,707 0.02 0.10 -0.12 0.57 Post92 * (Dist to Tilsner) 26,707 2.03 0.84 0.00 3.00 Pre92 * (Dist to Tilsner) 26,707 0.19 0.64 0.00 3.00 Post92 26,707 0.92 0.27 0.00 1.00
* Excluded from Traffic Zone model due to collinearity issues

115
Definitions of Variables: • Residential Unit Sale Price – listed sale
price of the house or condominium. • Age at Sale – the year of sale less the year
the property was built. (Note –negative values represent purchases prior to home construction.)
• Gross Building Area (GBA) – total fin-ished area (including any interior common areas, such as stairways and hallways).
• Square Footage of Living Area (SFLA) –first and second floor finished and unfin-ished living area and finished basement area.
• Number of Bathrooms – the summed to-tal bathrooms, where a half bath is valued at .5, a three-quarter bathroom at .75, and a full bathroom at 1.
• Condominium – 1 if the property is a condominium, 0 if not
• Commute Cost – distance from the house to the tallest building in the Minneapolis or St. Paul Central Business District (Dist to Minn CBD or Dist to Paul CBD) mul-tiplied by the regular unleaded gas com-ponent of the national Consumer Price Index (CPI), as reported by the Bureau of Labor Statistics (BLS).
• (Dist to Minn CBD) * GBA; (Dist to Paul CBD) * SFLA – an interaction term used to control for the strong correlation be-tween the size of a property and the dis-tance that property is from the center of Minneapolis or St. Paul, respectively.
• Distance to Nearest Other Water – dis-tance a property is from any body of wa-ter (lake, stream or river) that is not the Mississippi.
• Median Household Income 1999 and Per-centage White, Diff House and Unem-ployed in 1999 – demographic block-group-level statistics from the 2000 Cen-sus.
• Pop Growth per Sq Mile '00-'04 – growth per square mile of the population at the block-group-level from 2000 to 2004, cal-
culated using data from the American Community Survey.
The variables involving Pre and Post 96 and 92 are essential to interpreting the Traffic Zone’s and Tilsner’s respective estimated im-pacts on local property prices. For the Traffic Zone (construction completed in 1997): • Pre96 – 1 if a property sale occurred in
1996 or prior, 0 if not. • Post96 – 1 if the sale year for a property
was in 1997 or later, 0 if not; controls for the passage of time from 1996 to 1997
• Multiplying Pre and Post96 by a prop-erty's distance from Traffic Zone pro-duces variables that measure the effects of changes in 1996 at the Traffic Zone site (within a few square blocks).
For the Tilsner (construction completed in 1993): • Pre92 – 1 if the sale year for a property
was in 1992 or earlier, 0 if not. • Post92 – 1 if the sale year for a property
was in 1993 or later, 0 if not; controls for the passage of time from 1992 to 1993.
• Multiplying Pre92 and Post92 by a prop-erty's distance from Tilsner produces vari-ables that measure the effects of changes in 1992 at the Tilsner site (within a few square blocks).
Although not presented in Table 12 or 13, we also included several additional dummy vari-ables (variables with a 1 or 0 value) in the re-gression. These variables cover the following property attributes: type of heating and exte-rior construction, the overall property condi-tion, and, for the Tilsner model, the style (tu-dor, bungalow, etc). Note, the condominium variable is included in the Tilsner model, al-though not presented in Table 13, as it is a style variable. In the following regression re-sults, the Fixed Effects line includes the dummy variables.

116
We present Box-Cox regression results for the Traffic Zone and Tilsner in Table 14 and 15, respectively. Box-Cox regression results have many components, but the coefficients asso-ciated with the untransformed and trans-formed variables are of primary importance. Unlike simple regressions, one may not di-rectly interpret Box-Cox regression coeffi-cients as dollar amounts, due to variable trans-formations. In addition, Box-Cox regressions employ the chi-squared distribution method to determine a variable's significance, rather than t or z scores, as in a simple regression. The statistics software calculates the probabil-ity that each variable is insignificantly different from zero (the null hypothesis), and puts the result in the column labeled P>chi2(df). Stat-isticians commonly use a 5% probability levels to determine significance (where P>chi2(df) has a value of .05 or less). For the Traffic Zone model, all the transformed and untrans-formed variables are significant at the 5% level, except Percentage Diff House in 1995 (Table 14). For the Tilsner model, all variables are significant at the 5% level with the excep-tions of Pop Growth per Sq Mile, Stories and Median HH income (Table 15). To determine the estimate impact of the Traf-fic Zone and Tilsner on area property values, we employed the coefficients results for the first three untransformed variables for each model. Using the model and these three vari-able coefficients, we calculated before-and-after predictions for all the homes in the dataset, whether or not they were actually sold before, during or after 1996 or 1992, respec-tively. We then geocoded the predicted values
and generated maps illustrating rings repre-senting different average estimated impacts radiating out from the Traffic Zone and Tilsner (Figures 11-12 main report). Below, we summarize the average estimated property value impacts (by dollar and percentage in-crease) categorized by proximity to the artist space (Table 16 and 17). The 1996 investment at the Traffic Zone site and surrounding few square blocks contrib-uted to an estimated 15% increase in the value of the housing stock in and around Minnea-polis, an average of $24,173 per residential unit. This represents a $589 million contribu-tion for the 22,364 homes for which we have sale data. However, the model’s estimation that the Traffic Zone’s impacts extend for nearly an eight-mile radius seems implausibly high. Consequently, we restricted our esti-mates of the Traffic Zone’s aggregate effects to a more conservative three-mile radius cut-off, which yields a $367 million contribution for the 9,101 homes for which we have sale data. Within this 3-mile radius, we estimate the 1992 investment at the Traffic Zone site and surrounding few square blocks yielded an average increase of $40,325 per residential unit (Table 16). The 1992 investment at the Tilsner site and surrounding few square blocks contributed to an estimated 11% increase in the value of the housing stock in and around St. Paul, an aver-age of $13,827 per residential unit. This rep-resents a $173 million contribution for the 12,533 homes for which we have sale data (Table 17).

117
Table 14 Box-Cox Regression Results – Traffic Zone Model Dependent Variable: Number of obs = 42,707 Residential Unit Sale Price LR chi2(38) = 40237.71 Prob > chi2 = 0 Estimates of Independent Variables Coefficients chi2(df) P>chi2(df)
Untransformed Variables (Post96) * (Dist to Traffic Zone) 15.4623** 1455.571 0 (Pre96) * (Dist to Traffic Zone) 20.13396** 1945.719 0 Post96 34.88417** 907.131 0 Condominium 10.06488** 61.213 0 Age at Sale -0.0711517** 68.349 0 Percentage White in 1999 43.8095** 1699.922 0 Percentage Diff House in 1995 -2.058349 1.028 0.311 Percentage Unemployed in 1999 -22.8797** 11.296 0.001 Pop Growth per Sq Mile '00-'04 6.171733** 22.38 0 Constant -84.65006** ------ ------ Fixed Effects ------ ------ ------
Transformed Variables Commute Cost 15.68359** 2065.301 0 (Dist to Minn CBD) * (GBA) -3.500315** 3783.448 0 Gross Building Area 10.73366** 7949.63 0 Number of Bathrooms 4.617811** 48.481 0 Total Number of Rooms 2.792067** 22.948 0 Stories -18.83526** 499.355 0 Distance to Mississippi 1.687906** 29.381 0 Distance to Other Water -3.005647** 54.547 0 Median Household Income 0.2979288** 308.618 0
Estimates of Transformation Parameters Coefficients Std. Err. P>z Theta (Dependent Variable) 0.4032709** 0.0051035 0 Lambda (Independent Variables) 0.3943051** 0.0080883 0
Tests of Restricted Models H0: Log Likelihoods chi2 Prob>chi2 theta=lambda=-1 -557231.19** 71594.36 0 theta=lambda=0 -524729.05** 6590.09 0 theta=lambda=1 -529511.87** 16155.72 0 **Significant at the 5% level

118
Table 15 Box-Cox Regression Results – Tilsner Artists' Cooperative Model Dependent Variable: Number of obs = 26,707 Residential Unit Sale Price LR chi2(47) = 12488.58 Prob > chi2 = 0 Estimates of Independent Variables Coefficients chi2(df) P>chi2(df) Untransformed Variables (Post92) * (Dist to Tilsner) 16.50482** 157.783 0 (Pre92) * (Dist to Tilsner) 18.28675** 144.025 0 Post92 8.753618** 19.419 0 Percentage White in 1999 15.18573** 263.701 0 Percentage Diff House in 1995 15.36871** 128.003 0 Percentage Unemployed in 1999 -14.82751** 23.655 0 Pop Growth per Sq Mile '00-'04 1.090111 0.616 0.433 Age at Sale -0.1366824** 744.757 0 Constant -1.1657 ------ ------ Fixed Effects ------ ------ ------
Transformed Variables Commute Cost 4.162712** 192.408 0 (Dist to Paul CBD) * (SFLA) -2.263034** 100.082 0 Square Footage of Living Area 6.608992** 460.927 0 Number of Bathrooms 3.293442** 60.089 0 Total Number of Rooms -1.063242** 5.045 0.025 Stories 2.45359 2.245 0.134 Distance to Nearest Park -1.89576** 26.812 0 Distance to Mississippi -2.684173** 37.354 0 Distance to Nearest Other Water 9.460245** 282.334 0 Distance to Nearest LRT Station -3.357974** 32.314 0 Median Household Income 0.0357898 1.129 0.288
Estimates of Transformation Parameters Coefficients Std. Err. P>z Theta (Dependent Variable) 0.3283202** 0.007207 0 Lambda (Independent Variables) 0.2914156** 0.028031 0
Tests of Restricted Models H0: Log Likelihoods chi2 Prob>chi2 theta=lambda=-1 -343384.63** 26847.64 0 theta=lambda=0 -330935.25** 1948.88 0 theta=lambda=1 -334553.04** 9184.46 0 **Significant at the 5% level

119
Table 16 Traffic Zone Estimated Property Value Effects
Miles from Traffic Zone Average Increase per
Residential Unit ($) Average Increase per Residential Unit (%)
<.33 56,345 25.7 .33-.66 49,764 27.0 .66-1 50,040 24.9 1-1.33 46,408 23.0 1.33-1.66 47,028 20.9 1.66-2 38,762 21.5 2-2.33 33,511 21.6 2.33-2.66 30,513 20.8 2.66-3 27,122 19.6 Average Increase (0-3 miles) 40,325 3-4 21,607 17.4 4-5 16,100 12.7 5-6 11,605 7.8 6-7 6,250 4.1 7+ -64 0.0 Average Increase (0-7+ miles) 24,173 15.3
Table 17 Tilsner Estimated Property Value Effects
Miles from Tilsner Average Increase per
Residential Unit ($) Average Increase per Residential Unit (%)
<.33 25,269 18.7 .33-.66 30,391 15.5 .66-1 19,883 16.5 1-1.33 17,684 15.2 1.33-1.66 16,885 13.5 1.66-2 15,201 12.3 2-2.33 13,885 10.7 2.33-2.66 12,074 9.4 2.66-3 10,608 8.1 Average Increase (0-3 miles) 13,827 10.8