how metabolic niches shape marine life
TRANSCRIPT

How metabolic nichesshape marine life
Craig R. McClain Department of Biology, Triangle Center for Evolutionary Medicine, Duke University
@DrCraigMc craigmcclain.com

Veined Octopus (Amphioctopus marginatus) eating a crab
Life requires energy

carbon
C6 12.011
Species Physiological and EcologicalResponses and Adaptations
DIVERSITY
12

1900 2000
“We observe declines in eight out of ten ocean regions… this decline will need to be considered in future studies of marine ecosystems, geochemical cycling, ocean circulation and fisheries.”
Nature. 2010 Jul 29;466(7306):591-6.Global phytoplankton decline over the past century.Boyce DG, Lewis MR, Worm B.
Productivity of the oceans may be changing

1Patterns of diversity on the ocean floor Links to food availability

324 m (1063 ft)
36.5m (120 ft)

4500m, 2.8 miles, 14 Eiffel Towers


3%
The deep ocean are energy-deprived systems

McClain, C.R., J.Nekola, L.Kuhnz, and J. Barry (2011) Local-scale faunal turnover on the deep Pacific floor. Marine Ecology Progress Series, 442:193-200
YourNana’s QuiltPatterns of invertebrate diversity
Grandmother’s Quilt: Turnover At Small Spatial Scales 1a
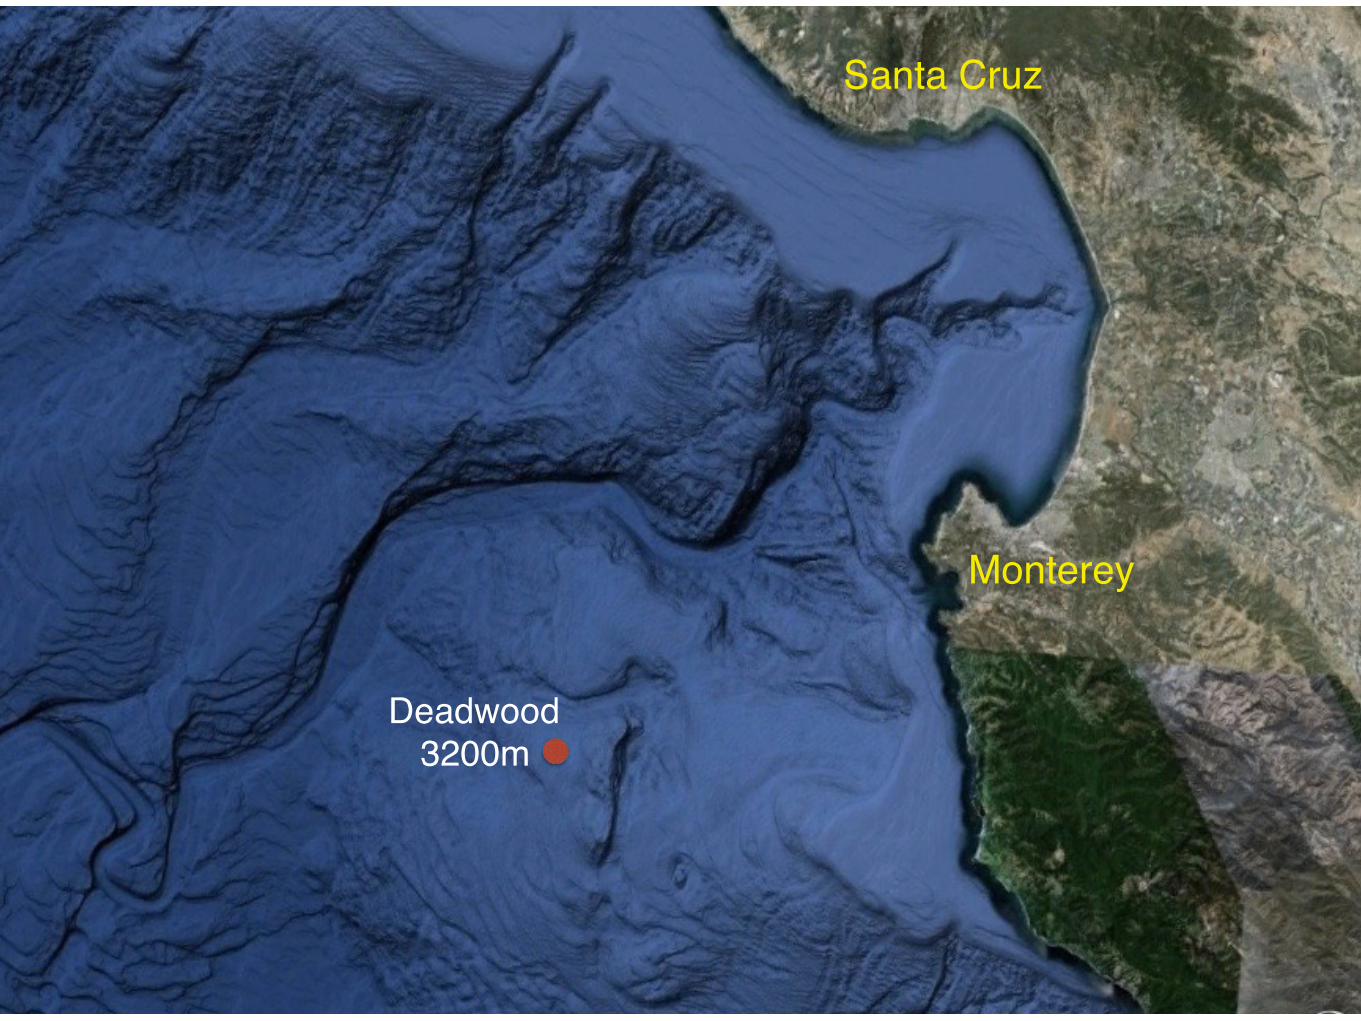
Monterey
Santa Cruz
Deadwood3200m


1 2 3 4 5 6 7 8
350 m

1
3
1
2
3
13
1
3
2
2
12
6
7
7
6
7
6
8
8
8
6
7
8
54 4
5
5
4
5
5
2D Stress: 0.24
1
1
1
1
1
8
8
8
8
8
8
1
3
1
2
3
1
3
1
3
2
2
1
26
7
7
6
7
6
8
8
8
6
7
85
4
455
4
5
5
2D Stress: 0.25
1
1
1
1
1
1
8
8
8
8
8
8
log
(x+1
)Pr
esen
ce/A
bsen
ce
Distance: Rho= 0.05, p=0.076
Distance: Rho= 0.04, p=0.081
1 2.52
3 2.94
2 2.68 6 3.22
7 2.29
8 2.34
5 1.57
4 2.75
2D Stress: 0.10
2D Stress: 0.11
1 2.52
3 2.94
2 2.68
6 3.22
7 2.29
8 2.34
5 1.57
4 2.75
Distance: Rho= 0.05, p=0.094% Carbon: Rho= 0.42, p=0.021
Distance: Rho= 0.06, p=0.078% Carbon: Rho= 0.31, p=0.036
MDS: a matrix of item–item similarities, then assigns a location to each item in N-dimensional space. Distance in plot correlates with differences in community composition
Cluster of cores
% Carbon in Sediment
Correlation and p-value for how well distance predicts relationship
Correlation and p-value for how well % Carbon predicts relationship


Station M. 4200m Pacific Abyssal PlainVideo from K. Smith and H. Ruhl

Pining for answers:Tests of energetic theory with experimental deep-sea wood falls
McClain, C.R. and J. Barry (2014) Beta-Diversity on Deep-Sea Wood Falls Reflects Gradients in Energy Availability. Biology Letters 10:20140129
McClain, C.R. et al. (2016) Multiple processes generate productivity-diversity relationships in experimental wood-fall. Ecology in press
1b

A very “poplar” question “fir” ecology: What are the processes that underly
diversity-productivity relationships?
Div
ersi
ty
Productivity


Invertebrates on wood falls are endemic and reliant on the wood as their only food source
Xylophaga

Invertebrates on wood falls are endemic and reliant on the wood as their only food source


Set 1
Set 2
November 2006-October 2011 (5 years)
November 2006-October 2013 (7 years)


−1.0 −0.5 0.0 0.5
−1.0
−0.5
0.0
0.5
NMDS1
NM
DS2
12
●
●
●
●
●
●
●
●
●
●
●
●
●
●
●
●
●
●
●
●●
●
●
●● ●
● ●●
●
●●
0.3
0.4
0.5
0.6
0.7
0.8
Species Composition Changes
Dillwynella (Ganesa) panamesis
Protanais sp. nov.

H2: Relaxed pressure for optimal body size
no. o
f spe
cies
H3: Shifts in optimal body size
no. o
f spe
cies
H5: Species-energy relationship within size classes
no. individualsno. o
f spe
cies
log10 body size classes
H1: Increased packing into optimal body size
no. o
f spe
cies
H4: Mulitmodal distributions with increased rare resources
no. o
f spe
cies
log10 body size classes
kurto
sis
varia
nce
aver
age
size
wood-fall size (energy availability)no. o
f mod
es
12
34
56
7 1
2
3
4
5
6
7
●
●
●
●
●
●●●
●
●
●
●
●●
●
●
●
●
●
●
●
●●
●
●
●
●
● ●
●
●
●
0
1
2
0.0 0.5 1.0
log1
0 Bi
omas
s
A
●
●
●
●
● ●
●
●
●
●
●
●
●
●
●
●●
●
●
●
●
●
●●
●
●●
●
●
●
●
●
1.5
2.0
2.5
3.0
0.0 0.5 1.0
log1
0 Ab
unda
nce
B
●
●
●
●
●
●
●
●
●
●
●
●
●
●
●
●●
●
●
●
●
●
●
●
●
●●
●
●
●●
●
−2.1
−1.8
−1.5
−1.2
−0.9
0.0 0.5 1.0
Mea
n Lo
g10
Body
Size
C
●
●
●
●
●
●
●
●
●
●
●
●
●●
●
●
●
●
●
●
●
●
●
●
●
●
●
●
●
●
●
●
0.6
0.8
1.0
0.0 0.5 1.0
Stan
dard
Dev
iatio
n of
Bod
y Si
ze
D
●
●
●
●
●●
●
●
●
●
●
● ●
●
●
●
●
●
●
●
●
●
●
●
●
●
●
●●
●
●●
−2
−1
0
1
0.0 0.5 1.0Log10 Woodfall Weight
Skew
ness
of B
ody
Size
sE
●
●
●
●
●
●
●
●
●
●
●
●
●
●
●
●
●
●
●●●
●●
●
●
●
●
●
●
−2.0
−1.5
−1.0
−0.5
0.0
0.5
0.0 0.5 1.0Log10 Woodfall Weight
Kurto
sis
of B
ody
Size
s
F

2No Food No Cry:
Adaptations and Energetics of
marine invertebrates

What suites of traits make species low vs. high
energy adapted?
Species have an Energetic (Metabolic) Niche
Community ecology is comparative physiology
Energetics and metabolism structure communities
energy budget and energy adaptation views
energy resources are viewed as resource allocation that can be
translated into work and mass, e.g. the metabolic theory of ecology

Animals as machines

2aEnergy Budget: the energetics of life on the seafloor from individuals to ecosystems
McClain et al. (2012)The energetics of life on the deep seafloor. Proceedings of the National Academy of Science, U.S.A. 109:15366-15371

“Metabolism provides a basis for using first principles of physics, chemistry, and biology…Metabolic theory predicts how metabolic rate, by setting the rates of resource uptake from the environment and resource allocation to survival, growth, and reproduction, controls ecological processes at all levels of organization from individuals to the biosphere.”

B=b0*Mb*e-E/kTB = basal metabolic rate b0 = intercept (changes among clades & ecologies) M = mass b = scaling coefficient (2/3 or 3/4) E = activation energy (~0.65 eV) k = Boltzmann’s constant T = Temperature (˚K)
Brody 1945

Is the scaling of metabolism with body size stable over evolutionary time?

All Skeletonized only Anthozoa Articulata
Asteroidea Bivalvia Cephalopoda Cirripedia
Crinoidea Decapoda Demospongiae Echinoidea
Gastropoda Gymnolaemata Holothuroidea Inarticulata
Ophiuroidea Ostracoda Polychaeta Polyplacophora
−3
−1
1
3
5
−3
−1
1
3
5
−3
−1
1
3
5
−3
−1
1
3
5
−3
−1
1
3
5
−6 −4 −2 0 2 −6 −4 −2 0 2 −6 −4 −2 0 2 −6 −4 −2 0 2Log10 Body mass (g AFDM)
Log1
0 R
espi
ratio
n (J
ind−
1 d−1 )
0
10
20
30
Temp

ahem…deep sea?

Body size and temperature through its control of individual metabolic rates sets the rates and sums of resource uptake from the environment
There are high and low metabolic demand deep-sea species


1
2
3
4
5
6
7
8
910
11
12
13
14
15
16
17
18
19
20
21
22
2324
26
27
28
29
30
31
32
35
5
10
15
20
1.5 2.0 2.5 3.0Log10 Abundance
Ric
hess Set
aa
12
Abundance Increases Lead to Diversity Increases on Wood falls

<aside>

Architeuthis dux Giant Squid
12m (39.37 feet) in length

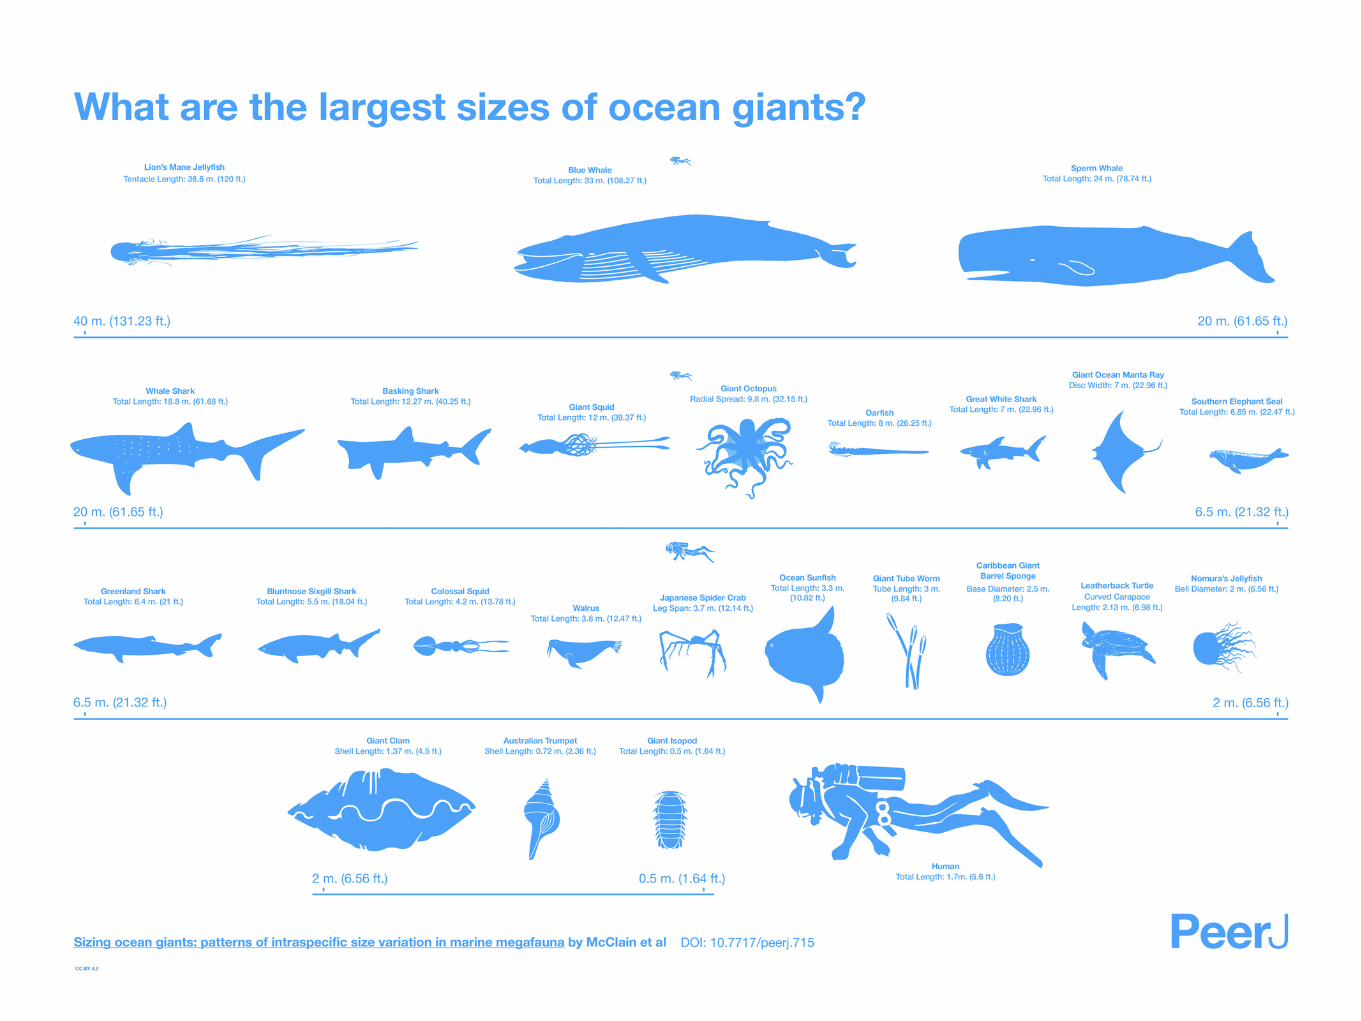


</aside>

The caloric restriction hypothesis in the wild: energy budget or adaptation?2b


-0.3
-0.2
-0.1
0
0.1
0.2
Mas
s an
d Te
mpe
ratu
re C
orre
cted
Life
span
5 5.5 6 6.5
Log Depth (m)

• The Energetic Basis of Aging: An Evolutionary Perspective Working Group (August 2015)
• Test caloric restriction hypothesis in wild populations • Brings together 15 specialists on a variety of taxa, habitats, methods,
and disciplines • Link together
• global climate and productivity data • longevity data • phylogenetic relationships • comparative and spatial analyses
• Identify new model organisms, reveal underlying genetic mechanism

Maximum Age of Marine Invertebrates vs. Ocean Primary Production
−1
0
1
2
3
6 7log(primprod)
log(A_max)
Alcyonaria
Amphipoda
Canalipalpata
Decapoda
Diptera
Euechinoidea
Heterodonta
Isopoda
Mysida
Neotaenioglossa
Oligochaeta
Ophiuroidea
Opisthobranchia
Prosobranchia
Protobranchia
Pteriomorphia
Scolecida

2c50 Shades of Food:Energy and reproductive adaptations
in marine gastropods

Planktotrophic: feed in the plankton during their larval stage and are considered to have longer dispersal potential
Lecithotrophic: larvae derive nourishment from yolk and are non-feeding and are considered to have longer dispersal potential
Direct: young develop directly into the adult form without a larval phase and typically have limited dispersal potential Low
Food
planktonic larvae cheap minimize larval/adult competition
dispersal phases allow for bet hedging
direct development expensive retention of larvae favored
High Food
% P
lank
toni
c La
rvae
McClain, C.R. et al. Proceedings of the Royal Society, B 2014

sqrt (Median Carbon Flux)
Probability o
f O
ccurrence
Mixed
Direct
Lecithotrophic
Planktotrophic
50 150 2500.0
0.5
1.0
Planktotrophic: feed in the plankton during their larval stage and are considered to have longer dispersal potential
Lecithotrophic: larvae derive nourishment from yolk and are non-feeding and are considered to have longer dispersal potential
Direct: young develop directly into the adult form without a larval phase and typically have limited dispersal potential
McClain, C.R. et al. Proceedings of the Royal Society, B 2014

Low Food High
Food
% H
erm
aphr
odite
s
density low mate availability low
density high mate availability high
Abundance
Hyselodoris bennetti
McClain, C.R. et al. Proceedings of the Royal Society, B 2014

50 150 250
0.0
0.5
1.0
sqrt (Median Carbon Flux)
Probability o
f O
ccurrence
Hermaphroditic
Non-Hermaphroditic
=
Basal metabolic rates of nudibranchs are the highest among gastropods.
Metabolically expensive to be a simultaneous hermaphrodite
McClain, C.R. et al. Proceedings of the Royal Society, B 2014

carbon
C6 12.011
Energy Budget(Response)
EnergyAdaptation
DIVERSITY

Future Research Directions
carbon
C6 12.011
Species Physiological and EcologicalResponses and Adaptations
DIVERSITY
Theoretically and conceptually link? Empirically document and test?
Theoretically and conceptually link? Empirically document and test?

1. Deep-Sea Biodiversity and Food Limitation • The role of food patchiness in driving deep-sea biodiversity • Experimental tests of productivity/diversity relationships • How energetic niches drive local scale diversity patterns
2.Metabolic controls of oceanic and global diversity gradients • How the strength of these relationships relates to the metabolic demand of the clade • How do metabolic controls impact phylogenetic, functional, and species diversity
patterns 3. Adaptations and tradeoffs in marine invertebrates in response to carbon variability
• The suite of physiological traits that makes species adapted to particular levels productivity
• Carbon availability and trophic adaptations 4. The evolution of metabolism
• Whether the relationship mass-scaling of metabolic rate has evolved through time? • What is the rate of the evolution? • Is the relationship constrained? • Whether there have been discrete transitions between alternate evolutionary optima?
Future Research Directions

Acknowledgements
• Collaborators: Jim Barry, Jeff Nekola, James Brown, Michael Rex, Andrew Allen, Derek Tittensor, Jon Payne, Josh Auld,
• Technicians: Linda Kuhnz, Patrick Whaling, Kurt Buck, Chris Lovera
• Undergraduates: Candace Leong, Mickie Ream, Taylor Gullet, Justine Jackson Ricketts, Ryan Filler
• Graduate Students: Meghan Balk
• Complete Sizing Ocean Giants Team
• Crews of the R/V Pt Lobos, R/V Western Flyer, ROV Tiburon, and ROV Ventana
National Evolutionary Synthesis Center
Monterey Bay Aquarium Research Institute