how revenue and spending impact the illinois general fund
TRANSCRIPT

Presented by:Ralph Martire, Executive Director
70 East Lake Street
Suite 1700
Chicago, IL 60601
www.ctbaonline.org
© 2015, Center for Tax and Budget Accountability
How Revenue and Spending Impact the Illinois General Fund
May 6, 2015
Wednesday, May 6, 2015
Senate Revenue Hearing
212 Capitol, Springfield, IL
May 6, 2015
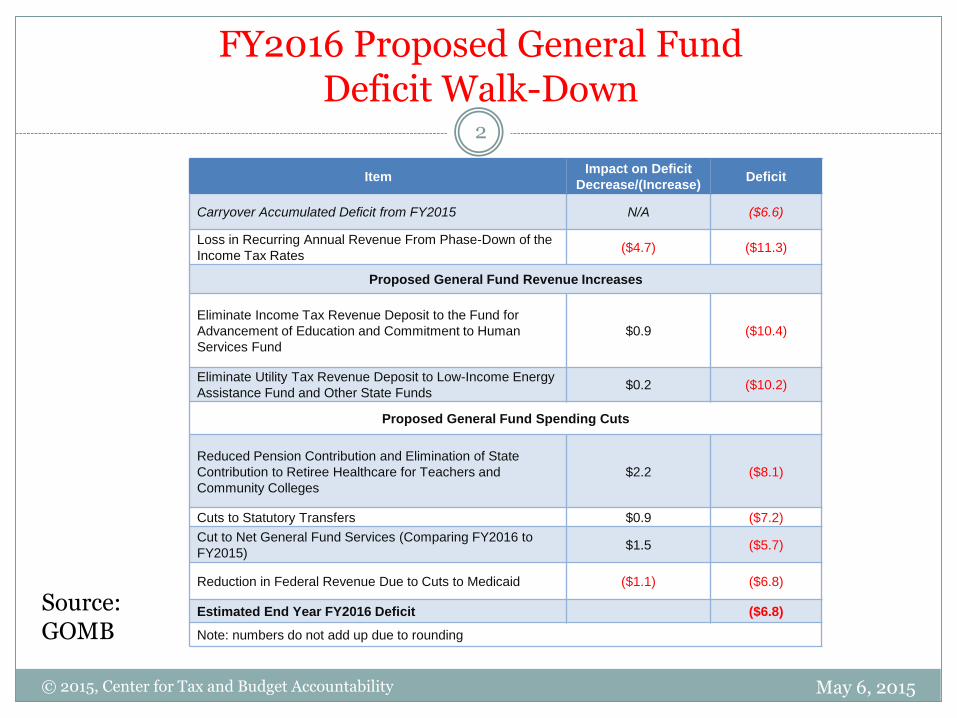
ItemImpact on Deficit
Decrease/(Increase)Deficit
Carryover Accumulated Deficit from FY2015 N/A ($6.6)
Loss in Recurring Annual Revenue From Phase-Down of the
Income Tax Rates($4.7) ($11.3)
Proposed General Fund Revenue Increases
Eliminate Income Tax Revenue Deposit to the Fund for
Advancement of Education and Commitment to Human
Services Fund
$0.9 ($10.4)
Eliminate Utility Tax Revenue Deposit to Low-Income Energy
Assistance Fund and Other State Funds$0.2 ($10.2)
Proposed General Fund Spending Cuts
Reduced Pension Contribution and Elimination of State
Contribution to Retiree Healthcare for Teachers and
Community Colleges
$2.2 ($8.1)
Cuts to Statutory Transfers $0.9 ($7.2)
Cut to Net General Fund Services (Comparing FY2016 to
FY2015)$1.5 ($5.7)
Reduction in Federal Revenue Due to Cuts to Medicaid ($1.1) ($6.8)
Estimated End Year FY2016 Deficit ($6.8)
Note: numbers do not add up due to rounding
© 2015, Center for Tax and Budget Accountability
FY2016 Proposed General Fund Deficit Walk-Down
Source: GOMB
2

FY2016 General Fund as Compared to FY2015
May 6, 2015© 2015, Center for Tax and Budget Accountability
Category FY2015
Appropriation (includes Supplementals)
FY2016 Proposed
$ Difference (Nominal)
% Difference
K-12 Education1 $6,454 $6,769 $315 4.9%
Early Education $300 $325 $25 8.4%
Higher Education $1,948 $1,593 ($355) -18.2%
Human Services $5,139 $4,743 ($396) -7.7%
Healthcare $7,303 $6,431 ($871) -11.9%
Public Safety $1,702 $1,799 $97 5.7%
Group Health $1,565 $1,195 ($370) -23.6%
Other $1,239 $1,091 ($148) -11.9%
Governor Discretionary
$90 N/A
Sub Total $25,740 $23,946 ($1,793) -7.0%
Less Unspent Appropriations
($950) ($653)
Net Appropriations $24,840 $23,293 ($1,496) -6.0%
1 Figure for FY2015 includes appropriation from the Fund for Advancement of Education.
3

How We Got Here: The Illinois General Fund
May 6, 2015© 2015, Center for Tax and Budget Accountability
Has Two Primary Elements:
(i) Hard Costs—No Discretion ( Approx. $11 B)Approx. %
of Total
Debt Service 26%
Pension Payments (Normal Cost & Debt) 56%
Statutory Transfers Out 18%
(ii)Current Service Expenditures—Discretion Varies
(Approx. $24 B)
Education (PreK, K-12, Higher-Ed) 35%
Healthcare 30%
Human Services 21%
Public Safety 5%
91%
+Group Health 5%
+Everything Else 4%
100%
4
May 6, 2015© 2015, Center for Tax and Budget Accountability
$22
$23
$24
$25
$26
$27
$28
2009 2010 2011 2012 2013 2014 2015
$ B
illio
ns
Fiscal Year
Change in Net General Fund Budgeted Appropriations for Current Services During Recovery—Post Great Recession(Nominal, non inflation-adjusted dollars)
Change in Net General Fund Budgeted Appropriations
5

That Huge Shortfall is a Concern Because……Over $9 out of $10 of G.F. are Spent on:
© 2015, Center for Tax and Budget Accountability
Education (PreK-12 plus Higher Ed) 35%
Healthcare 30%
Human Services 21%
Public Safety 5%
91%
May 6, 2015
6

Hard Costs (Appropriations/Budgeted Figures)
May 6, 2015© 2015, Center for Tax and Budget Accountability
$0.0 $0.5 $0.4 $0.4 $0.5 $0.5$1.2
$1.8 $2.2 $2.1 $2.3 $2.2 $2.2$2.1$2.1 $2.5 $2.5 $2.7 $2.7
$2.0
$2.6$3.1 $3.0 $2.9
$2.4$3.1
$1.4$1.2 $0.7 $1.0
$1.2
$1.6$0.0
$4.2
$4.1$5.1
$6.1$6.2
$6.8
0
2
4
6
8
10
12
14
$3.57 $3.79 $3.61 $3.88 $4.43 $4.79 $3.24 $8.58 $9.38 $10.19 $11.31 $10.76 $12.03
2004 2005 2006 2007 2008 2009 2010 2011 2012 2013 2014 2015 2016
Debt Service (Pension & Capital Bonds) Statutory Transfers Out PensionNotes: Legislation passed in 2005 cut the state’s pension contributions for fiscal years 2006 and 2007 In 2010 the state used Pension Obligation Bonds to pay its pension contribution In 2011, the state also used Pension Obligation Bonds. AS such, while the state budgeted for $4.2 billion in General Fund pension contributions the actual General Fund pension contribution in
2011 was $0 2015 statutory transfer is artificially low because it exclude $600 million Healthcare Provider Relief Fund transfer, which took place in 2014 instead (that $600 million IS NOT reflected in the 2014
figure) 2016 statutory transfer does NOT reflect the $650 million repayment of inter-fund borrowing that will take place in 2015
7
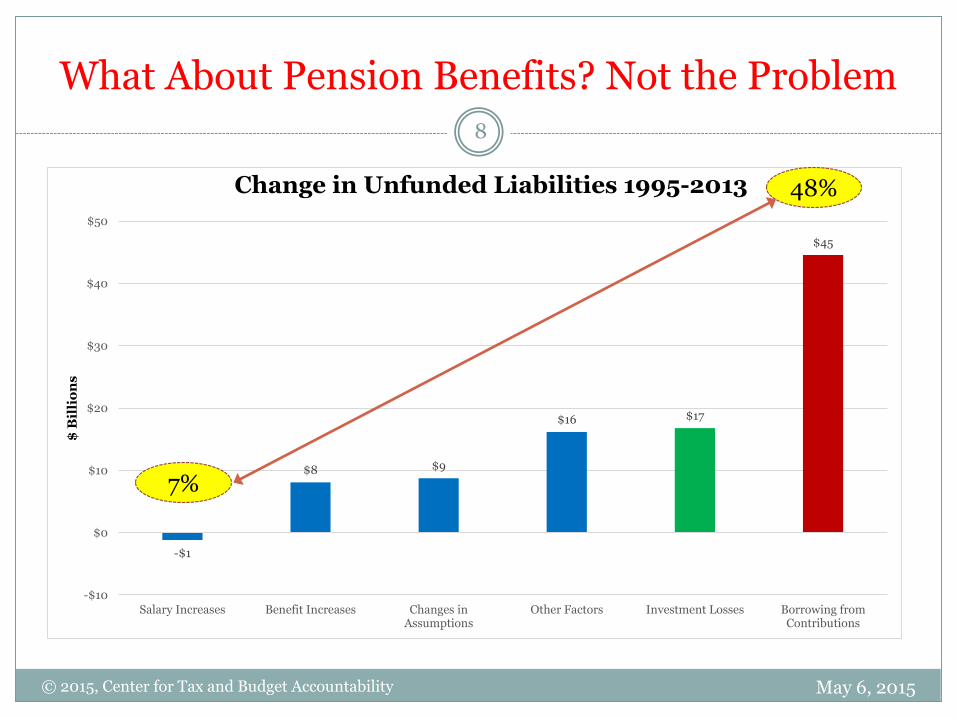
What About Pension Benefits? Not the Problem
May 6, 2015
8
© 2015, Center for Tax and Budget Accountability
-$1
$8 $9
$16 $17
$45
-$10
$0
$10
$20
$30
$40
$50
Salary Increases Benefit Increases Changes inAssumptions
Other Factors Investment Losses Borrowing fromContributions
$ B
illi
on
s
Change in Unfunded Liabilities 1995-2013 48%
7%

Impact of the Temporary Tax Increase on the Accumulated Deficit
© 2015, Center for Tax and Budget Accountability
Sources: FY2011 actual spending from GOMB, Illinois State Budget: Fiscal Year (Springfield, IL: Feb 22, 2012), CH 2-18; FY2012 actual spending from GOMB, Illinois State Budget: Fiscal
Year 2014 (Springfield, IL: March 6, 2013), CH 2-16; FY2013 actual spending from GOMB, Illinois State Budget: Fiscal Year 2015 (Springfield, IL: March 26, 20134, CH 2-16; actual revenue
for FY2011-FY2013 from COGFA, State of Illinois Budget Summary: Fiscal Year 2014 (Springfield, IL: August 1, 2013), 50; estimated FY2014 revenue from COGFA, Monthly Briefing for the
Month Ended: April 2014 (Springfield, IL: April 2014); FY2014 spending includes supplemental appropriations. FY2011 deficit calculated using carry forward deficit from FY2010 using Section
25 liabilities and deficits in “Defining a Balanced Budget” reported by the Comptroller, as of June 6, 2014
Note: deficits do not include incurred bills that are not recorded in the state’s General Fund budget
($9.7)
($17.2)
($23.7)
($31.5)
($7.2) ($7.1)($6.3) ($6.5)
($35.0)
($30.0)
($25.0)
($20.0)
($15.0)
($10.0)
($5.0)
$0.0
2011 2012 2013 2014
Without Temporary Tax Increase With Temporary Tax Increase
And it’s About to Get Worse
May 6, 2015
9

Temporary Tax Increases Phase Down:Illinois' Fiscal Cliff
May 6, 2015© 2015, Center for Tax and Budget Accountability
$36.7
$34.1
$32.1
$32.8
$29
$30
$31
$32
$33
$34
$35
$36
$37
$38
2014 2015 2016 2017
$ B
illio
ns
Fiscal Year
Revenue
Source: GOMB, 2014 Three Year Projection (Springfield, IL: January 1, 2014).
10

Impact on People
May 6, 2015© 2015, Center for Tax and Budget Accountability
Net Illinois Income
Group
Total Difference
between 3.75% and
5% for Income
Bracket
% of Tax
BenefitAverage Cut
Average Net
Illinois Income
Average
Adjusted Gross
Income
% of Tax Filers
$0-$25,000 ($301,052,960) 8.1% ($106.89) $8,550.90 $18,964.43 50.4%
$25,001-$35,000 ($189,646,232) 5.1% ($372.32) $29,785.39 $39,082.14 9.1%
$35,001-$50,000 ($300,654,609) 8.1% ($526.45) $42,115.75 $51,775.10 10.2%
$50,001-$75,000 ($492,169,307) 13.2% ($768.78) $61,502.31 $71,740.42 11.5%
$75,001-$100,000 ($418,908,679) 11.2% ($1,080.17) $86,413.26 $97,258.15 6.9%
$100,001-$200,000 ($809,279,182) 21.7% ($1,677.04) $134,162.76 $146,324.98 8.6%
$200,001-$1,000,000 ($717,656,313) 19.2% ($4,371.34) $349,706.85 $365,598.00 2.9%
$1,000,001 or Greater ($503,206,395) 13.5% ($36,797.54) $2,943,802.83 $2,976,255.53 0.2%
Total ($3,732,573,676) 100.0% ($668.28) $53,462.03 $64,072.49 100.0%
Share of Tax Cut by Net Illinois Income—Illinois Residents Only
Source: CTBA analysis of the Illinois Department of Revenue’s Personal
Income Tax data for tax year 2011. Numbers do not add up due to rounding.
13%
54% Top 11%
Bottom 60%
11

Illinois State & Local Taxes Paid as a Share of Family Income for Non-Elderly Taxpayers
12
© 2015, Center for Tax and Budget Accountability
13.80%
12.10%
10.90%10.30%
9.00%
7.60%
4.90%
0%
2%
4%
6%
8%
10%
12%
14%
16%
Lowest 20% Second 20% Middle 20% Fourth 20% Next 15% Next 4% Top 1%
Total Tax Burden as a Percentage of Income
(Less than ($18,000- ($36,000- ($57,000- ($93,000- ($182,000- ($445,000 $18,000) $36,000) $57,000) $93,000) $182,000) $445,000) or more)
Source: Institute on Taxation and Economic Policy, Who Pays? A Distributional Analysis of Tax Systems in All 50 States, p 52, Fourth Edition January 2013. Includes
all State Sales, Excise, Property, and Income Taxes.
May 6, 2015

Source: Economic Policy Institute's website: http://stateofworkingamerica.org/who-gains/ Data used is from Piketty and Saez, "Income Inequality in the United States, 1913-1998", Quarterly Journal of Economics, 118(1), 2003, 1-39 (Tables and Figures Updated to 2011 in Excel format, January 2013), http://elsa.berkeley.edu/~saez/ .
Change in Average US IncomeGrowth Over Time
Income Group 1979 — 2011
Top 10% 139.8%
Bottom 90% -39.8%
Change in Average US IncomeGrowth Over Time
Income Group 1947— 1979
Top 10% 34.1%
Bottom 90% 65.9%
© 2015, Center for Tax and Budget Accountability
13
May 6, 2015
The Long-Term Trends in Income Distribution in America

FY2015 General Fund AppropriationsRelative to FY2000, in Nominal Dollars and
Adjusted for Inflation and Population Growth (excluding Group Health)
© 2015, Center for Tax and Budget Accountability
Sources: House Bills 6093, 6094, 6095, 6096, and 6097 of the 98th General Assembly for FY2015 appropriations. Appropriations for FY2000 from Illinois Economic
and Fiscal Commission, FY2002 Budget Summary (Springfield, IL: September 2001) and Illinois Economic and Fiscal Commission, Fiscal Year 2001 Report on the
Liabilities of the State Employees' Group Insurance Program (Springfield, IL: March 2000), 2. FY2000 appropriations adjusted using ECI, Midwest Medical Care CPI
(for Healthcare), Midwest CPI from the BLS as of July 2014, and historic year-to-year population growth from the Census Bureau as of Jan. 2014.
19.1%
-23.7%
-28.0%
-40%
-30%
-20%
-10%
0%
10%
20%
30%
State Spending Change (Nominal) State Spending Change (CPI and Population Growth) State Spending Change (ECI and Population Growth)
May 6, 2015
14

FY2015 General Fund Service Appropriations Relative to FY2000, in Nominal Dollars and Adjusted for Inflation and Population Growth (excluding Group Health)
© 2015, Center for Tax and Budget Accountability
CategoryFY2000
(Nominal)FY2015
FY2000
(Adj. for
Inflation and
Pop)
$
Difference
%
Difference
Healthcare (including
Medicaid)$5.04 $7.45 $9.54 ($2.09) -21.9%
PreK-12 Education* $4.84 $6.60 $7.61 ($1.01) -13.3%
Higher Education $2.15 $1.99 $3.38 ($1.39) -41.1%
Human Services $4.66 $4.81 $7.32 ($2.51) -34.3%
Public Safety $1.39 $1.62 $2.18 ($0.56) -25.7%
Other $1.64 $1.21 $2.57 ($1.36) -52.9%
Total Spending
(Gross)$19.72 $23.68 $32.60 ($8.92) -27.4%
• FY2015 appropriation for K-12 Education excludes $200 million from the Fund for Advancement of Education that is appropriated for General State Aid. The
Illinois State Board of Education includes that $200 million in its FY2015 General Fund budget report.
15
May 6, 2015

Compared to the Rest of the Nation, Illinois is a Very Low Spending and Small Government State
Consider that:
In calendar year 2012, Illinois had the fifth largest population (Census Data), fifth highest overall state Gross Domestic Product (GDP) (BEA Data), and 12th highest state GDP per capita in the nation.
Despite that, in FY2012 Illinois ranked 28th in General Fund spending on services per capita, and 36th in General Fund spending on services as a share of GDP.
In 2011, (the most recent year for which there is data) Illinois ranked 49th, next to last among all 50 states, in number of state workers per 1,000 residents.
© 2015, Center for Tax and Budget Accountability
*Data for preceding analysis comes from U.S. Census, U.S. Bureau of Economic Analysis, National Association of State Budget Officers, and the final, enacted General Fund Budgets of all 50 states.
May 6, 2015
16

Now: The Economic Context
© 2015, Center for Tax and Budget Accountability
In 2013, Illinois ranked fifth nationally with a Gross State Product in excess of $720 billion (BEA).
That would be the 20th largest economy of any nation in the world-greater than Egypt, Colombia, Belgium, Sweden, Greece, Ireland, Portugal, Norway and Nigeria, to name a few.
May 6, 2015
17

But………Illinois Economic Growth Lags U.S. Long Term (1997-2013)
© 2015, Center for Tax and Budget Accountability
Source: BEA
May 6, 2015
18
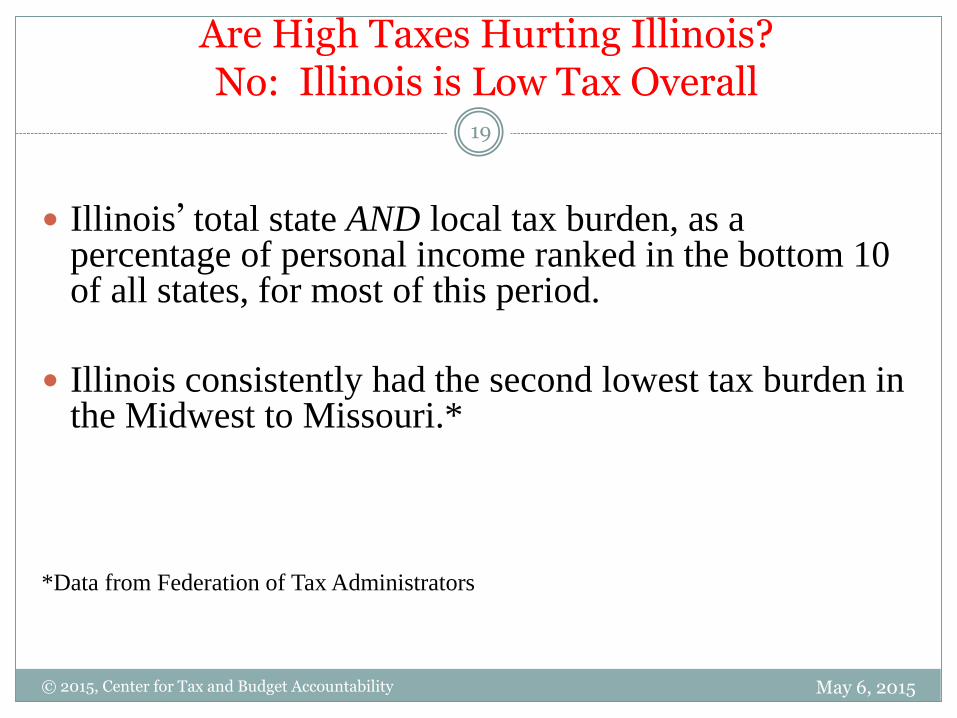
Are High Taxes Hurting Illinois?No: Illinois is Low Tax Overall
© 2015, Center for Tax and Budget Accountability
Illinois’ total state AND local tax burden, as a percentage of personal income ranked in the bottom 10 of all states, for most of this period.
Illinois consistently had the second lowest tax burden in the Midwest to Missouri.*
*Data from Federation of Tax Administrators
May 6, 2015
19

Illinois is Low Tax Overall
© 2015, Center for Tax and Budget Accountability
Midwest States % National Rank
Iowa 17.0% 10th
Michigan 16.9% 12th
Wisconsin 16.6% 16th
Indiana 16.6% 17th
Ohio 16.1% 26th
Illinois 14.2% 42nd
Missouri 13.5% 47th
Source: Federation of Tax Administrators. Includes all state and local taxes and fees.
Total State and Local Tax Burden
as a Percentage of Income in 2010
May 6, 2015
20

21
© 2015, Center for Tax and Budget Accountability
Illinois had the second lowest real GDP Growth in the entire Midwest in 2010
Real GDP Growth 2010
Indiana 4.6%
Iowa 3.1%
Michigan 2.9%
Wisconsin 2.5%
Ohio 2.1%
Illinois 1.9%
Missouri 1.4%
National and Midwest Average was 2.6%
But Despite Being Low Tax. . . . .
May 6, 2015

Total State and Local Tax Burden as a Percentage of Income in 2012, with Temporary Tax Increase
© 2015, Center for Tax and Budget Accountability
Midwest States % National Rank
Iowa 17.0% 10th
Michigan 16.9% 12th
Wisconsin 16.6% 16th
Indiana 16.6% 17th
Ohio 16.1% 26th
Illinois 15.6% 27th
Missouri 13.5% 47th
Source: Federation of Tax Administrators. Includes all state and local taxes and fees; and CTBA calculation.
May 6, 2015
22

Is State Corporate Income Tax Policy Killing the Economy?
© 2015, Center for Tax and Budget Accountability
Illinois: 7% until 2015, then 5.25%
Midwest Other Big States
Iowa: 6% – 12% (12% @ $250,000) Pennsylvania: 9.99%
Indiana: 8.5% New Jersey: 9%
Wisconsin: 7.9% California: 8.84%
Missouri: 6.25% New York: 7.1%
Kentucky: 4% - 6% (6% @ $100,000) Florida: 5.5%
Michigan: 4.9%
May 6, 2015
23

Indeed—State Corporate Income Taxes Overall are Insignificant
© 2015, Center for Tax and Budget Accountability
1998 2003 2007 2008 2009 2010
Total state corporate income taxes
paid nationwide* $31,089 $28,384 $52,915 $49,860 $39,278 $38,006
Net Income (before payment of
income taxes) of corporations
nationwide**$1,091,150 $1,175,609 $2,252,874 $1,806,890 $1,614,867 $1,836,377
Effective Total State Income Tax
Rate***2.85% 2.41% 2.35% 2.76% 2.43% 2.07%
*Annual Survey of State Government Tax Collections—U.S. Census Bureau
**SOI Tax Stats—Returns of Active Corporations – Table 1 – IRS
***Simple math—line 1 divided by line 2
Corporate Tax Liability Nationally ($ Millions)
May 6, 2015
24

Very Few Businesses Pay Any State Corporate Income Tax
© 2015, Center for Tax and Budget Accountability
Liability Range Total Filers Percent of Filers
$0 76,868 69.52%
$0 — $5,000 25,604 23.15%
$5,000 — $10,000 2,517 2.28%
$10,000 — $50,000 3,106 2.81%
$50,000 — $100,000 796 0.72%
$100,000 — $500,000 1,143 1.03%
$500,000 — $1 M 234 0.21%
$1 M or More 309 0.28%
Totals 110,577 100.00%
Corporations with any
tax liability 33,709 30.48%
Source: CTBA analysis of data provided by the Illinois Department of Revenue (May 2013).
Illinois Corporate Income Tax Liability
Tax Year 2010
92.67%, combined
May 6, 2015
25

Meanwhile, Corporate Profits Are at an All Time High
© 2015, Center for Tax and Budget Accountability May 6, 2015
26

Dollar Shortfall in State Per-Pupil K-12 Education Funding to Meet EFAB Adequate Education Standard by Fiscal Year
© 2015, Center for Tax and Budget Accountability
$0
-$120
-$1,270 -$1,269
-$2,553
-$2,747
-$2,946
-$3,500
-$3,000
-$2,500
-$2,000
-$1,500
-$1,000
-$500
$0
2002 2003 2004 2005 2006 2007 2008 2009 2010 2011 2012 2013 2014 2015 2016
Sources: CTBA analysis of January 2013 EFAB data. Education Funding Advisory Board, Illinois Education Funding Recommendations, (Springfield, IL: January,
2013), p. 9. Appropriations adjusted using ECI and Midwest Medical Care CPI (for Healthcare) from the BLS as of January 2013, and population growth from the
Census Bureau as of January 2013.
May 6, 2015
27

Local and State Share of Education Funding Spending
© 2015, Center for Tax and Budget Accountability
Source: CTBA analysis of U.S. Department of Education, National Center on Education Statistics, 2015. “Revenues and Expenditures for Public Elementary and Secondary Education: School Year 2011-2012 (Fiscal Year 2012).”
May 6, 2015
62.9%
28.3%
44.6% 45.2%
0%
10%
20%
30%
40%
50%
60%
70%
Local % Share State % Share
Illinois US Average
28

Illinois Total Property Tax Revenue Growth vs. State Median Income Growth
May 6, 2015© 2015, Center for Tax and Budget Accountability
49.76%
6.33%2.71%
-0.96%
-10%
0%
10%
20%
30%
40%
50%
60%
1990-2005 2005-2013
Total Property TaxRevenue Growth
State Median IncomeGrowth
All data inflation
adjusted to 2013 using
CPI-U-RS
Income Data: US
Department of Census,
Current Population
Survey
Property Tax Data:
Illinois Department of
Revenue
29

Unemployment Highest Among Least Educated, 2012
© 2015, Center for Tax and Budget Accountability May 6, 2015
Source: The State of Working Illinois 2013
18.0%
11.4%11.8%
6.5%
4.7%
17.6%
9.9%
8.8%
5.4%
3.5%
17.4%
10.4%
8.8%
6.2%
4.1%
0.0%
2.0%
4.0%
6.0%
8.0%
10.0%
12.0%
14.0%
16.0%
18.0%
20.0%
LTHS HS Some College Associate's Bachelor's +
Illinois Midwest National
30

Wages for Minorities Lag Whites
© 2015, Center for Tax and Budget Accountability
Median hourly wages for Whites increased modestly between 1980 and 2014, but :
The White-Hispanic wage gap is larger in amount, growing from $4.36 per hour in 1980 to $5.98 in 2014, an increase of 37% over 1980
Median wages for African-Americans declined, in real terms. The hourly wage gap between Whites and African-Americans grew from $1.74 in 1980 to $5.18 in 2014, an increase of 197% over 1980
May 6, 2015
31

Going Forward: Illinois Still Has a Structural Deficit
May 6, 2015© 2015, Center for Tax and Budget Accountability
$30,000
$35,000
$40,000
$45,000
$50,000
$55,000
$60,000
201
4
201
5
201
6
201
7
201
8
201
9
202
0
202
1
202
2
202
3
202
4
202
5$
Mill
ion
s
Fiscal Year
Appropriations (Prior Pension Law) Appropriations (New Pension Law)
Revenue (Tax Increases Kept) Revenue (Tax Increases Expire)
32

Sale of Goods and Services as a Percent of Gross Domestic Product: Illinois (SIC 1965-1985, NAICS: 1997-2012)
© 2015, Center for Tax and Budget Accountability
Source: Bureau of Economic Analysis
51.35%53.35% 54.23%
57.44%
63.35%64.70%
66.59%
70.74% 71.90% 72.95% 72.49%
40.53%
36.74%35.29%
32.54%
26.78%25.42% 23.71%
19.93% 18.54%16.46%
17.47%
0.00%
10.00%
20.00%
30.00%
40.00%
50.00%
60.00%
70.00%
80.00%
1965 1970 1975 1980 1985 1990 1995 2000 2005 2010 2012
Services as a percent of State GDP Goods as a percent of State GDP
May 6, 2015
33

Number of Service Industries Taxed under General Sales Tax
May 6, 2015© 2015, Center for Tax and Budget Accountability
Source: Analysis of Federation of Tax Administrators, Survey of Services Taxation (Washington, DC: July 2008), http://www.taxadmin.org/fta/pub/services/btn/0708.html
34

Comparison of Illinois and Wisconsin State Level Sales Tax Revenue, Adjusted for Inflation
Sources: COGFA, Illinois Revenue Volatility Study: Public Act 98 – 0682, (Springfield, IL: December 31, 2014), 13; Wisconsin data from the U. S. Census State Government Tax Collections, https://www.census.gov/govs/statetax/index.html
May 6, 2015© 2015, Center for Tax and Budget Accountability
35

Example of Tax Pyramiding Effect, Using a 5% Rate
• In a properly designed sales tax system, only the final stage of this one, integrated transaction, the sale to
the ultimate consumer, highlighted in red, would be taxed.
May 6, 2015© 2015, Center for Tax and Budget Accountability
36

Additional Sales Tax Revenue
May 6, 2015
$ in Millions COGFA FY2011 Estimate
FY2016 Estimates (adjusted for inflation)
General Fund Revenue
All Services $8,451.2 $9,384.9 $8,964.2
All Services (Excluding Professional)
$4,539.0 $5,040.5 $4,814.5
Services Excluding Business to Business
$4,002.6 $4,444.8 $4,245.5
Services ExcludingBusiness to Business and Professional
$1,949.9 $2,165.3 $2,068.3
IDOR Estimate $1,700.0
© 2015, Center for Tax and Budget Accountability
Source: COGFA; CTBA analysis of COGFA figures
37

Examples of Potential Revenue from Tax Expenditures
May 6, 2015
Expenditure($ in Millions)
Tax Impacted
Revenue Estimate
Year ofRevenue Estimate
FY2016 Estimate(@ 7%)
FY2016 Estimate
(@ 5.25%)
Repeal the Non-combination Rule
Corporate $25.0 2013 $26.5 $19.9
Decouple from the Federal Domestic Activities Production Deduction
Corporate $139.0 2014 $67.0 $50.3
Repeal CMS-SBOR SpecialTax Break
Corporate $93.0 $93.0 $69.8
Decouple from Federal Accelerated Depreciation
Corporate $333.0 $333.0 $249.8
TOTAL $519.5 $389.6
© 2015, Center for Tax and Budget Accountability
Sources: Good Jobs First
38

Increasing Taxes the Right Way Won’t Hurt the Economy
© 2015, Center for Tax and Budget Accountability
2002-2011 Comparison:9 States with Highest Graduated Income Tax Rate vs. 9 States with No Income Tax
Source: Institute on Taxation and Economic Policy, States with “High Rate” Taxes are Still Outperforming No-Tax States (Washington, DC: February 2013). Figures 2,3 & 4
6.1%
-4.2%
8.2%
6.0%
-4.5%
5.2%
-6%
-4%
-2%
0%
2%
4%
6%
8%
10%
Average Unemployment Rate Change in Real MedianHousehold Income
Growth in Per Capita RealGSP
High Rate Personal Income Tax Rate States No-Personal Income Tax States
May 6, 2015
39

And Has the Potential to Help ItThe Multiplier Effect
May 6, 2015
Government ActionMultiplier Effect on
Illinois Economy
(i) Tax Cut: • Across the board tax cut (temporary)• Cut In Corporate Income Tax Rate• Accelerated Depreciation
0.980.320.29
(ii) Spending Increases: • General (for spending on items such
as education, public safety, health and human services)
• Infrastructure
1.34
1.44
© 2015, Center for Tax and Budget Accountability
Source: Testimony of Mark Zandi before the Joint Economic Committee, "Bolstering the Economy: Helping American Families by Reauthorizing the Payroll Tax Cut and UI Benefits", 2012
40

Indeed, Even the National Economy can Take Off Post a Tax Increase
© 2015, Center for Tax and Budget Accountability
Henry Blodget, Bombshell: New Study Destroys Theory That Tax Cuts Spur Growth, September 21, 2012 http://www.businessinsider.com/study-tax-cuts-dont-lead-to-growth-2012-9
Economic Growth Rates Following Periods of Tax Increases and Tax Cuts
May 6, 2015
41

For More Information
Ralph M. Martire
Executive Director
(312) 332-1049
© 2015, Center for Tax and Budget Accountability
Website: www.ctbaonline.org
May 6, 2015
42