“how shall we grow?” - lake county, florida · “how shall we grow? ... pedestrian scale,...
TRANSCRIPT

myregion.org
“How Shall We Grow?”
Update for:the Lake County
Board of County CommissionersJune 13, 2006
Phil Laurien, Executive Director, ECFRPC

myregion.org- How Shall We Grow?
Looking forward, we know the region will grow.
4 million newcomers will be here by 2050
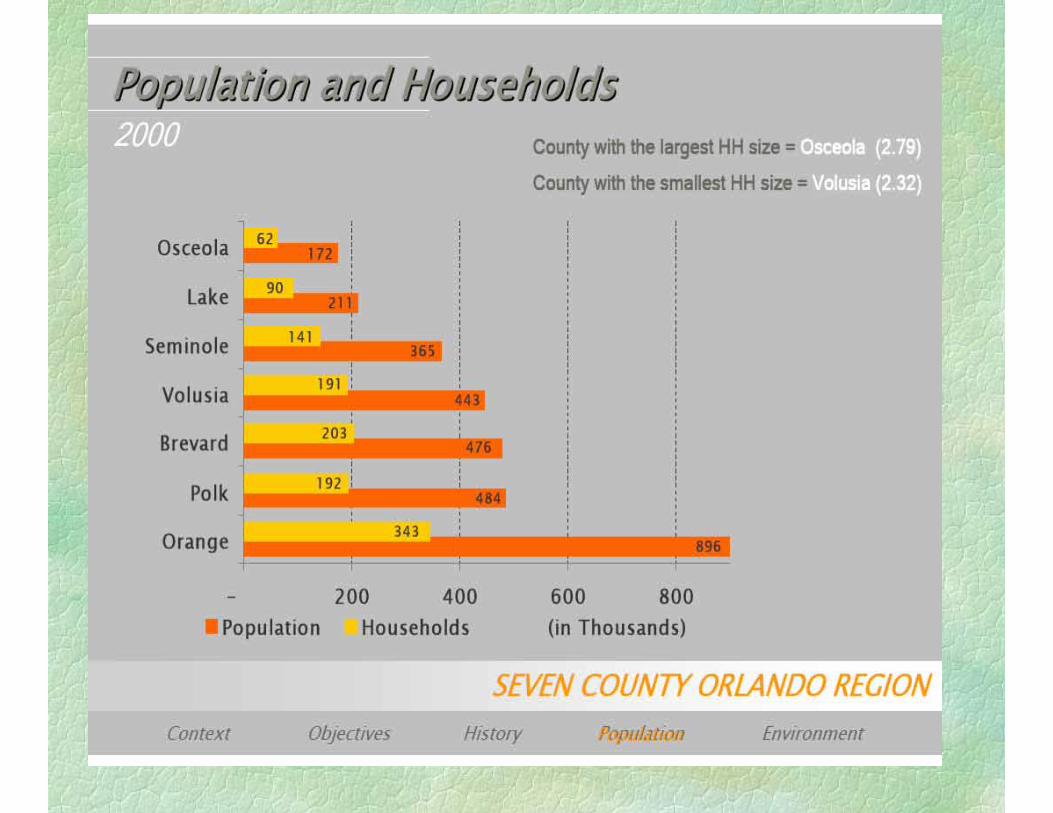
2000 population: 3.05 million for 7 counties
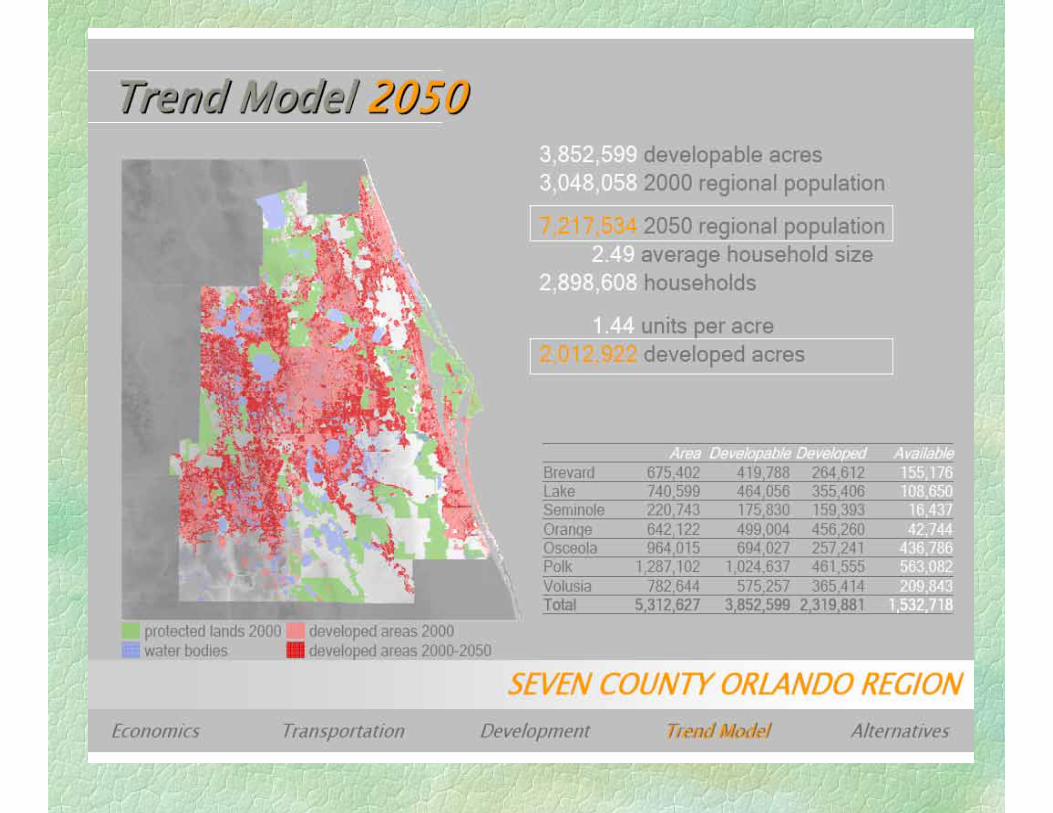
2050 projected population:7.2 million
We have choices as to how we grow

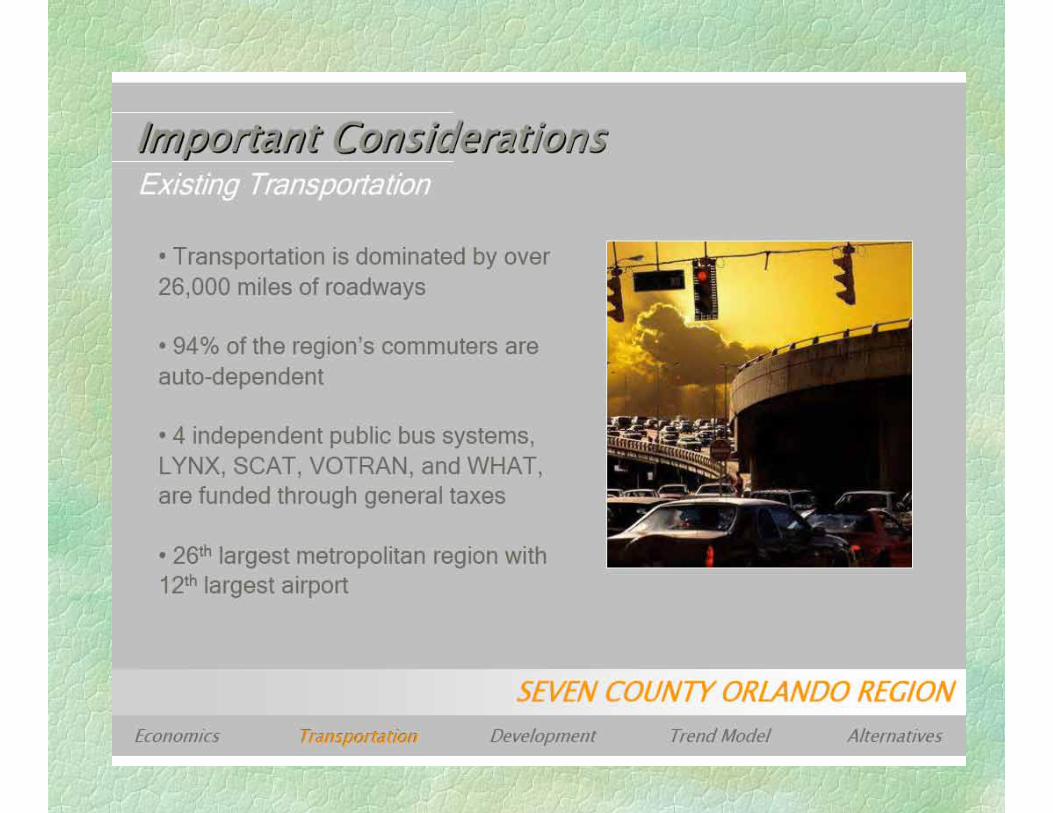

Most expensive commuter cities in USA(Orlando Sentinel June 12, 2006)
1. Atlanta- $5,770*2. Birmingham Ala. 3. Orlando, FL $5,400* 4. Jacksonville, FL5. Pensacola, FL
*for 2 persons, 2 cars, for mileage commuted, time spent in traffic and fuel cost


myregion.org- How Shall We Grow?Choice #1: Do nothing; just continue existing development patterns
GLE
NSI
DE
LAN
E
E DRIV
ESLATE RUN DRIVE
HEATHER LANESPICEWOOD LANE
GREEN RIDGE LANE
HIGHMEADOWS C
IRCLE
BUTTERFIELD LANE
INTE
RMEA
DOW
S W
AY
FOX RIDGE CIRCLE
STO
NEY
RID
GE
COU
RT
RA
VIN
E RI
DG
E D
RIV
E
NORTHVIEW DRIVE
WEST POWELL ROAD
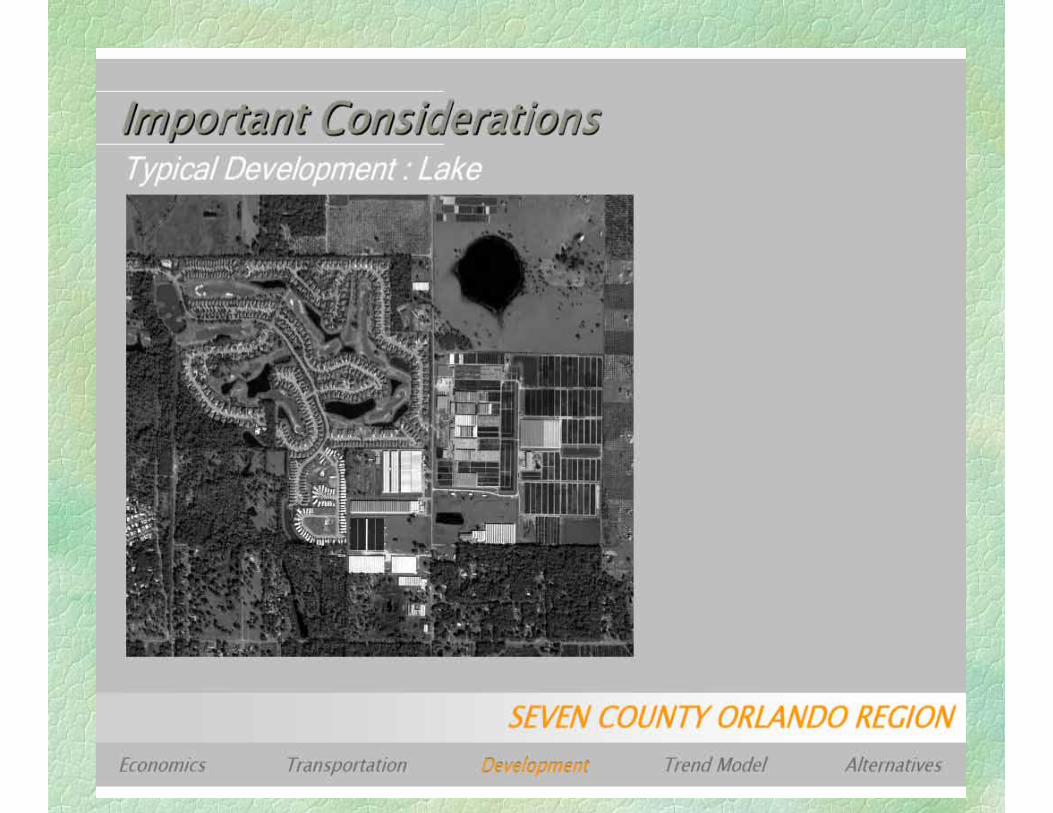
Post World War II- Low density suburban sprawl with curvilinear, unconnected streets become the norm for auto oriented development. Open spaces are forgotten, sidewalks and streets are abandoned. Separation of uses by zoning results in every human need resulting in an auto trip , which causes traffic congestion.

myregion.org- How Shall We Grow?
If we continue existing development patterns:
Pro: We know how that looks and works.
Con: We know how that looks and works

Con: The 2005 Penn Design study found that current low density development patterns are land consumptive.
In 1993 there was an average gross residential density of 1.56 dwelling units per acre in the 7 county region.
By 2000, average residential density had dropped to .99 units per acre, which is a 33% increase in the amount of land needed to house the same population.
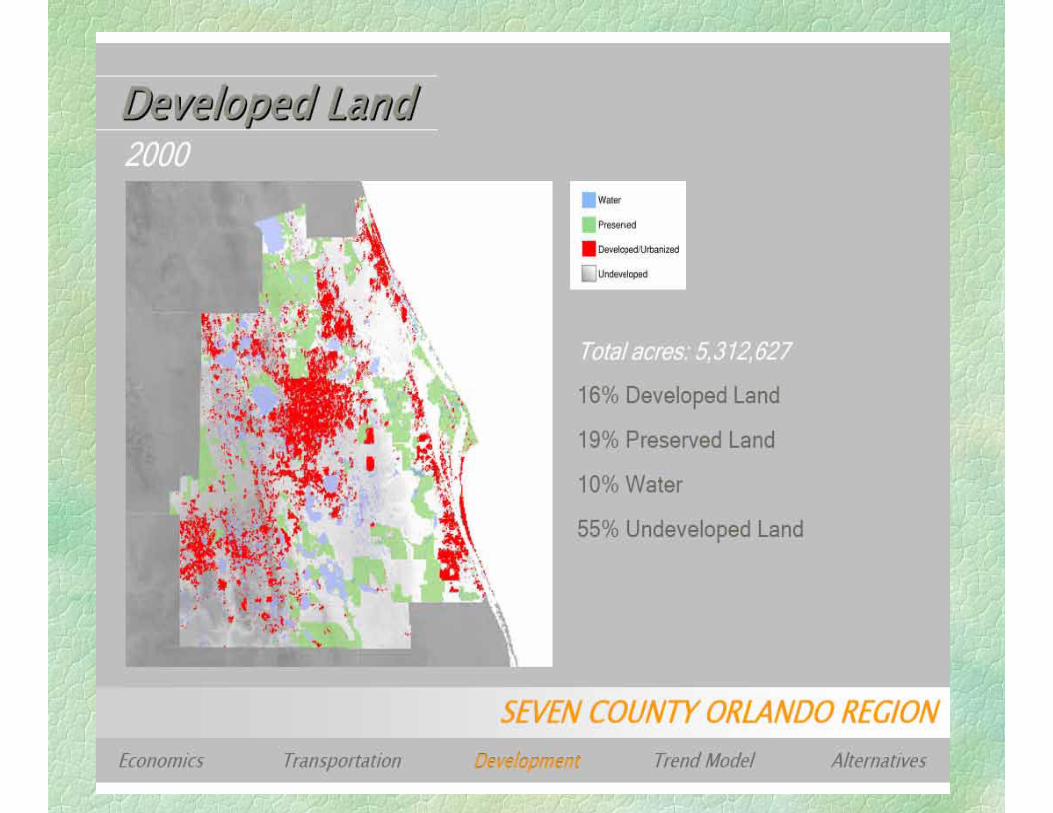
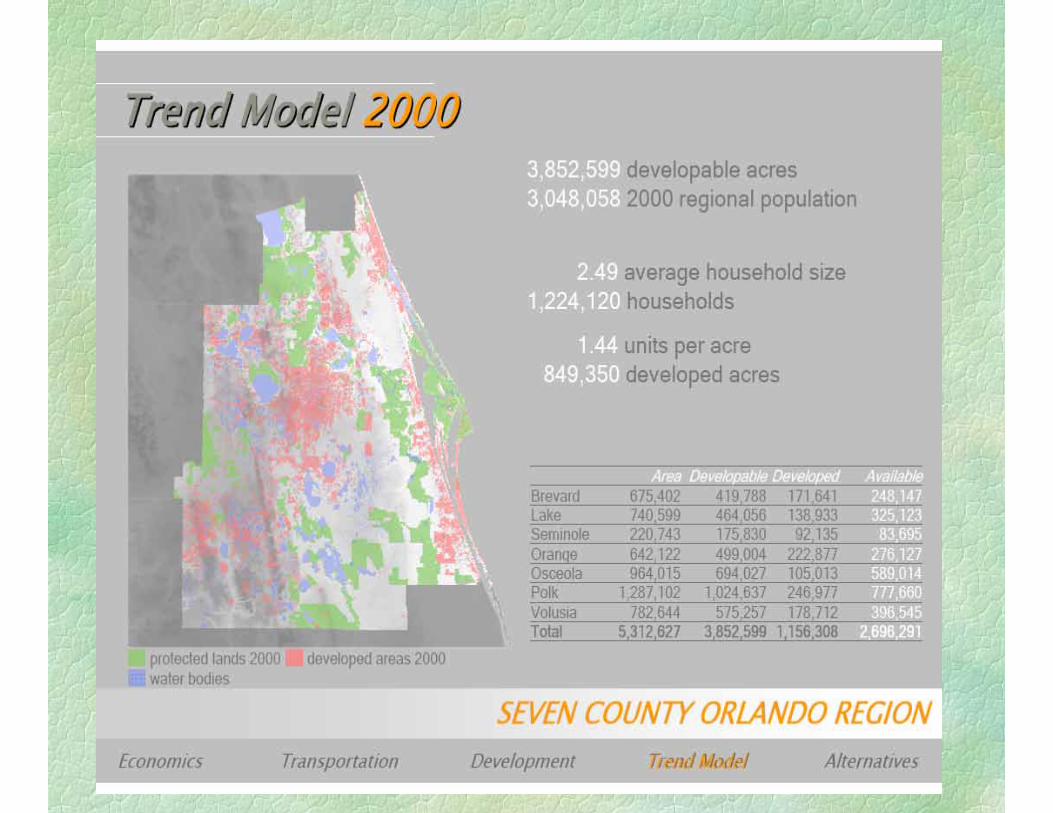
In 2000 there was a total of 849,350 acres of developed land
1.16 million acres of additional developed land will be needed by 2050 to accommodate 4.15 million new residents under current development patterns.

Low density development patterns are expensive to service.
The Penn Design study estimated it cost $90,000 per acre to provide roads, utilities and other services to newly developed land with current development patterns.
Developing the 1.16 million acres of new land by 2050 would cost $104 billion.
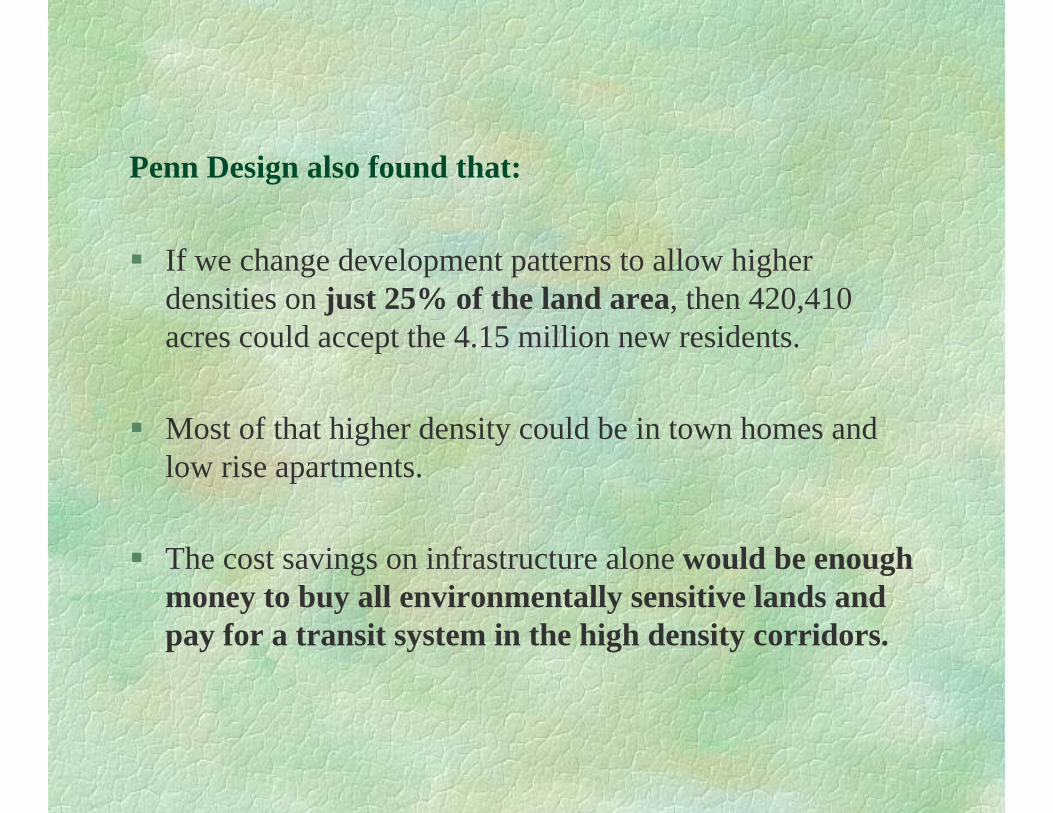
Penn Design also found that:
If we change development patterns to allow higher densities on just 25% of the land area, then 420,410 acres could accept the 4.15 million new residents.
Most of that higher density could be in town homes and low rise apartments.
The cost savings on infrastructure alone would be enough money to buy all environmentally sensitive lands and pay for a transit system in the high density corridors.

If we continue existing patterns, it is a matter of local choice how we grow, but there are regional consequences:
Traffic. Low density development is a traffic generator, causing 10 new trips for each new home per day. Our roads become congested, and ultimately result in gridlock.
Alternative, mixed use development can generate as little as 4 trips per home per day. 60% less traffic!

myregion.org- How Shall We Grow?
Choice #2- Consider alternative development patterns
Which ones?Where?Who gets to choose?

myregion.org- How Shall We Grow?
The Transect (by A. Duany) is a gradient of development types.Preserve Edge General Center Core Downtown
Source: Andres Duany @ dpz.com

Indicators of development patterns
Most land Consumptive Less land consumptive Least land ConsumptiveFarms Rural residential Suburban Urban-low Urban-mid DowntownConservation Single family homes Single family homes Mixed use Mixed use Mixed Use25+ acre parcels 2-10 acre lots 1-3 units/ac. 4-6 units/ac 7-10 units/ac 10+ units/ac
Wildlife 100’ + setbacks 30’-50’ setbacks 15’ setbacks 0’ setback 0’ setbackWetlands Large estates Detached homes Detached homes Detached/attached AttachedWater Private green Large lawns Small fenced yards Courtyards Public parksParks Auto only Auto, trails Sidewalks Sidewalks/bike lanes Sidewalks/bike lanesN/A Bldg Ht. 35’ Bldg Ht 35’ Bldg ht. 40’ Bldg Ht 40-70’ Bldg Ht 70’+

myregion.org- How Shall We Grow?
“Smart Growth” is a collection of planning, regulatory, and development practices that use land resources more efficiently through compact building forms, in-fill development and moderation in street and parking standards.”
(The American Planning Association)
myregion.org- How Shall We Grow?
One of purposes of Smart Growth is:“ to reduce the outward spread of urbanization, protect sensitive lands and in the process create true neighborhoods with a sense of community.”

myregion.org- How Shall We Grow?
Maryland enacted “Smart Growth”legislation in 1997.
Maryland directs state growth related expenditures into locally designated compact growth areas.

Conservation subdivisions in rural areas;
Traditional Neighborhood Developments in urban areas.
Mixture of stores, offices, residences, schools and related public facilities within walking distance of each other in compact neighborhoods.
Smart growth can mean:

Conservation subdivision ↓ Traditional Neighborhood↓
Source: Conservation Design for Subdivisions, Randall Arendt
Source: ULI Great Planned Communities
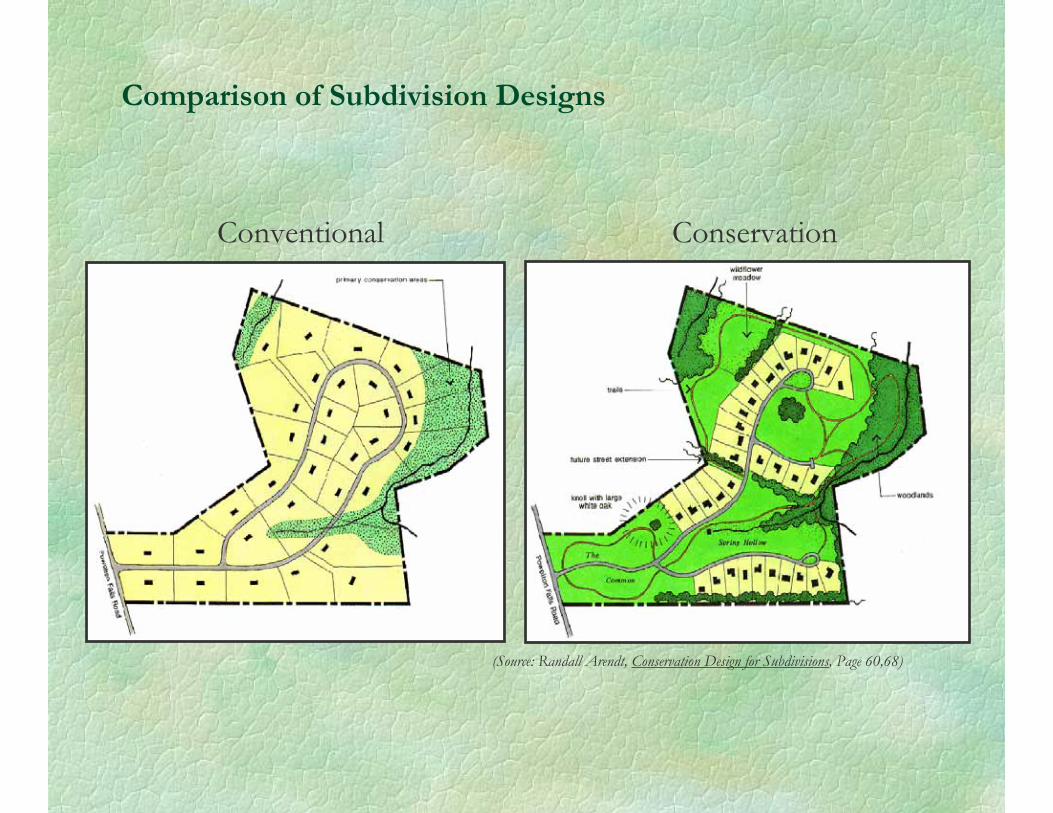
Comparison of Subdivision Designs
Conventional Conservation
(Source: Randall Arendt, Conservation Design for Subdivisions, Page 60,68)
Traditional Neighborhood Design
Our oldest Florida cities were based on pedestrian scale, walk-able communities with public green space and mixed uses.

St. Augustine, Florida, 1565. The First American city was a traditional European design mandated by the Spanish Law of the Indies. A public square was surrounded by public buildings, bounded by grid of right angle streets.

1733- Savannah, GA
General James Ogelthorpe’s Georgian Town plan, (approved by King’s Grant) was a traditional grid street design with 24, one-acre park squares.

Neo-Traditional Neighborhood Design
Architects such as Andres Duany and his firm DPZ of Coral Gables, FL are a school of planners who advocate a return to traditional neighborhood design in new communities. They call this “neo traditional design”, taking the best design cues from our best historic communities.
What is a neo-traditional design?
It is: formal land designrich architectural detailsdense coregrid streetsmixed usesguidelines for architecture, materials, and common open space. distance from the center of a neighborhood to its edge is ideally ¼ mile, or a five-minute walk.

Neo Traditional Designuses form-based codes & pattern books
Source: ULI Great Planned Communities

Neo -traditional design- formal land designCelebration, FL10,000 acres, 5-6000housing units. 50%open space, 2 millionSq. Ft commercial.
Source: ULI Great Planned Communities
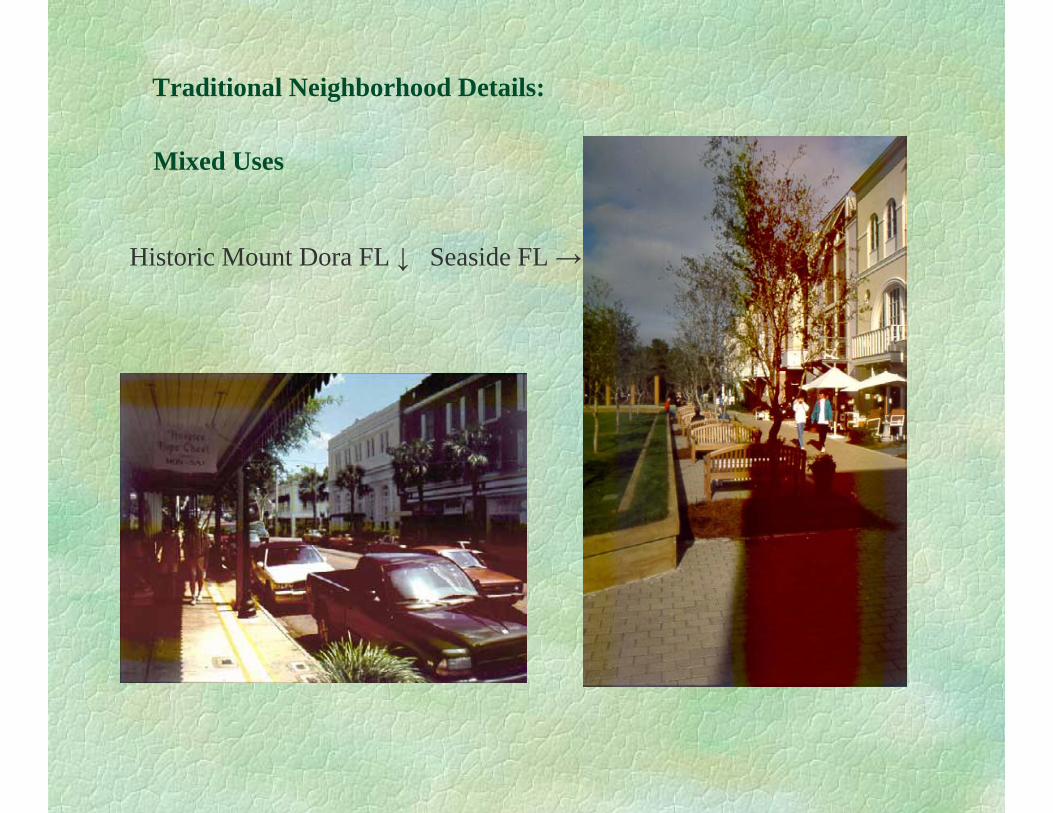
Mixed Uses
Historic Mount Dora FL ↓ Seaside FL →
Traditional Neighborhood Details:

Traditional Neighborhood Details : Tree Lawns, Streets, sidewalks and curbs
Tree canopy with tree lawn between the sidewalk and curb.(Monticello, Florida)

Traditional Neighborhood Details : Density
Typical Density: 4-6 units per gross acre for moderate density TNDs with 2-3 story structures. Much higher densities for urban town centers.
Seaside FL density- 4 units per gross acre

Traditional Neighborhood Details : SetbacksSavannah, GA. (Historic) Traditional Neighborhood Design
0’ setback ↓ 15’ setback from outside edge of sidewalk ↓
Traditional Neighborhood Details: Setbacks
Minimum house front setbacks (0-15’). Houses with 0’setback are masonry construction. Maximum front setback- 15’ from sidewalk for porch. Lots on streets closest to the Transect “Core” have shallowest setbacks. Increase setbacks as you move outward. For example:“Core” Downtown - 0’ setback“Center” Residential Blocks 15’setback “Center” Blocks” 20’setback “General” 30’setback

Traditional Neighborhood Details: Privacy/party walls. Historic: Brick, masonry best materials.
(Savannah, GA.)

Traditional Neighborhood Details - Privacy/party walls
Fence Detail

Traditional Neighborhood Details : Garages. Accessed by alleys, or set 10-12’ behind building line for front load garages. No snout houses!
Setback off alley- 15’. Alley width 14-20’.

Historic and Traditional Neighborhood Details: Streets. Wide enough for on street parking, at least on one side. R.O.W. typically 60’ with curb and gutter (Savannah, Georgia).
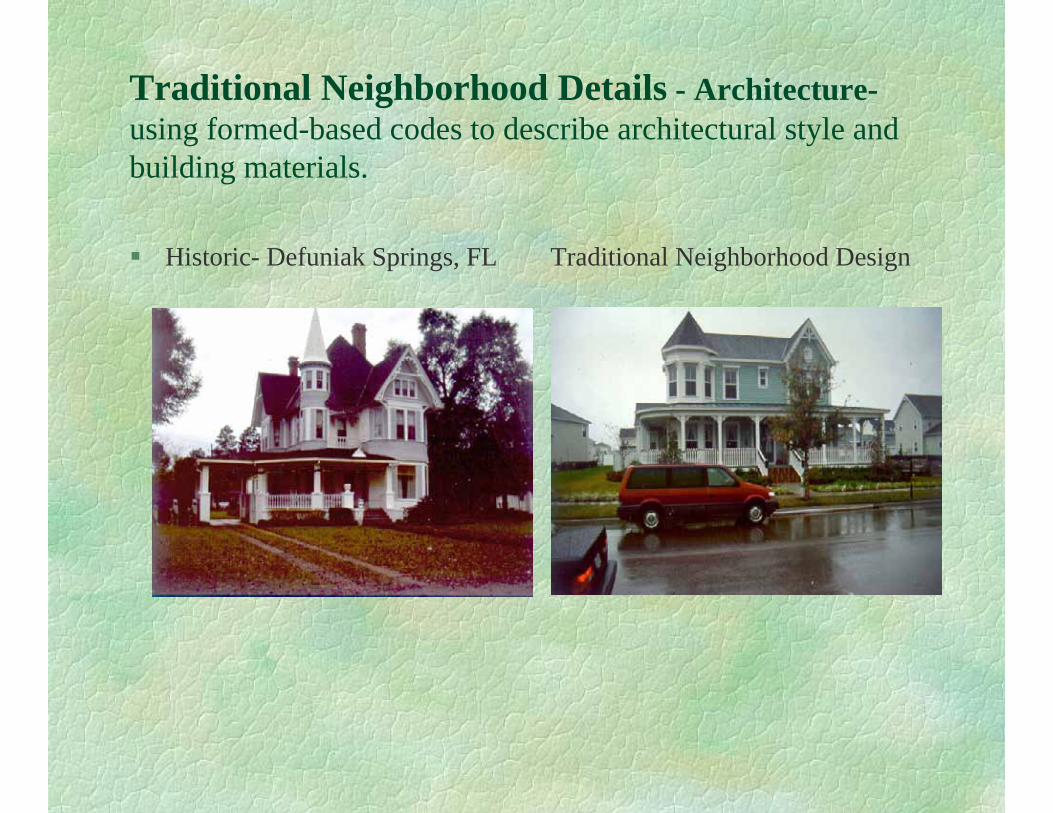
Traditional Neighborhood Details - Architecture-using formed-based codes to describe architectural style and building materials.
Historic- Defuniak Springs, FL Traditional Neighborhood Design
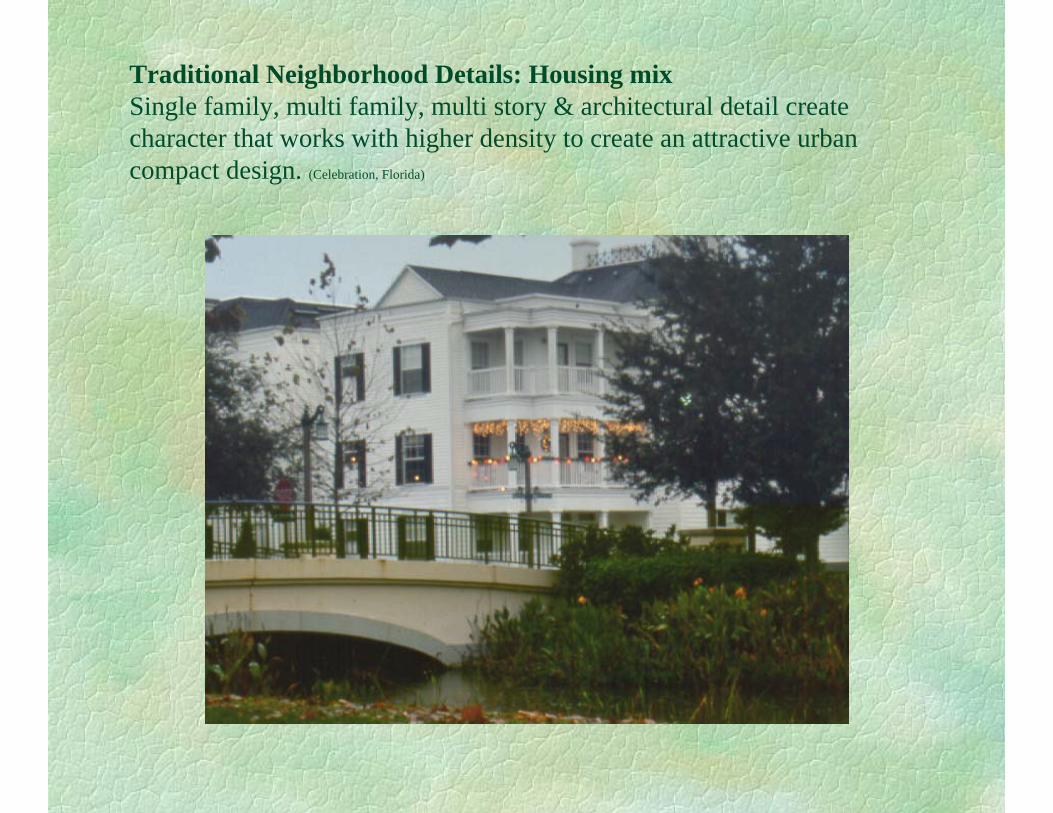
Traditional Neighborhood Details: Housing mixSingle family, multi family, multi story & architectural detail create character that works with higher density to create an attractive urban compact design. (Celebration, Florida)
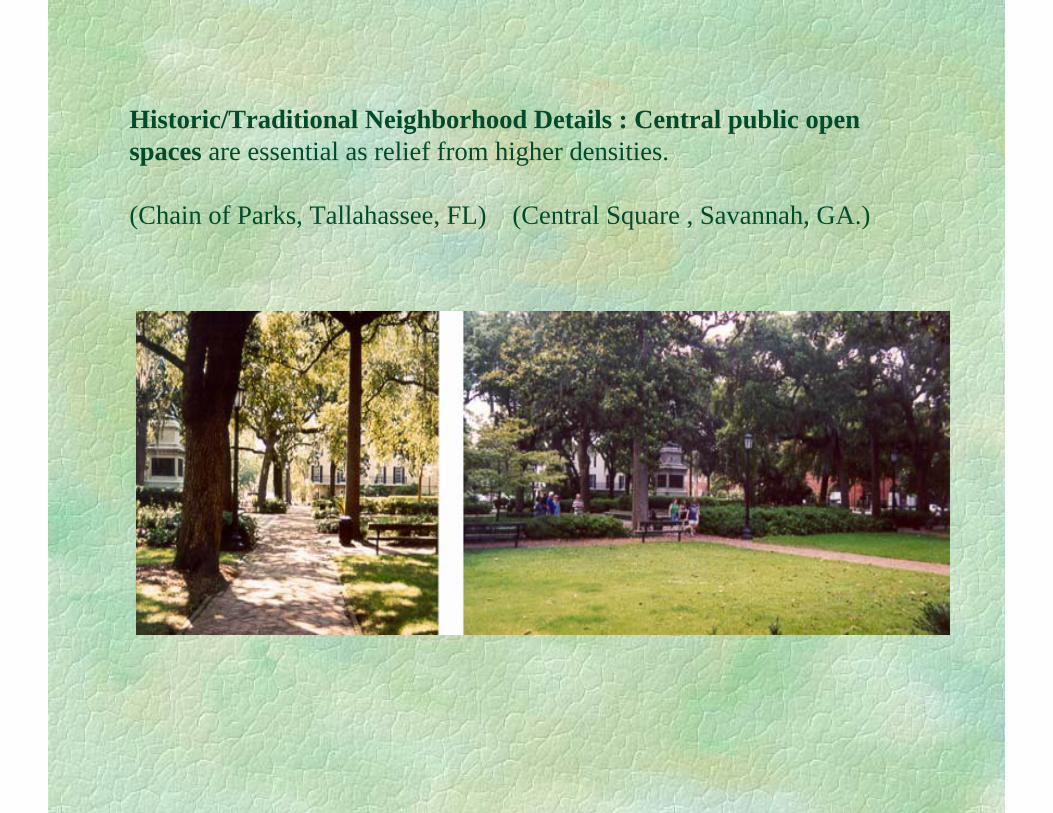
Historic/Traditional Neighborhood Details : Central public open spaces are essential as relief from higher densities.
(Chain of Parks, Tallahassee, FL) (Central Square , Savannah, GA.)

Traditional Neighborhood Details : useable centralized open space
Historic- Forsyth Park, Neo Traditional Neighborhood Savannah, GA Rosemary Beach, FL
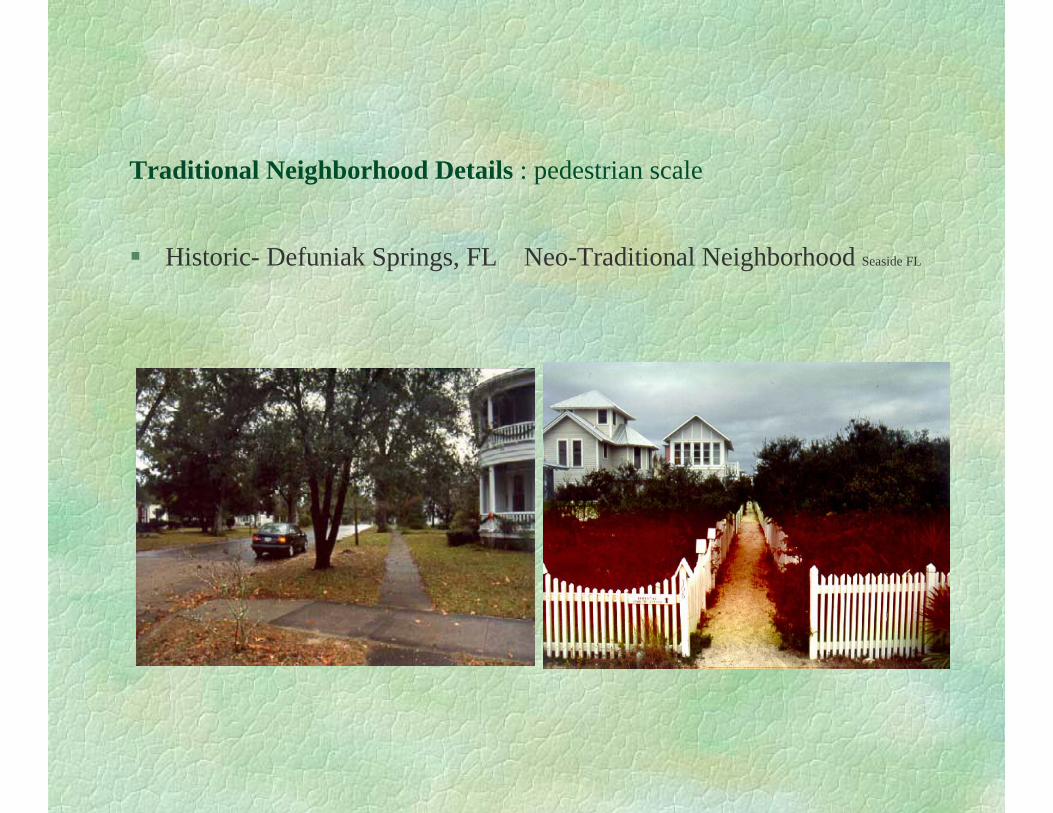
Traditional Neighborhood Details : pedestrian scale
Historic- Defuniak Springs, FL Neo-Traditional Neighborhood Seaside FL

TND Details: Streets. Compact blocks. Grid pattern streets, block design purposefully interrupted. Where through streets exist, the best are treed boulevards, with low speeds, stop signs at intersections. Density: 3.8 units per gross acre.Open Space: 21%; each square park is one acre.

Smart GrowthNeo-Traditional designBig box alternativecreates equalvalue, less traffic.
Source: Frank Elmer, Lincoln Street Studio
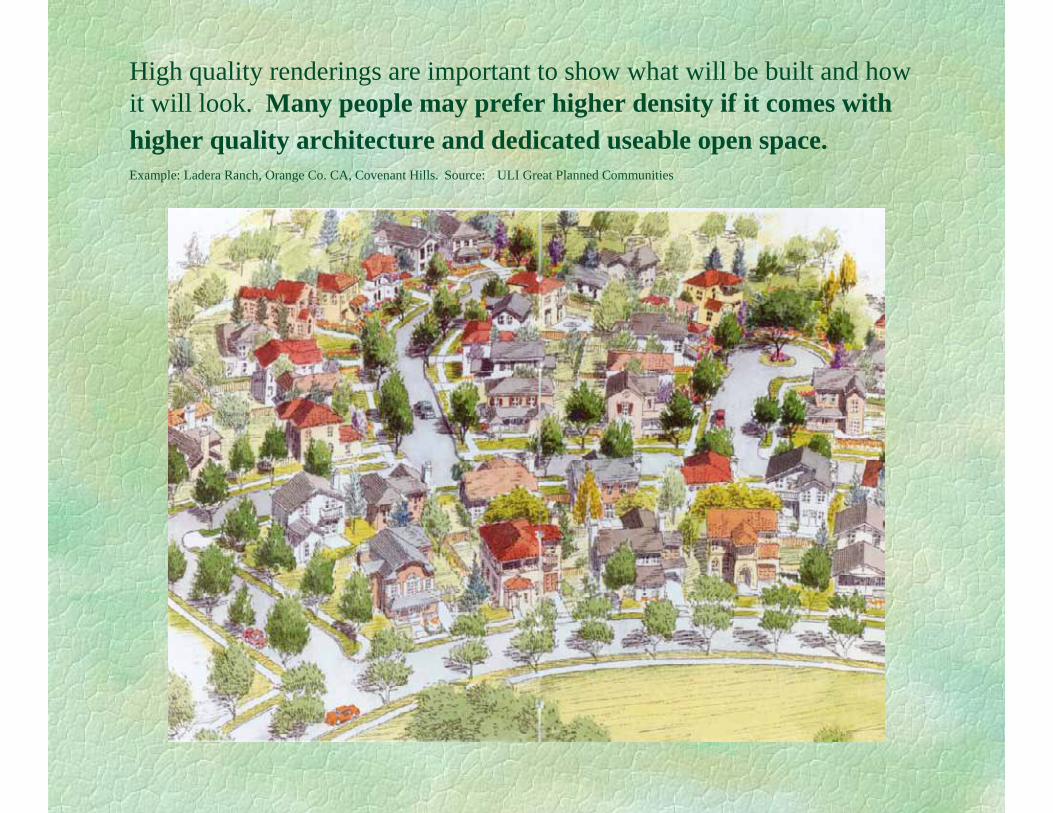
High quality renderings are important to show what will be built and how it will look. Many people may prefer higher density if it comes with higher quality architecture and dedicated useable open space.Example: Ladera Ranch, Orange Co. CA, Covenant Hills. Source: ULI Great Planned Communities

Alternative development policies
Should they be an option in your community?
What are the benefits? Reduced costs, preserved green space, reduced auto trips if transit can be incorporated in limited high density corridors.
What are the tradeoffs? Higher density in some areas.
Bottom line: It is still a matter of local choice in Florida

myregion.org- How Shall We Grow?
Time to choose your future
myregion.org offers alternatives to consider
Let’s play a game to choose how you want your region to look in 2050
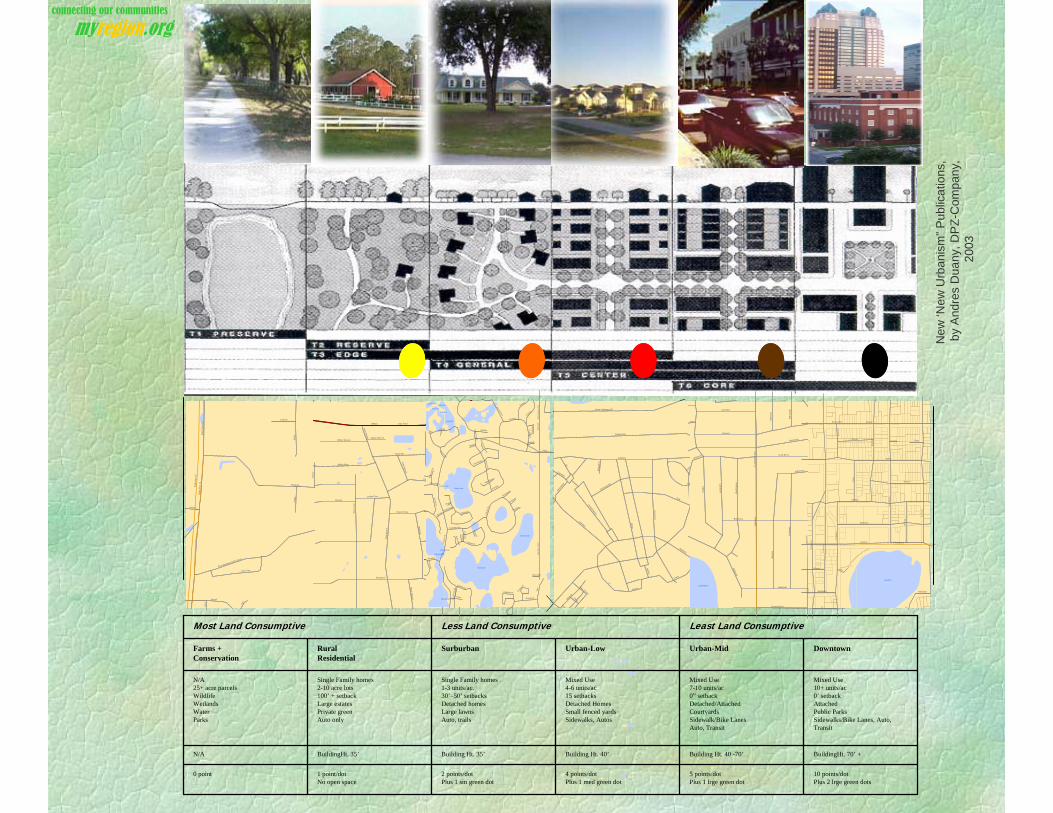
10 points/dotPlus 2 lrge green dots
5 points/dotPlus 1 lrge green dot
4 points/dotPlus 1 med green dot
2 points/dotPlus 1 sm green dot
1 point/dotNo open space
0 point
BuildingHt. 70’ +Building Ht. 40 -70’Building Ht. 40’Building Ht. 35’BuildingHt. 35’N/A
Mixed Use10+ units/ac0’ setbackAttachedPublic ParksSidewalks/Bike Lanes, Auto, Transit
Mixed Use7-10 units/ac0” setbackDetached/AttachedCourtyardsSidewalk/Bike LanesAuto, Transit
Mixed Use4-6 units/ac15 setbacksDetached HomesSmall fenced yardsSidewalks, Autos
Single Family homes1-3 units/ac.30’–50’ setbacksDetached homesLarge lawnsAuto, trails
Single Family homes2-10 acre lots100’ + setbackLarge estatesPrivate greenAuto only
N/A25+ acre parcelsWildlifeWetlandsWaterParks
DowntownUrban-MidUrban-LowSurburbanRuralResidential
Farms +Conservation
Least Land ConsumptiveLess Land ConsumptiveMost Land Consumptive
McKinley
Sta
te R
o ad
1 9
Wile
y
Bea
chFa
irway
Burrell
Pine Tree
Pine Meadows Golf Course
Fre d
a
Pen
ny
Tropical
Oak
Powers
Rus
two o
d
Alic
e
Pine Cone
Sta
te H
wy
19S
t at e
Hw
y 19
Dan Ford
Plantation
Conifer
Fir
Pin
e W
oods
Hem
lock
Pinyon
Breezy
Scotch Pine
White Pine
Tamarack
Pin
e C
one
Sitk
a
Pal
met
to P
ines
White Spruce
Lodge Pole
Red Spruce
Black Spru ce
Eve
rgre
en
Pine Woods White Spruce
SR 40
Island Lake
Lake Marietta
Sawyer Lake
Banana Lake
Lake Irish
Lake Irish
Lake Marietta
Lake IrishLake Irish
Lake Marietta
Lake Irish
Sawyer Lake
He a
t hr o
w
Ban
ana
Lake
A aa
Ora
nge
K ee nwic ke
Langham
Cricklewood
St Albans
Lak e
wo r
t h
Bradcliffe Point
Kersley
Kersfield
Tadsworth
Palliste
r
Greenstone
P re ser ve
Paola
Prince
Chantry
B loomsbury
Paddington
Stonefield
Chessington
Rockd al e
Ridgemount
Cha tf ie ld
Wintree
Wild
Ch e
r r y
Ga t
wic
k
Haddonstone
Cherry Ridge
Stanfield
Knightsbridge
Stonehaven
Kenilw
orth
Kentshire
A shbr ok
Ashbroo ke
Trentwood
Sebastian
Branchory
Island Lake
Rosw el l
Finsbury
Queensga t e
Tufton
Aberdovey Point
Cri c
k lew
ood
St A
lb an s
Sta
te H
wy
431
G
Teal
Water
Golfpark
Campus
Front
Celebration
Syc am
o re
Mulberry
Arbor
State Highway 417
Iris
Longmeadow
Honeysuckle
Wist
eria
Bloom
Green
brier
Rosa
Market
Camellia
Lake Evelyn
Elde
rber
ry
Teal
Lake Berry
Lake
mon
t
Phe
lps
Sel
kirk
Poinsettia
Bre
c hin
Dun
rave
n
Banchory
Dun
blan
e
Perth
Dar
cey
Loch Berry
Whitehall
Lang
holm
Dundee
Balmoral
Wor
thin
gton
Grinnell
Summerfield
Carrollee
Kimbrace
Cady
Mizell
Ben
mor
e
Edi
nbur
gh
Coldstr
eam
Brookshire
Aster
Balmoral
Darcey
S L
akem
ont A
ve
Summerfield Rd
Lake Eola
Amelia
Mag
nolia
Concord
Cat
hcar
t
Robinson
Livingston
Bro
adw
ay
Ro s
alin
d
Hig
hlan
d
Ridgewood
Pal
met
to
Rut
h
Harwood
Hill
man
Hibiscus
Ge ne va
Eola
Cristor
Washington
Jefferson
Washington
E Concord St
E Robinson St
connecting our communities
myregion.org
New
‘New
Urb
anis
m”P
ublic
atio
ns,
by A
ndre
s D
uany
, DP
Z-C
ompa
ny,
2003

Each table designs its own 2050 development “look”.
Maximum 100 points displayed by colored “new development dots”.
These dots represent density multiples for purposes of the game.
myregion.org- How Shall We Grow?

myregion.org- How Shall We Grow?
The choice of providing more density results in more green space being left in 2050.
The choice of providing less density results in less green space in 2050.
Green space dots are different sizes.
Development dots are the same size. Different colors represent different densities.
myregion.org- How Shall We Grow?
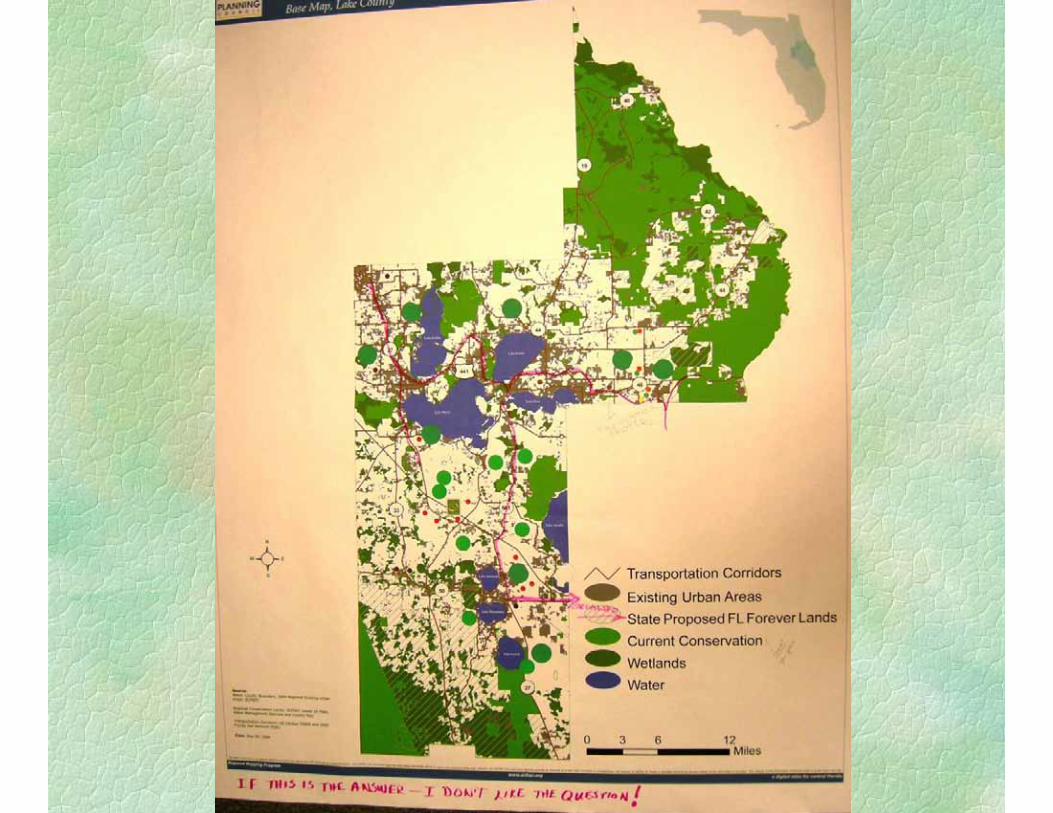
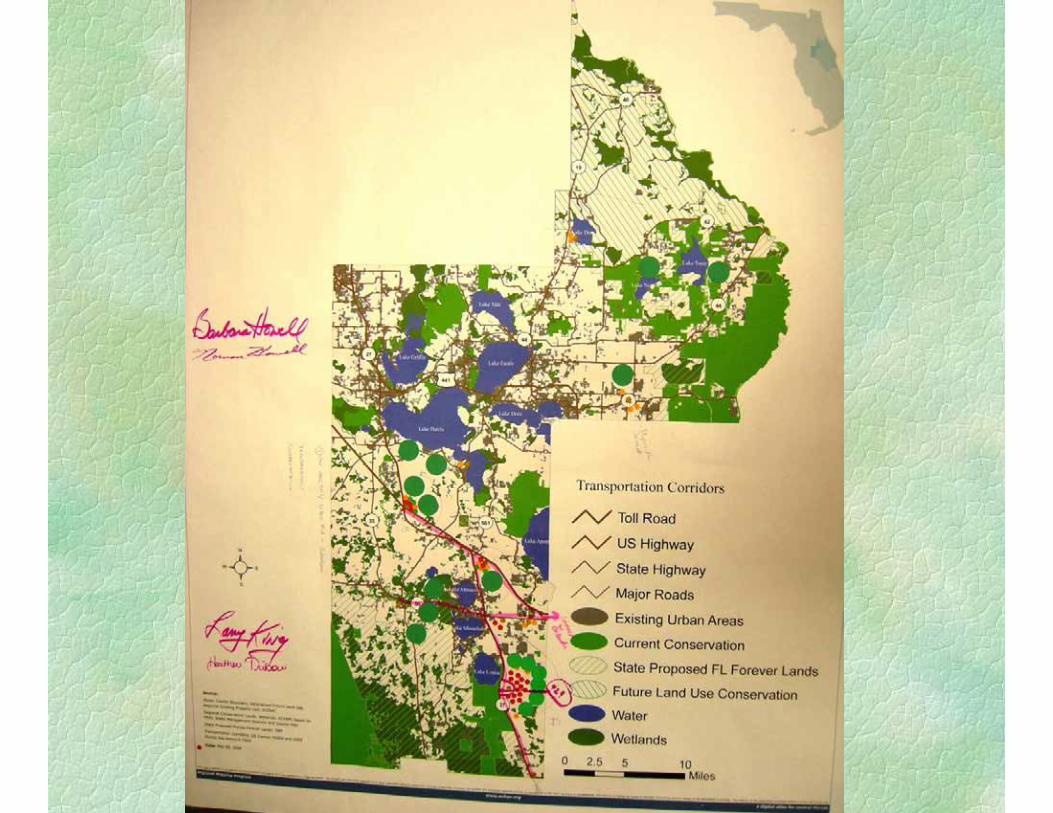
Lake County Results from the May Community Workshops.


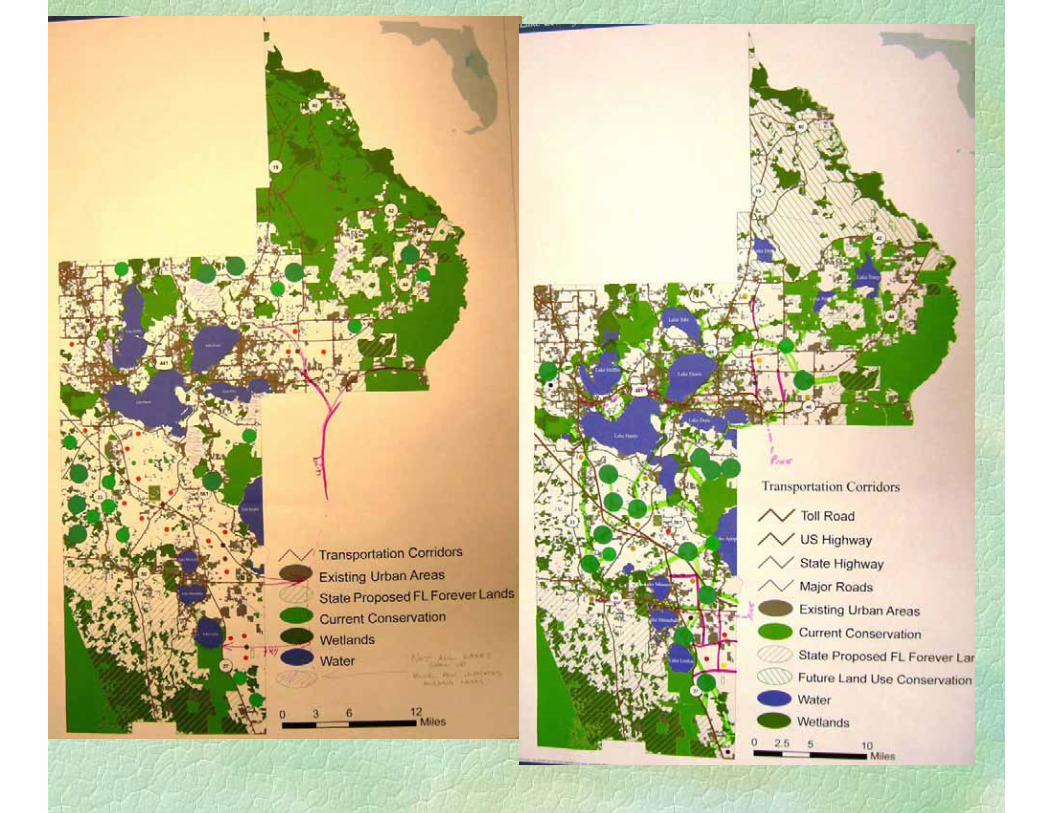


Next Steps:
Your maps will be put into a county “composite” that we will bring back to you for a “Paint the Region” exercise.
This composite can then be further “adjusted” using the Paint the Region model, fall 2006.

Future Steps
The final vision selected by Lake County residents in the round two workshops (fall 2006) may guide elected officials in their contemplation of future Lake County development patterns.

Future Steps
To accomplish a better development pattern result in 2050, Lake County and its cities may wish to amend their comprehensive plans to incorporate their long range vision from the myregion project.