how to deliver the right metrics to your cmo and earn...
TRANSCRIPT

On LinkedIn:
How to Deliver the Right Metrics to Your CMO and Earn More Recognition for Marketing
Terry FlahertyVP of Strategy and Best PracticesBulldog Solutions
Jon VlockDirector of Client Marketing Strategy, UBM TechWeb

© 2011 Bulldog Solutions. All rights reserved. www.bulldogsolutions.com
On LinkedIn:
AgendaThe Scorecard of the C-Suite
– Marketing’s Role in the C-Suite Scorecard
– The Integrated Sales and Marketing Process
– 5 Critical Metric Categories for the CMO
Meeting & Exceeding CXOs and Business Leaders Expectations in the Real World– Expectations of You and Marketing is Shifting
– CEOs and Business Stakeholders Expectations
– Key Recommendations & Approaches
– How to Avoid Metrics Traps

© 2011 Bulldog Solutions. All rights reserved. www.bulldogsolutions.com
On LinkedIn:
About Bulldog Solutions
Demand-generation agency for BtoB.
We provide BtoB marketing with new capabilities to grow revenue and prove its influence.
How do you measure up?Take the Executive Benchmark Assessment at
eba.bulldogsolutions.com

© 2011 Bulldog Solutions. All rights reserved. www.bulldogsolutions.com
On LinkedIn:
CMO Role is Evolving…Compelled to drive revenue
Integrate marketing and sales – deliver value throughout the sales and marketing process
Balance revenue growth and cost of sales/marketing
Bring process best practices to marketing and sales
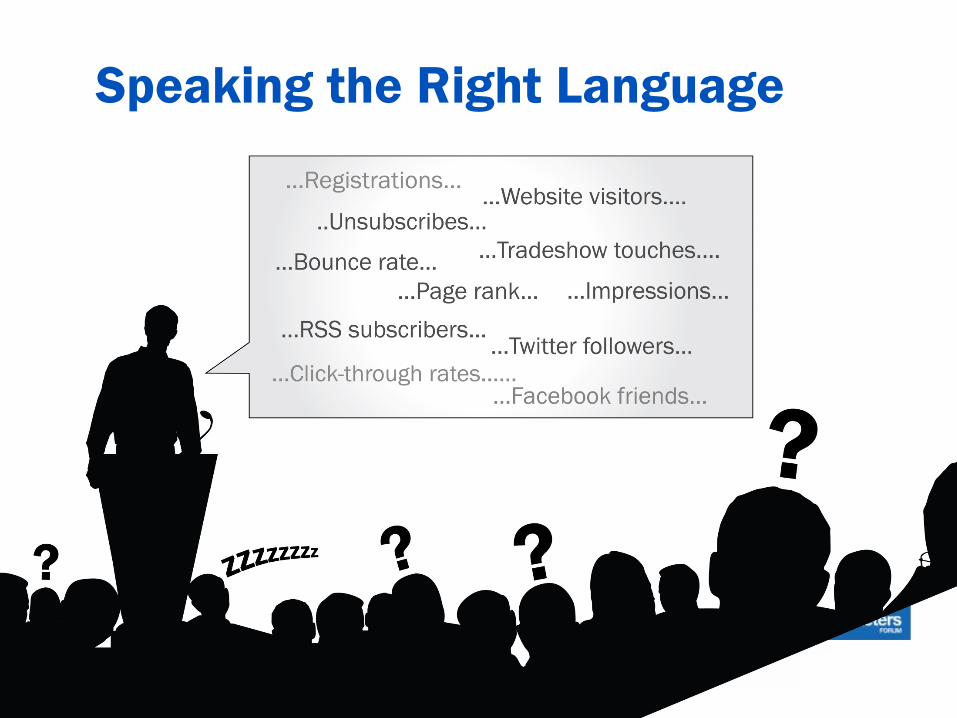
“CMOs need to speak about business in business terms to their peers, using words and metrics like revenue, cash flow, and profitability.”
© 2011 Bulldog Solutions. All rights reserved. www.bulldogsolutions.com
On LinkedIn:
Speaking the Right Language
© 2011 Bulldog Solutions. All rights reserved. www.bulldogsolutions.com
On LinkedIn:
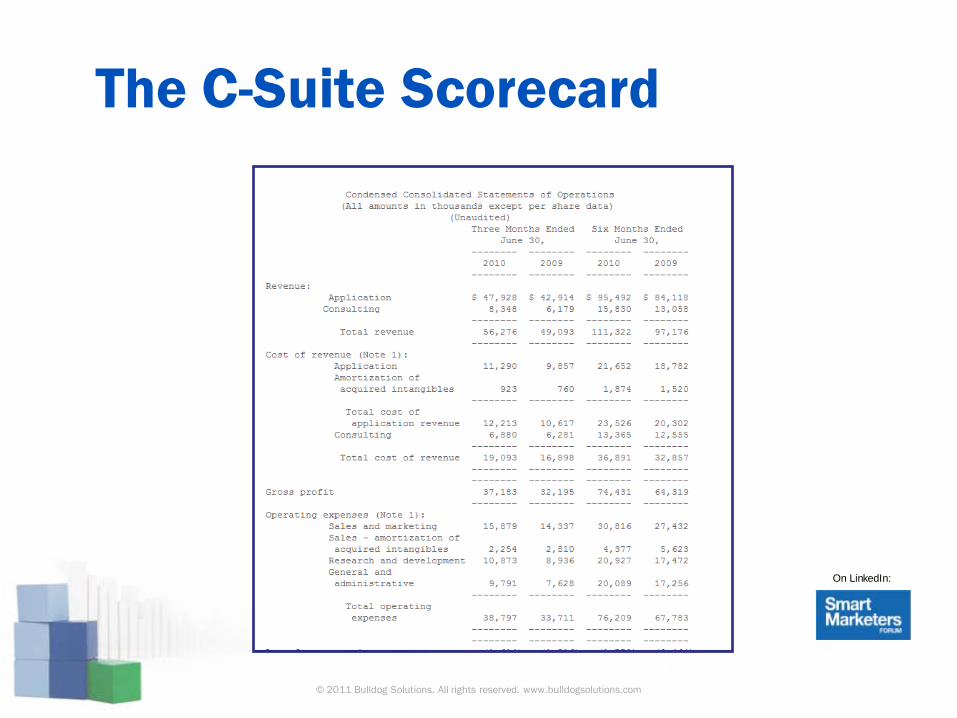
The C-Suite Scorecard

© 2011 Bulldog Solutions. All rights reserved. www.bulldogsolutions.com
On LinkedIn:
CMO Impacts 2 Key Metrics

© 2011 Bulldog Solutions. All rights reserved. www.bulldogsolutions.com
On LinkedIn:
-30.00%
-20.00%
-10.00%
0.00%
10.00%
20.00%
30.00%
40.00%
50.00%
-5.00% -4.00% -3.00% -2.00% -1.00% 0.00% 1.00% 2.00% 3.00% 4.00%
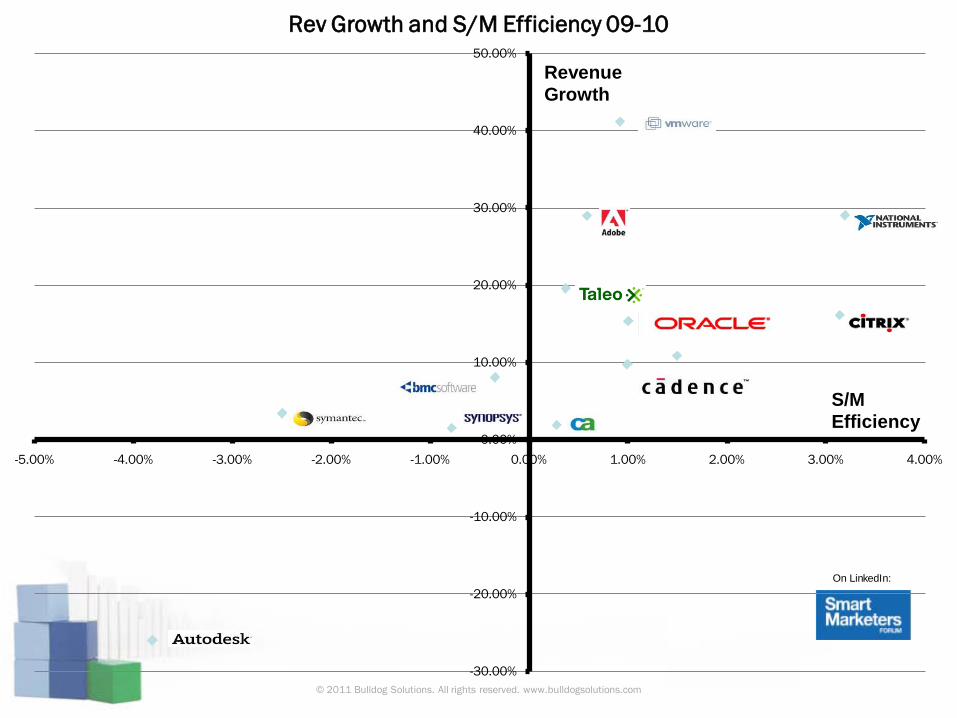
Rev Growth and S/M Efficiency 09-10
Revenue Growth
S/M Efficiency

© 2011 Bulldog Solutions. All rights reserved. www.bulldogsolutions.com
On LinkedIn:
-30.00%
-20.00%
-10.00%
0.00%
10.00%
20.00%
30.00%
40.00%
50.00%
-5.00% -4.00% -3.00% -2.00% -1.00% 0.00% 1.00% 2.00% 3.00% 4.00%
Rev Growth and S/M Efficiency 09-10
Revenue Growth
S/M Efficiency
Driving Growth Gaining Efficiencies
Losing RevenueCosts Escalating
Buying Market?
Overaggressive Cost Reduction?
© 2011 Bulldog Solutions. All rights reserved. www.bulldogsolutions.com
On LinkedIn:
-30.00%
-20.00%
-10.00%
0.00%
10.00%
20.00%
30.00%
40.00%
50.00%
-5.00% -4.00% -3.00% -2.00% -1.00% 0.00% 1.00% 2.00% 3.00% 4.00%
Rev Growth and S/M Efficiency 09-10
Revenue Growth
S/M Efficiency

© 2011 Bulldog Solutions. All rights reserved. www.bulldogsolutions.com
On LinkedIn:
Why Scorecards Matter to the CEO
2 Competitors in Enterprise Software
–Similar Solutions
–Similar Business Model (SAAS)
–Similar Revenue (~$200M)
Company A Company B
Rev. Growth 32.1% 25.4%

© 2011 Bulldog Solutions. All rights reserved. www.bulldogsolutions.com
On LinkedIn:
Looking a Little Deeper…
Aggregate Impact – B has a $26M Competitive Advantage
Driven by efficiencies in Sales/Marketing process (i.e. the demand waterfall)
Company A(HiGrowth)
Company B(Efficiency)
Rev. Growth 32.1% 25.4%
S/M % Rev 47.7% 27.7%
2 Competitors in Enterprise Software Similar Solutions Similar Business Model
(SAAS) Similar Revenue (~$200M)
Every dollar of revenue costs company B 27.7cents… and company A 47.7 cents in sales and marketing costs
© 2011 Bulldog Solutions. All rights reserved. www.bulldogsolutions.com
On LinkedIn:
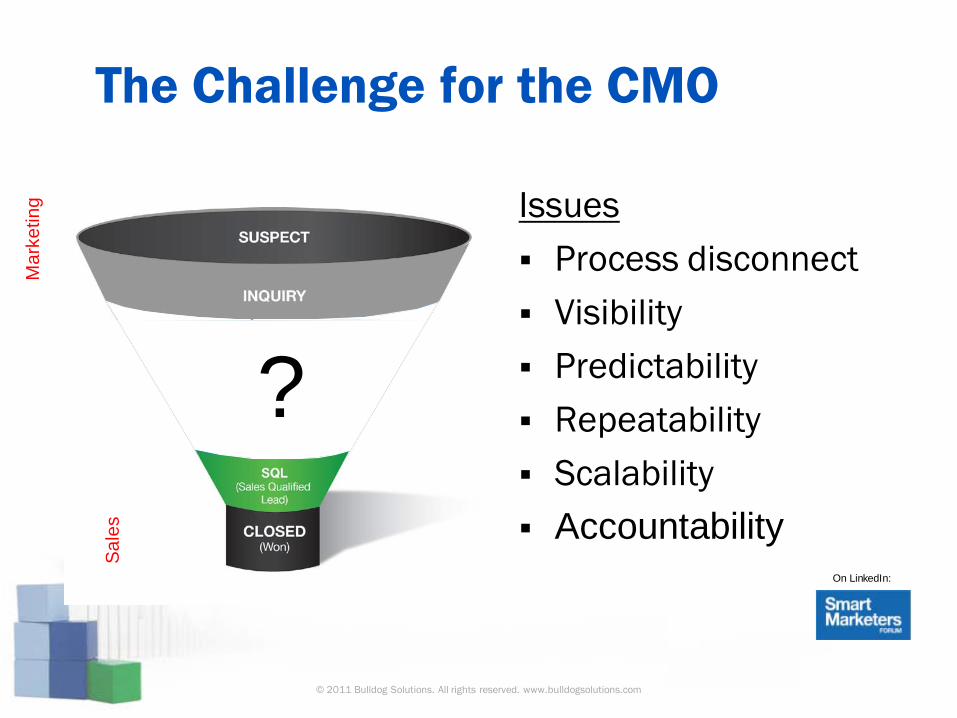
The Challenge for the CMO
Issues Process disconnect Visibility Predictability Repeatability Scalability Accountability
Mar
ketin
g
?
Sal
es
?

© 2011 Bulldog Solutions. All rights reserved. www.bulldogsolutions.com
On LinkedIn:
??
The Gap in the Process
Opportunity to Closed/Won
Supported by CRM
Somewhat repeatable process and defined stages
Standard metrics
Communicated via sales pipeline and forecasts
Needs AnalysisSolutions Presentation
LOI/ProposalContracts
Closed/ Won
Marketing Programs Often manual, Transitioning to Marketing Automation Limited visibility post-inquiryMetrics not linked to revenue Limited understanding of metrics outside of marketing

© 2011 Bulldog Solutions. All rights reserved. www.bulldogsolutions.com
On LinkedIn:
Integrated Sales and Marketing Funnel
Critical stages in the marketing and sales process:
• Manages lead hand-off between marketing and sales• Provides closed loop feedback throughout the funnel
© 2011 Bulldog Solutions. All rights reserved. www.bulldogsolutions.com
On LinkedIn:
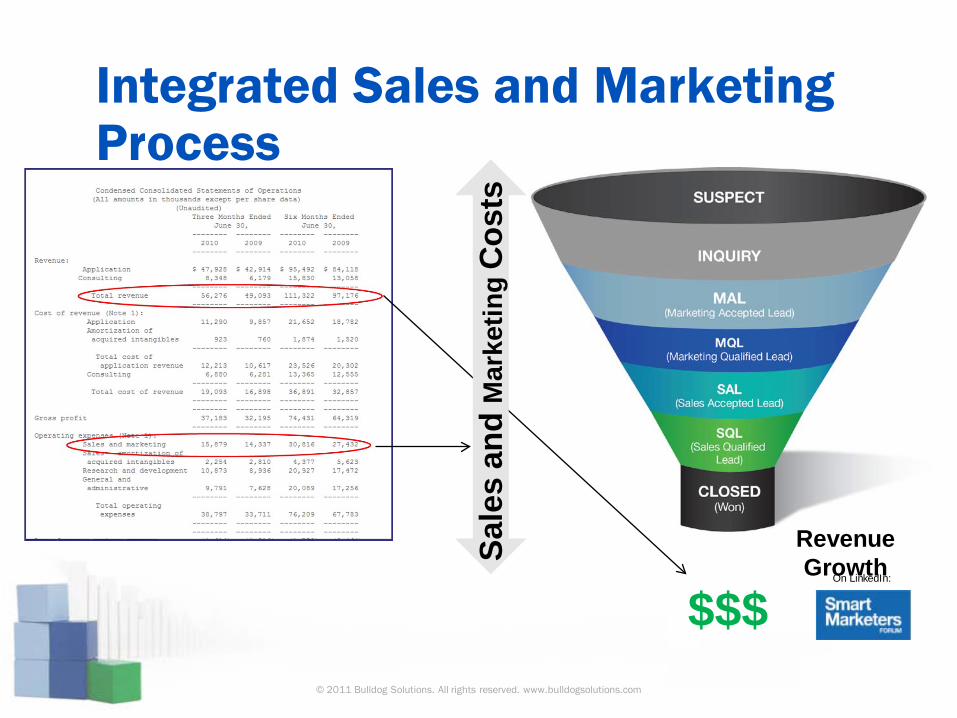
Integrated Sales and Marketing Process
$$$Revenue GrowthSa
les
and
Mar
ketin
gC
osts

© 2011 Bulldog Solutions. All rights reserved. www.bulldogsolutions.com
On LinkedIn:
Key Metric Categories
Types of Funnel Metrics
Business Strategy
Volume (and trends)
Conversion rates
Velocity
Program/Asset Performance

© 2011 Bulldog Solutions. All rights reserved. www.bulldogsolutions.com
On LinkedIn:
Business Strategy Metrics
Recurring Revenue
39%
New Revenue -Marketing Initiated
32%
New Revenue - Sales
Initiated29%
Marketing Initiated Revenue sourced by marketing programs
CMO accountable for specific revenue goals
© 2011 Bulldog Solutions. All rights reserved. www.bulldogsolutions.com
On LinkedIn:
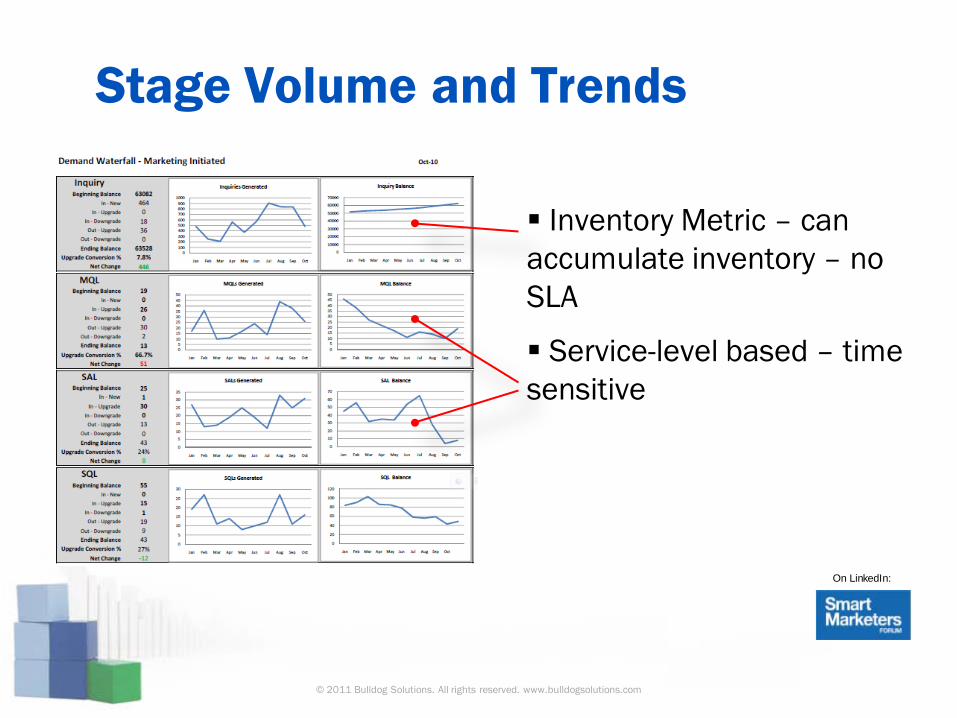
Stage Volume and Trends
Inventory Metric – can accumulate inventory – no SLA
Service-level based – time sensitive

© 2011 Bulldog Solutions. All rights reserved. www.bulldogsolutions.com
On LinkedIn:
Conversion Rates
Average Strong Best-in-class
Suspect-Inquiry
0.5% 1.0% 1.5%
Inquiry -MQL
3.9% 5.8% 9.7%
MQL -SAL
58.3% 65.6% 74.5%
SAL -SQL
49.1% 56.4% 60.5%
SQL -CL/W
23.1% 26.9% 30.7%
Sirius Decisions

© 2011 Bulldog Solutions. All rights reserved. www.bulldogsolutions.com
On LinkedIn:
The Impact of Efficient Funnels
BudgetCompany A (average)
Company B (strong)
Total Budget Required $ 935,973 $ 459,314
Waterfall Stages RequiredCompany A (average)
Company B (strong)
Inquiries Required 17,509 8,940 MQLs Required 753 519SALs Required 439 353Opportunities (SQL) Required 230 196Deals Required 56 56
Key Performance MetricsCompany A (average)
Company B (strong)
ROMI 10.68 21.77Performance Improvement over Current Client Baseline 1.00 2.04
1.70% 4.3%
58.3%52.3%
24.2%
2.50% 5.8%
68.1%55.4%
28.4%
0.00%
10.00%
20.00%
30.00%
40.00%
50.00%
60.00%
70.00%
80.00%
Contact to Inquiry
Inquiry to MQL
MQL to SAL SAL to SQL SQL to Closed Won
Company A (average) Company B (strong)
Goal : Generate $10M incremental marketing initiated revenue
Avg. Deal Size: 180K

© 2011 Bulldog Solutions. All rights reserved. www.bulldogsolutions.com
On LinkedIn:
Velocity
Measures velocity of change across pipeline stage
Key component (with conversion) of pipeline forecast
Identify service level issues
02468
10121416
Q1 09
Q2 09
Q3 09
Q4 09
Q1 10
Q2 10
Q3 10
MQL to SAL
SAL to SQL
Average Days for Conversion
105
110
115
120
125
130
Q1 09
Q2 09
Q3 09
Q4 09
Q1 10
Q2 10
Q3 10
MQL to C/Win
Average Days for Conversion

© 2011 Bulldog Solutions. All rights reserved. www.bulldogsolutions.com
On LinkedIn:
Asset Performance
Understand Funnel Performance for each Campaign
–Units Generated at Stage
–Cost
–Return on Marketing $ Invested
Waterfall Stages Generated Cmpg001 Cmpg002 Cmpg003
Inquiries Generated 966 1368 548MQLs Generated 82 86 31SALs Generated 48 41 15Opportunities (SQL) Generated
22 21 8
Deals Generated 6 5 2
Cost Per Waterfall Stage Cmpg001 Cmpg002 Cmpg003Cost Per Inquiry $30 $48 $45 Cost Per MQL $352 $767 $798 Cost Per SAL $604 $1,616 $1,612 Cost Per SQL $1,324 $3,095 $2,964 Cost Per Closed-Won $4,815 $13,227 $11,227
Cmpg001 Cmpg001 Cmpg003
ROM$I $37.38 $13.61 $16.03

© 2011 Bulldog Solutions. All rights reserved. www.bulldogsolutions.com
On LinkedIn:
CMO Planning Across Waterfall
Attract
Engage
Convert

© 2011 Bulldog Solutions. All rights reserved. www.bulldogsolutions.com
On LinkedIn:
Evolution of Demand Gen Budget Over Time

UBM TechWeb Strategy & Business Model
Pg 26
Business Information Marketing-as-a-Service
• Education & Conferences
• Training & Certification
• Research & Analytics
• Websites, Events, Newsletters & Mags
• Media Solutions• Lead Lifecycle• Exhibitions &
Sponsorships• Communities• Content
Development• Custom Solutions
50% 50%
Business Information Fuels Insights For Tech Decision Making
Enabling People and Organizations to Harness the Power of Technology
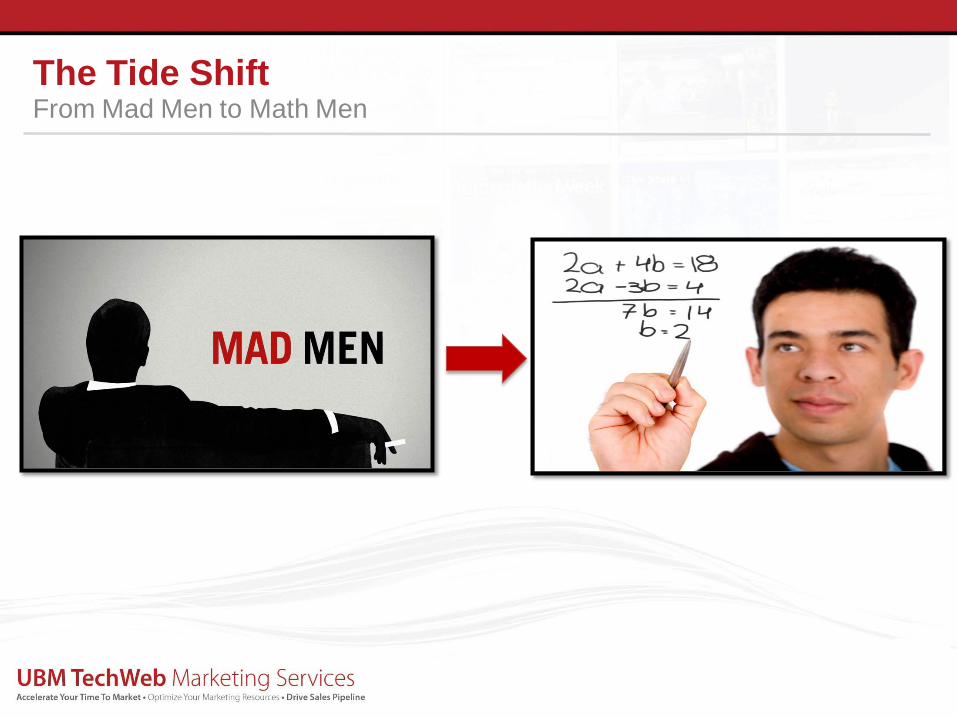
The Tide ShiftFrom Mad Men to Math Men

What Do C-level Execs Expect and Value?First Take Reality
“More revenue.” “Less sass.” “Total agreement with everything I say.” “More credit given to John (the CFO) and me.”

Tactics Have Changed but Principles are the SameWhat do CXOs Value and Expect?
• Defined success metrics• Clear Opportunity or Problem Definition• Agreed-Upon expected outcomes
– faster growth, new customers, revenue and profit…
• Milestones and timeframe with frequent and clear communications
- Tony Uphoff, CEO UBM TechWeb

Meeting CXOs & Business Leaders Expectations?Key Recommendations
Everything in Context
Its All About Growth
Plan for Your Environment
Agile Development vs. Big Bang
Test, Test, and Test Some More
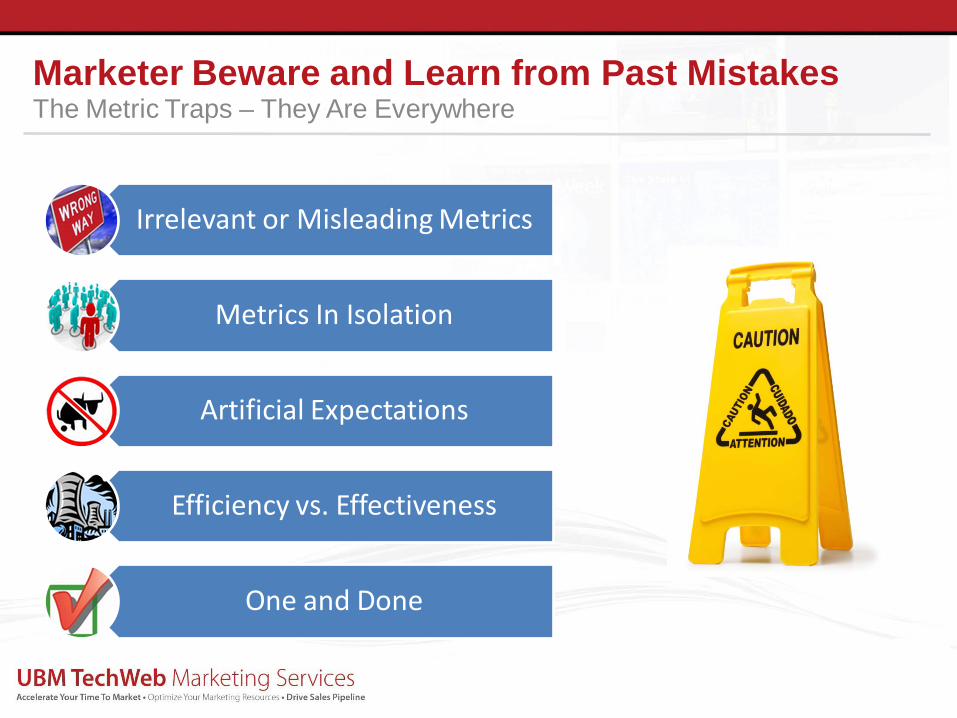
Marketer Beware and Learn from Past MistakesThe Metric Traps – They Are Everywhere
Irrelevant or Misleading Metrics
Metrics In Isolation
Artificial Expectations
Efficiency vs. Effectiveness
One and Done
On LinkedIn:
Funnel Scorecard Scenarios
Determining best actions for various pipeline conversion issues
© 2011 Bulldog Solutions. All rights reserved. www.bulldogsolutions.com
On LinkedIn:
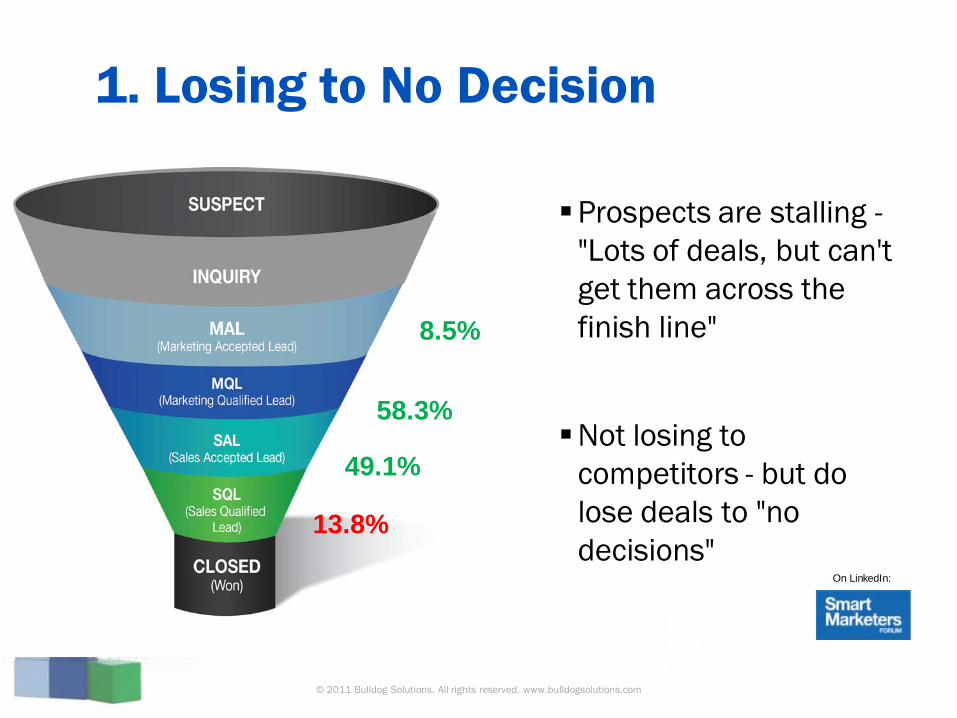
1. Losing to No Decision
Prospects are stalling -"Lots of deals, but can't get them across the finish line"
Not losing to competitors - but do lose deals to "no decisions"
13.8%
49.1%
58.3%
8.5%

© 2011 Bulldog Solutions. All rights reserved. www.bulldogsolutions.com
On LinkedIn:
1. Losing to No Decisions - CMO Strategy
Focus on economic buyers
Sales enablement tools
Tighten definition for MQL/SAL
© 2011 Bulldog Solutions. All rights reserved. www.bulldogsolutions.com
On LinkedIn:
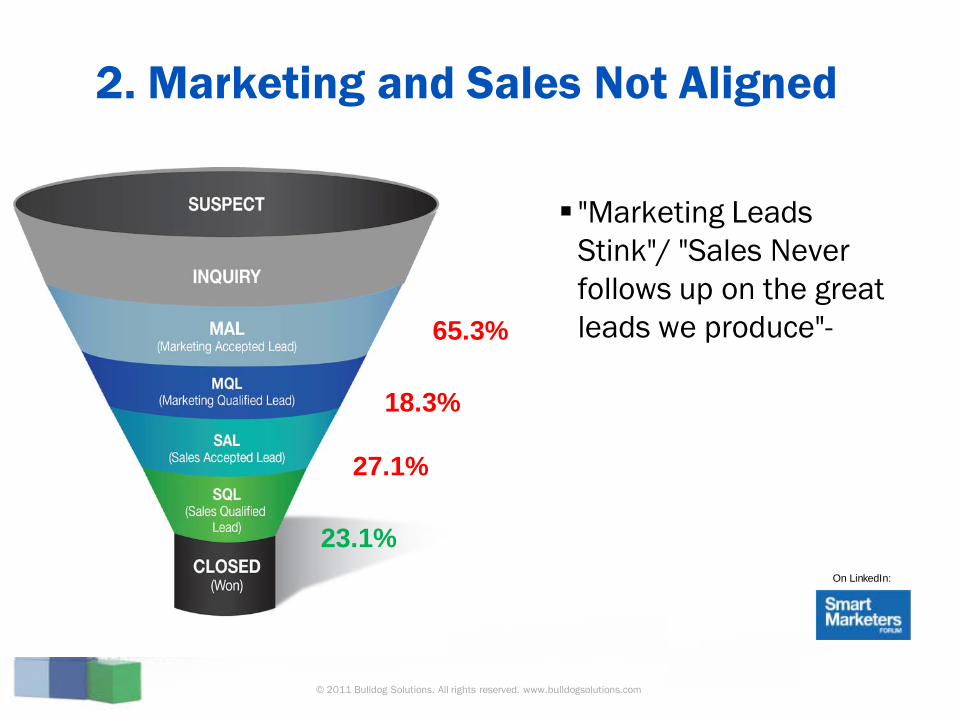
2. Marketing and Sales Not Aligned
"Marketing Leads Stink"/ "Sales Never follows up on the great leads we produce"-
23.1%
27.1%
18.3%
65.3%

© 2011 Bulldog Solutions. All rights reserved. www.bulldogsolutions.com
On LinkedIn:
2. Marketing/Sales Alignment–CMO Strategy
Re-evaluate definition of MQL/SAL
Establish and measure bi-directional service level agreements
Introduce lead scoring and lead nurturing
–Route qualified leads based on profile fit and engagement
–Establish nurture programs based on: Profile (Role, industry)
Stage of the buying cycle

© 2011 Bulldog Solutions. All rights reserved. www.bulldogsolutions.com
On LinkedIn:
3. Starving for Leads
"We're starving for leads - Just get me someone to talk to“
Current scenario has high conversion rates from Inquiry to SAL
Often leads to “No Decisions” or Un-alignment
5.5%
69.4%
67.9
87.5%

© 2011 Bulldog Solutions. All rights reserved. www.bulldogsolutions.com
On LinkedIn:
Starving for Leads – CMO StrategyQuality is more important than Quantity (no matter how
hard they complain)
Create personas and specifications for MQLs that have rigor
–Drive relevant messages for very defined markets
Leverage the "Rule of 5" for content development
–“Hard Hitting” Content
–Try new marketing channels and track closely
Nurture existing database – but also cleanse!

© 2011 Bulldog Solutions. All rights reserved. www.bulldogsolutions.com
On LinkedIn:
SummaryFinancial ViewIntegrated and Aligned ProcessesConversion Rates Rule!

On LinkedIn:
Thank You For Your Time!
Terry FlahertyVP of Strategy and Best PracticesBulldog [email protected]@Tflaherty
Jon VlockDirector of Client Marketing Strategy, UBM [email protected]