how to do beps compliant qualitative and quantitative vca? · marketing intangibles step 5....
TRANSCRIPT

tpa-global.comTaking control of the future1 Taking control of the future tpa-global.com
How to do BEPS compliant qualitative and quantitative VCA?
Marc Zaal, Partner, TPA Global
September 19, 2019

tpa-global.comTaking control of the future2 tpa-global.com
Contents
1. Introduction
2. Value Chain Analysis
3. Qualitative VCA
4. Quantitative VCA
5. Regulatory Anchor
6. Industry Anchor
7. BEPS Compliant Anchor

tpa-global.comTaking control of the future3 Taking control of the future tpa-global.com
Introduction

tpa-global.comTaking control of the future4
BEPS has changed the Tax World

tpa-global.comTaking control of the future5 Staying out of trouble
Fully in control
Financial data Analytics
using software
6
5
4
3
2
1
Determining tax (CIT, VAT, MF,
CbC) compliance
Risk Planning & Provisioning, ETR impact (APAs, tax
rulings)
Align governance and operational conduct (RACI
design)
Manage in-house challenges (HR, IT
and succession planning)
Clear/efficient communication to stakeholders
Tax risk management – a holistic approach

tpa-global.comTaking control of the future6
Economic Reality
Financial Reality Legal Reality
Operating Model
Corporate Governance
Move from Pre to Post BEPSPost BEPS
Value ChainAnalysis
Pre BEPSFunctional Analysis
Finance/Tax/TP Model
Tax risk management – a pragmatic approach

tpa-global.comTaking control of the future7 Taking control of the future tpa-global.com
Value Chain Analysis
tpa-global.comTaking control of the future8 tpa-global.com
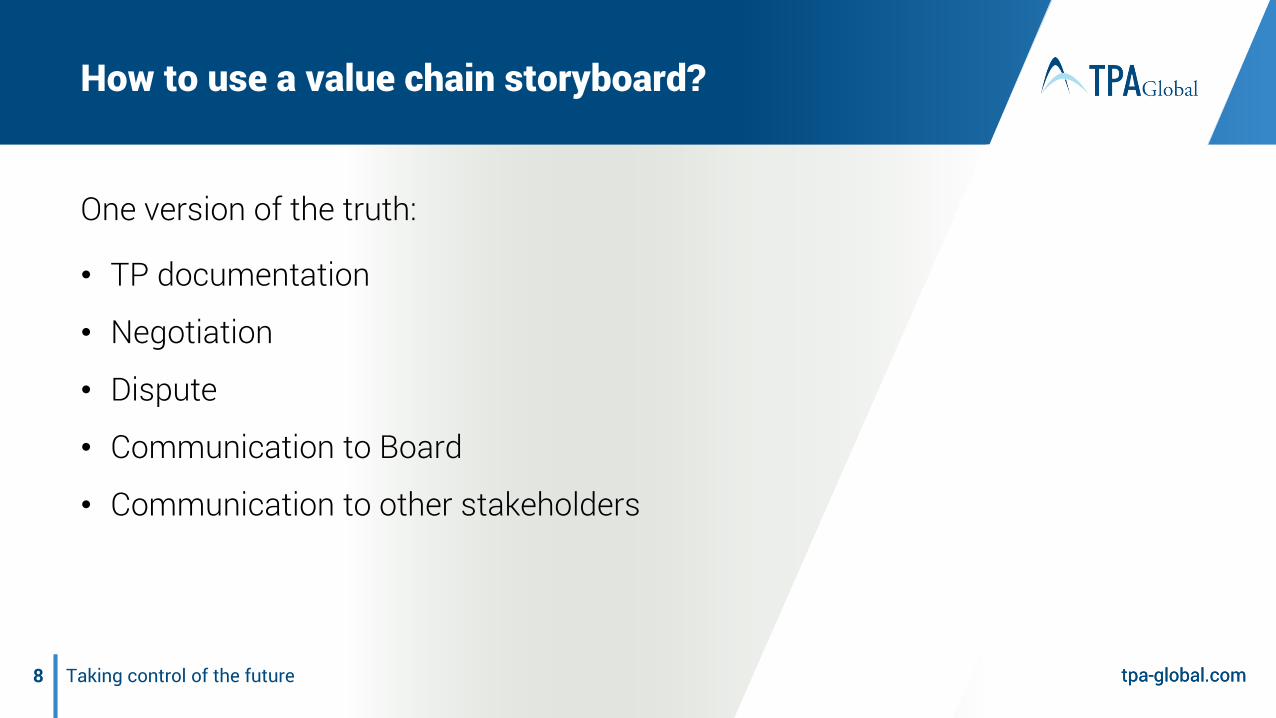
One version of the truth:
• TP documentation
• Negotiation
• Dispute
• Communication to Board
• Communication to other stakeholders
How to use a value chain storyboard?

tpa-global.comTaking control of the future9 Taking control of the future tpa-global.com
Qualitative VCA
tpa-global.comTaking control of the future1 0
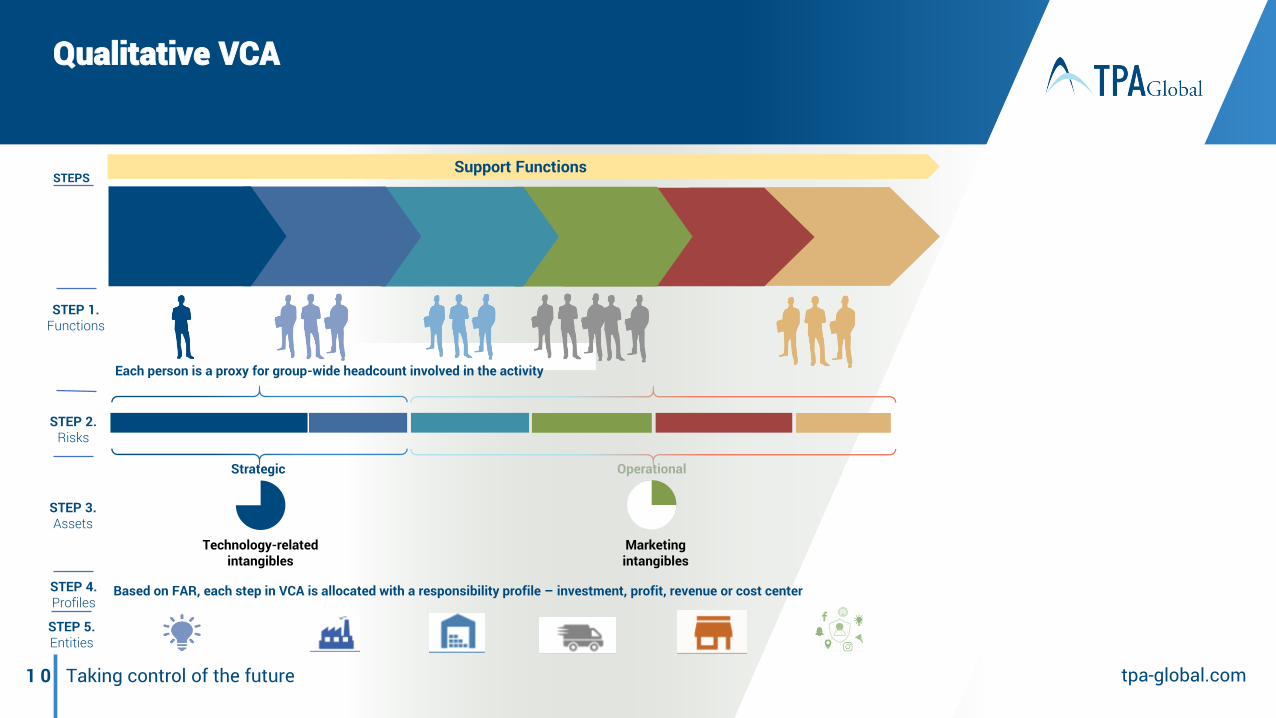
Qualitative VCA
STEPS
Each person is a proxy for group-wide headcount involved in the activity
STEP 1.Functions
STEP 2.Risks
STEP 3.Assets
Strategic Operational
Technology-relatedintangibles
Marketingintangibles
STEP 5.Entities
Support Functions
STEP 4.Profiles
Based on FAR, each step in VCA is allocated with a responsibility profile – investment, profit, revenue or cost center

tpa-global.comTaking control of the future1 1
VCA Technique 1:How to analyze and align the operating model
Alignment Between Gross Margin, Operating Margin, and F T E sIllustrative
Misalignment is visible when expressed as the ratio of country and total group for gross margin, operating margin, andFTEs. The higher the delta, the greater the need to provide explanations to the Tax authorities.
Gross Margin (GM) Rat ioCountry GM to Total Group GM
Operat ing Margin (OM) Rat ioCountry OM to Total Group OM
Ful l T ime E m ploy e e ( F T E ) Rat ioCountry FTEs to Total Group FTEs
The Netherlands
33%
Germany19%
China17%
United Kingdom
31%
The Netherlands
60%
Germany5%
China5%
United Kingdom
30%
The Netherlands
6%Germany
13%
UK23%
China58%

tpa-global.comTaking control of the future1 2
VCA Technique 2:Basic Approach to divide the residual profit
Legal Entities
Residual: Other: Cost Plus: Cost Plus or Percentage of Operating Margin:
IP Owner Match making
Finance Activities (cash pool)
Contract manufacturing Contract R&D
Local sales or marketingoffices
Support Services (admin, legal, HR etc.)
Starting PointDetermine EBIT%
Key People FunctionsAllocation of EBIT% Allocation of People
Functions and EBIT%
Residual
Investment Center Profit Center✓Capital market/customer driven activities✓Mostly performed for stakeholders/MNE as a whole✓Core Activitye.g.., IP Owners
✓Capital market/customer driven activities✓Mostly performed for external customers✓Mostly coree.g.., Distribution Centers
DEMPE Functionso + Filter Match-Making
Source: TPA Global. - a Development Enhancement Maintenance Protection Exploitation Functions.

tpa-global.comTaking control of the future1 3 Taking control of the future tpa-global.com
Quantitative VCA
tpa-global.comTaking control of the future1 4
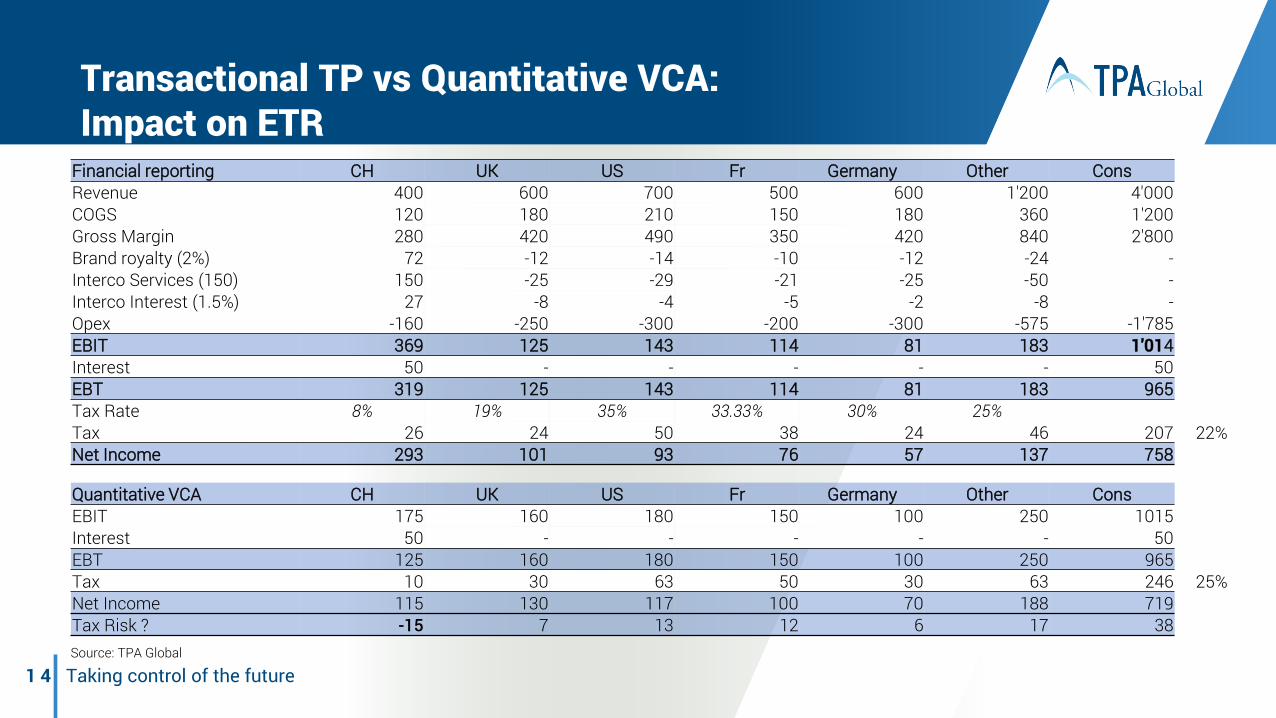
Financial reporting CH UK US Fr Germany Other ConsRevenue 400 600 700 500 600 1'200 4'000COGS 120 180 210 150 180 360 1'200 Gross Margin 280 420 490 350 420 840 2'800 Brand royalty (2%) 72 -12 -14 -10 -12 -24 -Interco Services (150) 150 -25 -29 -21 -25 -50 -Interco Interest (1.5%) 27 -8 -4 -5 -2 -8 -Opex -160 -250 -300 -200 -300 -575 -1'785EBIT 369 125 143 114 81 183 1'014Interest 50 - - - - - 50 EBT 319 125 143 114 81 183 965 Tax Rate 8% 19% 35% 33.33% 30% 25%Tax 26 24 50 38 24 46 207 22%Net Income 293 101 93 76 57 137 758
Quantitative VCA CH UK US Fr Germany Other ConsEBIT 175 160 180 150 100 250 1015Interest 50 - - - - - 50EBT 125 160 180 150 100 250 965 Tax 10 30 63 50 30 63 246 25%Net Income 115 130 117 100 70 188 719 Tax Risk ? -15 7 13 12 6 17 38 Source: TPA Global
Transactional TP vs Quantitative VCA: Impact on ETR
tpa-global.comTaking control of the future1 5
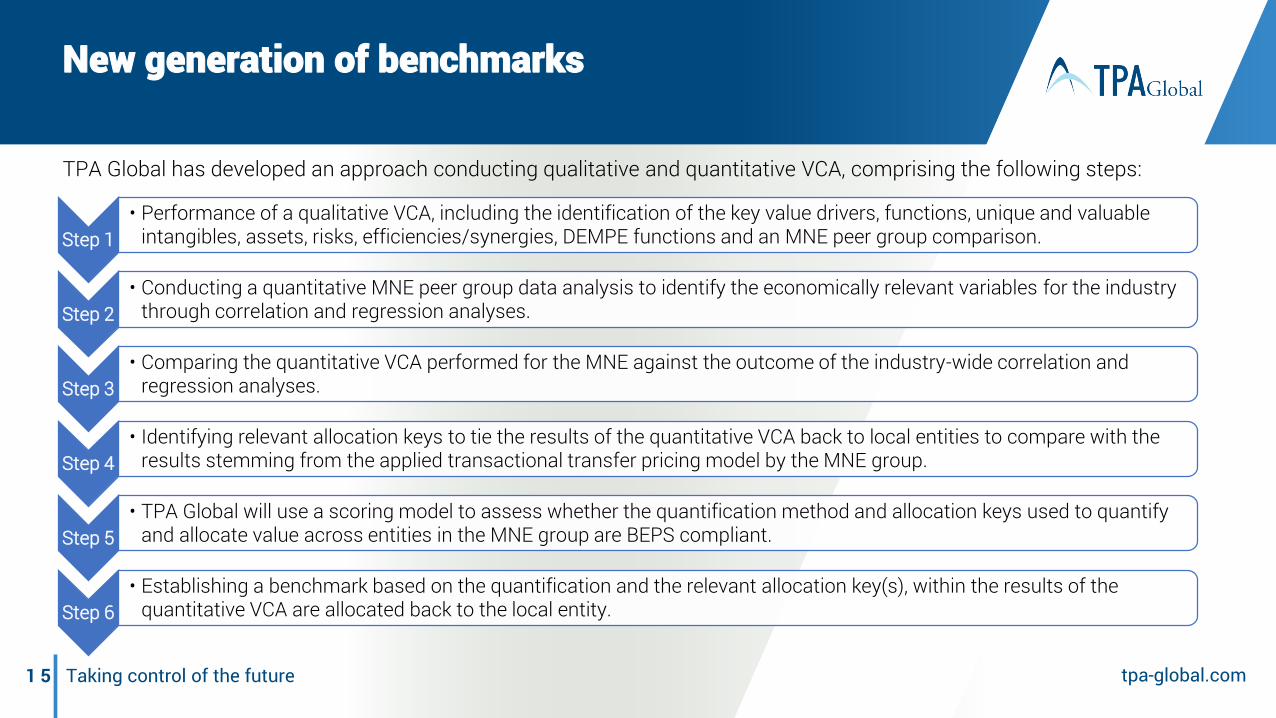
New generation of benchmarks
Step 1• Performance of a qualitative VCA, including the identification of the key value drivers, functions, unique and valuable
intangibles, assets, risks, efficiencies/synergies, DEMPE functions and an MNE peer group comparison.
Step 2• Conducting a quantitative MNE peer group data analysis to identify the economically relevant variables for the industry
through correlation and regression analyses.
Step 3• Comparing the quantitative VCA performed for the MNE against the outcome of the industry-wide correlation and
regression analyses.
Step 4• Identifying relevant allocation keys to tie the results of the quantitative VCA back to local entities to compare with the
results stemming from the applied transactional transfer pricing model by the MNE group.
Step 5• TPA Global will use a scoring model to assess whether the quantification method and allocation keys used to quantify
and allocate value across entities in the MNE group are BEPS compliant.
Step 6• Establishing a benchmark based on the quantification and the relevant allocation key(s), within the results of the
quantitative VCA are allocated back to the local entity.
TPA Global has developed an approach conducting qualitative and quantitative VCA, comprising the following steps:
tpa-global.comTaking control of the future1 6
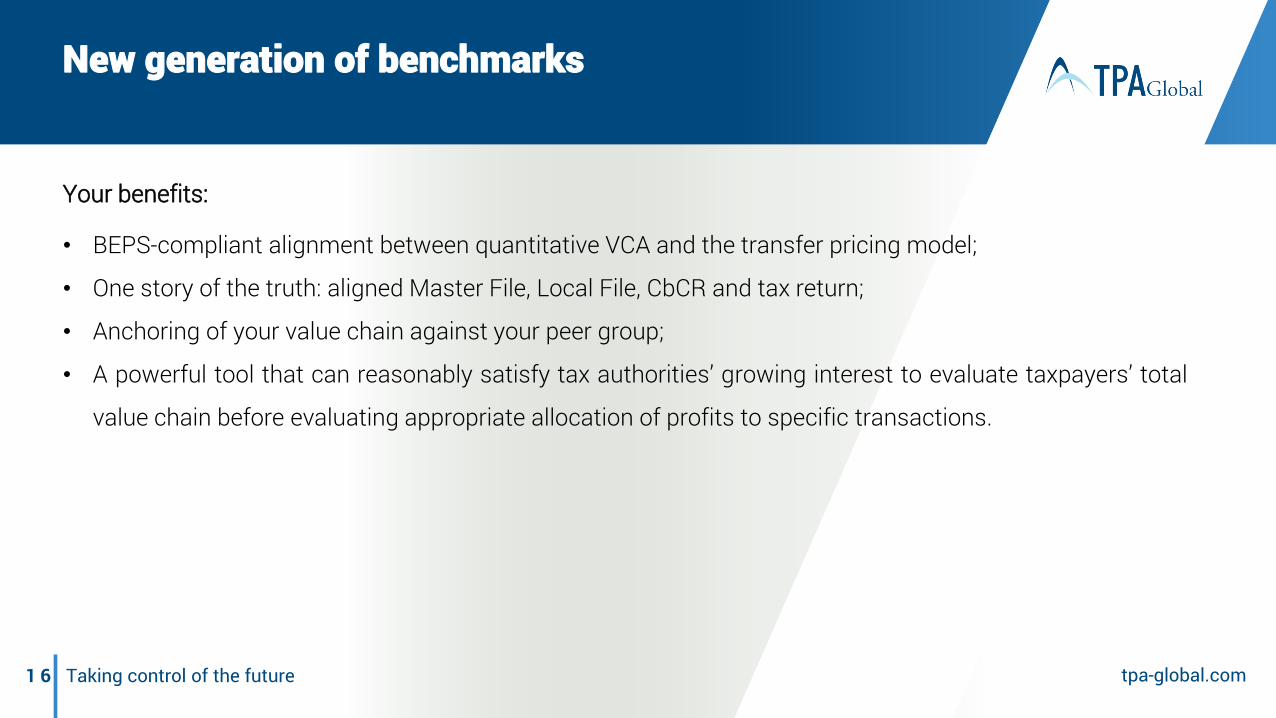
New generation of benchmarks
Your benefits:
• BEPS-compliant alignment between quantitative VCA and the transfer pricing model;
• One story of the truth: aligned Master File, Local File, CbCR and tax return;
• Anchoring of your value chain against your peer group;
• A powerful tool that can reasonably satisfy tax authorities’ growing interest to evaluate taxpayers’ total
value chain before evaluating appropriate allocation of profits to specific transactions.

tpa-global.comTaking control of the future1 7
• Quantitative VCA is presented as a corroborative method for transactional transfer pricing.
• Quantitative VCA should not be confused with a profit split method.
• TPA uses the following anchors to make VCA more objective – less subjective:
1. Regulatory anchor – countries regulations requirements;
2. Industry anchor – variables / value drivers that have an economically significant impact on yourEBIT;
3. BEPS-compliant anchor – BEPS criteria for a proper quantification of carve-outs and allocation tocountries / legal entities.
• Objectification of Quantitative VCA creates clean audit trail ready for audit and court cases.
VCA / BEPS version of Transfer Pricing –Quantitative approach

tpa-global.comTaking control of the future1 8 Taking control of the future tpa-global.com
Regulatory Anchor
tpa-global.comTaking control of the future1 9
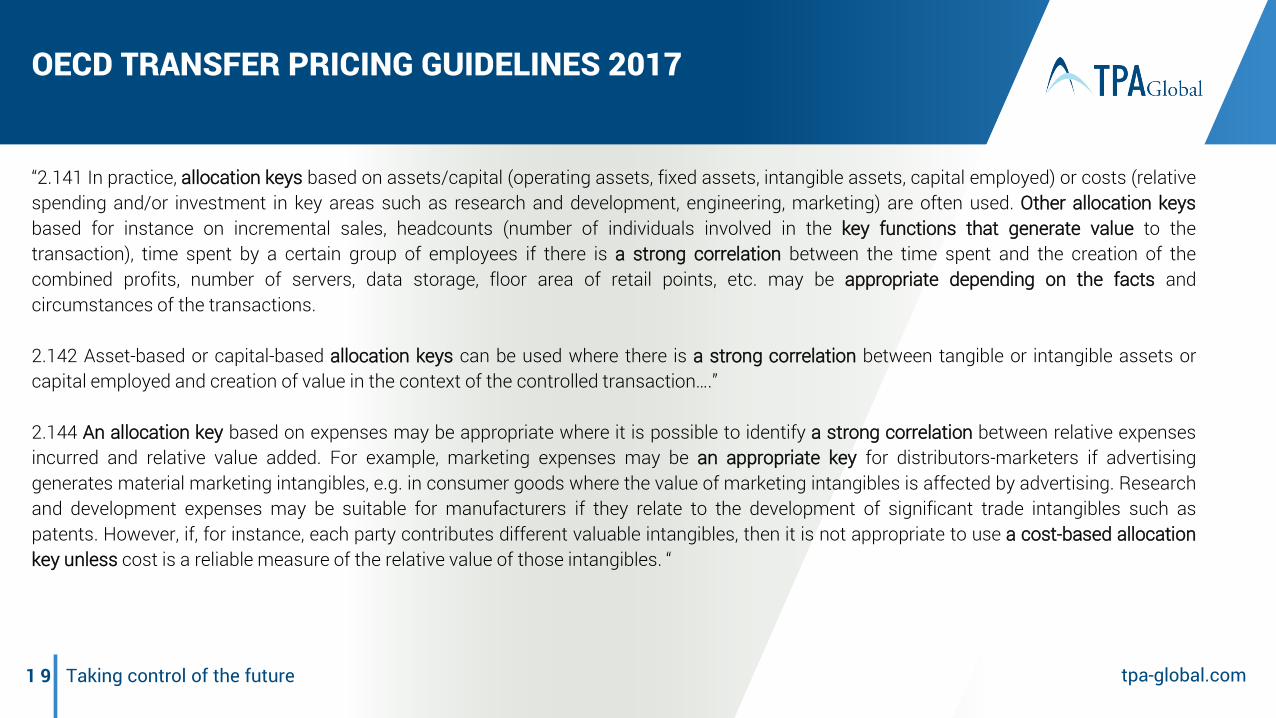
OECD TRANSFER PRICING GUIDELINES 2017
“2.141 In practice, allocation keys based on assets/capital (operating assets, fixed assets, intangible assets, capital employed) or costs (relativespending and/or investment in key areas such as research and development, engineering, marketing) are often used. Other allocation keysbased for instance on incremental sales, headcounts (number of individuals involved in the key functions that generate value to thetransaction), time spent by a certain group of employees if there is a strong correlation between the time spent and the creation of thecombined profits, number of servers, data storage, floor area of retail points, etc. may be appropriate depending on the facts andcircumstances of the transactions.
2.142 Asset-based or capital-based allocation keys can be used where there is a strong correlation between tangible or intangible assets orcapital employed and creation of value in the context of the controlled transaction….”
2.144 An allocation key based on expenses may be appropriate where it is possible to identify a strong correlation between relative expensesincurred and relative value added. For example, marketing expenses may be an appropriate key for distributors-marketers if advertisinggenerates material marketing intangibles, e.g. in consumer goods where the value of marketing intangibles is affected by advertising. Researchand development expenses may be suitable for manufacturers if they relate to the development of significant trade intangibles such aspatents. However, if, for instance, each party contributes different valuable intangibles, then it is not appropriate to use a cost-based allocationkey unless cost is a reliable measure of the relative value of those intangibles. “

tpa-global.comTaking control of the future2 0 Taking control of the future tpa-global.com
Industry Anchor

tpa-global.comTaking control of the future2 1 tpa-global.com
Industry anchor – Base data
9,80%14,37%
9,45% 9,60%11,60%
0,00%
10,00%
20,00%
RoE 2014-2016
Company 1 Company 2 Company 3 Company 4 Company 5 Company 6
84.546
527.582 313.297 414.216 315.502 404.278
-
1.000.000
Profit per FTE 2014-2016 (EUR)
Company 1 Company 2 Company 3 Company 4 Company 5 Company 6

tpa-global.comTaking control of the future2 2
Industry anchor – Relationship of variables
Source Variable 1 Variable 2 Correlation as per source
OECD Transfer Pricing Guidelines 2017Sales/Fixed assets Gross margin
If Sales/Fixed assets ratio increases=> Gross margin increases
EBIT EmployeesIf number of employees increases=> EBIT increases
Stephen L. Curtis – Journal of Forensic &Investigative Accounting (2016);S. Lee and Sang-Bum Park- A Study on theAssociation between operating leverageand risk: The case of the Airline Industry(2014)
Fixed costs/Total costs
Profit Margin(Profit before tax/Revenue)
If Fixed costs/Total costs ratio increases=> Profit Margin increases
Fixed costs/ Total costs
∆PBT/∆Revenue (risk) If Fixed costs/ Total costs ratio increases=> ∆PBT/∆Revenue (risk) increases
∆PBT/∆RevenueProfit margin(Profit before tax/Revenue)
If ∆PBT/∆Revenue ratio increases=> Profit margin increases
Ministry of Economy, Trade and Industry of Japan 2004
R&D expenditure Return on equity (ROE)If R&D expenditure increases=> ROE increases
Intangible assets SalesIf intangible assets increase=> Sales increase
Tangible assets SalesIf tangible assets increase => Sales increase

tpa-global.comTaking control of the future2 3 tpa-global.com
Industry anchor – Relationship of variablesVariable 1 (tangible assets) / Variable 2 (sales)
-
50.000.000.000
100.000.000.000
150.000.000.000
200.000.000.000
250.000.000.000
- 100.000
Millions
Sales - 2017 Linear ( Sales - 2017 )
-
50.000.000.000
100.000.000.000
150.000.000.000
200.000.000.000
250.000.000.000
- 50.000 100.000
Millions
Sales - 2016 Linear ( Sales - 2016 )
-
50.000.000.000
100.000.000.000
150.000.000.000
200.000.000.000
250.000.000.000
- 50.000 100.000
Millions
Sales - 2015 Linear ( Sales - 2015 )
-
50.000.000.000
100.000.000.000
150.000.000.000
200.000.000.000
250.000.000.000
- 40.000
Millions
Sales - 2014 Linear ( Sales - 2014 )
-
50.000.000.000
100.000.000.000
150.000.000.000
200.000.000.000
250.000.000.000
- 40.000
Millions
Sales - 2013 Linear ( Sales - 2013 )

tpa-global.comTaking control of the future2 4 Taking control of the future tpa-global.com
BEPS Compliant Anchor
tpa-global.comTaking control of the future2 5
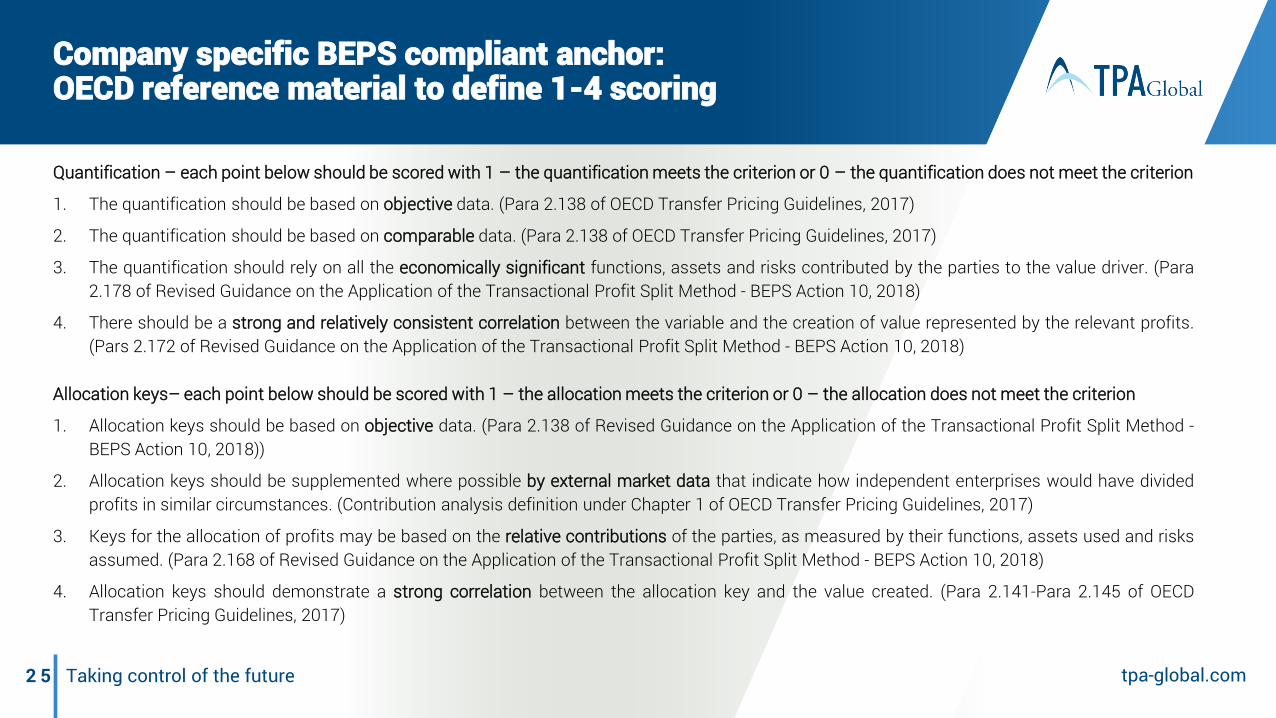
Quantification – each point below should be scored with 1 – the quantification meets the criterion or 0 – the quantification does not meet the criterion
1. The quantification should be based on objective data. (Para 2.138 of OECD Transfer Pricing Guidelines, 2017)
2. The quantification should be based on comparable data. (Para 2.138 of OECD Transfer Pricing Guidelines, 2017)
3. The quantification should rely on all the economically significant functions, assets and risks contributed by the parties to the value driver. (Para2.178 of Revised Guidance on the Application of the Transactional Profit Split Method - BEPS Action 10, 2018)
4. There should be a strong and relatively consistent correlation between the variable and the creation of value represented by the relevant profits.(Pars 2.172 of Revised Guidance on the Application of the Transactional Profit Split Method - BEPS Action 10, 2018)
Allocation keys– each point below should be scored with 1 – the allocation meets the criterion or 0 – the allocation does not meet the criterion
1. Allocation keys should be based on objective data. (Para 2.138 of Revised Guidance on the Application of the Transactional Profit Split Method -BEPS Action 10, 2018))
2. Allocation keys should be supplemented where possible by external market data that indicate how independent enterprises would have dividedprofits in similar circumstances. (Contribution analysis definition under Chapter 1 of OECD Transfer Pricing Guidelines, 2017)
3. Keys for the allocation of profits may be based on the relative contributions of the parties, as measured by their functions, assets used and risksassumed. (Para 2.168 of Revised Guidance on the Application of the Transactional Profit Split Method - BEPS Action 10, 2018)
4. Allocation keys should demonstrate a strong correlation between the allocation key and the value created. (Para 2.141-Para 2.145 of OECDTransfer Pricing Guidelines, 2017)
Company specific BEPS compliant anchor:OECD reference material to define 1-4 scoring
tpa-global.comTaking control of the future2 6
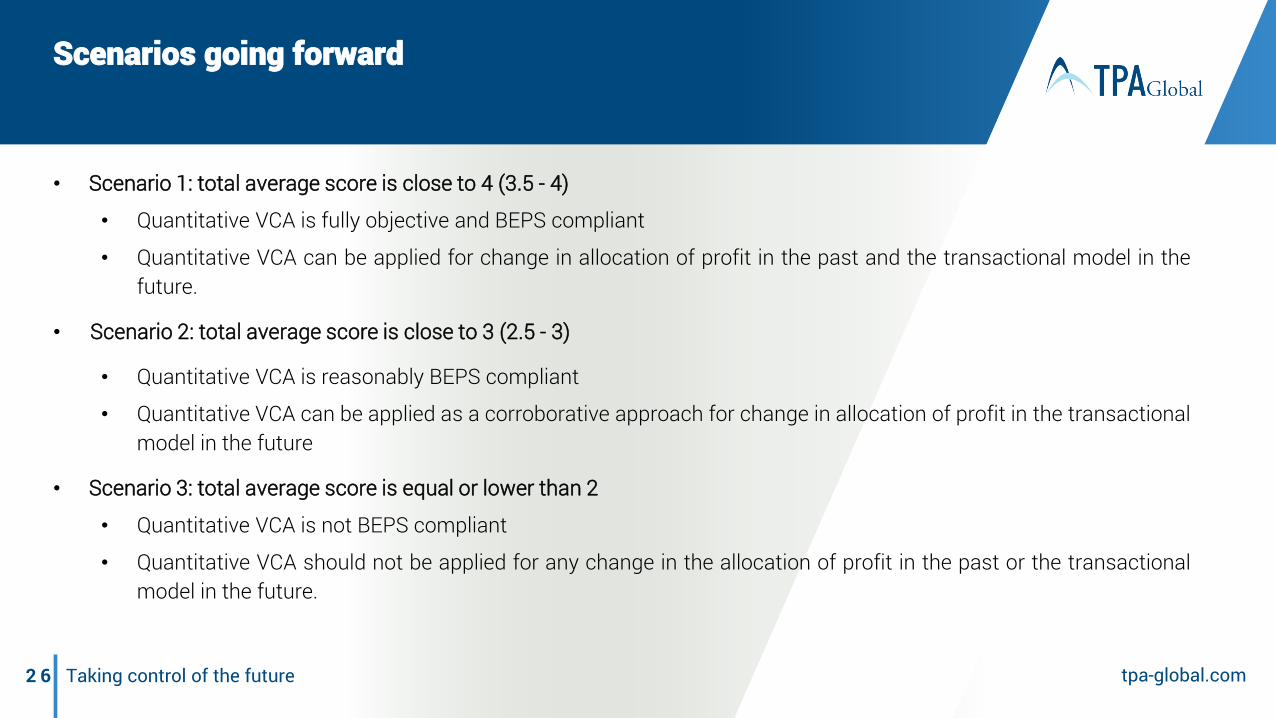
• Scenario 1: total average score is close to 4 (3.5 - 4)
• Quantitative VCA is fully objective and BEPS compliant
• Quantitative VCA can be applied for change in allocation of profit in the past and the transactional model in thefuture.
• Scenario 2: total average score is close to 3 (2.5 - 3)
• Quantitative VCA is reasonably BEPS compliant
• Quantitative VCA can be applied as a corroborative approach for change in allocation of profit in the transactionalmodel in the future
• Scenario 3: total average score is equal or lower than 2
• Quantitative VCA is not BEPS compliant
• Quantitative VCA should not be applied for any change in the allocation of profit in the past or the transactionalmodel in the future.
Scenarios going forward

2 7
TPA Global Network
TPA Global serves international businesses with integrated and value-added solutions. To ensure the highest quality and seamless service provision, thereby meeting international standards and regulations, a global network
of dedicated professionals and specialists is a key and determining factor.
https://www.tpa-global.com/professionals
TPA Global Network
2 8 Taking control of the future
TPA Global provides international businesses with integrated and value-addedsolutions in improving financial performance, operational efficiency, strategicdevelopment and talent coaching through a cross-border and cross-discipline teamof professionals which identifies the right solutions for customers and targets;efficient and streamlined advisory and implementation processes which cutthrough operational complexities across functions and borders; and superiorcustomer service and support which proactively anticipate the evolving needs ofthe clients.
H.J.E. Wenckebachweg 210 . 1096 AS Amsterdam . The Netherlands . +31 (0)20 462 3530 . tpa-global.com
The views expressed and the information provided in this material are of general nature andis not intended to address the circumstances of any particular individual or entity. The abovecontent should neither be regarded as comprehensive nor sufficient for making decisions.No one should act on the information or views provided in this publication withoutappropriate professional advise. It should be noted that no assurance is given for any lossarising from any actions taken or to be taken or not taken by anyone based on thispublication.
© 2019 Transfer Pricing Associates Holding B.V. All Rights Reserved.
tpa-global.com