how to improve - 1000 lives plus · 8. spread – how to transfer successful improvements 39 9....
TRANSCRIPT

How to Improve
www.1000livesplus.wales.nhs.uk2
AcknowledgementsThis guide has been produced by Debbie Doig-Evans, Julie Ward-Jones and Joy Whitlock. Special input has also been received from Mike Davidge.
We would particularly like to thank healthcare organisations in Wales and their teams for their work and feeding back lessons and experiences gained as a result.
1000 Lives Plus is run as a collaborative, involving the National Leadership and Innovation Agency for Healthcare, National Patient Safety Agency, Public Health Wales and the Clinical Governance Support and Development Unit.
We wish to thank and acknowledge the Institute for Healthcare Improvement (IHI), Patient Safety First and The Health Foundation for their support and contribution to 1000 Lives Plus.
Date of publicationThis guide was published in April 2010 and will be reviewed in April 2012. The latest version will always be available online on the programme’s website: www.1000livesplus.wales.nhs.uk.
The purpose of this guideThis guide has been produced to enable healthcare organisations and their teams to successfully implement a series of interventions to improve the safety and quality of care that their patients receive.
This ‘How to Improve’ guide must be read in conjunction with the following:
■ Leading the Way to Safety and Quality Improvement
Further guides are also available to support you in your improvement work:
■ How to use the Extranet
■ A Guide to Measuring Mortality
■ Improving Clinical Communication using SBAR
■ Learning to use Patient Stories
■ Using Trigger Tools
■ Reducing Patient Identification Errors
These are available from the 1000 Lives Plus office, or online at www.1000livesplus.wales.nhs.uk
Where reference is made to 1000 Lives Plus, this includes the work undertaken as part of the 1000 Lives Campaign and the second phase of this improvement programme – 1000 Lives Plus.
We are grateful to The Health Foundation for their support in the production of this guide.
www.1000livesplus.wales.nhs.uk 3
How to Improve
Contents
1. How to Improve – an overview 4
2. Developing the Will 8
3. Guaranteed Execution - The Model for Improvement 11
4. Aims - What are we trying to accomplish? 12
5. Measurement 14
6. What changes can we make that will result in an improvement? 30
7. PDSA cycles – How to test your changes robustly 34
8. Spread – How to transfer successful improvements 39
9. Reliability – How to make your improvement deliver day in day out 42
10. Tools and Checklists 47
11. Glossary 67
1000 Lives Plus 14 Cathedral Road, Cardiff CF11 9LJ | Tel: (029) 2022 7744Email: [email protected] | Web: www.1000livesplus.wales.nhs.ukTwitter: www.twitter.com/1000livesplus

How to Improve
www.1000livesplus.wales.nhs.uk4
1. How to Improve – an overview
“Improvement requires a will to improve, ideas to test and execution of a plan”
Frank Federico, IHI; Doug Bonacum, Kaiser Permanante Healthcare Executive, Jan 2010
This guide aims to assist all staff involved in improvement. It is a useful tool to help you deliver successful improvements for patients and staff, at whatever level in your organisation.
If you are new to improvement projects, we strongly recommend that you read this ‘How to Improve guide’ in the order in which it is written. However, it also serves as a refresher or reference to those with previous experience of change management and improvement.
The methodology outlined in the guide applies to all improvement activities implemented within the NHS from local level to strategic programmes and should be used by all members of the team involved. The models and concepts found in this ‘How to Improve’ guide are all developed and referenced to the Institute for Healthcare Improvement (IHI).
There is a considerable amount of information available relating to improvement, and patient safety. If you would like to source further relevant information, use-ful websites include:
■ 1000 Lives Plus - www.1000livesplus.wales.nhs.uk
■ The Institute for Healthcare Improvement – www.ihi.org.
■ NHS Institute for Innovation and Improvement – www.institute.nhs.uk
■ National Patient Safety Agency (NPSA) – www.npsa.nhs.uk
■ The Health Foundation – www.health.org
■ Associates in Process Improvement – www.apiweb.org
A successful improvement programme involves careful planning and testing to determine if it is to be successful. You make modifications as needed and re-test to ensure your ideas are sound before implementing over time.
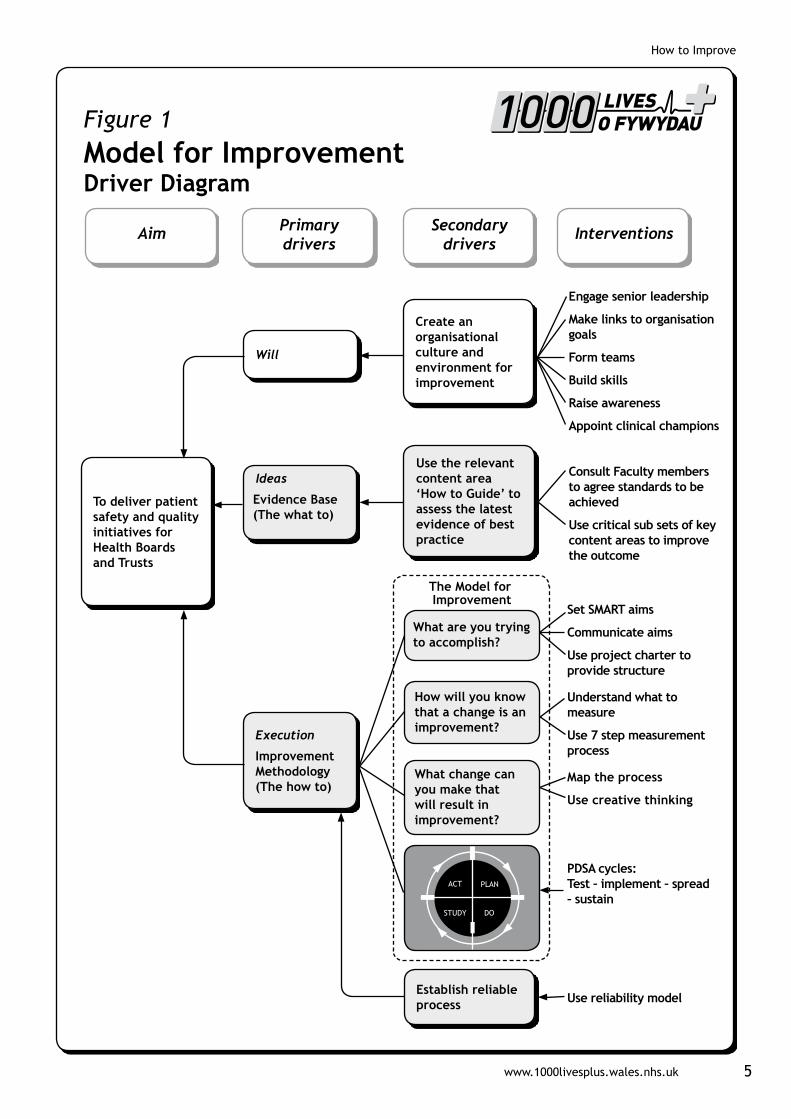
In any improvement initiative you need to succeed in three areas. You need to generate the Will to pursue the changes despite difficulties and competing demands on time and resources. You need the good Ideas that will transform your service, and finally you need to Execute those ideas effectively to achieve the improvement required. The way that these various components fit together is illustrated in Figure 1.
www.1000livesplus.wales.nhs.uk 5
How to Improve
To deliver patient safety and quality initiatives for Health Boards and Trusts
Aim Primary drivers
Secondary drivers
Interventions
Figure 1Model for ImprovementDriver Diagram
Ideas
Evidence Base (The what to)
Use the relevant content area ‘How to Guide’ to assess the latest evidence of best practice
Execution
Improvement Methodology (The how to)
Establish reliable process
Will
Create an organisational culture and environment for improvement
The Model for Improvement
Engage senior leadership
Make links to organisation goals
Form teams
Build skills
Raise awareness
Appoint clinical champions
Consult Faculty members to agree standards to be achieved
Use critical sub sets of key content areas to improve the outcome
Set SMART aims
Communicate aims
Use project charter to provide structure
Understand what to measure
Use 7 step measurement process
Map the process
Use creative thinking
PDSA cycles: Test – implement – spread – sustain
Use reliability model
What are you trying to accomplish?
How will you know that a change is an improvement?
What change can you make that will result in improvement?

How to Improve
www.1000livesplus.wales.nhs.uk6
Achieve breakthrough goals
Provide leaders for large system projects
Spread and sustain
Provide day-to-day leaders for micro systems
Manage local improvement
Develop human resources
WillThe interventions you need to build Will are explained within the ‘Leading the Way to Safety and Quality Improvement’ guide and also in section 2 of this guide. They concentrate on raising the commitment levels for change and then providing the project structure to underpin improvement approaches. Achieving results at the system or organisational level requires Will at all levels but especially at top management.
IdeasThere are many sources for ideas. Some of the evidence base to draw on for your improvement programme is to be found in the ‘How to Guides’ on the various content areas associated with 1000 Lives Plus. Methods and techniques for generating new ideas or innovative ways to implement the evidence are discussed in Section 6, which also references other improvement literature.
ExecutionThe Institute for Healthcare Improvement have concluded from their programmes and research that execution is the ‘weak link’ in this three-part chain. They recommend a key framework to deliver effective improvements called the Model for Improvement. This ‘How to Improve’ guide covers the model and the associated interventions outlined in the driver diagram in sections 3 to 7. Successful improvement projects all have clear aims, robust measurement and well tested ideas. Use this guide to ensure your projects have all three of these attributes.
Successful execution requires actions at all levels in the organisation and so we have included Nolan’s execution model, see Figure 2.1
Figure 2 Execution Mode

www.1000livesplus.wales.nhs.uk 7
How to Improve
www.1000livesplus.wales.nhs.uk 7
Nolan writes:
“We know that quality and safety occupy a prominent place in the strategic plans of many health care organisations. However, a common organisational response to this emphasis on quality and safety is a long list of worthwhile projects and measures that are not well coordinated, let alone capable of achieving system-level results. You have to have the will to improve, you have to have ideas about alternatives to the status quo, and then you have to execute those ideas reliably and robustly to make the change real and sustainable.”
Nolan requires organisations to fulfill three criteria to produce system level results:
1. At Board level the organisation will aim to deliver system level improvement by aligning strategic vision with improvement aims, managing both human and financial resources to do so. These are the organisational outcomes or Primary Drivers.
2. At the middle management level each relevant leader will manage a portfolio of improvement projects, each aligned accordingly to move the larger organisational outcomes. These are the interventions or Secondary Drivers.
3. The organisation will build a sufficient number of employees capable of leading improvement initiatives and provide supervisors capable of quality based management to support them.
Finally, you need your improvements to stand the test of time and to be able to be spread to other parts of your organisation. Sections 8 and 9 cover these subjects.
References1 Nolan TW. Execution of Strategic Improvement Initiatives to Produce System-Level
Results. IHI Innovation Series white paper. Cambridge, MA: Institute for Healthcare Improvement; 2007. (Available on www.IHI.org).

How to Improve
www.1000livesplus.wales.nhs.uk8
2. Developing the Will
Achieving results at the system or organisational level requires will at all levels, but especially at top management to make a new way of working attractive and the status quo uncomfortable. The new system will require new ideas about how work gets done, how relationships are built, and how patients participate in their care. Some of these ideas may come from sources internal to the organisation, but many will come from outside. For example, many tools and techniques come from the airline industry, which obviously has a need for robust safety systems. However, no single initiative or set of unaligned projects will likely be enough to produce system-level results.
For those engaged or about to embark on an improvement effort, harnessing will at all levels, but especially that of senior leadership, will be crucial before the project begins.
2.1 Engaging senior leadership:
Any improvement process should be driven by leadership, with a commitment to providing adequate resources and attention to the initiative. This is also important as changing practice requires a change in organisational culture and attitudes. The culture within an individual organisation, or even at the local level of a department or patient care unit, develops through the explicit and implicit messages employees receive. The actions of leaders strongly influence employee beliefs as to what leaders consider important, even more so than what is actually said. This includes not only what leaders do, but also what they do not do. Visible support for your work at a senior level sends a powerful message to all staff that finding ways to implement this intervention is important.
2.2 Link your work to a system level organisation goal
Leaders must make patient safety and quality of care strategic priorities in order for any improvement team to be successful. In order to execute the improvement initiative, strategic aims and goals are given as portfolios of work at the ‘meso’ or middle management layer which in turn translate to specific projects, which, when completed together impact on the overall outcome aim.
For example, every Chief Executive in Wales voluntarily signed up to the 1000 Lives Campaign to reduce needless deaths and reduce harm. Each content area within the Campaign is designed to achieve that outcome, such as reducing surgical errors, hospital acquired infections and medication errors. The reliable delivery of each intervention as an individual project within those content areas will cumulatively impact on the overall aim of the content area and the overall outcome measure for the organisation, namely the reduction of adverse events.
Once leaders have publicly given recognition and support (e.g. financial resource, person-time) to the programme, each organisation will have its own methods for selecting a core team to lead implementation.
TOOL: A Driver Diagram helps make the links between organisational priorities and your own improvement ideas. See section 10.

www.1000livesplus.wales.nhs.uk 9
How to Improve
2.3 Form a multi-disciplinary implementation team
No one person can create system level improvements. When forming the team you should aim to keep the number to a minimum; the more people in the team, the more difficult it is to communicate quickly and effectively, achieve consensus and coordinate activity.
A team will help generate ideas and co-ordinate the interventions, as well as review the process and outcome data. Teams should be diverse in make-up, but uniform in mindset. The value of bringing varied personnel together is that all members of the team are given a stake in the outcome and work to achieve the same goal. All the stakeholders in the process must be included in order to gain the buy-in and cooperation of all parties.
Some suggestions to attract and retain excellent team members include using data to define and solve the problem, and working with those who really want to work on the project. Appointing a local content specialist or ‘process owner’ who has responsibility for the functioning of the process and the knowledge in the relevant area to oversee the effective implementation of the improvement helps to maintain the integrity of the effort.
‘Sub-teams’ may also be required to work on specific components of your improvement programme.
2.4 Appoint clinical champions
TOOL: Develop a Project Charter, which will enable you to identify key roles for your improvement team. See section 10.
The team needs encouragement and commitment from an authority in the field. Champions can increase wider motivation to succeed by maintaining enthusiasm. When measures are not improving fast enough they can also address problems and help to keep everybody on track toward the aims. Their persuading and influencing skills will help get others on board when you move to implementation and spread phases.
TIP: Section 10 provides a framework for engaging clinicians.
2.5 Raise awareness and provide training
There will be those on your improvement journey who do not have the same level of Will and do not want to participate in ideas generation, altering the status quo or executing change. Fear of change is a common barrier as any change can be difficult; the antidote to fear is knowledge. We recommend providing education and training prior to your improvement venture getting underway to mitigate this. Share knowledge about the deficiencies of the present process and optimism about the potential benefits of a new process using the following:
How to Improve
www.1000livesplus.wales.nhs.uk10
■ Equip yourself with the knowledge and skills required to answer potential queries about the intervention and begin testing the changes.
■ Assess where you stand presently. Is there a process in place? If so, work with staff to begin preparing for changes.
■ Organise an educational programme. Teaching the core principles to staff will open many people’s minds to the process of change.
■ Introduce the interventions to the staff. Previous improvement initiatives have not been successful when organisations have failed to communicate with staff about the importance of the interventions or failed to provide ongoing teaching as new staff become involved in the process.
TOOL: Barrier analysis helps to identify problem areas. See Section 10 for a list of tools and what job they do.
TOOL: DICE Score. Use a DICE (Duration, Integrity, Commitment, Effort) score to calculate the probability of a project being successful. See section 10 for how to calculate the score.
TIP: The Greenhalgh Criteria helps you to check that you are stacking the cards in your favour.1,2 See Section 10.
References1 Sustainability Model. Institute for Innovation and Improvement
www.institute.nhs.uk/sustainability_model/general/welcome_to_sustainability.html
2 Gozzard, D., Willson, A. (December 2009) Intelligent Targets for Wales. Faculty for Healthcare Improvement

www.1000livesplus.wales.nhs.uk 11
How to Improve
3. Guaranteed Execution - The Model for Improvement
The Model for Improvement was developed by Associates for Process Improvement (www.apiweb.org) to provide a framework around which to structure improvement activity to ensure the best chance of achieving your goals and wider adoption of ideas.
The model is based on three key questions, known as the thinking components, which are then used in conjunction with small scale testing, the doing component known as Plan-Do-Study-Act cycles (PDSA).
TOOL: A Project Charter will help you to explicitly state your aims and help you plan. See section 10.
Figure 3 Model for Improvement
Details of how to answer the above three questions are expanded in sections 4-6
What are we trying to accomplish?
How will we know that a changeis an improvement?
What change can we make that will resultin improvement?
How to Improve
www.1000livesplus.wales.nhs.uk12
4. Aims - What are we trying to accomplish?
“Some is not a number. Soon is not a time.”
5 Million Lives Campaign, Institute for Healthcare Improvement
Having established that there is a problem with existing processes, participants and other stakeholders involved in the improvement effort need to agree on what is to be accomplished. This is the first question in the Model for Improvement.
The use of a well written aim statement is an effective tool for answering the first question in the Model for Improvement. It provides a goal for the improvement effort that will guide and keep the team focused.
Make sure your aim is SMART
Whether your improvement work is a formal initiative aligned to the organisation’s strategic requirements or a local project; setting an aim that is Specific, Measureable, Achievable, Realistic and Timely (SMART) gives the team a clear direction to work towards.
Criteria for setting aims:
■ State the aim clearly. Achieving agreement on the aim of a project is critical for maintaining progress. Good aim statements are clear, concise, and results orientated. Make sure that the aim statement describes the system to be improved and the population it relates to.
■ Include numerical goals that require fundamental change to the system. Teams are more successful when they have unambiguous, focused aims. Setting numerical goals clarifies the aim, helps to create tension for change, directs measurement and focuses initial changes. Including numerical goals not only clarifies the aim but also helps team members begin to think about what their measures of improvement will be, what initial changes they might make and what level of support they will need.
■ Set stretch goals. A “stretch” goal is one to reach for within a certain time. Setting stretch goals such as “Reduce Adverse drug events by 50% within 12 months” communicates immediately and clearly that maintaining the status quo is not an option.
■ Avoid aim drift. Once the aim has been set, the team needs to be careful not to back away from it deliberately or “drift” away from it unconsciously. Start each team meeting with an explicit statement of aim.
www.1000livesplus.wales.nhs.uk 13
How to Improve
TIP: Be prepared to refocus the aim. Every team needs to recognise when to refocus its aim. For example, one team looking to reduce their adverse drug events by 50% realised this was unattainable so took a transitional, stepped approach, rather than trying to achieve transformational change.
Example of an improvement aim statement:
“We will achieve 95% compliance with the ventilator care bundle for all ventilated patients in the critical care unit within 1 year.”
Summary
Prepare the ground by creating and harnessing the will.
Gain senior leadership support: Align your improvement task with the strategic quality priorities of the organisation.
Form a multidisciplinary team: Use the ‘Engaging Physicians’ strategy (section 10).
Raise awareness: Training.
Answer the first question of the Model for Improvement: “What are we trying to accomplish?”
Create your project charter: (see section 10) to share your vision, explicitly state your aims and begin to plan what success will look like and how you will know you’ve achieved it.
Use PDSA cycles to test small scale changes.
How to Improve
www.1000livesplus.wales.nhs.uk14
5. Measurement
“Seek usefulness, not perfection, in the measurement.”
Nelson et al., Building Measurement and Data Collection into Medical Practice; Annals of Internal Medicine; 15 March, 1998; Volume 128 Issue 6; Pages 460-466.
5.1 How will we know that a change is an improvement?
Criteria or measures need to be identified to answer the second question of the Model for Improvemnt. Successful measurement is a cornerstone of successful improvement. Measurement doesn’t have to be difficult or time-consuming. The key is to pick the right measurements, so that you can see results quickly and adapt your interventions accordingly, putting less strain on resources and more focus on outcomes.
To make effective changes you have to be observant. You need to notice what is occurring before the change and what is different after the change.
The use of data plays an essential role in moving from a ‘trial and error’ approach to a ‘trial and learning’ one, and the collection and analysis of data are important to support the improvement journey.
Data can be described as the documentation of an observation or a measurement. Observational data is valuable but has limitations within the improvement field:
■ Recent observations tend to be clearer in our minds than observations from the distant past
■ Our minds sometimes see what we want or expect (i.e. create a bias) rather than what is actually occurring
Improvement teams learn better from data based on measurement than on observation.
5.2 How are data used?
Data are used to focus improvement efforts. The act of measurement itself can often move things toward the desired result or produce the Hawthorne effect, but this is not enough to achieve sustained improvement.1
Measurement can show us a number of important pieces of information:
■ how well our current process is performing
■ whether we have reached our goal
■ how much variation is in our data/process
■ whether the changes have resulted in an improvement
■ whether a change has been sustained.
The key premise of question two of the Model for Improvement is to identify whether the change is an improvement. This is using measurement for learning and not for judgement, accountability or comparison.

www.1000livesplus.wales.nhs.uk 15
How to Improve
Table 1
Some of the key differences between data used for improvement, comparison (or accountability) and research.
Aspect Improvement Comparison or Accountability
Clinical research
Aim Improvement of care
Comparison, choice, reassurance, spur for change
New knowledge
Methods
Test Observability Test observable No test, evaluate current performance
Test blinded
Bias Accept consistent bias
Measure and adjust to reduce bias
Design to eliminate bias
Sample size “just enough” data, small sequential samples
Obtain 100% of available, relevant, data
Just in case data
Flexibility of hypothesis
Hypothesis flexible, changes as learning takes place
No hypothesis Fixed hypothesis
Testing strategy Sequential tests No tests One large test
Determining if change is an improvement
Run or Shewhart charts
No change focus Hypothesis tests (T-tests, F-tests, Chi-square) p-value
Confidentiality data
Data used only by those involved in the improvement
Data available for public consumption
Research subjects’ identities protected
Table 1 Adapted from: The Three Faces of Performance Measurement: Improvement, Accountability and Research.2
Accountability data (often referred to as data for judgement) will identify if a process is not performing well but will not determine the area for improvement, i.e. what change needs to be made to improve the performance. (This is question three of the Model for Improvement covered in the next section.)
Improvement teams need to ensure that accountability data is not mixed up with improvement data as this can disengage clinicians.
Research data, which is often more clinically acceptable, is time consuming and is collated with the purpose of gathering new knowledge and therefore slow to affect improvement.

How to Improve
www.1000livesplus.wales.nhs.uk16
TIP: It is easy to overdo measurement, particularly process measures – remember “just enough” data.
5.3 Criteria for Successful Measurement
The following criteria will ‘stack the cards in your favour’ to achieve a successful measurement strategy:
1. Have a clear operational definition
2. Use the right type of measure for the job
3. Choose the appropriate statistics to plot
4. Decide how much data you need and the techniques to obtain it
5. Ensure the team understands variation
6. Plot data over time and understand how to view it
5.3.1 Have a clear operational definition
If the data are collected by different people, or differently each time, it becomes difficult to know if changes in the data are due to the changes that result from the improvement effort or are from inconsistencies in the data collection strategy. An operational definition is the term used for the consistent approach to data collection, both in terms of what and how data is obtained.
The most important thing is that once you have established these definitions, they are applied consistently. If you do change them for any reason, you will need to annotate your run chart stating what you changed about what you measure or the way that you measure it.
5.3.2 Use the right type of measure
Healthcare systems are very complex and are often interrelated. The use of one single measure as the sole means of determining improvement to a particular system is often not enough. When working to improve a system, a combination of measures, often described as a Family of Measures, are usually necessary to better assess the result of our changes on the many aspects of the system.
The three types we use in improvement work are called outcome, process and balancing measures. Thinking about measurement for improvement in terms of these measures provides a robust framework for designing a Family of Measures to learn about the changes on our system.
Outcome measures reflect the impact on the patient or system and show the end result of your improvement work. Examples within the safety arena are the rate of MRSA or the number of surgical site infection cases.
Process measures reflect the way your systems and processes work to deliver the outcome you want. Examples within the safety arena are % compliance with hand
www.1000livesplus.wales.nhs.uk 17
How to Improve
washing or the % of patients who received ‘on time’ prophylactic antibiotics.
Balancing measures reflect what may be happening elsewhere in the system as a result of the change. This impact may be positive or negative. For example if you have implemented changes to reduce operative length of stay, you also want to know what is happening to your post operative readmission rate. If this has increased then you might want to question whether, on balance, you are right to continue with the changes or not.
It is also worthwhile remembering that as well as these project level measures, which will be maintained throughout the life of the project, there are also PDSA measures. These are done for specific PDSA cycles and are on an ‘as needed’ basis, often for diagnosis and for assessment of the changes tested. These will be discussed in Section 7.
The main purpose is to see outcomes improving but how can you do that? Reliable processes are a proven way to delivering better outcomes. Processes need to be improved first to make them extremely reliable then improved outcomes will follow. Therefore, both process and outcome measures are needed, and where necessary a balancing measure.
5.3.3 Choose appropriate statistics to plot
Having decided on a topic for a measure, you now need to decide how it should be expressed. This can be as a count, a percentage or rate/ratio. The following are some guidelines to help you decide which option to use:
Use Counts when the target population does not change very much. It has the advantage of simplicity so, expressing our measure as a number is fine as long as the population remains reasonably static over time.
For example, wards may express the occurrence of infections as a number if the number of inpatients is reasonably constant.
Use Percentages when you want to make your focus more specific, or to express the problem as a proportion of your population.
For the infections example, the measure would be the percentage of patients who had a surgical site infection (SSI) that met your pre-determined criteria for such an infection. This is a move away from counting the number of infections to expressing the proportion of your patient population that has an infection. If you were counting the former, this could not be expressed as a percentage because some patients may have more than one infection and statistically that means it would be possible to end up with a number that is greater than 100%!

How to Improve
www.1000livesplus.wales.nhs.uk18
Example1. Determine the numerator: the total number of patients in the sample who
developed a SSI.
2. Determine the denominator: the total number of surgical cases (patients) in the sample
3. Calculate the actual percent of patients developing a SSI by dividing the numerator by the denominator and then multiplying the resulting proportion (ratio) by 100. Even though one patient could experience more than one SSI during the same admission or surgical procedure, this measure is a percentage not a rate. The numerator, therefore, is based on a simple question: did the patient develop a SSI? Yes or No? The measure is not concerned with how many the patient developed.
Use Rates when you want to relate the defect/s under review, such as infections, to some other factor, such as patients or bed days. If your target population varies, a simple count is not sufficient without the context. In this case the measure would be infections per 100 patients or infections per 1000 bed days. Rates are generally used for larger scale measures, to indicate levels of defects, such as hospital fall rates or organisation infection rates.
Example1. Determine the numerator: The total number of patients in the sample who
developed a SSI.
2. Determine the denominator: The total number of occupied bed days of those patients included in the sample.
3. The SSI rate is calculated by dividing the total number of SSIs occurring in the month (the numerator) by the total number of occupied bed days in the month (the denominator) and then multiplying the result by 1000 to create a SSI rate per 1000 occupied bed days.
When measuring incidents that are rare but episodic (for example, the outbreak of an infectious organism), track the time between episodes, as it will give you more useful information.
5.3.4 The right amount of data
The purpose of measurement for improvement is to increase learning and direct improvement. Measurement is not the aim, improvement is. We can conserve resources through techniques such as sampling, stratification and randomisation and by integrating measurement into daily work.
It is all too easy for improvement teams to get trapped in measurement and put off making changes until they have collected all of the data they believe they require. As shown in Table 1 an improvement team needs just enough data to make a sensible decision on next steps. Below are some techniques to help you do this:
Sampling involves deciding how much and which data we are going to collect in order to help us improve.
www.1000livesplus.wales.nhs.uk 19
How to Improve
Sometimes the number of patients or the volume of work we have available to learn from is small enough to make obtaining all of the data feasible and helpful, e.g. diabetic patients having surgery in the pilot theatre or with a specific consultant. However, when working with the potential for a great deal of measurement, e.g. the number of adverse events occurring in an organisation, sampling can be a simple and efficient way to help a team understand how a system is performing. Sampling can save time and resources whilst accurately tracking performance.
Build the data collection into the daily work of staff, instead of making it a separate project. This not only aids timely, relevant collection of data, but also reduces stress by making measurement something that’s “easy” to do.
Tip: Create data collection forms that include only the information you need and are easy to fill out. When integrating measurement into a staff member’s role, be sure to build in a contingency plan for ongoing collection should that person become unavailable.
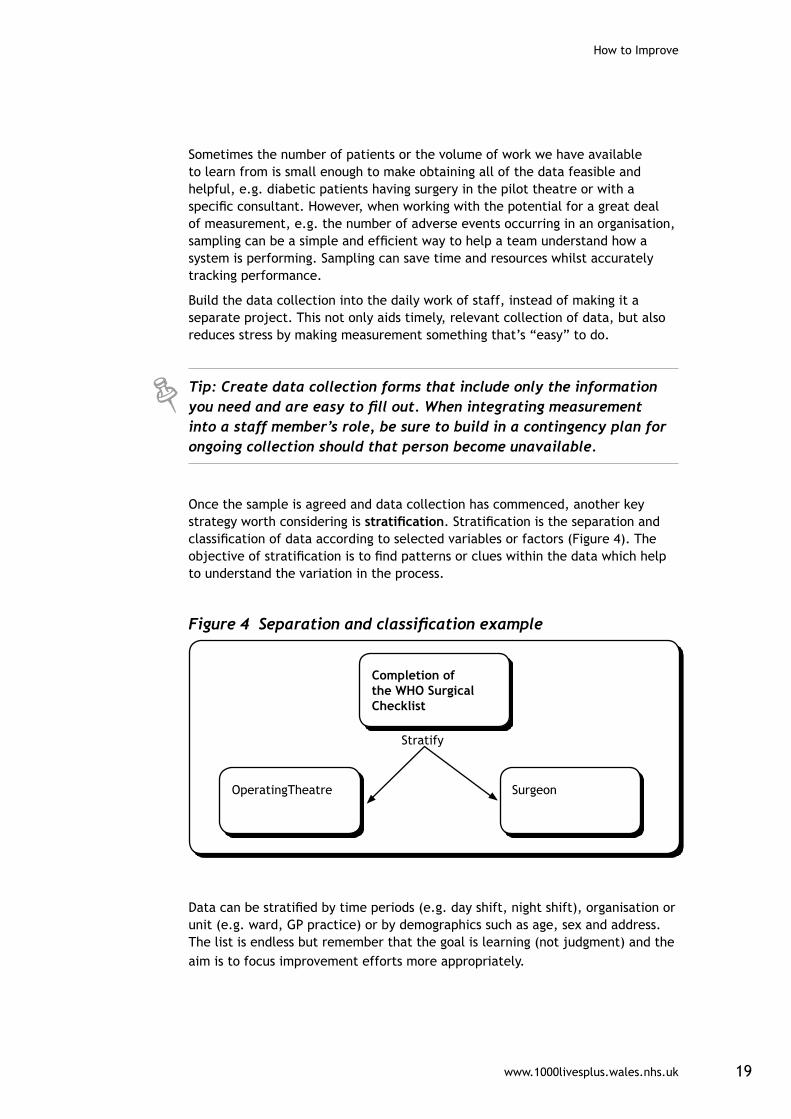
Once the sample is agreed and data collection has commenced, another key strategy worth considering is stratification. Stratification is the separation and classification of data according to selected variables or factors (Figure 4). The objective of stratification is to find patterns or clues within the data which help to understand the variation in the process.
Figure 4 Separation and classification example
Completion of the WHO Surgical Checklist
OperatingTheatre Surgeon
Stratify
Data can be stratified by time periods (e.g. day shift, night shift), organisation or unit (e.g. ward, GP practice) or by demographics such as age, sex and address. The list is endless but remember that the goal is learning (not judgment) and the aim is to focus improvement efforts more appropriately.
How to Improve
www.1000livesplus.wales.nhs.uk20
5.3.5 Ensure the team understands variation
“If I had to reduce my message for management to just a few words, I’d say it all had to do with reducing variation.”
W. Edwards Deming
How will you know that a change is an improvement?
1. By understanding the variation that lives within your data.
2. By making good decisions on your improvement choices (i.e. don’t overreact to a special cause and don’t think that random movement of your data up and down is a signal of improvement).
One of the key strategies in improvement is to control variation. Healthcare professionals often struggle with this concept as their job is to make judgments and treat the conditions of unique patients. To understand this you must differentiate between intended versus unintended variation:
Intended variation, often called purposeful, planned or guided, is an important part of effective, patient-centred health care. It is similar to the concept of variety: one size does not fit all. A clinician purposely prescribes a different dose of a drug to a child and an adult.
TIP: Be aware not all intended variation is good. For example, if it is based on clinician preference rather than good evidence.
Unintended variation is due to changes introduced into healthcare processes that are not purposeful, planned or guided. The changes often come from decisions made that affect the system, environment, supplies and management practices. It is this unintended variation that creates inefficiencies, waste, duplication, re-work, ineffective care, errors and injuries in our healthcare system.
TIP: It is by reducing the unintended variation in a process that results in improved outcomes.
Variation, as a measure of quality, can be viewed as having two types of causes: common cause variation and special cause variation.
Common causes are inherent within the system over time. They affect everyone working in the system and all outcomes of the system.
Special causes are not part of the system all the time and do not affect everyone. They arise because of specific (special) circumstances.
It is important to remember that common cause does not mean “good variation”. It only means that the process is stable and predictable.

www.1000livesplus.wales.nhs.uk 21
How to Improve
For example, if a patient’s systolic blood pressure averaged around 165 and was usually between 160 and 170 mmHg, this might be stable and predictable but completely unacceptable.
Similarly, Special Cause variation should not be viewed as “bad variation”. You could have a special cause that represents a very good result (e.g. a low turnaround time), which you would want to emulate. Special Cause merely means that the process is unstable and unpredictable.
TIP: Special causes – identify, investigate and learn! Then take action.
5.3.6 Plot data over time
Run Charts
Improvement takes place over time. Therefore, determining if improvement has really happened and if it is lasting, requires observing patterns over time. Run charts graphically display time series data, are easy to construct and simple to interpret, making them one of the single most important tools in performance improvement.
Run charts can:
■ Help improvement teams formulate aims by depicting how well, or poorly, a process is performing.
■ Help in determining when changes are truly improvements by displaying a pattern of data that you can observe as you make changes.
■ Give direction as you work on improvement and information about the value of particular changes.
Data must be displayed clearly, as analysing a run chart may be as straight forward as looking at it. This can be helped by placing the median and/or a goal line on your chart.
Figure 5
Calculating the Mean and Median averages
Median: the middle value of an ordered data set
3 5 5 7 9 9 9 10 11 11 12
Median
3 5 5 7 9 9 9 10 11 11 12 13
Median = (9 + 9) /2 = 9

How to Improve
www.1000livesplus.wales.nhs.uk22
If improvement is not visually obvious on the run chart, you can make use of some probability-based rules to analyse the run chart for non-random evidence of change (signals). The rules are:
Rule 1 – shift: 6 or more consecutive points above or below the median.
These runs indicate a shift in the process. If this is shift in the right direction it is likely that the change you made is having a beneficial effect. This is the most frequent type of change in the data that you will see.
Rule 2 – trend: 5 or more consecutive points all increasing or decreasing.
This indicates a trend and suggests that the change you made is having an effect but you don’t know yet where performance will become stable again. You need to keep measuring to find out. This situation is more likely to occur if you are rolling out a change over a period of time.
Rule 3 – runs: a non-random pattern is signalled by too few or too many runs, or crossings of the median line. A run is a series of points in a row on one side of the median. Some points fall right on the median, which makes it hard to decide which run these points belong to. So an easy way to determine the number of runs is to count the number of times the line connecting the data points crosses the median and add one.
Rule 4 – an astronomical data point: the point does not look like part of the data series or pattern, is visually abnormal, and therefore needs further investigation. Use a Statistical Process Control (SPC) chart for more clarity. (See page 23-24).
Visual displays of data, such as run charts are motivators, reality checks and validators of work already done. They don’t need to be perfect, just useful. It is important to make the connection between changes in your data and the interventions you test by making notes on your charts. We learn much more and more effectively when run charts are annotated.
Figure 6
Elements of Run chart
The centreline(CL) on a RunChart is the
Median
Mea
sure
Time

www.1000livesplus.wales.nhs.uk 23
How to Improve
TIP: The addition of a goal or target line ensures everyone viewing the graph can see at a glance how the work is progressing in relation to achieving the aim.
The simplicity of the run chart makes it one of the most important methods for communicating and understanding variation. However, if you want to further distinguish between special and common causes of variation you need to use a Statistical Process Control chart.
Statistical Process Control (SPC) chart
The construction of a SPC chart typically involves:
■ Plotting the data in time order (typically 15 – 20 data points) to establish control limits.
■ Determining some measure of the central tendency of the data for the centre line (such as the average).
■ Calculating upper and lower limits that reflect the magnitude of the variation.
Constructing a SPC chart does not have to be a complicated process. Anyone can get started by selecting a measure and plotting it on a run chart. Software is readily available to do the calculations and present the charts graphically. Figure 7 shows elements of a SPC chart.
Figure 7 Elements of a SPC chart
(UpperControlLimit)
(LowerControlLimit)
Mean
Mea
sure
Time
The SPC chart provides a basis for taking action to improve a process. A process is considered to be stable when there is a ‘random distribution’ of the plotted points within the control limits (Figure 8). For a stable process, action should be directed at identifying the important causes of variation common to all of the points.

How to Improve
www.1000livesplus.wales.nhs.uk24
Figure 8 Natural variation – a stable process
F M A M J J A S O N D J F M A M J J A S O N D
80
70
60
50
40
30
20
10
0
Special Cause Variation
If the pattern of points is not random, as determined by a signal of a special cause, the process is considered to be unstable and action should be taken to learn about the special causes of variation.
Figure 9 Graph showing special cause variation
Statistical Process Control (SPC) Charts are a means to analyse data for improvement not judgment. They are visual displays of data that enable decisions to be made based on evidence and not opinion. They help you recognise variation, evaluate underlying processes and help drive improvement.
But it is only a tool!
www.1000livesplus.wales.nhs.uk 25
How to Improve
SPC charts do not tell you:
■ The reason(s) for a Special Cause
■ Whether or not a Common Cause process should be improved (is the performance of the process acceptable?)
■ How the process should actually be improved or redesigned
Remember, data and measurement play an important part in your improvement journey but this role is a supportive one.
5.4 How can I measure for improvement?
Having explored what measurement for improvement is and the concepts involved, the next sub-section provides a practical roadmap to help you to measure.
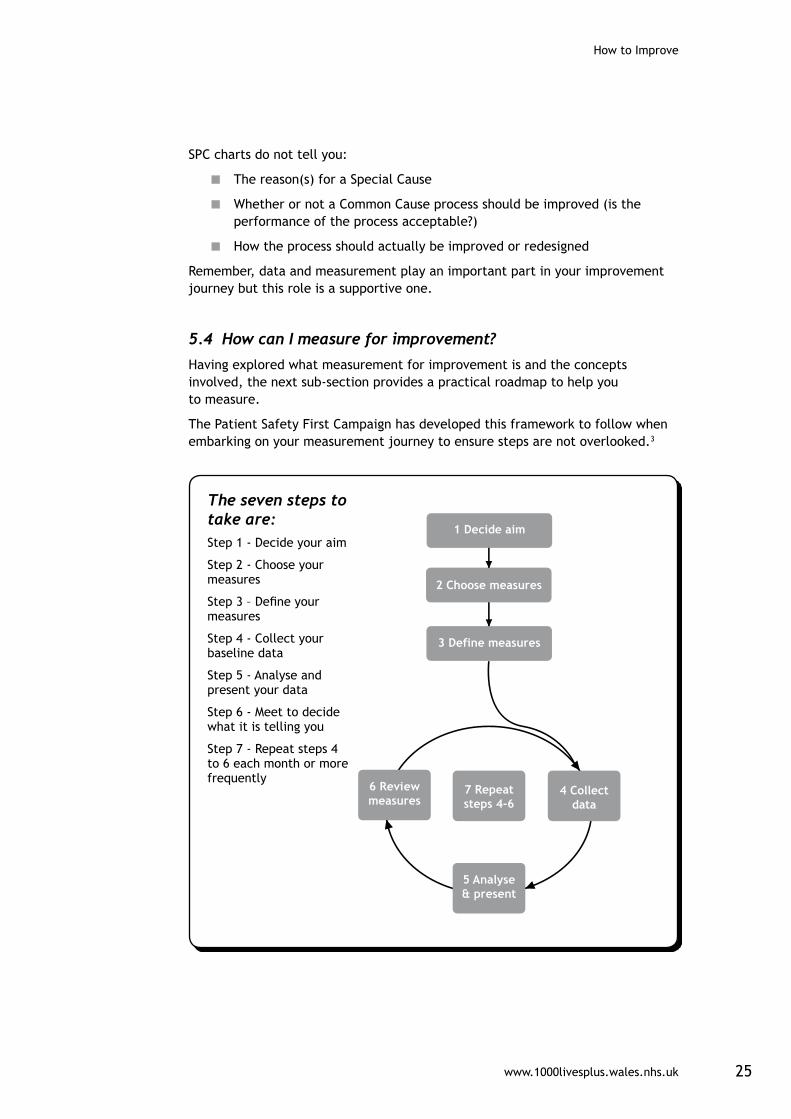
The Patient Safety First Campaign has developed this framework to follow when embarking on your measurement journey to ensure steps are not overlooked.3
1 Decide aim
2 Choose measures
3 Define measures
6 Reviewmeasures
7 Repeatsteps 4-6
4 Collectdata
5 Analyse& present
The seven steps to take are: Step 1 - Decide your aim
Step 2 - Choose your measures
Step 3 – Define your measures
Step 4 - Collect your baseline data
Step 5 - Analyse and present your data
Step 6 - Meet to decide what it is telling you
Step 7 - Repeat steps 4 to 6 each month or more frequently
How to Improve
www.1000livesplus.wales.nhs.uk26
Step 1 – Decide your aim
Refer back to Section 4 to refresh on articulating aim/goal but remember — be sure that the improvement goal or aim is:
■ Strategic
■ Relevant
■ Compelling
■ Important
■ A stretch (i.e. challenging but not unattainable)
■ Achievable
■ Unambiguous
Step 2 – Choose measures
Sections 5.3.2 and 5.3.3 outline the types of measures and statistics to help you display your data in the most effective way to assist your improvement efforts.
Remember operational definitions at this point are critical to ensure the team has a clear and unambiguous measurement plan.
Don’t waste time trying to get the perfect definition; agree one that is good enough.
For example, one hospital spent a year having discussions about how to define a ventilator associated pneumonia (VAP). If you want to know how many patients had VAP you need to be explicit about what constitutes a VAP and what does not. Sometimes these definitions can be very difficult to get consensus on.
Step 3 – Define measures
You will need to identify the data you require and where it comes from. Sometimes the data will be already collected but often you may need to set about collecting it yourself. The process of working this out helps you to define exactly what you are measuring. Sometimes you will find that it might be so complex that you need to rethink what the best measure is to ensure the data is collected reliably. It also can help you add detail to your aim statement such as what the pilot population is if you are using one.
Steps 4 to 6 – the Collect-Analyse-Review measurement cycle
Measurement itself is a process. In its simplest form it consists of three stages. First you collect some data, then you analyse it and present in an appropriate way to convert it into useful information and finally you review your information to see what decisions you need to make. The Collect-Analyse-Review or CAR cycle then starts all over again.

www.1000livesplus.wales.nhs.uk 27
How to Improve
Step 4 – Collect your data
You will need to know your baseline before you can track the progress of your goal against it. By starting your measurement and plotting points you will be able to create your baseline.
To create a baseline or identify a trend using a run chart, about 25 data points are ideal. However, 20 data points will provide a robust representation. One way to get more points is to measure more frequently. Often the data you need to measure is not being collected. If so, you should start collecting your data straight away. But you do not have to wait to start making small changes. They will not affect your overall situation so you can be doing those while creating your baseline.
Step 5 – Analyse your data
Having an excellent visual display of data makes all the difference in the data demonstrating how a process is ‘performing’, whether your changes are making improvements and how far away you are from achieving your goal. Using Run Charts is a simple way to help you analyse the data and an SPC chart will provide more context, especially in understanding variation in the process. Section 5.3.5 provides more detail.
Step 6 – Review your data to decide what it is telling you
It is vital that you set time aside to look at what your measures are telling you. The frequency with which you collect, analyse and review your data sets the pace for change for improvement.
Step 7 – Repeat steps 4 to 6
This is an iterative process. Remember that the purpose of measurement is to lead you to making the right decisions about your improvement project.
Even if you are consistently meeting your goal you should still look to see if there are further improvements that could be made. If you aimed for 0% or 100% and are meeting it reliably you should still continue to measure so that any deviations are picked up and acted upon quickly. In these cases you may decide to measure less frequently, however be aware that the process of measuring does have a positive effect in keeping awareness high and demonstrating that the goals you are measuring are important to the organisation.

How to Improve
www.1000livesplus.wales.nhs.uk28
SummarySeek usefulness, not perfection. Remember, measurement is not the goal; improvement is the goal. A team needs just enough data to know whether changes are leading to improvement
Establish a measurement plan:
Plot data over time. Tracking a few key measures over time is the single most powerful tool a team can use.
Use sampling. Sampling is a simple, efficient way to help a team understand how a system is performing.
Integrate measurement into the daily routine. Useful data are often easy to obtain without relying on information systems.
Use qualitative and quantitative data. In addition to collecting quantitative data, be sure to collect qualitative data, which often are easier to access and highly informative.
Understand the variation that lives within your data. Don’t overreact to a special cause and don’t think that random movement of your data up and down is a signal of improvement.
Use the CAR measurement cycle and seven step framework for data management.
Measures are vital for improvement and can be integrated into daily workloads:
“The main message I would want to convey is that collating the information about the quality of care we give to our patients need not be onerous — and can easily be incorporated into our usual observations of care. This information is often more meaningful and can supersede other information that has routinely been captured historically. By embedding a measurement culture, improvement changes can be applied in a more timely manner by those frontline staff who are measuring the quality of care they deliver.”
Gemma Ellis, Consultant Nurse, Critical Care, Cardiff and Vale University Health Board

www.1000livesplus.wales.nhs.uk 29
How to Improve
References1 en.wikipedia.org/wiki/Hawthorne_effect
2 The Three Faces of Performance Measurement: Improvement, Accountability and Research.” Solberg, Leif I., Mosser, Gordon and McDonald, Susan Journal on Quality Improvement. March 1997, Vol.23, No. 3
3 Clarke, J., Davidge, M., James, L. (2009). How to Guide for Measurement for Improvement. www.patientsafetyfirst.nhs.uk/ashx/Asset.ashx?path=/How-to-guides-2008-09-19/External%20-%20How%20to%20guide%20-%20measurement%20for%20improvement%20v1.2.pdf

How to Improve
www.1000livesplus.wales.nhs.uk30
6. What changes can we make that will result in an improvement?
“All improvement will require change, but not all change will result in improvement.”
Dr. Don Berwick, IHI President and CEO
By now you and your team have agreed a clear aim statement and explored which set of measures to use. It’s time to address the third question and start developing changes that will result in the improvement you want to see. All change should be thought of from the standpoint of those who will benefit.
Figure 10 Sequence of improvement
6.1 Developing a change:
“When confronted with the need for change, the first response is usually to attempt a previously tried change. More of the same (more people, money, equipment, inspection and so on) is a common response. Another problem response is to get all tied up in trying to define the perfect change…which leads to nothing being done.”1
When developing a change from the viewpoint of those who stand to benefit it is important to distinguish between the two types of change that relate to systems.1,2

www.1000livesplus.wales.nhs.uk 31
How to Improve
First order change is one that is within the current system so the system itself does not change. For example, an insertion pack may be developed for central lines or urinary catheters. The process and equipment for insertion remain the same but equipment is co-located in a pack for ease and to make the insertion process more reliable.
Second order change is one that changes the system or creates a new one. It alters how the system works and what people do. Changing a surgical technique from an abdominal incision in a general theatre to a laparoscopic procedure in day surgery or creating a new system for monitoring and maintaining peri-operative normothermia in the light of new knowledge are second order changes.
The significance of defining between first and second order change is that there are times when we only do first order change when second order change is what is really required and conversely we sometimes change the whole system when it is not really required.
Three sources from which long-term, effective improvement comes are:
1. An understanding of processes and systems of work
2. Creative thinking (looking for change outside the normal approach)
3. The appropriate use of new technology
6.2 Understanding processes and systems:
There are so many tools to help you understand your systems and processes and identify good ideas to affect the changes that will result in improvement. The links to other sources of information, such as Associates in Process Improvement3, given in Section 1 provide further reading on this subject. Here are a few to get you started:
■ Process mapping
■ Failure Modes and Effects Analysis
■ Cause and effect diagram (also known as Ishikawa and fishbone diagram)
■ Tree diagram
■ Theory of Constraints Current Reality Tree
6.3 Creative thinking:
Based on the work of Dr Edward De Bono, creativity models are a collection of techniques that are ‘serious, deliberate and systematic; designed to allow people to deliberately produce thoughts that are outside their normal thinking patterns to lead to new ideas that lead to different ways of attacking a problem or accomplishing a task. These are also called lateral thinking methods. Methods include:
■ Six thinking hats 4
■ Lateral Thinking Methods
Ò Provocations – which seek to jolt us out of old patterns of thinking to provoke and stimulate new ideas, concepts and perceptions.
How to Improve
www.1000livesplus.wales.nhs.uk32
Ò Random Entry - extremely simple to do, this method seeks to use something random, such as a word, to provide a new starting point to think from.
Ò Concept triangle - used to help generate new ideas that relate back to a particular purpose.
Further reading on this subject are to be found in Dr de Bono’s book ‘Serious Creativity’ (1992).5
6.4 Use of technology:
Technology in this instance ranges from equipment, materials, information systems and methods. This is generally advocated when second order change is required. Answering the questions in the model for improvement should help to mitigate buying into new technology for its own sake rather than to produce an improvement, but here are some other cautions to assist this decision:
1. Do not automate a bad system – this just allows errors to be made faster!
2. Technological solutions work best in stable systems rather than for fixing special causes (refer back to Section 5.3.6 - Statistical Process Control).
3. Direct changes that involve technology at a bottleneck – using technology in these areas does not address the actual bottleneck.
4. A technology that is unreliable is worse than none at all. Make sure any new technology is thoroughly tested to ensure that it is reliable before system and staff depend on its performance.
TIP: Understand the current system and then ask the three key questions in the model for improvement. These will help guide your thinking on whether you need first or second order change.
There is a formula for successful change which is often referred to as the Greenhalgh criteria. More detail is available in the Sustainability Model Guide developed by the Institute for Innovation and Improvement.1
Briefly, the attributes include:
■ Relative advantage over the present situation (what’s in it for me?)
■ Compatibility – the change must be consistent with values and culture of the organisation
■ Complexity – the target audience must be able to understand what is required to adopt the change
■ Trial-ability – people must be able to test the change first
■ Observability – people must be able to see the change as positive

www.1000livesplus.wales.nhs.uk 33
How to Improve
References1 Sustainability Model. Institute for Innovation and Improvement
www.institute.nhs.uk/sustainability_model/general/welcome_to_sustainability.html
2 Watzlawick P, Weakland J, Fisch R, Principles of Problem Formation and Problem Resolution. Norton, New York, (1974).
3 Associates in Process Improvement (2007).
4 DeBono E, Six Thinking Hats. Mamaroneck, New York, The International Centre for Creative Thinking, (1985).
5 DeBono E, Serious Creativity. Harper Business, New York, (1992).

How to Improve
www.1000livesplus.wales.nhs.uk34
7. PDSA Cycles – How to test your changes robustly
“The PDSA cycle is the primary means to turning the ideas into action and for connecting action to learning.”
Langley et al. The Improvement Guide, 1996.
Implicit in every change is a prediction that it will improve things and you are in a better position to learn as the change is tested. The testing phase is not permanent; it is a way of learning and mistakes are likely.
7.1 Using Plan, Do, Study, Act (PDSA) cycles
Start with a prediction, hypothesis or idea. Predictions should be positive. If you predict failure there is little point in progressing and you will have to re-think.
Scenario 1 – A safety briefing using a checklist will highlight risks and improve communication.
Scenario 2 - Two ordinary blankets will maintain normothermia during the peri-operative period.
PDSA measures: part of the plan will be what PDSA cycle data you are going to collect. Section 5.3.2 describes a balanced set of measures. PDSA cycle measures are ones that guide the tests of change and are often discontinued when the change has been effective.
Scenario 1 – The safety briefing; data may be quantitative e.g. the number of risks highlighted, number of actions agreed and the number people who felt the timing of the safety briefing was OK. Qualitative measures could include the perceived usefulness of safety briefings.
Scenario 2 - Using blankets for maintaining normothermia; the quantitative measure would be the patient’s temperature at agreed intervals and qualitative measure could be the patient’s comfort/experience.
Have a plan – Be explicit about the ‘who, what, where, when’. For example:
Who Nurse Jones, Dr Evans
What Invite participants to the safety briefing.
Carry out a safety briefing using the checklist.
Measure the impact of the safety briefing
Where Clinical area A
When 8am 18th December 2009

www.1000livesplus.wales.nhs.uk 35
How to Improve
Do - Carry out the plan including the data collection. Capture the data as planned that will help in your evaluation during the study part of the PDSA cycle. Think about what is working well and what the issues that need resolving are.
Study - Gather relevant team members as soon as possible after the test for a short informal meeting. This can be done in a ‘huddle’ without sitting down. Analyse the data and review the prediction against what actually happened to enable the team to learn from the test. Data in this sense is the recorded observation of the test. Questions to ask include:
■ ‘What is the data telling us?’
■ ‘What worked and what didn’t work?’
■ ‘What should be adopted, adapted, or abandoned?’ For example:
Scenario 1 – The safety checklist had items on it which were not relevant in this clinical area and we have frequent problems with other things which were not on the list. Only 4 staff attended at the time of the safety check. It was too early for part time staff and other members of the multidisciplinary team are busy elsewhere.
Scenario 2 - Two ordinary blankets; the patient left the ward with a normal temperature but this had dropped to 35.8 on reaching the anaesthetic room. The patient said he felt cold and requested another blanket.
Act - Use this new knowledge to plan the next test. Agree the changes and amend the measures if required. Remember you are working with a change methodology and therefore a flexible hypothesis so it is OK to amend your objectives accordingly.
The next cycle begins and the team continues linking tests in this way, refining the change until it is ready for broader implementation.
TIP: Do not be tempted or pressurised into implementing or spreading until you have achieved a reliable process that is fit for purpose and you are happy with.
TIP: Collate your PDSA cycles and share them with other areas when you spread so they can understand what processes, predictions and tests they went through that lead to the change.
How to Improve
www.1000livesplus.wales.nhs.uk36
7.2 Guidelines for using PDSA cycles
1. These are small scale tests of change. Start with as small a sample size as you can get meaningful information from such as one patient, one doctor or one occurrence. This ensures testing can be started with minimum delay, is easily observable and minimises the impact if it is not working. Remember, if you can’t make it work for one you will never make it work for the whole system!
2. Go where the will is. Start with someone who is keen for the change to work. They will have the patience to help you with refinements and retesting.
3. Simulation is okay. If you are concerned about the impact, test out the process with a colleague or ‘walk it through’.
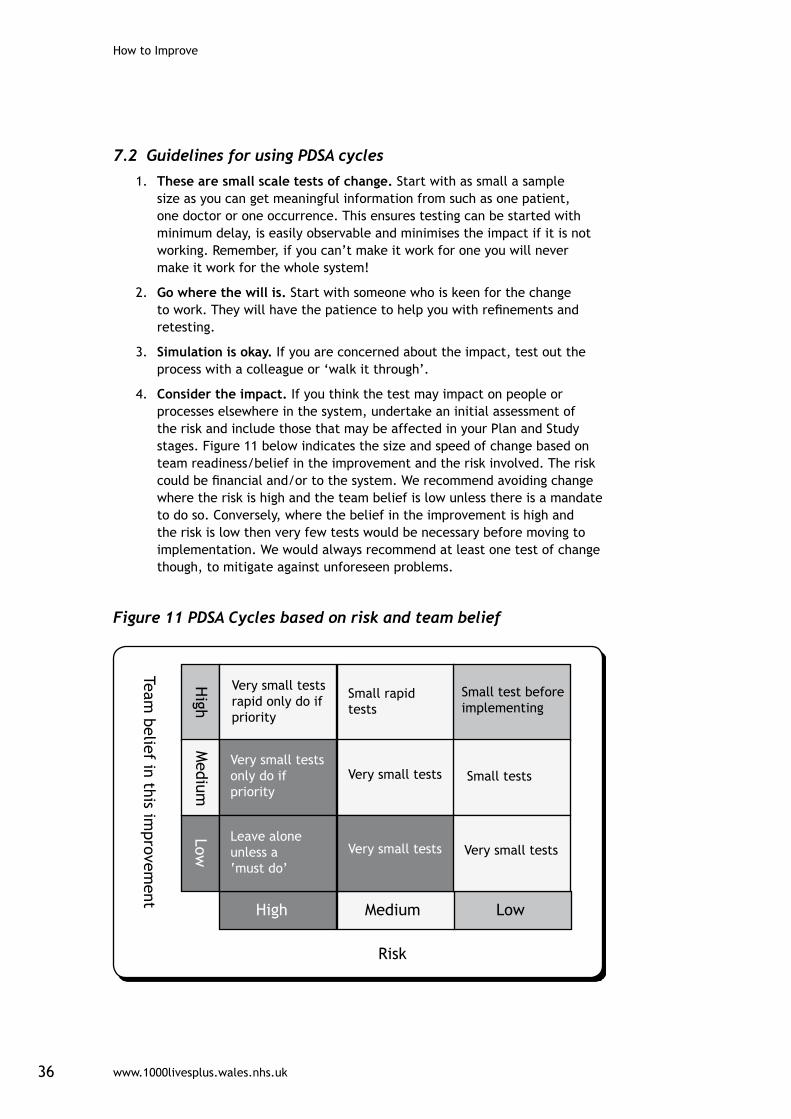
4. Consider the impact. If you think the test may impact on people or processes elsewhere in the system, undertake an initial assessment of the risk and include those that may be affected in your Plan and Study stages. Figure 11 below indicates the size and speed of change based on team readiness/belief in the improvement and the risk involved. The risk could be financial and/or to the system. We recommend avoiding change where the risk is high and the team belief is low unless there is a mandate to do so. Conversely, where the belief in the improvement is high and the risk is low then very few tests would be necessary before moving to implementation. We would always recommend at least one test of change though, to mitigate against unforeseen problems.
Figure 11 PDSA Cycles based on risk and team belief
www.1000livesplus.wales.nhs.uk 37
How to Improve
5. Testing changes is an iterative process. The completion of each PDSA cycle leads directly into the start of the next cycle. Cycles should be carried out in quick succession to maximise the pace of change. People are far more willing to test a change when they know that changes can and will be modified as needed. Linking small tests of change helps overcome an organisation’s natural resistance to change and increases clinician buy-in.
TIP: A test rarely works first time. Expect to test, observe results, refine and retest. The testing phase allows for failure to occur. Four or five cycles is not uncommon to get a process that works reliably.
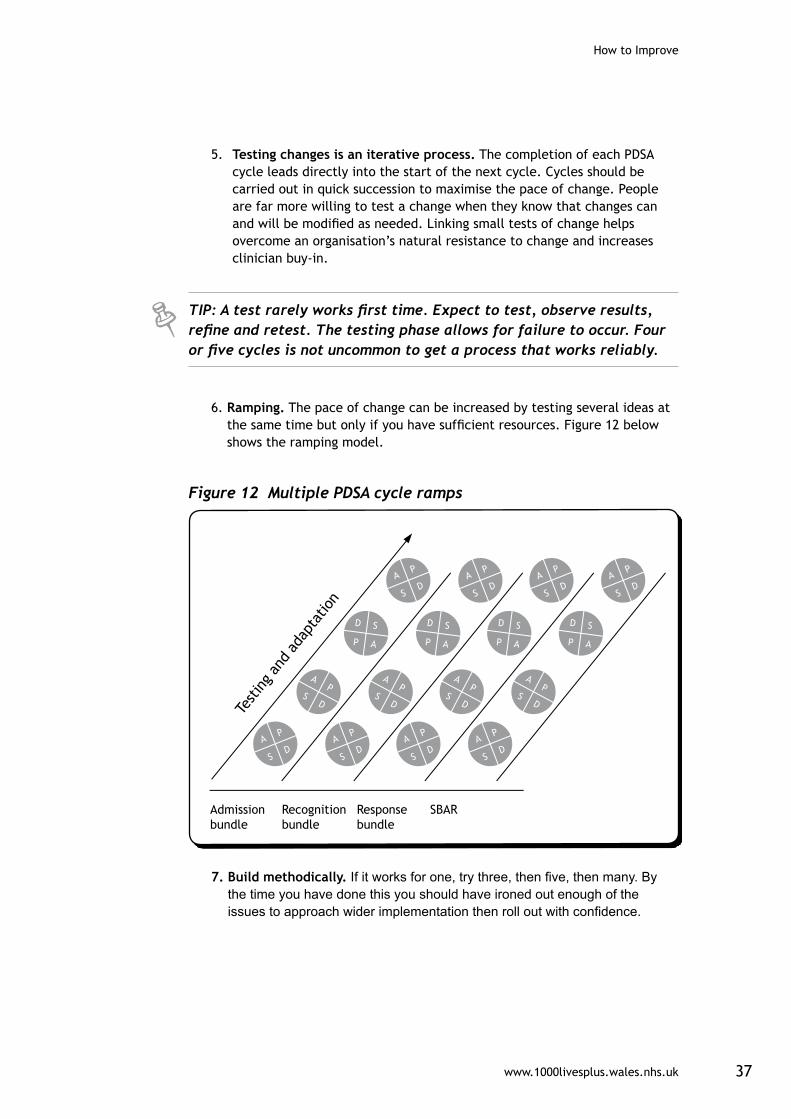
6. Ramping. The pace of change can be increased by testing several ideas at the same time but only if you have sufficient resources. Figure 12 below shows the ramping model.
Figure 12 Multiple PDSA cycle ramps
7. Build methodically. If it works for one, try three, then five, then many. By the time you have done this you should have ironed out enough of the issues to approach wider implementation then roll out with confidence.

How to Improve
www.1000livesplus.wales.nhs.uk38
TIP: See Section 9 for more guidance on establishing reliability.
As the small scale tests build and measures improve so will the confidence that the change will result in an improvement. This is why it is important to work with people who are keen in the first place. Their belief, energy and enthusiasm will propel the improvement work forward on the small scale and the results will demonstrate to others the benefits and help bring them on board as you move towards implementation and spread.
TIP: As you implement more widely, remember to include relevant balancing measures to ensure you continue to monitor the effects.
Implementing
Implementing occurs when the process has achieved 95% or more reliability. Change is expected to become routine. Failure should only occur in less than 5% since the problems have been resolved during testing. Expect increased resistance due to increased scope during this phase. You will need to rehearse your communication and back it up with local data as evidence.
Implementation is a series of cycles. There are a few options to consider:
1. Just do it.
2. Parallel approach so that you have the old and new systems running together until it is safe to stop the original system.
3. Sequential approach – as you bring in the new system the old one stops immediately by time and location.
TIP: View this as a separate stage in your improvement journey and remember implementation cycles generally require more time than testing.
www.1000livesplus.wales.nhs.uk 39
How to Improve
8. Spread – How to transfer successful improvements
Spread is the extent to which the changes have been adopted in other relevant areas.
“A key factor in closing the gap between best practice and common practice is the ability of health care providers and their organizations to rapidly spread innovations and new ideas. Pockets of excellence exist in our health care systems, but knowledge of these better ideas and practices often remains isolated and unknown to others.”1
Spread does not happen by accident. The Institute for Healthcare Improvement suggests you need to:
■ prepare for spread;
■ establish an aim for spread; and
■ develop, execute, and refine a spread plan.
Spread sites are likely to have differences from the original pilot site. Some adapting using PDSA cycles is usually required to make the change fit for purpose. For example, safety briefings in the operating theatre, a medical ward, pharmacy, radiolology, a GP practice, district nursing team or mental health crisis team will all have common elements but will also be adapted to make the content relevant to those particular teams.
8.1 Develop a plan for spread1
A spread plan has similar criteria as the initial project set up, which are described in more detail in Section 4 of this guide. You need to:
■ Define your aim for spread.
■ Allocate executive responsibility for spread.
■ Use this person and existing champions to generate will amongst people in the spread areas.
■ Use your knowledge of the existing social and communication systems to generate will amongst people in the spread areas.
■ Identify a champion in the new areas and help them establish their own measurement and feedback systems.
You will also need to think about the following and ensure they are captured in the spread plan:
■ How many spread sites can you support at any one time and what state of reliability will you require before spreading further?
■ How will you share the learning with the addition of new units?
■ How do the spread areas relate to the initial pilot sites? Are the professional and managerial reporting structures the same? Do new sets of local leaders need to be involved? Are there any tensions that may hinder the spread?

How to Improve
www.1000livesplus.wales.nhs.uk40
■ Do champions exist in the spread areas or can they be developed?
■ Are there sufficient resources available for successful spread?
■ How will the measurement system be set up? Who will be responsible?
■ What materials will be required? Who will develop them?
■ What is the best way to communicate with the new teams? What do they need to know about the initiative such as benefits, impact on current performance, what changes are required?
■ Do they perceive a need to change? What is the current process reliability or performance? How does this compare to other sites?
TIP: Section 10 provides advice on what to do and what to avoid when spreading. Further information on spread can also be found on the IHI website at www.ihi.org
8.2 Sustainability
Sustainability is achieved when new ways of working and improved outcomes become the norm. You will have addressed the human dimensions of change so that thinking and attitudes are fundamentally altered and surrounding supporting systems are also transformed. The new system has become mainstream. For example, the safety briefings occur at every handover regardless of changing circumstances such as staff involved or time of day. Staff expect them to occur.
TIP: It is important to establish an infrastructure including some measurement or reporting system to be able to detect whether the change is sustained.
You must continue your outcome measures as this will signal to you any changes in your process that require investigation. You can reduce the amount and/or frequency of process measures when you have a sustainable process.

www.1000livesplus.wales.nhs.uk 41
How to Improve
Summary
Take sequential steps.
Remember that each step of the sequence is a distinct phase of your improvement journey.
What change do you require?
Decide on First order or Second order change and the source of your change.
Answer the three questions and use PDSA Cycles.
PDSA Cycles can be used in each step of the sequence.
Check your idea fulfils the sustainability criteria.3
(See Section 10).
Establish a reliable process before implementing.
Use the 3-level reliability strategy where appropriate (See Section 9).
Establish a spread plan.
It’s important to prepare for spread, it won’t happen organically from the change you have implemented.
Use the Engaging Physicians strategy.2
Securing the participation of clinicians can be key to the success of your improvement (see Section 10).
Spread reliably
Try to avoid the ‘7 Spreadly Sins’ (See Section 10).
References1 Massoud MR, Nielsen GA, Nolan K, Nolan T, Schall MW, Sevin C. A Framework for
spread:From Local Improvements to System-Wide Change. IHI Innovation Series white paper. Cambridge, Massachusetts: Institute for Healthcare Improvement; 2006. (Available on www.IHI.org)
2 Reinertsen JL, Gosfield AG, Rupp W, Whittington JW. Engaging Physicians in a Shared Quality Agenda. IHI Innovation Series white paper. Cambridge, Massachusetts: Institute for Healthcare Improvement; 2007. (Available on www.IHI.org)
3 Sustainability Model. Institute for Innovation and Improvement.www.institute.nhs.uk/sustainability_model/general/welcome_to_sustainability.html

How to Improve
www.1000livesplus.wales.nhs.uk42
9. Reliability – How to make your improvement deliver day in day outDefinitions of reliability:
“Reliability” is the extent of failure-free operation over time.”
(Garvin D, Harvard Business School).
“I would say it is ensuring that healthcare processes occur con-sistently and safely for all patients all the time. So all patients receive the right care at the right time”
(Fran Griffin, Director IHI).
“Reliability is the measurable capability of an object to perform its intended function in the required time under speci-fied conditions”
(Igor Ushakov, the Handbook of Reliability Engineering).
The formula to produce reliability is:
the number of actions that achieve the intended result
the total number of actions taken
Reliability occurs by design not by accident. For the patient this is an “all or nothing” measure; knowing that 70% of patients receive a risk assessment is of cold comfort if you are in the 30% who does not.
The Institute for Healthcare Improvement (IHI) use a numerical system and the definitions are not meant to be the true mathematical equivalent. We have introduced it below as you will see it used in their literature. The categories for process reliability are:
■ Chaotic process: Failure in greater than 20% of opportunities which means we only get things right for 8 or less out of 10 patients.
■ 80 to 90 % (IHI call this a 10-1 reliability): 1 or 2 failures out of 10 opportunities. This lacks a consistent, clear understanding of the process and fails to be effectively applied for one out of every 10 patients.
■ 95% or better (IHI call this a 10-2 reliability): 5 failures or less out of 100 opportunities.
Example:If 90% of surgical patients get their prophylactic antibiotic within an hour of surgical incision, the reliability of that process as measured by defect rate is 10-1

www.1000livesplus.wales.nhs.uk 43
How to Improve
TIP: A quick test of reliability is to ask 5 front line process users whether they can articulate the process. If you get different answers then process reliability has not been achieved.
9.1 Why do we need reliable processes?
Reliable processes lead to improved outcomes. However, many healthcare processes are chaotic. This applies to non-catastrophic processes, defined as failure of the process will not lead to death or severe injury within hours of the failure. Given all the resources and talent available to us why does this happen? Environmental conditions and human factors play a big part in how we perform, such as:
■ Limited memory capacity – only 5-7 pieces of information can be held in short term memory.
■ Tunnel vision.
■ Negative influence of fatigue and other physiological factors.
■ Competing demands.
■ Limited ability to multi-task e.g. mobile phones and driving.
■ Interruptions.
In addition to these, particularly in healthcare, hindrances occur due to:
■ A tendency to look at outcomes and not the reliability of processes.
■ Benchmarking to what are perceived as best practices without understanding the underpinning process design and reliability.
■ Permissive clinical autonomy creating and allowing wide performance variation.
9.2 How do we create reliable processes?
The IHI describes a 3 level reliability strategy outlined below. Section 10 has more detail.
LEVEL 1
Preventing initial failure (first order change) through intent, vigilance and hard work. Common solutions include:
■ Common equipment, standardising, multiple choice protocols, and written policies/procedures.
■ Personal check lists.
■ Feedback of information on compliance.
■ Suggestions of working harder next time.
■ Awareness and training.

How to Improve
www.1000livesplus.wales.nhs.uk44
Standardisation is an important first step because it:
■ Removes some of the chaos and helps us to see our system.
■ Contributes to building an infrastructure (who does what, when, where, how and with what).
■ Makes training and competency assessment easier.
■ Each of those involved can describe and execute the process in the same way.
■ Opt out vs. opt in.
■ Enables us to measure our processes, identify defects from which we can learn redesign.
LEVEL 2
There are two ways to increase reliability to 95% through first order change. You can identify failure and mitigate or take in to account the human factors necessary to increase reliability.
Identify and mitigate allows us to take a chaotic process with 80% reliability and make it 95% reliable with a 2-step approach.
Example:There are 100 staff, 80 of whom follow the hand hygiene process appropriately leaving 20 who don’t. If we identify the reasons for failure and provide another step (mitigation) then 80% of those 20 people will follow the process (80% of 20 = 16 people). 80 from the first step + 16 from the second step = 96. This is another reason why we set a 95% target. for non-catatrophic processes.
Reliable design that reduces the potential effects of adverse human factors and increases the effects of positive human factors will also lead to 95% reliability.
These are detailed in section 10 but briefly comprise the following:
■ Decision aids and reminders built into the system.
■ Desired action the default (based on best evidence).
■ Redundant processes are used.
■ Scheduling is used in design development.
■ Taking advantage of habits and patterns.
■ Standardisation of the process based on clear specification that people can articulate.
Example of desired action being the default:If we want people to clean their hands before entering a room we make using the hand gel a factor in opening a door – the door will not open until the hand gel dispenser has been activated.

www.1000livesplus.wales.nhs.uk 45
How to Improve
LEVEL 3
Analysing why the current system fails and then redesigning it; this is usually second order change.
TIP: If your improvement project or programme is not moving at a sufficient pace then re-visit the DICE score (see Section 10). This will help you identify some of the reasons and give you insight into what you should do to rectify the situation.
If your processes appear to be reliable but the outcome is not improving check that:
■ Your process is as reliable as you think it is – is it reliable all the time or just when it is being measured?
■ Your process is actually linked to your outcome.
■ Your processes are sufficient to improve the outcome – do other processes need to be improved as well?
■ Your outcome measure is sensitive enough to detect the impact of your improvement. For example, you are measuring a process on one segment of patients and the outcome measure is for the whole patient population. In this case you will only see outcome improvement when you have depth and breadth of spread unless you are able to measure the outcome on that particular segment too.

How to Improve
www.1000livesplus.wales.nhs.uk46
Summary
Reliability: the number of actions that achieve the intended result
the total number of actions taken
Reliability is expressed as >95%
For non-catastrophic events each process must be achieving this level of reliability to impact on the outcome; otherwise processes can still be described as chaotic.
Reliability occurs by design
It is not a ‘happy accident’ that robust processes work; remember for patients this is an all or nothing measure.
Human and environmental factors affect our performance
Therefore they must be taken into consideration when designing a reliable process.
Use the 3 level reliability strategies:
Level 1 - Prevent initial failure.
Level 2 - Identify failure and mitigate.
Level 3 - Analyse why the current system fails and then redesign it.

www.1000livesplus.wales.nhs.uk 47
How to Improve
10. Tools and Checklists
1. Project Charter
The charter relates to the first component of the Model for Improvement. It communicates the purpose of a team or individual involved in an improvement effort. The charter answers the fundamental improvement question, “What are we trying to accomplish?”
Standard Format and Definitions for a CharterWhat are we trying to accomplish?
General description (defines WHAT)
■ Provides an initial orientation toward the activities of the improvement initiatives, i.e. design of a new process, improve an existing product or service. Describes the sub-system(s) in the organisation where the improvement will take place.
Reason for the effort (defines WHY)
■ Why is the effort important?
■ How will this improvement benefit the organisation?
■ What is the potential downside of this effort for the organisation?
■ What data/analysis supports the choice?
■ How does it impact patients?
Expected outcomes (defines WHAT specifically, still not HOW)
■ Anticipated outcomes (products, tools, and deliverables) or success criteria.
■ Specific objectives to be accomplished.
■ Specific, numerical goals to be attained.
■ Business impact (financial, throughput, cost, and productivity).
■ Time frame: expected dates for key milestones and completion date.
How do we know that a change is an improvement?
Feedback, measures or indicators: define the measures that will be used to monitor the impact of this improvement effort:
■ Connect measures to the goals and outcomes of the charter.
■ Measures monitor and guide progress of work on charter.
■ Consider qualitative feedback as well as quantitative measures.
■ Consider both outcome and process measures.
■ Are balancing measures needed to guard against sub-optimisation (unintended consequences)?
How to Improve
www.1000livesplus.wales.nhs.uk48
What changes can we make that will lead to improvement?
■ Initial activities: provide initial focus for the project work, e.g. specific issues to investigate and/or alternatives to consider, concept design for the team to work with, guidance on adapting and testing some specific change ideas, summarise recent patient feedback, do a process map of current reality, etc.
■ Boundaries: list any project constraints, financial limitations, existing guidelines or procedures to be adhered to, software considerations, what is not to be addressed, etc.
■ Resources: team membership (includes all members and the rationale for their inclusion on the team) and their expected time commitments for the work.
■ Sponsorship: states the person or guidance team that is providing resources to work on the charter.
2. Driver and Tree Diagrams
Driver and Tree Diagrams are familiar from initiatives such as 1000 Lives Plus. The driver diagram articulates the theory for system improvements and guides the thinking to identify the interventions or projects required to achieve the improvement outcome. An example can be found on page 5 in Figure 1. Tree diagrams are more focused on the structures and work streams used to conduct the project.
Both are used to visualise the structure of a problem, plan or issue and determine its system components, which will then develop a route to achieve the specified goal/outcome. As diagrams are developed systematically and logically, it is less likely that any essential items will be omitted and provides the opportunity for discussion and agreement among team members as to how the project should be scoped and planned. As the scope of the project, objectives, measures and initial PDSA cycles are written down, this information is formalised in the project charter.
There are 3 different types of tree diagrams, depending on the intended use:
■ The planning tree diagram: Used proactively in planning and organising events. This is similar to a driver diagram and enables you to determine the individual system components required to achieve the specified aim.
Ò Primary Drivers are components which will contribute to achieving this goal.
Ò Secondary Drivers are elements of the associated primary driver. They contain change concepts that can be used to create projects that will affect the primary driver.
■ The problem solving tree diagram: Used reactively in problem solving, often using the ‘five-whys’. Similar to a cause and effect diagram and also called a root-cause tree.
■ The analysis tree diagram: Used in problem analysis or decision making; a method called “failure mode and effects analysis” or FMEA is an example of this kind of tree.

www.1000livesplus.wales.nhs.uk 49
How to Improve
3. Plan-Do-Study-Act (PDSA) Cycles
These provide a structure for learning from data and experience. Using a PDSA form or worksheet for “establishing a degree of discipline and thoughtfulness in carrying out a cycle …and is a convenient way of documenting the project”.1
There are many forms available to use and the ones below provide an example from the Associates in Process Improvement (API).
MODEL FOR IMPROVEMENT DATE __________
Objective for this PDSA Cycle:
Is this cycle used to develop, test, or implement a change?
What question(s) do we want to answer on this PDSA cycle?
Plan: Plan to answer questions: Who, What, When, Where Plan for collection of data: Who, What, When, Where Predictions (for questions above based on plan)
Do: Carry out the change or test; Collect data and begin analysis.
Study: Complete analysis of data; Compare the data to your predictions and summarise the learning.
Act: Are we ready to make a change? Plan for the next cycle.
1 Associates in Process Improvement (2007).

How to Improve
www.1000livesplus.wales.nhs.uk50
Date: Team: Cycle #:
Plan
Objective of cycle this cycle:
Collect data Develop a change (or modify a change from a previous change)
Test a change Implement a change
Describe: ..........................................................................................................................................
...........................................................................................................................................................
What additional knowledge is necessary to take action?
Questions to be answered from the data obtained in this cycle:
1: .......................................................................................................................................................
...........................................................................................................................................................
2: .......................................................................................................................................................
...........................................................................................................................................................
3: .......................................................................................................................................................
...........................................................................................................................................................
4: .......................................................................................................................................................
...........................................................................................................................................................
Predictions:
1: .......................................................................................................................................................
...........................................................................................................................................................
2: .......................................................................................................................................................
...........................................................................................................................................................
3: .......................................................................................................................................................
...........................................................................................................................................................
4: .......................................................................................................................................................
...........................................................................................................................................................
Are historical data available to answer the questions above? Yes No
Does the team agree on the predictions?
Yes for Question(s): No for Question(s):

www.1000livesplus.wales.nhs.uk 51
How to Improve
Develop a plan to answer the questions (who, what, where, when)
1: .......................................................................................................................................................
...........................................................................................................................................................
2: .......................................................................................................................................................
...........................................................................................................................................................
3: .......................................................................................................................................................
...........................................................................................................................................................
4: .......................................................................................................................................................
...........................................................................................................................................................
The plan considered the following methods:
Data Collection Forms Pareto Diagrams
Control Charts Frequency Plots
Planned Experimentation Survey Methods
Simulation/ Modeling Scatter Diagrams
Run Charts Engineering Analysis
Did you assign responsibilities for collection and analysis of the data? Yes No
Is the plan consistent with the charter? Yes No
Can the plan be carried out on a small scale? Yes No
Have you considered people outside the team who will be affected by this plan? Yes No
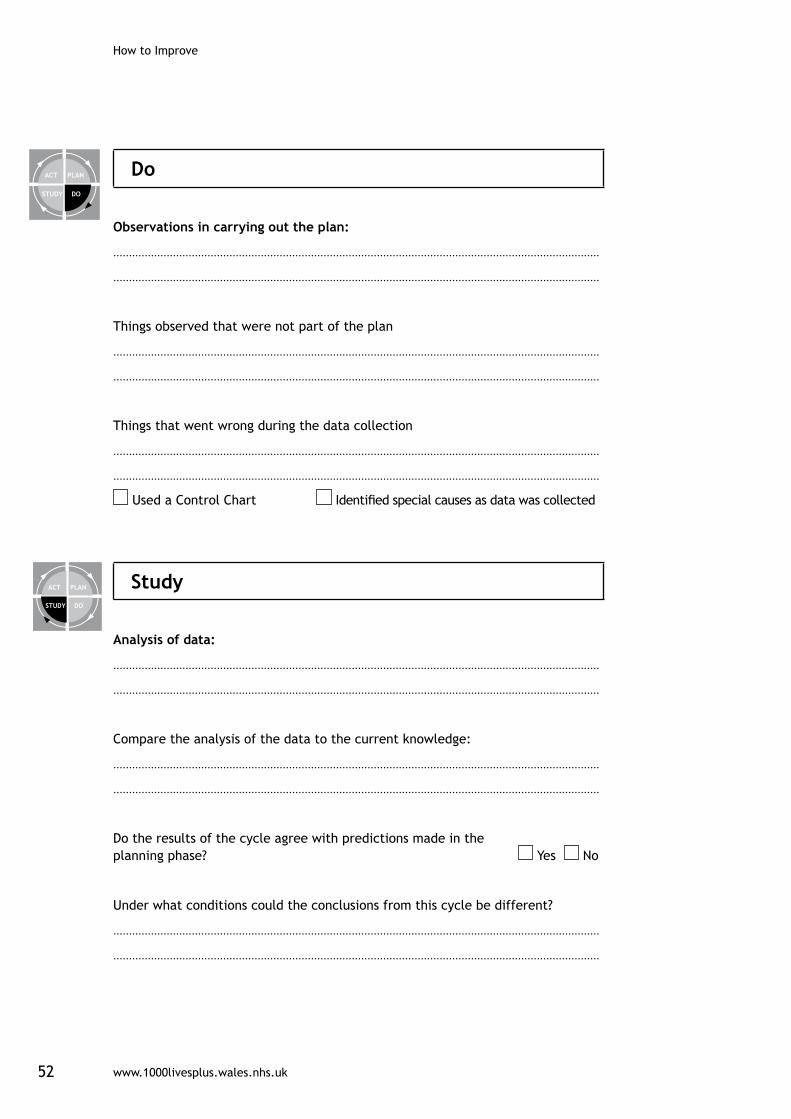
How to Improve
www.1000livesplus.wales.nhs.uk52
Do
Observations in carrying out the plan:
...........................................................................................................................................................
...........................................................................................................................................................
Things observed that were not part of the plan
...........................................................................................................................................................
...........................................................................................................................................................
Things that went wrong during the data collection
...........................................................................................................................................................
...........................................................................................................................................................
Used a Control Chart Identified special causes as data was collected
Study
Analysis of data:
...........................................................................................................................................................
...........................................................................................................................................................
Compare the analysis of the data to the current knowledge:
...........................................................................................................................................................
...........................................................................................................................................................
Do the results of the cycle agree with predictions made in the planning phase? Yes No
Under what conditions could the conclusions from this cycle be different?
...........................................................................................................................................................
...........................................................................................................................................................

www.1000livesplus.wales.nhs.uk 53
How to Improve
What are the implications of the unplanned observations and problems during the collection of data?
...........................................................................................................................................................
...........................................................................................................................................................
Do the data help answer the questions posed in the plan? Yes No
Summarise the new knowledge gained in this cycle:
...........................................................................................................................................................
...........................................................................................................................................................
Flowcharts reflect what was learned
Cause and effect diagrams reflect what was learned.
What was learned can be applied in another area. Comments:
...........................................................................................................................................................
...........................................................................................................................................................
Act
What changes are to be made to the process?
...........................................................................................................................................................
...........................................................................................................................................................
List other organisations and people that will be affected by the changes:
...........................................................................................................................................................
...........................................................................................................................................................
The cause system is sufficiently understood.
An appropriate action or change has been developed or selected.
The changes have been tested on a small scale.
Change responsibilities for implementation and evaluation completed.
Actions or changes will improve performance in the future.
Completed an analysis of forces in the organization that will help or hinder the changes

How to Improve
www.1000livesplus.wales.nhs.uk54
Objective of next cycle:
Collect data
Develop a change (or modify a change from a previous change)
Test a change
Implement a change
Description:
...........................................................................................................................................................
...........................................................................................................................................................

www.1000livesplus.wales.nhs.uk 55
How to Improve
4. Measures Checklist
Measure setupMeasure name:
What data item comprises the numerator?
What data item comprises the denominator? (Some measures do not require one)
What is the calculation?
Which patient groups are to be covered?
What is the numeric goal you are setting yourselves?
Who is responsible for setting this?
When will it be achieved by?
Measurement process Is the data available? Currently available / Available with minor changes / Prospective collection needed
Who is responsible for data collection?
What is the process of collection?
What is the process for presenting results? e.g. enter data in Extranet, create run chart in Excel
Who is responsible for the analysis?
How often is the analysis completed?
Where will decisions be made based on results?
Who is responsible for taking action?
Mea
sure
defi
niti
onCo
llect
Goa
l set
ting
Anal
yse
Calc
ulat
e m
easu
re
and
pres
ent
resu
lts
Revi
ew

How to Improve
www.1000livesplus.wales.nhs.uk56
5. Form for Developing Improvement Project Measures
1. Basic Information
Improvement project name: .....................................................................................................
Name of this measure: ................................................................................................................
Objective:.......................................................................................................................................
What is the numerical target or goal for this measure? ....................................................
Is this an outcome, process or balancing measure for the improvement project?
...........................................................................................................................................................
2. Operational Definition of the Measure:
What actual data elements need to be collected? ............................................................
...........................................................................................................................................................
...........................................................................................................................................................
Define both numerator and denominator if appropriate.
Is this definition different than standard definitions used in other places?
...........................................................................................................................................................
List inclusions or exclusions to the data you will collect.
...........................................................................................................................................................
What identifying information will you capture with the data (e.g. coding, location)?
...........................................................................................................................................................
...........................................................................................................................................................
Will you sample to obtain the data? If so, describe your sampling plan.
...........................................................................................................................................................
...........................................................................................................................................................
For each data element define the measurement unit and degree of precision (e.g. is length of stay in days, hours or minutes? Is pain scale captured in whole numbers or is it possible to record a 3.5?) Will you round the data?
...........................................................................................................................................................
...........................................................................................................................................................
If your data involves making a judgment such as ‘late’ or ‘inappropriate’ list the criteria you will be using to make that judgment.
...........................................................................................................................................................
...........................................................................................................................................................
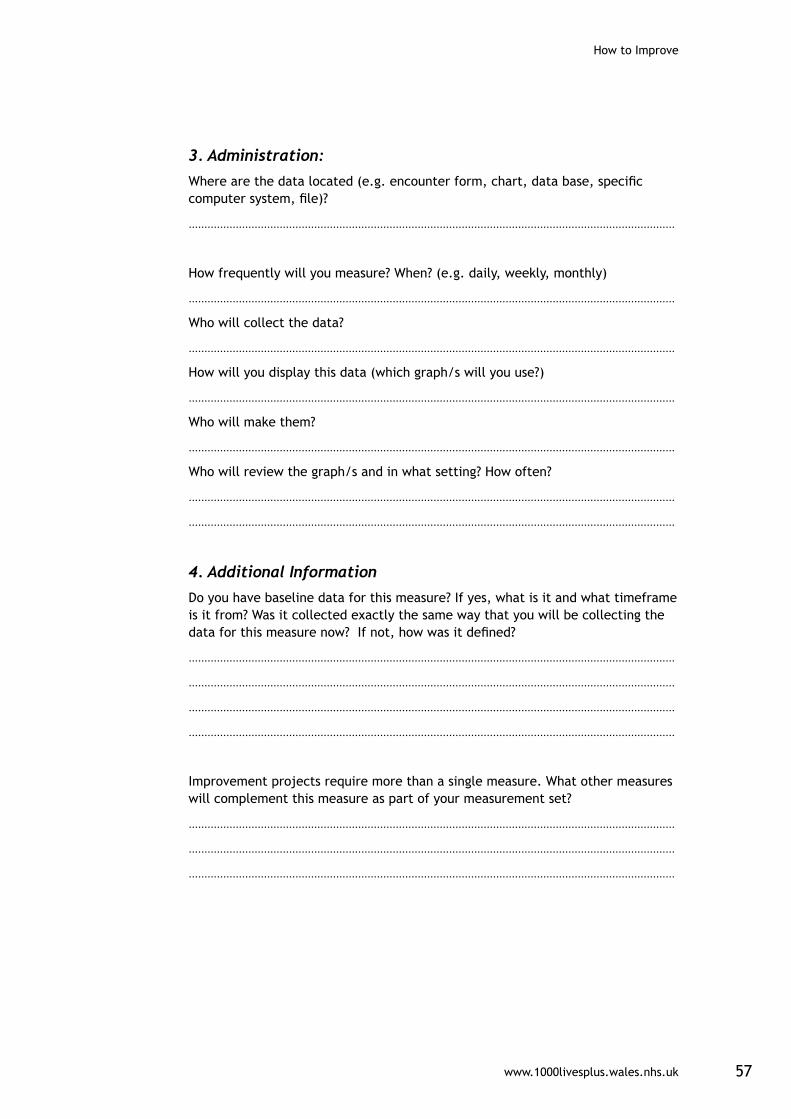
www.1000livesplus.wales.nhs.uk 57
How to Improve
3. Administration:
Where are the data located (e.g. encounter form, chart, data base, specific computer system, file)?
...........................................................................................................................................................
How frequently will you measure? When? (e.g. daily, weekly, monthly)
...........................................................................................................................................................
Who will collect the data?
...........................................................................................................................................................
How will you display this data (which graph/s will you use?)
...........................................................................................................................................................
Who will make them?
...........................................................................................................................................................
Who will review the graph/s and in what setting? How often?
...........................................................................................................................................................
...........................................................................................................................................................
4. Additional Information
Do you have baseline data for this measure? If yes, what is it and what timeframe is it from? Was it collected exactly the same way that you will be collecting the data for this measure now? If not, how was it defined?
...........................................................................................................................................................
...........................................................................................................................................................
...........................................................................................................................................................
...........................................................................................................................................................
Improvement projects require more than a single measure. What other measures will complement this measure as part of your measurement set?
...........................................................................................................................................................
...........................................................................................................................................................
...........................................................................................................................................................

How to Improve
www.1000livesplus.wales.nhs.uk58
6. Calculating DICE Scores1
Companies can determine if their change programs will succeed by asking executives to calculate scores for each of the four factors of the DICE framework – duration, integrity, commitment, and effort. They must grade each factor on a scale from 1 to 4 (using fractions, if necessary); the lower the score, the better. Thus, a score of 1 suggests that the factor is highly likely to contribute to the program’s success, and a score of 4 means that it is highly unlikely to contribute to success. Table 1 shows questions and scoring guidelines to allow executives to rate transformation initiatives effectively.
Executives can combine the four elements into a project score. When a regression analysis was conducted against a database of change efforts, the team found that the combination that correlates most closely with actual outcomes doubles the weight given to team performance[I] and senior management commitment[C1]. This translates into the following formula:
DICE Score = D + (2 x I) + (2 x C1) + C2 + E
In the 1-to-4 scoring system, the formula generates overall scores that range from 7 to 28. Companies can compare a project’s score with those of past projects and their outcomes to assess if the project is slated for success or failure. The team’s data show a clear distribution of scores:
■ Scores between 7 and 14: The project is very likely to succeed. This is called the Win Zone.
■ Scores higher than 14 but lower than 17: Risks to the project’s success are rising, particularly as the score approaches 17. This is the Worry Zone.
■ Scores over 17: The project is extremely risky. If a project scores over 17 and under 19 points, the risks to the success are very high. Beyond 19, the project is unlikely to succeed. This is the Woe Zone.
The team changed the boundaries of the zone over time. For instance, the Worry Zone was between 14 and 21 points at first, and the Woe Zone from 21 to 28 points. The team found, however, that companies prefer to be alerted to trouble as soon as outcomes become unpredictable (17 to 20 points). Therefore, the Worry Zone was compressed and the Woe Zone expanded.
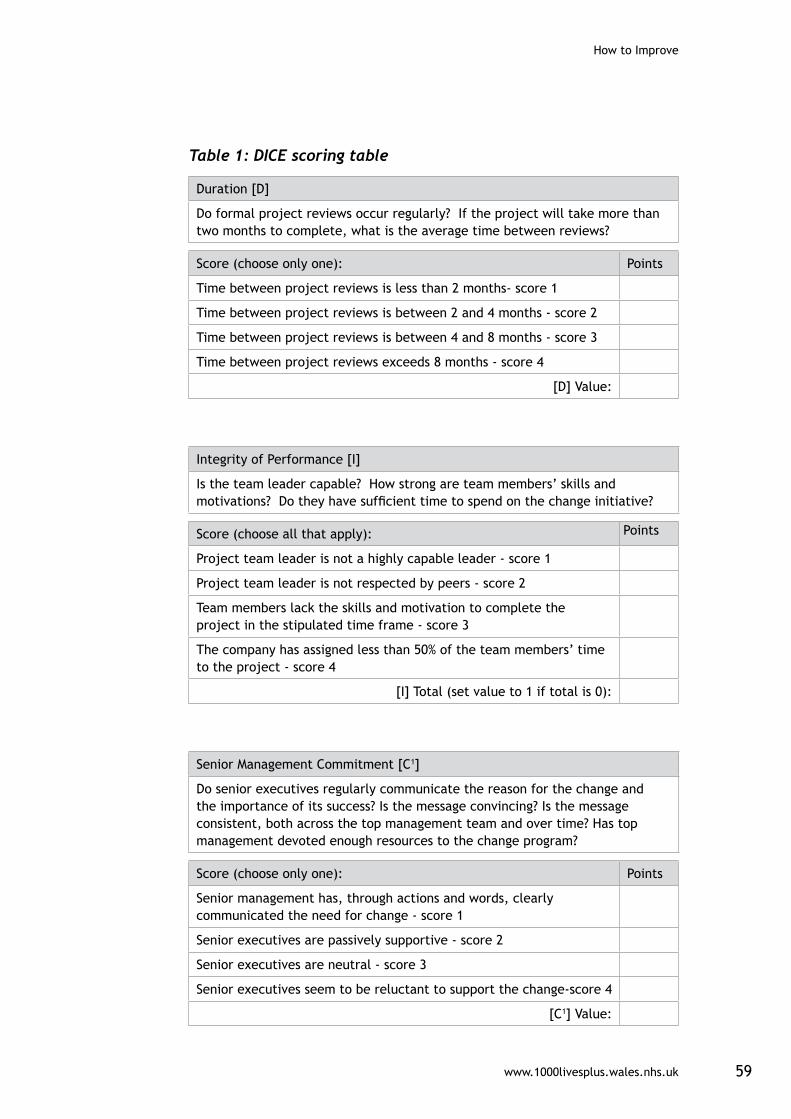
www.1000livesplus.wales.nhs.uk 59
How to Improve
Table 1: DICE scoring table
Duration [D]
Do formal project reviews occur regularly? If the project will take more than two months to complete, what is the average time between reviews?
Score (choose only one): Points
Time between project reviews is less than 2 months- score 1
Time between project reviews is between 2 and 4 months - score 2
Time between project reviews is between 4 and 8 months - score 3
Time between project reviews exceeds 8 months - score 4
[D] Value:
Integrity of Performance [I]
Is the team leader capable? How strong are team members’ skills and motivations? Do they have sufficient time to spend on the change initiative?
Score (choose all that apply): Points
Project team leader is not a highly capable leader - score 1
Project team leader is not respected by peers - score 2
Team members lack the skills and motivation to complete the project in the stipulated time frame - score 3
The company has assigned less than 50% of the team members’ time to the project - score 4
[I] Total (set value to 1 if total is 0):
Senior Management Commitment [C1]
Do senior executives regularly communicate the reason for the change and the importance of its success? Is the message convincing? Is the message consistent, both across the top management team and over time? Has top management devoted enough resources to the change program?
Score (choose only one): Points
Senior management has, through actions and words, clearly communicated the need for change - score 1
Senior executives are passively supportive - score 2
Senior executives are neutral - score 3
Senior executives seem to be reluctant to support the change-score 4
[C1] Value:

How to Improve
www.1000livesplus.wales.nhs.uk60
Local-Level Commitment [C2]
Do the employees most affected by the change understand the reason for it and believe it’s worthwhile? Are they enthusiastic and supportive or worried and obstructive?
Score (choose only one): Points
Employees are eager to take on the change initiative - score 1
Employees are willing to take on the change initiative - score 2
Employees are reluctant to take on the change initiative - score 3
Employees are strongly reluctant to take on the change initiative - score 4
[C2] Value:
Effort [E]
What is the percentage of increased effort that employees must make to implement the change effort? Does the incremental effort come on top of a heavy workload? Have people strongly resisted the increased demand on them?
Score (choose only one): Points
Project requires less than 10% extra work by employees - score 1
Project requires between 10% and 20% extra work by employees - score 2
Project requires between 20% and 40% extra work by employees - score 3
Project requires more than 40% extra work by employees - score 4
[E] Value:
TOTAL
References1 All content from “The Hard Side of Change Management,” from the October 2005 edition of the Harvard Business Review, written by Harold L. Sirkin, Perry Keenan, and Alan Jackson.
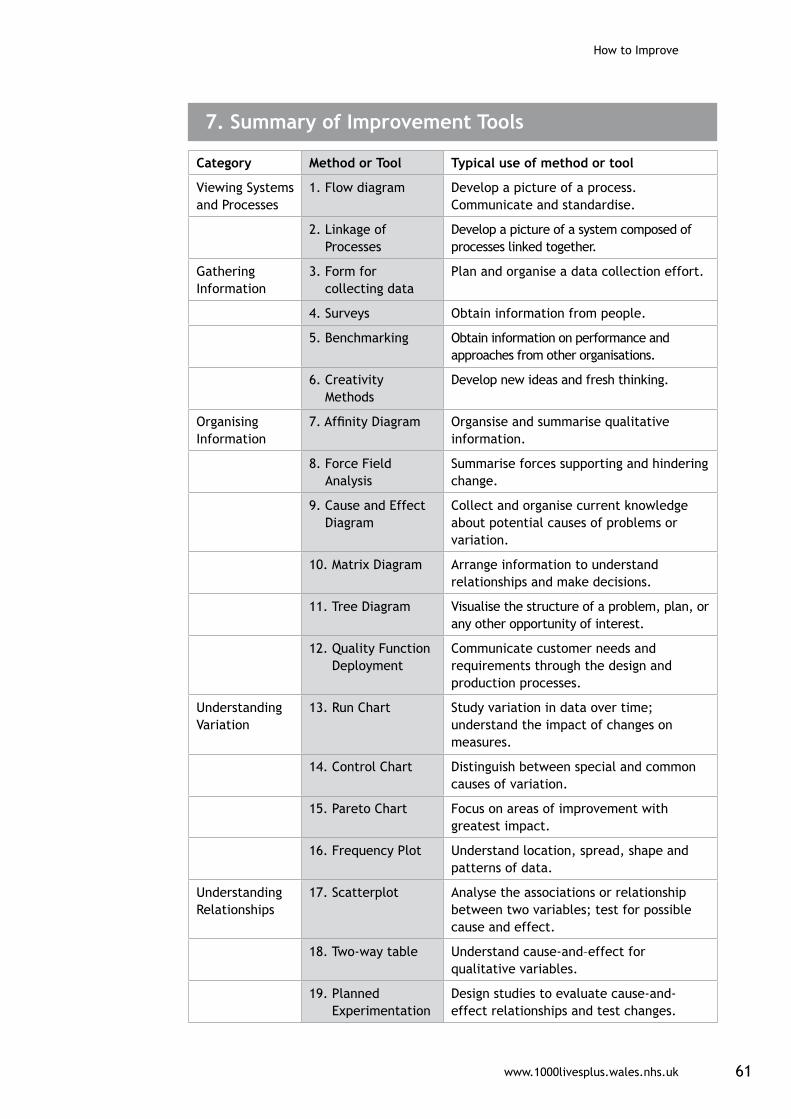
www.1000livesplus.wales.nhs.uk 61
How to Improve
Category Method or Tool Typical use of method or tool
Viewing Systems and Processes
1. Flow diagram Develop a picture of a process. Communicate and standardise.
2. Linkage of Processes
Develop a picture of a system composed of processes linked together.
Gathering Information
3. Form for collecting data
Plan and organise a data collection effort.
4. Surveys Obtain information from people.
5. Benchmarking Obtain information on performance and approaches from other organisations.
6. Creativity Methods
Develop new ideas and fresh thinking.
Organising Information
7. Affinity Diagram Organsise and summarise qualitative information.
8. Force Field Analysis
Summarise forces supporting and hindering change.
9. Cause and Effect Diagram
Collect and organise current knowledge about potential causes of problems or variation.
10. Matrix Diagram Arrange information to understand relationships and make decisions.
11. Tree Diagram Visualise the structure of a problem, plan, or any other opportunity of interest.
12. Quality Function Deployment
Communicate customer needs and requirements through the design and production processes.
Understanding Variation
13. Run Chart Study variation in data over time; understand the impact of changes on measures.
14. Control Chart Distinguish between special and common causes of variation.
15. Pareto Chart Focus on areas of improvement with greatest impact.
16. Frequency Plot Understand location, spread, shape and patterns of data.
Understanding Relationships
17. Scatterplot Analyse the associations or relationship between two variables; test for possible cause and effect.
18. Two-way table Understand cause-and–effect for qualitative variables.
19. Planned Experimentation
Design studies to evaluate cause-and-effect relationships and test changes.
7. Summary of Improvement Tools

How to Improve
www.1000livesplus.wales.nhs.uk62
8. Greenhalgh Criteria
■ It must have clear relative advantage
■ It must have compatibility with the user’s values and ways of working
■ Complexity must be minimised
■ Users will adopt more readily if innovations allow trialability
■ There must be observability, that is it must be seen to deliver benefit
■ Reinvention is the propensity for local adaptation
9. Seven Spreadly Sins: What to avoid when spreading
(Adapted from Carol Haraden, PhD, Vice President IHI and Roger Resar, MD, Senior Fellow IHI)
Sin 1 - Starting with a large scale ‘expertly’ devised pilot.
Impact - This does not allow learning and adapting processes to make them reliable and fit for purpose or for involving and bringing people who will be affected by the change on board, which is essential for establishing an acceptable and reliable process.
Avoid Sin 1: It is vital to go through the Model for Improvement and work with people who will actually be using the changes to make them fit for purpose.
Sin 2 - Find one person who is willing to do it all.
Impact – A process dependant on one person will not work when they are absent.
Avoid Sin 2: Start with your process owner or champion but quickly involve others.
Sin 3 – Depend primarily on vigilance and hard work for spread.
Impact – This is a traditional model that does not build a reliable process.Human factors described above mean that hard work and vigilance cannot be maintained consistently over time.
Avoid Sin 3: Use the reliability model to spread. Have a spread plan.

www.1000livesplus.wales.nhs.uk 63
How to Improve
Sin 4 – If a process is working well in one unit just spread it to the others.
Impact – Other units may have different conditions. Just spreading to other areas may mean a square peg is being forced in to a proverbial round hole. There will also be effects of Sin 1. The new process will quickly be abandoned.
Avoid Sin 4: Have a spread plan. Use PDSA cycles in each area so that the process can be adapted appropriately.
Sin 5 - Require the person and team who led the successful unit design to be responsible for organisation wide spread.
Impact – This person may burn out, the pilot site may be deprived of their own champion and revert back to old ways. There is no local leadership or ownership established in the spread units.
Avoid Sin 5: Develop local champions who can learn and build on the achievements of the original pilot site.
Sin 6 – Look at data on a quarterly basis.
Impact – The pace of improvement will be slow.
Avoid Sin 6: Gather live data at least monthly – better still weekly or even daily to inform decisions for rapid tests of change.
Sin 7 – With early spread, hold the teams responsible for outcomes.
Impact – The focus becomes the outcome rather than establishing process reliability.
Avoid Sin 7: Hold the teams responsible for establishing and maintaining reliable processes. If these become highly reliable the outcome will improve.
10. Reliability Checklist
Level 1 – Prevent Initial Failure
■ Common Equipment Ò Sets of surgical instruments
■ Standard orders Ò All Wales prescription chart
Ò All Wales blood transfusion request forms
Ò Organisation-wide lab and radiology test forms

How to Improve
www.1000livesplus.wales.nhs.uk64
■ Standard Rooms Ò Consulting rooms are similar with equipment etc all in the same place
- expect to find what is required for that consultation type
Ò Bed spaces are similar according to ward area
Ò Anaesthetic rooms are similar in layout with common equipment
■ Memory aids and personal check lists Ò Notes taken at handover
■ Awareness Ò General knowledge and vigilance
Ò Intervene if things don’t look right e.g. unsteady patient is assisted
■ Training Ò Competencies
■ Compliance Ò Observed by measurement
Ò Hand hygiene measures
Level 2 – Identify Failure and Mitigate
■ Decision aids and reminders Ò Information booklets in junior doctors1 (and others’) pockets
Ò 1000 Lives plus ‘How to Guides’
Ò Clinic lists, attendees are identified
Ò Electronic pop up reminders (e.g. diaries, reminders to check blood pressures or take bloods)
Ò Care pathways and care bundles - documents to guide the processes
Ò How to clean your hands posters above sinks
Ò SBAR documents/template reminder by the phones
Ò Checklist stickers in packs – e.g. in peripheral or central line insertion packs
Ò Alarms on infusion pumps to tell when they are about to run out
Ò MEWS charts with algorithm for action
Ò Medication packs with days of the week on
■ Differentiation Ò Different colours, writing, markers on vials and packaging for drugs
Ò Needle colours determine bore size
Ò Different colours for blood sample bottles
■ Constraints Ò Prescribing combinations – electronic restrictions where lethal,
prescriber rights limited.
■ Make desired action the default Ò Care pathways
Ò Standard packs with everything in
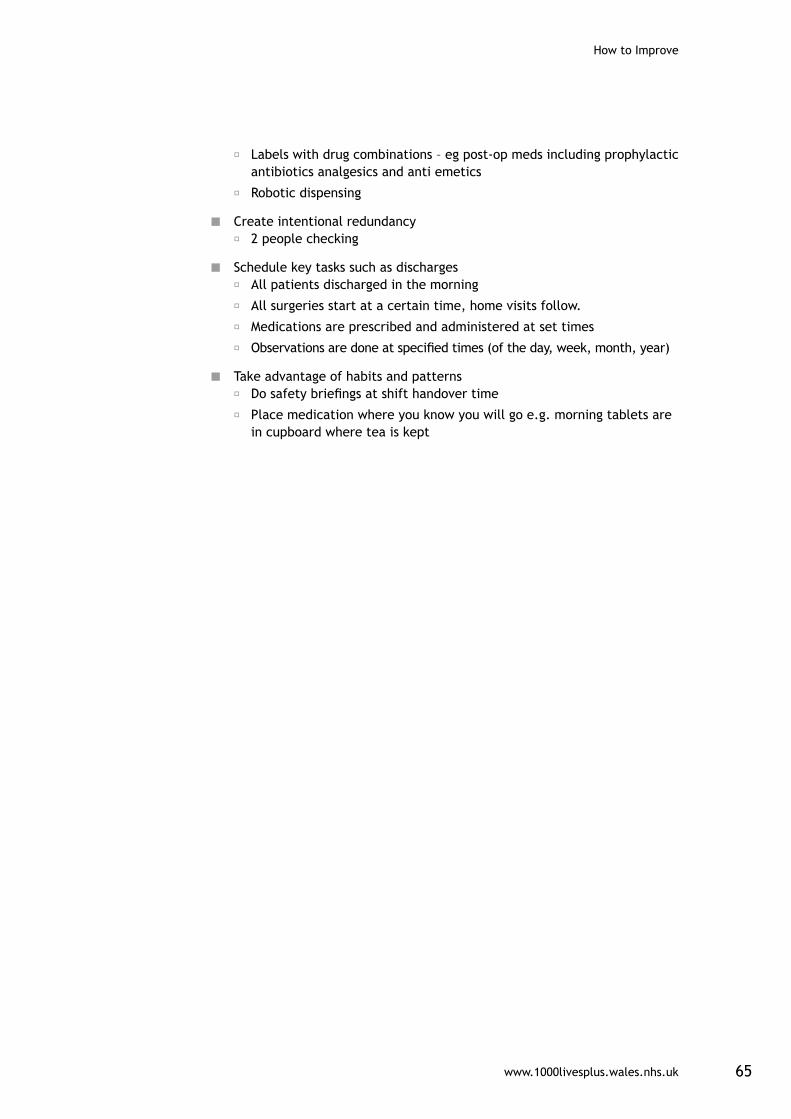
www.1000livesplus.wales.nhs.uk 65
How to Improve
Ò Labels with drug combinations – eg post-op meds including prophylactic antibiotics analgesics and anti emetics
Ò Robotic dispensing
■ Create intentional redundancy Ò 2 people checking
■ Schedule key tasks such as discharges Ò All patients discharged in the morning
Ò All surgeries start at a certain time, home visits follow.
Ò Medications are prescribed and administered at set times
Ò Observations are done at specified times (of the day, week, month, year)
■ Take advantage of habits and patterns Ò Do safety briefings at shift handover time
Ò Place medication where you know you will go e.g. morning tablets are in cupboard where tea is kept
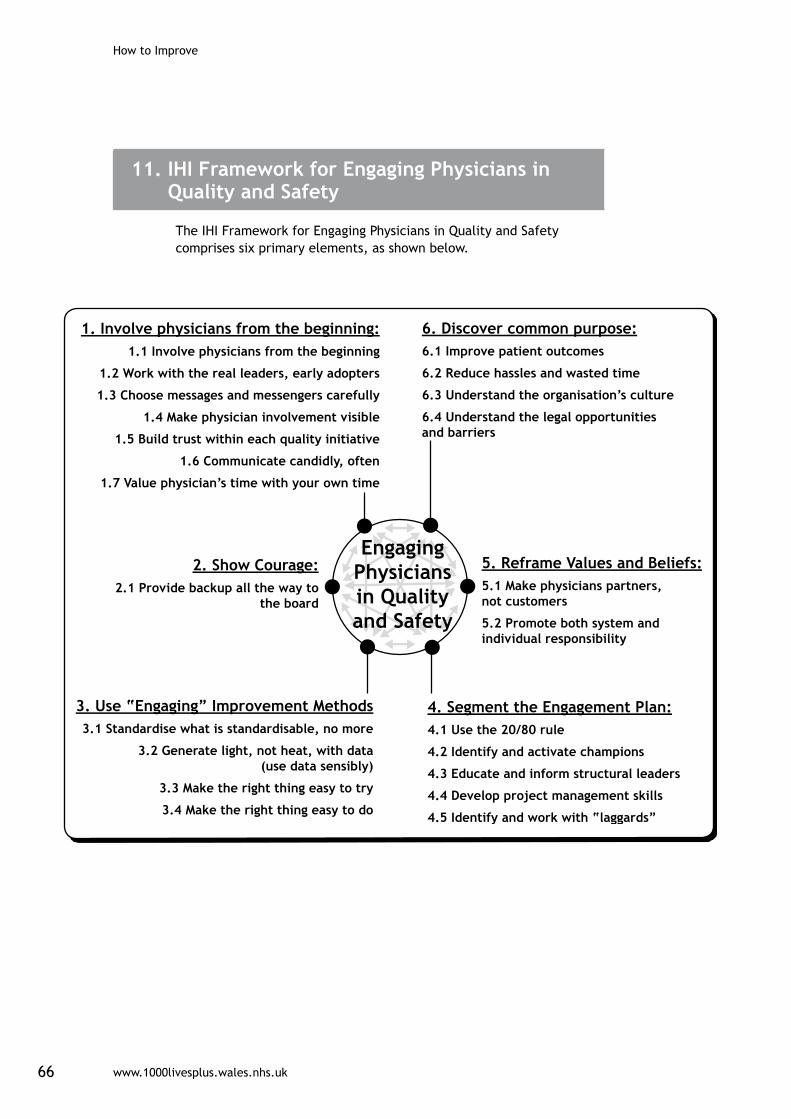
How to Improve
www.1000livesplus.wales.nhs.uk66
11. IHI Framework for Engaging Physicians in Quality and Safety
The IHI Framework for Engaging Physicians in Quality and Safety comprises six primary elements, as shown below.

www.1000livesplus.wales.nhs.uk 67
How to Improve
11. Glossary
Astronomical data point
A data point that looks different to the others on a run chart. These should be investigated. Put in to a SPC chart to check if the data point really is outside the process control limits.
Benchmarking The process of comparing performance levels with competitors or industry leaders.
Common Cause Variation
Those causes that are inherent within the process over time, affect everyone working in the process, and affect all outcomes of the process.
Control chart A graph used to display and monitor the extent to which a process is stable over a given period of time and to determine when a process is out of statistical control.
Denominator The lower portion of a fraction used to calculate a rate or ratio. In a rate, the denominator is usually the population under observation.
DICE score An assessment tool to calculate the probability of a project being successful.
Driver diagram A tool that helps us to articulate the theory for system improvements and guide the thinking to identify the interventions, or projects, required to achieved the improvement outcome.
Greenhalgh criteria
Criteria required for a successful improvement project developed by Professor Greenhalgh.
Hawthorne effect The Hawthorne effect is a form of reactivity whereby subjects improve an aspect of their behaviour simply because they are being observed experimentally rather than the effect of any experimental manipulation.
Implementing Implementing occurs when a reliable process has been developed and is expected to become normal practice in the pilot population.
Mean A number that is the average of a set of numbers.
Median Constitutes the middle value of an ordered set of values (or the average of the middle two in a set with an even number).
Model for Improvement
A roadmap for improvement: 3 basic questions followed by the PDSA cycle.
Numerator The number written above the fraction bar, indicating how many subjects are being considered.
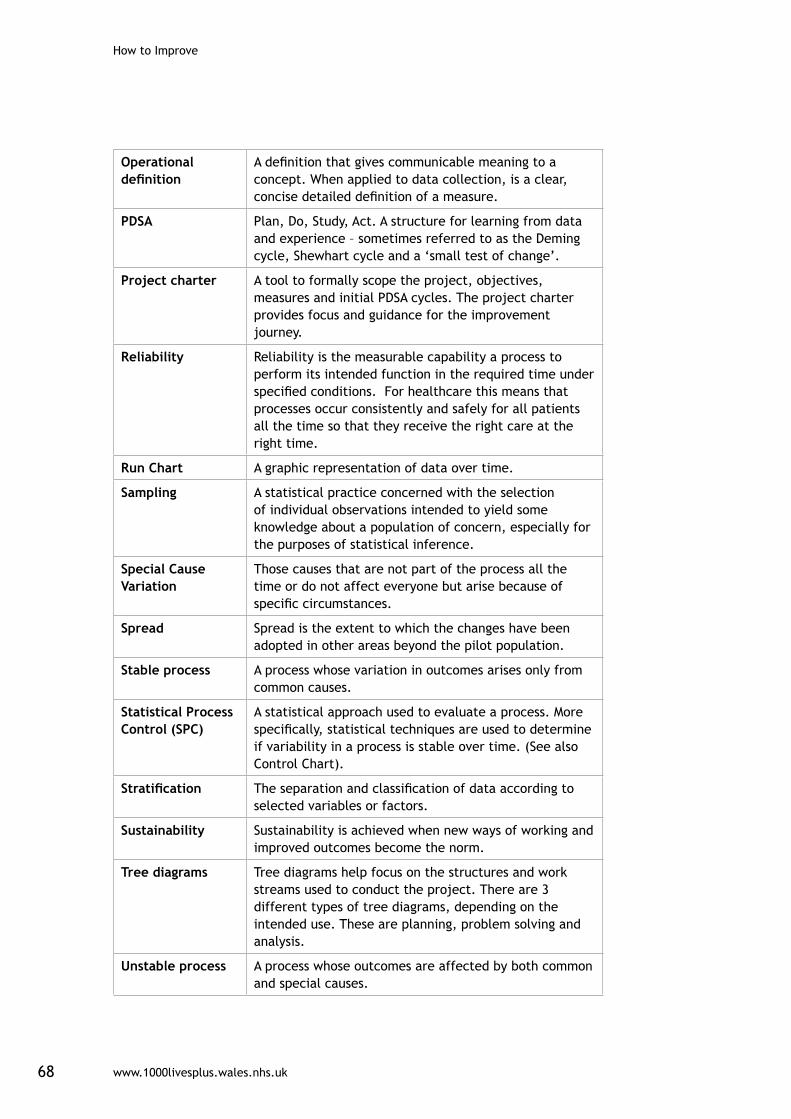
How to Improve
www.1000livesplus.wales.nhs.uk68
Operational definition
A definition that gives communicable meaning to a concept. When applied to data collection, is a clear, concise detailed definition of a measure.
PDSA Plan, Do, Study, Act. A structure for learning from data and experience – sometimes referred to as the Deming cycle, Shewhart cycle and a ‘small test of change’.
Project charter A tool to formally scope the project, objectives, measures and initial PDSA cycles. The project charter provides focus and guidance for the improvement journey.
Reliability Reliability is the measurable capability a process to perform its intended function in the required time under specified conditions. For healthcare this means that processes occur consistently and safely for all patients all the time so that they receive the right care at the right time.
Run Chart A graphic representation of data over time.
Sampling A statistical practice concerned with the selection of individual observations intended to yield some knowledge about a population of concern, especially for the purposes of statistical inference.
Special Cause Variation
Those causes that are not part of the process all the time or do not affect everyone but arise because of specific circumstances.
Spread Spread is the extent to which the changes have been adopted in other areas beyond the pilot population.
Stable process A process whose variation in outcomes arises only from common causes.
Statistical Process Control (SPC)
A statistical approach used to evaluate a process. More specifically, statistical techniques are used to determine if variability in a process is stable over time. (See also Control Chart).
Stratification The separation and classification of data according to selected variables or factors.
Sustainability Sustainability is achieved when new ways of working and improved outcomes become the norm.
Tree diagrams Tree diagrams help focus on the structures and work streams used to conduct the project. There are 3 different types of tree diagrams, depending on the intended use. These are planning, problem solving and analysis.
Unstable process A process whose outcomes are affected by both common and special causes.

www.1000livesplus.wales.nhs.uk
Improving care, delivering quality
If we can improve care for one person,then we can do it for ten.
If we can do it for ten, then we can do it for a 100.
If we can do it for a 100, we can do it for a 1000.
And if we can do it for a 1000, we can do it for everyone in Wales.