how to save a planet - on a budget: cleantech, the venture capital climate, and policy
DESCRIPTION
How to Save a Planet - On a Budgetfrom The Energy Collective & Sustainable Cities CollectiveHour 3: Cleantech, the Venture Capital Climate, and PolicyTRANSCRIPT

How to Save a Planet – On a Budget
Brought to you by
#GreenFinance
• Green Seeds: Venture Capital and Cleantech Startups
• Government Policy and Cleantech
Hour 3 (11:15 – 12:15 EST):

About this Webinar
• Submit your questions in the GotoWebinar presentation window
• Follow along and share your thoughts on Twitter at #GreenFinance
How you can share:
#GreenFinance

About Our Speakers
#TECLive
Will Coleman is a partner at Mohr Davidow Ventures. He has logged ten years in cleantech and has worked with startups, cleantech funds, and on project finance structures for new energy technologies. He previously worked as the Legislative Director for the New Fuels Alliance (Formerly REAP), for GE Wind in the commercial operations group, for Xseed Capital, and on a variety of renewable energy projects abroad.
Scott Edward Anderson is founder of VerdeStrategy, a consulting and advisory firm focused on the cleantech, energy, and environment sectors, and is a frequent commentator on FOX Business Network. He has over 20 years experience in management, marketing, fund raising and business development, and has held management positions institutions such as The Nature Conservancy and Ashoka, a social venture capital organization.
#GreenFinance
Daniel Shugar is CEO of Solaria, and has spent over twenty years advancing the renewable energy industry, most recently as president of SunPower Corporation, and previously of PowerLight. Mr. Shugar has invented various PV system applications, holds multiple U.S. patents and has published over 50 technical papers. Mr. Shugar holds a BS in electrical engineering from Rensselaer Polytechnic Institute and MBA from Golden Gate University.
Jesse Jenkins, moderating, is Director of Energy and Climate Policy at the Breakthrough Institute, and is a leading energy and climate analyst and advocate. Jesse's work and analysis has been featured in many media outlets, and he is recently the co-author of Bridging the Clean Energy Valleys of Death: Helping American Entrepreneurs Meet the Nation's Energy Innovation Imperative

Financing Cleantech InnovationWill Coleman
Energy Collective WebinarNovember 30, 2011

Firm Overview
Life Sciences
Cleantech
Information Technology

6
Cleantech Investment Continues
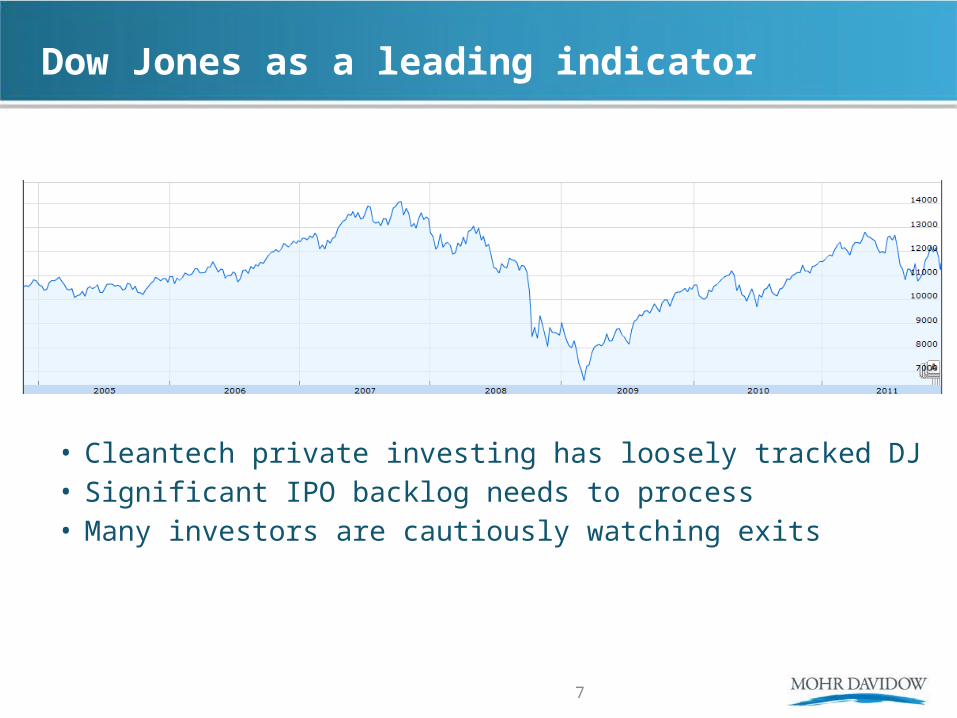
Dow Jones as a leading indicator
• Cleantech private investing has loosely tracked DJ• Significant IPO backlog needs to process• Many investors are cautiously watching exits
7

Increasing number of late stage deals

Corporate investors are active – particularly late
Source: Cleantech Market Insight Database

Asset financing and exits are evolving

Fundamental Drivers Remain Strong
Global population is living longer and richer

Macro trend continues unabated
Energy consumption rises with GDP

Energy prices will follow

14
Competition is still relatively cheap and plentiful

Commercialization of new technology requires scale
Series A Series B Series C+ IPO or MergerSeed
Develop conceptCreate IP
LabProve technical concept
PilotProve engineering feasibility
Demo
Prove commercial execution
Commercial
5-7 years
<$1m
$5-10m
$25-100m
Venture Financing
>$100m

Stages of financing
Series A Series B Series C+ IPO or MergerSeed
Develop conceptCreate IP
LabProve technical concept
PilotProve engineering feasibility
Demo
Prove commercial execution
Commercial
5-7 years
<$1m
$5-10m
$25-100m
Venture Financing
>$100m
Technical Risk
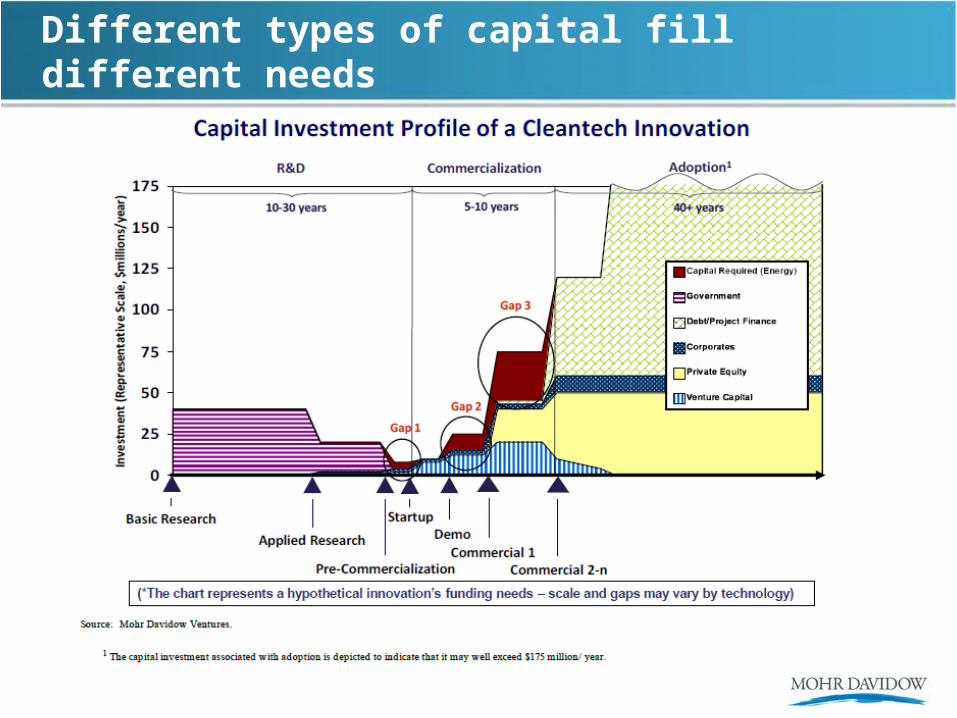
Different types of capital fill different needs

Financing – Typical Risks / Issues
• Early capital intensity before validation– Requires access to different sources of capital
(PE / debt / strategic / government)
• Late binding risk reduction – Economics of process only proven at scale
• Later stage investors’ interests might not be aligned with entrepreneurs and early stage investors– Cost of Capital less important to decision making

Things we have learned
• Build something that matters– Typically: difficult = differentiation = value capture
• Build something that can be a solution not a component
• Manage capital intensity– It’s as much about the timing as the total capital
• Cleantech investing is more complex than classic IT– Many more financing sources, strategic interests, policy, etc.
• Successful business development can beat technology (at least over the short run)

Financing Cleantech InnovationWill Coleman
Energy Collective WebinarNovember 30, 2011

Solar:Power Today
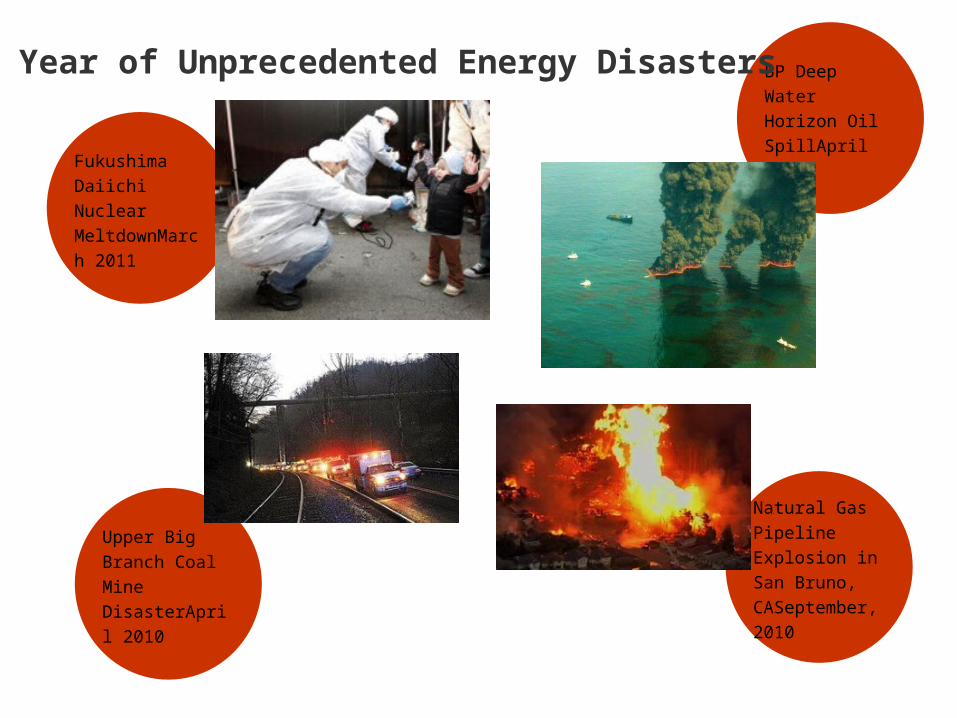
Fukushima
Daiichi Nuclear
MeltdownMarch
2011
BP Deep Water
Horizon Oil
SpillApril 2010
Natural Gas
Pipeline
Explosion in San
Bruno,
CASeptember,
2010
Upper Big
Branch Coal
Mine
DisasterApril
2010
A Year of Unprecedented Energy Disasters

Residential1-10 kW
Commercial Rooftop10 kW – 1 MW
Utility Scale1 MW– 250 MW
Solar Power Applications – Diverse Range

Solar Growing Rapidly, Averaging 65% Compound Annual Growth Rate for the Past 5 Years
17 nuclear power
plants worth
of solar peak
power
shipped in 2010
Source: PV Industry Growth Data from Paula Mints, Principal Analyst, Solar Services Program, Navigant

Global Solar Industry Growth has Produced Steadily Falling Prices
Sources: 1976 -1985 data from IPCC, Final Plenary, Special Report Renewable Energy Sources (SRREN), May 2011; 1985-2010 data from Paula Mints, Principal Analyst, Solar Services Program, Navigant; 2011 numbers based on current market data
Module Pricing Trends 1985-2011

US cell phone subscribers has risen from 5.3 million to 285 million in 15 years
Price
Technology and Adoption
Solar Adoption on High Tech Trajectory

Solar Price Drops MirrorHigh Tech Consumer Goods
DVD Players
Digital CamerasCell Phones
with plan
Driven by Innovation, Automation, and Scale
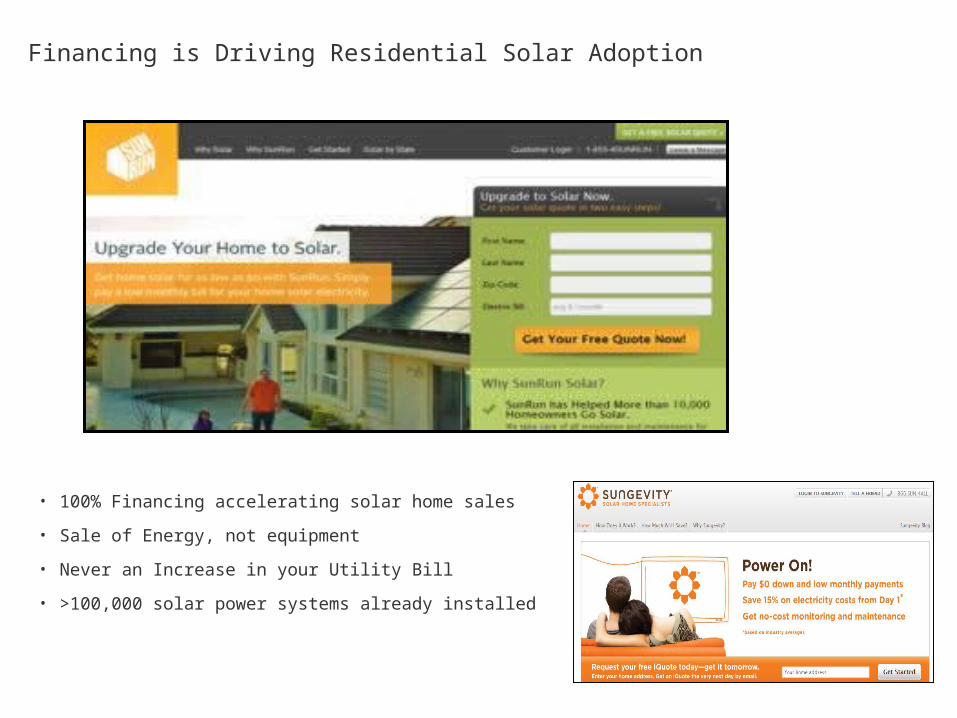
• 100% Financing accelerating solar home sales
• Sale of Energy, not equipment
• Never an Increase in your Utility Bill
• >100,000 solar power systems already installed
Financing is Driving Residential Solar Adoption

Solar is Less Expensive Than New Nuclear
Cen
ts p
er K
ilow
att H
our
Average time to permit and build a nuclear 1 GW power plant – 13 years. Average time to permit and build 1 GW solar – 1 year. The last nuclear power plant completed in the US, Watts Bar 1 in Tennessee, took 23 years 7 months to construct.
$0.139
$0.07
$0.129
$0.095
Sources: 2011 nuclear price is the mid-point of the LCOE range given by Lazard, version 5.0. 2020 nuclear price is illustrative, calculated assuming 3.5% annual escalation; 2011 & 2016 PV Prices from DOE, Advanced Research Projects Agency - Energy, $1/Watt Photovoltaic Systems, May 2011, 2020 PV price illustrative, assuming 4% annual cost reduction from 2016
(further validated by prices bid by solar developers into the California markets).

Solar Beats Natural Gas Peak Power TodayC
ents
per
Kilo
wat
t Hou
r
$0.226
$0.139
$0.086
$0.238
250 MW Gas CT
Sources: 2011 gas price is the mid-point of the LCOE range given by Lazard, version 5.0. 2016 gas price is illustrative, calculated assuming 1% annual escalation; 2011 & 2016 PV Prices from DOE, Advanced Research Projects Agency - Energy, $1/Watt Photovoltaic Systems, May 2011 (further validated by prices bid by solar developers into the California markets).
Gas peakers pollute 3 times more than natural gas power plants.

Coal Plant 5%500 MW
New Coal Can’t Deliver Power for 6-8 Years, When Solar Will Be Competitive
Cen
ts p
er K
ilow
att H
our
$0.139
$0.07
$0.109
$0.07
Source: 2011 coal price is the mid-point of the LCOE range given by Lazard, version 5.0. 2020 coal price is illustrative, calculated assuming 5% annual escalation: 2011 & 2016 PV Prices from DOE, Advanced Research Projects Agency - Energy, $1/Watt Photovoltaic Systems, May 2011, 2020 PV price illustrative, assuming 4% annual cost reduction from 2016
(further validated by prices bid by solar developers into the California markets).
$0.08
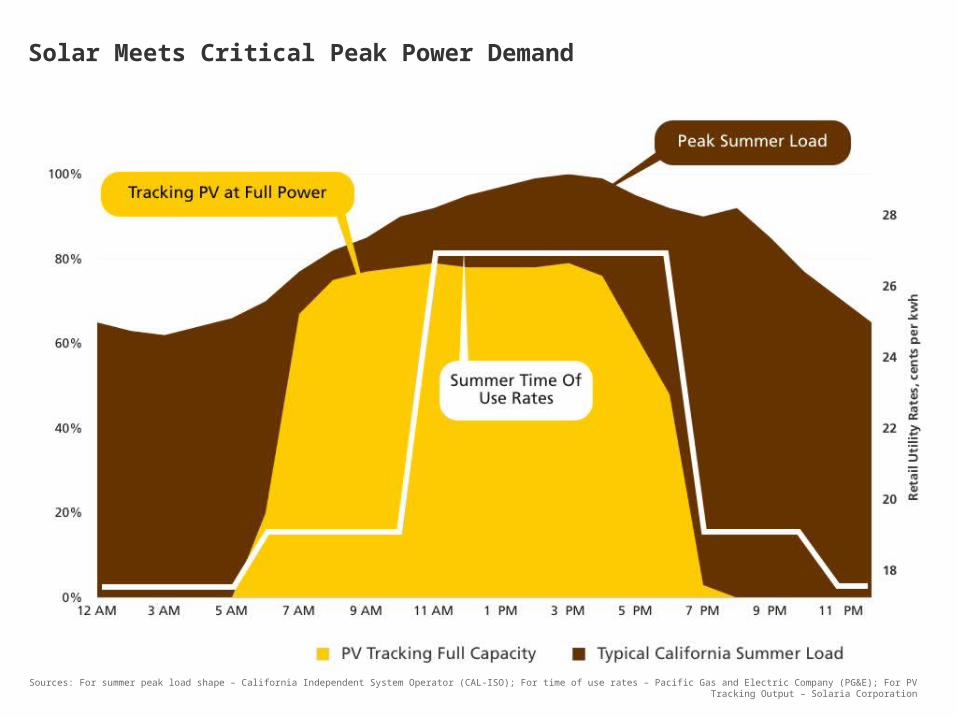
Solar Meets Critical Peak Power Demand
Sources: For summer peak load shape – California Independent System Operator (CAL-ISO); For time of use rates – Pacific Gas and Electric Company (PG&E); For PV Tracking Output – Solaria Corporation

Solar Creates U.S. Jobs
7x more jobs per MWthan coal
Sources: Kammen, David M et al, 2004, Report of the Renewable and Appropriate Energy Lab, Putting Renewables to Work: How Many Jobs Can the Clean Energy Industry Create?, Energy Resources Group, Goldman School of Public Policy, University of California, Berkeley.Wei, Max et al, 2010, Putting Renewables to Work: How Many Jobs Can
the Clean Energy Industry Create?, Energy Resources Group, Goldman School of Public Policy and the Haas School of Business, University of California, Berkeley, in Energy Policy, vol 38, issue 2, February 2010.
Solar Foundation 2011 National Jobs CensusU.S. Bureau of Labor Statistics: May 2010 National Industry-Specific Occupational Employment and Wage Estimates
100,237 Americans work in solar today
Solar employment grew 6.8% while the general economy grew 0.7%
20k
40k
60k
80k
100k
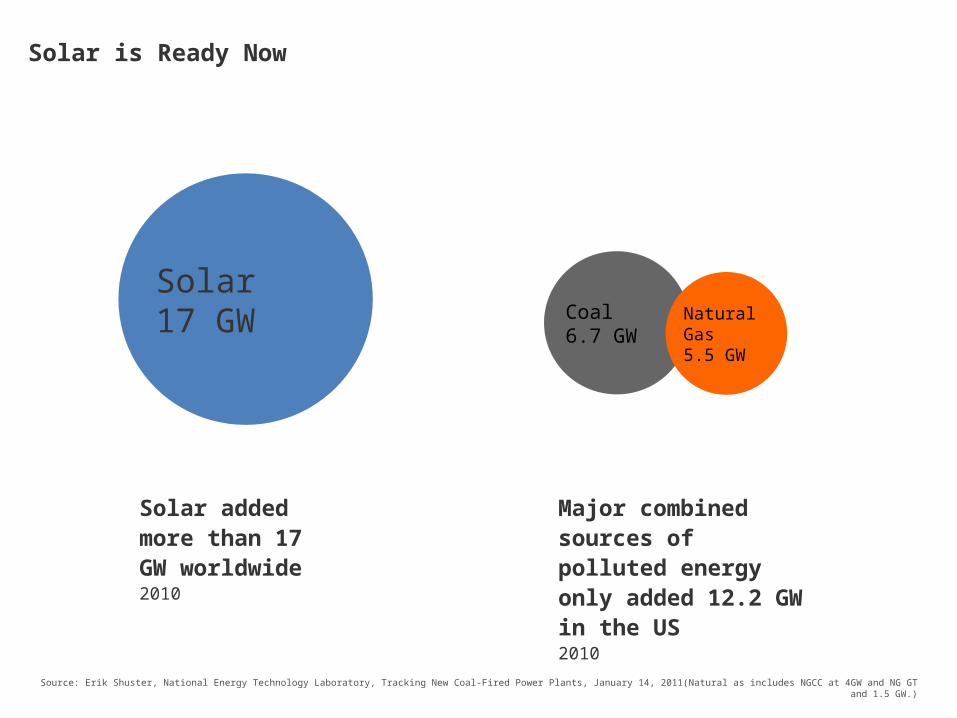
Solar is Ready Now
Solar17 GW
Solar added more than 17 GW worldwide2010
Major combined sources of polluted energy only added 12.2 GW in the US2010
Coal6.7 GW
Natural Gas5.5 GW
Source: Erik Shuster, National Energy Technology Laboratory, Tracking New Coal-Fired Power Plants, January 14, 2011(Natural as includes NGCC at 4GW and NG GT and 1.5 GW.)

Bipartisan Public Support for Clean Energy
91 percent of Americans say developing sources of clean energy should be a priority for the President and Congress
85% of Republicans
89% of Independents
97% of Democrats
Sources: Public Support for Climate & Energy Policies in May 2011, Yale Project on Climate Change.

Solar power will be the largest source of electricity in the U.S.
TW
H/y
r
To 2030 To 2040 To 2050
• Substitute Generation • Smartgrid• Flexible Generation
• Energy Storage
Sources: McKinsey Report, 2007 for starting points and energy efficiency; AWEA for wind; internal SunPower calculations for DPV, CPV, CSP
Transition to Renewables
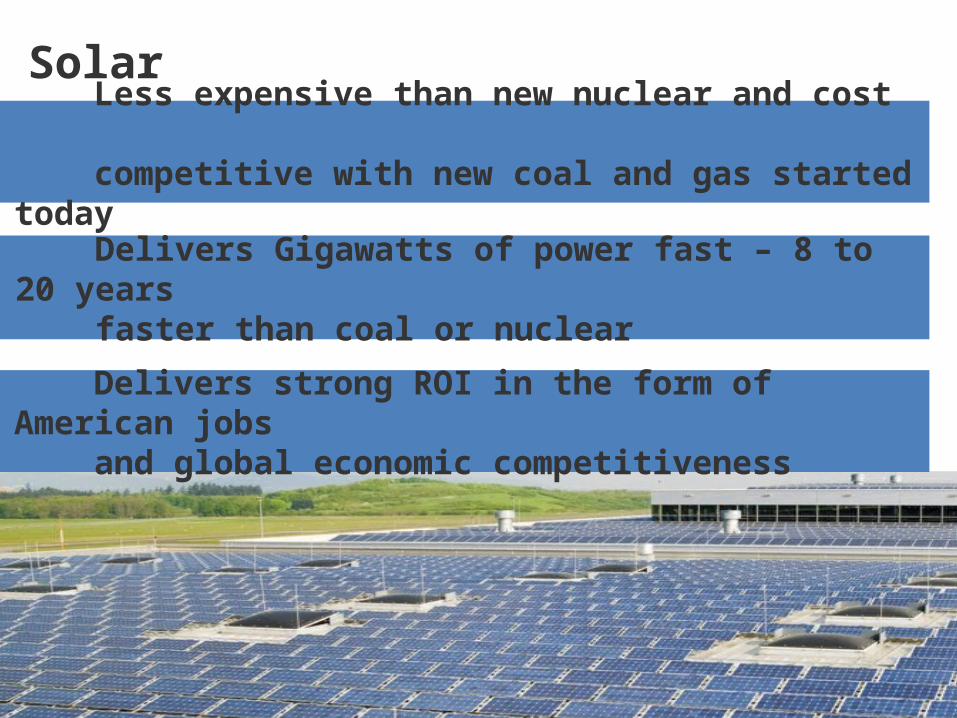
Solar Less expensive than new nuclear and cost competitive with new coal and gas started today Delivers Gigawatts of power fast – 8 to 20 years faster than coal or nuclear
Delivers strong ROI in the form of American jobs and global economic competitiveness

• Date and other infoThank You

How to Save a Planet – On a Budget
Brought to you by
#GreenFinance

#GreenFinance
Thank You for Joining Us
• Recordings of these sessions, and accompanying slide presentations, will be available at www.TheEnergyCollective.com and SustainableCitiesCollective.com. Stop by to learn more and share your comments.
• Connect with our panelists using the Search feature.