how we differ from consensus market...
TRANSCRIPT

PREPARED BY NON-US BROKER-DEALER(S): BNP PARIBAS SECURITIES (TAIWAN) LTD THIS MATERIAL HAS BEEN APPROVED FOR U.S DISTRIBUTION. ANALYST CERTIFICATION AND IMPORTANT DISCLOSURES CAN BE FOUND AT APPENDIX ON PAGE 17
Remains sound
n We initiate at BUY with a TP of HKD43
We initiate on AAC Technology at BUY with a TP of HKD43. We
expect AAC’s lead in audio mechanical design and technology to
help it expand market share in Chinese smartphone brands as they
grow in popularity and manufacturers look for better quality designs.
n Apple’s product to boost near-term momentum
We forecast AAC’s 4Q13 sales and earnings will both grow 20% q-q,
boosted by pull-in demand from Apple. We expect AAC’s strong cost
control and lead in advanced technology to support its GM at c40%
and OPM at c25%, much higher than its peers’.
n Better product mix compared to peers
While competition from local makers such as Goertek and Merry
remains fierce, AAC enjoys much higher profitability due to its well-
controlled cost and higher-margin product mix. With potential share
gain in Chinese clients, we are positive on its outlook.
n Competitive concerns in the price: BUY on solid fundamentals
AAC’s share price has pulled back 20% from its peak six months
ago, mainly due to market concern on competition from local peers.
We expect AAC to deliver solid 17% earnings CAGR in 2012-15 on
the back of continued cross-selling of key products and market share
gains in China. The company is trading at 16x/14x our FY13/FY14
EPS estimate, which we find attractive given its promising growth
outlook. Our HKD43 TP is set at 17x our FY14 EPS estimate.
Customer break down by revenue in 1H13
Source: Company data; BNP Paribas estimates
Apple45%
Samsung15%
Xiaomi5%
HTC3%
Nokia10%
Amazon3%
Motorola3%
Others16%
3 OCTOBER 2013
INITIATION HONG KONG / TECHNOLOGY HARDWARE & EQUIPMENT
AAC TECHNOLOGIES HOLDINGS 2018 HK
BUY
TARGET PRICE HKD43.00
CLOSE HKD36.40
UP/DOWNSIDE +18.1%
HKD40.00 CHANGE IN TP +7.5%
HOW WE DIFFER FROM CONSENSUS MARKET RECS
TARGET PRICE (%) 5.7 POSITIVE 18
EPS 2013 (%) (4.1) NEUTRAL 9
EPS 2014 (%) (7.1) NEGATIVE 5
Laura Chen [email protected]
+886 2 8729 7052
Our research is available on Thomson One, Bloomberg, TheMarkets.com, Factset and on http://eqresearch.bnpparibas.com/index. Please contact your salesperson for
authorisation. Please see the important notice on the back page.
KEY STOCK DATA
YE Dec (RMB m) 2012A 2013E 2014E 2015E
Revenue 6,283 8,104 9,844 11,403
Rec. net profit 1,763 2,189 2,488 2,817
Recurring EPS (RMB) 1.44 1.78 2.03 2.29
EPS growth (%) 70.1 24.2 13.7 13.2
Recurring P/E (x) 20.0 16.1 14.2 12.5
Dividend yield (%) 2.0 1.9 2.1 2.4
EV/EBITDA (x) 15.2 12.9 11.1 9.6
Price/book (x) 5.8 4.2 3.2 2.6
Net debt/Equity (%) 1.4 2.2 (1.4) (6.2)
ROE (%) 32.6 30.3 25.7 22.7
Share price performance 1 Month 3 Month 12 Month
Absolute (%) 2.3 (16.8) 30.0
Relative to country (%) (2.7) (25.8) 18.3
Next results Novermber 2013
Mkt cap (USD m) 5,765
3m avg daily turnover (USD m) 26.1
Free float (%) 78
Major shareholder Chun Yuan Wu (21.4%)
12m high/low (HKD) 46.40/25.85
3m historic vol. (%) 46.9
ADR ticker -
ADR closing price (USD) -
Issued shares (m) 1,228
Sources: Bloomberg consensus; BNP Paribas estimates
(21)
(1)
19
39
59
22
27
32
37
42
47
Sep-12 Dec-12 Mar-13 Jun-13 Sep-13
(%)(HKD) AAC Technologies Holdings Rel to MSCI Hong Kong

AAC Technologies Holdings 2018 HK Laura Chen
2 BNP PARIBAS 3 OCTOBER 2013
Investment thesis
We expect AAC to deliver a solid 17% earnings CAGR in 2012-15 on the back of continued cross-selling of key products and market share gains in China. While competition from local makers such as Goertek and Merry remains fierce, AAC enjoys much higher profitability due to its well-controlled cost and higher-margin product mix. We expect AAC to benefit as demand for smartphones with better sound quality leads to demand for more expensive acoustic components.
For 4Q13, we forecast AAC’s sales and earnings will both grow 20% y-y, boosted by pull-in demand from Apple. We expect AAC’s strong cost control and lead in advanced technology to support its GM at c40% and OPM at c25%, much higher than its peers’.
AAC is the largest dynamic component supplier globally and the second largest MEMS microphone supplier, with c30% and c17% market shares. We expect AAC’s healthy growth to continue supported by its strong cost structure, stable yield rate and high quality products.
Catalyst
Although the market has been conservative on the sustainability of iPhone 5S/C momentum, we think AAC’s share at Apple remains intact. We also expect its Apple business to return to growth with Apple’s iPhone 6 launch in 2H14. While Apple remains its biggest client, AAC is looking to diversify. It has already penetrated Samsung’s and Chinese smartphone makers’ supply chains. On the back of secular growth of global smartphones and tablets, we expect AAC to continue benefitting from its clients’ growth. Moreover, we expect it to provide its customers with increasingly complete solutions including speaker boxes, receivers, MEMS microphones and antennas. AAC’s abundant cross-selling opportunities make us confident that the company has a strong growth outlook.
Risks to our call
Key downside risks to our P/E-based target price are worse-than-expected demand for mobile devices and faster-than-expected ASP deterioration.
Company background Key assumptions on product shipment
AAC Technologies is one of the world’s leading players of
vertically integrated miniature acoustic components and other
non-acoustic products. Founded in 1993, the company became
the key provider for well-known smartphone and tablet brands
such as Apple, Samsung, Nokia, RIM, and HTC as well as other
thriving Chinese OEMs. The company’s product segment can be
mainly divided into dynamic components, microphones, headsets
related, and other non-acoustic products.
(m units) 2013E 2014E 2015E
Receiver 366.6 402.8 402.8
Speaker 379.6 454.6 503.8
Speaker box 285.0 321.3 372.6
Microphone 304.9 303.5 303.5
Sources: Bloomberg consensus; BNP Paribas estimates
Principal activities: revenue by product, FY13E Earnings sensitivity
------ Base- ---- ------ Best ----- ------ Worst ----
2013 2014 2013 2014 2013 2014
Sales (RMB b) 8.1 9.8 8.2 10.0 8.0 9.7
Change (%)
1.3 1.7 (1.3) (1.7)
Speakerbox Shipment growth (%) 48.1 12.7 52.1 16.7 44.1 8.7
Change (%)
4.0 4.0 (4.0) (4.0)
OPM (%) 28.0 26.7 29.0 27.7 27.0 25.7
Change (%)
1.0 1.0 (1.0) (1.0)
EPS (RMB) 1.78 2.02 1.86 2.13 1.70 1.92
Change (%)
4.5 5.2 (4.5) (5.1)
Key executives Sources: Bloomberg consensus; BNP Paribas estimates
Title
Benjamin Zhengmin Pan CEO
Mok Joe Kuen Richard Executive Director
Ingrid Chunyuan Wu Non-executive Director
http://www.aactechnologies.com/
A 4% increase/decrease in speaker box shipment growth,
others unchanged, will increase/decrease the FY13/14
EPS forecast by 1.2%/1.6%, and sales by 1.3%/1.7%.
The effect of OPM changes is larger. A 1 %
increase/decrease in OPM alone will increase/decrease
the FY13/14E EPS by 3.3%/3.5%.
Receiver20.0%
Speaker15.5%
Speaker box47.7%
Microphone10.0%
Headset1.4%
Vibrator1.5%
Others3.9%

AAC Technologies Holdings 2018 HK Laura Chen
3 BNP PARIBAS 3 OCTOBER 2013
Initiate at BUY with a HKD43 TP
We initiate on AAC Technology at BUY with a TP of HKD43. AAC Technologies is a
world leading vertically-integrated miniature acoustic component and other non-
acoustic product manufacturer. Founded in 1993 and headquartered in Shenzhen,
the company became the key provider for well-known smartphone and tablet brands
such as Apple, Samsung, Nokia, RIM and HTC as well as other thriving Chinese
OEMs. Its sustainable growth comes from enhancing R&D capability, acquiring
companies with technology or customer base prominence, and integrated
manufacturing.
AAC’s revenue stream can be broadly divided into: dynamic components,
microphones, headsets-related products and other non-acoustic products:
§ Dynamic components: accounted for 80% of AAC’s revenue in 1H13; have
AAC’s highest gross margin (c45-50%); include receivers, speakers, speaker
boxes and multi-function devices.
§ Microphones: accounted for 11% of revenue in 1H13; includes Electret
Condenser Microphones (ECM) and MicroElectrical-Mechanical System (MEMS)
microphones.
§ Headsets: refers to wired stereo headsets
§ Other non-acoustic products: comprises antennas, optical lenses, vibrators
and ceramics products used in all kinds of smart mobile devices.
With rising demand for better stereo audio from mobile devices, speaker boxes have
become AAC’s key catalyst over the last two to three years. We expect AAC’s lead in
audio mechanical design and technology to help it expand market share in Chinese
smartphone brands as they grow in popularity and manufacturers look for better
quality designs.
EXHIBIT 1: AAC product segments
Segment Dynamic components Microphones Headsets Other products
Sales contribution 1H13 83% 11% 1% 5%
Gross profit margin 1H13 46% 30% 35% 24%
Products Speakers, speaker boxes, receivers
MEMS microphones
Wired stereo headsets
Antennas, optical lenses, vibrators and ceramics products
Customers Apple, Samsung, Nokia , RIM, HTC, Chinese brands
Apple, Nokia, RIM, HTC, Chinese brands
RIM, Motorola, Chinese brands
Market share Speaker boxes for smartphones: 35%
MEMS microphones: 20%
Competitors Speaker boxes: NXP Knowles, Analog devices, Goertek
Sources: Company; BNP Paribas estimates
Near-term momentum from Apple with upside from local clients
We expect AAC to deliver a solid earnings CAGR of 17% in 2012-2015 thanks to its
cross-selling advantage among key products and market share gain in China. While
competition from local makers such as Goertek (002241 CH, not rated) and Merry
(2439 TT, not rated) remains fierce, we note that AAC enjoys much better profitability
thanks to its well-controlled costs and higher-margin product mix. We expect AAC to
benefit as demand for smartphones with better sound quality leads to demand for
more expensive acoustic components.
For 4Q13, we forecast AAC’s sales and earnings will both grow 20% q-q, boosted by
pull-in demand from Apple. We expect AAC’s strong cost controls and lead in
advanced technology to support its GM at c40% and OPM at c25%, much higher
than its peers’. Although AAC plans to increase its revenue contribution from mid- to
low-end smartphones, we see no major downside risk to margins because: 1) we
expect high-end models (e.g. iPhones/iPads) to remain the biggest sales
contributors; and 2) AAC has completed development of automation lines that should
AAC Technologies Holdings 2018 HK Laura Chen
4 BNP PARIBAS 3 OCTOBER 2013
provide economies of scale in mass production. In addition, as audio performance
becomes a key differentiator in mobile devices, we forecast 48%/12.7% shipment
growth for speaker boxes in FY13/ FY14, with 10%+ growth afterwards for product
upgrades in mid-end phones. We forecast a favourable ASP trend for AAC based on
increasingly integrated designs.
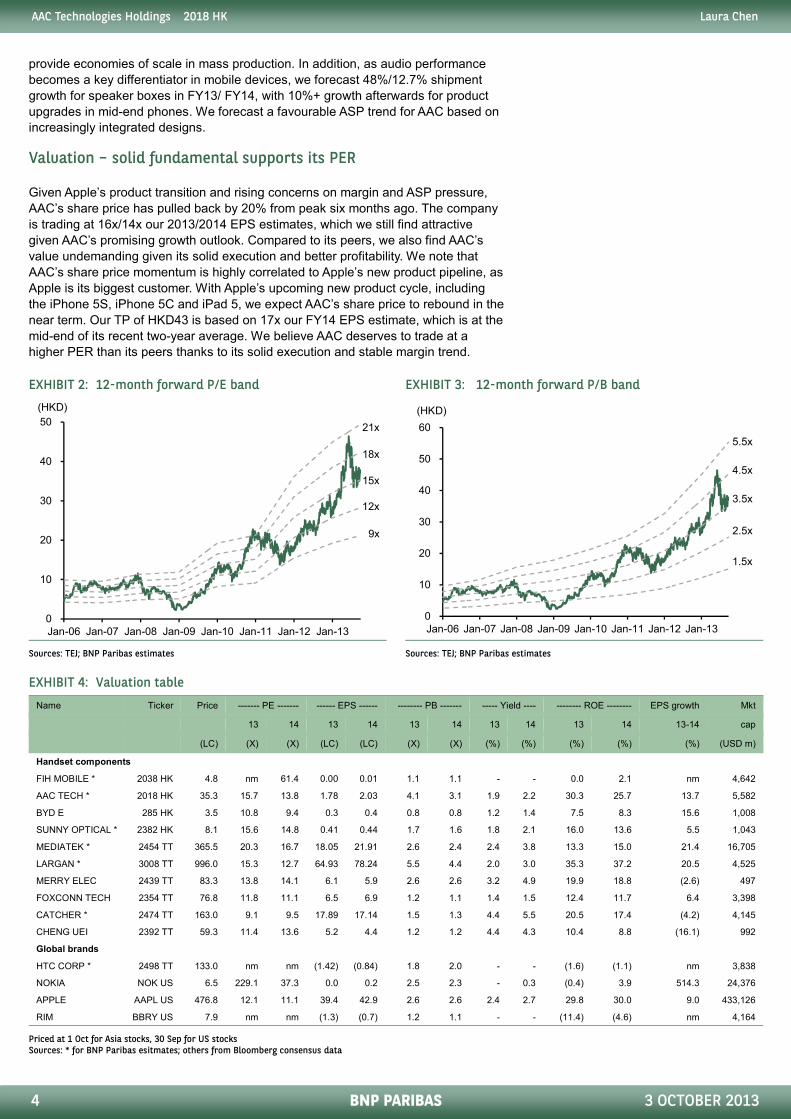
Valuation – solid fundamental supports its PER
Given Apple’s product transition and rising concerns on margin and ASP pressure,
AAC’s share price has pulled back by 20% from peak six months ago. The company
is trading at 16x/14x our 2013/2014 EPS estimates, which we still find attractive
given AAC’s promising growth outlook. Compared to its peers, we also find AAC’s
value undemanding given its solid execution and better profitability. We note that
AAC’s share price momentum is highly correlated to Apple’s new product pipeline, as
Apple is its biggest customer. With Apple’s upcoming new product cycle, including
the iPhone 5S, iPhone 5C and iPad 5, we expect AAC’s share price to rebound in the
near term. Our TP of HKD43 is based on 17x our FY14 EPS estimate, which is at the
mid-end of its recent two-year average. We believe AAC deserves to trade at a
higher PER than its peers thanks to its solid execution and stable margin trend.
EXHIBIT 2: 12-month forward P/E band EXHIBIT 3: 12-month forward P/B band
Sources: TEJ; BNP Paribas estimates Sources: TEJ; BNP Paribas estimates
EXHIBIT 4: Valuation table
Name Ticker Price ------- PE ------- ------ EPS ------ -------- PB ------- ----- Yield ---- -------- ROE -------- EPS growth Mkt
13 14 13 14 13 14 13 14 13 14 13-14 cap
(LC) (X) (X) (LC) (LC) (X) (X) (%) (%) (%) (%) (%) (USD m)
Handset components
FIH MOBILE * 2038 HK 4.8 nm 61.4 0.00 0.01 1.1 1.1 - - 0.0 2.1 nm 4,642
AAC TECH * 2018 HK 35.3 15.7 13.8 1.78 2.03 4.1 3.1 1.9 2.2 30.3 25.7 13.7 5,582
BYD E 285 HK 3.5 10.8 9.4 0.3 0.4 0.8 0.8 1.2 1.4 7.5 8.3 15.6 1,008
SUNNY OPTICAL * 2382 HK 8.1 15.6 14.8 0.41 0.44 1.7 1.6 1.8 2.1 16.0 13.6 5.5 1,043
MEDIATEK * 2454 TT 365.5 20.3 16.7 18.05 21.91 2.6 2.4 2.4 3.8 13.3 15.0 21.4 16,705
LARGAN * 3008 TT 996.0 15.3 12.7 64.93 78.24 5.5 4.4 2.0 3.0 35.3 37.2 20.5 4,525
MERRY ELEC 2439 TT 83.3 13.8 14.1 6.1 5.9 2.6 2.6 3.2 4.9 19.9 18.8 (2.6) 497
FOXCONN TECH 2354 TT 76.8 11.8 11.1 6.5 6.9 1.2 1.1 1.4 1.5 12.4 11.7 6.4 3,398
CATCHER * 2474 TT 163.0 9.1 9.5 17.89 17.14 1.5 1.3 4.4 5.5 20.5 17.4 (4.2) 4,145
CHENG UEI 2392 TT 59.3 11.4 13.6 5.2 4.4 1.2 1.2 4.4 4.3 10.4 8.8 (16.1) 992
Global brands
HTC CORP * 2498 TT 133.0 nm nm (1.42) (0.84) 1.8 2.0 - - (1.6) (1.1) nm 3,838
NOKIA NOK US 6.5 229.1 37.3 0.0 0.2 2.5 2.3 - 0.3 (0.4) 3.9 514.3 24,376
APPLE AAPL US 476.8 12.1 11.1 39.4 42.9 2.6 2.6 2.4 2.7 29.8 30.0 9.0 433,126
RIM BBRY US 7.9 nm nm (1.3) (0.7) 1.2 1.1 - - (11.4) (4.6) nm 4,164
Priced at 1 Oct for Asia stocks, 30 Sep for US stocks Sources: * for BNP Paribas esitmates; others from Bloomberg consensus data
0
10
20
30
40
50
Jan-06 Jan-07 Jan-08 Jan-09 Jan-10 Jan-11 Jan-12 Jan-13
(HKD)
18x
15x
12x
21x
9x
0
10
20
30
40
50
60
Jan-06 Jan-07 Jan-08 Jan-09 Jan-10 Jan-11 Jan-12 Jan-13
(HKD)
5.5x
4.5x
3.5x
1.5x
2.5x

AAC Technologies Holdings 2018 HK Laura Chen
5 BNP PARIBAS 3 OCTOBER 2013
EXHIBIT 5: AAC sales vs. Apple shipments
Sources: Company; BNP Paribas estimates (from industry checks of companies under our coverage)
Apple remains the biggest client but AAC is looking to diversify
Thanks to AAC’s lead in acoustic component and mechanical design and technology,
the company has already penetrated the supply chains of Apple, Samsung and
Chinese smartphone makers. While the market has been conservative about the
sustainability of Apple’s iPhone 5S/C momentum, we think AAC’s share at Apple
remains intact. We also expect its Apple business to return to growth with Apple’s
iPhone 6 launch in 2H14.On the back of the secular growth of the global smartphone
and tablet markets, we believe AAC will continue benefit from its clients’ expansion.
Moreover, we expect it to provide its customers with increasingly complete solutions
including speaker boxes, receivers, MEMS microphones and antennas. For instance,
AAC first penetrated Apple in 2007 when it provided speakers, receivers and MEMS
microphones. Apple has been its biggest customer since 2012 and has since
accounted for over 40% of AAC’s total sales. AAC currently provides multiple
products to Xiaomi including speaker boxes, receivers, MEMS microphones and
headphones. Xiaomi is likely to ship 15m smartphones in 2013 and it is targeting
40m units in 2014. We expect AAC to benefit from the rise in local brands like Xiaomi
in the Chinese smartphone market. AAC’s abundant cross-selling opportunities
make us confident that the company has a strong growth outlook.
EXHIBIT 6: Revenue by customer at 1H13
Sources: Company; BNP Paribas estimates
0
500
1,000
1,500
2,000
2,500
0
10
20
30
40
50
60
70
80
90
1Q
11
2Q
11
3Q
11
4Q
11
1Q
12
2Q
12
3Q
12
4Q
12
1Q
13
2Q
13
3Q
13
4Q
13
1Q
14
2Q
14
3Q
14
4Q
14
(RMB m)(m units) Apple shipment (iPhone+iPad) Sales (RHS)
Apple45%
Samsung15%
Xiaomi5%
HTC3%
Nokia10%
Amazon3%
Motorola3%
Others16%

AAC Technologies Holdings 2018 HK
6
Diversified product mix
Speakers and speaker boxes to drive growth
Speaker boxes accounted for 48% of AAC’s revenue in 1
growth driver because of their high ASP and increasing
tablets. AAC’s patented design ensures top quality
speakers. This enables mobile device producers to design slimmer products.
Also, with audio and image performance becoming the major differentiators in these
devices, AAC is reaping rewards from its R&D investment
speaker box/antenna solutions.
Demand for speaker boxes is also growing to support high
video playback: tablets are equipped with speaker
expect demand from local producers as well as for
EXHIBIT 7: Speaker box growth trend and sales contribution
Sources: Company; BNP Paribas estimates
EXHIBIT 8: Integrated speaker
Source: Company
Rising demand for MEMS microphones
The MEMS (Micro Electrical-Mechanical System)
microphone chip or silicon microphone. Compar
Condenser Microphones) microphones, MEMS consumes less power, allows
massive automatic production, and offers better audio quality. Dual MEMS
microphones enable noise cancellation, which
As an example the iPhone 5 has three to improve sound
application.
According to IHS, AAC is ranked second globally
revenue among MEMS microphone suppliers in
0
1,000
2,000
3,000
4,000
5,000
6,000
2011 2012
(RMB m) Sales (LHS)
BNP PARIBAS
growth
revenue in 1H13 and are AAC’s main
increasing adoption in smartphones and
top quality sound with 0.5-1.8mm lower
his enables mobile device producers to design slimmer products.
ith audio and image performance becoming the major differentiators in these
R&D investment in the likes of dual function
support high-performance gaming and
speaker-boxes for high-quality audio. We
as well as for Apple iPads.
Speaker box growth trend and sales contribution
Mechanical System) microphone is also called a
Compared to traditional ECM (Electret
microphones, MEMS consumes less power, allows
massive automatic production, and offers better audio quality. Dual MEMS
es enable noise cancellation, which is a requirement for mobile phones.
iPhone 5 has three to improve sound recognition of its Siri
globally with a 17% market share by
microphone suppliers in 2012. Despite a 57% y-y shipment
0
10
20
30
40
50
60
2013E 2014E
(%)Sales contribution (RHS)
Laura Chen
3 OCTOBER 2013

AAC Technologies Holdings 2018 HK Laura Chen
7 BNP PARIBAS 3 OCTOBER 2013
growth to 2.05b in the MEMS market in 2012, it forecasts double-digit growth for at
least three more years, expecting 4.65b to be shipped by 2016. AAC has completed
the major phase of automated production by the end of 2012; we believe it is ready
for top line growth with steadier margins.
EXHIBIT 9: Global MEMS microphones shipment forecast EXHIBIT 10: MEMS mic. market share by revenue 2012
Sources: IHS; BNP Paribas estimates Sources: IHS; BNP Paribas estimates
EXHIBIT 11: AAC’s MEMS microphone sales growth trend and sales contribution
Sources: Company; BNP Paribas estimates
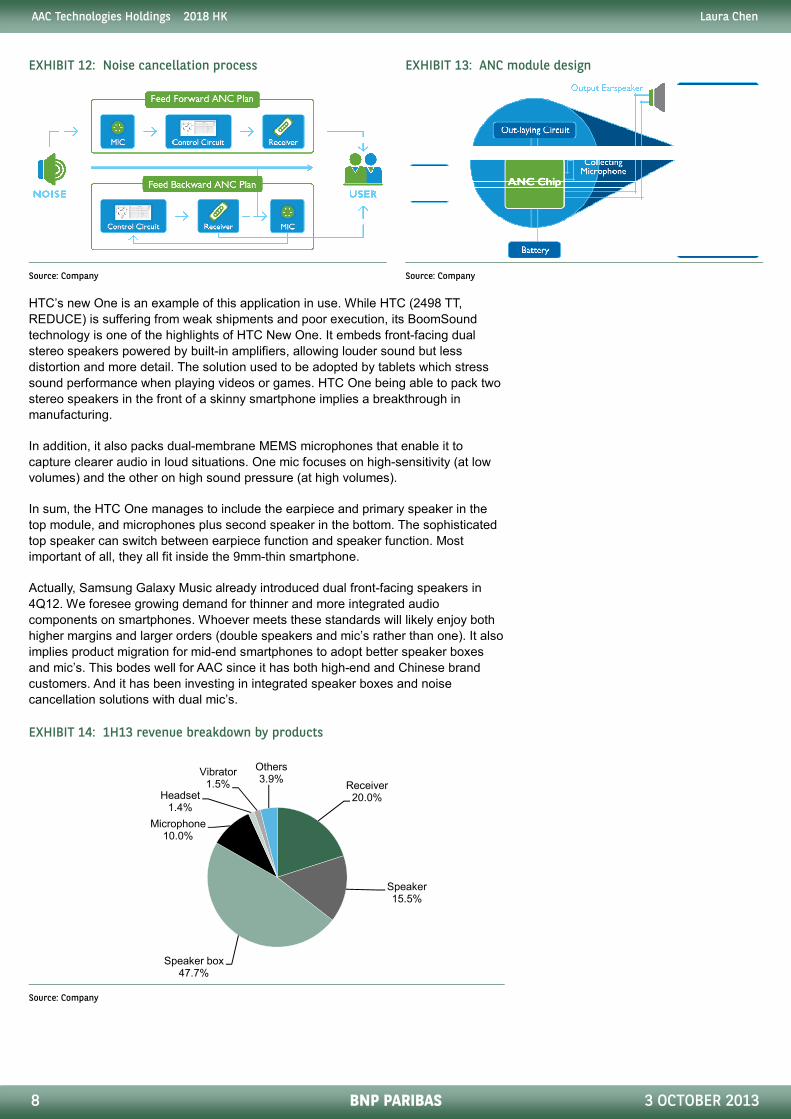
Dual Microphone noise cancellations solution
Noise cancellation is achieved by using an electronic circuit to separate ambient
noise from the mix of human voice and noise. It is achieved with two microphones:
one close to the mouth to pick up the higher-intensity human voice, and the other
further away to pick up ambient noise. This can ensure that only the human voice
enters the communication channel and the listener only receives the same clarity of
voice. The technology is useful in noisy environments, a common issue for mobile
devices, and responds to needs for ambient noise reduction as wearable devices
lengthen the distance between device holders and microphones.
AAC’s ANC (Active Noise Cancellation) subsystem module includes a receiver,
microphones, a control circuit, and a power supply. ANC produces better signal-to-
noise ratios and clarity with low power consumption.
0.0
1.0
2.0
3.0
4.0
5.0
2012 2013E 2014E 2015E 2016E
(b units)
Knowles49.9%
AAC16.8%
Analog 13.6%
Goertek7.9%
STMicro3.6%
Others8.2%
0
2
4
6
8
10
12
0
100
200
300
400
500
600
700
800
900
2011 2012 2013E 2014E
(%)(RMB m) Sales (LHS) Sales contribution (RHS)
AAC Technologies Holdings 2018 HK Laura Chen
8 BNP PARIBAS 3 OCTOBER 2013
EXHIBIT 12: Noise cancellation process EXHIBIT 13: ANC module design
Source: Company Source: Company
HTC’s new One is an example of this application in use. While HTC (2498 TT,
REDUCE) is suffering from weak shipments and poor execution, its BoomSound
technology is one of the highlights of HTC New One. It embeds front-facing dual
stereo speakers powered by built-in amplifiers, allowing louder sound but less
distortion and more detail. The solution used to be adopted by tablets which stress
sound performance when playing videos or games. HTC One being able to pack two
stereo speakers in the front of a skinny smartphone implies a breakthrough in
manufacturing.
In addition, it also packs dual-membrane MEMS microphones that enable it to
capture clearer audio in loud situations. One mic focuses on high-sensitivity (at low
volumes) and the other on high sound pressure (at high volumes).
In sum, the HTC One manages to include the earpiece and primary speaker in the
top module, and microphones plus second speaker in the bottom. The sophisticated
top speaker can switch between earpiece function and speaker function. Most
important of all, they all fit inside the 9mm-thin smartphone.
Actually, Samsung Galaxy Music already introduced dual front-facing speakers in
4Q12. We foresee growing demand for thinner and more integrated audio
components on smartphones. Whoever meets these standards will likely enjoy both
higher margins and larger orders (double speakers and mic’s rather than one). It also
implies product migration for mid-end smartphones to adopt better speaker boxes
and mic’s. This bodes well for AAC since it has both high-end and Chinese brand
customers. And it has been investing in integrated speaker boxes and noise
cancellation solutions with dual mic’s.
EXHIBIT 14: 1H13 revenue breakdown by products
Source: Company
Receiver20.0%
Speaker15.5%
Speaker box47.7%
Microphone10.0%
Headset1.4%
Vibrator1.5%
Others3.9%

AAC Technologies Holdings 2018 HK Laura Chen
9 BNP PARIBAS 3 OCTOBER 2013
Product diversification in non-acoustic continues
While non-acoustic component’s sales contribution remains small at only 5% in
2Q13, AAC has been working on product diversification for many years, including
antennas, camera lenses, etc. The company has successfully provided Antenna
solutions to Oppo, XiaomiMetc in the Chinese smartphone market. AAC offers
integrated solutions of an antenna with a speaker box. It can be incorporated with
NFC (Near Field Communication) technology, which can be used in swiped proximity
payments, information exchange at small distances, and simplified setup of devices
such as Wi-Fi/Bluetooth.
EXHIBIT 15: AAC products for smartphone and tablet devices
Source: Company
EXHIBIT 16: NFC used in integrated speaker box
Sources: Company; BNP Paribas
Speaker Speaker Box
LDS/FPC/NFCAntenna
Integratedmodule
LDS FPC NFC

AAC Technologies Holdings 2018 HK Laura Chen
10 BNP PARIBAS 3 OCTOBER 2013
Competitive landscape- Unique position in handset component industry
Starting as an acoustic component maker, AAC Technology has diversified itself into
a mechanical parts supplier for mobile devices. While we see rising competition from
its local peers, in particular Goertek, we believe its industry leadership remains intact
on the back of AAC’s better technology and long term R&D commitment. AAC has
become the largest Dynamic component supplier with over 30% market share
globally, according to our estimate; its MEMS microphone has seen promising growth
in the past few years as the second largest globally with about 17% market share.
We believe its better cost structure, stable yield rate and quality is the key success
factors for the company.
EXHIBIT 17: 1H13 revenue breakdown by product – AAC EXHIBIT 18: 1H13 revenue breakdown by product – Goertek
Source: Company Source: Company
EXHIBIT 19: 1H13 revenue breakdown by customer – AAC
EXHIBIT 20: 1H13 revenue breakdown by customer – Goertek
Source: Company Source: Company
Receiver20.0%
Speaker15.5%
Speaker box47.7%
Microphone10.0%
Headset1.4%
Vibrator1.5%
Others3.9%
Receiver10%
Speaker13%
Speaker box16%
Microphone5%
Earpod20%
Others36%
Apple45%
Samsung15%
Xiaomi5%
HTC3%
Nokia10%
Amazon3%
Motorola3%
Others16%
Apple39%
Samsung29%
Nokia6%
Huawei6%
Sony9%
Microsoft4%
Others7%

AAC Technologies Holdings 2018 HK Laura Chen
11 BNP PARIBAS 3 OCTOBER 2013
EXHIBIT 21: Margin trends of AAC and Goertek EXHIBIT 22: Sales trends of AAC and Goertek
Source: Companies Source: Companies
Financial analysis- Steady ROE and solid Cash Flow
DuPont analysis
AAC shows a stable ROE trend, maintaining a relatively higher level among its
peers. From 2010, AAC increased capex, mostly funded by short-term debt,
increasing the asset-to-equity ratio. The investment aimed at product line automation
and expansion into the smartphone business, reaped 52% and 21% y-y sales growth
in 2010 and 2011 which led to a higher asset turnover. In 2012, sales grew 55% y-y
further with ROE reaching a record high since 2005 of 28.7%.
EXHIBIT 23: ROE peer comparison 1H13 EXHIBIT 24: DuPont analysis
Source: Companies Source: Company
Capex and cash flow
AAC’s group automation plan is aimed at supporting the diversification of its product
portfolio especially into smartphone and tablet business. Investment for the plan
began in 2010 and was completed in 1H13. AAC’s overall capex peaked in 2012 at
RMB1,163m. The expenditure led to a negative free cash flow in 2011, but turned
around in 2012 as surging sales growth generated larger operating cash flows. The
capex to sales ratio also declined to 19%. The increased automation rate expanded
its capacity for larger orders from smartphones capturing growth in tablet markets.
From 2014, spending will focus more on non-acoustic areas.
% 0
% 5
% 10
% 15
% 20
% 25
% 30
% 35
% 40
% 45
% 50
1H10 2H10 1H11 2H11 1H12 2H12 1H13
(%)AAC GPM AAC OPM
Goertek GPM Goertek OPM
0
500
1,000
1,500
2,000
2,500
3,000
3,500
4,000
4,500
5,000
1H10 2H10 1H11 2H11 1H12 2H12 1H13
(RMB m) AAC Goertek
0
10
20
30
40
50
60
2005 2006 2007 2008 2009 2010 2011 2012 1H13
(%) AAC Goertek
Dover Merry Elec.
0.0
0.2
0.4
0.6
0.8
1.0
1.2
1.4
1.6
0
5
10
15
20
25
30
35
2005 2006 2007 2008 2009 2010 2011 2012 1H13
(x)(%) Net margin (%) Asset/Equity (x)
Asset Turnover (x)

AAC Technologies Holdings 2018 HK Laura Chen
12 BNP PARIBAS 3 OCTOBER 2013
EXHIBIT 25: CAPEX and capex to sales ratio trend EXHIBIT 26: Operating cash flow and free cash flow
Sources: Company; BNP Paribas estimates Sources: Company; BNP Paribas estimates
Balance sheet
AAC has maintained stable AR, AP, and inventory days despite a short decline of
inventory days in 2010 due to the commencement of the automation plan and
successful breakthrough into smart device business. The cash conversion days were
around 130 to 140 days, higher than its peers due to lower AP days.
EXHIBIT 27: Cash conversion days EXHIBIT 28: AR/AP/Inventory days
Source: Company Source: Company
AAC had an equity-to-asset ratio at around 70% and held nearly no long-term debt
from 2005 to 2010. Even in 2012, it had only RMB44m of long-term debt, or 1.6% of
its total liabilities. While most of the debt financing came from short-tern bank loans,
it still managed to maintain its working capital and current ratio at a safe level. The
gearing ratio, computed by dividing short-term bank loans by total assets, was 11.6%
by end of 2012, compared to 13.3% in 2011. Even with heavy investments on
automation, management believes that the current cash and equivalents, credit
facilities, and expected operating cash flows will be sufficient for fulfilling operational
requirements.
EXHIBIT 29: Balance sheet summary
2010 2011 2012 2013E 2014E 2015E
(RMB m) (RMB m) (RMB m) (RMB m) (RMB m) (RMB m)
Cash and cash equivalent 1,735 1,374 1,314 1,213 1,557 2,259
Inventory & Prepaid 343 559 958 1,274 1,575 1,838
Current Assets 3,402 3,425 4,607 5,322 6,373 7,631
Current Liability 1,408 1,887 2,751 3,081 3,339 3,508
Working capital 1,994 1,538 1,856 2,240 3,034 4,122
Current ratio 2.4 1.8 1.7 1.7 1.9 2.2
Acid ratio 2.2 1.5 1.3 1.3 1.4 1.7
Source: Company
0 %
5 %
10 %
15 %
20 %
25 %
30 %
0
200
400
600
800
1,000
1,200
1,400
2010 2011 2012 2013E 2014E
(%)(RMB m) Capex (LHS) Capex to sales ratio (RHS)
(500)
0
500
1,000
1,500
2,000
2,500
3,000
2010 2011 2012 2013E 2014E
(RMB m) Operating cash flow Free cash flow
0
20
40
60
80
100
120
140
160
180
2006 2007 2008 2009 2010 2011 2012 1H13
(days)
0
20
40
60
80
100
120
2006 2007 2008 2009 2010 2011 2012 1H13
(days) AR days AP days Inventory days

AAC Technologies Holdings 2018 HK Laura Chen
13 BNP PARIBAS 3 OCTOBER 2013
EXHIBIT 30: AAC’s quarterly P&L
1Q13 2Q13 3Q13E 4Q13E 1Q14E 2Q14E 3Q14E 4Q14E 2012 2013E 2014E
(RMB m) (RMB m) (RMB m) (RMB m) (RMB m) (RMB m) (RMB m) (RMB m) (RMB m) (RMB m) (RMB m)
Net sales 1,905 1,926 1,943 2,331 2,100 2,279 2,631 2,834
6,283 8,104 9,844
Gross profit 814 825 812 984 880 960 1,073 1,160
2,774 3,435 4,073
Operating profit 533 569 526 641 571 625 686 744
1,849 2,270 2,626
Pretax income 587 595 563 678 608 662 723 781
2,016 2,424 2,774
Net income 534 542 506 608 546 594 649 700
1,763 2,189 2,488
EPS (RMB cents) 43.47 44.10 41.18 49.53 44.44 48.37 52.81 57.01
143.54 178.29 202.63
Margin (%)
Gross margin 42.7 42.8 41.8 42.2 41.9 42.1 40.8 40.9
44.2 42.4 41.4
Operating margin 28.0 29.6 27.1 27.5 27.2 27.4 26.1 26.2
29.4 28.0 26.7
Net margin 28.0 28.1 26.0 26.1 26.0 26.1 24.7 24.7
28.1 27.0 25.3
Growth (y-y %)
Net sales 59.7 37.9 14.5 16.8 10.3 18.3 35.4 21.6
54.8 29.0 21.5
Gross profit 58.9 34.6 8.7 9.1 8.1 16.3 32.1 17.9
55.5 23.8 18.6
Operating profit 60.0 30.9 2.1 13.5 7.1 9.8 30.3 16.0
62.8 22.8 15.7
Pretax income 67.3 32.0 1.0 3.3 3.6 11.2 28.3 15.1
76.6 20.2 14.4
Net income 69.9 33.3 (0.1) 13.5 2.2 9.7 28.2 15.1
70.1 24.2 13.7
Growth (q-q%)
Net sales (4.6) 1.1 0.9 20.0 (9.9) 8.5 15.5 7.7
Gross profit (9.7) 1.4 (1.6) 21.1 (10.6) 9.1 11.7 8.2
Operating profit (5.6) 6.8 (7.5) 21.8 (10.9) 9.5 9.7 8.4
Pretax income (10.6) 1.4 (5.3) 20.3 (10.3) 8.9 9.2 8.0
Net income (0.4) 1.4 (6.6) 20.3 (10.3) 8.9 9.2 7.9
Sources: Company; BNP Paribas estimates

AAC Technologies Holdings 2018 HK Laura Chen
14 BNP PARIBAS 3 OCTOBER 2013
Appendix 1- Company’s M&A history since 2007
AAC has been investing in acoustic and non-acoustic technologies to diversify its
product portfolio. For acoustic technology, AAC acquired the entire LTCC (Low
Temperature Co-fired Ceramic) division of Sam Young Electronics in 2009. This
enabled AAC to bridge the technology gap to embed multi-layer ceramic technology
and build more complete acoustic-RF integrated modules and imaging component
solutions. In 2010, it acquired I. Square Research, a Japanese micro-lens design
consultancy company, to target high-resolution handset cameras. Recently, the
company increased its share of MEMS Tech. to 60%, which it initially acquired in
2011 to support its MEMS application development.
AAC shows rapid expansion in the non-acoustic field acquisition in recent years. It
invested 16.7% equity of Heptagon, a Finnish company specializing in wafer level
optical lens technology, for developing low-resolution front handset cameras. It also
invested 81.3% equity of Kaleido, a private Danish company engaged in wafer-level
glass moulding, for mid-end handset cameras. It acquired 39.15% equity of Xenon,
the company famous for its flash lamp and modules in consumer photography.
EXHIBIT 31: Summary of AAC’s M&A history
Time Target company Investment Invested amount Acquired technology Enhanced solution
1H13 Mems Technology Another 10% equity (thereby increase to 60.0%)
RMB5.6m MEMS product design and manufacture MEMS product
1H12 Kaleido Technology Another 10.4% equity (thereby increase to 81.3%)
DKK12.6m (RMB13.4m) Wafer-level glass moulding technology Micro-optics
2H11 Mems Technology 50.0% equity RMB38.3m MEMS product design and manufacture MEMS product
1H11 Kaleido Technology Another 38.95% equity (thereby increase to 70.9%)
DKK35.1m (RMB43.8m) Wafer-level glass moulding technology Micro-optics
2H10 I. Square Research 96.4% equity RMB12.3m Lens design consultancy Lens
1H10 Xenon Technologies 39.15% equity RMB75.2m in total Xenon-based flash lamp & flash modules Micro-optics
1H10 Kaleido Technology 31.95% equity Wafer-level glass moulding technology Micro-optics
1H09 Heptagon Oy 16.7% equity (decrease to 16.4% in 2010)
RMB27.7m Reflowable WLO polymer on glass lens technology
Micro-optics
1H09 Sam Young Electronics 100.00% equity RMB15.0m Embed multi-layer ceramic technology Acoustic & optical
2H08 Beijing Technology 51.00% equity RMB1.7m Application specific integrated circuits design Acoustic & wireless
2H07 AAC Wireless Technologies AB
76.00% equity RMB7.7m Antenna design technology Wireless solution
Source: Company

AAC Technologies Holdings 2018 HK Laura Chen
15 BNP PARIBAS 3 OCTOBER 2013
Financial statements AAC Technologies Holdings
Profit and Loss (RMB m) Year Ending Dec 2011A 2012A 2013E 2014E 2015E
Revenue 4,060 6,283 8,104 9,844 11,403
Cost of sales ex depreciation (2,014) (3,163) (4,296) (5,335) (6,241)
Gross profit ex depreciation 2,046 3,120 3,809 4,509 5,162
Other operating income 0 0 0 0 0
Operating costs (649) (925) (1,165) (1,447) (1,676)
Operating EBITDA 1,397 2,194 2,644 3,062 3,485
Depreciation (262) (345) (374) (436) (493)
Goodwill amortisation 0 0 0 0 0
Operating EBIT 1,136 1,849 2,270 2,626 2,993
Net financing costs (66) 36 40 28 28
Associates 0 0 0 0 0
Recurring non operating income 71 131 114 120 120
Non recurring items 0 0 0 0 0
Profit before tax 1,142 2,016 2,424 2,774 3,141
Tax (109) (259) (240) (291) (330)
Profit after tax 1,033 1,757 2,184 2,482 2,811
Minority interests 3 6 6 6 6
Preferred dividends 0 0 0 0 0
Other items 0 0 0 0 0
Reported net profit 1,036 1,763 2,189 2,488 2,817
Non recurring items & goodwill (net) 0 0 0 0 0
Recurring net profit 1,036 1,763 2,189 2,488 2,817
Per share (RMB)
Recurring EPS * 0.84 1.44 1.78 2.03 2.29
Reported EPS 0.84 1.44 1.78 2.03 2.29
DPS 0.34 0.57 0.53 0.61 0.69
Growth
Revenue (%) 21.2 54.8 29.0 21.5 15.8
Operating EBITDA (%) 11.0 57.0 20.5 15.8 13.8
Operating EBIT (%) 7.2 62.8 22.8 15.7 14.0
Recurring EPS (%) 5.0 70.1 24.2 13.7 13.2
Reported EPS (%) 5.0 70.1 24.2 13.7 13.2
Operating performance
Gross margin inc depreciation (%) 44.0 44.2 42.4 41.4 40.9
Operating EBITDA margin (%) 34.4 34.9 32.6 31.1 30.6
Operating EBIT margin (%) 28.0 29.4 28.0 26.7 26.2
Net margin (%) 25.5 28.1 27.0 25.3 24.7
Effective tax rate (%) 9.5 12.8 9.9 10.5 10.5
Dividend payout on recurring profit (%) 40.3 40.0 30.0 30.0 30.0
Interest cover (x) 18.4 - - - -
Inventory days 81.7 87.5 94.8 97.5 99.8
Debtor days 100.8 90.8 95.6 93.4 90.7
Creditor days 74.4 71.6 77.8 76.0 74.0
Operating ROIC (%) 29.8 33.2 33.0 32.4 32.6
ROIC (%) 28.3 32.1 29.1 25.3 23.4
ROE (%) 23.2 32.6 30.3 25.7 22.7
ROA (%) 17.8 22.1 21.0 19.0 17.6
*Pre exceptional, pre-goodwill and fully diluted
Sources: AAC Tech; BNP Paribas estimates

AAC Technologies Holdings 2018 HK Laura Chen
16 BNP PARIBAS 3 OCTOBER 2013
Financial statements AAC Technologies Holdings
Cash Flow (RMB m) Year Ending Dec 2011A 2012A 2013E 2014E 2015E
Recurring net profit 1,036 1,763 2,189 2,488 2,817
Depreciation 262 345 374 436 493
Associates & minorities (3) (6) (6) (6) (6)
Other non-cash items 1 (1) 0 0 0
Recurring cash flow 1,295 2,101 2,558 2,919 3,304
Change in working capital (370) (711) (533) (483) (403)
Capex - maintenance 0 0 0 0 0
Capex - new investment (1,039) (1,163) (1,000) (1,000) (1,000)
Free cash flow to equity (115) 228 1,024 1,436 1,900
Net acquisitions & disposals 0 0 0 0 0
Dividends paid (442) (417) (705) (657) (746)
Non recurring cash flows (274) (1) (415) (430) (446)
Net cash flow (831) (190) (96) 350 707
Equity finance 0 0 0 0 0
Debt finance 463 166 0 0 0
Movement in cash (368) (24) (96) 350 707
Per share (RMB)
Recurring cash flow per share 1.05 1.71 2.08 2.38 2.69
FCF to equity per share (0.09) 0.19 0.83 1.17 1.55
Balance Sheet (RMB m) Year Ending Dec 2011A 2012A 2013E 2014E 2015E
Working capital assets 2,050 3,293 4,108 4,815 5,372
Working capital liabilities (791) (1,397) (1,727) (1,985) (2,154)
Net working capital 1,259 1,896 2,381 2,831 3,218
Tangible fixed assets 2,806 3,737 4,364 4,927 5,435
Operating invested capital 4,065 5,633 6,745 7,758 8,652
Goodwill 0 0 0 0 0
Other intangible assets 283 269 269 269 269
Investments 3 25 1,187 2,350 3,512
Other assets 196 287 371 450 522
Invested capital 4,548 6,214 8,572 10,827 12,955
Cash & equivalents (1,375) (1,315) (1,213) (1,557) (2,259)
Short term debt 1,096 1,354 1,354 1,354 1,354
Long term debt * 16 44 44 44 44
Net debt (264) 84 185 (159) (861)
Deferred tax 0 0 0 0 0
Other liabilities 0 0 0 0 0
Total equity 4,750 6,078 8,387 10,986 13,816
Minority interests 61 52 0 0 0
Invested capital 4,548 6,214 8,572 10,827 12,955
* includes convertibles and preferred stock which is being treated as debt
Per share (RMB)
Book value per share 3.87 4.95 6.83 8.95 11.25
Tangible book value per share 3.64 4.73 6.61 8.73 11.03
Financial strength
Net debt/equity (%) (5.5) 1.4 2.2 (1.4) (6.2)
Net debt/total assets (%) (3.9) 0.9 1.6 (1.1) (5.0)
Current ratio (x) 1.8 1.7 1.7 1.9 2.2
CF interest cover (x) 15.1 - - - -
Valuation 2011A 2012A 2013E 2014E 2015E
Recurring P/E (x) * 34.1 20.0 16.1 14.2 12.5
Recurring P/E @ target price (x) * 40.2 23.7 19.0 16.8 14.8
Reported P/E (x) 34.1 20.0 16.1 14.2 12.5
Dividend yield (%) 1.2 2.0 1.9 2.1 2.4
P/CF (x) 27.2 16.8 13.8 12.1 10.7
P/FCF (x) (307.7) 154.6 34.4 24.6 18.6
Price/book (x) 7.4 5.8 4.2 3.2 2.6
Price/tangible book (x) 7.9 6.1 4.3 3.3 2.6
EV/EBITDA (x) ** 23.6 15.2 12.9 11.1 9.6
EV/EBITDA @ target price (x) ** 28.0 17.9 15.2 13.1 11.4
EV/invested capital (x) 7.7 5.7 4.1 3.2 2.7
* Pre exceptional, pre-goodwill and fully diluted ** EBITDA includes associate income and recurring non-operating income
Sources: AAC Tech; BNP Paribas estimates

AAC Technologies Holdings 2018 HK Laura Chen
17 BNP PARIBAS 3 OCTOBER 2013
APPENDIX
DISCLAIMERS AND DISCLOSURES APPLICABLE TO NON-US BROKER-DEALER(S) (BNP Paribas Securities (Taiwan) Ltd)
ANALYST(S) CERTIFICATION
Laura Chen, BNP Paribas Securities (Taiwan) Ltd, +886 2 8729 7052, [email protected].
The analyst(s) or strategist(s) herein each referred to as analyst(s) named in this report certify(ies) that (i) all views expressed in this report accurately reflect the personal view of the analyst(s) with regard to any and all of the subject securities, companies or issuers mentioned in this report; and (ii) no part of the compensation of the analyst(s) was, is, or will be, directly or indirectly, related to the specific recommendations or views expressed by the research analyst herein. Analysts mentioned in this disclaimer are employed by a non-US affiliate of BNP Paribas Securities Corp., and are not registered/ qualified pursuant to NYSE and/or FINRA regulations.
IMPORTANT DISCLOSURES REQUIRED IN THE UNITED STATES BY FINRA RULES AND OTHER JURISDICTIONS "BNP Paribas” is the marketing name for the global banking and markets business of BNP Paribas Group. No portion of this report was prepared by BNP Paribas Securities Corp (US) personnel, and it is considered Third-Party Affiliate research under NASD Rule 2711. The following disclosures relate to relationships between companies covered in this research report and the BNP entity identified on the cover of this report, BNP Securities Corp., and other entities within the BNP Paribas Group (collectively, "BNP Paribas").
The disclosure column in the following table lists the important disclosures applicable to each company that has been rated and/or recommended in this report:
Company Ticker Disclosure (as applicable)
AAC Technologies Holdings 2018 HK N/A
BNP Paribas represents that: 1. Within the past year, it has managed or co-managed a public offering for this company, for which it received fees. 2. It had an investment banking relationship with this company in the last 12 months. 3. It received compensation for investment banking services from this company in the last 12 months. 4. It expects to receive or intends to seek compensation for investment banking services from the subject company/ies in the next 3 months. 5. It beneficially owns 1% or more of any class of common equity securities of the subject company. 6. It makes a market in securities in respect of this company. 7. The analyst(s) or an individual who assisted in the preparation of this report (or a member of his/her household) has a financial interest position in
securities issued by this company. The financial interest is in the common stock of the subject company, unless otherwise noted. 8. The analyst (or a member of his/her household) is an officer, director, or advisory board member of this company or has received compensation from the
company.
IMPORTANT DISCLOSURES REQUIRED IN KOREA The disclosure column in the following table lists the important disclosures applicable to each Korea listed company that has been rated and/or recommended in this report:
1. The performance of obligations of the Company is directly or indirectly guaranteed by BNP Paribas Securities Korea Co. Ltd (“BNPPSK”) by means of payment guarantees, endorsements, and provision of collaterals and/or taking over the obligations.
2. BNPPSK owns 1/100 or more of the total outstanding shares issued by the Company. 3. The Company is an affiliate of BNPPSK as prescribed by Item 3, Article 2 of the Monopoly Regulation and Fair Trade Act. 4. BNPPSK is the financial advisory agent of the Company for the Merger and Acquisition transaction or of the Target Company whereby the size of the
transaction does not exceed 5/100 of the total asset of the Company or the total number of outstanding shares. 5. BNPPSK has taken financial advisory service regarding listing to the Company within the past 1 year. 6. With regards to the tender offer initiated by the Company based on Item 2, Article 133 of the Financial Investment Services and Capital Market Act,
BNPPSK acts in the capacity of the agent for the tender offer designated either by the Company or by the target company, provided that this provision shall apply only where tender offer has not expired.
7. the listed company which issued the stocks in question in case where 40 days has not passed since the new shares were listed from the date of entering into arrangement for public offering or underwriting-related agreement for issuance of stocks
8. The Company is recognized as having considerable interests with BNPPSK. 9. The analyst or his/her spouse owns (including delivery claims of marketable securities based on legal regulations and trading and misc. contracts) the
following securities or rights (hereinafter referred to as “Securities, etc.” in this Article) regardless of whose name is used in the trading. 1) Stocks, bond with stock certificate, and certificate of pre-emptive rights issued by the Company whose securities dealings are being solicited. 2) Stock options of the Company whose securities dealings are being solicited. 3) Individual stock future, stock option, and warrants that use the stocks specified in Item 1) as underlying.

AAC Technologies Holdings 2018 HK Laura Chen
18 BNP PARIBAS 3 OCTOBER 2013
GENERAL DISCLAIMER This report was produced by BNP Paribas Securities (Taiwan) Ltd, member company(ies) of the BNP Paribas Group. This report is for the use of intended recipients only and may not be reproduced (in whole or in part) or delivered or transmitted to any other person without our prior written consent. By accepting this report, the recipient agrees to be bound by the terms and limitations set forth herein. This report does not constitute a personal recommendation or take into account the particular investment objectives, financial situations, or needs of individual clients. Customers are advised to use the information contained herein as just one of many inputs and considerations prior to engaging in any trading activity. This report does not constitute a prospectus or other offering document or an offer or solicitation to buy or sell any securities or other investments. This report is not intended to provide the sole basis of any evaluation of the subject securities and companies mentioned in this report. Information and opinions contained in this report are published for reference of the recipients and are not to be relied upon as authoritative or without the recipient’s own independent verification, or taken in substitution for the exercise of judgment by the recipient. Additionally, the products mentioned in this report may not be available for sale in certain jurisdictions. As an investment bank with a wide range of activities, BNP Paribas may face conflicts of interest, which are resolved under applicable legal provisions and internal guidelines. You should be aware, however, that BNP Paribas may engage in transactions in a manner inconsistent with the views expressed in this document, either for its own account or for the account of its clients.
Australia: This report is being distributed in Australia by BNP Paribas Sydney Branch, registered in Australia as ABN 23 000 000 117 at 60 Castlereagh Street Sydney NSW 2000. BNP Paribas Sydney Branch is licensed under the Banking Act 1959 and the holder of Australian Financial Services Licence no. 238043 and therefore subject to regulation by the Australian Securities & Investments Commission in relation to delivery of financial services. By accepting this document you agree to be bound by the foregoing limitations, and acknowledge that information and opinions in this document relate to financial products or financial services which are delivered solely to wholesale clients (in terms of the Corporations Act 2001, sections 761G and 761GA; Corporations Regulations 2001, division 2, reg. 7.1.18 & 7.1.19) and/or professional investors (as defined in section 9 of the Corporations Act 2001).
Canada: The information contained herein is not, and under no circumstances is to be construed as, a prospectus, an advertisement, a public offering, an offer to sell securities described herein, or solicitation of an offer to buy securities described herein, in Canada or any province or territory thereof. Any offer or sale of the securities described herein in Canada will be made only under an exemption from the requirements to file a prospectus with the relevant Canadian securities regulators and only by a dealer properly registered under applicable securities laws or, alternatively, pursuant to an exemption from the dealer registration requirement in the relevant province or territory of Canada in which such offer or sale is made. The information contained herein is under no circumstances to be construed as investment advice in any province or territory of Canada and is not tailored to the needs of the recipient. To the extent that the information contained herein references securities of an issuer incorporated, formed or created under the laws of Canada or a province or territory of Canada, any trades in such securities must be conducted through a dealer registered in Canada. No securities commission or similar regulatory authority in Canada has reviewed or in any way passed judgment upon these materials, the information contained herein or the merits of the securities described herein, and any representation to the contrary is an offence.
Hong Kong: This report is prepared for professional investors and is being distributed in Hong Kong by BNP Paribas Securities (Asia) Limited to persons whose business involves the acquisition, disposal or holding of securities, whether as principal or agent. BNP Paribas Securities (Asia) Limited, a subsidiary of BNP Paribas, is regulated by the Securities and Futures Commission for the conduct of dealing in securities, advising on securities, providing automated trading services, dealing in futures contacts and advising on corporate finance. For professional investors in Hong Kong, please contact BNP Paribas Securities (Asia) Limited for all matters and queries relating to this report.
India: In India, this document is being distributed by BNP Paribas Securities India Pvt. Ltd. ("BNPPSIPL"), having its registered office at 5th floor, BNP Paribas House, 1 North Avenue, Maker Maxity, Bandra Kurla Complex, Bandra (East), Mumbai 400 051 (Tel. no. +91 22 3370 4000 / 6196 4000). BNPPSIPL is registered with the Securities and Exchange Board of India (“SEBI”) as a stockbroker in the Equities and the Futures & Options segments of National Stock Exchange of India Ltd. and Bombay Stock Exchange Ltd. (SEBI regn. nos. INB/INF231474835, INB/INF011474831).
Indonesia: This report is being distributed by PT BNP Paribas Securities Indonesia and is delivered by licensed employee(s) to its clients. PT BNP Paribas Securities Indonesia, having its registered office at Menara BCA, 35th Floor, Grand Indonesia, Jl. M.H.Thamrin No.1, Jakarta, 10310, Indonesia, is a fully subsidiaries company of BNP Paribas SA and is licensed under Capital Market Law No. 8 of 1995 and the holder of broker-dealer and underwriter licenses issued by the Capital Market and Financial Institutions Supervisory Agency (BAPEPAM-LK). PT BNP Paribas Securities Indonesia is also a member of Indonesia Stock Exchange. Neither this research publication nor any copy hereof may be distributed in Indonesia or to any Indonesian citizens except in compliance with applicable Indonesian capital market laws and regulations. This research publication is not an offer of securities in Indonesia. Some of the securities referred to in this research publication have not been registered with the Capital Market and Financial Institutions Supervisory Agency (BAPEPAM-LK) pursuant to relevant capital market laws and regulations, and may not be offered or sold within the territory of the Republic of Indonesia or to Indonesian citizens through a public offering or in circumstance which constitute an offer within the meaning of Indonesian capital market laws and regulations.
Japan: This report is being distributed to Japanese based firms by BNP Paribas Securities (Japan) Limited or by a subsidiary or affiliate of BNP Paribas not registered as a financial instruments firm in Japan, to certain financial institutions defined by article 17-3, item 1 of the Financial Instruments and Exchange Law Enforcement Order. BNP Paribas Securities (Japan) Limited is a financial instruments firm registered according to the Financial Instruments and Exchange Law of Japan and a member of the Japan Securities Dealers Association, the Financial Futures Association of Japan and the Type II Financial Instruments Firms Association. BNP Paribas Securities (Japan) Limited accepts responsibility for the content of a report prepared by another non-Japan affiliate only when distributed to Japanese based firms by BNP Paribas Securities (Japan) Limited. Some of the foreign securities stated on this report are not disclosed according to the Financial Instruments and Exchange Law of Japan.
Malaysia: This report is issued and distributed by BNP Paribas Capital (Malaysia) Sdn Bhd. The views and opinions in this research report are our own as of the date hereof and are subject to change. BNP Paribas Capital (Malaysia) Sdn Bhd has no obligation to update its opinion or the information in this research report. This publication is strictly confidential and is for private circulation only to clients of BNP Paribas Capital (Malaysia) Sdn Bhd. This publication is being provided to you strictly on the basis that it will remain confidential. No part of this material may be (i) copied, photocopied, duplicated, stored or reproduced in any form by any means or (ii) redistributed or passed on, directly or indirectly, to any other person in whole or in part, for any purpose without the prior written consent of BNP Paribas Capital (Malaysia) Sdn Bhd.
Philippines: This report is being distributed in the Philippines by BNP Paribas Manila Branch, an Offshore Banking Unit (OBU) of BNP Paribas whose head office is in Paris, France. BNP Paribas Manila OBU is registered as an offshore banking unit under Presidential Decree No. 1034 (PD 1034), and regulated by the Bangko Sentral ng Pilipinas. This report is being distributed in the Philippines to qualified clients of OBUs as allowed under PD 1034, and is qualified in its entirety to the products and services allowed under PD 1034.
Singapore: This report is distributed in Singapore by BNP Paribas Securities (Singapore) Pte Ltd ("BNPPSSL") and may be distributed in Singapore only to an Accredited or Institutional Investor, each as defined under the Financial Advisers Regulations ("FAR") and the Securities and Futures Act (Chapter 289) of Singapore, as amended from time to time. In relation to the distribution to such categories of investors, BNPPSSL and its representatives are exempted under Regulation 35 of the FAR from the requirements in Section 36 of the Financial Advisers Act of Singapore, regarding the disclosure of certain interests in, or certain interests in the acquisition or disposal of, securities referred to in this report. For Institutional and Accredited Investors in Singapore, please contact BNP Paribas Securities (Singapore) Ptd Ltd for all matters and queries relating to this report.
South Africa: In South Africa, BNP Paribas Cadiz Securities (Pty) Ltd and BNP Paribas Cadiz Stock Broking (Pty) Ltd (hereinafter referred to as “BNPP Cadiz”) are licensed members of Johannesburg Stock Exchange and are authorised Financial Services Providers and subject to regulation by the Financial Services Board. BNPP Cadiz does not expressly or by implication represent, recommend or propose that the financial products referred to in this report are appropriate to the particular investment objectives, financial situation or particular needs of the recipient.
Switzerland: This report is intended solely for customers who are “Qualified Investors” as defined in article 10 paragraphs 3 and 4 of the Swiss Federal Act on Collective Investment Schemes of 23 June 2006 (CISA) and the relevant provisions of the Swiss Federal Ordinance on Collective Investment Schemes of 22 November 2006 (CISO). “Qualified Investors” includes, among others, regulated financial intermediaries such as banks, securities dealers, fund management companies and asset managers of collective investment schemes, regulated insurance companies as well as pension funds and companies with professional

AAC Technologies Holdings 2018 HK Laura Chen
19 BNP PARIBAS 3 OCTOBER 2013
treasury operations. This document may not be suitable for customers who are not Qualified Investors and should only be used and passed on to Qualified Investors. For specification purposes, a “Swiss Corporate Customer” is a Client which is a corporate entity, incorporated and existing under the laws of Switzerland and which qualifies as “Qualified Investor” as defined above." BNP Paribas (Suisse) SA is authorised as bank and as securities dealer by the Swiss Federal Market Supervisory Authority FINMA. BNP Paribas (Suisse) SA is registered at the Geneva commercial register under No. CH-270-3000542-1. BNP Paribas (Suisse) SA is incorporated in Switzerland with limited liability. Registered Office: 2 place de Hollande, CH-1204 Geneva.
Taiwan: Information on securities that trade in Taiwan is distributed by BNP Paribas Securities (Taiwan) Co., Ltd. Such information is for your reference only. The reader should independently evaluate the investment risks and is solely responsible for their investment decision. Information on securities that do not trade in Taiwan is for informational purposes only and is not to be construed as a recommendation or a solicitation to trade in such securities. BNP Paribas Securities (Taiwan) Co., Ltd. may not execute transactions for clients in these securities. This publication may not be distributed to the public media or quoted or used by the public media without the express written consent of BNP Paribas.
Thailand: Research relating to Thailand and Thailand based issuers is produced pursuant to an arrangement between BNP PARIBAS (“BNPP”) and Finansia Syrus Securities Public Company Limited (“FSS”). The International Investment Advisory Team at FSS prepares and distributes research under the brand name “BNP PARIBAS/FSS”. FSS is not an affiliate of BNPP. FSS also publishes a different research product under the brand name “FINANSIA SYRUS,” which is prepared by research analysts who are not part of the International Investment Advisory Team and who may cover the same securities, issuers, or industries that are the subject of this report. The ratings, recommendations, and views expressed in this report may differ from the ratings, recommendations, and views expressed by other research analysts or research teams employed by FSS. This report is being distributed outside Thailand by members of BNP Paribas.
Turkey: This report is being distributed in Turkey by TEB Investment and outside Turkey jointly by TEB Investment and BNP Paribas. Notice Published in accordance with “Communiqué Regarding the Principles on Investment Consultancy Activities and the Investment Consultancy Institutions” Series: V, No: 55 issued by the Capital Markets Board. The investment related information, commentary and recommendations contained herein do not constitute investment consultancy services. Investment consultancy services are provided in accordance with investment consultancy agreements executed between investors and brokerage companies or portfolio management companies or non-deposit accepting banks. The commentary and recommendations contained herein are based on the personal views of the persons who have made such commentary and recommendations. These views may not conform to your financial standing or to your risk and return preferences. Therefore, investment decisions based solely on the information provided herein may fail to produce results in accordance with your expectations.
United States: This report may be distributed in the United States only to U.S. Persons who are “major U.S. institutional investors” (as such term is defined in Rule 15a-6 under the Securities Exchange Act of 1934, as amended) and is not intended for the use of any person or entity that is not a “major U.S. institutional investor”. U.S persons who wish to effect transactions in securities discussed herein must do so through BNP Paribas Securities Corp., a US-registered broker dealer and member of FINRA, SIPC, NFA, NYSE and other principal exchanges.
Certain countries within the European Economic Area: This document may only be distributed in the United Kingdom to eligible counterparties and professional clients and is not intended for, and should not be circulated to, retail clients (as such terms are defined in the Markets in Financial Instruments Directive 2004/39/EC (“MiFID”)). This document will have been approved for publication and distribution in the United Kingdom by BNP Paribas London Branch, a branch of BNP Paribas SA whose head office is in Paris, France. BNP Paribas SA is incorporated in France with limited liability with its registered office at 16 boulevard des Italiens, 75009 Paris. BNP Paribas London Branch (registered office: 10 Harewood Avenue, London NW1 6AA; tel: [44 20] 7595 2000; fax: [44 20] 7595 2555) is authorised by the Autorité de Contrôle Prudentiel and the Prudential Regulation Authority and subject to limited regulation by the Financial Conduct Authority and Prudential Regulation Authority. Details about the extent of our authorisation and regulation by the Prudential Regulation Authority, and regulation by the Financial Conduct Authority are available from us on request.This report has been approved for publication in France by BNP Paribas, a credit institution licensed as an investment services provider by the Autorité de Contrôle Prudentiel whose head office is 16, Boulevard des Italiens 75009 Paris, France. This report is being distributed in Germany either by BNP Paribas London Branch or by BNP Paribas Niederlassung Frankfurt am Main, regulated by the Bundesanstalt für Finanzdienstleistungsaufsicht (BaFin).
Other Jurisdictions: The distribution of this report in other jurisdictions or to residents of other jurisdictions may also be restricted by law, and persons into whose possession this report comes should inform themselves about, and observe, any such restrictions. By accepting this report you agree to be bound by the foregoing instructions. This report is not directed to, or intended for distribution to or use by, any person or entity that is a citizen or resident of or located in any locality, state, country, or other jurisdiction where such distribution, publication, availability or use would be contrary to law or regulation.
All research reports are disseminated and available to all clients simultaneously through our internal client websites. For all research available on a particular stock, please contact the relevant BNP Paribas research team or the author(s) of this report.
Additional Disclosures Target price history, stock price charts, valuation and risk details, and equity rating histories applicable to each company rated in this report is available in our most recently published reports available on our website: http://eqresearch.bnpparibas.com, or you can contact the analyst named on the front of this note or your BNP Paribas representative.
All share prices are as at market close on 2 October 2013 unless otherwise stated.
RECOMMENDATION STRUCTURE
Stock Ratings Stock ratings are based on absolute upside or downside, which we define as (target price* - current price) / current price. BUY (B). The upside is 10% or more. HOLD (H). The upside or downside is less than 10%. REDUCE (R). The downside is 10% or more. Unless otherwise specified, these recommendations are set with a 12-month horizon. Thus, it is possible that future price volatility may cause a temporary mismatch between upside/downside for a stock based on market price and the formal recommendation. * In most cases, the target price will equal the analyst's assessment of the current fair value of the stock. However, if the analyst doesn't think the market will reassess the stock over the specified time horizon due to a lack of events or catalysts, then the target price may differ from fair value. In most cases, therefore, our recommendation is an assessment of the mismatch between current market price and our assessment of current fair value.
Industry Recommendations Improving (é): The analyst expects the fundamental conditions of the sector to be positive over the next 12 months. Stable (previously known as Neutral) (çè): The analyst expects the fundamental conditions of the sector to be maintained over the next 12 months. Deteriorating (ê): The analyst expects the fundamental conditions of the sector to be negative over the next 12 months. Country (Strategy) Recommendations Overweight (O). Over the next 12 months, the analyst expects the market to score positively on two or more of the criteria used to determine market recommendations: index returns relative to the regional benchmark, index sharpe ratio relative to the regional benchmark and index returns relative to the market cost of equity. Neutral (N). Over the next 12 months, the analyst expects the market to score positively on one of the criteria used to determine market recommendations: index returns relative to the regional benchmark, index sharpe ratio relative to the regional benchmark and index returns relative to the market cost of equity. Underweight (U). Over the next 12 months, the analyst does not expect the market to score positively on any of the criteria used to determine market recommendations: index returns relative to the regional benchmark, index sharpe ratio relative to the regional benchmark and index returns relative to the market cost of equity.
AAC Technologies Holdings 2018 HK Laura Chen
20 BNP PARIBAS 3 OCTOBER 2013
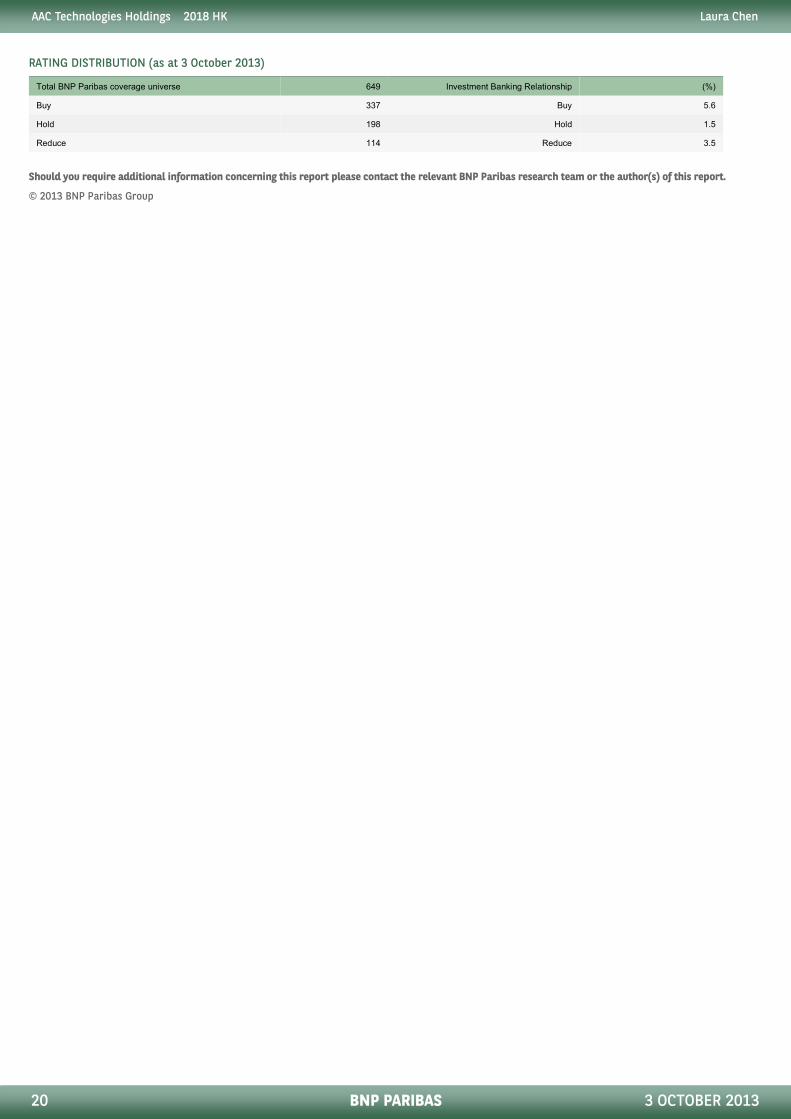
RATING DISTRIBUTION (as at 3 October 2013)
Total BNP Paribas coverage universe 649 Investment Banking Relationship (%)
Buy 337 Buy 5.6
Hold 198 Hold 1.5
Reduce 114 Reduce 3.5
Should you require additional information concerning this report please contact the relevant BNP Paribas research team or the author(s) of this report.
© 2013 BNP Paribas Group