hp presentation final pdf (2008.12.22)
TRANSCRIPT

7/27/2019 HP Presentation Final PDF (2008.12.22)
http://slidepdf.com/reader/full/hp-presentation-final-pdf-20081222 1/78
HP Strategic Analysis
Keep Aggressive:
Go Horizontally & Vertically
Nov. 27, 2008
Univer sity du Quebec en Outaouais
Presented to : Dr. Tamas Koplyay
MGP708QA
Strategy Formulation in High-tech and ProjectManagement Setting
Team Members
Arman Matti
Florentina Macovei
Jian ni Chen
Sahar Kamaly

7/27/2019 HP Presentation Final PDF (2008.12.22)
http://slidepdf.com/reader/full/hp-presentation-final-pdf-20081222 2/78
Agenda
•Background Information (HP & IT Industry)
•Market Dynamics
•Corporate Profile
•Strategic Fits
•Recommendations

7/27/2019 HP Presentation Final PDF (2008.12.22)
http://slidepdf.com/reader/full/hp-presentation-final-pdf-20081222 3/78
Importance of Corporate Strategy
“
“Quote”
organization is like a shipwithout a rudder, going aroundin circles.”
Joel Ross and Michael Kami
Strategy is management’s “game plan” to:
• Attract and please customers
• Stake out a market position
• Conduct operations
• Compete successfully
• Achieve organizational objectives

7/27/2019 HP Presentation Final PDF (2008.12.22)
http://slidepdf.com/reader/full/hp-presentation-final-pdf-20081222 4/78
HP Background
HP Background
Hewlett-Packard Company (HP) is well known as a technology solutions provider to
consumer, businesses and institutions globally.
• HP was founded in 1939 in a garage building, where two college friends, Bill Hewlettand Dave Packard created a development lab and manufacturing facility for their innovative electronics products.
• Corporate headquarters is in Palo Alto, California.
• HP is a global provider of personal systems, imaging and printing products, andtechnology solutions. The company is the largest player in the inkjet printer and laser printer market. Hewlett-Packard is one of the major companies in the enterprisestorage and servers market. The company is also one of market leaders in the globalPC market.
• Hewlett-Packard generates revenues primarily through seven business divisions:personal systems group, imaging and printing group, enterprise storage and HPservices , HP financial services , software and corporate investments.
• The USA is the company's largest geographic market, accounted for 33.4% of thetotal revenues in fiscal 2007.
Non-US operations accounted for 66.6% of the total segment revenues in the fiscal year
2007.

7/27/2019 HP Presentation Final PDF (2008.12.22)
http://slidepdf.com/reader/full/hp-presentation-final-pdf-20081222 5/78
Market share
• Hewlett-Packard is the market leader in distributed performance and availabilitymanagement software market. The company also led the industry in thin client unitshipments with approximately 34% market share.
• Strong market position in various market segments enhances the brand image of the
company and provides economies of scale in procurement.
HP financial positioning
• World’s largest IT companies- Revenue totaling $113.1 billion at the end of July 2008and 325,000 employees
• Hewlett-Packard’s long-term debt ratio stood at 0.1 for the fiscal year ended October 2007 compared with IBM’s long-term debt ratio of 0.22 for fiscal year endedDecember 2006.
• Hewlett-Packard had cash and cash equivalent of $13,293 million compared to IBM’s$8,023 million for fiscal year ended December 2007.
• Strong financial position provides the company the flexibility of expanding itsgeographical coverage and product portfolio by acquisition.

7/27/2019 HP Presentation Final PDF (2008.12.22)
http://slidepdf.com/reader/full/hp-presentation-final-pdf-20081222 6/78
HP Mission, Vision and Values
•Mission: Create, Solve and Reach customers
•Vision:− Market Leadership
− Continuous growth
−Higher profits
•Values:
− Trust and respect
− Speed and agility
− Meaningful Innovation
− Integrity
− Efficiency
•
Mission: Create competitive advantage by optimizing availability, performance andoperational efficiency , solve their business problems
• Vision: Hewlett once said that the “HP Way was a core ideology” . . . [that] includesa deep respect for the individual, a dedication to affordable quality and reliability, acommitment to community responsibility, and a view that the company exists tomake technical contributions for the advancement and welfare of humanity.“
• Trust and respect for customers and employees – culture of inclusion
• Speed and agility - resourceful, adaptable and achieve results faster
• Meaningful Innovation – invest in useful and significant technology
• Integrity – open, honest and direct in dealings
• Achievements, contribution, results through teamwork - provide efficiency tocustomers
Strategy deals with a company’s competitive initiatives and business approachesand Business Model -- Concerns more if the revenues and costs flowing from thestrategy demonstrate that the business is profitable and viable
Before you formulate a strategy the organization need to have a clear Mission, Visionand Values.
•
A mission statement focuses on current business activities -- “who we are and whatwe do”
• Current product and service offerings
• Customer needs being served
• Technological and business capabilities
• A strategic vision concerns a firm’s future business path -- “where we are going”
• Markets to be pursued
• Future technology-product-customer focus
• Kind of company that management is trying to create

7/27/2019 HP Presentation Final PDF (2008.12.22)
http://slidepdf.com/reader/full/hp-presentation-final-pdf-20081222 7/78
Corporate Profile
HP -- The Technology Solutions Provider
• HP: founded in 1939, California.
• IPO : November 1957
• Leading global provider
•
• Largest global IT company
• Market Advantage: leaders in some business segments
• Leading global provider in computing, imaging solutions and services for
business and home services,
• Market leader in printers and low-end servers, but trails Dell in PCs and IBM in
services
• Growing large size corporation with : more than 700 suppliers, 400 contract
manufacturing sites worldwide, 500 partners including leading software
pioneers, network service providers, and business, process specialists .
• Market Advantage – leader in providing mission-critical services and support
across all operating systems and to IT infrastructure, including storage, system
software, and the network.
• HP is a technology company that operates in more than 170 countries around the
world.
• HP provides infrastructure and business offerings from handheld devices to
some of the world's most powerful supercomputer installations (Itanium)
• Company offer consumers a comprehensive portfolio with a wide range of
products and services from digital photography to digital entertainment and from
computing to home printing.
• In 1959 HP becomes a global company by establishes a European marketing
organization in Geneva, Switzerland, and a manufacturing plant in Boeblingen,
Germany. From this base, HP steadily expands its European operations.

7/27/2019 HP Presentation Final PDF (2008.12.22)
http://slidepdf.com/reader/full/hp-presentation-final-pdf-20081222 8/78
• In 1962 HP enter the Fortune 500 US companies at number 460 and continues
to climb reaching number 11 in 2004 and 2008 remain at number 14
• HP Overall Positioning
• Number 1 - globally in the inkjet, all-in-one and single-function printers, mono
and color laser printers, scanners, print servers and ink and laser supplies
• Number 1 -globally in desktop PCs and notebooks,
• Number 2 - globally in Pocket PCs and workstations - The company is the
second largest entity in the servers market behind International Business
• Machines (IBM), with its server range extending from low-end systems to high-
end systems.
• Number 1 - globally in blade, x86, Windows®, Linux, UNIX and high-end UNIX
servers
• Number 10 - globally and Number 1 in the U.S. in Environment, Social Impact
Ratings by The Economist
• Number 22 - in the Accountability Rating, the first global index that evaluates
how well the world's 100 largest companies account for their impact on society
and the environment
• Listed on all four FTSE4Good Index lists — U.S., Global, UK and Europe —
which rate the performance of companies meeting globally recognized corporate
responsibility standards
• Source: IDC Q1 2008 for all categories except large-format printing, print servers
and supplies for which source is HP. ** Refers to factory revenue. Source: IDC
Q1 2008.

7/27/2019 HP Presentation Final PDF (2008.12.22)
http://slidepdf.com/reader/full/hp-presentation-final-pdf-20081222 9/78
Company profile - Revenues
$140,000
Revenue Comparison ($ millions)
$60,000
$80,000
$100,000
$120,000HP
IBM
DELL
$0
$20,000
,
1998 1999 2000 2001 2002 2003 2004 2005 2006 2007 2008
Note: For IBM and DELL, Revenues available only for 3 quarters
1. HP: a leading global provider of computing and imaging solutions and services -- is
focused on making technology and its benefits accessible to all. HP had total
revenue from continuing operations of $48.8 billion in its 2000 fiscal year
2. Before the merger with Compaq in 2000, HP focus on computers, Imaging and
printing services. Compaq core business was in computer, enterprise technology
and solutions. Apparently, HP wanted to expand its business territory to Enterprise
after its acquisition with Compaq. Looking at the Revenue graph HP doubled it's
enterprise business revenues in 2002, the same year after finishing the marriage
with Compaq.
3. Compaq: Founded in 1982, Compaq Computer Corporation (“Compaq”) and was a
leading global provider of enterprise technology and solutions. Compaq designs,
develops, manufactures and markets hardware, software, solutions and services,
including industry-leading enterprise computing solutions, fault-tolerant business-
critical solutions, communication products, and desktop and portable personal
computers that are sold in more than 200 countries.
4. From the graph continuous revenues growth except in 2001 when Compaq wasacquired and first year of merger the revenue were not so great also due to crisis in
high tech and low demand.
5. Applying different strategies over the years the HP maintained the second place
after the IBM up to year 2007 when HP revenues 104,286 millions versus 98,786
millions IBM revenues.
7/27/2019 HP Presentation Final PDF (2008.12.22)
http://slidepdf.com/reader/full/hp-presentation-final-pdf-20081222 10/78
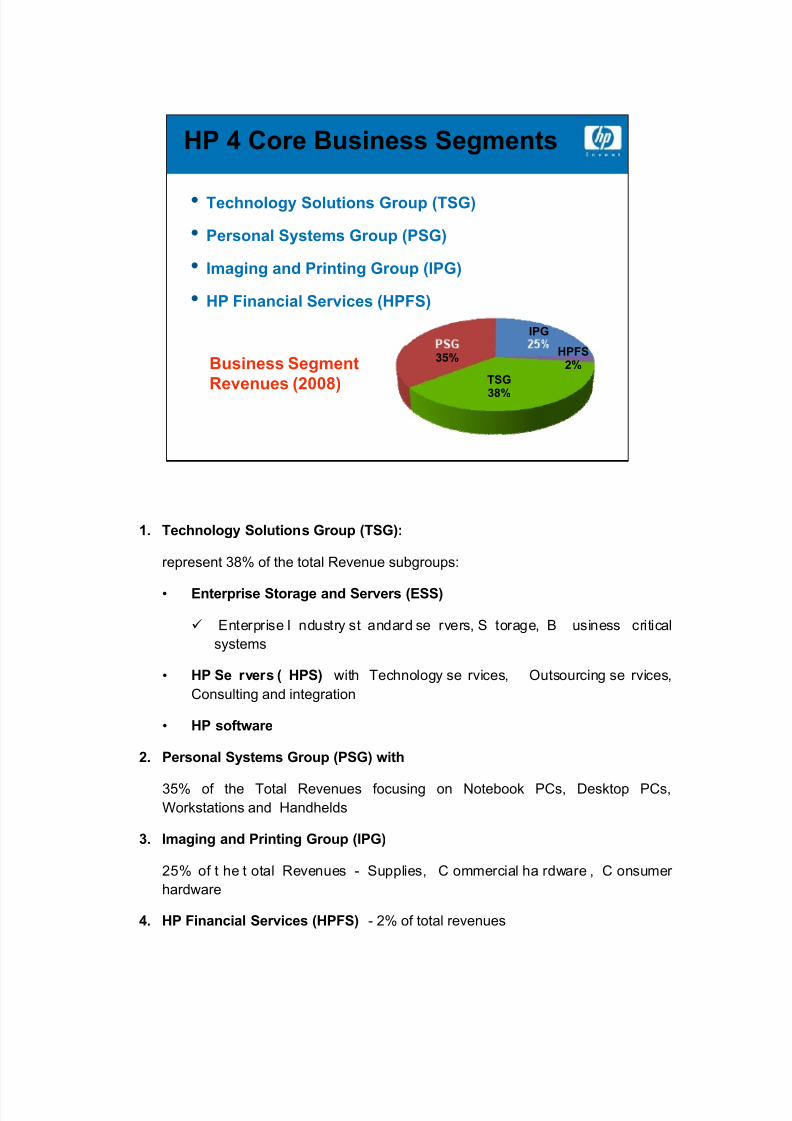
• Technology Solutions Group (TSG)
HP 4 Core Business Segments
• Personal Systems Group (PSG)
• Imaging and Printing Group (IPG)
• HP Financial Services (HPFS)
IPG
Business SegmentRevenues (2008)
HPFS2%
TSG
38%
35%
1. Technology Solutions Group (TSG):
represent 38% of the total Revenue subgroups:
• Enterprise Storage and Servers (ESS)
Enterprise I ndustry st andard se rvers, S torage, B usiness critical
systems
• HP Se rvers ( HPS) with Technology se rvices, Outsourcing se rvices,
Consulting and integration
• HP software
2. Personal Systems Group (PSG) with
35% of the Total Revenues focusing on Notebook PCs, Desktop PCs,Workstations and Handhelds
3. Imaging and Printing Group (IPG)
25% of t he t otal Revenues - Supplies, C ommercial ha rdware , C onsumer
hardware
4. HP Financial Services (HPFS) - 2% of total revenues

7/27/2019 HP Presentation Final PDF (2008.12.22)
http://slidepdf.com/reader/full/hp-presentation-final-pdf-20081222 11/78
HP Products & Services
Services Imaging and Printing Hardware
• Technology
• Consulting &
• Printers • Digital Cameras
• Digital Presses • Cartridge & Paper
•
Hardware
• Server
• Storage
Software Solutions IPG
HPF
PSG
• IT management &Outsourcing
•
• Photo Kiosks
• Printing-related media
• Online photo services
• publishing & graphicsprinting solutions
IPG Solutions
• BTO Software Solutions
• Supports
• etwor
TSGS
PCs
e a e ro uc sHPFS & Others
• Digital Entertainment Center
• LCD flat-panel TV
• DVD writers
• RW drives
• HD DVD• Desktops • Workstations
• Laptops • Handhelds
• Financial management services
• Leasing
• Financing
• Utility programs
• Asset recovery services
• Data extracted from HP Quarter Report 2008 (Q1-Q4)
HP Products & Services
• Data extracted from HP Quarter Report 2008 (Q1-Q4)
•
IPG- Imaging and Printing Group
• PSG –Personal System Group
• HPFS- HP Financial Services
• TSG - Technology Solutions Group
• BTO: Business Technology Optimization
• Hewlett-Packard has high brand equity. The company is one of the leading
brands in the technology sector along with Microsoft, IBM and Intel. Hewlett-
Packard figured in ‘The 100 Top Brands 2008’ of Business Week magazine.

7/27/2019 HP Presentation Final PDF (2008.12.22)
http://slidepdf.com/reader/full/hp-presentation-final-pdf-20081222 12/78
HP History Line
•HPfounded
1939
• Agilentdivestiture
• Chan ed
2000
• HP-Compaqmerger
• Ac uired
2002
• Digital entertainmentstrategy announced
• Won Cor orate
2004
• AcquiredVoodoo PC
• Ac uired
2006
• Acquired EDS
• AcquiredLefthand
2008
1999
•
2001
•
2003
•
2005
•
2007
•
CEO Indigo
• Opened IndianR&D lab
Innovation Award
• Revolution imaging &printing projectiontechnology released
Mercury• Stated several
horizontalcooperation
spin off
unit - HPServices
• Announced
new 64-bitplatform
strategy
• Initiated Smallmedium business
market• Imaging & printing
simplify-technology
• Acquired 5companies
• Acquired 2companies toexpand Imaging &
printing• China R&D lab
established
center strategy
• 7 acquisitionscompleted
• AdvocatedGreen IT
• HP: The technology solutions provider
• 1938 - Stanford University graduates Bill Hewlett and Dave Packard collaborate onthe company's first product, an audio oscillator, in a Palo Alto garage.
• 1939: Hewlett and Packard formalize their partnership on Jan. 1, 1939, deciding thecompany's name with a coin toss.
• 1940: HP moves from the garage behind Hewlett and Packard's house to rentedbuildings in Palo Alto. The start of World War II brings increased U.S. governmentorders for electronic instruments. Revenues at year-end total $34,396.
• 1957: HP goes public on Nov. 6 for $16 per share.
• 1999: Agilent Technologies - spun off as a new company (a public subsidiary) fromthe existing HP organization.
• HP named Carleton (Carly) S. Fiorina as President and CEO
• The first Windows CE pocket-size PC with a color screen has been introduced.
• HP began a new brand campaign based on a single concept: invent. (Print andtelevision ads focus on the company's history of invention and innovation.)
• HP revenue: $42 billion. HP employees: 84,400.
• 2001 Created a new business unit (HP Services). The new organization includes ITconsulting, outsourcing, support, education and solutions deployment.

7/27/2019 HP Presentation Final PDF (2008.12.22)
http://slidepdf.com/reader/full/hp-presentation-final-pdf-20081222 13/78
• HP and Intel cooperated and announced a new technology product -- Itanium (theplatform for next-generation 64-bit computing)
• HP and Compaq announced a definitive merger agreement to create an $87 billionglobal technology leader.
• HP revenue: 45.2 billion. HP employees: 88,000.
• 2002:
• HP opened the research Labs in India;
• Completed the acquisition of Indigo
• Acquisition impacts: The acquisition extends HP's printing systems portfoliobeyond inkjet and LaserJet technology into a third high-speed color printtechnology - offset-quality digital press solutions and services for short-run,personalized business communications.) results: HP announced its largestconsumer product rollout
•
HP and Compaq officially merged
• Merged Impacts: lead global provider of products, technologies, solutions andservices to consumers and businesses. Business scope span IT infrastructure,personal computing and access devices, global services and imaging andprinting
• HP introduced its first tablet PC (collaborated with Compaq)
• HP revenue: 56.6 billion. HP employees: 141,000.
• 2003:
• The value proposition changed to high tech, low cost and the best total customer experience.
• Adapted Enterprise strategy to help businesses manage change and get more fromtheir IT investments. (New services, software, solutions and enterprise referencearchitecture designed to help companies measure, architect and manage change bycreating a tighter linkage between business and IT.)
• Simplified technology radically to help people "enjoy more"
• Impact: extends HP's leadership in imaging, printing and home computing intothe fast-growing digital photography and entertainment markets)
• Initiated the Smart Office that tailored support services to serve small and medium-sized business (SMB) market.
• 2005:
• Changed CEO: Mark Hurd was named the CEO and president of HP.
• HP acquired online photo service company – Snapfish.

7/27/2019 HP Presentation Final PDF (2008.12.22)
http://slidepdf.com/reader/full/hp-presentation-final-pdf-20081222 14/78
• HP announced a breakthrough printing platform (fastest home and office photoprinting devices)
• HP shipped the millionth x86 processor-based ProLiant server (, which was initiatedthe first shipment in 1993)
• HP acquired Scitex Vision and expanded its printing market to industrial professional
field. (Scitex Vision was a market leader in wide and super-wide format printers for signage and industrial applications such as billboards, banners, street advertisingand packaging.)
• HP establishes a research lab in China.( for more lab history, please refer toHISTORY AND MILESTONES SUPPLEMENTAL section hereinafter)
• Created the Halo Collaboration Studio, which enabled remote teams to work together in a setting so life-like that participants feel as though they are in the same room.
• 2006:
• CEO Mark Hurd was named as chairman of the board.
• HP acquired VoodooPC, a high-end gaming PC provider
• HP acquires Mercury Interactive Corp., (A software company, its core productwas WinRunner ), which was the subsidiary of HP for business technologyoptimization (BTO).
• Fortune 500 Ranking: 14
• HP revenue: $91.6 billion. HP employees: 156,000.
• 2008:
• HP's 2008 Fortune 500 ranking: No. 14
• HP's revenue for the four fiscal quarters ended July 31, 2008: $113.1 billion.
• HP Announces Strategy to Bridge Gap Between Content Creation and Publishing (Jan)
• Cooperated horizontally:
• ProCurve Networking by HP Strengthens Network Security Through Integrationwith Microsoft NAP Technology
•
(Apr)
•
MySpace (Microsoft) and HP to Unlock Online Content Through the Power Of Print
HP Acquired LeftHand Networks to Extend Leadership in Storage andVirtualization Solutions
• Announced a new relationship with U.K.- based Timsons Ltd., the world’slargest book press manufacturer, to develop a digital inkjet system for short- andmedium-run book production. (Oct)
(Oct)

7/27/2019 HP Presentation Final PDF (2008.12.22)
http://slidepdf.com/reader/full/hp-presentation-final-pdf-20081222 15/78
• HP and Foxconn Expand PC Business in Russia
• Completed $13.9 billion acquisition of EDS, and started integration sequence withHP Service.
(May)
(EDS was a $22 billion-plus global technology services, outsourcing and consultingleader that pioneered the IT outsourcing industry.)
• Signed a definitive agreement to acquire Colubris Networks Inc.,to Expand HPProCurve’s Wireless Technology (Aug)(http://www.hp.com/hpinfo/newsroom/press/2008/080811b.html?jumpid=reg_R1002_ USEN)
• Colubris is a Waltham, Mass.-based, privately-held global provider of intelligentwireless networks for enterprises and service providers. (Aug)
• HP plans to integrate Colubris’ extensive product line into its ProCurveNetworking product portfolio. This will expand HP ProCurve’s reach into verticalmarkets such as hospitality, transportation, healthcare, manufacturing, service
provider and education.• It will simplify operations and achieve lower total cost of ownership for their
storage-area network (SAN) environments
• HP Unveils Innovative Large-format Printing Solutions (Oct)
• HP Makes Big Investment in Consumer Tech Support - the aim of which is to enablepeople to get faster, more effective help with the HP technology products in their homes. (Feb)
• HP Introduces Servers, storage arrays, Customer Management Portfolio to ReduceCosts for Midsize Businesses
• Offered New Web Solutions, business/ marketing solutions and workshops (HP andSCORE Host Nationwide “Wellness” Workshops) for small organizations to reducecosts, :
• For enterprises: Announced a software and hardware storage virtualization solutionthat enabled enterprises to improve productivity. (Nov)

7/27/2019 HP Presentation Final PDF (2008.12.22)
http://slidepdf.com/reader/full/hp-presentation-final-pdf-20081222 16/78
HP 4 Major Strategies
$118,364$120,000
$140,000
($ millions)
$39,330$42,371
$48,870$45,226
$56,588
$73,061$79,905
$86,696$91,658
$104,286
$40,000
$60,000
$80,000
$100,000
7-companyAcquisitions
R&D center
$2,678 $3,104 $3,561$624 -$923
$2,539 $3,497 $2,398$6,198 $7,264 $8,329
-$20,000
$0
$20,000
Revenues Net Incomes
• Strategy 1: Corporation Restructuring Strategy
HP spun off Agilent and focused on PC, imaging and printing market.
• Strategy 2: Merger Strategy (Horizontal)
Case: HP Compaq merger in 2002.
• Strategy 3: Acquisition Strategy ( Horizontal )
Case: Snapfish and other 11 imaging and printing companies acquisitions (from
2002 to 2008).
• Strategy 4: Acquisition Strategy (Horizontal and Vertical)
Case: EDS acquisition (2008).
Strategy - Focusing in things that HP can make a difference
2005- Organization starts focusing in their core fundamentals. To be competitive,being able to go to the marketplace and compete, and simplifying their organization,
HP will get their cost structure inline by focusing in leveraging the core assets.
HP is in the server business, storage business and in the management software
business markets that have large growth potential.
To be a leader in those markets HP has to take care of customers services.
Average per year HP ships 50 million printers, over 30 million PCs and a couple of
million industry standard servers.

7/27/2019 HP Presentation Final PDF (2008.12.22)
http://slidepdf.com/reader/full/hp-presentation-final-pdf-20081222 17/78
Customer Centric -. HP focused on getting a price-competitive product, created
value added for the customer, making sure that product is delivered in time and
offers good quality.
The HP goes to market by looking at the customer on a "segment of one" basis
understanding their service history, requirements for present and future giving
organization an opportunity to cross-sell and the ability to understand what their total
satisfaction with HP.
To improve customer experience, HP focuses on the importance of understanding
the entire experience and relationship that a customer has.
On the Enterprise Storage area HP continue to push on lowering the cost of
computing, leverage industry standards and continue to drive down the cost of
computing,
In the years to come HP is focusing in integration of management software, storage
management software, security and the ability to drive and manage that enterprise
remotely
Printing Imaging Business: For HP the printing-imaging business is a pretty strong
business that organization can compete well in the market place. Organization will
invest in R&D to increase the number of printed pages.
HP Services- organization is going to be very focused on the services business in IT
technology that will increase HP products sale. The services business is an
important business to HP since many organizations today start to look at outsourcingtheir business.
HP is a strong partnering company and we'll partner for some of those solutions to
make sure they support their customer.

7/27/2019 HP Presentation Final PDF (2008.12.22)
http://slidepdf.com/reader/full/hp-presentation-final-pdf-20081222 18/78
Revenue Trend per Segment
Revenue Trend of HP Business Segments
$25,000
$30,000
$35,000
$40,000
$45,000
,
TSG
IPG
PSG
$0
$5,000
$10,000
$15,000
$20,000
1998 1999 2000 2001 2002 2003 2004 2005 2006 2007 2008
HPFS
• TSG
The r evenues o f TSG (Technology S olution Group) i ncreased al most 9 t imes
from 1998 to 2008 . A veragely, i t had 28 % r evenue i ncrease per y ear. Its
increasing rate was rank number 1 amongst 4 business segments in HP.
The TSG Revenues started to soar since 2001, after HP merged Compaq, from
2001 to 2002, the increasing rate of PSG group soared to 169% on a yearly
basis. The nex t hi ghest i ncreasing rate occu rred i n 2002 to 2003 fiscal y ear,
which r eached 38% . After 2003 , the i ncreasing sp eed slow dow n t o 8%
(maximum 12%/ year). In 2008, after HP acquired EDS, the TSG revenuesstarted to climb again, the increasing rate reached 19%/year.
Both the merger and acquisition strategies proved that HP made the right choice.
• PSG
Besides TSG, P SG i s the se cond co ntributor t o t he t otal r evenues in HP.
Averagely, PSG has 11% increasing rate/ year from 1998 to 2008. from 2001 to
2002 t wo fiscal y ears, a fter H P m erged C ompaq, i t’s revenues continued
dropping for 2 years, which can be understandable, because during that time, the
IT industry is going through an economy winter. Most of the companies who soldPCs had t heir revenues dropped dur ing t hat period. B ut t he bou nced bac k
numbers from 2002 to 2008 fiscal year illustrate that for a long run, this marriage
is worthy.
• IPG
Among three business segments, IPG is the group that keeps the lowest growth
since 2001. A lthough H P acquired Indigo(2002), sn apfish ( 2005) and o ther 10
companies from 2002 to 2008 , and it launched over hundreds o f products, it
seems that i t w as lack of some l ucky from t he i maging and p rinting market.
Maybe this group expand too fast horizontally, it need some vertical strategies,we will verify our assumption in the following models and SPACE analysis.

7/27/2019 HP Presentation Final PDF (2008.12.22)
http://slidepdf.com/reader/full/hp-presentation-final-pdf-20081222 19/78
•Background Information (HP & IT Industry)
•Market Dynamics
•Corporate Profile
ra eg c s
•Recommendations

7/27/2019 HP Presentation Final PDF (2008.12.22)
http://slidepdf.com/reader/full/hp-presentation-final-pdf-20081222 20/78
Positioning Map – PCs
High
Quality
Price
LowHi h
Low
Competitors (PC)
• HP competes directly with Dell, Toshiba and Acer in terms of price and quality.
Other competitors such Lenovo and specially Apple have their niche, as it can be
seen from the diagram their prices are higher.
• HP (market share 18.9%)
• Dell (market share 16.4%)
• Acer ( market share 9.5%)
• Lenovo (market share 7.9%)
• Toshiba (market share 4.5%)
• Apple (market share 3.5%)
Reference: http://www.businessweek.com/investor/content/oct2008/pi2008106_
002546.htm

7/27/2019 HP Presentation Final PDF (2008.12.22)
http://slidepdf.com/reader/full/hp-presentation-final-pdf-20081222 21/78
Positioning Map – Imaging & printing
Quality
Price
LowHi h
Low
Key takeaways from this slide:
Prices of al l major competitors are a l ittle h igher than H P, however in terms of
quality HP is third among competitors. They are still considered strong in imaging
and printing business and they offer all in one products.
Reference
• http://www.businessweek.com/investor/content/oct2008/pi2008106_002546.htm
• http://www.hp.com/sbso/expert/competitive.html
7/27/2019 HP Presentation Final PDF (2008.12.22)
http://slidepdf.com/reader/full/hp-presentation-final-pdf-20081222 22/78
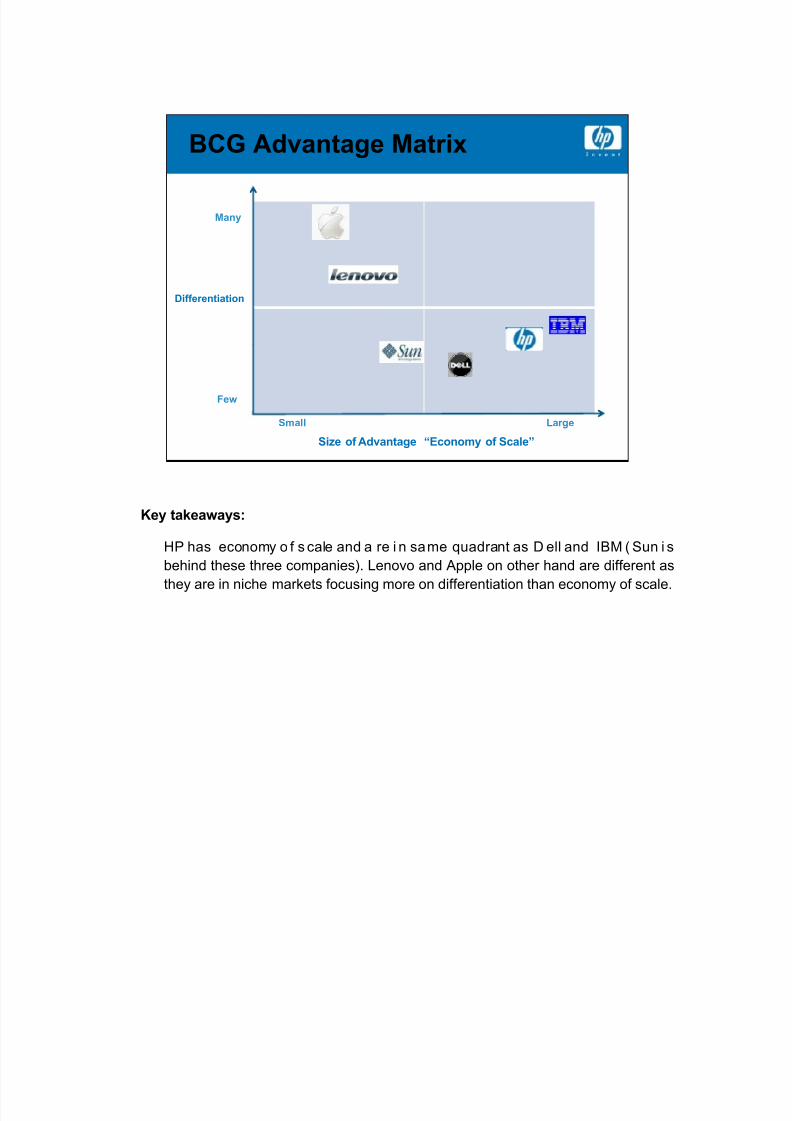
BCG Advantage Matrix
Many
Differentiation
Few
Small Large
Size of Advantage “Economy of Scale”
Key takeaways:
HP has economy o f s cale and a re i n same quadrant as D ell and IBM ( Sun i s
behind these three companies). Lenovo and Apple on other hand are different as
they are in niche markets focusing more on differentiation than economy of scale.
7/27/2019 HP Presentation Final PDF (2008.12.22)
http://slidepdf.com/reader/full/hp-presentation-final-pdf-20081222 23/78
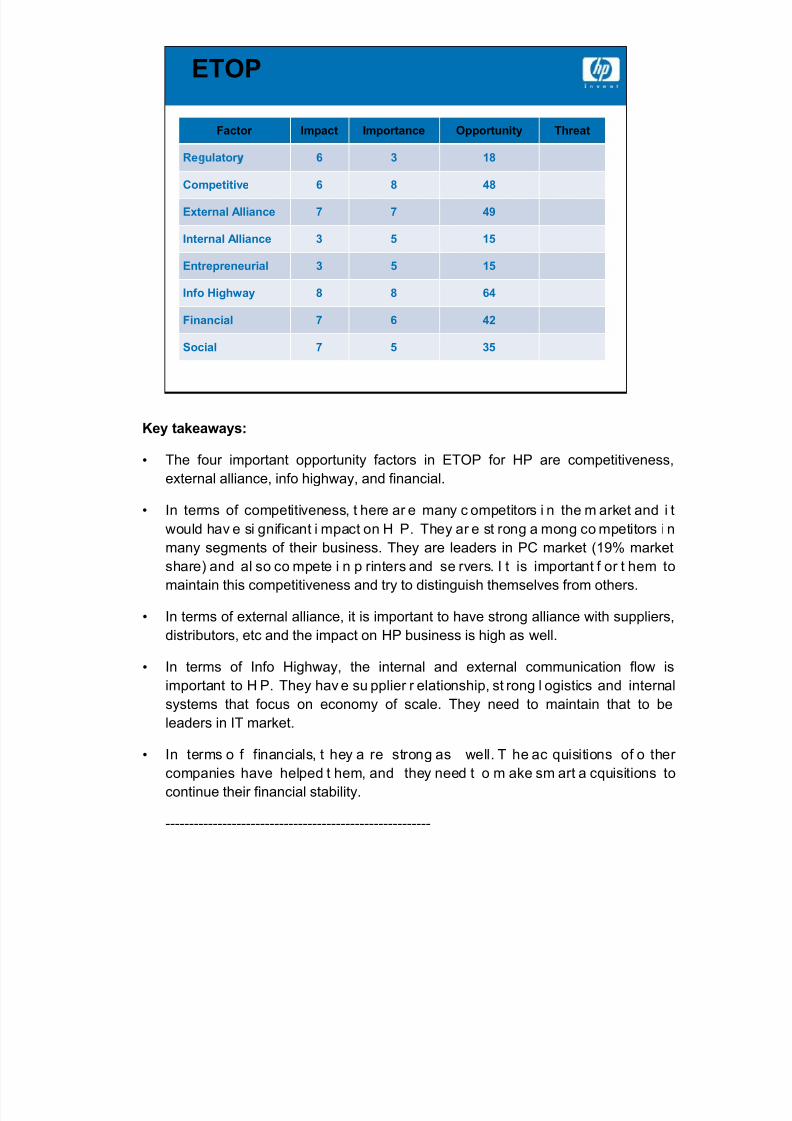
ETOP
Factor Impact Importance Opportunity Threat
Re ulator 6 3 18
Competitive 6 8 48
External Alliance 7 7 49
Internal Alliance 3 5 15
Entrepreneurial 3 5 15
Info Highway 8 8 64
Financial 7 6 42
Social 7 5 35
Key takeaways:
• The four important opportunity factors in ETOP for HP are competitiveness,
external alliance, info highway, and financial.
• In terms of competitiveness, t here ar e many c ompetitors i n the m arket and i t
would hav e si gnificant i mpact on H P. They ar e st rong a mong co mpetitors i n
many segments of their business. They are leaders in PC market (19% market
share) and al so co mpete i n p rinters and se rvers. I t is important f or t hem to
maintain this competitiveness and try to distinguish themselves from others.
• In terms of external alliance, it is important to have strong alliance with suppliers,
distributors, etc and the impact on HP business is high as well.
• In terms of Info Highway, the internal and external communication flow is
important to H P. They hav e su pplier r elationship, st rong l ogistics and internal
systems that focus on economy of scale. They need to maintain that to be
leaders in IT market.
• In terms o f financials, t hey a re strong as well. T he ac quisitions of o ther
companies have helped t hem, and they need t o m ake sm art a cquisitions to
continue their financial stability.
--------------------------------------------------------

7/27/2019 HP Presentation Final PDF (2008.12.22)
http://slidepdf.com/reader/full/hp-presentation-final-pdf-20081222 24/78
Extra Information:
• Regulatory
•
Competitive
Holds strong market position, one of the leading IT companies (PC,printers, etc). Intense competition.
• External Alliance Strong, long-term, proven.
• Internal Alliance alliance between the segments, 4 groups (package selling)
• Entrepreneurial mature company, less entrepreneurial
• Info H ighway Internet ( internal and ex ternal communication, su ppliers and
logistics, financials)
•
Financial
HP has strong financials in recent years. It has reduced it is long termdebt from $4,494 million in 2003 to $4,997 million in 2007.
• Social Social responsibilities (internal and external), being fit with environment.

7/27/2019 HP Presentation Final PDF (2008.12.22)
http://slidepdf.com/reader/full/hp-presentation-final-pdf-20081222 25/78
IPG PSG
Effectiveness(externat focus)MarketPosition
Efficiency
(Internal focus)Operations
Product Life Cycle – Marketing/Strategy
Cost Leadership
Market DevelopmentProductDifferentiation Market Maintenance and defense
HP Financial &Software
HP Services
Market Pull Market Push Market Checkmate Market Expansion
Product development Focus Customers,
Focus on EfficiencyStrategies/Marketing
Product / service emphasis
Product / Production based
(Customers, Competitors, Suppliers)(customers) Competitors
Locked in Production / service emphasis
Production based
Hp i s a technology co mpany that i s competing in a mainly i n the mature market.
Their products in the TSG\ HPS and I PG segments, mostly have sh ort l ife cycles,
and always evolve. for HP to keep up with the innovations, they acquire companies
to lower risk compared to developing new products, to have a faster way to enter and
compete in the current market, and to have a quicker means to new capabilities
• As well t hey i nvest i n their R&D global l abs to realize new cu tting ed ge
innovations.
(If half of HP’s printing revenues were in the consumer market that would put 45% of
HP’s revenues in the consumer segment.) And where IBM now makes more than
half of its revenue from software and services, HP makes 80% of its revenues selling
hardware and (printing) supplies.
TSG:
• Server market facts: HP grew blade revenue 59.2%, year over year, gaining 6.2points of revenue market share while IBM lost 7.6 points of revenue share to fall
to 24.8%, more than 28 points behind HP.
• HP is the number 1 su pplier of I tanium based systems based on worldwide unit
volume and worldwide factory revenue. (ESS - HP growth was based only on the
Compaq merger and other acquisitions in 2005)

7/27/2019 HP Presentation Final PDF (2008.12.22)
http://slidepdf.com/reader/full/hp-presentation-final-pdf-20081222 26/78
IPG:
In laser printers, HP holds a 55% worldwide market share as of the first quarter of
2007, acco rding t o research f irm I DC, f ar surpassing t he 10% share o f second-
ranked Samsung. In inkjet machines, too, HP's share is 45%, compared with
second-place Canon (CAJ), which holds a 26% share.
PSG (personal systems group) :
Hewlett-Packard remained the top se ller o f PCs i n the worldwide m arket, sh ipping
almost 14.8 million PCs and grabbing 18.4 percent of the worldwide market. Overall,
HP saw a 15.1 percent year-on-year growth in worldwide PC shipments. According
to Gartner HP remains the largest seller of PCs worldwide, although Dell is tops in
the U.S. and Acer is gaining ground.
HPS:
With i ts acquisition of EDS in 2008 HP st rategy is t o grow i ts on dem and-
infrastructure (outsourcing)
HP S ervices - This segment was slowly growing due to the Compaq merger and
other acquisitions such as Intria, Extrem logic, Triation, Synstar, and others in 2006
and 2007.
HP’s Services market ( 62% cu stomer su pport, 20% co nsulting a nd sy stems
integration, 18% managed services) is continuing to grow; customer support revenue
is up 9%, consulting and integration up 8%, and managed services up 50%.
Comments:
HP 4 segments were staidly growing by mostly acquisition :
In the TSG, PSG the biggest acquisition was the Compaq . During t2004 ,The PSG
and I PG so me or ganic growth w as achieved. 2 006 and 2007. Actually, r evenues
decline i n 2004, t he only year where no acq uisitions related to this segment were
made.
Signs of Maturity:
• Cost leadership: have economy of scale, where it was able to lower it’s prices (by
bringing uni t c ost dow n), and hav e hi gh v olumes. S ince 2005 , H P has
demonstrated its ability to improve profitability by focusing on costs.

7/27/2019 HP Presentation Final PDF (2008.12.22)
http://slidepdf.com/reader/full/hp-presentation-final-pdf-20081222 27/78
• It has currently 4 main business segments (Horizontal integration), and
throughout t he y ears from 2001 t ill now i t acq uired l ots of companies i n t he
various segments. It strategy is to buy competitors and expand its market share
way. (it buy market space).
• They are focused on being more efficient (cutting cost more then competitors).
• Knocking competition down (Compaq, EDS)
• They are no longer compete with smaller companies in the market, and compete
in the global market as well side by side with IBM.
• They want t o l ead a complete service so lutions to their mid and big si ze
companies. They adopting the One-Stop Shops: In other words, HP thinks want
to ov ercome i ts o f se parating out sourcing nee ds and sp reading them acr oss
vendors. HP seeks to be the first one-stop shop for outsourcing.
•
They have a stable growth, in a shake out market (buy smaller companies), andin a Push market as they are dealing with Early to late majority (depends on
segment).

7/27/2019 HP Presentation Final PDF (2008.12.22)
http://slidepdf.com/reader/full/hp-presentation-final-pdf-20081222 28/78
Product Life Cycle – Competitions
Market Share Importance
IncreasingStable
No Competition Decreasingunstable
Increasingunstable
Equilibriumstable
Basis of Competitive Strength
Core Competencies Core Capabilities
Client base unstable
Client RelationsClient base stable Client base unstable
Competitor PressureLow asset base Maximum Decreasing
Economy of SState
High Barriers
SalesScope Scale
Synergy
Speed Span Structure SalesLow Barriers
HP was viewed as an innovative technology (core competency) information technology
company doing business in over 170 countries worldwide. HP comes second to IBM as
largest computer company in the world.
HP now is trying to move to be more efficient, and competitive:
In Services:
Providing i ts se rvices through “Data ce nters” – centralized del ivery w ith su bstantialhardware co mponents ( Blade se rvers). This i s to replace co mpanies I T su pport s taff
which are required to maintain local servers (old) . HP has lots of storage and ne twork
expertise w hich is more advantage over I BM t hat hand t his over t o someone el se t o
manage i t. B y buy ing E DS i s trying t o compete w ith I BM G lobal services. ( biggest
competitor) Others: A ccenture LLP , CapGemini/ Ernst & Y oung an d
PricewaterhouseCoopers LLP.
Imaging and Printing systems:
The markets for printer hardware and i ts supplies are highly competitive, especially the
pricing and i nnovations. K ey co mpetitors in this segment i nclude Xerox C orporation,
Lexmark International Group Inc., S eiko E pson C orporation, S ony Corporation o f
America (“Sony”) and Canon USA inc. The segment has been a strong profit area for HP,
representing about 27% of fiscal 2007 revenue but 41% of earnings from operations.
Printers and imaging solutions are another prime area for HP, where it competes against
the likes of Canon, Xerox, and Lexmark). The segment has been a strong profit area for
HP, representing about 27% of fiscal 2007 revenue but 41% of earnings from operations.

7/27/2019 HP Presentation Final PDF (2008.12.22)
http://slidepdf.com/reader/full/hp-presentation-final-pdf-20081222 29/78
In personal computers:
The company is a top competitor in several key IT markets. It holds a leading market
share o f about 18 .9% It co mpetes w ith rivals Dell(16.4% second-quarter 2008 m arket
share), Acer (9.5%), Lenovo (7.9%), Toshiba (4.5%), and Apple(3.5%) in the PC arena.
ESG:
EMC Corporation in storage space.
In an overall server market worth about $54.4 billion in 2007, HP is a close second to
rival IBM. W ith about a 28.3% market share of worldwide server factory revenue for
2007 (Dell, Sun Microsystems). Market leader IBM had 31.9% share in 2007, and Dell
(11.3%) and Sun Microsystems (10.8%) vied for third place.
HP is well positioned to gain share in the future because it is prominent in the large and
fast-growing "volume server" market, whereas IBM has strengths in higher-end markets
that might see less rapid growth.
In Finance:
largest competitor is again IBM Global Financing. Offers leasing, financing, utility
programs and asset r ecovery se rvices, financial asset management se rvices for l arge
global and Enterprise customers. It also provides specialized financial services to small
and offers leasing, financing, utility programs and asset recovery services, financial
asset management services for large global and enterprise customers. It also providesspecialized financial se rvices to small and medium si zed businesses, a nd educational
and governmental entities medium sized businesses, and educational and governmental
entities.
Strategy to obtain bigger market share and growth:
• HP will become stronger competitor by the partnership and alliance at the end of
2006 with Microsoft for a three-year joint marketing alliance, in creating solutions
portfolio which are focused on the area of messaging & unified communications,
collaboration & C ontent M anagement, busi ness intelligence. S oftware and
Hardware will be pushed globally by both their adjacent partners.
• Another par tnership i s between H P, M S, and Yahoo i n cl oud computing: The
idea is that large-scale computing tasks, can be handled as efficiently, if not more
so “in the cloud” meaning by thousands of Internet-connected servers stationed
in dat a ce nters ar ound the w orld. I nstead o f s pending truckloads o f cash for
servers and the space t o house t hem and the personnel to run and maintain
them, why not lease the capacity you need from providers in the cloud who can
give you what need, add or subtract more quickly based on your needs
• HP’s Prith Banerjee, head of HP Labs said that HP believes that the marketplace
is entering an era called “Everything as a Service.”

7/27/2019 HP Presentation Final PDF (2008.12.22)
http://slidepdf.com/reader/full/hp-presentation-final-pdf-20081222 30/78
Product Life Cycle & Financial
Effectiveness(externat focus)Market Position
ROA
ROECash Flow
Revenues
Net Profit
Investment Increase
Lines of Cr edit Growth Funding Cash Flow FinancialReserves
CapitalStructure
Reinvestment of Cash Flow
Since Apr. 1, 2005, has demonstrated its ability to improve profitability by focusing on
costs. Fo r i nstance, H P's return on e quity w ent from abou t 6 .4% i n fiscal 2005
(October), to about 19.0% in fiscal 2007.
The company is among the largest IT companies, with fiscal 2007 revenues of $104
billion t hat w e est imate will g row or ganically an d by acq uisition to $11 9 bi llion for
fiscal 2008.
Hp is following a strategy of repurchases. They announced the will be spending up
to $8 billion on a major stock re-purchasing campaign; the company has about 2.5billion shares outstanding. This in attempt to control fluctuations in its share price.
Paying Dividends to it stakeholders.
Their stock price is relatively stable.
Notes:
• Cash f low: How much cash the company is generating from its operation. It is
calculated from the net profit and from the cash inflows from the balance sheet.When acco unt receivable decr ease t his will g enerated cash to t he co mpany,
account receivable is getting better. can be helpful in financing its capital
expenditures.
• ROA: Efficiency of assets and how much revenue they are generating
• ROE: Return on the shareholder equity. The higher it is the more likely dividends
the shareholders will get.
• Net Profit or Loss Margin
•
HP’s revenues are divided between the consumer and business markets.

7/27/2019 HP Presentation Final PDF (2008.12.22)
http://slidepdf.com/reader/full/hp-presentation-final-pdf-20081222 31/78
Product Life Cycle
Intro Growth Maturity Decline
Cash Flow
Profit
Investment
# of Competitors Low Increasing Decreasing (shakeout) Low (mkt exit)
Product Low Increasing (productVariant)
High (mkt segment) Decreasing (mkt exit)
Barriers to entry High(patents)
Decreasing (tech. Diffusion) Increasing (capital needs) High(high capital, lowmargins)
Barriers to exit Low Increasing High (invested Cap.) Decreasing (Cap. Assetserosion)
Price elasticity Inelastic More elastic Segment inelasticity only Very elastic
FC/ VC ratio Low Increasing High Decreasing
ExperienceCurve Effect
Large Very High Decreasing Few
Economy of scale Few Increasing (capital intensity) High High
This is a copy from “Mr. Tom Koplyay and David Goldsimith slide (July 1998)”
The t ext in Red g ive a q uick glance a t w here H P and i ts S egments are on the
Product Li fe Cycle cu rve. This would highlight where t hey are i s reflected i n P rice
elasticity, Experience, Economy of Scale, Barriers to Entry and Exit, Competition.

7/27/2019 HP Presentation Final PDF (2008.12.22)
http://slidepdf.com/reader/full/hp-presentation-final-pdf-20081222 32/78
Porter’s 5 Forces
NEW Entrants
Competitors BuyersSuppliers
Substitutes
Competitive rivalry
• Technology sol ution groups ( TSG): servers, so ftware, s torage and services –
Medium
• HP (133,000 more servers than Dell, 410,000 more than IBM)
• Intense competition (IBM, Sun Microsystems, Dell and Fujitsu Siemens
Computers)
This market currently has medium internal rivalry, but as other companies
enter, the rivalry will increase.
Hp has an advantage in this market
In 2008 HP shipped over 133,000 more servers than #2 Dell.
Moreover, H P sh ipped over 410, 000 more se rvers than #3 I BM and 7 .4
times as many as #4 Sun.
The server m arket co ntinues to show promising signs; t he co mpetitive
rivalry in the server market has become intense. Some of the competitors
in this market are; HP, IBM, Sun Microsystems, Dell and Fuj itsu Siemens
Computers

7/27/2019 HP Presentation Final PDF (2008.12.22)
http://slidepdf.com/reader/full/hp-presentation-final-pdf-20081222 33/78
• Personal system group (PSG): PCs and Workstations
• High Competition
• Major Competitors ( Dell, IBM, Apple, etc)
• Brand Image
• low switching costs
Market p rice for p c’s has gone dow n due t o high co mpetition i n t he market
causing the p rofit m argin t o decr ease. C ompetitors su ch as del l and I BM
continue to i nvest i n R&D. M ajor co mpetitors in t he market hav e a w ell
established brand image in the market.
• Imaging and printing group (IPG): medium/low
• HP’s key strengths (Product depth, market reach, post-sales support)
• Competitors: Xerox, Heidelberger, Konica, Lexmark, Pitney Bowes, SHARP
• High barrier to entry (R&D)
• Economies of scale
One o f H P’s major co mpetitor i n the i maging and pr inting i s Canon.
However, hp seems to have an advantage over Canon in this market.
HP has three key strengths in the imaging and printing market:
a) product depth,
b) reach in the market,
c) Post-sales support.
Some of HP’s competition (e.g. Canon) is pricing their products at prices
lower than HP’s. Thus, HP should take its competitors seriously. Some of
hp’s competitors like Canon have a st rong presence in the home segment
because of its entry-level printers that are priced low. Canon is focusing on
B&C Class cities where purchases are happening.
In 2005, hp toped imaging and printing market I the Middle East HP. (24%
growth in Commercial Imaging & Printing Group, 13% growth for IPG total
hardware w hereas Supplies Hardware growth was 28% for t he Middle
East region).
Overall sa les i n the I maging and P rinting Group a t H P M iddle E ast
delivered year-on-year growth of 19%.
Some o f the o ther co mpetitors i n the p rinting and i maging market a re;
Xerox, Heidelberger, Konica, Lexmark, Pitney Bowes, SHARP

7/27/2019 HP Presentation Final PDF (2008.12.22)
http://slidepdf.com/reader/full/hp-presentation-final-pdf-20081222 34/78
Threat of Substitutes
• Technology solution groups (TSG): servers, software, storage and services – Low
• Few substitutes
• Web hosting ( low cost, tech support, low switching costs, easy to manage)
The web host ing business might be t he biggest threat o f substitute f or the server products.. The advantages of web host ing include low cost, t ech-support, easy to
manage and low switching costs.
In addition, the advanced personal computer might be another biggest threat to the
server product
• Personal System Group (PSG): medium
Substitutes that exist in the market are portable computer devices, advanced phones
such as iphones, blackberries, i-touch from apple, etc
• Imaging and Printing Group (IPG): Medium
Some of the available substitutes that exist are
• Computers,
• portable computer devices,
• Phones (such as iphones, blackberry phones)
• Data storage devices (data and image storage devices such as flash memory
sticks, CD’s, external hard drives, etc)
Threat of New Entrants
• Technology solution groups (TSG): servers, software, storage and services – Low
• High Capital requirements for R&D, techniques, distribution channels
• IBM ($171 million in system and technology for server product in 2005
The threat of entrants for the server market is low because of the enormous costs
on t he R &D, relevant su pport pr oducts and services, m anufacturing and thedistribution. For example, IBM spent nearly $171 million in system and technology
for server product in 2005, (Annual Report,2006) and IBM spent over $1 billion in
the Linux operating system in 2001.(Shankland, 2002) This was only the barrier on
the cost, there were other barriers like technique, distribution channels etc.
• Personal System Group (PSG): medium
• High Economies of Scale
• Profit Margin on PCs decreasing

7/27/2019 HP Presentation Final PDF (2008.12.22)
http://slidepdf.com/reader/full/hp-presentation-final-pdf-20081222 35/78
• Extremely high start up costs
• well established market
• copy rights for patents and technologies
The personal computer market is a very well established market with very large
companies in it, such as Dell, HP Compaq, and Lenovo.
Two o f the m ost i mportant barriers t o entry, w hich ar e ha rd t o ob tain, i nto the
personal system market are;
(1) First, the start up of such a company requires an enormous capital investment.
The large economies of scale and price war in the personal computer market
require new f irms to h old a m assive i nvestment t o keep i tself a ctive i n
comparing price and technology strength with others.
(2) The giant firms in the PC market are al l having i ts own copyright for patents
and technologies which made new entries difficult to follow.
The big names either protect them from others or asked the new entries to pay a
copy right f ee t o do so . I f t hey don't want t o buy it f rom the exiting f irms, the
company needs to invest in Research and Development to develop their own.
However, such technology advance requires not only a great capital investment but
also a long time period
• Imaging and Printing Group (IPG): Medium
• Capital requirements can be high for small companies
• High revenues (a single point of share can drive over $50M in revenues).
• High Brand Image
• Switching Costs
The barriers to entry for manufacturing are significant. Developing printing engines
is an ex pensive pr oposition w hich r equires si gnificant technology ex pertise,
intellectual property rights, and huge investments in capital and personnel
resources. The po tential rewards can be massive. In an industry where a si ngle
point of share can dr ive over $50M i n revenues, ca pturing share and b uilding an
installed base is critical.
Barriers to en try for well est ablished company ar e not t hat high as they have the
capabilities to make massive R&D and technological investments

7/27/2019 HP Presentation Final PDF (2008.12.22)
http://slidepdf.com/reader/full/hp-presentation-final-pdf-20081222 36/78
Power of Buyers
• Technology sol ution groups ( TSG): servers, so ftware, s torage and services –
Medium/high
• Low switching costs
• There are many product choices for the buyers, e.g. IBM, HP, Dell etc.
The power of buyers for the server products is somewhat high because the buyer
does not co ncentrate to the firm and the switching co sts for the buyers are low.
There are many product choices for the buyers, e.g. IBM, HP, Dell etc.
• Personal System Group (PSG): medium
• Buyer volume:
• Few buyers purchasing large number of computers (i.e.: educational institutions,
government department and government owned companies, etc )
• Low Switching costs: in many cases where buyers are i ndifferent between hp’s
products and other pc’s offered by competitors
• price sensitivity: some what high
Power of Suppliers:
• Technology sol ution groups ( TSG): servers, so ftware, s torage and services –
Medium
• Concentration of suppliers: (low)
• Differentiation of inputs: (medium)
Intel and A MD, as the t wo b iggest processor pr oviders (monopolies) in the world,
have very strong power on the chip supplying. Although the power of suppliers might
be decreased resulting from the competition between these two companies, the wide
range of customers and high costs on switching cause the buyers lack of power tobargain with these two giants.
However, the power of suppliers for other low technical required material and parts
was much lower than the core hardware providers.

7/27/2019 HP Presentation Final PDF (2008.12.22)
http://slidepdf.com/reader/full/hp-presentation-final-pdf-20081222 37/78
• Personal System Group (PSG): Low/medium
The bargaining power o f suppliers i n t he pc industry i s low as hp and most o f i ts
competitors are vertically integrated. (talk about dell’s vertical integration)
Conclusion
• Although the capital requirements to enter the high-tech market is high, hp must
pay close attention to its competitors in the market.
• Hp has a st rong competitive advantage i n the imaging and p rinting market as
the company invests heavily on R&D which is considered to be one of the most
important barriers to entry into this market.
• Hp also has a competitive advantage in the personal systems market as it has a
very well established brand image
• Hp should pay close attention to some of its competitors in the imaging and
printing market. Some of those competitors are; Xerox, Konica, Lexmark, Pitney
Bowes, SHARP
• Hp should continue to compete and innovate especially in the personal systems
and the imaging and printing market.

7/27/2019 HP Presentation Final PDF (2008.12.22)
http://slidepdf.com/reader/full/hp-presentation-final-pdf-20081222 38/78
Strategic Map – Industry
High
HP$104.8B
D i v e r s i f i c a t i o
n
IBM$98B
DELL61.3B
Low
Competitive Capability HighLow
Xerox$15.9BLenovo
$14.6B
Sun$13.9BHeidelberger
$3.7B
TSG IPG PSGNotes:
Diversification:
All the companies (include IBM) show in this chart do not have the power to compete HP
in terms of high product/ business diversification. HP is indeed a giant that it is the leader
in three major industry sectors (Personal system, imaging and printing and technology
solutions.)
In H P, Imaging and P rinting G roup (IPG) is a unique business segment. T o those I T
companies illustrate on this chart, t he imaging and pr inting business group created an
unbeatable condition that o ther IT companies could not imitate i t’s st rategy i n a short
time.
The difference between IBM and HP is that HP needs to find an efficient way to boost
both the t echnologies and co nsulting se rvices by sh orten i t’s internal ex periencing
curves. The relative strategies will be explain in the recommendation section.
Competitive Capability:
In TSG, since HP is a new born baby in this field, the capability is weaker than IBM, but
stronger than DELL and Sun Microsystem.

7/27/2019 HP Presentation Final PDF (2008.12.22)
http://slidepdf.com/reader/full/hp-presentation-final-pdf-20081222 39/78
Before IBM sold it’s PSG, HP, IBM and DELL have similar business structures. Now HP
just faces only one major competitors left in personal PC market ---- DELL. Because the
product quality, s tability, se rvices offering an d co mpany di versification o f H P ar e
stronger t han D ELL, which w eakened D ELL’s competitive ca pability i n bot h the
enterprise market and personal PC market.
Since the products from Sun are running under a unique operating system, which means,the pr oducts o f Sun a re not as popul ar t han those o f DELL or H P, and the co mpany
scale resulted in the inferior market condition.
Lenovo i s a st rong competitor t o H P i n P C m arket, but since t heir stream m arket o f
Lenovo is still in China, it will not be a threat to HP so far.
In I maging and pr inting i ndustry, H P ha s two m ajor competitors -- Xerox and
Heidelberger. Since both of these companies just focus on one type of customer, HP’s
broad-bound cl ientele strategy i s st ill w orking well w ithout an ov erall challenge. But i t
needs to face and beat it’s competitors in every market segment.
In general, HP has very sound competitive capability and the highest diversification in IT,
imaging and printing and consulting markets. From this map, the strategy of HP should
increase it’s competitive capability to move to the right hand side. In order to reach that
point, HP could increase its capability by using the following strategies:
- Acquire some excellent companies
- enhance deliverables and efficiencies of each functional department
- Rely on the new findings from HP R&D centers.
Background information:
• HP: 4 busi ness segments (personal co mputing, i maging and printing, t echnology
solution, and financing)
• IBM: similar business segments as those of HP, and it does not have imaging and
printing business
• Dell: i t just focusing on PCs, Laptops and Workstations. Even though i ts revenues
from enterprise business segments is 2/3 of that of HP’s TSG, it can not catch up
with the development speed of HP because HP products have higher quality, stabilityand capability.
• Sun M icrosystem: S un has similar b usiness diversification al st ructure as those i n
DELL (PCs and Laptops excluded)
• Xerox: focus on business printing hardware and software, a strong competitor to HP
in imaging and printing business section only.

7/27/2019 HP Presentation Final PDF (2008.12.22)
http://slidepdf.com/reader/full/hp-presentation-final-pdf-20081222 40/78
• Heidelberger: This company focus on publishing business.
• Revenues in 2007 (data extracted from 2007 annual reports)
• TSG:
- HP: $37,740 million
- IBM: $95,443 million
- Dell: $24,137 million
• PSG:
- HP PCs: $36,409.00 million
- Dell: $36,996.00 million
• IPG:
- HP: $28,465.00 million
- Xerox: $17,228.00 million

7/27/2019 HP Presentation Final PDF (2008.12.22)
http://slidepdf.com/reader/full/hp-presentation-final-pdf-20081222 41/78
•Background Information (HP & IT Industry)
•Market Dynamics
•Corporate Profile
ra eg c s
•Recommendations

7/27/2019 HP Presentation Final PDF (2008.12.22)
http://slidepdf.com/reader/full/hp-presentation-final-pdf-20081222 42/78
$104,286MCost of good sold
DuPont Formula
$16,222MOperating Expenses+
$104,286MSales/ Net Revenues
Total Cost of Expenses $7,264MNet Income
_
$289MInterest Expenses+
$1,913MTax Expenses+
$11,293MCash & Cash Equivalent
$13,420MAccounts Receivable
Inventories
+
+
97,022M
$47,402MCurrent Assets
Sales/ Net Revenues÷$6.965%
Net Profit Margin
ROA8.19%
$8,033M
$2,659MMarket Securities+
$7,798MProperty, plant & Equipment
$33,499MIntangible Assets+ $41,297M
Non-Current Assets+
$94,804MTotal Assets
$104,286MSales/ Net Revenues
÷ $110.002%Total Assets Turnover
Data extracted from HP Annual Report 2007
X

7/27/2019 HP Presentation Final PDF (2008.12.22)
http://slidepdf.com/reader/full/hp-presentation-final-pdf-20081222 43/78
Company Financial Profile
10.5%11.2%10.0%
12.0%
Profitability
2.212.00
2.50
Liquidity
7.0%
4.8%
3.3%
0.0%
2.0%
4.0%
6.0%
8.0%
HP IBM Dell Industry S&P 500
700%
Leverage1 000
in $ thousand Activity
1.001.14
1.01
1.28
0.00
0.50
1.00
1.50
HP IBM Dell Industry S&P 500
130%
323%
635%
30.3%
197.5%
0%
100%
200%
300%
400%
500%
600%
HP IBM Dell Industry S&P 500
$606
$256
$693
$293
$859
$0
$100
$200
$300
$400
$500
$600
$700
$800
$900
,
HP IBM Dell Industry S&P 500
Profitability:
The profitability can be measured by either rate of Net profit margin or ROE. As to the
net profit margin rate, HP doubled the rate of industry, higher than Dell, but lower than
IBM and S&P 500 index. It demonstrate that, in IT industry, HP has strong capability to
earn profits.
Liquidity / quick ratio = (Current Assets – Inventory)/Current Liabilities
Ideally the acid test ratio will be 1:1, but 0.8:1 is acceptable, with less the business could
suffer financial difficulties. Generally, according to the data showed on the histogram, the
liquidity capability of IT industry and S&P 500 index are higher than HP.
In this case, HP has the ideal quick ratio/ liquidity capability. Comparing to IBM and Dell,
IT industry and S&P 500, HP has lowest liquidity capability, but i t is still acceptable to
investors. Because HP used huge amount of cash to acquire 7 companies in 2007 and
was preparing cash flows to acquire EDS in 2008, these business activities would
eliminate the amount of current assets, which would eventually lower the rate of liquidity.
Leverage ratio = Total debt / Total Equity
The solvency of HP is very strong. HP has lower capacity than that in IT industry, but
much better than that of S&P500, IBM and Dell. It turned out that HP has a very healthy
financial leverage capability

7/27/2019 HP Presentation Final PDF (2008.12.22)
http://slidepdf.com/reader/full/hp-presentation-final-pdf-20081222 44/78
Activity
we used “revenues generated by each employee” to measure HP activity, which equals
Total revenues divided by Number of employees
The result from the histogram illustrate that HP was above the average (industry level)
and I BM, but l ower t han S &P500 and D ell. S ince Dell i s a y oung an d fast growth
company, y oung co mpanies usually hav e hi gher rate o f act ivity t han t he m ature
companies, which could keep them surviving, growing, and expanding their market
shares. B ut as to t he giants like H P and I BM, t hese mature co mpanies would f ocus
more on maintaining their profits, and this can explain why HP and IBM have higher rate
of profitability than Dell.
Overall, H P’s financial condition i s healthy; the company balanced t he degree of debt
and equity in a reasonable condition. And more importantly, to stockholders or investors,
this company can offer you higher profits than immature companies.

7/27/2019 HP Presentation Final PDF (2008.12.22)
http://slidepdf.com/reader/full/hp-presentation-final-pdf-20081222 45/78
Company Financial Profile
Weak Strong
Very Low Average Very High
Very tight About right Too much slack
Liquidity
Levera e
Too Much Debt Balanced Too Much Equity
Too Slow About Right Too Fast
Activity
“I” for Industry, “S” for S&P500
• Over al l, H P financial c apability i s above av erage. Though i t’s l iquidity and
leverage capacities are lower than industry level, the ratios are still acceptable in
terms of the requirements in traditional economy point of view.
• Comparing to it’s major competitor -- IBM, the leverage capability and employee
productivity were m uch better t han those o f IBM. T hough t he p rofitability and
liquidity is lower than those of IBM, they were still acceptable. Since HP acquired
7 co mpanies in 2007, which w ill influenced t he degree of Current Assets andLiability amounts (cash and cash equivalents decreased, inventory increased) ,
as well as the decrease of profitability accordingly (operation costs increased at
the beginning when new companies joined HP).

7/27/2019 HP Presentation Final PDF (2008.12.22)
http://slidepdf.com/reader/full/hp-presentation-final-pdf-20081222 46/78
Management Effectiveness
90.00%
HP IBM Dell Industry
36.59%
78.90%
40.00%
50.00%
60.00%
70.00%
80.00%
8.19%
16.46%18.85%
8.65%
17.61%
10.69%
27.06%
4.07%6.34% 8.27%
0.00%
10.00%
20.00%
30.00%
ROA ROI ROE
Although al l H P r atios here w ere abov e I T i ndustry l evels, i t st ill r anked t he l owest
comparing to the other two competitors (DELL and IBM). At a glance, it seems that HP
should find so me w ays to i mprove t hese numbers t o p rove i ts m anagement
effectiveness. But when we associate the profitability and leverage factors we mentioned
in the previous slide, we will find that HP had a sound management effectiveness. Why?
Following are the reasons:
The reason of HP had such a low ROE is that HP had a l arge base of equity than those
of IBM and D ELL. These t wo companies sacrificed the balance of debt and e quity to
acquire higher ROEs, which would lead to unstable financial conditions. It means their
investment activities relied on bigger proportion of debts or loans than on shareholders
equities.
The investors should consider such unbalanced financial condition before they decide to
buy these stocks as one of their long term investments. Therefore, we do not think the
low ROE is a big problem to the smart investors, as long as they can see the business
potential, healthy financial status of a company.
Although low ROE is not a big issue to HP, HP could increase their ROE to attract more
investors by increasing their net profits or reducing the level of costs. (rate of costs: IBM
HP is 91.2%, IBM is 85.33%, Dell is 93.74%. )
Source of Data:
• ROA & R OE: results o f HP, IBM and D ell were ca lculated ac cording t o the dat a
provided from companies’ annual reports, Industry data from Reuters.
• ROI: all data are from Reuters

7/27/2019 HP Presentation Final PDF (2008.12.22)
http://slidepdf.com/reader/full/hp-presentation-final-pdf-20081222 47/78
Porter’s Value Chain
Primary Activities
Distribution&
OutboundLogistics
OperationsSupplies
&
InboundLogistics
Sales &
Marketing
Service
ProfitMargin
Product R&D, Technology, Systems Development
Human Resources Management
General Administration
Support Activities
The primary value chain activities:
Inbound Logistics:
the receiving and w arehousing of raw materials and their distribution to manufacturing
as they are required.
• HP has the largest supply chain
• Hp’s provider base reduced by 70%
• 90% of direct purchases were concentrated to top 36 suppliers
• High co llaboration w ith su ppliers to ach ieve co st e ffectiveness and e fficiency i n
outbound logistics
• Operations
• What hp produces
: t he pr ocesses of transforming i nputs into finished p roducts and
services.
• What is hp’s input transformation process
• Improvements of operations
• Six Sigma,
are done through the use to tools and techniques that
allow hp to become more efficient and effective. Some of these are;
• lean manufacturing,
• Theory of Constraints
7/27/2019 HP Presentation Final PDF (2008.12.22)
http://slidepdf.com/reader/full/hp-presentation-final-pdf-20081222 48/78
• Outsourcing
• Chairman of the Board and Chief Executive Officer of Hewlett-Packard announced
in D ecember 1 st 2004
(
(another way to achieve cost advantage )
http://workingsmarter.typepad.com/my_weblog/2004/12/effectiveness_a.html) t hat
“H-P has had a discipline of outsourcing its manufacturing for 30 years. Now we
apply t hat di scipline t o every par t o f our business." H P recognizes that onl y bybeing m oiré efficient a nd m ore e ffective hp c an co mpete i n the m arket– (an
organization’s policy that is considered to be one of the most important drivers of
uniqueness/differentiation)
• Hp outsources m ost of i ts manufacturing t o co ntract producers – “The co ntract
manufacturer buy s the ca se for the monitor from an injection m older, w hich
acquires the material used to make the case from a plastics compounder (Geon is
an example), which in turn buys the material for the compound from a resin maker.”
Outbound Logistics:
The warehousing and distribution of finished goods.
• Spends 2 billion a year on outbound logistics
• Annually, HP ships roughly 25 million PCs, 43 million printers, 2.5 million
handhelds, two million servers, and more than one million disk arrays.
• Hewlett-Packard Company has the ninth-largest non-military supply ch ain in the
world. We ship everything from inkjet cartridges to super computers,” says Robert
Gifford, vice president, worldwide logistics for the company. "
• The improvement of their outbound logistics comes as a response to the increasing
pressure on hp for fast delivery of their pc’s and other final products.
• Hp’s distribution centers’ geographic locations (leads to cost advantage)
• Improved customers service ( differentiation due to linkage between outbound
logistics and services )
are
selected according to customers’ needs and in a manner to ensure high efficiency
in delivery and cost-effectiveness in their delivery operations. Therefore improving
their profitability and increasing the shareholder’s value (one of the 10 drivers that
leads to improvements of value chain activities)
• Offering cu stomers (retailers) and di rect cu stomers a num ber o f t ransit-time
options enabled hp to managed logistics costs and maintain the customer
experience (cost advantage due to

7/27/2019 HP Presentation Final PDF (2008.12.22)
http://slidepdf.com/reader/full/hp-presentation-final-pdf-20081222 49/78
• Simplifying the supply chain –
• Marketing & Sales: the identification of customer needs and the generation of sales.
Marketing
• Environmental practices;
• Hp has announced ha t it intends to cu t down i ts carbon dioxide em issions from
both HP-Owned and leased facilities by 15% by 2010. (An environmental practice
that is used for marketing which reflects the organizational policy that is considered
to be a driver of uniqueness/differentiation)
Sales
• Effective I dentification of customer’s needs lead hp to launch energy efficient
products to respond to growing demand for energy efficient products. Theses
products range from house appliances to commercial products. The introduction of
this type of products lead to an increase the level of sales for hp products
• Hp’s out sourcing pr oducts that r anges from application outsourcing, business
process outsourcing, infrastructure outsourcing etc) has lead to an increase in this
segment o f p roducts b y 27% i n t he se cond quarter i f 2005. The o utsourcing
products se gment w as identif ied a s the fastest growing se gment i n
hp. http://www.hp.com/hpinfo/newsroom/press/2005/050629a.html
• Service:
• See outbound logistics for service improvements
the support of customers after the products and services are sold to them.
• Online support centers
• Technical support centers
• Warranties
• Business support centers
• HP’s Business-to-business solutions allowing b usiness customers (retailers
and wholesalers to better manage their purchases, offers them more flexibility
and cost and time savings features.

7/27/2019 HP Presentation Final PDF (2008.12.22)
http://slidepdf.com/reader/full/hp-presentation-final-pdf-20081222 50/78
These primary activities are supported by:
The infrastructure of the firm: organizational structure, control systems, company culture,
etc.
Highly decentralized company
High degree of autonomy being given to individual departments to make their own
purchasing decisions and other types of decisions.
Human r esource management: employee recruiting, hi ring, training, development, and
compensation.
Management Style
• Open-door management policy and MBWA (management by walking around)
• MBWA – manager walking around and chatting with employees to better
understand work issues and assess employees performance and work challenges.
• Lack of management perks
• Profit results are shared with employees
• Beer parties for employees
Selection and Placement
• No placement tests
• Selection is based on person’s fit with the organization’s culture
Appraisal
• Employees are allowed to set personal objectives provided they are compatible with
the organization’s objectives. Employees will be evaluated according to the extent
they m eet their ow n per sonal w ork ob jectives. O bjectives need a su pervisory
approval. This helps to create constructive individual behaviours and initiatives and
help improve creativity and communications.
• Appraisals done at the group levels to avoid individual conflicts

7/27/2019 HP Presentation Final PDF (2008.12.22)
http://slidepdf.com/reader/full/hp-presentation-final-pdf-20081222 51/78
Rewards
• Generous salaries and benefits
• Transparent salary administration system
• Egalitarian reward system (Equal rewards)
• Layoffs are avoided to increase employees’ loyalty and trust
Training and development
• One for all, All for one
• Technology development: technologies to support value-creating activities.
• Research hp’s research and development (research labs)
• Procurement: purchasing inputs such as materials, supplies, and equipment.
• HP's procurement budget is $67 billion annually
• Decentralized pr ocurements - Individual business groups within HP m anage t heir
own direct materials procurement for spend that is unique to their business.
• $14.9B for i maging an d pr inting, $11. 5B for personal sy stems and over $10B
annually f or technology so lutions. C entral pr ocurement m anages $15 .4 bi llion o f
direct sp end across the oper ating units, $13 .2 billion in indirect sp end, and $1.4
billion in logistics procurement.
In the past decade, HP has implemented a number of processes and programs to
better manage spend. This includes;
• Consolidating and outsourcing transactional processing,
• Building tactical purchasing centers, and creating a distributed workforce of experts
for strategic procurement and shared services.
• The results they hav e ach ieved through these various initiatives have created a
"self-funding" investment model that drives accountability and team member to think
about actual, bankable cost reduction rather than just negotiated savings.
Porter Value Chain Conclusion:
• Hp’s innovative approach i n improving the quality and e ffectiveness of i ts primary
activities is an important contributing factor to Hp’s success in the market.
• Hp realizes that only through innovation and cr eativity it can remain competitive in
the market. This is shown in its improved inbound and outbound logistics sales and
marketing and after sale services provided to its customers

7/27/2019 HP Presentation Final PDF (2008.12.22)
http://slidepdf.com/reader/full/hp-presentation-final-pdf-20081222 52/78
Company Capability profile
Weak Neutral Strong
1. Product Strength, Quality, Uniqueness
Competitive factors
2.Customer Loyalty & Satisfaction
3.Market Share
4.Low Selling & Distribution Costs
5.Use of Experience Curve for Pricing
6.Use of Life Cycle of Products
0% 25% 50% 75% 100%
.
8.High Barrier to Entry in Competitive Markets
9.Advantage Taken of Market Growth Potential
10.Supplier Strength & Material Availability
11.Customer Concentration
Key takeaways from Competitive factors:
In terms of competitive factors, HP has high quality product and uniqueness. HP has
a strong market position in most of its product segments. The company has a leading
position in market position in PC (19% market share) followed by Dell (16.4%). HP isalso second largest entity in servers market behind IBM. It also is one of the leaders
in printers.
HP is flat in R&D spending. R&D as a percentage of revenue has declined over the
last three years (2005 to 2007 from 4% to 3.5%) comparing to IBM (6.1% to 6.7%).
Also, in terms of suppliers strength, there are some monopoly suppliers such as Intel
who can control the prices.

7/27/2019 HP Presentation Final PDF (2008.12.22)
http://slidepdf.com/reader/full/hp-presentation-final-pdf-20081222 53/78
Company Capability profile
Weak Neutral Strong
1.Technical and Manufacturing Skills
Technical factors
2.Resource and Personnel Utilization
3.Level of Technology Used in Products
4.Strength of Patents and Processes
5.Product Effectiveness & Delivery Schedules
6.Value Added to Product
0% 25% 50% 75% 100%
.
8.Economies of Scale
9.Newness of Plant and Equipment
10.Application of Computer Technology
11.Level of Coordination and Integration
Key takeaways from Technical factors:
It seems that HP is strong in terms of technical factors. Main strengths are economy
of s cales and level o f coordination and i ntegration. The co mpany i s mature an d
strives towards cost l eadership and v olume pr oduction. A lso, H P ar e st rong i n
integration and coordination since the company has acquired many companies and
were successful in integrating them with HP (one good example is Compaq).

7/27/2019 HP Presentation Final PDF (2008.12.22)
http://slidepdf.com/reader/full/hp-presentation-final-pdf-20081222 54/78
Company Capability profile
Weak Neutral Strong
1.Corporate Image, Social Responsibility
Managerial factors
2.Use of Strategic Plans & Analysis
3.Environmental Assessment & Forecasting
4.Speed of Response to Changing Conditions
5.Flexibility of Organizational Structure
6.Management Communication & Control
0% 25% 50% 75% 100%
.
8.Ability to Attractive & Retain Creative People
9.Ability to Meet Changing Technology
10.Ability to Handle Inflation
11.Aggressiveness in Meeting Competition
Key takeaways from Managerial factors:
Strong i n co rporate i mage and so cial r esponsibility su ch as Recycling i ssue: H P
achieves its goal of recycling one billion pounds of electronic, which now operate in
more t han 40 countries. I n terms o f business, it provides customers m ore energy-
efficient solutions for their data centers.
Also HP managers are strong in strategy planning and anal ysis, that is seen by the
growth and competition with other major competitors.
In terms of employees (attracting and retaining), HP employees move through four to
six functional areas in the course of their carriers. This creates broad knowledge of
the co mpany and fosters the kind o f teamwork other co mpanies covet. When i t
comes time to promote, managers don't look who is next down the carrier line, they
look for the best people.
HP i n t erms o f en trepreneurial, they ar e not as strong si nce they ar e a mature
company.

7/27/2019 HP Presentation Final PDF (2008.12.22)
http://slidepdf.com/reader/full/hp-presentation-final-pdf-20081222 55/78
Weak Neutral Strong
1. Access to Capital when required
Financial factors
Company Capability profile
.
3. Ease of exit from the market
4. Profitability, return on investment
5. Liquidity, available internal funds
6. Degree of Leverage, financial stability
7. Ability to compete on prices
0% 25% 50% 75% 100%
8. Cap investment, capacity to meet demand
9. Stability of costs
10. Ability to sustain effort in cyclic demand
11. Price elasticity of demand
Key takeaways from Financial factors:
In terms of profitability they are strong, HP is second to IBM. The are also strong in
cap investment. They have made many acquisitions such Compaq and EDS.
Exist from the market is weak since they are a mature company.

7/27/2019 HP Presentation Final PDF (2008.12.22)
http://slidepdf.com/reader/full/hp-presentation-final-pdf-20081222 56/78
Organizational life cycle
Initiation
entrepreneurial
Formalization
Bureaucratic
Expansion
DivisionalStructure
Coordination
ProductGroup
Participation
Matrix structure
p a n y
Age of company
S i z e o f C o
matureSmall
om nan ye oncep uaDirective
na y caBehavioural
rec veAnalytical
na y caConceptual
Conceptual/Behavioural
Structure Informal Segmented Horizontal Multi-tiered Multiple unit
Environment Unstable/Simple Stable/ Complex Stable/ Simple Stable/ComplexComplex
ROI Very High High Medium/Low Medium High
Mkt Strength Very high High Medium/ Low Medium High
typicalfinancialproblem
Capitalization Cash flow Leverage/Margins
Low netearnings/capitalization
Cost control
Key takeaways from this slide:
• Economy of scale
•
Cost leader/strong market position
• Robust Financials (reduced long term debt)
• Multiple units and products
• Matrix structure (Most companies tend to recruit, train and promote people within
functional corridors. But HewlettPackard (HP) breaks the walls, creating a carrier
network that begins with the recruitment of diverse people in terms of their skills
and personality and then promotes horizontally, as well as vertically throughout
the company)
• HP faces i ntense competition from co mpetitors i n many di fferent m arketsegments that co uld a ffect their revenue. The c ompany has become a market
leader in PC in third and fourth quarter of 2006, with Michael Dell coming back as
CEO, Dell is likely to make a push for market leadership.

7/27/2019 HP Presentation Final PDF (2008.12.22)
http://slidepdf.com/reader/full/hp-presentation-final-pdf-20081222 57/78
•Background Information (HP & IT Industry)
•Market Dynamics
•Corporate Profile
ra eg c s
•Recommendations

7/27/2019 HP Presentation Final PDF (2008.12.22)
http://slidepdf.com/reader/full/hp-presentation-final-pdf-20081222 58/78
SWOT Analysis
Big market share
Economy of Scale
Market expansion Green IT
One-stop solutions
or zon a n egra on
Strong Financial fundamentals
Cost effective operations
Diversification of product
Brand recognition
Restructuring
Partnership
Services
Offshore operations
Lack of elasticity
Economy instability
W
Lack of Focus
Maturity within segment (PC)
Acquisitions Vs innovation
Internal communication, andPerformance
Flat R&D spending T
Intense competition
Monopoly of suppliers/ customers
Decrease in Segment Margins
Strength:
• HP have big market share
• Economy of Scale
• Horizontal integration and Strategy Eliminating of the competitor
• Financial fundamentals are strong: capital structure, liquidity, operation andprofitability.
• Cost effective offshore operations.
• Segmentation which help them diversify the risks.
• Brand recognition
Weaknesses:
• Restructuring:
- Layoffs ev ery t ime H P acquire bi g co mpanies and i ts negative i mpact on
Employees moral and a nxiety ( uncertainty, l oyalty, bu rned out ) – although
Return on employees goes up!
- Customers fears from potential decline in level of quality and services.
- Integration of new acquisitions may take longer, cost more, and be less
effective than planned.
7/27/2019 HP Presentation Final PDF (2008.12.22)
http://slidepdf.com/reader/full/hp-presentation-final-pdf-20081222 59/78
• No focus because o f the di fferent segments which make t he management andplanning difficult.
• Maturity w ithin a busi ness segment (printing), s low dow n i n i nnovation w hichmight translate to less profits.
• Acquisitions may become substitutes for innovation.
• Internal C ommunication ( Diversified firms like H P w hich has 4 se gments mustprocess more information of greater diversity which HP lacked sometimes, Scopecreated by di versification m ay ca use managers t o rely t oo m uch on financialrather than strategic controls to evaluate business units’ performances)
• Flat R&D spending compared to competition
Opportunities:
• Expand in em erging markets t hat w ill g ive HP a l arger market sh are (Differentcountries are at different stages of economic and technological development, and
their consumers have different needs at different times. A company facing toughcompetition, thin profit margins, and slow sales growth at home may get a f reshstart in another country where demand for its product is just beginning to grow)
• Green computing to be fit with the environment (Data Centers that are focusedon l everaging hi gh-density co oling, pow er-reduction desi gn s trategies for customers with reliable, scalable solutions) Outsourcing and v irtualization to HP(help clients to better contribute in this means)
• Complete solutions: one stop solutions
• Reducing time to markets (be first in market to introduce new innovative products – Servers, printers, services, virtualization)
• Partnership with big market players (Microsoft, Intel and yahoo)
• Services when m argins sl ow dow n t o keep cu stomer sa tisfaction and l oyalty.Outsourcing to H P (added V alue t o c ustomers, as customer a re sw itching therisk to HP and getting services on demand)
• Offshore operations: HP labs in global setting help understand the marketdynamics, cl ient needs. R &D G lobalization ( HP l abs work w ith H P's businessdivisions and customers to a nticipate future t rends and create i nnovations thathelp create next-generation solutions. Focus on creating new technologies for
addressing t he I T needs of new cu stomers i n r apidly g rowing g lobal marketswhere t here a re di stinct t echnological, so cial and economic ch aracteristics. B yunderstanding t his co ntext deepl y, H P Labs ai ms t o cr eate new and relevanttechnologies. )
• Not enough elasticity in high end products (servers and storage), as if market areslow t hey ca nnot b ring t he p rice dow n ( will not h ave bi g co mpetition – HPmonopoly in this segment)

7/27/2019 HP Presentation Final PDF (2008.12.22)
http://slidepdf.com/reader/full/hp-presentation-final-pdf-20081222 60/78
Threats:
• Economy dow n t urn: the r ecession and i ts i mpact on the w hole m arket (The Asia/Pacific P C m arket was impacted by a sl owdown i n C hina, P C g rowth i nLatin America was slow relative to historical levels). Last acquisition investmentimpact that might have on the financial situation.
•
Intense competition with big players in the different segments ( IBM, D ell, S un,Xerox )
• Competitors Vertical integration with distributors and suppliers (monopoly)
• Decrease in Segment Margins (printers\ hand held devices\ PC)
How Strength can be an opportunity? Or How Strength can translate to threats?
Or How Weaknesses can be opportunity or a threat?
• Having Big market share, economy of scale can be an opportunity to expand in
the market, and have a stronger position within competitors
• With H orizontal i ntegration i s an oppo rtunity for ex pansion by ac quiring m orecompanies or competitors. The risk in this that they will miss on investing more ininnovations opportunities.
• Diversification i n their di fferent segments give H P an oppor tunity t o be bet ter then competition to provide clients with one stop solution, but in the same tokencan be a point of weakness in sense that there lack of internal communicationand synergy between the business segments.
• Flat R & D i s a w eakness that w ill pr esent esp ecially with t heir i ntensecompetition with IBM, Dell, Cannon, IBM Global services …
• Lack of Focus as they have the di fferent business segments, again can be anopportunity as they have t he advantage of pr oviding t he one-stop solutions totheir customers
• Brand Recognition is a strength that can be an opportunity, as they have goodchance to partner with big players in the market (ex: Microsoft, Intel, Yahoo), butthe t hreat here i s competition ca n have a bet ter oppor tunity o f i ntegration w ithsuppliers, distributors.
• Cost effective operations give them leverage to run off shore operations (HP labs)and provide their services globally.
• Maturity within a segment even though it is a strength as it give them economy of scale and big market share within the segment (IPG and PSG) it is a w eaknessin terms that don’t have big room to grow, they have to sustain their position inthe market for these segments.
• This would represent a risk or threat with the intense competition as they mightcome with new innovative, cu tting edge technologies, as well these se gmentsmight at this point have stable or decrease in the segments margins.

7/27/2019 HP Presentation Final PDF (2008.12.22)
http://slidepdf.com/reader/full/hp-presentation-final-pdf-20081222 61/78
Growth Vector
Market Penetration Product variant, imitation Product line extension
s
Present Products Improved Products New Products NewStrategies
• Imaging and Printing
• Storage & Servers• PCs
• Services, Financing,
• Entertainment• Digital Multimedia
• Intensify R&D
Aggressive promotion
•Server/ Storage for Medium Business
•Brick countries- Brazil,
Market segmentation
•Outsourcing
•Product differentiation
•Cloud computing testing
Vertical diversification
M a r k e t O p
t i o n Existing
Market
Expandinguss a
Market development
•Global market
Market extension
•Medical equipmentapplications
Conglomeratediversification
•Mobile IP networks
Product Alternatives
ar e
NewMarket
M
ExistingStrategies
A snapshot of where the company is and where i t is going. It reviews the di fferent
product al ternatives available t o a co mpany in r elation t o i ts market op tions.
Horizontal move : more difficult because of usage of more resources; Vertical move:
less risky; strategies can be improved on upperside and new strategies have to be
redesigned i f unde rneath. The l onger, t he m ore co mbination o f ar rows, the more
risky it is.
Major and secondary markets.
3G: a third generation network standard which makes it possible for more efficient
delivery of w ireless data se rvices including i nternet acce ss and t wo way em ails.
Applications include videoconferencing and mobile electronic commerce.

7/27/2019 HP Presentation Final PDF (2008.12.22)
http://slidepdf.com/reader/full/hp-presentation-final-pdf-20081222 62/78
Directional Policy Matrix
Diversification Market SegmentationMarket Leadership;
100%
PSG
Phased withdrawal Merger Maintain position,market penetration
Expansion;Product differentiation
m p a n y C a p a b i l i t y
IPG
PSGIPG
TSG
TSG
Divestment Imitation; Phasedwithdrawal
Cash Generation
C o
Market Potential0% 100%
0%
Previous market Existing market
The graph illustrates the same trend from these 3 business groups:
(1) All groups are moving towards to the same direction --- the market leadership.
(2) They all need to improve their company capabilities.
(3) All groups especially IPG and PSG groups need to keep finding new ways of market
potentials to improve their leadership in the industry.
TSG (Previous position):
The co mpany ca pability w as not hi gh, but H P did foresee t hat technology, so ftware,
consulting and IT so lutions will hav e at tractive m arket po tential, w hich ev entually
resulted i n t he H P-Compaq m erger and E DS a cquisition. A fter merged C ompaq, the
revenues of TSG increased about 160%, and a fter acquired EDS, the increasing rate is
bigger than that before acquisition.
TSG (existing position):
TSG sh ould co llaborate seamlessness with EDS to i ncrease its efficiency. In addi tion,
HP needs to enhance the R &D center’s function in o rder to switch
academic/experimental findings to business u tility, so t hat i t co uld i ncrease the
competitive capabilities as we mentioned in strategic map slide.

7/27/2019 HP Presentation Final PDF (2008.12.22)
http://slidepdf.com/reader/full/hp-presentation-final-pdf-20081222 63/78
PSG (Previous position):
But HP had stronger capabilities than its competitors in some areas such as its
technology, sa les ch annel, se rvices, so lutions, quality and b rand r ecognition, w hich
make H P ca n occu py a i deal per centage o f market sh ares in this personal sy stem
segment.
PSG (existing position):
After H P m erged C ompaq, i ts company ca pability i ncreased. N ow t he company had
many di rect competitors (Dell, Lenovo, Fuj ishu, Toshiba, Acer etc), so t hat t he market
potential was not in a very attractive condition since the profit margin became very lean
to manufacturers, but as to the numbers of PC customers is increasing (which means
the PSG market is expanding), which might offset the negative impact and might even
increase the market potential rate instead.
The main strategy to PSG group is to improve the company capability. On one hand, this
group should keep focusing on products’ qualities, innovation, and marketing strategies;
on the other hand, it should lower costs to enlarge its profits by using vertical integrationstrategies.
IPG (Previous position):
IPG had the similar si tuations as PSG, t he market potential was a l ittle bi t l ower t han
PSG. HP had many competitors from different level and business segments.
IPG (existing position):
The horizontal acquisition strategies (from 2002 to 2008) enhanced the company’s entirecapability. Although the marketing potential is shrinking, plus more and more substitute
products introduced to the market (as we mentioned in porter 5 forces model), the
horizontal acquisitions could offset some of the negative impacts and keep HP’s market
potential moving to a favourable direction.
In order to beat its strong competitors like Xerox, Canon and Heidelberger, IPG group
need to keep its eyes on the market potentials (main strategy for IPG), which means, it
could keep i ts horizontal i ntegration s trategy t o keep exploring new m arkets or create
innovative products/ services to their cl ients. I n addi tion, to lower costs and t o c reate
more environmental friendly/green products are the ways to improve its market share. In
order to reach this goal, IPG also could employ the same strategies (vertical integration)as those suggested to PSG.

7/27/2019 HP Presentation Final PDF (2008.12.22)
http://slidepdf.com/reader/full/hp-presentation-final-pdf-20081222 64/78
SPACE – TSG Environmental Stability
Technological changes Many 0 1 2 3 4 5 6 Few
Rate of inflation High 0 1 2 3 4 5 6 Low
Demand variability Large 0 1 2 3 4 5 6 Small
Price range of competing products Wide 0 1 2 3 4 5 6 Narrow
Barriers to entry into market Few 0 1 2 3 4 5 6 Many
Competitive pressure/rivalry High 0 1 2 3 4 5 6 Low
Price elasticity of demand Elastic 0 1 2 3 4 5 6 Inelastic
Pressure from substitute products High 0 1 2 3 4 5 6 Low
Average = 3.69Result = - 2.31
SPACE – TSG Financial Strength
ROI (Return on investment) Low 0 1 2 3 4 5 6 High
Leverage unbalanced 0 1 2 3 4 5 6 balanced
Liquidity unbalanced 0 1 2 3 4 5 6 Solid
Capital required vs available High 0 1 2 3 4 5 6 Low
Cash flow Low 0 1 2 3 4 5 6 High
Ease of exit from market Difficult 0 1 2 3 4 5 6 Easy
Risk involved in business Much 0 1 2 3 4 5 6 Little
Inventory turnover Slow 0 1 2 3 4 5 6 Fast
Economies of scale & experience Low 0 1 2 3 4 5 6 High
Average = 3.95

7/27/2019 HP Presentation Final PDF (2008.12.22)
http://slidepdf.com/reader/full/hp-presentation-final-pdf-20081222 65/78
SPACE – TSG Industry Strength
Growth potential Low 0 1 2 3 4 5 6 High
Profit potential Low 0 1 2 3 4 5 6 High
Financial stability Low 0 1 2 3 4 5 6 High
Technological Know-how Simple 0 1 2 3 4 5 6 Complex
Resource utilization Insufficient 0 1 2 3 4 5 6 Efficient
Capital intensity Low 0 1 2 3 4 5 6 High
Ease of entry into market Easy 0 1 2 3 4 5 6 Difficult
Productivity, capacity utilization Low 0 1 2 3 4 5 6 High
Other: manufacturers’ bargaining power Low 0 1 2 3 4 5 6 High
Average = 5.22
SPACE – TSG Competitive Advantage
Market Share Small 0 1 2 3 4 5 6 Large
Product quality Inferior 0 1 2 3 4 5 6 Superior
Product life cycle Late 0 1 2 3 4 5 6 Early
Product replacement cycle Variable 0 1 2 3 4 5 6 Fixed
Customer loyalty Low 0 1 2 3 4 5 6 High
Competition capacity utilization Low 0 1 2 3 4 5 6 High
Technological know-how Low 0 1 2 3 4 5 6 High
ertical integration Low 0 1 2 3 4 5 6 High
Other: speed of new product introductions Slow 0 1 2 3 4 5 6 Fast
Average = 4.33Result = - 1.67

7/27/2019 HP Presentation Final PDF (2008.12.22)
http://slidepdf.com/reader/full/hp-presentation-final-pdf-20081222 66/78
SPACE Analysis
Financial Strength
5
6 ConcentricDiversification
Status Quo
Con lomerate
CompetitiveAdvantage
IndustryStrength
-1
0
1
2
3
4
-5 -4 -3 -2 -1 0 1 2 3 4 5-6 6
VerticalIntegration
oncen ra onDiversification
Diversification TSG
PSG
Environmental Stability
-5
-4
-3
-2
-6
Divestment
Liquidation
Retrenchment
ConcentricMerger
ConglomerateMerger
Turnaround
IPG
TSG:
The T echnology solution g roup has strongest capabilities amongst t hree business
segments. I ts ou tstanding l eadership bene fits from i ts s trong ca pabilities in i ndustry,
competition and environmental stability area.
PSG:
The Personal system group (PSG) has the highest financial strength, but shortest arrows
amongst t hree o f the business groups. The shortest ar row r eflects t hat PSG has less
strength i n cost l eadership t han t hat i n TSG and I PG, beca use i t has l owest r ates i n
industrial strength, environmental stability and competitive advantage. These three
criteria will influence the length of the arrow.
Although the l ength o f t he ar row is shorter, i t doesn’t a ffect i t’s cost l eadership in t he
market and its strategy selection at all. Basically, PSG group would share same
suggestions from TSG, because HP still has strong competitive advantage and industrial
strength than it’s competitors.
IPG:
In Imaging and printing group, none of its criteria are outstanding, which rank this group
in the second position in HP. The leadership strength of IPG is between TSG (strongest)
and PSG (most fragile), since the arrow direction is the same to PST and similar to TSG.

7/27/2019 HP Presentation Final PDF (2008.12.22)
http://slidepdf.com/reader/full/hp-presentation-final-pdf-20081222 67/78

7/27/2019 HP Presentation Final PDF (2008.12.22)
http://slidepdf.com/reader/full/hp-presentation-final-pdf-20081222 68/78
Strategic Profile: Design Factors
• Sustainability: implement vertically
• Uniqueness: company portfolio
• Value added:− Vertical: reduce costs or increase revenues
−Horizontal: increase revenues
• Enhancement: both strategies could solid HP’s position
• Flexibility: large platform advantages
•
• Fit: Innovations & vertical supports maintain HP leadership
• Performance: Sophisticated restructuring plans help
• Consistency: Vision & value
• Stretch: Market leader in all business segments
• Sustainability:
Implement v ertically, su ch as ac quiring co mpanies with new busi ness or newtechnologies. In addition, t o exploit and enhance functions of HP l aboratories, toshorten the period of transferring academic findings to business projects.
• Uniqueness:
The company portfolio has overall competitive advantages over others.
•
Value added:
Horizontal acquisitions could bring revenues growth. Vertical acquisition couldreduce costs or i ncrease revenues because of applying new t echnologies/ edgedacademic findings.
• Enhancement:
Horizontal acq uisition could not go further without adv anced and i nnovativesupports from functional departments, and vertical acq uisition or v ertical technicalsupports could become the supplemental strategy for HP. Vice versa. Bothhorizontal and vertical strategies will solid HP’s market position as a cost leadership.
•
Flexibility:
A large platform allows techies to invent new products, enables internal manpower transfer and internal lessons learn.
• Stability:
The cost leadership will keep HP maintaining in a stable market position.

7/27/2019 HP Presentation Final PDF (2008.12.22)
http://slidepdf.com/reader/full/hp-presentation-final-pdf-20081222 69/78
• Fit:
Innovations and advanced t echnical su pports i s necessary for H P to maintain i tscost leadership position in the market.
• Performance:
After merger or acquisitions, sophisticated restructuring plans should beimplemented to improve productivities and employees’ performance.
• Consistency:
A long term vision and value se tting enables CEO to map out strategies consistentwith market trends, company structures and existing company advantages.
• Stretch:
Become a market leader in all business segments by enhancing vertical functionsand expanding new business markets.

7/27/2019 HP Presentation Final PDF (2008.12.22)
http://slidepdf.com/reader/full/hp-presentation-final-pdf-20081222 70/78
Recommendations
•Vertical acquisition: maintain leadership
•Horizontal acquisition: enhance industry strength
•Cost efficiency
•Advocate “Green IT”
• Intensify corporate financial capability
• Inter-company synergy
In conclusion and after the model analysis, we think that HP to keep its competitive edge
in all its business segments, we recommend that it should:
• Invest deeper into every segment, to gain more vertical depth, and to maintain its
cost leadership
• Continue with its existing strategy with the Horizontal integration to expand more
into their business and gain more strength in the industry and market
(HP beside its horizontal integration (across the business enterprise in all of its locations,
needs integration across the value chain and all of its partners to be flexible and efficient)
• Maintain and i ntensify i ts corporate financial ca pability which w ill enable H P t o
have bigger power and market position
• Strengthen and achieve hi gher synergy bet ween i ts business segments which
will intensify it competitive advantage and their financial health
• which will enable HP to have bigger power and market position

7/27/2019 HP Presentation Final PDF (2008.12.22)
http://slidepdf.com/reader/full/hp-presentation-final-pdf-20081222 71/78
Thank you!
Annexes

7/27/2019 HP Presentation Final PDF (2008.12.22)
http://slidepdf.com/reader/full/hp-presentation-final-pdf-20081222 72/78
Annex 1
SPACE
SPACE – TSG StrategyFinancial Strength
5
6 ConcentricDiversification
Status Quo
Con lomerate
CompetitiveAdvantage
IndustryStrength
-1
0
1
2
3
4
-5 -4 -3 -2 -1 0 1 2 3 4 5-6 6
VerticalIntegration
Diversification
Diversification
Environmental Stability
-5
-4
-3
-2
-6
Divestment
Liquidation
Retrenchment
ConcentricMerger
ConglomerateMerger
Turnaround
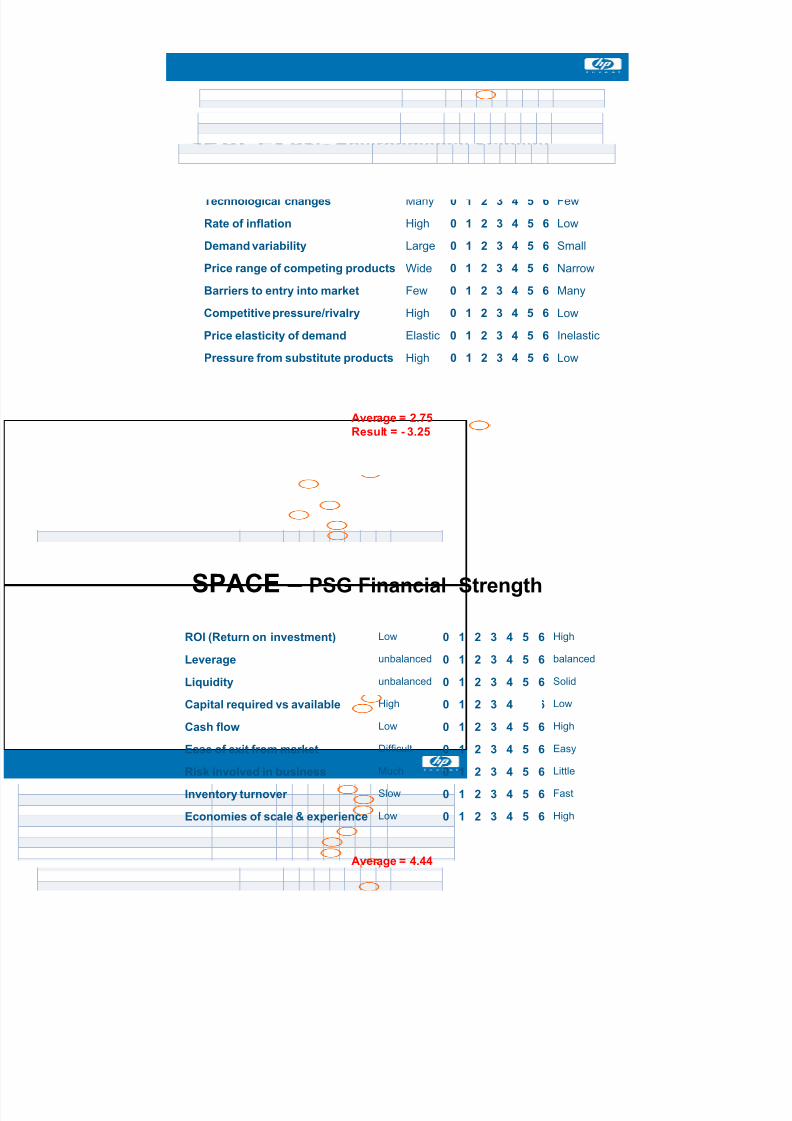
7/27/2019 HP Presentation Final PDF (2008.12.22)
http://slidepdf.com/reader/full/hp-presentation-final-pdf-20081222 73/78
SPACE- PSG Environmental Stability
Technological changes Many 0 1 2 3 4 5 6 Few
Rate of inflation High 0 1 2 3 4 5 6 Low
Demand variability Large 0 1 2 3 4 5 6 Small
Price range of competing products Wide 0 1 2 3 4 5 6 Narrow
Barriers to entry into market Few 0 1 2 3 4 5 6 Many
Competitive pressure/rivalry High 0 1 2 3 4 5 6 Low
Price elasticity of demand Elastic 0 1 2 3 4 5 6 Inelastic
Pressure from substitute products High 0 1 2 3 4 5 6 Low
Average = 2.75Result = - 3.25
SPACE – PSG Financial Strength
ROI (Return on investment) Low 0 1 2 3 4 5 6 High
Leverage unbalanced 0 1 2 3 4 5 6 balanced
Liquidity unbalanced 0 1 2 3 4 5 6 Solid
Capital required vs available High 0 1 2 3 4 5 6 Low
Cash flow Low 0 1 2 3 4 5 6 High
Ease of exit from market Difficult 0 1 2 3 4 5 6 Easy
Risk involved in business Much 0 1 2 3 4 5 6 Little
Inventory turnover Slow 0 1 2 3 4 5 6 Fast
Economies of scale & experience Low 0 1 2 3 4 5 6 High
Average = 4.44

7/27/2019 HP Presentation Final PDF (2008.12.22)
http://slidepdf.com/reader/full/hp-presentation-final-pdf-20081222 74/78
SPACE – PSG Industry Strength
Growth potential Low 0 1 2 3 4 5 6 High
Profit potential Low 0 1 2 3 4 5 6 High
Financial stability Low 0 1 2 3 4 5 6 High
Technological Know-how Simple 0 1 2 3 4 5 6 Complex
Resource utilization Insufficient 0 1 2 3 4 5 6 Efficient
Capital intensity Low 0 1 2 3 4 5 6 High
Ease of entry into market Easy 0 1 2 3 4 5 6 Difficult
Productivity, capacity utilization Low 0 1 2 3 4 5 6 High
Other: manufacturers’ bargaining power Low 0 1 2 3 4 5 6 High
Average = 3.89
SPACE– PSG Competitive Advantage
Market Share Small 0 1 2 3 4 5 6 Large
Product quality Inferior 0 1 2 3 4 5 6 Superior
Product life cycle Late 0 1 2 3 4 5 6 Early
Product replacement cycle Variable 0 1 2 3 4 5 6 Fixed
Customer loyalty Low 0 1 2 3 4 5 6 High
Competition capacity utilization Low 0 1 2 3 4 5 6 High
Technological know-how Low 0 1 2 3 4 5 6 High
ertical integration Low 0 1 2 3 4 5 6 High
Other: speed of new product introductions Slow 0 1 2 3 4 5 6 Fast
Average = 3.89Result = -2.11

7/27/2019 HP Presentation Final PDF (2008.12.22)
http://slidepdf.com/reader/full/hp-presentation-final-pdf-20081222 75/78
SPACE – PSG Strategy
Financial Strength
5
6
Concentration
Concentric
DiversificationStatus Quo
Conglomerate
CompetitiveAdvantage
IndustryStrength
-1
0
1
2
3
4
-5 -4 -3 -2 -1 0 1 2 3 4 5-6 6
VerticalIntegration
Diversification
Diversification
Environmental Stability
-5
-4
-3
-2
-6
Divestment
Liquidation
Retrenchment
oncen r cMerger
ConglomerateMerger
Turnaround
SPACE- IPG Environmental Stability
Technological changes Many 0 1 2 3 4 5 6 Few
Rate of inflation High 0 1 2 3 4 5 6 Low
Demand variability Large 0 1 2 3 4 5 6 Small
Price range of competing products Wide 0 1 2 3 4 5 6 Narrow
Barriers to entry into market Few 0 1 2 3 4 5 6 Many
Competitive pressure/rivalry High 0 1 2 3 4 5 6 Low
Price elasticity of demand Elastic 0 1 2 3 4 5 6 Inelastic
Pressure from substitute products High 0 1 2 3 4 5 6 Low
Average = 3.625Result = - 2.375

7/27/2019 HP Presentation Final PDF (2008.12.22)
http://slidepdf.com/reader/full/hp-presentation-final-pdf-20081222 76/78
SPACE – IPG Financial Strength
ROI (Return on investment) Low 0 1 2 3 4 5 6 High
Leverage unbalanced 0 1 2 3 4 5 6 balanced
Liquidity unbalanced 0 1 2 3 4 5 6 Solid
Capital required vs available High 0 1 2 3 4 5 6 Low
Cash flow Low 0 1 2 3 4 5 6 High
Ease of exit from market Difficult 0 1 2 3 4 5 6 Easy
Risk involved in business Much 0 1 2 3 4 5 6 Little
Inventory turnover Slow 0 1 2 3 4 5 6 Fast
Economies of scale & experience Low 0 1 2 3 4 5 6 High
Average = 4.05
SPACE – IPG Industry Strength
Growth potential Low 0 1 2 3 4 5 6 High
Profit potential Low 0 1 2 3 4 5 6 High
Financial stability Low 0 1 2 3 4 5 6 High
Technological Know-how Simple 0 1 2 3 4 5 6 Complex
Resource utilization Insufficient 0 1 2 3 4 5 6 Efficient
Capital intensity Low 0 1 2 3 4 5 6 High
Ease of entry into market Easy 0 1 2 3 4 5 6 Difficult
Productivity, capacity utilization Low 0 1 2 3 4 5 6 High
Other: manufacturers’ bargaining power Low 0 1 2 3 4 5 6 High
Average = 4.33

7/27/2019 HP Presentation Final PDF (2008.12.22)
http://slidepdf.com/reader/full/hp-presentation-final-pdf-20081222 77/78
SPACE– IPG Competitive Advantage
Market Share Small 0 1 2 3 4 5 6 Large
Product quality Inferior 0 1 2 3 4 5 6 Superior
Product life cycle Late 0 1 2 3 4 5 6 Early
Product replacement cycle Variable 0 1 2 3 4 5 6 Fixed
Customer loyalty Low 0 1 2 3 4 5 6 High
Competition capacity utilization Low 0 1 2 3 4 5 6 High
Technological know-how Low 0 1 2 3 4 5 6 High
ertical integration Low 0 1 2 3 4 5 6 High
Other: speed of new product introductions Slow 0 1 2 3 4 5 6 Fast
Average = 4.22Result = -1.78
SPACE – IPG StrategyFinancial Strength
5
6 ConcentricDiversification
Status Quo
Con lomerate
CompetitiveAdvantage
IndustryStrength
-1
0
1
2
3
4
-5 -4 -3 -2 -1 0 1 2 3 4 5-6 6
VerticalIntegration
oncen ra onDiversification
Diversification
Environmental Stability
-5
-4
-3
-2
-6
Divestment
Liquidation
Retrenchment
ConcentricMerger
ConglomerateMerger
Turnaround

7/27/2019 HP Presentation Final PDF (2008.12.22)
http://slidepdf.com/reader/full/hp-presentation-final-pdf-20081222 78/78
SPACE Overview
BusinessVector
Status RecommendationX-Axile Y-Axile
TSG + 3.55 + 1.64 Cost Leadership (strong)Vertical
acquisition
IPG + 2.55 + 1.68 Cost Leadership (Medium)Vertical
acquisition
PSG + 1.78 + 1.19 Cost Leadership (Weak)Vertical
acquisition
Annex 2 – HP Acquisitions (2001-2008)
2008 2007 2006 2005 2004 2003 2002 2001
Enterprise Storageand Servers
Polyserve Outerbbay ApplQ Rlx Technology
Persist CompaqStorageApps
HP Services EDS
Eyp Mission AOME knightsbridge Mac Dermid
TTP Triaton DSG Synstar
Intria Extreme Logic
Software Tower
Spi Dynamics Opsware Bristol Bitfone
Mercury Interactive Trustgenix
Peregrine Novadigm Consera Trulogica
Talking Blocks Pipebeach Select Access
Bluestone