hr service center benchmark - amazon web services · volume refers to the number of contacts...
TRANSCRIPT

HR Service Center Benchmark
Company
XYZ

HR Service Center Benchmark
Your Project Manager: Jeff Rumburg
Co Founder and Managing Partner,
MetricNet, LLC
Winner of the 2014 Ron Muns
Lifetime Achievement Award
Former CEO, The Verity Group
Former Vice President, Gartner
Founder of the Service Desk
Benchmarking Consortium
Author of A Hands-On Guide to
Competitive Benchmarking
Harvard MBA, Stanford MS
1© 2016 MetricNet, LLC, www.metricnet.com
HR Service Center Benchmark
2
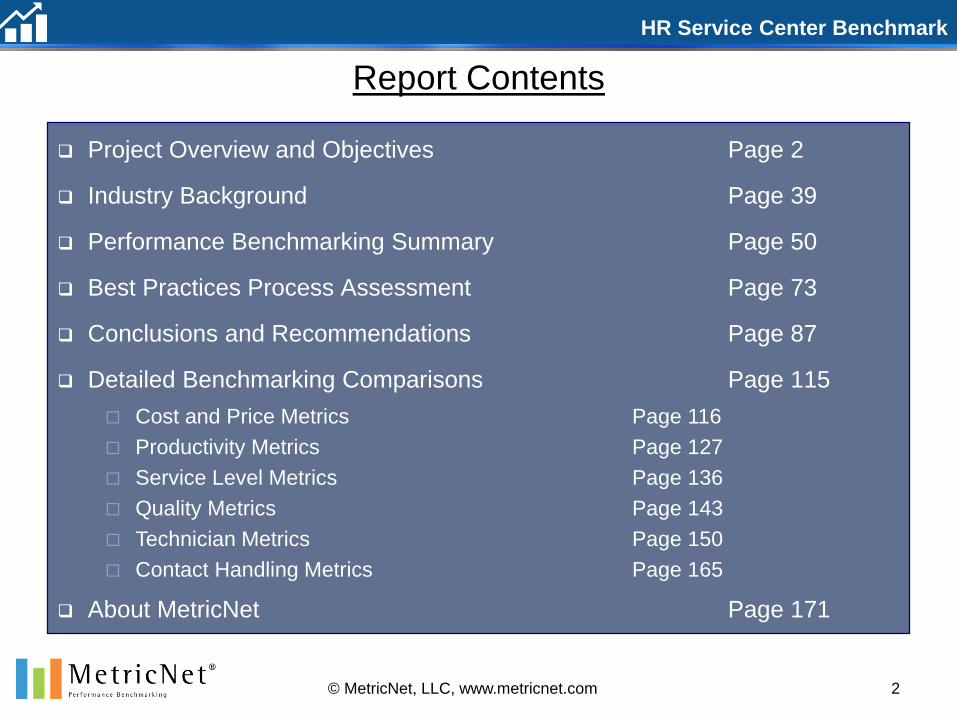
Report Contents
Project Overview and Objectives Page 2
Industry Background Page 39
Performance Benchmarking Summary Page 50
Best Practices Process Assessment Page 73
Conclusions and Recommendations Page 87
Detailed Benchmarking Comparisons Page 115
Cost and Price Metrics Page 116
Productivity Metrics Page 127
Service Level Metrics Page 136
Quality Metrics Page 143
Technician Metrics Page 150
Contact Handling Metrics Page 165
About MetricNet Page 171
© MetricNet, LLC, www.metricnet.com
Project Overview and Objectives
3
Company
XYZ
HR Service Center Benchmark
Project Objectives
Review and assess the performance of the Company
XYZ Service Desk
Benchmark the performance of Company XYZ against a
peer group of comparable Service Desks
Complete a Best Practices Process Assessment of the
Company XYZ Service Desk
Recommend strategies for improved performance
Achieve world-class levels of support
Maximize customer satisfaction
4© MetricNet, LLC, www.metricnet.com
HR Service Center Benchmark
5© MetricNet, LLC, www.metricnet.com
Project Approach
Module 1: Company XYZ Baselining / Data Collection
Module 2: Benchmarking and Gap Analysis
Module 3: Balanced Scorecard
Module 4: Best Practices Process Assessment
Module 5: Strategies for Improved Performance
Module 6: Report Development and Presentation of
Results
HR Service Center Benchmark
6
Module 1: Company XYZ Baselining/Data Collection
Core Topics
Project Kickoff
Data Collection
© MetricNet, LLC, www.metricnet.com
HR Service Center Benchmark
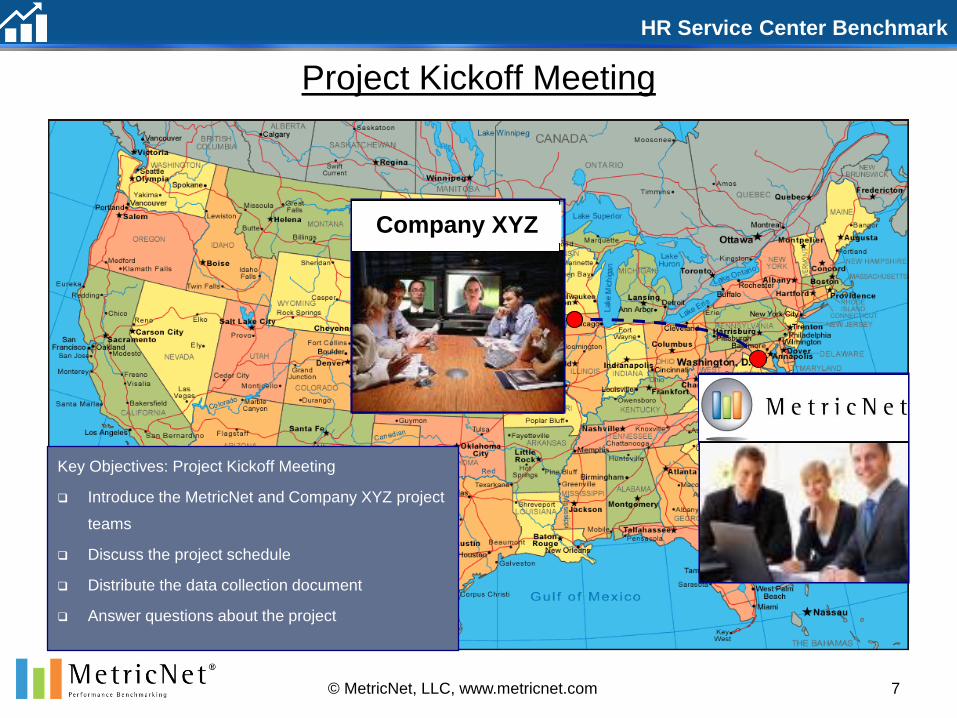
Project Kickoff Meeting
Company XYZ
7© MetricNet, LLC, www.metricnet.com
Key Objectives: Project Kickoff Meeting
Introduce the MetricNet and Company XYZ project
teams
Discuss the project schedule
Distribute the data collection document
Answer questions about the project
HR Service Center Benchmark
8
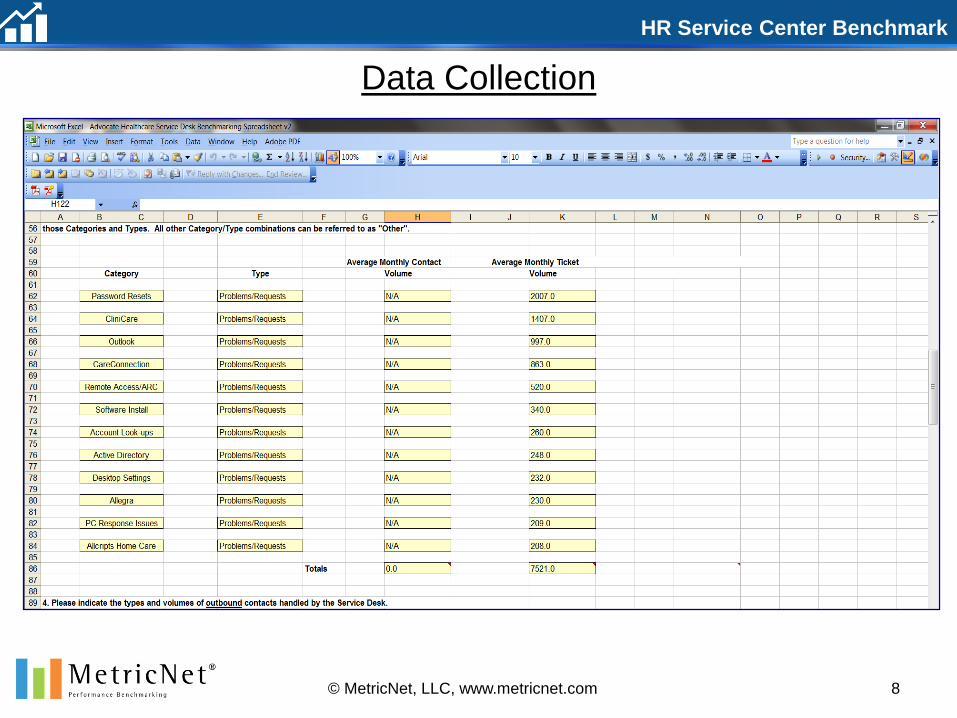
Data Collection
© MetricNet, LLC, www.metricnet.com
HR Service Center Benchmark
9© MetricNet, LLC, www.metricnet.com
Module 2: Benchmarking and Gap Analysis
Core Topics
Peer Group Selection
Benchmarking
Comparison
Gap Analysis
HR Service Center Benchmark
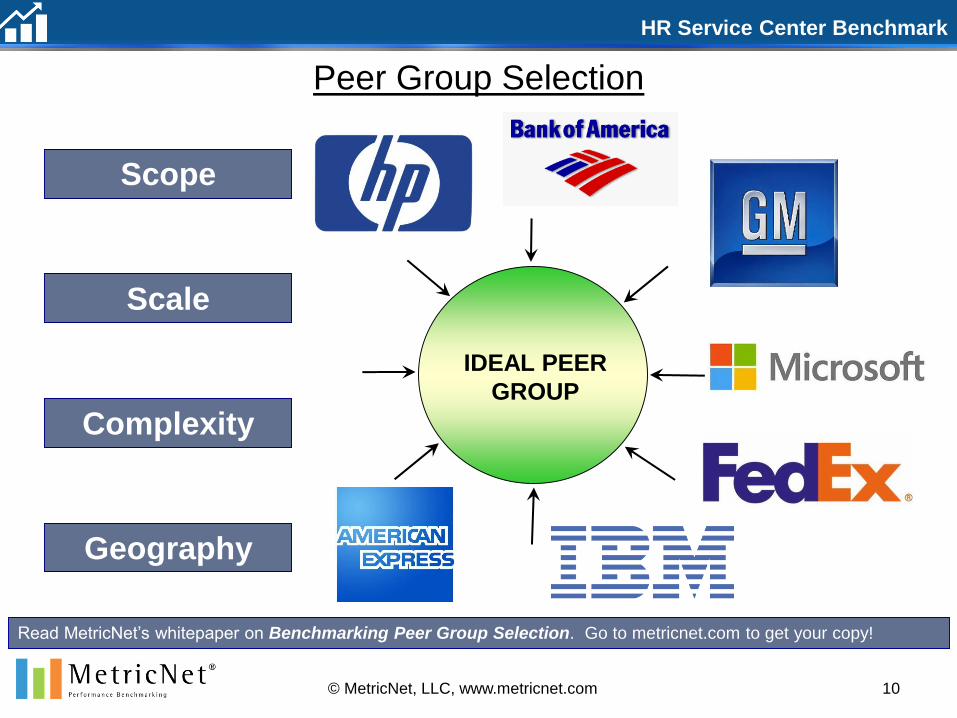
Peer Group Selection
Read MetricNet’s whitepaper on Benchmarking Peer Group Selection. Go to metricnet.com to get your copy!
Scope
Complexity
Scale
Geography
IDEAL PEER
GROUP
10© MetricNet, LLC, www.metricnet.com
HR Service Center Benchmark
© MetricNet, LLC, www.metricnet.com
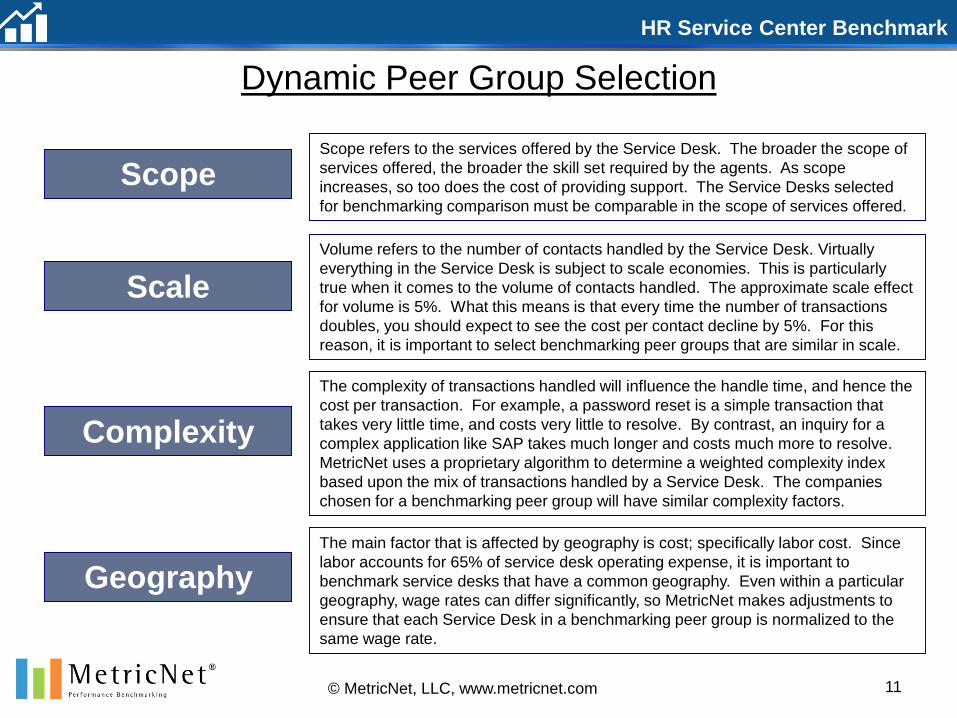
Dynamic Peer Group Selection
Scope
Complexity
Scale
Geography
Scope refers to the services offered by the Service Desk. The broader the scope of
services offered, the broader the skill set required by the agents. As scope
increases, so too does the cost of providing support. The Service Desks selected
for benchmarking comparison must be comparable in the scope of services offered.
Volume refers to the number of contacts handled by the Service Desk. Virtually
everything in the Service Desk is subject to scale economies. This is particularly
true when it comes to the volume of contacts handled. The approximate scale effect
for volume is 5%. What this means is that every time the number of transactions
doubles, you should expect to see the cost per contact decline by 5%. For this
reason, it is important to select benchmarking peer groups that are similar in scale.
The complexity of transactions handled will influence the handle time, and hence the
cost per transaction. For example, a password reset is a simple transaction that
takes very little time, and costs very little to resolve. By contrast, an inquiry for a
complex application like SAP takes much longer and costs much more to resolve.
MetricNet uses a proprietary algorithm to determine a weighted complexity index
based upon the mix of transactions handled by a Service Desk. The companies
chosen for a benchmarking peer group will have similar complexity factors.
The main factor that is affected by geography is cost; specifically labor cost. Since
labor accounts for 65% of service desk operating expense, it is important to
benchmark service desks that have a common geography. Even within a particular
geography, wage rates can differ significantly, so MetricNet makes adjustments to
ensure that each Service Desk in a benchmarking peer group is normalized to the
same wage rate.
11
HR Service Center Benchmark
12
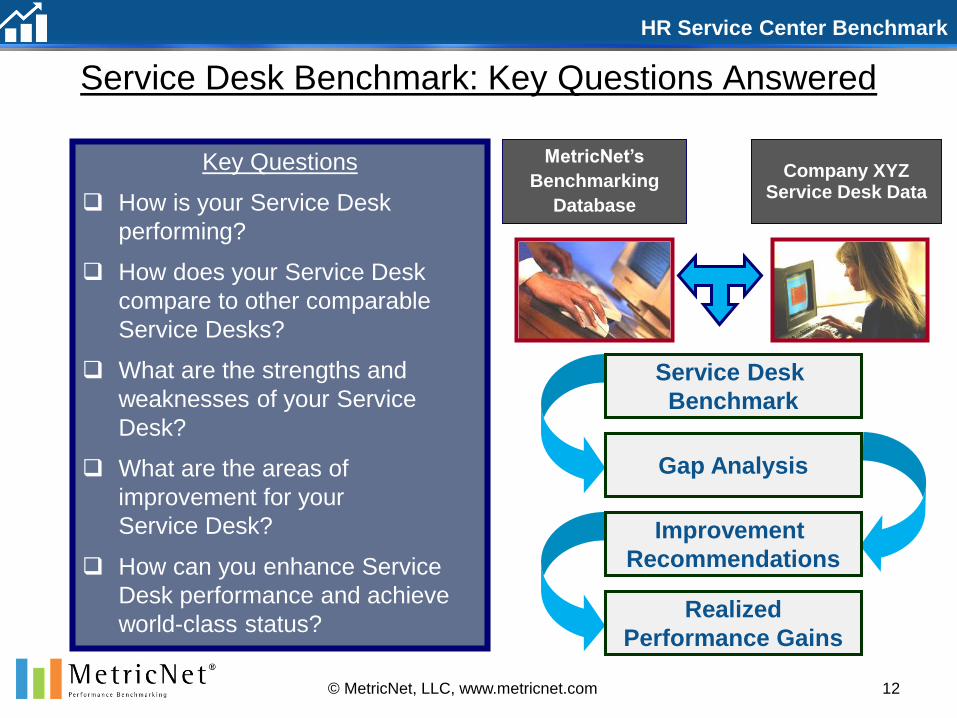
Key Questions
How is your Service Desk
performing?
How does your Service Desk
compare to other comparable
Service Desks?
What are the strengths and
weaknesses of your Service
Desk?
What are the areas of
improvement for your
Service Desk?
How can you enhance Service
Desk performance and achieve
world-class status?
Company XYZ Service Desk Data
MetricNet’s
Benchmarking
Database
Service Desk Benchmark: Key Questions Answered
© MetricNet, LLC, www.metricnet.com
Service Desk
Benchmark
Gap Analysis
Improvement
Recommendations
Realized
Performance Gains
HR Service Center Benchmark
13
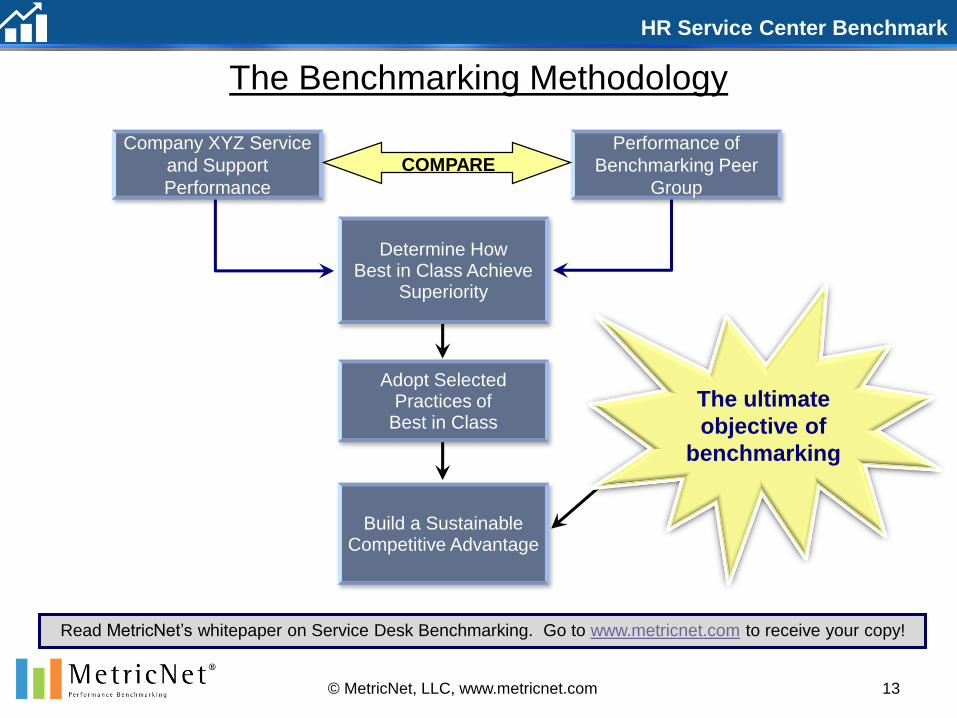
The Benchmarking Methodology
© MetricNet, LLC, www.metricnet.com
Company XYZ Service
and Support
Performance
Performance of
Benchmarking Peer
Group
Determine How Best in Class Achieve
Superiority
Adopt Selected Practices of
Best in Class
Build a Sustainable Competitive Advantage
COMPARE
Read MetricNet’s whitepaper on Service Desk Benchmarking. Go to www.metricnet.com to receive your copy!
The ultimate
objective of
benchmarking

HR Service Center Benchmark
Summary of Included Benchmarking Metrics
© MetricNet, LLC, www.metricnet.com 14
Cost per Inbound Contact
Cost per Minute of Inbound
Handle Time
Price per Inbound Contact
Price per Minute of Handle Time
First Level Resolution Rate
Cost Productivity
Service Level
Quality
Call HandlingTechnician
Average Speed of Answer
(ASA)
% of Calls Answered in 30
seconds
Call Abandonment Rate
Inbound Contacts per
Technician per Month
Technician Utilization
Technicians as a % of
Total Headcount
Customer Satisfaction
First Contact Resolution Rate
Call Quality
Annual Technician Turnover
Daily Technician Absenteeism
Schedule Adherence
New Technician Training Hours
Annual Technician Training Hours
Technician Tenure
Technician Job Satisfaction
Inbound Contact Handle
Time
User Self-Service
Completion Rate
HR Service Center Benchmark
15© MetricNet, LLC, www.metricnet.com
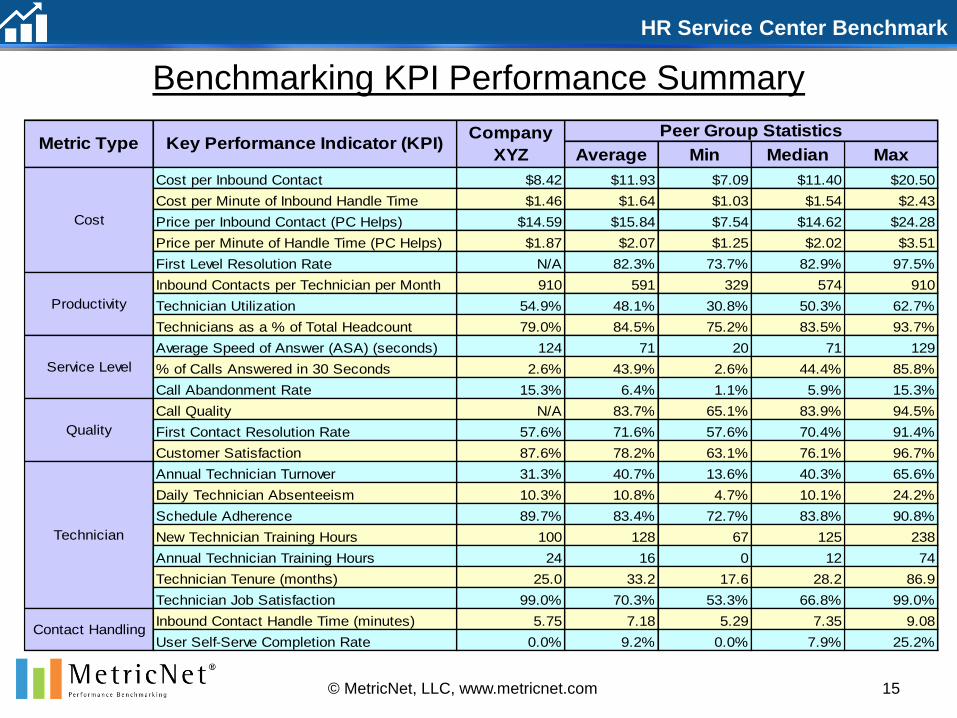
Benchmarking KPI Performance Summary
Average Min Median Max
Cost per Inbound Contact $8.42 $11.93 $7.09 $11.40 $20.50
Cost per Minute of Inbound Handle Time $1.46 $1.64 $1.03 $1.54 $2.43
Price per Inbound Contact (PC Helps) $14.59 $15.84 $7.54 $14.62 $24.28
Price per Minute of Handle Time (PC Helps) $1.87 $2.07 $1.25 $2.02 $3.51
First Level Resolution Rate N/A 82.3% 73.7% 82.9% 97.5%
Inbound Contacts per Technician per Month 910 591 329 574 910
Technician Utilization 54.9% 48.1% 30.8% 50.3% 62.7%
Technicians as a % of Total Headcount 79.0% 84.5% 75.2% 83.5% 93.7%
Average Speed of Answer (ASA) (seconds) 124 71 20 71 129
% of Calls Answered in 30 Seconds 2.6% 43.9% 2.6% 44.4% 85.8%
Call Abandonment Rate 15.3% 6.4% 1.1% 5.9% 15.3%
Call Quality N/A 83.7% 65.1% 83.9% 94.5%
First Contact Resolution Rate 57.6% 71.6% 57.6% 70.4% 91.4%
Customer Satisfaction 87.6% 78.2% 63.1% 76.1% 96.7%
Annual Technician Turnover 31.3% 40.7% 13.6% 40.3% 65.6%
Daily Technician Absenteeism 10.3% 10.8% 4.7% 10.1% 24.2%
Schedule Adherence 89.7% 83.4% 72.7% 83.8% 90.8%
New Technician Training Hours 100 128 67 125 238
Annual Technician Training Hours 24 16 0 12 74
Technician Tenure (months) 25.0 33.2 17.6 28.2 86.9
Technician Job Satisfaction 99.0% 70.3% 53.3% 66.8% 99.0%
Inbound Contact Handle Time (minutes) 5.75 7.18 5.29 7.35 9.08
User Self-Serve Completion Rate 0.0% 9.2% 0.0% 7.9% 25.2%
Service Level
Quality
Technician
Contact Handling
Peer Group Statistics
Productivity
Company
XYZKey Performance Indicator (KPI)Metric Type
Cost
HR Service Center Benchmark
16
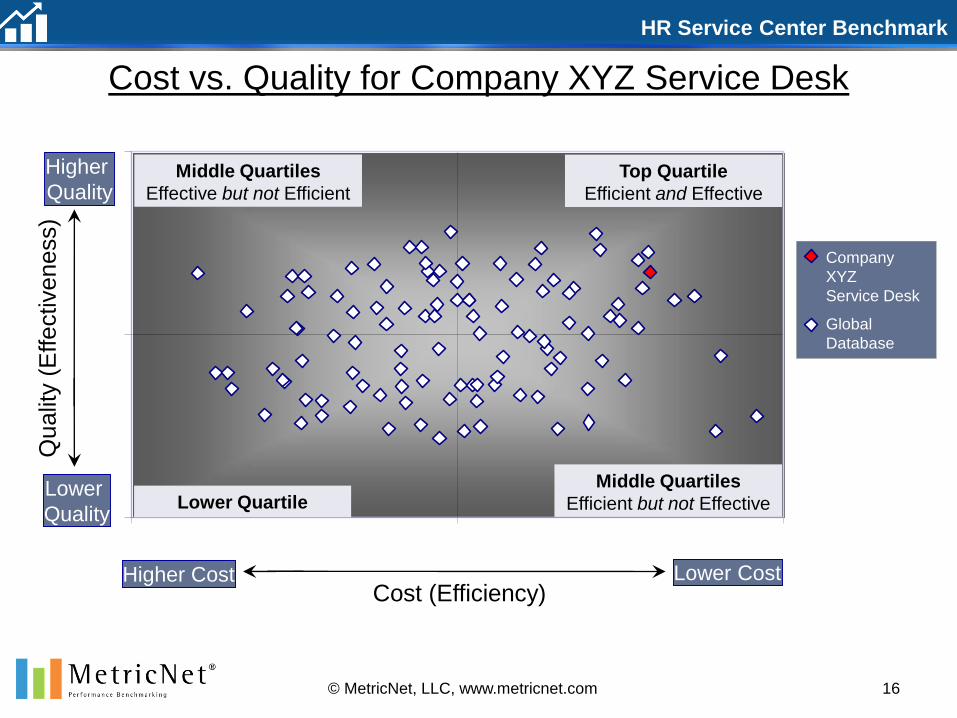
Cost vs. Quality for Company XYZ Service Desk
© MetricNet, LLC, www.metricnet.com
Company
XYZ
Service Desk
Global
Database
Lower CostCost (Efficiency)
Qualit
y (
Effectiveness)
Top Quartile
Efficient and Effective
Lower Quartile
Middle Quartiles
Effective but not Efficient
Middle Quartiles
Efficient but not Effective
Higher Cost
Lower
Quality
Higher
Quality
HR Service Center Benchmark
17
Module 3: Balanced Scorecard
© MetricNet, LLC, www.metricnet.com
Core Topics
Metrics Selection
Metric Weightings
Scorecard Construction
HR Service Center Benchmark
18© MetricNet, LLC, www.metricnet.com
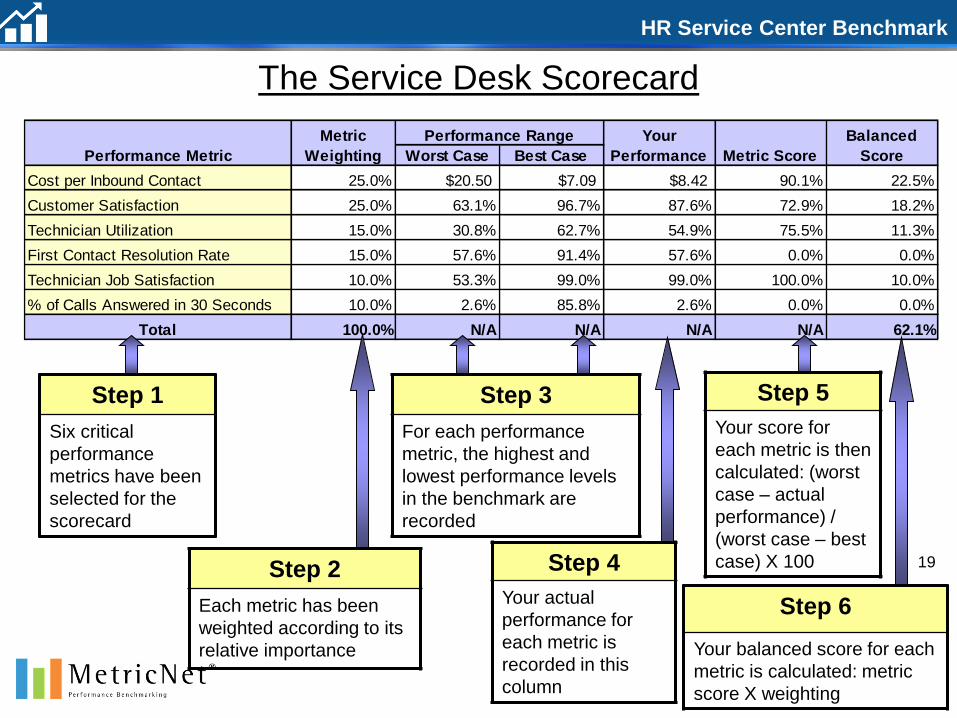
The Service Desk Scorecard: An Overview
The Service Desk scorecard employs a methodology that provides
you with a single, all-inclusive measure of your Service Desk
performance
It combines cost, service level, productivity, and quality metrics into
an overall performance indicator for your Service Desk
Your Service Desk score will range between 0 and 100%, and can
be compared directly to the scores of other Service Desks in the
benchmark
By computing your overall score on a monthly or quarterly basis,
you can track and trend your performance over time
Charting and tracking your Service Desk score is an ideal way to
ensure continuous improvement in your Service Desk!
HR Service Center Benchmark
Worst Case Best Case
Cost per Inbound Contact 25.0% $20.50 $7.09 $8.42 90.1% 22.5%
Customer Satisfaction 25.0% 63.1% 96.7% 87.6% 72.9% 18.2%
Technician Utilization 15.0% 30.8% 62.7% 54.9% 75.5% 11.3%
First Contact Resolution Rate 15.0% 57.6% 91.4% 57.6% 0.0% 0.0%
Technician Job Satisfaction 10.0% 53.3% 99.0% 99.0% 100.0% 10.0%
% of Calls Answered in 30 Seconds 10.0% 2.6% 85.8% 2.6% 0.0% 0.0%
Total 100.0% N/A N/A N/A N/A 62.1%
Performance Metric
Metric
Weighting
Performance Range Your
Performance Metric Score
Balanced
Score
Step 2
Each metric has been
weighted according to its
relative importance
The Service Desk Scorecard
Step 1
Six critical
performance
metrics have been
selected for the
scorecard
Step 3
For each performance
metric, the highest and
lowest performance levels
in the benchmark are
recorded
Step 4
Your actual
performance for
each metric is
recorded in this
column
Step 5
Your score for
each metric is then
calculated: (worst
case – actual
performance) /
(worst case – best
case) X 100
Step 6
Your balanced score for each
metric is calculated: metric
score X weighting
19
HR Service Center Benchmark
25.0%
30.0%
35.0%
40.0%
45.0%
50.0%
55.0%
60.0%
65.0%
6 9 21 13 XYZ 22 3 5 18 14 11 1 7 8 19 20 10 12 2 17 16 15 4
Bala
nced
Sco
res
Service Desk
20© MetricNet, LLC, www.metricnet.com
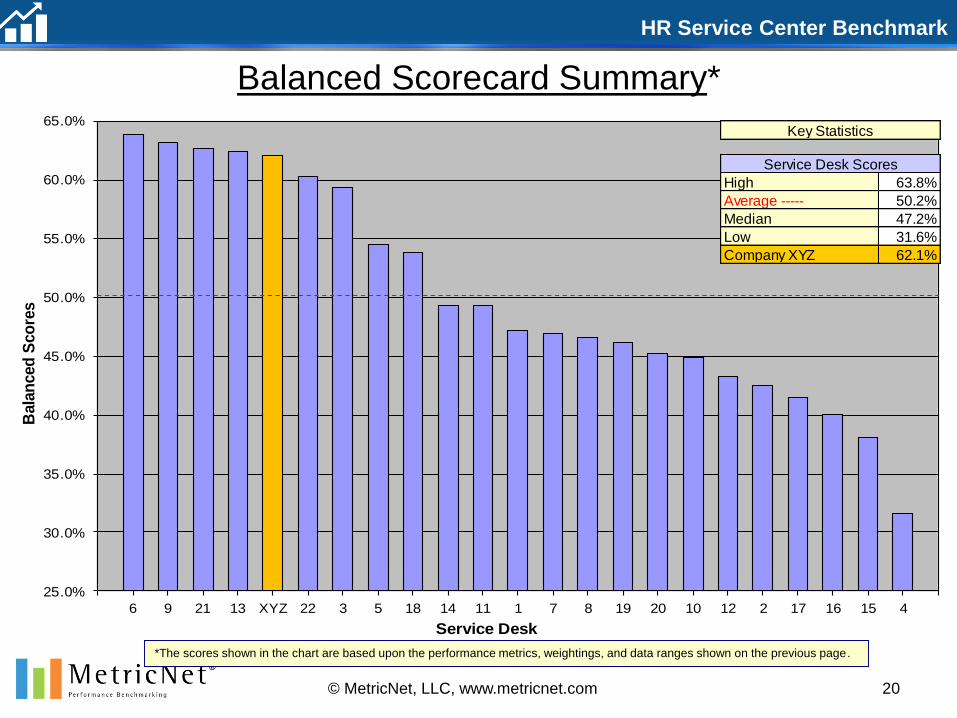
Balanced Scorecard Summary*
*The scores shown in the chart are based upon the performance metrics, weightings, and data ranges shown on the previous page.
High 63.8%
Average ----- 50.2%
Median 47.2%
Low 31.6%
Company XYZ 62.1%
Key Statistics
Service Desk Scores

HR Service Center Benchmark
21© MetricNet, LLC, www.metricnet.com
Scorecard Performance Rankings
Overall
Ranking
Service Desk
Number
Cost per
Inbound
Contact
Customer
Satisfaction
Technician
Utilization
First Contact
Resolution
Rate
Technician Job
Satisfaction
% of Calls
Answered in 30
Seconds
Total Balanced
Score
1 6 $17.55 90.2% 50.8% 91.4% 88.3% 53.1% 63.8%
2 9 $8.18 84.7% 52.4% 68.5% 74.7% 40.3% 63.2%
3 21 $17.93 96.7% 35.2% 90.0% 89.8% 73.0% 62.7%
4 13 $12.00 85.2% 48.5% 78.8% 78.5% 60.2% 62.5%
5 Company XYZ $8.42 87.6% 54.9% 57.6% 99.0% 2.6% 62.1%
6 22 $8.32 79.4% 55.5% 73.1% 71.8% 27.4% 60.4%
7 3 $8.44 81.8% 56.9% 71.1% 66.8% 17.1% 59.4%
8 5 $8.34 74.2% 47.9% 70.4% 65.6% 62.1% 54.5%
9 18 $9.24 74.6% 53.3% 71.1% 65.3% 44.4% 53.8%
10 14 $13.09 75.2% 52.6% 72.3% 72.3% 49.1% 49.3%
11 11 $7.09 72.2% 57.8% 64.8% 53.3% 16.4% 49.3%
12 1 $10.26 76.0% 47.8% 67.5% 66.2% 29.8% 47.2%
13 7 $10.53 66.2% 52.9% 72.9% 66.0% 53.0% 46.9%
14 8 $13.69 81.4% 36.3% 75.1% 66.8% 60.4% 46.6%
15 19 $13.99 86.7% 45.3% 68.7% 55.3% 37.8% 46.1%
16 20 $8.25 63.1% 47.5% 69.1% 61.7% 65.8% 45.2%
17 10 $12.59 76.1% 50.3% 68.1% 72.2% 23.7% 44.9%
18 12 $10.22 67.3% 62.7% 63.5% 57.0% 23.6% 43.2%
19 2 $12.45 78.2% 39.8% 69.1% 63.2% 42.4% 42.5%
20 17 $15.65 82.0% 42.3% 66.7% 68.0% 50.0% 41.5%
21 16 $11.40 68.9% 50.8% 67.8% 57.6% 35.4% 40.1%
22 15 $16.27 75.2% 33.7% 74.9% 79.2% 56.6% 38.1%
23 4 $20.50 75.5% 30.8% 73.2% 78.3% 85.8% 31.6%
Average $11.93 78.2% 48.1% 71.6% 70.3% 43.9% 50.2%
Max $20.50 96.7% 62.7% 91.4% 99.0% 85.8% 63.8%
Min $7.09 63.1% 30.8% 57.6% 53.3% 2.6% 31.6%
Median $11.40 76.1% 50.3% 70.4% 66.8% 44.4% 47.2%
Scorecard Metrics
Key Statistics

HR Service Center Benchmark
22© MetricNet, LLC, www.metricnet.com
KPI Data in Rank Order
Cost per
Inbound
Contact
Customer
Satisfaction
Technician
Utilization
First Contact
Resolution
Rate
Technician Job
Satisfaction
% of Calls
Answered in 30
Seconds
Total Balanced
Score
Company XYZ $8.42 87.6% 54.9% 57.6% 99.0% 2.6% 62.1%
Ranking 6 3 5 23 1 23 5
Quartile 1 1 1 4 1 4 1
1 $7.09 96.7% 62.7% 91.4% 99.0% 85.8% 63.8%
2 $8.18 90.2% 57.8% 90.0% 89.8% 73.0% 63.2%
3 $8.25 87.6% 56.9% 78.8% 88.3% 65.8% 62.7%
4 $8.32 86.7% 55.5% 75.1% 79.2% 62.1% 62.5%
5 $8.34 85.2% 54.9% 74.9% 78.5% 60.4% 62.1%
6 $8.42 84.7% 53.3% 73.2% 78.3% 60.2% 60.4%
7 $8.44 82.0% 52.9% 73.1% 74.7% 56.6% 59.4%
8 $9.24 81.8% 52.6% 72.9% 72.3% 53.1% 54.5%
9 $10.22 81.4% 52.4% 72.3% 72.2% 53.0% 53.8%
10 $10.26 79.4% 50.8% 71.1% 71.8% 50.0% 49.3%
11 $10.53 78.2% 50.8% 71.1% 68.0% 49.1% 49.3%
12 $11.40 76.1% 50.3% 70.4% 66.8% 44.4% 47.2%
13 $12.00 76.0% 48.5% 69.1% 66.8% 42.4% 46.9%
14 $12.45 75.5% 47.9% 69.1% 66.2% 40.3% 46.6%
15 $12.59 75.2% 47.8% 68.7% 66.0% 37.8% 46.1%
16 $13.09 75.2% 47.5% 68.5% 65.6% 35.4% 45.2%
17 $13.69 74.6% 45.3% 68.1% 65.3% 29.8% 44.9%
18 $13.99 74.2% 42.3% 67.8% 63.2% 27.4% 43.2%
19 $15.65 72.2% 39.8% 67.5% 61.7% 23.7% 42.5%
20 $16.27 68.9% 36.3% 66.7% 57.6% 23.6% 41.5%
21 $17.55 67.3% 35.2% 64.8% 57.0% 17.1% 40.1%
22 $17.93 66.2% 33.7% 63.5% 55.3% 16.4% 38.1%
23 $20.50 63.1% 30.8% 57.6% 53.3% 2.6% 31.6%
Average $11.93 78.2% 48.1% 71.6% 70.3% 43.9% 50.2%
Max $20.50 96.7% 62.7% 91.4% 99.0% 85.8% 63.8%
Min $7.09 63.1% 30.8% 57.6% 53.3% 2.6% 31.6%
Median $11.40 76.1% 50.3% 70.4% 66.8% 44.4% 47.2%
Scorecard Metrics
HR Service Center Benchmark
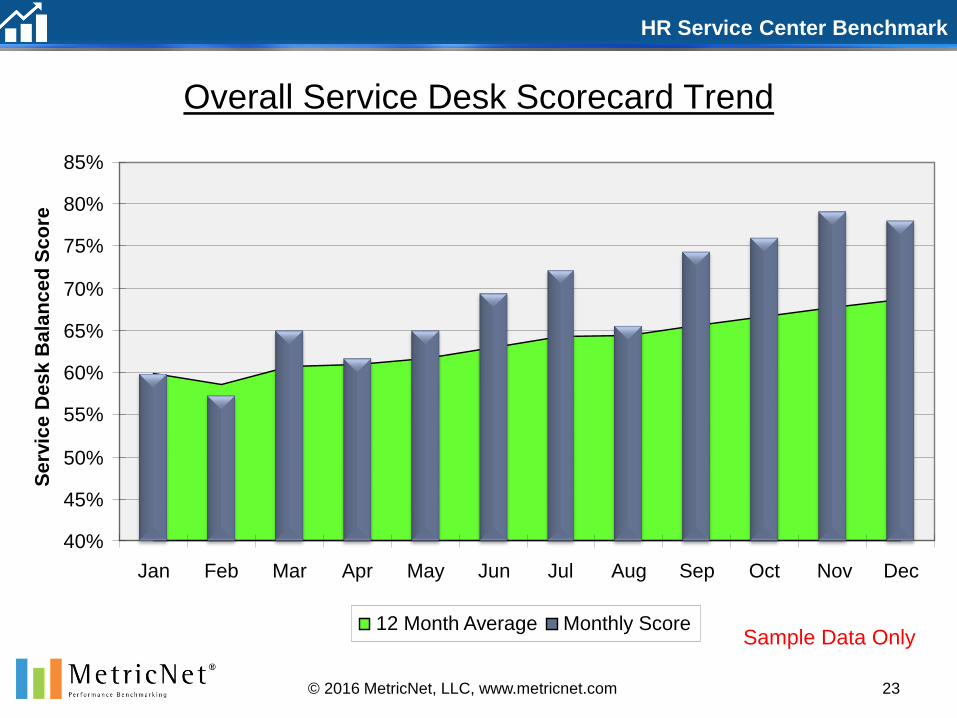
Overall Service Desk Scorecard Trend
40%
45%
50%
55%
60%
65%
70%
75%
80%
85%
Jan Feb Mar Apr May Jun Jul Aug Sep Oct Nov Dec
Se
rvic
e D
es
k B
ala
nc
ed
Sc
ore
12 Month Average Monthly Score
23© 2016 MetricNet, LLC, www.metricnet.com
Sample Data Only
HR Service Center Benchmark
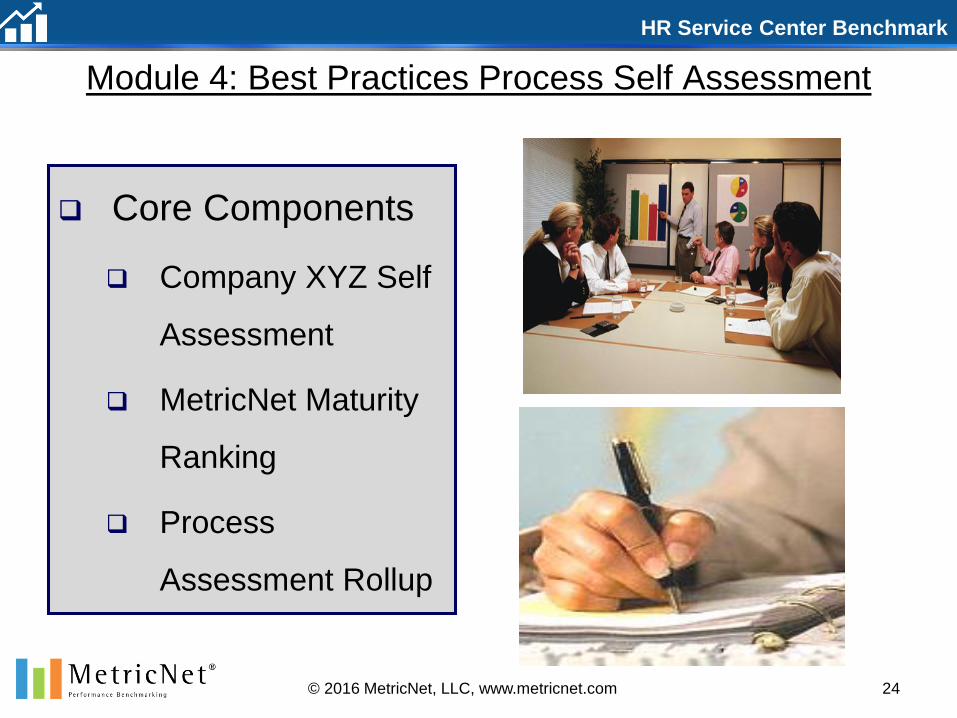
Module 4: Best Practices Process Self Assessment
Core Components
Company XYZ Self
Assessment
MetricNet Maturity
Ranking
Process
Assessment Rollup
© 2016 MetricNet, LLC, www.metricnet.com 24

HR Service Center Benchmark
Six-Part Model for Service Desk Best Practices
25© MetricNet, LLC, www.metricnet.com
Proactively Managing
Stakeholder Expectations
Stakeholder Communication
A Holistic Approach to
Performance
Measurement
Performance Measurement
Leveraging People and
ProcessesTechnology
Expeditious Delivery of
Customer ServiceProcess
Proactive, Life-cycle
Management of
Personnel
Human
Resources
Defining Your Charter
and MissionStrategy
DefinitionModel
Component
Customer
Enthusiasm
Strategy
Human Resources
ProcessTechnology
PerformanceMeasurement
Stakeholder Communication
HR Service Center Benchmark
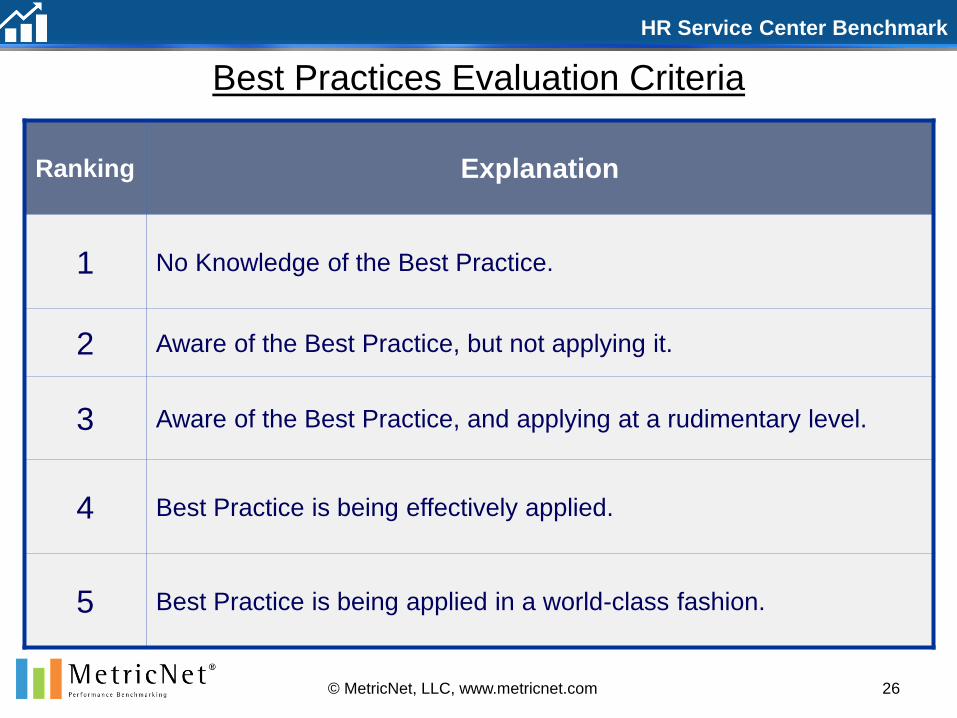
Best Practices Evaluation Criteria
26© MetricNet, LLC, www.metricnet.com
Ranking Explanation
1 No Knowledge of the Best Practice.
2 Aware of the Best Practice, but not applying it.
3 Aware of the Best Practice, and applying at a rudimentary level.
4 Best Practice is being effectively applied.
5 Best Practice is being applied in a world-class fashion.
HR Service Center Benchmark
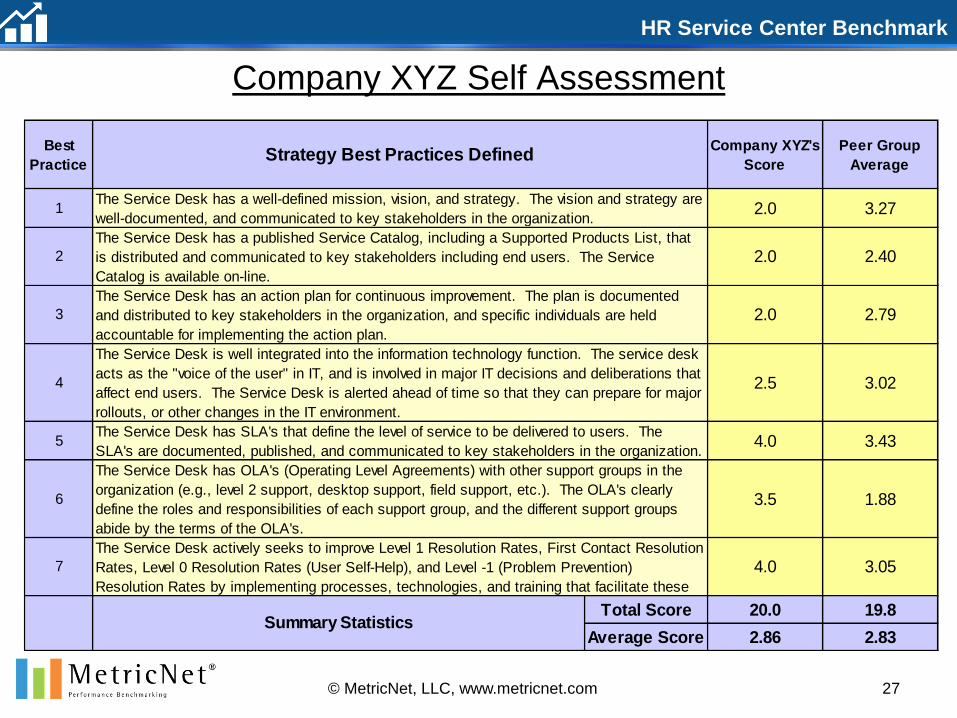
Company XYZ Self Assessment
27© MetricNet, LLC, www.metricnet.com
Best
Practice
Company XYZ's
Score
Peer Group
Average
Total Score 20.0 19.8
Average Score 2.86 2.83Summary Statistics
3.02
3.272.01
2.792.03
2.402.02
The Service Desk actively seeks to improve Level 1 Resolution Rates, First Contact Resolution
Rates, Level 0 Resolution Rates (User Self-Help), and Level -1 (Problem Prevention)
Resolution Rates by implementing processes, technologies, and training that facilitate these
2.5
5
Strategy Best Practices Defined
The Service Desk has an action plan for continuous improvement. The plan is documented
and distributed to key stakeholders in the organization, and specific individuals are held
accountable for implementing the action plan.
The Service Desk is well integrated into the information technology function. The service desk
acts as the "voice of the user" in IT, and is involved in major IT decisions and deliberations that
affect end users. The Service Desk is alerted ahead of time so that they can prepare for major
rollouts, or other changes in the IT environment.
The Service Desk has a published Service Catalog, including a Supported Products List, that
is distributed and communicated to key stakeholders including end users. The Service
Catalog is available on-line.
The Service Desk has a well-defined mission, vision, and strategy. The vision and strategy are
well-documented, and communicated to key stakeholders in the organization.
4
6
4.0
The Service Desk has SLA's that define the level of service to be delivered to users. The
SLA's are documented, published, and communicated to key stakeholders in the organization.4.0
3.5
The Service Desk has OLA's (Operating Level Agreements) with other support groups in the
organization (e.g., level 2 support, desktop support, field support, etc.). The OLA's clearly
define the roles and responsibilities of each support group, and the different support groups
abide by the terms of the OLA's.
7
3.43
1.88
3.05
HR Service Center Benchmark
28© MetricNet, LLC, www.metricnet.com
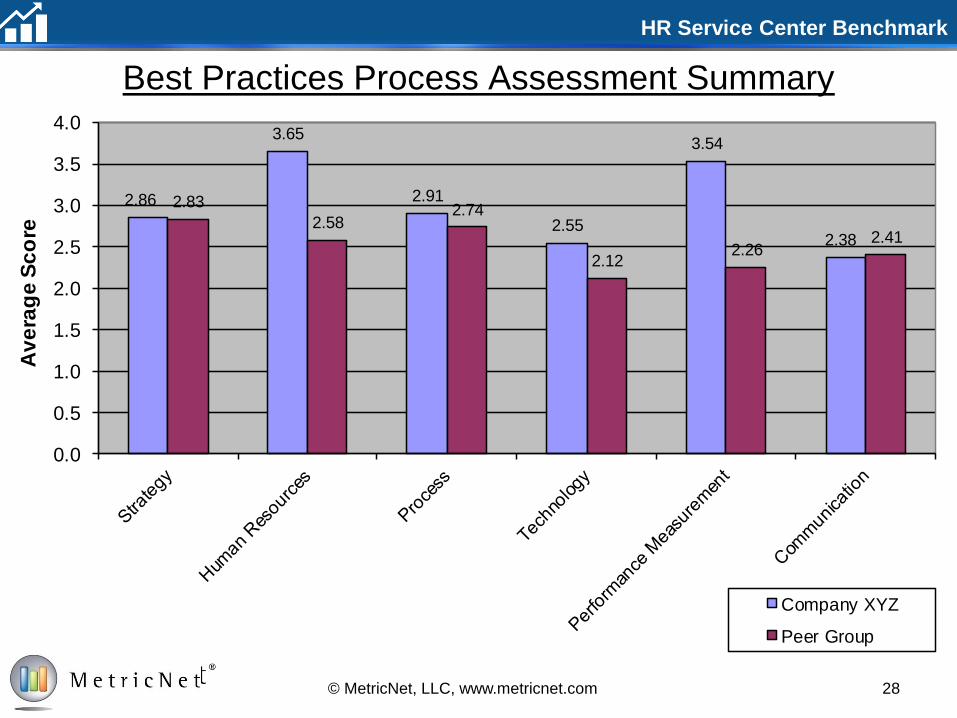
Best Practices Process Assessment Summary
2.86
3.65
2.91
2.55
3.54
2.38
2.83
2.582.74
2.122.26
2.41
0.0
0.5
1.0
1.5
2.0
2.5
3.0
3.5
4.0
Av
era
ge
Sc
ore
Company XYZ
Peer Group

HR Service Center Benchmark
Module 5: Strategies for Improved Performance
Core Components
Conclusions and
Recommendations
Roadmap for World-
Class Performance
29© MetricNet, LLC, www.metricnet.com
HR Service Center Benchmark
Conclusions and Recommendations
Conclusions and Recommendations fall into six
categories
1. Strategy
2. Human Resource Management
3. Call Handling Processes and Procedures
4. Technology
5. Performance Measurement and Management
6. Stakeholder Communication
30© MetricNet, LLC, www.metricnet.com
HR Service Center Benchmark
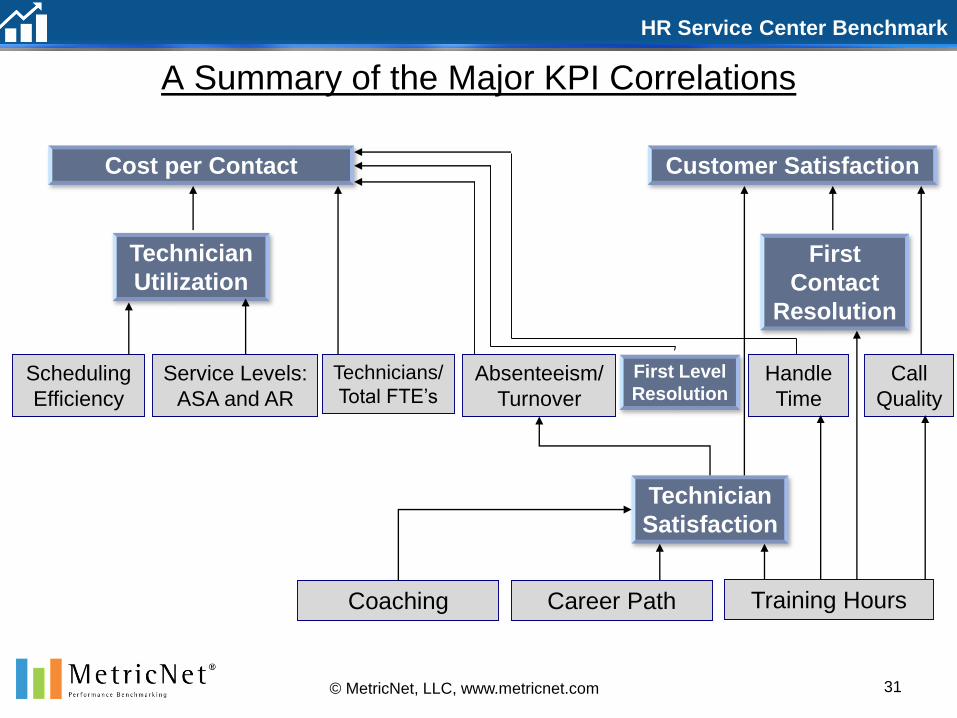
A Summary of the Major KPI Correlations
31© MetricNet, LLC, www.metricnet.com
Cost per Contact Customer Satisfaction
Technician
UtilizationFirst
Contact
Resolution
Technician
Satisfaction
Coaching Career Path Training Hours
Call
Quality
Handle
Time
Technicians/
Total FTE’sAbsenteeism/
Turnover
First Level
ResolutionScheduling
Efficiency
Service Levels:
ASA and AR
HR Service Center Benchmark
32
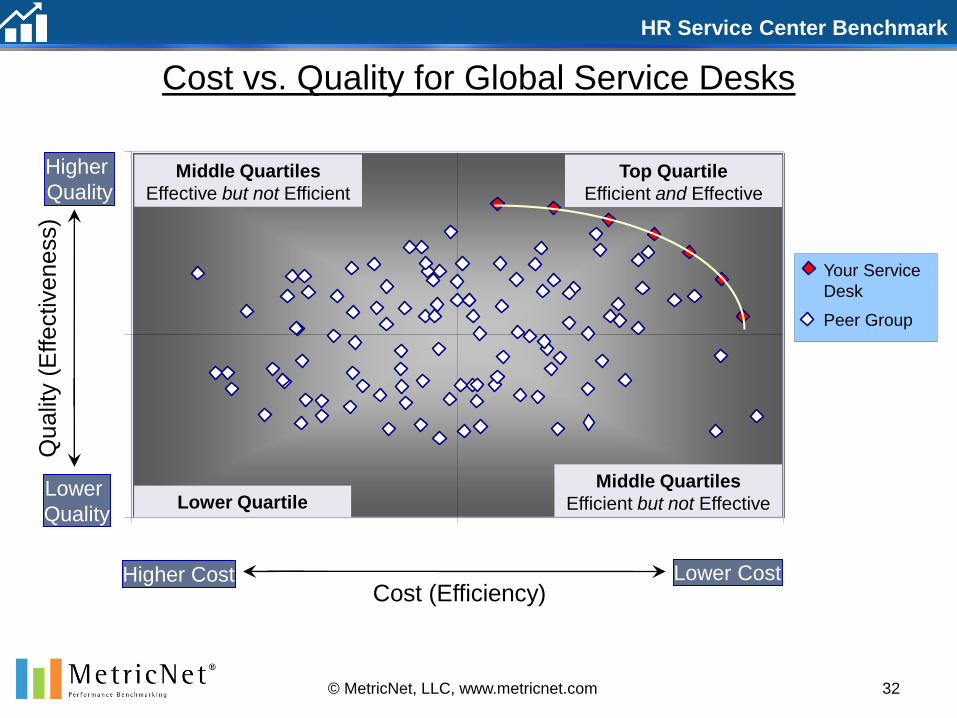
Cost vs. Quality for Global Service Desks
© MetricNet, LLC, www.metricnet.com
Lower CostCost (Efficiency)
Qualit
y (
Effectiveness)
Top Quartile
Efficient and Effective
Lower Quartile
Middle Quartiles
Effective but not Efficient
Middle Quartiles
Efficient but not Effective
Higher Cost
Lower
Quality
Higher
Quality
Your Service
Desk
Peer Group
HR Service Center Benchmark
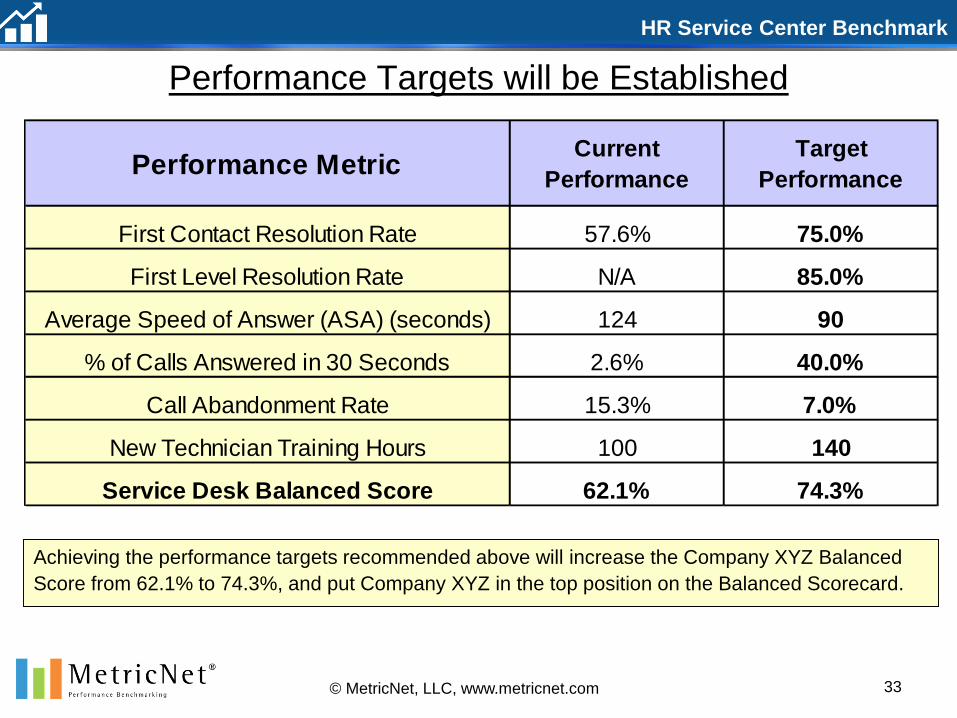
Performance Targets will be Established
Achieving the performance targets recommended above will increase the Company XYZ Balanced
Score from 62.1% to 74.3%, and put Company XYZ in the top position on the Balanced Scorecard.
33© MetricNet, LLC, www.metricnet.com
Performance MetricCurrent
Performance
Target
Performance
First Contact Resolution Rate 57.6% 75.0%
First Level Resolution Rate N/A 85.0%
Average Speed of Answer (ASA) (seconds) 124 90
% of Calls Answered in 30 Seconds 2.6% 40.0%
Call Abandonment Rate 15.3% 7.0%
New Technician Training Hours 100 140
Service Desk Balanced Score 62.1% 74.3%
HR Service Center Benchmark
34
Module 6: Report Development and Presentation of Results
Core Topics
Conclusions and
Recommendations
Report
Development
Presentation of
Benchmarking
Results
© 2016 MetricNet, LLC, www.metricnet.com
HR Service Center Benchmark
35
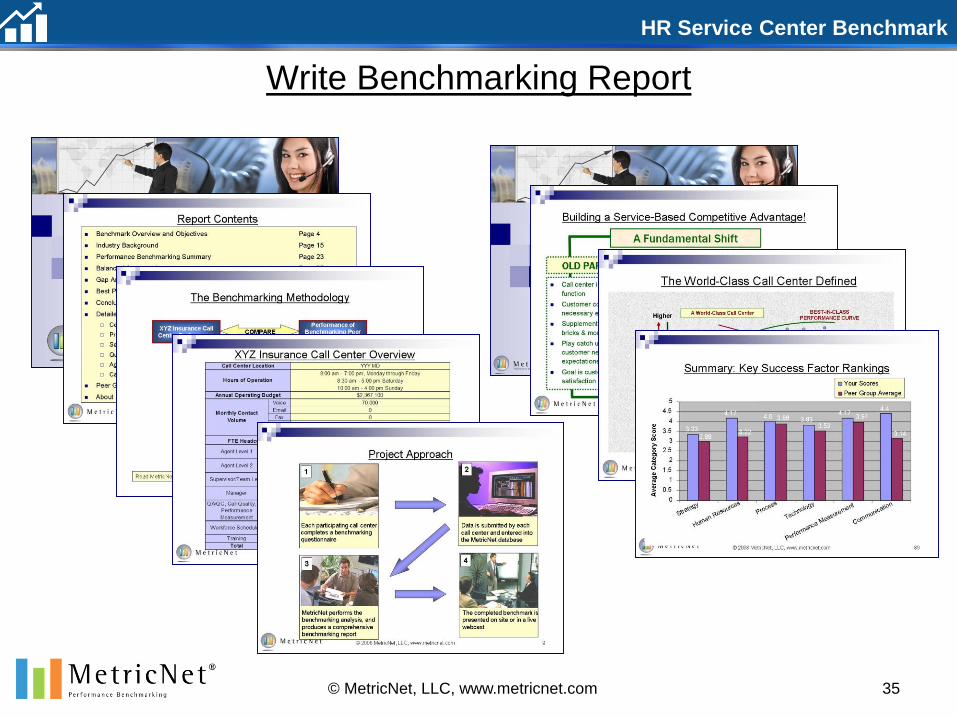
Write Benchmarking Report
© MetricNet, LLC, www.metricnet.com
HR Service Center Benchmark
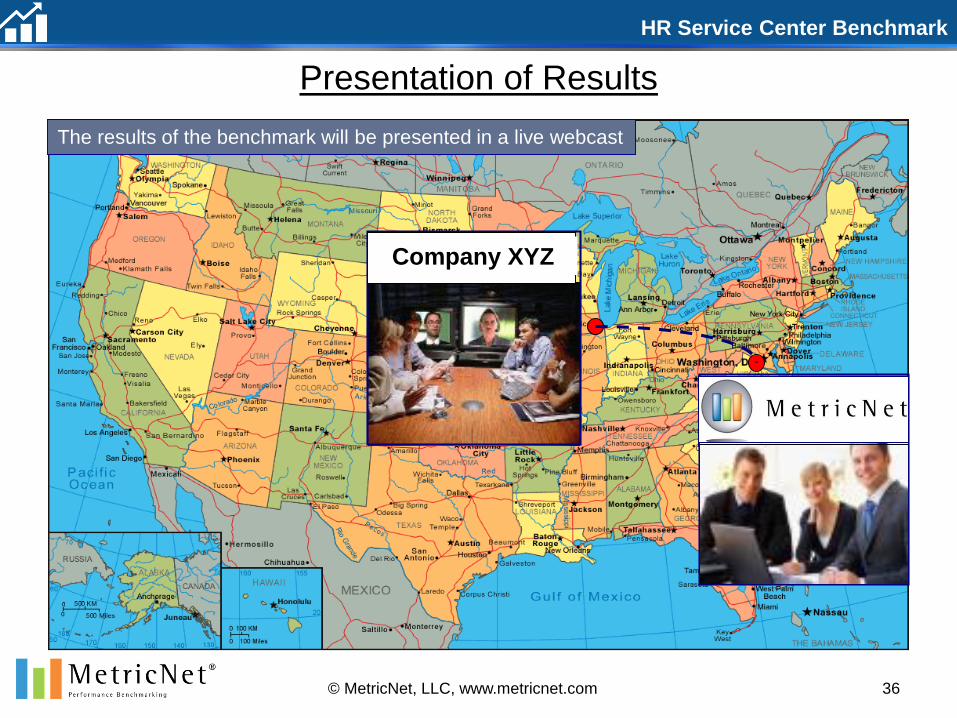
Presentation of Results
Company XYZ
36© MetricNet, LLC, www.metricnet.com
The results of the benchmark will be presented in a live webcast
HR Service Center Benchmark
Summary of Deliverables
Deliverables include…
Project Participation Kit:
Project Schedule
Data collection questionnaires
Project Kickoff Meeting
Comprehensive Assessment and Benchmarking Report
Project Overview and Objectives
Industry Background
Benchmarking Performance Summary
Balanced Scorecard
Best Practices Process Assessment
Conclusions and Recommendations
Detailed Benchmarking Data
Live Webcast Presentation of Results via GoTo Meeting
37© MetricNet, LLC, www.metricnet.com
HR Service Center Benchmark
38
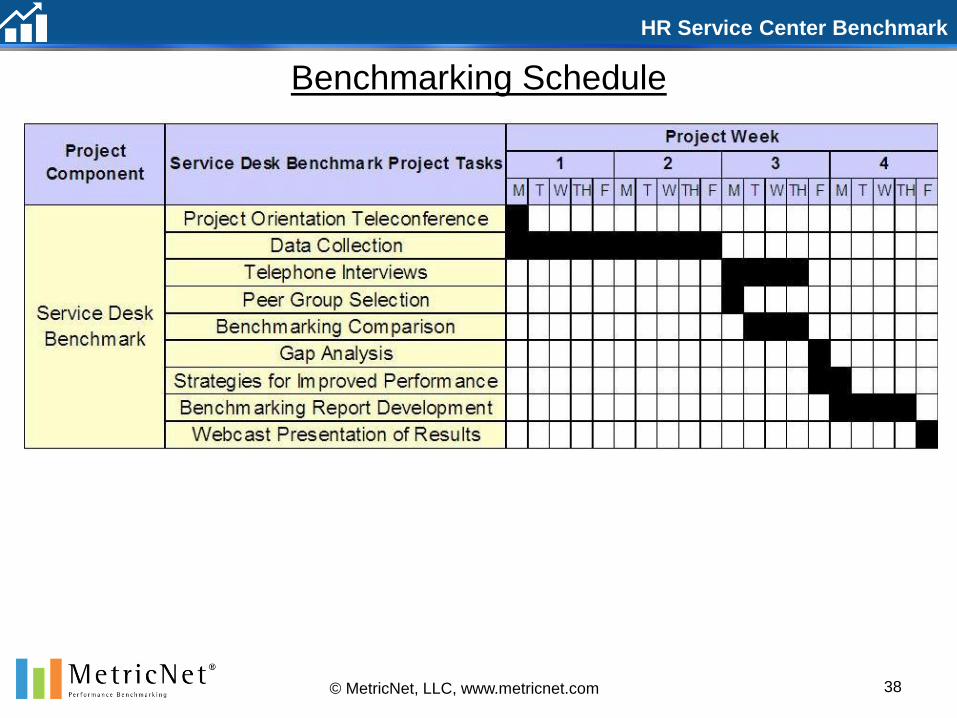
Benchmarking Schedule
© MetricNet, LLC, www.metricnet.com
Industry Background
39
Company
XYZ

HR Service Center Benchmark
27 Years of Service and Support Benchmarking Data
© 2016 MetricNet, LLC, www.metricnet.com 40
More than 3,700 Service
Desk Benchmarks
Global Database
20+ Key Performance Indicators
Nearly 60 Industry Best Practices
HR Service Center Benchmark
41© MetricNet, LLC, www.metricnet.com
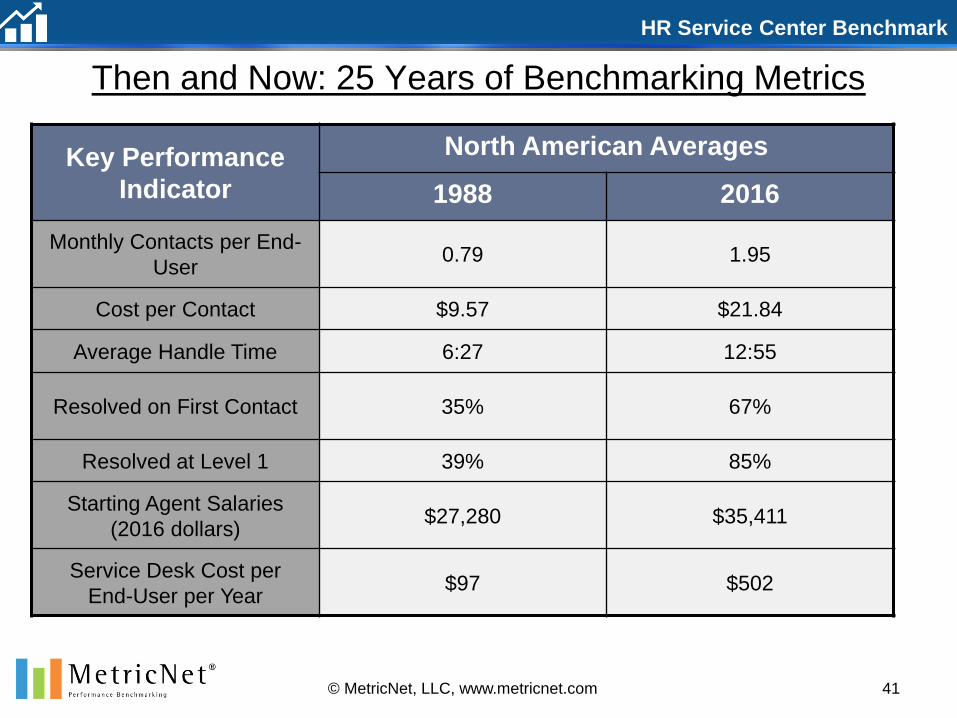
Then and Now: 25 Years of Benchmarking Metrics
Key Performance
Indicator
North American Averages
1988 2016
Monthly Contacts per End-
User0.79 1.95
Cost per Contact $9.57 $21.84
Average Handle Time 6:27 12:55
Resolved on First Contact 35% 67%
Resolved at Level 1 39% 85%
Starting Agent Salaries
(2016 dollars)$27,280 $35,411
Service Desk Cost per
End-User per Year$97 $502

HR Service Center Benchmark
So What’s Going on Here?
Industry Megatrends: The Drivers
Increasing awareness and understanding of Service Desk TCO
(Total Cost of Ownership)
Service Desk evolving from a support to a strategic role in the enterprise
The growing importance of the Service Desk in shaping end-user opinions on IT
42© MetricNet, LLC, www.metricnet.com
HR Service Center Benchmark
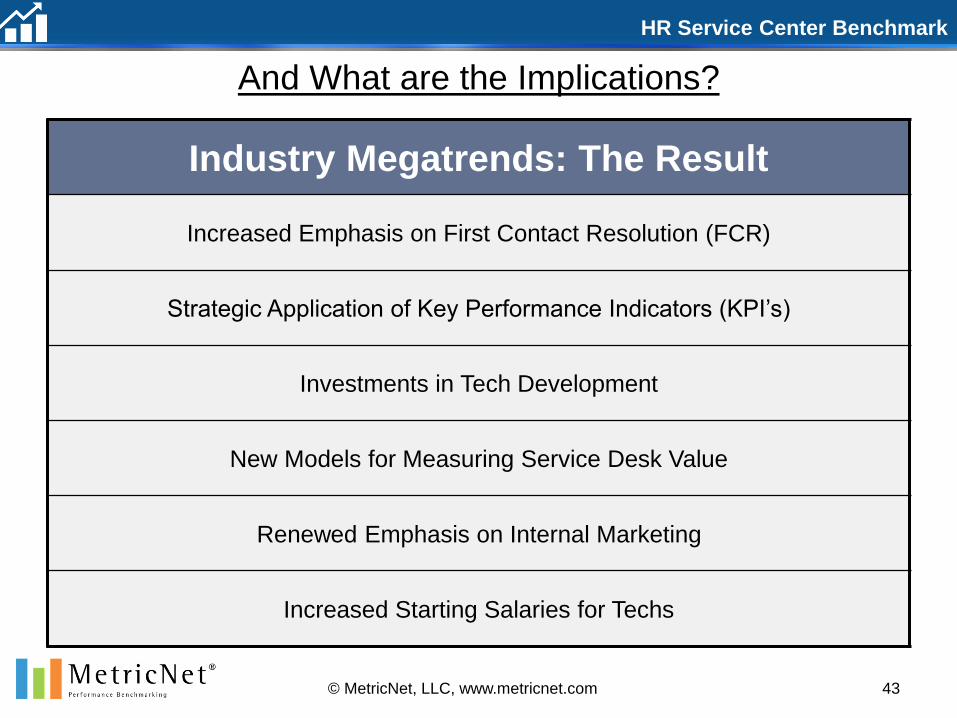
And What are the Implications?
Industry Megatrends: The Result
Increased Emphasis on First Contact Resolution (FCR)
Strategic Application of Key Performance Indicators (KPI’s)
Investments in Tech Development
New Models for Measuring Service Desk Value
Renewed Emphasis on Internal Marketing
Increased Starting Salaries for Techs
43© MetricNet, LLC, www.metricnet.com
HR Service Center Benchmark
84%
47%
31%29%
22%19%
8%
0%
10%
20%
30%
40%
50%
60%
70%
80%
90%
Service Desk Desktop
Support
Network
Outages
VPN Training Enterprise
Applications
Desktop
Software
Factors Contributing to IT Customer Satisfaction
% S
ayin
g V
ery
Im
po
rtan
t
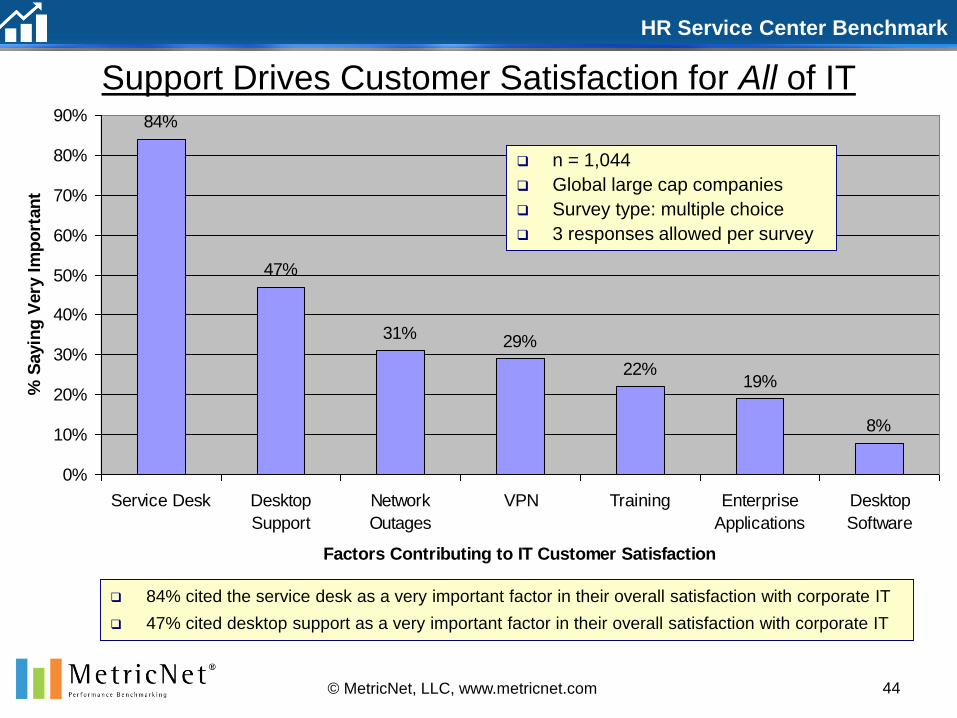
n = 1,044
Global large cap companies
Survey type: multiple choice
3 responses allowed per survey
84% cited the service desk as a very important factor in their overall satisfaction with corporate IT
47% cited desktop support as a very important factor in their overall satisfaction with corporate IT
Support Drives Customer Satisfaction for All of IT
44© MetricNet, LLC, www.metricnet.com
HR Service Center Benchmark
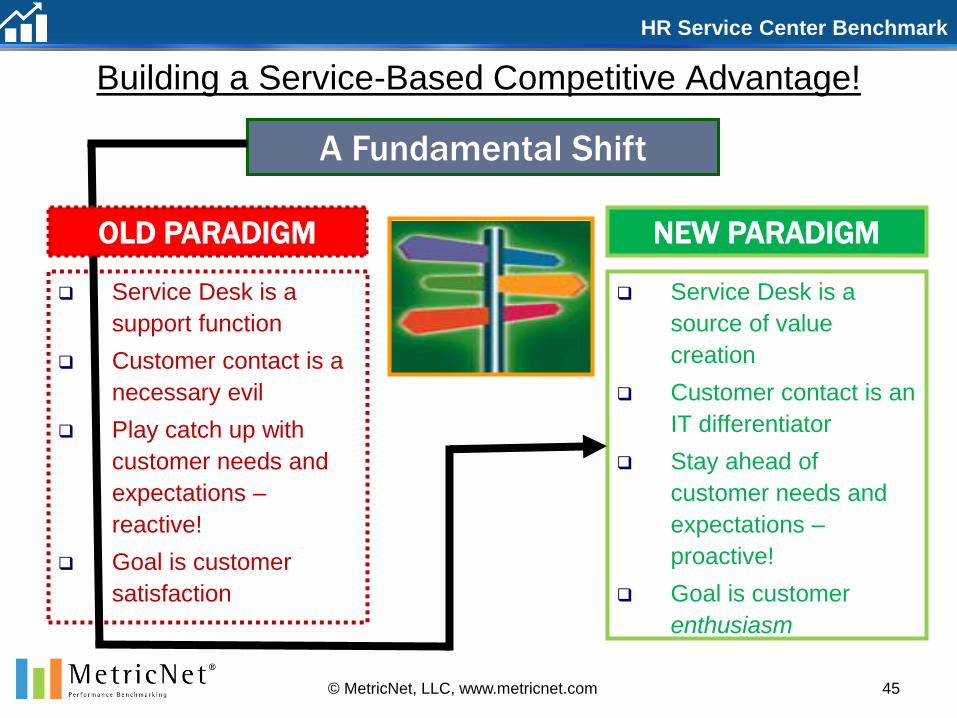
Building a Service-Based Competitive Advantage!
Service Desk is a
support function
Customer contact is a
necessary evil
Play catch up with
customer needs and
expectations –
reactive!
Goal is customer
satisfaction
Service Desk is a
source of value
creation
Customer contact is an
IT differentiator
Stay ahead of
customer needs and
expectations –
proactive!
Goal is customer
enthusiasm
45© MetricNet, LLC, www.metricnet.com
NEW PARADIGM
A Fundamental Shift
OLD PARADIGM
HR Service Center Benchmark
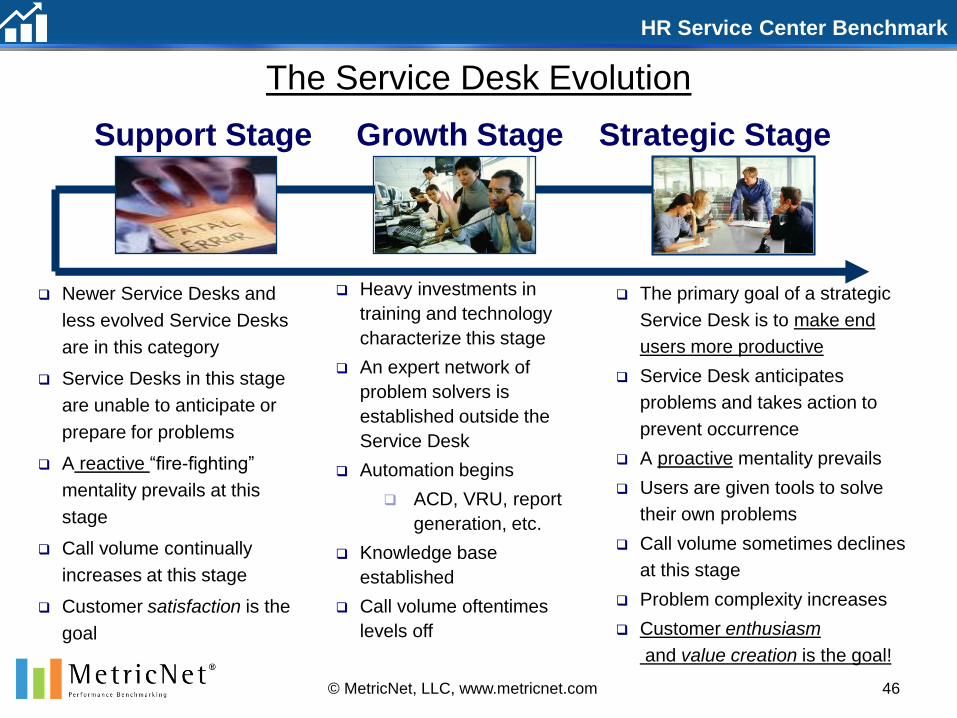
The Service Desk Evolution
Newer Service Desks and
less evolved Service Desks
are in this category
Service Desks in this stage
are unable to anticipate or
prepare for problems
A reactive “fire-fighting”
mentality prevails at this
stage
Call volume continually
increases at this stage
Customer satisfaction is the
goal
The primary goal of a strategic
Service Desk is to make end
users more productive
Service Desk anticipates
problems and takes action to
prevent occurrence
A proactive mentality prevails
Users are given tools to solve
their own problems
Call volume sometimes declines
at this stage
Problem complexity increases
Customer enthusiasm
and value creation is the goal!
46© MetricNet, LLC, www.metricnet.com
Heavy investments in
training and technology
characterize this stage
An expert network of
problem solvers is
established outside the
Service Desk
Automation begins
ACD, VRU, report
generation, etc.
Knowledge base
established
Call volume oftentimes
levels off
Support Stage Growth Stage Strategic Stage
HR Service Center Benchmark
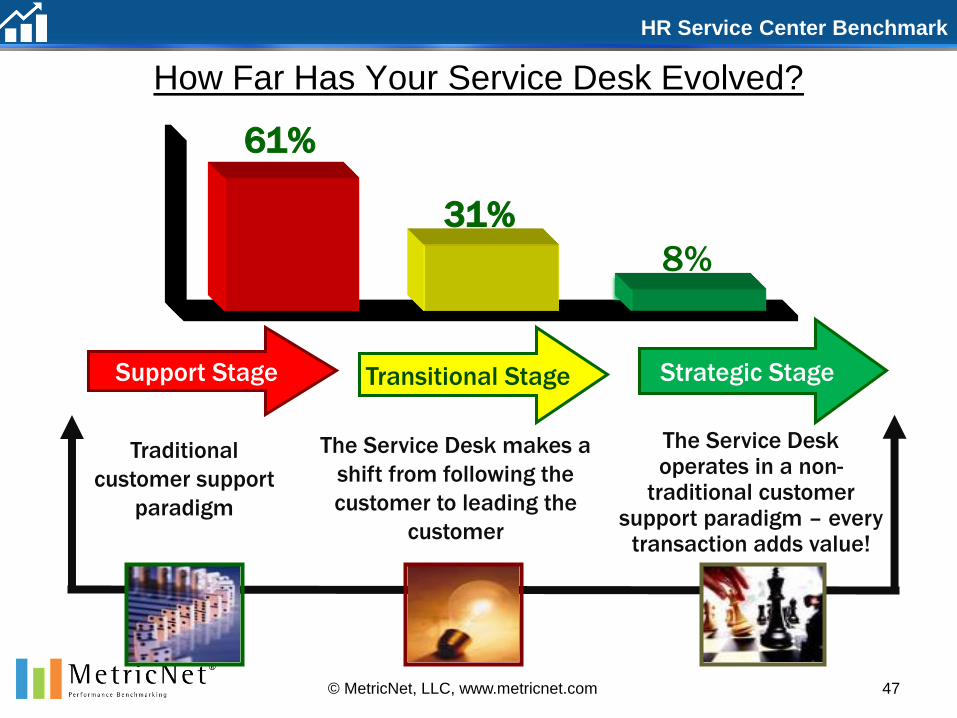
How Far Has Your Service Desk Evolved?
47© MetricNet, LLC, www.metricnet.com
61%
31%
8%
Support Stage Transitional Stage Strategic Stage
Traditional
customer support
paradigm
The Service Desk makes a
shift from following the
customer to leading the
customer
The Service Desk operates in a non-
traditional customer support paradigm – every
transaction adds value!
HR Service Center Benchmark
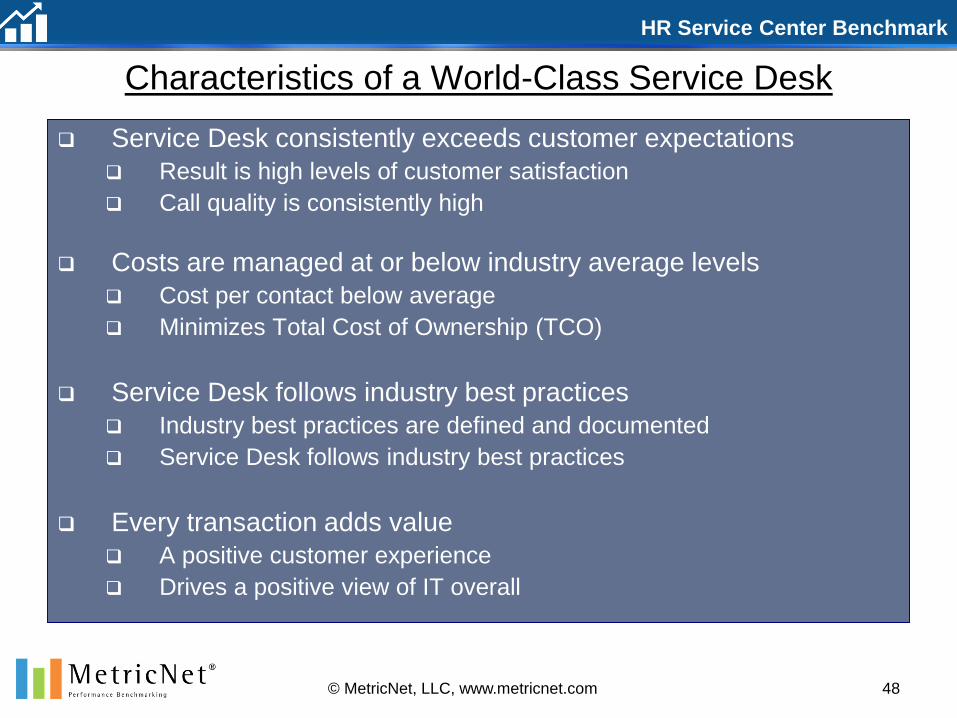
Characteristics of a World-Class Service Desk
Service Desk consistently exceeds customer expectations
Result is high levels of customer satisfaction
Call quality is consistently high
Costs are managed at or below industry average levels
Cost per contact below average
Minimizes Total Cost of Ownership (TCO)
Service Desk follows industry best practices
Industry best practices are defined and documented
Service Desk follows industry best practices
Every transaction adds value
A positive customer experience
Drives a positive view of IT overall
48© MetricNet, LLC, www.metricnet.com

HR Service Center Benchmark
The World-Class Service Desk Defined
49© MetricNet, LLC, www.metricnet.com
Cost per Contact HigherLower
HigherA World-Class Service Desk
An “Average” Service Desk
BEST-IN-CLASS
PERFORMANCE CURVE
AVERAGE PERFORMANCE CURVE
Performance Benchmarking
Summary
50
Company
XYZ
HR Service Center Benchmark
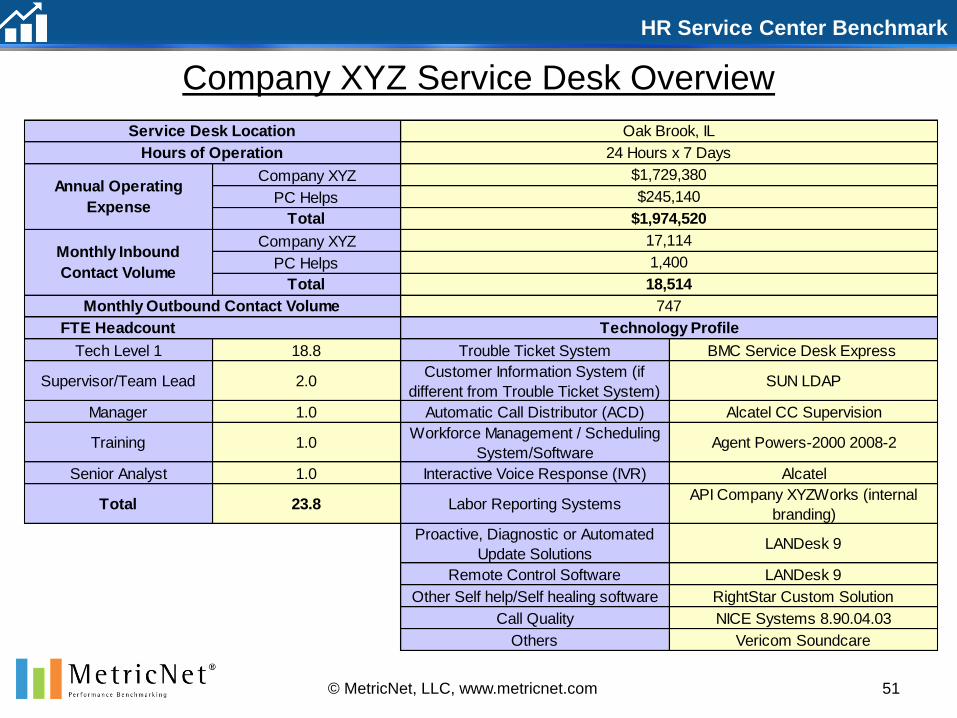
Company XYZ Service Desk Overview
51© MetricNet, LLC, www.metricnet.com
Company XYZ
PC Helps
Total
Company XYZ
PC Helps
Total
FTE Headcount
Tech Level 1 18.8 Trouble Ticket System BMC Service Desk Express
Supervisor/Team Lead 2.0Customer Information System (if
different from Trouble Ticket System)SUN LDAP
Manager 1.0 Automatic Call Distributor (ACD) Alcatel CC Supervision
Training 1.0Workforce Management / Scheduling
System/SoftwareAgent Powers-2000 2008-2
Senior Analyst 1.0 Interactive Voice Response (IVR) Alcatel
Total 23.8 Labor Reporting SystemsAPI Company XYZWorks (internal
branding)
Proactive, Diagnostic or Automated
Update SolutionsLANDesk 9
Remote Control Software LANDesk 9
Other Self help/Self healing software RightStar Custom Solution
Call Quality NICE Systems 8.90.04.03
Others Vericom Soundcare
Service Desk Location Oak Brook, IL
$245,140
Hours of Operation 24 Hours x 7 Days
Annual Operating
Expense
$1,729,380
$1,974,520
1,400
Monthly Outbound Contact Volume 747
Technology Profile
Monthly Inbound
Contact Volume
17,114
18,514
HR Service Center Benchmark
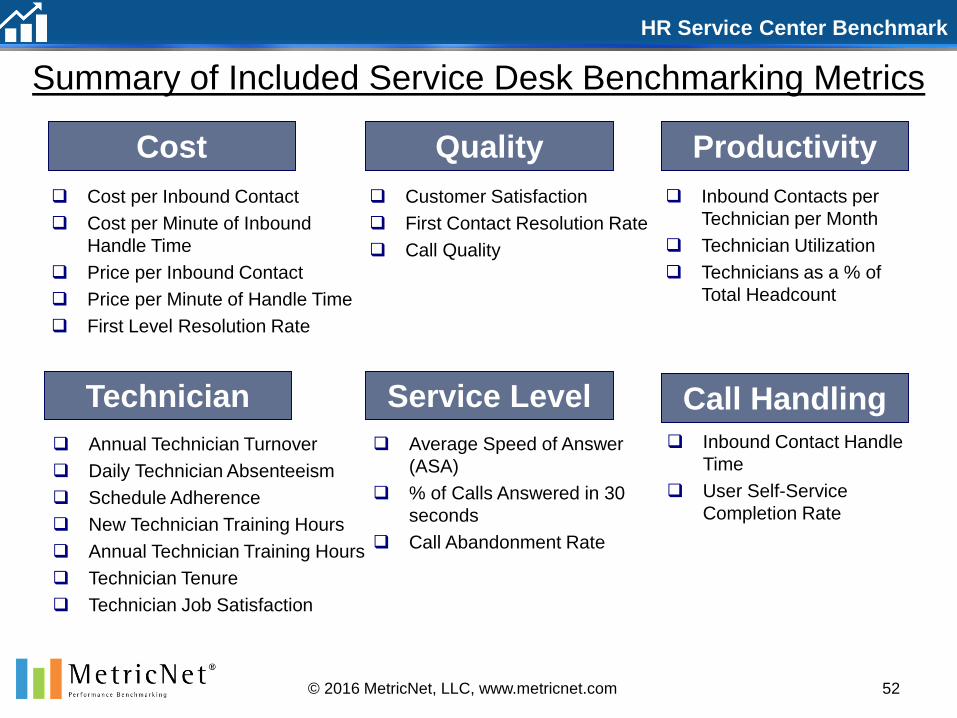
Summary of Included Service Desk Benchmarking Metrics
Cost per Inbound Contact
Cost per Minute of Inbound
Handle Time
Price per Inbound Contact
Price per Minute of Handle Time
First Level Resolution Rate
Cost Productivity
Service Level
Quality
Call HandlingTechnician
Average Speed of Answer
(ASA)
% of Calls Answered in 30
seconds
Call Abandonment Rate
Inbound Contacts per
Technician per Month
Technician Utilization
Technicians as a % of
Total Headcount
Customer Satisfaction
First Contact Resolution Rate
Call Quality
Annual Technician Turnover
Daily Technician Absenteeism
Schedule Adherence
New Technician Training Hours
Annual Technician Training Hours
Technician Tenure
Technician Job Satisfaction
Inbound Contact Handle
Time
User Self-Service
Completion Rate
© 2016 MetricNet, LLC, www.metricnet.com 52
HR Service Center Benchmark
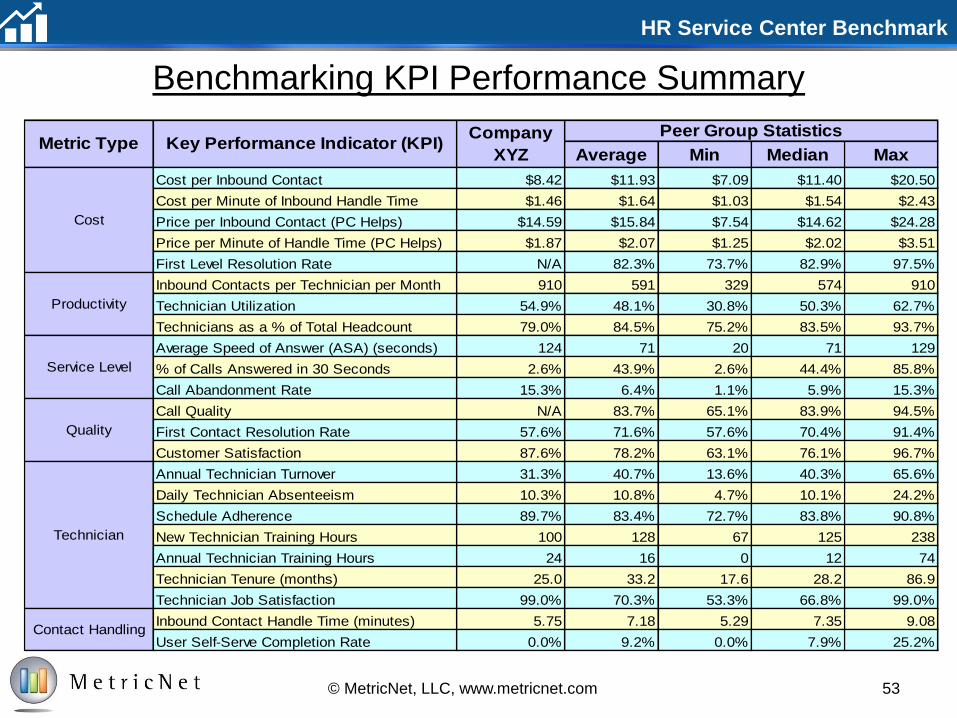
Benchmarking KPI Performance Summary
53© MetricNet, LLC, www.metricnet.com
Average Min Median Max
Cost per Inbound Contact $8.42 $11.93 $7.09 $11.40 $20.50
Cost per Minute of Inbound Handle Time $1.46 $1.64 $1.03 $1.54 $2.43
Price per Inbound Contact (PC Helps) $14.59 $15.84 $7.54 $14.62 $24.28
Price per Minute of Handle Time (PC Helps) $1.87 $2.07 $1.25 $2.02 $3.51
First Level Resolution Rate N/A 82.3% 73.7% 82.9% 97.5%
Inbound Contacts per Technician per Month 910 591 329 574 910
Technician Utilization 54.9% 48.1% 30.8% 50.3% 62.7%
Technicians as a % of Total Headcount 79.0% 84.5% 75.2% 83.5% 93.7%
Average Speed of Answer (ASA) (seconds) 124 71 20 71 129
% of Calls Answered in 30 Seconds 2.6% 43.9% 2.6% 44.4% 85.8%
Call Abandonment Rate 15.3% 6.4% 1.1% 5.9% 15.3%
Call Quality N/A 83.7% 65.1% 83.9% 94.5%
First Contact Resolution Rate 57.6% 71.6% 57.6% 70.4% 91.4%
Customer Satisfaction 87.6% 78.2% 63.1% 76.1% 96.7%
Annual Technician Turnover 31.3% 40.7% 13.6% 40.3% 65.6%
Daily Technician Absenteeism 10.3% 10.8% 4.7% 10.1% 24.2%
Schedule Adherence 89.7% 83.4% 72.7% 83.8% 90.8%
New Technician Training Hours 100 128 67 125 238
Annual Technician Training Hours 24 16 0 12 74
Technician Tenure (months) 25.0 33.2 17.6 28.2 86.9
Technician Job Satisfaction 99.0% 70.3% 53.3% 66.8% 99.0%
Inbound Contact Handle Time (minutes) 5.75 7.18 5.29 7.35 9.08
User Self-Serve Completion Rate 0.0% 9.2% 0.0% 7.9% 25.2%
Service Level
Quality
Technician
Contact Handling
Peer Group Statistics
Productivity
Company
XYZKey Performance Indicator (KPI)Metric Type
Cost
HR Service Center Benchmark
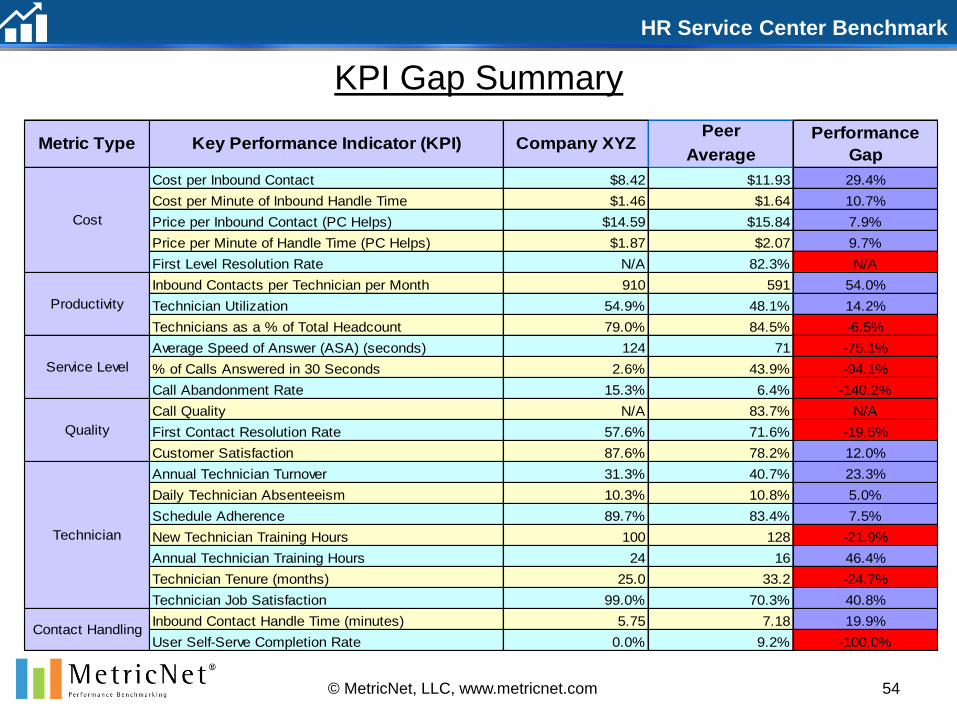
KPI Gap Summary
54© MetricNet, LLC, www.metricnet.com
Peer
Average
Cost per Inbound Contact $8.42 $11.93 29.4%
Cost per Minute of Inbound Handle Time $1.46 $1.64 10.7%
Price per Inbound Contact (PC Helps) $14.59 $15.84 7.9%
Price per Minute of Handle Time (PC Helps) $1.87 $2.07 9.7%
First Level Resolution Rate N/A 82.3% N/A
Inbound Contacts per Technician per Month 910 591 54.0%
Technician Utilization 54.9% 48.1% 14.2%
Technicians as a % of Total Headcount 79.0% 84.5% -6.5%
Average Speed of Answer (ASA) (seconds) 124 71 -75.1%
% of Calls Answered in 30 Seconds 2.6% 43.9% -94.1%
Call Abandonment Rate 15.3% 6.4% -140.2%
Call Quality N/A 83.7% N/A
First Contact Resolution Rate 57.6% 71.6% -19.5%
Customer Satisfaction 87.6% 78.2% 12.0%
Annual Technician Turnover 31.3% 40.7% 23.3%
Daily Technician Absenteeism 10.3% 10.8% 5.0%
Schedule Adherence 89.7% 83.4% 7.5%
New Technician Training Hours 100 128 -21.9%
Annual Technician Training Hours 24 16 46.4%
Technician Tenure (months) 25.0 33.2 -24.7%
Technician Job Satisfaction 99.0% 70.3% 40.8%
Inbound Contact Handle Time (minutes) 5.75 7.18 19.9%
User Self-Serve Completion Rate 0.0% 9.2% -100.0%
Service Level
Quality
Technician
Contact Handling
Cost
Productivity
Performance
GapMetric Type Key Performance Indicator (KPI) Company XYZ
HR Service Center Benchmark
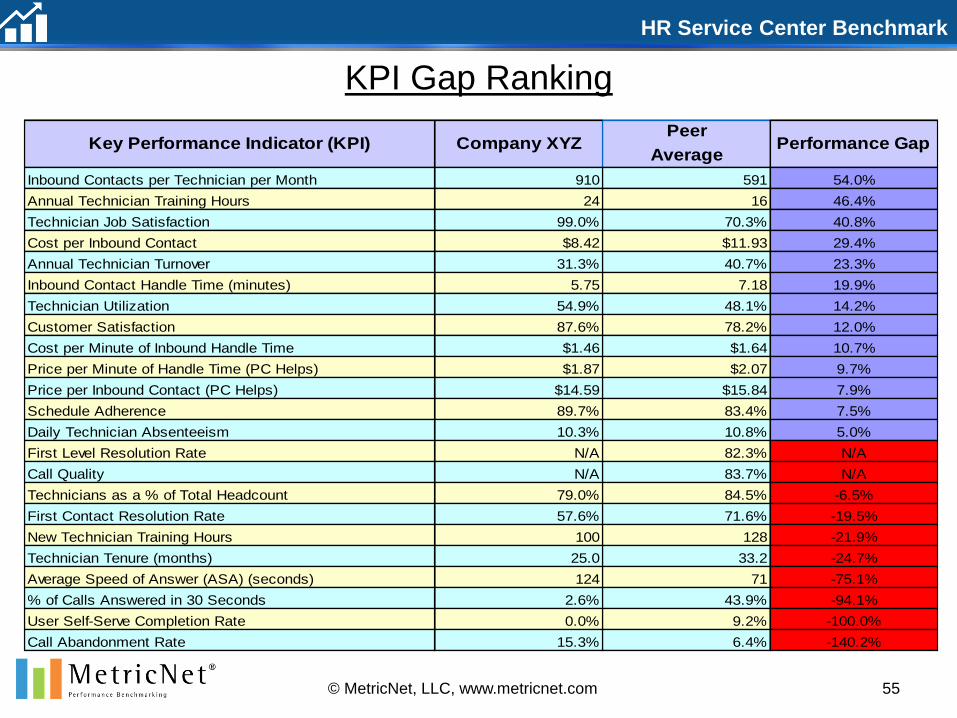
KPI Gap Ranking
55© MetricNet, LLC, www.metricnet.com
Peer
Average
Inbound Contacts per Technician per Month 910 591 54.0%
Annual Technician Training Hours 24 16 46.4%
Technician Job Satisfaction 99.0% 70.3% 40.8%
Cost per Inbound Contact $8.42 $11.93 29.4%
Annual Technician Turnover 31.3% 40.7% 23.3%
Inbound Contact Handle Time (minutes) 5.75 7.18 19.9%
Technician Utilization 54.9% 48.1% 14.2%
Customer Satisfaction 87.6% 78.2% 12.0%
Cost per Minute of Inbound Handle Time $1.46 $1.64 10.7%
Price per Minute of Handle Time (PC Helps) $1.87 $2.07 9.7%
Price per Inbound Contact (PC Helps) $14.59 $15.84 7.9%
Schedule Adherence 89.7% 83.4% 7.5%
Daily Technician Absenteeism 10.3% 10.8% 5.0%
First Level Resolution Rate N/A 82.3% N/A
Call Quality N/A 83.7% N/A
Technicians as a % of Total Headcount 79.0% 84.5% -6.5%
First Contact Resolution Rate 57.6% 71.6% -19.5%
New Technician Training Hours 100 128 -21.9%
Technician Tenure (months) 25.0 33.2 -24.7%
Average Speed of Answer (ASA) (seconds) 124 71 -75.1%
% of Calls Answered in 30 Seconds 2.6% 43.9% -94.1%
User Self-Serve Completion Rate 0.0% 9.2% -100.0%
Call Abandonment Rate 15.3% 6.4% -140.2%
Key Performance Indicator (KPI) Company XYZ Performance Gap
HR Service Center Benchmark
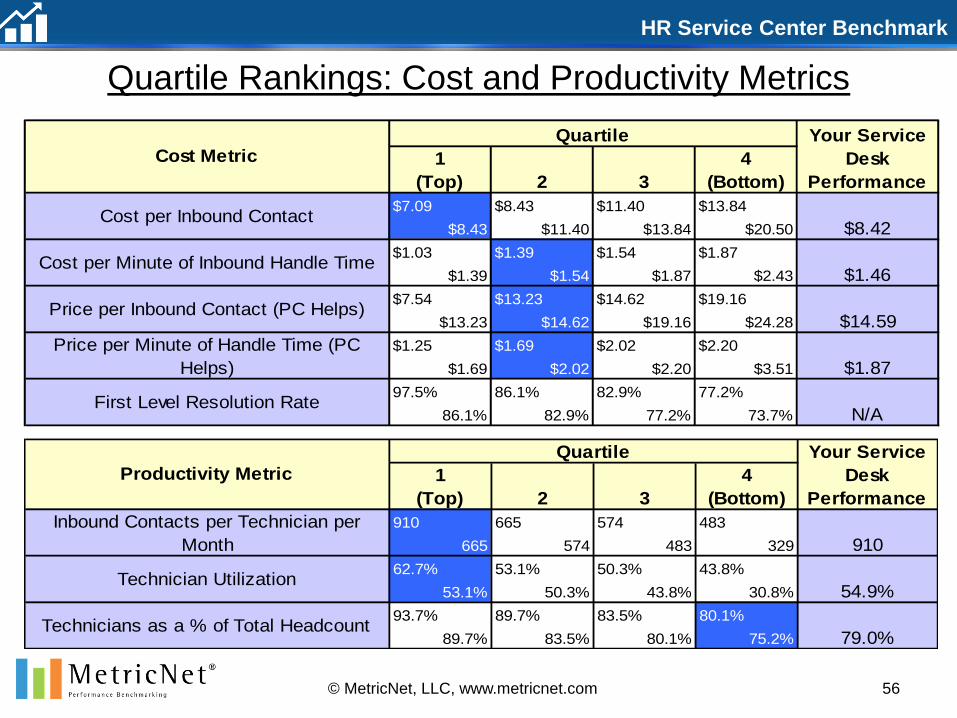
Quartile Rankings: Cost and Productivity Metrics
56© MetricNet, LLC, www.metricnet.com
Cost MetricQuartile Your Service
Desk
Performance
1
2 3
4
(Bottom)(Top)
Cost per Inbound Contact$7.09 $8.43 $11.40 $13.84
$8.42$8.43 $11.40 $13.84 $20.50
$1.39 $1.54 $1.87 $2.43
$1.87
$1.46
Price per Inbound Contact (PC Helps)$7.54 $13.23 $14.62
Cost per Minute of Inbound Handle Time$1.03 $1.39 $1.54
$13.23 $14.62 $19.16 $24.28
$19.16
$14.59
$1.69 $2.02 $2.20 $3.51
$2.20
$1.87
First Level Resolution Rate97.5% 86.1% 82.9%
Price per Minute of Handle Time (PC
Helps)
$1.25 $1.69 $2.02
86.1% 82.9% 77.2% 73.7%
77.2%
N/A
Productivity Metric
Quartile Your Service
Desk
Performance
1
2 3
4
(Bottom)(Top)
Inbound Contacts per Technician per
Month
910 665 574 483
910665 574 483 329
53.1% 50.3% 43.8% 30.8%
43.8%
54.9%
Technicians as a % of Total Headcount93.7% 89.7% 83.5%
Technician Utilization62.7% 53.1% 50.3%
89.7% 83.5% 80.1% 75.2%
80.1%
79.0%
HR Service Center Benchmark
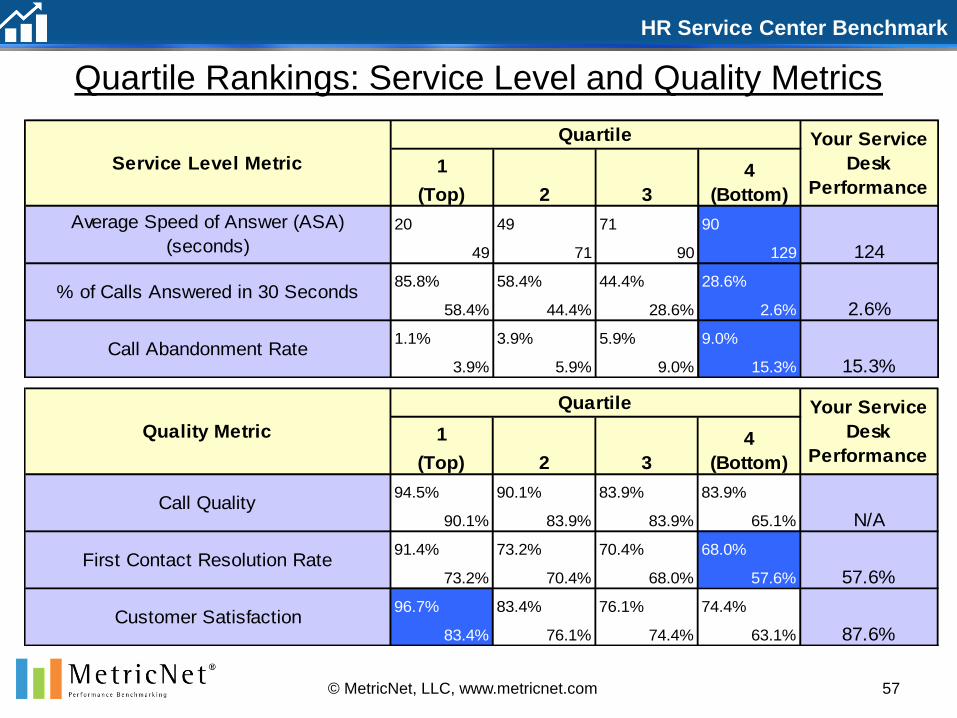
Quartile Rankings: Service Level and Quality Metrics
57© MetricNet, LLC, www.metricnet.com
Service Level Metric
Quartile Your Service
Desk
Performance1
2 3
4
(Bottom)(Top)
Average Speed of Answer (ASA)
(seconds)
20 49 71 90
12449 71 90 129
58.4% 44.4% 28.6% 2.6%
28.6%
2.6%
Call Abandonment Rate1.1% 3.9% 5.9%
% of Calls Answered in 30 Seconds85.8% 58.4% 44.4%
3.9% 5.9% 9.0% 15.3%
9.0%
15.3%
Quality Metric
Quartile Your Service
Desk
Performance1
2 3
4
(Bottom)(Top)
Call Quality94.5% 90.1% 83.9% 83.9%
N/A90.1% 83.9% 83.9% 65.1%
73.2% 70.4% 68.0% 57.6%
68.0%
57.6%
Customer Satisfaction96.7% 83.4% 76.1%
First Contact Resolution Rate91.4% 73.2% 70.4%
83.4% 76.1% 74.4% 63.1%
74.4%
87.6%
HR Service Center Benchmark
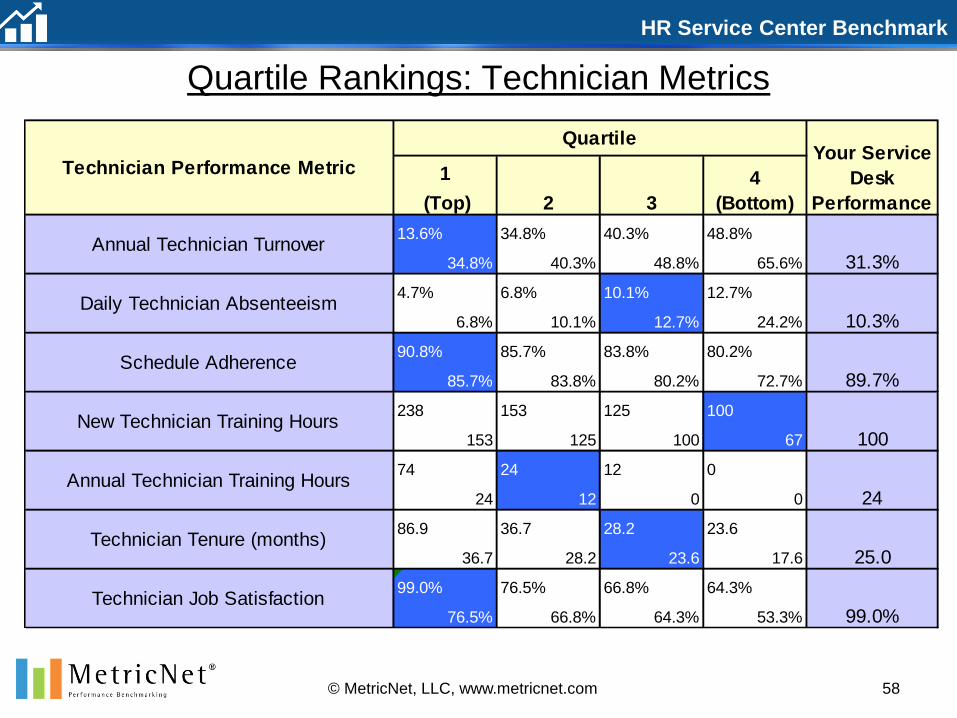
Quartile Rankings: Technician Metrics
58© MetricNet, LLC, www.metricnet.com
Technician Performance Metric
QuartileYour Service
Desk
Performance
1
2 3
4
(Bottom) (Top)
Annual Technician Turnover13.6% 34.8% 40.3% 48.8%
31.3%34.8% 40.3% 48.8% 65.6%
6.8% 10.1% 12.7% 24.2%
12.7%
10.3%
Schedule Adherence90.8% 85.7% 83.8%
Daily Technician Absenteeism4.7% 6.8% 10.1%
85.7% 83.8% 80.2% 72.7%
80.2%
89.7%
153 125 100 67
100
100
Annual Technician Training Hours74 24 12
New Technician Training Hours238 153 125
24 12 0 0
0
24
36.7 28.2 23.6 17.6
23.6
25.0
Technician Job Satisfaction99.0% 76.5% 66.8%
Technician Tenure (months)86.9 36.7 28.2
76.5% 66.8% 64.3% 53.3%
64.3%
99.0%
HR Service Center Benchmark
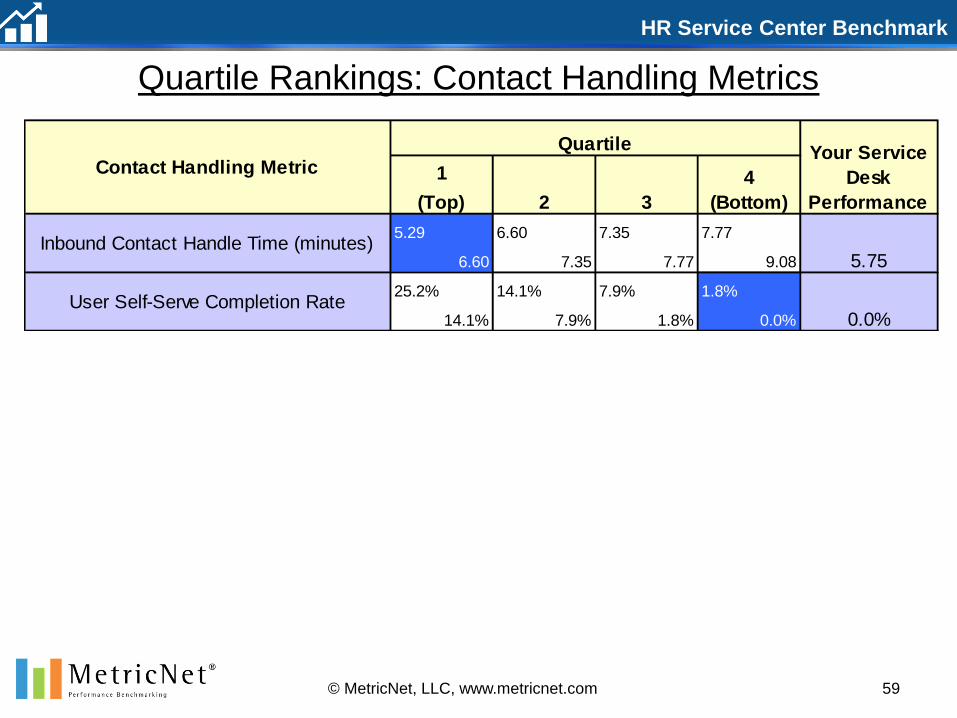
Quartile Rankings: Contact Handling Metrics
59© MetricNet, LLC, www.metricnet.com
Contact Handling Metric
Quartile Your Service
Desk
Performance
1
2 3
4
(Bottom)(Top)
Inbound Contact Handle Time (minutes)5.29 6.60 7.35 7.77
5.756.60 7.35 7.77 9.08
User Self-Serve Completion Rate25.2% 14.1% 7.9%
14.1% 7.9% 1.8% 0.0%
1.8%
0.0%
HR Service Center Benchmark
60© MetricNet, LLC, www.metricnet.com
The Service Desk Scorecard: An Overview
The Service Desk scorecard employs a methodology that provides you
with a single, all-inclusive measure of your Service Desk performance
It combines cost, service level, productivity, and quality metrics into an
overall performance indicator for your Service Desk
Your Service Desk score will range between 0 and 100%, and can be
compared directly to the scores of other Service Desks in the benchmark
By computing your overall score on a monthly or quarterly basis, you can
track and trend your performance over time
Charting and tracking your Service Desk score is an ideal way to ensure
continuous improvement in your Service Desk!
HR Service Center Benchmark
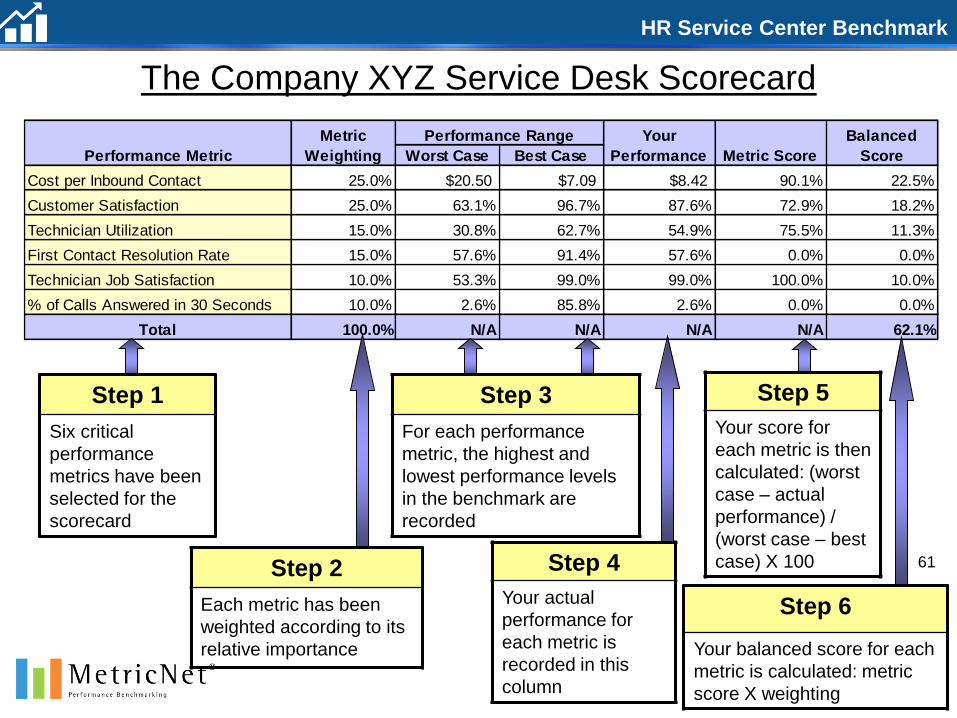
Worst Case Best Case
Cost per Inbound Contact 25.0% $20.50 $7.09 $8.42 90.1% 22.5%
Customer Satisfaction 25.0% 63.1% 96.7% 87.6% 72.9% 18.2%
Technician Utilization 15.0% 30.8% 62.7% 54.9% 75.5% 11.3%
First Contact Resolution Rate 15.0% 57.6% 91.4% 57.6% 0.0% 0.0%
Technician Job Satisfaction 10.0% 53.3% 99.0% 99.0% 100.0% 10.0%
% of Calls Answered in 30 Seconds 10.0% 2.6% 85.8% 2.6% 0.0% 0.0%
Total 100.0% N/A N/A N/A N/A 62.1%
Performance Metric
Metric
Weighting
Performance Range Your
Performance Metric Score
Balanced
Score
Step 2
Each metric has been
weighted according to its
relative importance
The Company XYZ Service Desk Scorecard
Step 1
Six critical
performance
metrics have been
selected for the
scorecard
Step 4
Your actual
performance for
each metric is
recorded in this
column
Step 5
Your score for
each metric is then
calculated: (worst
case – actual
performance) /
(worst case – best
case) X 100
Step 6
Your balanced score for each
metric is calculated: metric
score X weighting
61
Step 3
For each performance
metric, the highest and
lowest performance levels
in the benchmark are
recorded
HR Service Center Benchmark
62© MetricNet, LLC, www.metricnet.com
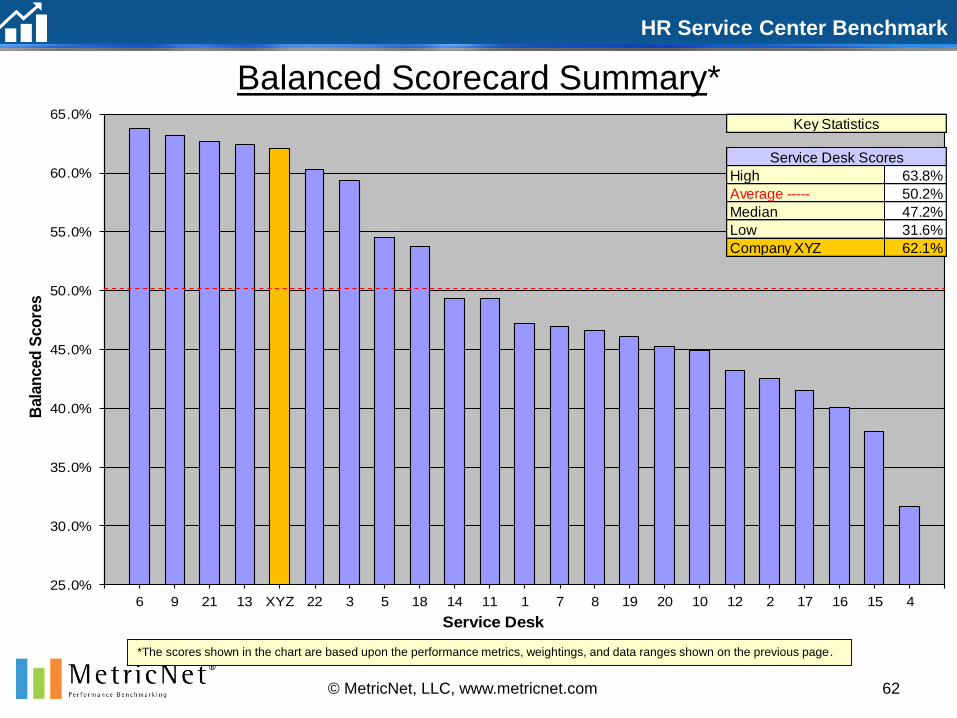
Balanced Scorecard Summary*
*The scores shown in the chart are based upon the performance metrics, weightings, and data ranges shown on the previous page.
25.0%
30.0%
35.0%
40.0%
45.0%
50.0%
55.0%
60.0%
65.0%
6 9 21 13 XYZ 22 3 5 18 14 11 1 7 8 19 20 10 12 2 17 16 15 4
Bala
nced
Sco
res
Service Desk
High 63.8%
Average ----- 50.2%
Median 47.2%
Low 31.6%
Company XYZ 62.1%
Key Statistics
Service Desk Scores

HR Service Center Benchmark
63© MetricNet, LLC, www.metricnet.com
Peer Group Scorecard Summary Data
The next two pages illustrate the benchmarking peer
group performance for each KPI in the scorecard
Page 64 ranks each service desk from best performer
(service desk #6) to worst performer (service desk #4)
based upon their balanced scores
Page 65 ranks each KPI in the scorecard from best (top
row) to worst (bottom row)
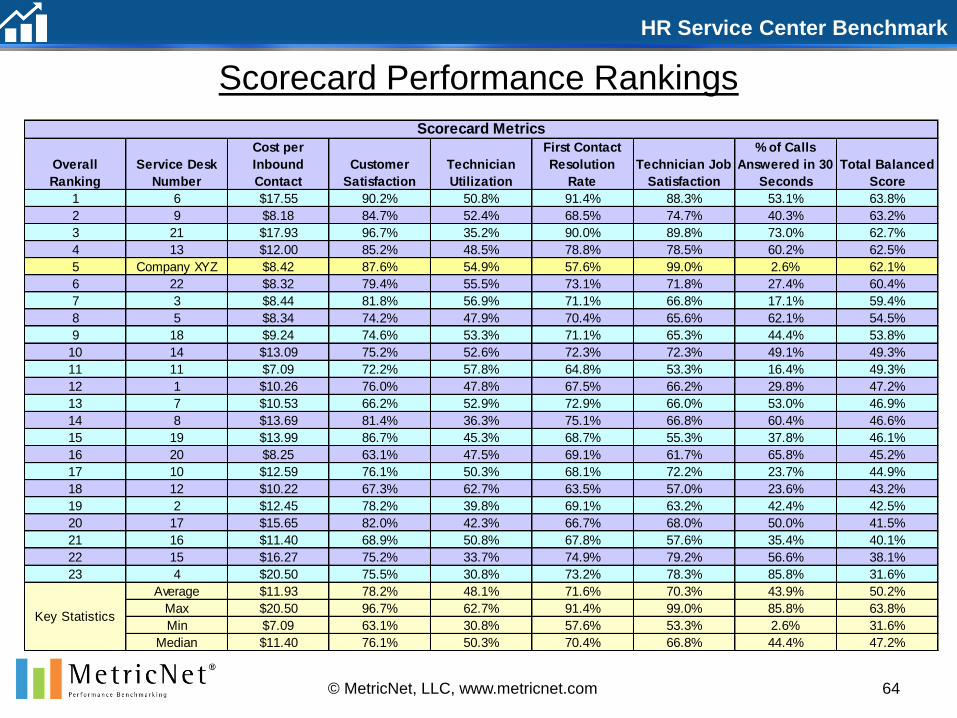
HR Service Center Benchmark
64© MetricNet, LLC, www.metricnet.com
Scorecard Performance Rankings
Overall
Ranking
Service Desk
Number
Cost per
Inbound
Contact
Customer
Satisfaction
Technician
Utilization
First Contact
Resolution
Rate
Technician Job
Satisfaction
% of Calls
Answered in 30
Seconds
Total Balanced
Score
1 6 $17.55 90.2% 50.8% 91.4% 88.3% 53.1% 63.8%
2 9 $8.18 84.7% 52.4% 68.5% 74.7% 40.3% 63.2%
3 21 $17.93 96.7% 35.2% 90.0% 89.8% 73.0% 62.7%
4 13 $12.00 85.2% 48.5% 78.8% 78.5% 60.2% 62.5%
5 Company XYZ $8.42 87.6% 54.9% 57.6% 99.0% 2.6% 62.1%
6 22 $8.32 79.4% 55.5% 73.1% 71.8% 27.4% 60.4%
7 3 $8.44 81.8% 56.9% 71.1% 66.8% 17.1% 59.4%
8 5 $8.34 74.2% 47.9% 70.4% 65.6% 62.1% 54.5%
9 18 $9.24 74.6% 53.3% 71.1% 65.3% 44.4% 53.8%
10 14 $13.09 75.2% 52.6% 72.3% 72.3% 49.1% 49.3%
11 11 $7.09 72.2% 57.8% 64.8% 53.3% 16.4% 49.3%
12 1 $10.26 76.0% 47.8% 67.5% 66.2% 29.8% 47.2%
13 7 $10.53 66.2% 52.9% 72.9% 66.0% 53.0% 46.9%
14 8 $13.69 81.4% 36.3% 75.1% 66.8% 60.4% 46.6%
15 19 $13.99 86.7% 45.3% 68.7% 55.3% 37.8% 46.1%
16 20 $8.25 63.1% 47.5% 69.1% 61.7% 65.8% 45.2%
17 10 $12.59 76.1% 50.3% 68.1% 72.2% 23.7% 44.9%
18 12 $10.22 67.3% 62.7% 63.5% 57.0% 23.6% 43.2%
19 2 $12.45 78.2% 39.8% 69.1% 63.2% 42.4% 42.5%
20 17 $15.65 82.0% 42.3% 66.7% 68.0% 50.0% 41.5%
21 16 $11.40 68.9% 50.8% 67.8% 57.6% 35.4% 40.1%
22 15 $16.27 75.2% 33.7% 74.9% 79.2% 56.6% 38.1%
23 4 $20.50 75.5% 30.8% 73.2% 78.3% 85.8% 31.6%
Average $11.93 78.2% 48.1% 71.6% 70.3% 43.9% 50.2%
Max $20.50 96.7% 62.7% 91.4% 99.0% 85.8% 63.8%
Min $7.09 63.1% 30.8% 57.6% 53.3% 2.6% 31.6%
Median $11.40 76.1% 50.3% 70.4% 66.8% 44.4% 47.2%
Scorecard Metrics
Key Statistics
HR Service Center Benchmark
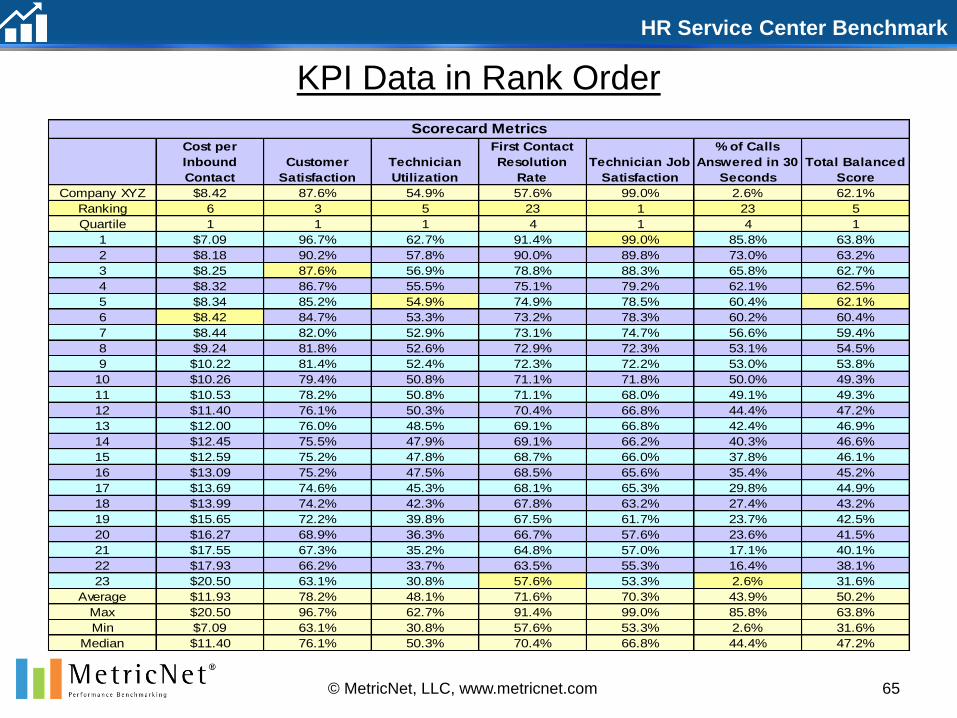
65© MetricNet, LLC, www.metricnet.com
KPI Data in Rank Order
Cost per
Inbound
Contact
Customer
Satisfaction
Technician
Utilization
First Contact
Resolution
Rate
Technician Job
Satisfaction
% of Calls
Answered in 30
Seconds
Total Balanced
Score
Company XYZ $8.42 87.6% 54.9% 57.6% 99.0% 2.6% 62.1%
Ranking 6 3 5 23 1 23 5
Quartile 1 1 1 4 1 4 1
1 $7.09 96.7% 62.7% 91.4% 99.0% 85.8% 63.8%
2 $8.18 90.2% 57.8% 90.0% 89.8% 73.0% 63.2%
3 $8.25 87.6% 56.9% 78.8% 88.3% 65.8% 62.7%
4 $8.32 86.7% 55.5% 75.1% 79.2% 62.1% 62.5%
5 $8.34 85.2% 54.9% 74.9% 78.5% 60.4% 62.1%
6 $8.42 84.7% 53.3% 73.2% 78.3% 60.2% 60.4%
7 $8.44 82.0% 52.9% 73.1% 74.7% 56.6% 59.4%
8 $9.24 81.8% 52.6% 72.9% 72.3% 53.1% 54.5%
9 $10.22 81.4% 52.4% 72.3% 72.2% 53.0% 53.8%
10 $10.26 79.4% 50.8% 71.1% 71.8% 50.0% 49.3%
11 $10.53 78.2% 50.8% 71.1% 68.0% 49.1% 49.3%
12 $11.40 76.1% 50.3% 70.4% 66.8% 44.4% 47.2%
13 $12.00 76.0% 48.5% 69.1% 66.8% 42.4% 46.9%
14 $12.45 75.5% 47.9% 69.1% 66.2% 40.3% 46.6%
15 $12.59 75.2% 47.8% 68.7% 66.0% 37.8% 46.1%
16 $13.09 75.2% 47.5% 68.5% 65.6% 35.4% 45.2%
17 $13.69 74.6% 45.3% 68.1% 65.3% 29.8% 44.9%
18 $13.99 74.2% 42.3% 67.8% 63.2% 27.4% 43.2%
19 $15.65 72.2% 39.8% 67.5% 61.7% 23.7% 42.5%
20 $16.27 68.9% 36.3% 66.7% 57.6% 23.6% 41.5%
21 $17.55 67.3% 35.2% 64.8% 57.0% 17.1% 40.1%
22 $17.93 66.2% 33.7% 63.5% 55.3% 16.4% 38.1%
23 $20.50 63.1% 30.8% 57.6% 53.3% 2.6% 31.6%
Average $11.93 78.2% 48.1% 71.6% 70.3% 43.9% 50.2%
Max $20.50 96.7% 62.7% 91.4% 99.0% 85.8% 63.8%
Min $7.09 63.1% 30.8% 57.6% 53.3% 2.6% 31.6%
Median $11.40 76.1% 50.3% 70.4% 66.8% 44.4% 47.2%
Scorecard Metrics
HR Service Center Benchmark
$0.00
$2.00
$4.00
$6.00
$8.00
$10.00
$12.00
$14.00
$16.00
$18.00
$20.00
$22.00
11 9 20 22 5 XYZ 3 18 12 1 7 16 13 2 10 14 8 19 17 15 6 21 4
Co
st
per
Inb
ou
nd
Co
nta
ct
Service Desk
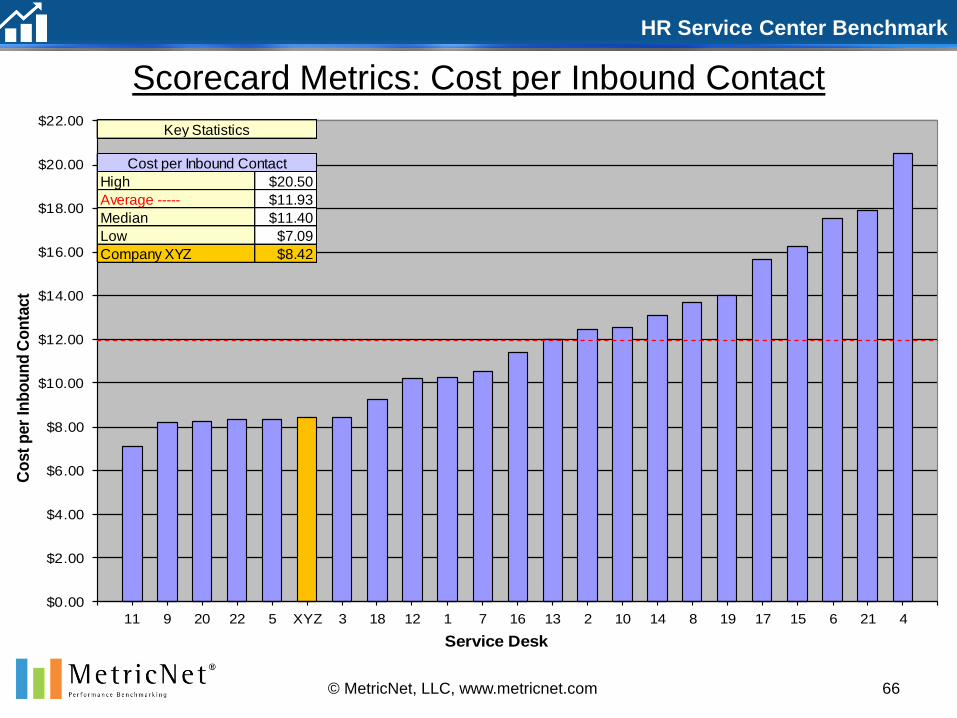
66© MetricNet, LLC, www.metricnet.com
Scorecard Metrics: Cost per Inbound Contact
High $20.50
Average ----- $11.93
Median $11.40
Low $7.09
Company XYZ $8.42
Key Statistics
Cost per Inbound Contact
HR Service Center Benchmark
50.0%
55.0%
60.0%
65.0%
70.0%
75.0%
80.0%
85.0%
90.0%
95.0%
100.0%
21 6 XYZ 19 13 9 17 3 8 22 2 10 1 4 14 15 18 5 11 16 12 7 20
Cu
sto
mer
Sati
sfa
cti
on
Service Desk
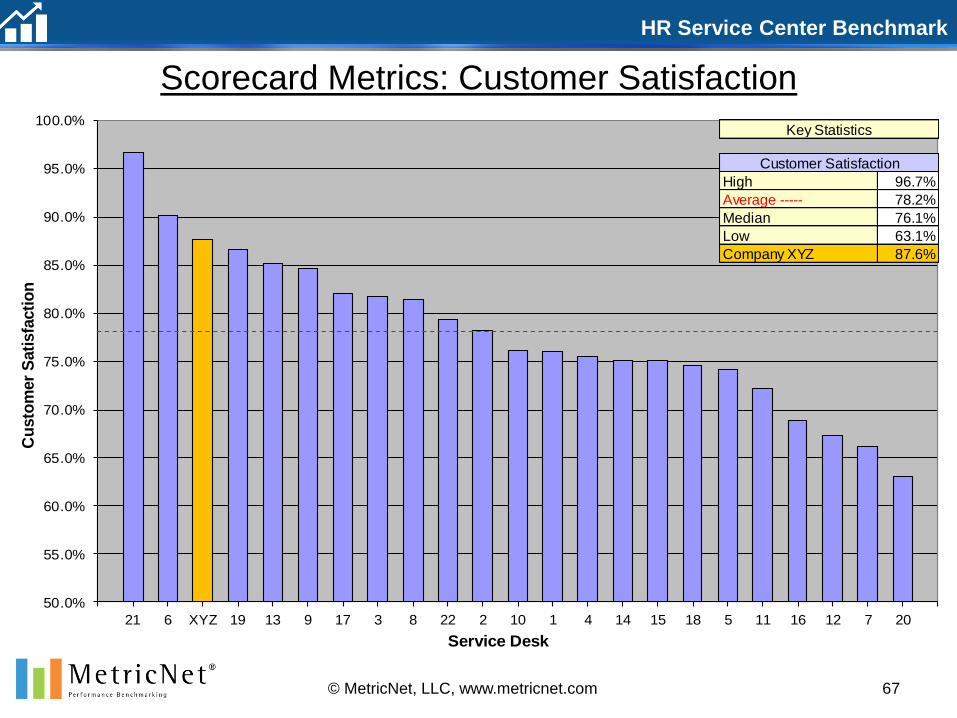
67© MetricNet, LLC, www.metricnet.com
Scorecard Metrics: Customer Satisfaction
High 96.7%
Average ----- 78.2%
Median 76.1%
Low 63.1%
Company XYZ 87.6%
Key Statistics
Customer Satisfaction
HR Service Center Benchmark
20.0%
25.0%
30.0%
35.0%
40.0%
45.0%
50.0%
55.0%
60.0%
65.0%
12 11 3 22 XYZ 18 7 14 9 6 16 10 13 5 1 20 19 17 2 8 21 15 4
Tech
nic
ian
Uti
lizati
on
Service Desk
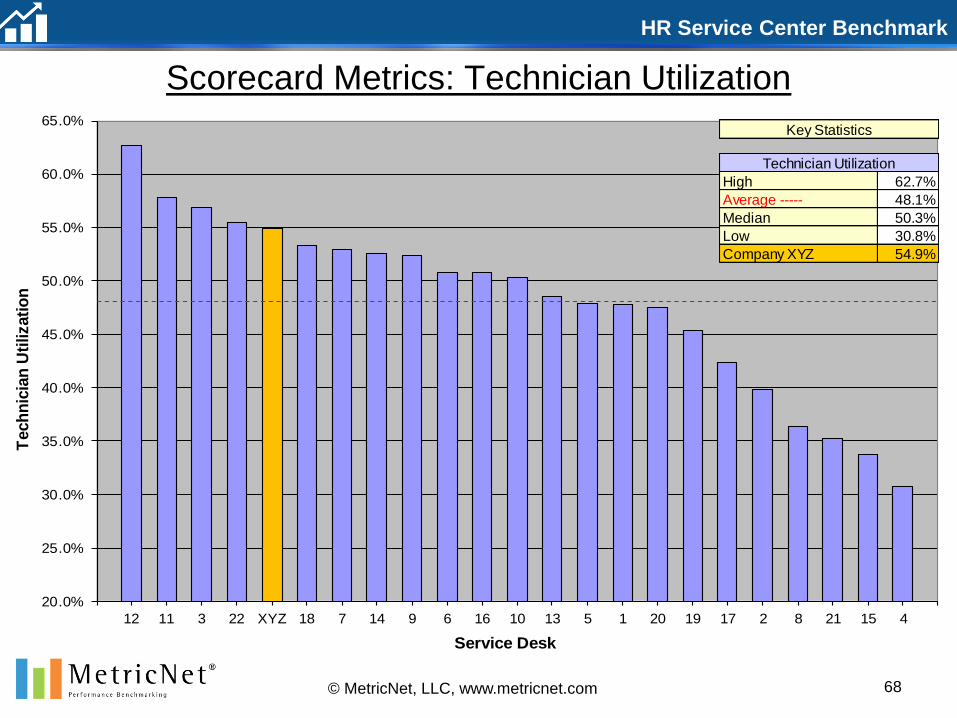
68© MetricNet, LLC, www.metricnet.com
Scorecard Metrics: Technician Utilization
High 62.7%
Average ----- 48.1%
Median 50.3%
Low 30.8%
Company XYZ 54.9%
Key Statistics
Technician Utilization
HR Service Center Benchmark
45.0%
50.0%
55.0%
60.0%
65.0%
70.0%
75.0%
80.0%
85.0%
90.0%
95.0%
6 21 13 8 15 4 22 7 14 3 18 5 2 20 19 9 10 16 1 17 11 12 XYZ
Fir
st
Co
nta
ct
Reso
luti
on
Rate
Service Desk
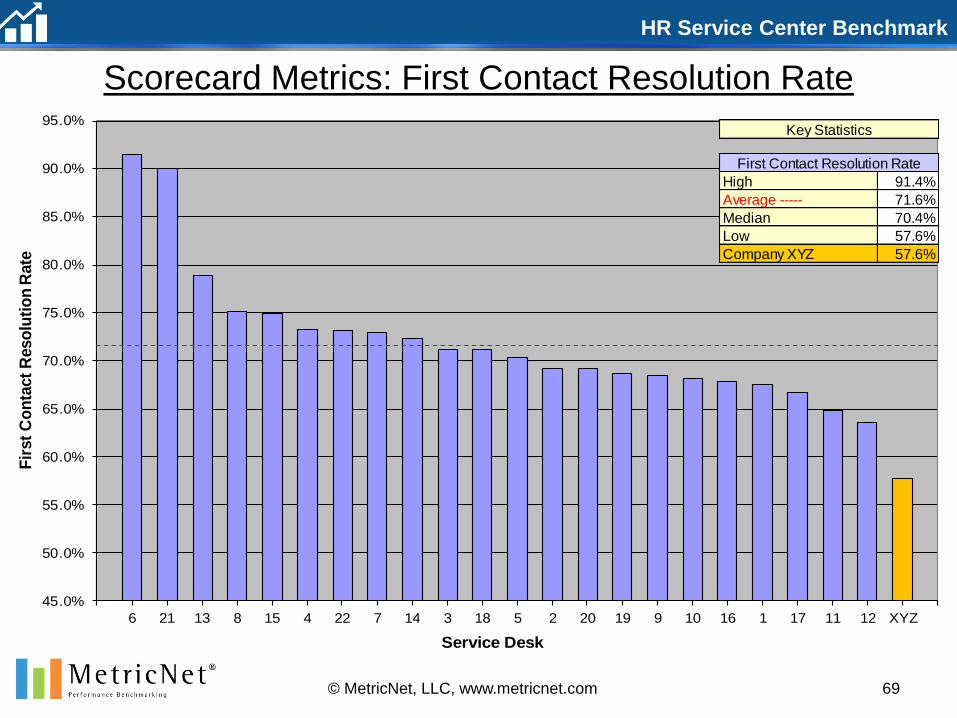
69© MetricNet, LLC, www.metricnet.com
Scorecard Metrics: First Contact Resolution Rate
High 91.4%
Average ----- 71.6%
Median 70.4%
Low 57.6%
Company XYZ 57.6%
Key Statistics
First Contact Resolution Rate

HR Service Center Benchmark
70© MetricNet, LLC, www.metricnet.com
Scorecard Metrics: Technician Job Satisfaction
50.0%
55.0%
60.0%
65.0%
70.0%
75.0%
80.0%
85.0%
90.0%
95.0%
100.0%
XYZ 21 6 15 13 4 9 14 10 22 17 3 8 1 7 5 18 2 20 16 12 19 11
Tech
nic
ian
Jo
b S
ati
sfa
cti
on
Sevice Desk
High 99.0%
Average ----- 70.3%
Median 66.8%
Low 53.3%
Company XYZ 99.0%
Key Statistics
Technician Job Satisfaction
HR Service Center Benchmark
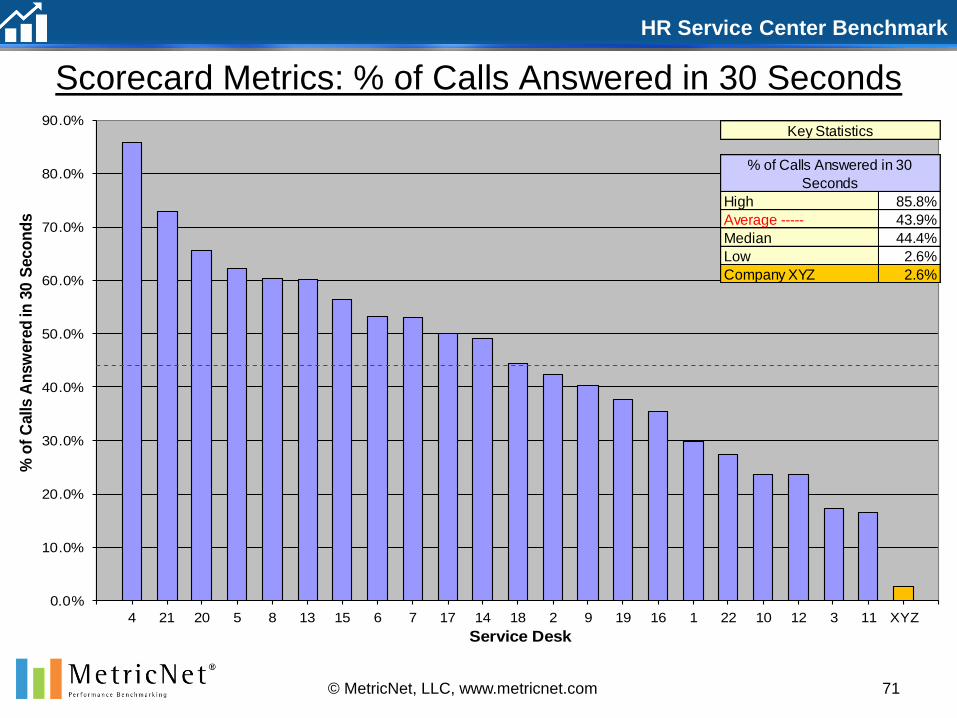
71© MetricNet, LLC, www.metricnet.com
Scorecard Metrics: % of Calls Answered in 30 Seconds
0.0%
10.0%
20.0%
30.0%
40.0%
50.0%
60.0%
70.0%
80.0%
90.0%
4 21 20 5 8 13 15 6 7 17 14 18 2 9 19 16 1 22 10 12 3 11 XYZ
% o
f C
alls A
nsw
ere
d in
30 S
eco
nd
s
Service Desk
High 85.8%
Average ----- 43.9%
Median 44.4%
Low 2.6%
Company XYZ 2.6%
Key Statistics
% of Calls Answered in 30
Seconds
HR Service Center Benchmark
72
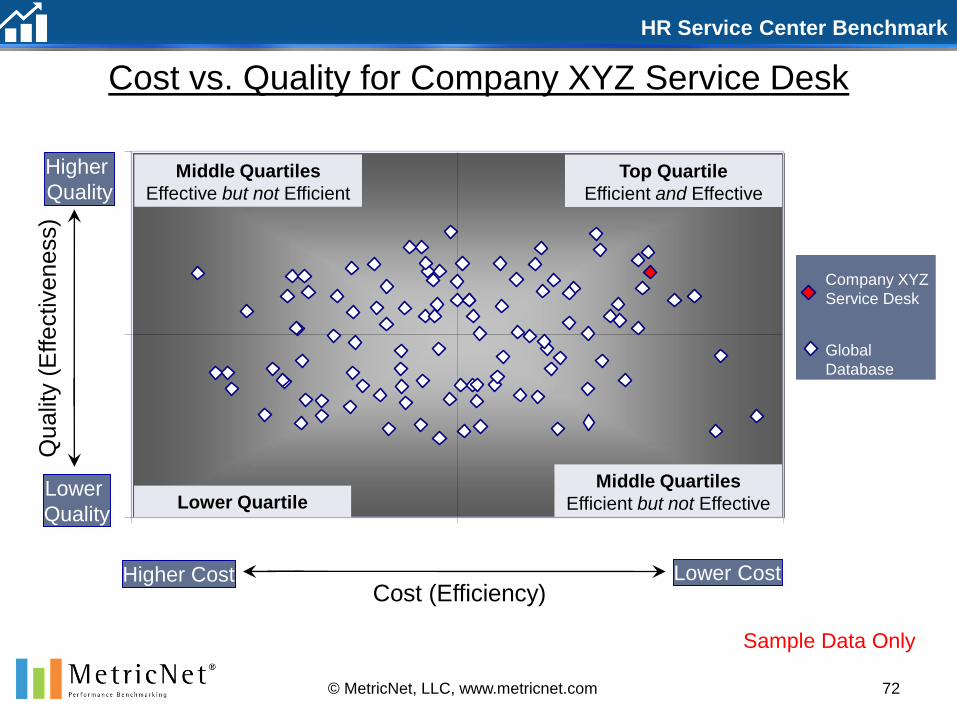
Cost vs. Quality for Company XYZ Service Desk
© MetricNet, LLC, www.metricnet.com
Company XYZ
Service Desk
Global
Database
Lower CostCost (Efficiency)
Qualit
y (
Effectiveness)
Top Quartile
Efficient and Effective
Lower Quartile
Middle Quartiles
Effective but not Efficient
Middle Quartiles
Efficient but not Effective
Higher Cost
Lower
Quality
Higher
Quality
Sample Data Only

Best Practices Process Assessment
73
Company
XYZ
HR Service Center Benchmark
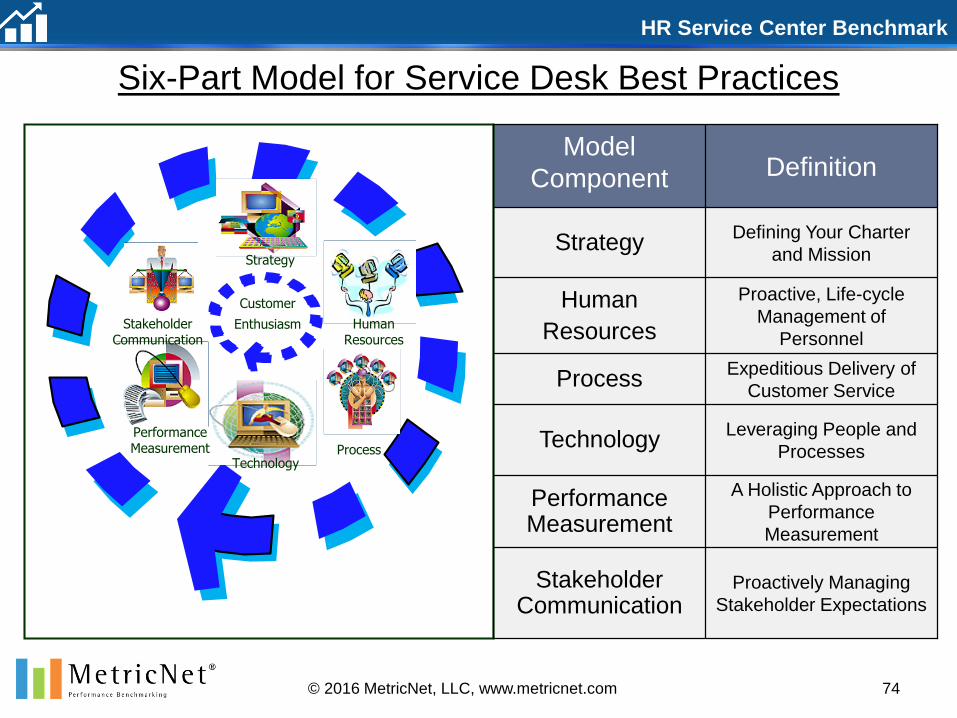
Six-Part Model for Service Desk Best Practices
Proactively Managing
Stakeholder Expectations
Stakeholder Communication
A Holistic Approach to
Performance
Measurement
Performance Measurement
Leveraging People and
ProcessesTechnology
Expeditious Delivery of
Customer ServiceProcess
Proactive, Life-cycle
Management of
Personnel
Human
Resources
Defining Your Charter
and MissionStrategy
DefinitionModel
Component
Customer
Enthusiasm
Strategy
Human Resources
ProcessTechnology
PerformanceMeasurement
Stakeholder Communication
74© 2016 MetricNet, LLC, www.metricnet.com

HR Service Center Benchmark
Ranking Explanation
1 No Knowledge of the Best Practice.
2 Aware of the Best Practice, but not applying it.
3 Aware of the Best Practice, and applying at a rudimentary level.
4 Best Practice is being effectively applied.
5 Best Practice is being applied in a world-class fashion.
Best Practices Evaluation Criteria
75© 2016 MetricNet, LLC, www.metricnet.com
HR Service Center Benchmark
76
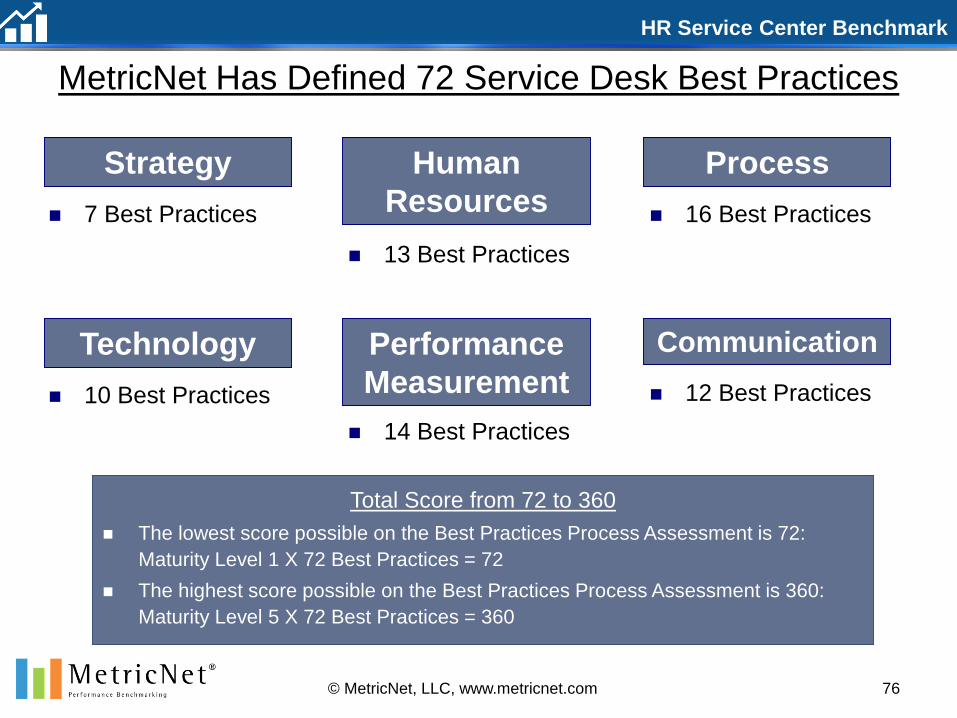
MetricNet Has Defined 72 Service Desk Best Practices
7 Best Practices
Strategy Process
Performance
Measurement
Human
Resources
CommunicationTechnology
14 Best Practices
16 Best Practices
13 Best Practices
10 Best Practices 12 Best Practices
Total Score from 72 to 360
The lowest score possible on the Best Practices Process Assessment is 72:
Maturity Level 1 X 72 Best Practices = 72
The highest score possible on the Best Practices Process Assessment is 360:
Maturity Level 5 X 72 Best Practices = 360
© MetricNet, LLC, www.metricnet.com
HR Service Center Benchmark
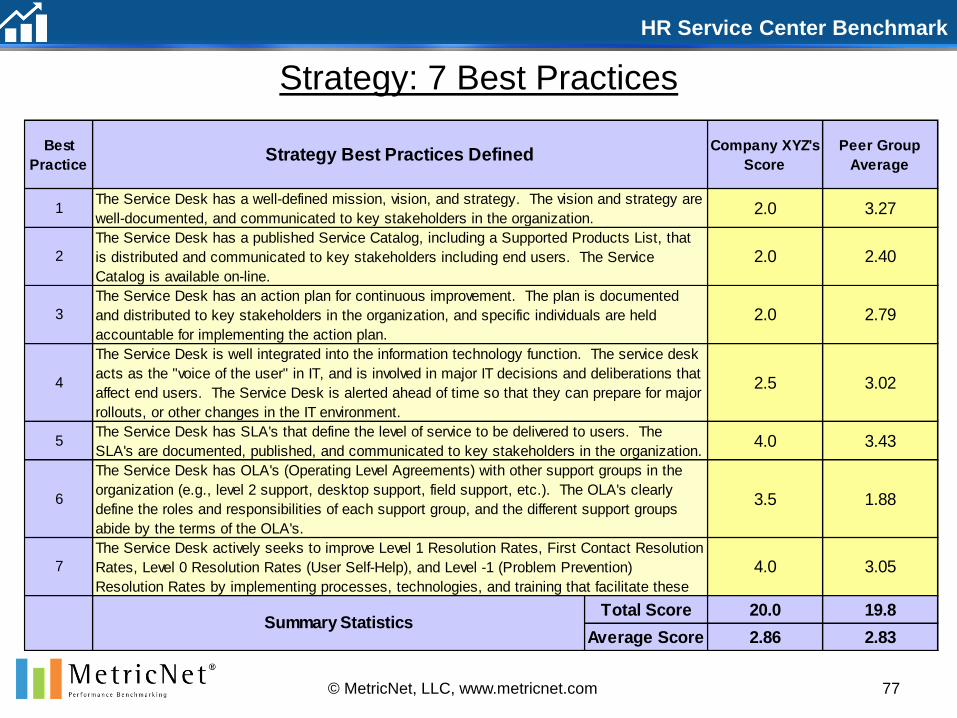
Strategy: 7 Best Practices
77© MetricNet, LLC, www.metricnet.com
Best
Practice
Company XYZ's
Score
Peer Group
Average
Total Score 20.0 19.8
Average Score 2.86 2.83Summary Statistics
3.02
3.272.01
2.792.03
2.402.02
The Service Desk actively seeks to improve Level 1 Resolution Rates, First Contact Resolution
Rates, Level 0 Resolution Rates (User Self-Help), and Level -1 (Problem Prevention)
Resolution Rates by implementing processes, technologies, and training that facilitate these
2.5
5
Strategy Best Practices Defined
The Service Desk has an action plan for continuous improvement. The plan is documented
and distributed to key stakeholders in the organization, and specific individuals are held
accountable for implementing the action plan.
The Service Desk is well integrated into the information technology function. The service desk
acts as the "voice of the user" in IT, and is involved in major IT decisions and deliberations that
affect end users. The Service Desk is alerted ahead of time so that they can prepare for major
rollouts, or other changes in the IT environment.
The Service Desk has a published Service Catalog, including a Supported Products List, that
is distributed and communicated to key stakeholders including end users. The Service
Catalog is available on-line.
The Service Desk has a well-defined mission, vision, and strategy. The vision and strategy are
well-documented, and communicated to key stakeholders in the organization.
4
6
4.0
The Service Desk has SLA's that define the level of service to be delivered to users. The
SLA's are documented, published, and communicated to key stakeholders in the organization.4.0
3.5
The Service Desk has OLA's (Operating Level Agreements) with other support groups in the
organization (e.g., level 2 support, desktop support, field support, etc.). The OLA's clearly
define the roles and responsibilities of each support group, and the different support groups
abide by the terms of the OLA's.
7
3.43
1.88
3.05
HR Service Center Benchmark
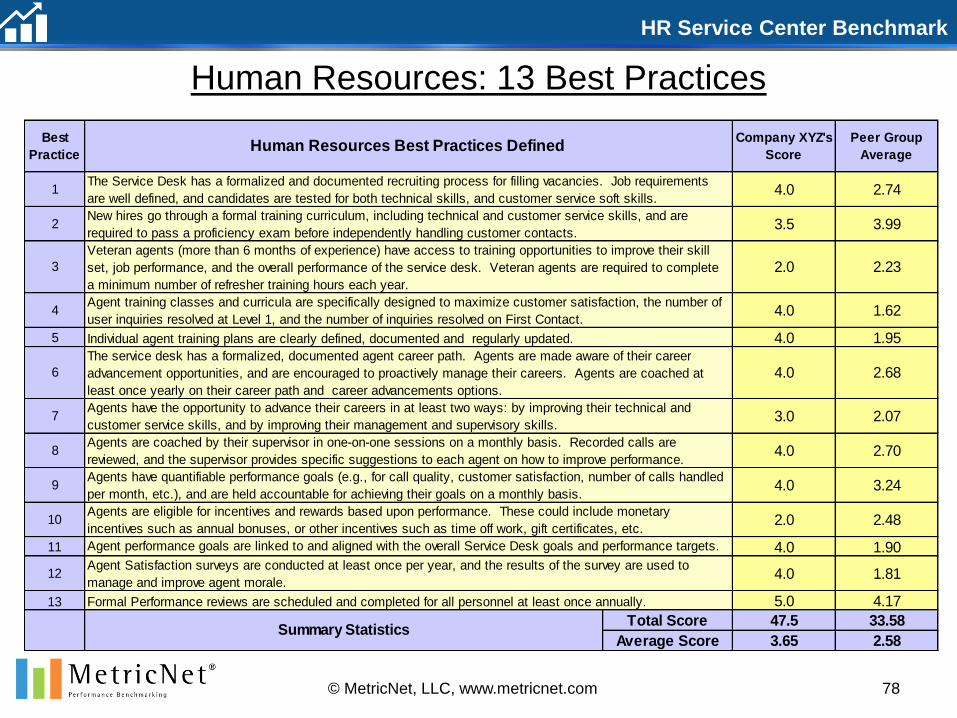
Human Resources: 13 Best Practices
78© MetricNet, LLC, www.metricnet.com
Best
Practice
Company XYZ's
Score
Peer Group
Average
5 4.0 1.95
11 4.0 1.90
13 5.0 4.17
Total Score 47.5 33.58
Average Score 3.65 2.58
8
7
6
3.5
2.0
4.0
4.0
3.0
New hires go through a formal training curriculum, including technical and customer service skills, and are
required to pass a proficiency exam before independently handling customer contacts.
1
2
3
Agent training classes and curricula are specifically designed to maximize customer satisfaction, the number of
user inquiries resolved at Level 1, and the number of inquiries resolved on First Contact.4 1.62
2.68
Human Resources Best Practices Defined
Veteran agents (more than 6 months of experience) have access to training opportunities to improve their skill
set, job performance, and the overall performance of the service desk. Veteran agents are required to complete
a minimum number of refresher training hours each year.
2.74
3.99
2.23
The Service Desk has a formalized and documented recruiting process for filling vacancies. Job requirements
are well defined, and candidates are tested for both technical skills, and customer service soft skills. 4.0
Individual agent training plans are clearly defined, documented and regularly updated.
2.07
The service desk has a formalized, documented agent career path. Agents are made aware of their career
advancement opportunities, and are encouraged to proactively manage their careers. Agents are coached at
least once yearly on their career path and career advancements options.
Agents are eligible for incentives and rewards based upon performance. These could include monetary
incentives such as annual bonuses, or other incentives such as time off work, gift certificates, etc.
Agents have quantifiable performance goals (e.g., for call quality, customer satisfaction, number of calls handled
per month, etc.), and are held accountable for achieving their goals on a monthly basis.
Agents have the opportunity to advance their careers in at least two ways: by improving their technical and
customer service skills, and by improving their management and supervisory skills.
Agents are coached by their supervisor in one-on-one sessions on a monthly basis. Recorded calls are
reviewed, and the supervisor provides specific suggestions to each agent on how to improve performance.
3.24
2.48
2.704.0
2.0
4.09
Summary Statistics
Formal Performance reviews are scheduled and completed for all personnel at least once annually.
Agent performance goals are linked to and aligned with the overall Service Desk goals and performance targets.
Agent Satisfaction surveys are conducted at least once per year, and the results of the survey are used to
manage and improve agent morale.12
10
1.814.0
HR Service Center Benchmark
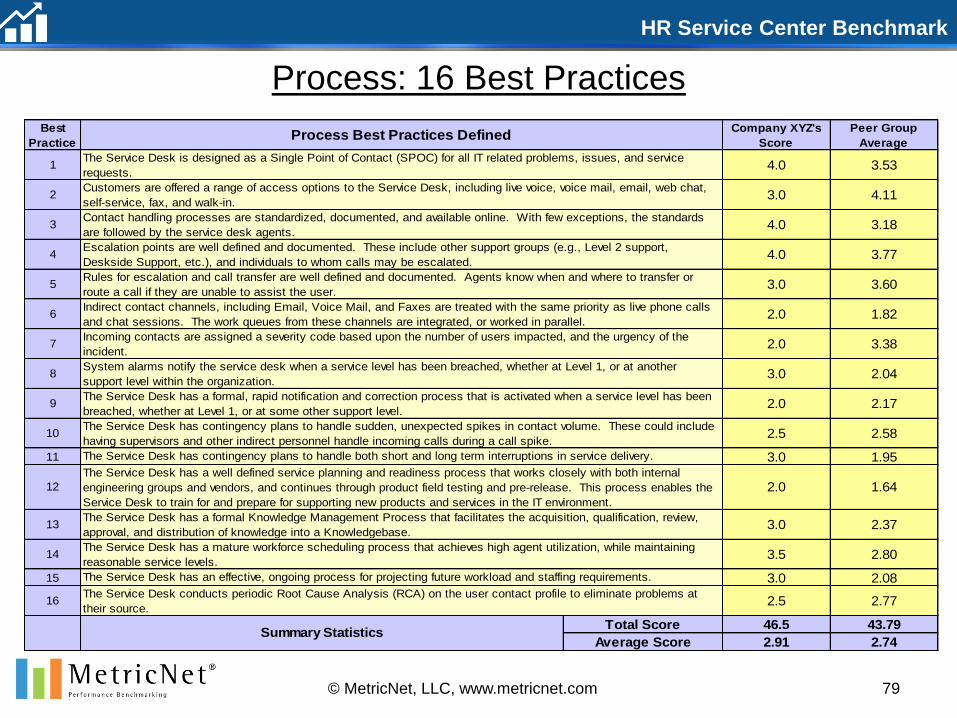
Process: 16 Best Practices
79© MetricNet, LLC, www.metricnet.com
Best
Practice
Company XYZ's
Score
Peer Group
Average
11 3.0 1.95
15 3.0 2.08
Total Score 46.5 43.79
Average Score 2.91 2.74
13
The Service Desk conducts periodic Root Cause Analysis (RCA) on the user contact profile to eliminate problems at
their source.
12
The Service Desk has a formal, rapid notification and correction process that is activated when a service level has been
breached, whether at Level 1, or at some other support level.2.0
4.0
3.0
2.0
Rules for escalation and call transfer are well defined and documented. Agents know when and where to transfer or
route a call if they are unable to assist the user.
7
16
8
The Service Desk has contingency plans to handle sudden, unexpected spikes in contact volume. These could include
having supervisors and other indirect personnel handle incoming calls during a call spike.
9
10
3
4
Incoming contacts are assigned a severity code based upon the number of users impacted, and the urgency of the
incident.
2.0
3.0
Contact handling processes are standardized, documented, and available online. With few exceptions, the standards
are followed by the service desk agents.
Escalation points are well defined and documented. These include other support groups (e.g., Level 2 support,
Deskside Support, etc.), and individuals to whom calls may be escalated.
Indirect contact channels, including Email, Voice Mail, and Faxes are treated with the same priority as live phone calls
and chat sessions. The work queues from these channels are integrated, or worked in parallel.
3.0
2.0
2.5
System alarms notify the service desk when a service level has been breached, whether at Level 1, or at another
support level within the organization.
6
5
1 4.0
2
4.0
3.0Customers are offered a range of access options to the Service Desk, including live voice, voice mail, email, web chat,
self-service, fax, and walk-in.
3.38
2.04
Process Best Practices Defined
14 3.5
The Service Desk is designed as a Single Point of Contact (SPOC) for all IT related problems, issues, and service
requests.
The Service Desk has contingency plans to handle both short and long term interruptions in service delivery.
The Service Desk has a well defined service planning and readiness process that works closely with both internal
engineering groups and vendors, and continues through product field testing and pre-release. This process enables the
Service Desk to train for and prepare for supporting new products and services in the IT environment.
The Service Desk has a formal Knowledge Management Process that facilitates the acquisition, qualification, review,
approval, and distribution of knowledge into a Knowledgebase.
The Service Desk has a mature workforce scheduling process that achieves high agent utilization, while maintaining
reasonable service levels.
3.53
4.11
3.18
3.77
3.60
1.82
2.17
2.58
2.80
2.77
Summary Statistics
The Service Desk has an effective, ongoing process for projecting future workload and staffing requirements.
2.5
1.64
2.37

HR Service Center Benchmark
Technology: 10 Best Practices
80© MetricNet, LLC, www.metricnet.com
Best
Practice
Company XYZ's
Score
Peer Group
Average
9 2.0 1.45
Total Score 25.5 21.2
Average Score 2.55 2.12
2.5
2.0
1.83
2.5 1.66
1.59
The incident management system can track and monitor the skill levels of Service Desk agents based on closed
tickets by product and/or service code.
3.26
1.62
1.49
3.05
3.57
Summary Statistics
5
6
4.0
1.71
2.0
The Service Desk has a multi-year plan for an integrated technology strategy.
8The Service Desk uses technology alerts/alarms to notify the Service Desk or perform self healing scripts when a
customer or system issue is proactively identified.
1
Technology Best Practices Defined
The Service Desk utilizes a capital investment justification process based on ROI, and reports on post
installation ROI as part of this process.10
7
2
4
The Service Desk has a comprehensive knowledge management tool that facilitates effective knowledge capture
and re-use. Service desk agents are able to quickly find solutions to user problems by searching the knowledge
base. Solutions for the vast majority of user problems and questions can be found in the knowledge base.
3
The Service Desk has an effective, integrated self-service portal that is available to all users. The self-service
portal provides information, FAQ's, and solutions to problems that are more complex than simple password
resets. The tool includes a direct link to service desk technicians. Users are aware of the self-service portal,
and usage rates are continuously increasing.
The Service Desk has a full-featured incident management system that facilitates effective incident tracking,
service level compliance, reporting, and root cause analysis.
The Service Desk has an effective tool that allows agents to proxy into a user's computer, take control of the
computer, and remotely perform diagnostics and problem solving (e.g., Tivoli, Bomgar, GoTo Assist, etc.). The
tool increases both first contact and first level resolution rates, and reduces contact handle times.
The Service Desk has an Automated Password Reset (APR) capability that dramatically reduces the number of
password resets that must be performed manually by the Service Desk agents.
The Service Desk knowledgebase is used continuously by all Service Desk agents, and results in higher First
Contact and First Level Resolution Rates, and lower contact handle times. 2.5
4.0
1.0
3.0
HR Service Center Benchmark
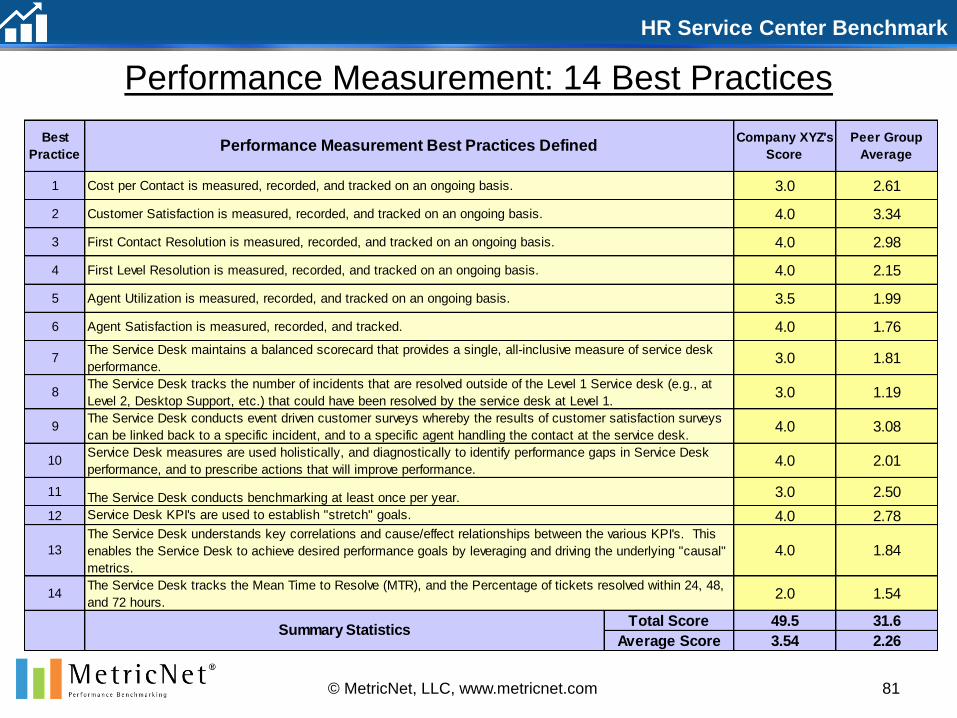
Performance Measurement: 14 Best Practices
81© MetricNet, LLC, www.metricnet.com
Best
Practice
Company XYZ's
Score
Peer Group
Average
1 3.0 2.61
2 4.0 3.34
3 4.0 2.98
4 4.0 2.15
5 3.5 1.99
6 4.0 1.76
11 3.0 2.50
12 4.0 2.78
Total Score 49.5 31.6
Average Score 3.54 2.26
Cost per Contact is measured, recorded, and tracked on an ongoing basis.
Performance Measurement Best Practices Defined
Customer Satisfaction is measured, recorded, and tracked on an ongoing basis.
First Contact Resolution is measured, recorded, and tracked on an ongoing basis.
First Level Resolution is measured, recorded, and tracked on an ongoing basis.
The Service Desk tracks the number of incidents that are resolved outside of the Level 1 Service desk (e.g., at
Level 2, Desktop Support, etc.) that could have been resolved by the service desk at Level 1.
Agent Satisfaction is measured, recorded, and tracked.
Agent Utilization is measured, recorded, and tracked on an ongoing basis.
Service Desk KPI's are used to establish "stretch" goals.
4.0
The Service Desk understands key correlations and cause/effect relationships between the various KPI's. This
enables the Service Desk to achieve desired performance goals by leveraging and driving the underlying "causal"
metrics.
Service Desk measures are used holistically, and diagnostically to identify performance gaps in Service Desk
performance, and to prescribe actions that will improve performance.
The Service Desk maintains a balanced scorecard that provides a single, all-inclusive measure of service desk
performance.
3.0
The Service Desk conducts event driven customer surveys whereby the results of customer satisfaction surveys
can be linked back to a specific incident, and to a specific agent handling the contact at the service desk.
1.54
Summary Statistics
1.84
8
4.0
1.81
1.19
The Service Desk conducts benchmarking at least once per year.
10
3.08
2.01
9 4.0
7
13
The Service Desk tracks the Mean Time to Resolve (MTR), and the Percentage of tickets resolved within 24, 48,
and 72 hours.2.014
3.0
HR Service Center Benchmark
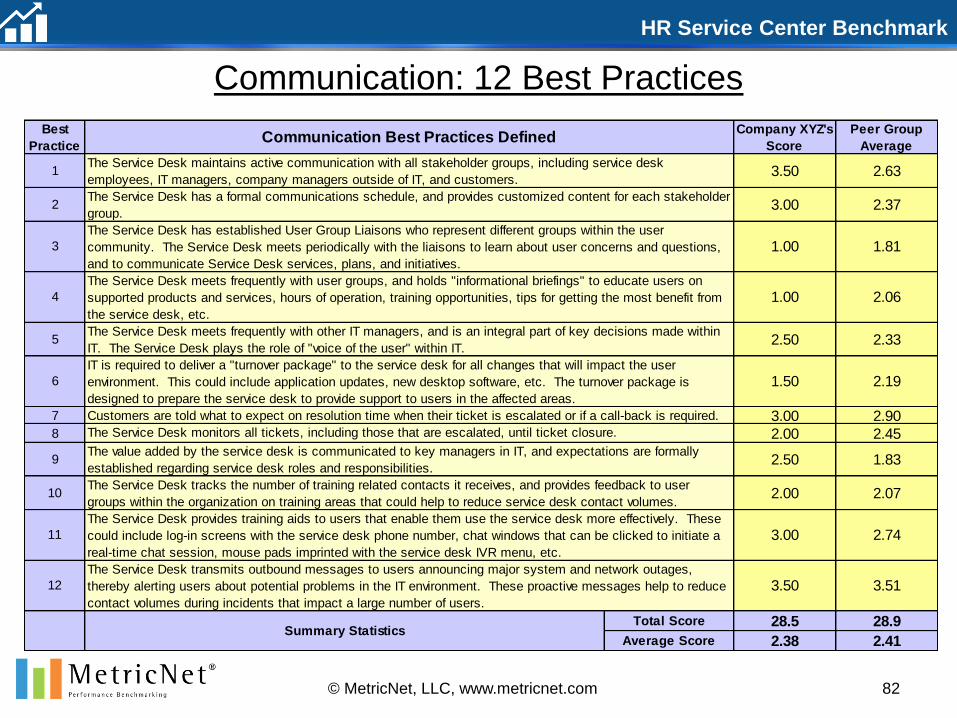
Communication: 12 Best Practices
82© MetricNet, LLC, www.metricnet.com
Best
Practice
Company XYZ's
Score
Peer Group
Average
7 3.00 2.908 2.00 2.45
Total Score 28.5 28.9
Average Score 2.38 2.41
The Service Desk monitors all tickets, including those that are escalated, until ticket closure.
The Service Desk provides training aids to users that enable them use the service desk more effectively. These
could include log-in screens with the service desk phone number, chat windows that can be clicked to initiate a
real-time chat session, mouse pads imprinted with the service desk IVR menu, etc.
6
4
Communication Best Practices Defined
5
The Service Desk meets frequently with user groups, and holds "informational briefings" to educate users on
supported products and services, hours of operation, training opportunities, tips for getting the most benefit from
the service desk, etc.
The Service Desk meets frequently with other IT managers, and is an integral part of key decisions made within
IT. The Service Desk plays the role of "voice of the user" within IT.
9
10
Customers are told what to expect on resolution time when their ticket is escalated or if a call-back is required.
3
1
2
The Service Desk maintains active communication with all stakeholder groups, including service desk
employees, IT managers, company managers outside of IT, and customers.
The Service Desk has a formal communications schedule, and provides customized content for each stakeholder
group.
3.50
1.83
1.00
The Service Desk has established User Group Liaisons who represent different groups within the user
community. The Service Desk meets periodically with the liaisons to learn about user concerns and questions,
and to communicate Service Desk services, plans, and initiatives.
1.00
3.00
2.50
1.50IT is required to deliver a "turnover package" to the service desk for all changes that will impact the user
environment. This could include application updates, new desktop software, etc. The turnover package is
designed to prepare the service desk to provide support to users in the affected areas.
The value added by the service desk is communicated to key managers in IT, and expectations are formally
established regarding service desk roles and responsibilities.2.50
2.63
2.37
1.81
2.06
2.33
2.19
11 3.00
2.07
2.74
3.51
Summary Statistics
2.00The Service Desk tracks the number of training related contacts it receives, and provides feedback to user
groups within the organization on training areas that could help to reduce service desk contact volumes.
The Service Desk transmits outbound messages to users announcing major system and network outages,
thereby alerting users about potential problems in the IT environment. These proactive messages help to reduce
contact volumes during incidents that impact a large number of users.
3.5012
HR Service Center Benchmark
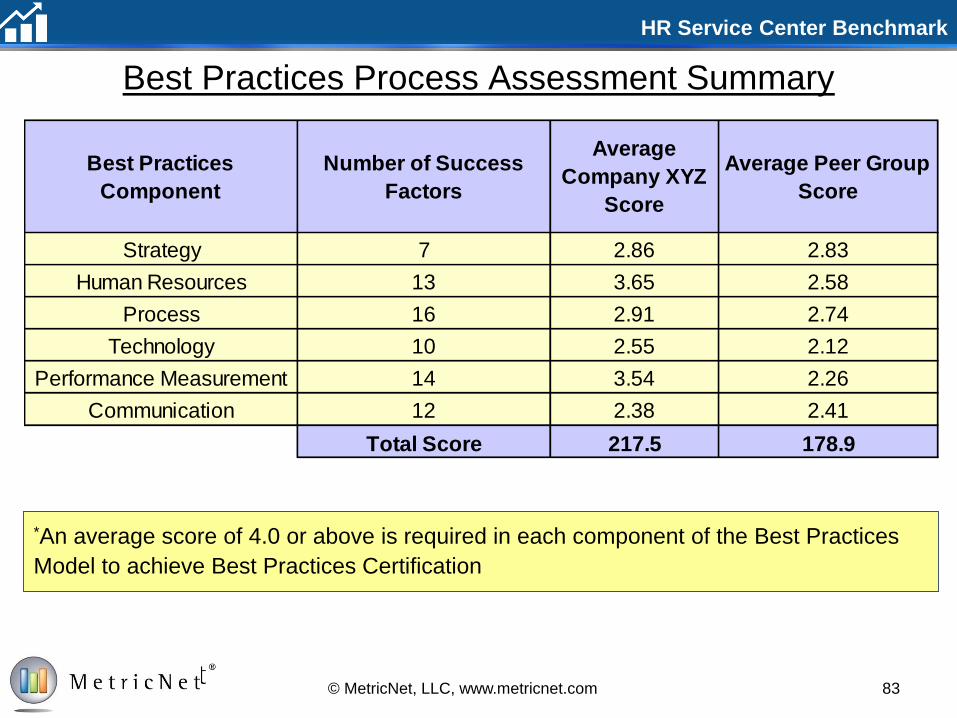
Best Practices Process Assessment Summary
83© MetricNet, LLC, www.metricnet.com
*An average score of 4.0 or above is required in each component of the Best Practices
Model to achieve Best Practices Certification
Best Practices
Component
Number of Success
Factors
Average
Company XYZ
Score
Average Peer Group
Score
Strategy 7 2.86 2.83
Human Resources 13 3.65 2.58
Process 16 2.91 2.74
Technology 10 2.55 2.12
Performance Measurement 14 3.54 2.26
Communication 12 2.38 2.41
Total Score 217.5 178.9

HR Service Center Benchmark
84© MetricNet, LLC, www.metricnet.com
Best Practices Process Assessment Summary
2.86
3.65
2.91
2.55
3.54
2.38
2.83
2.582.74
2.122.26
2.41
0.0
0.5
1.0
1.5
2.0
2.5
3.0
3.5
4.0
Av
era
ge
Sc
ore
Company XYZ
Peer Group
HR Service Center Benchmark
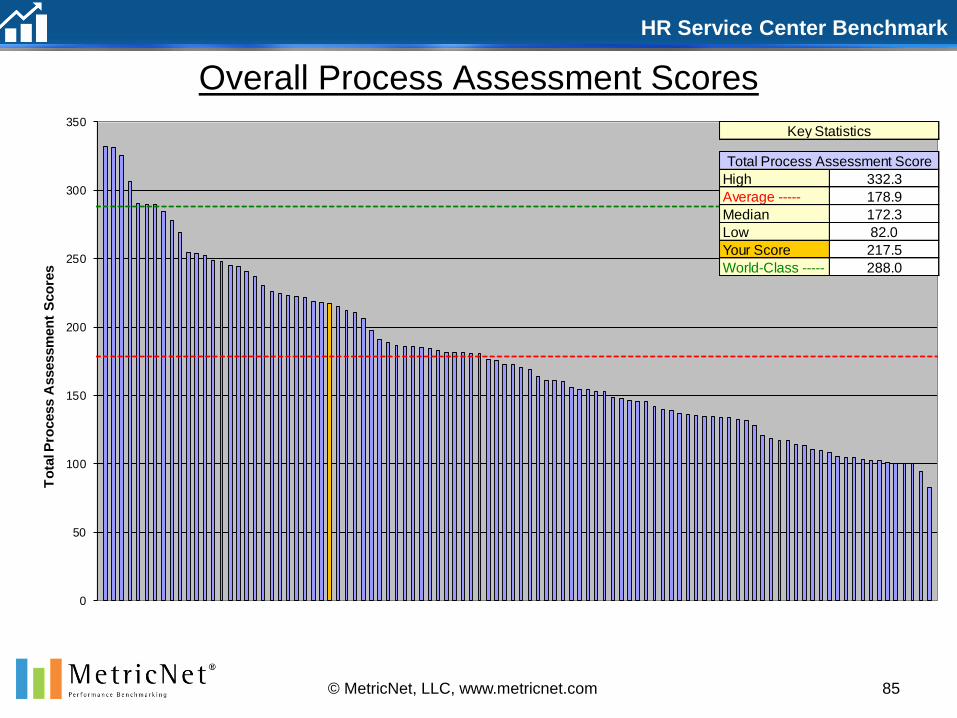
Overall Process Assessment Scores
85© MetricNet, LLC, www.metricnet.com
0
50
100
150
200
250
300
350
To
tal P
rocess A
ssessm
en
t S
co
res
High 332.3
Average ----- 178.9
Median 172.3
Low 82.0
Your Score 217.5
World-Class ----- 288.0
Key Statistics
Total Process Assessment Score
HR Service Center Benchmark
0%
10%
20%
30%
40%
50%
60%
70%
80%
90%
100%
0 50 100 150 200 250 300 350
Bala
nced
Sco
re
Process Assessment Score
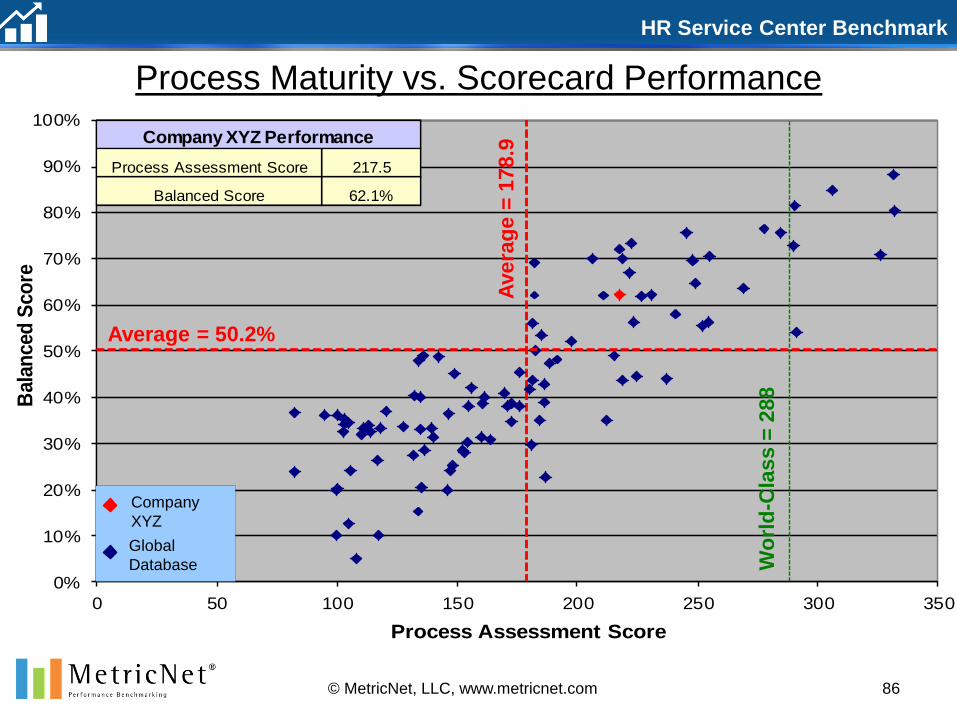
Process Maturity vs. Scorecard Performance
86© MetricNet, LLC, www.metricnet.com
Company
XYZ
Global
Database
Average = 50.2%
Avera
ge =
178.9
Wo
rld
-Cla
ss =
288
Process Assessment Score 217.5
Balanced Score 62.1%
Company XYZ Performance
87© MetricNet, LLC, www.metricnet.com
Conclusions and
Recommendations
Company
XYZ

HR Service Center Benchmark
88© MetricNet, LLC, www.metricnet.com
Notable Strengths
Costs are low
Cost per Inbound Contact, Cost per Minute of Handle Time, and the Price paid to PC Helps are in the top
two quartiles
Customer Satisfaction is in the top quartile
Customer Satisfaction is the most important measure of quality
Technician Utilization is well above average
This is a key driver of Company XYZ’s low costs
Technician Job Satisfaction is the highest in the benchmark!
This has a positive impact on many other metrics in the service desk
Company XYZ scored above average on the Best Practices Process Assessment
Company XYZ performed well above average on the benchmark
Company XYZ placed 5th out of 23 service desks on the Balanced Scorecard
First quartile performance overall!
The Company XYZ Service Desk has a number of notable strengths.
HR Service Center Benchmark
89© MetricNet, LLC, www.metricnet.com
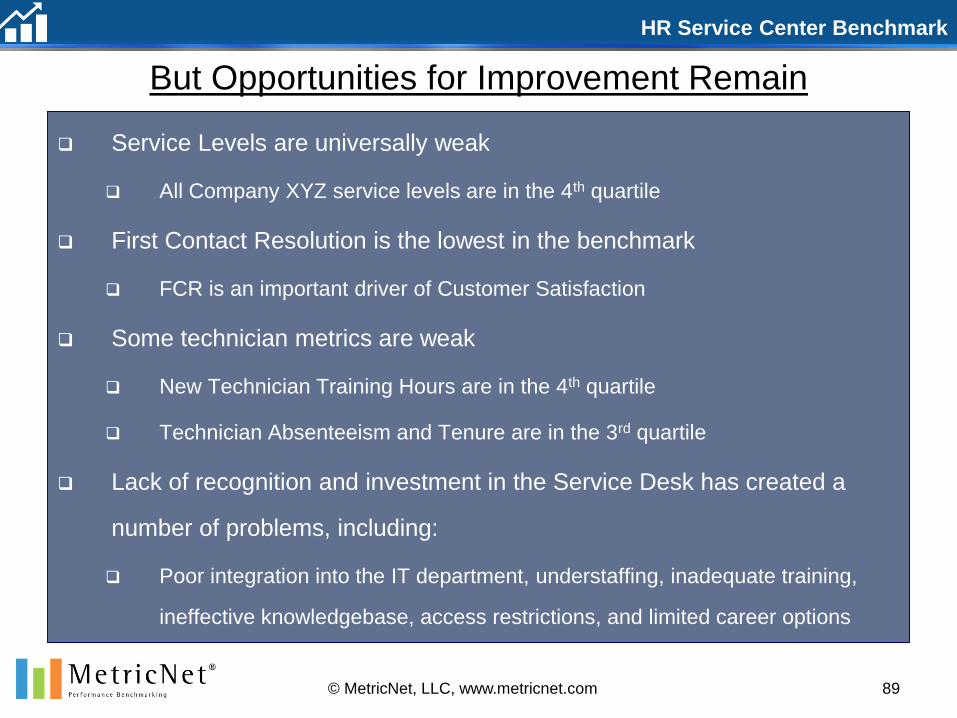
But Opportunities for Improvement Remain
Service Levels are universally weak
All Company XYZ service levels are in the 4th quartile
First Contact Resolution is the lowest in the benchmark
FCR is an important driver of Customer Satisfaction
Some technician metrics are weak
New Technician Training Hours are in the 4th quartile
Technician Absenteeism and Tenure are in the 3rd quartile
Lack of recognition and investment in the Service Desk has created a
number of problems, including:
Poor integration into the IT department, understaffing, inadequate training,
ineffective knowledgebase, access restrictions, and limited career options
HR Service Center Benchmark
90© MetricNet, LLC, www.metricnet.com
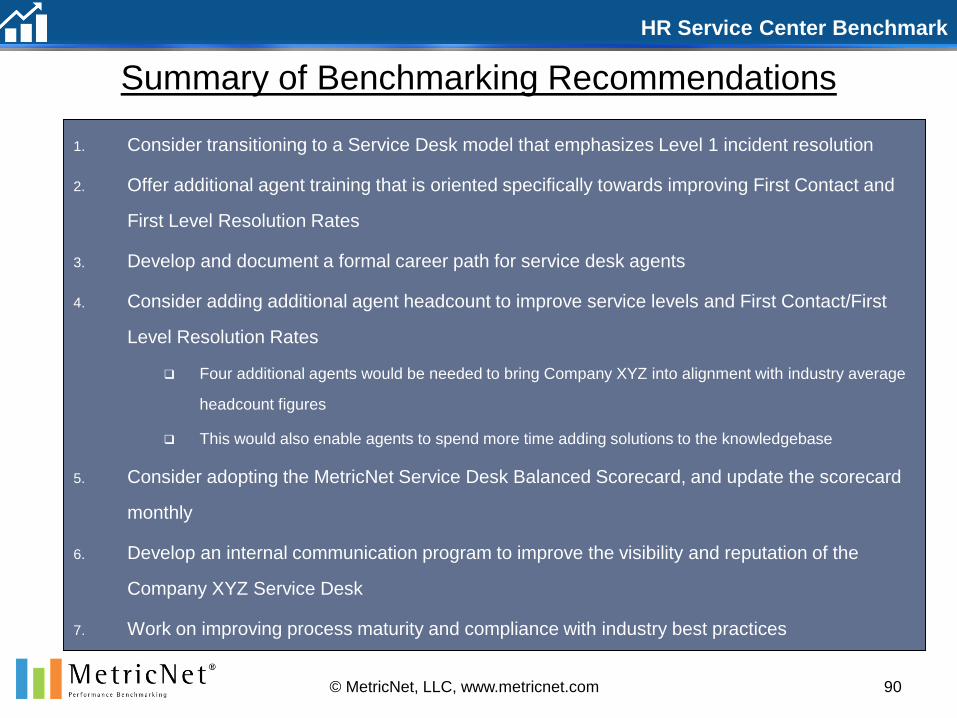
Summary of Benchmarking Recommendations
1. Consider transitioning to a Service Desk model that emphasizes Level 1 incident resolution
2. Offer additional agent training that is oriented specifically towards improving First Contact and
First Level Resolution Rates
3. Develop and document a formal career path for service desk agents
4. Consider adding additional agent headcount to improve service levels and First Contact/First
Level Resolution Rates
Four additional agents would be needed to bring Company XYZ into alignment with industry average
headcount figures
This would also enable agents to spend more time adding solutions to the knowledgebase
5. Consider adopting the MetricNet Service Desk Balanced Scorecard, and update the scorecard
monthly
6. Develop an internal communication program to improve the visibility and reputation of the
Company XYZ Service Desk
7. Work on improving process maturity and compliance with industry best practices
HR Service Center Benchmark
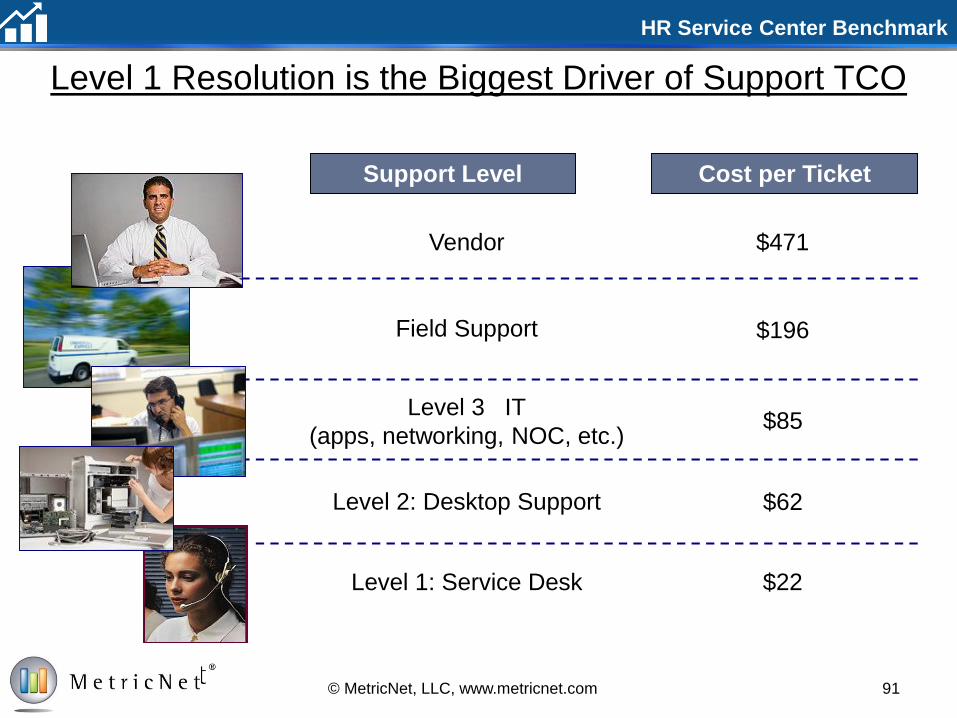
Level 1 Resolution is the Biggest Driver of Support TCO
Support Level Cost per Ticket
Vendor
Level 2: Desktop Support
Field Support
Level 3 IT
(apps, networking, NOC, etc.)
Level 1: Service Desk
$471
$196
$85
$62
$22
© MetricNet, LLC, www.metricnet.com 91
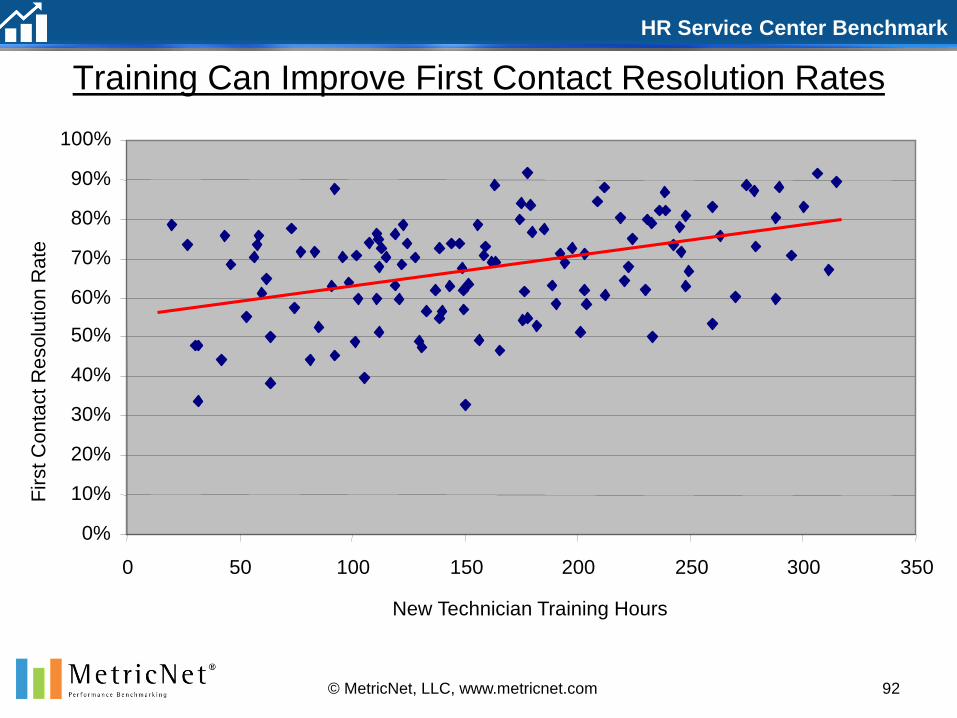
HR Service Center Benchmark
0%
10%
20%
30%
40%
50%
60%
70%
80%
90%
100%
0 50 100 150 200 250 300 350
New Technician Training Hours
Fir
st C
on
tact R
eso
lutio
n R
ate
Training Can Improve First Contact Resolution Rates
© MetricNet, LLC, www.metricnet.com 92
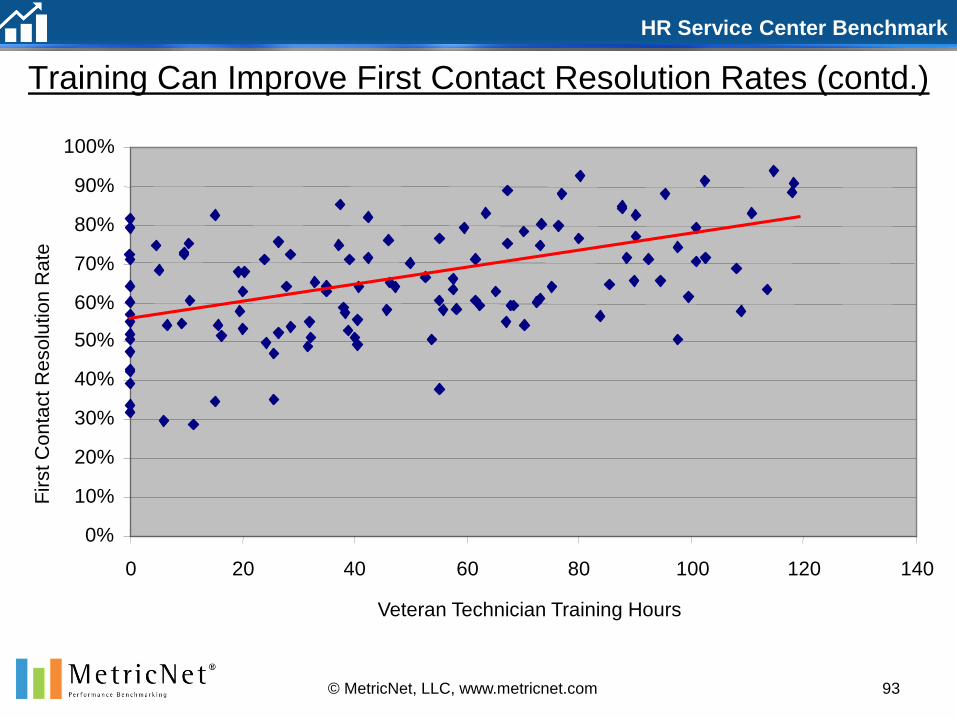
HR Service Center Benchmark
0%
10%
20%
30%
40%
50%
60%
70%
80%
90%
100%
0 20 40 60 80 100 120 140
Veteran Technician Training Hours
Fir
st C
on
tact R
eso
lutio
n R
ate
Training Can Improve First Contact Resolution Rates (contd.)
© MetricNet, LLC, www.metricnet.com 93
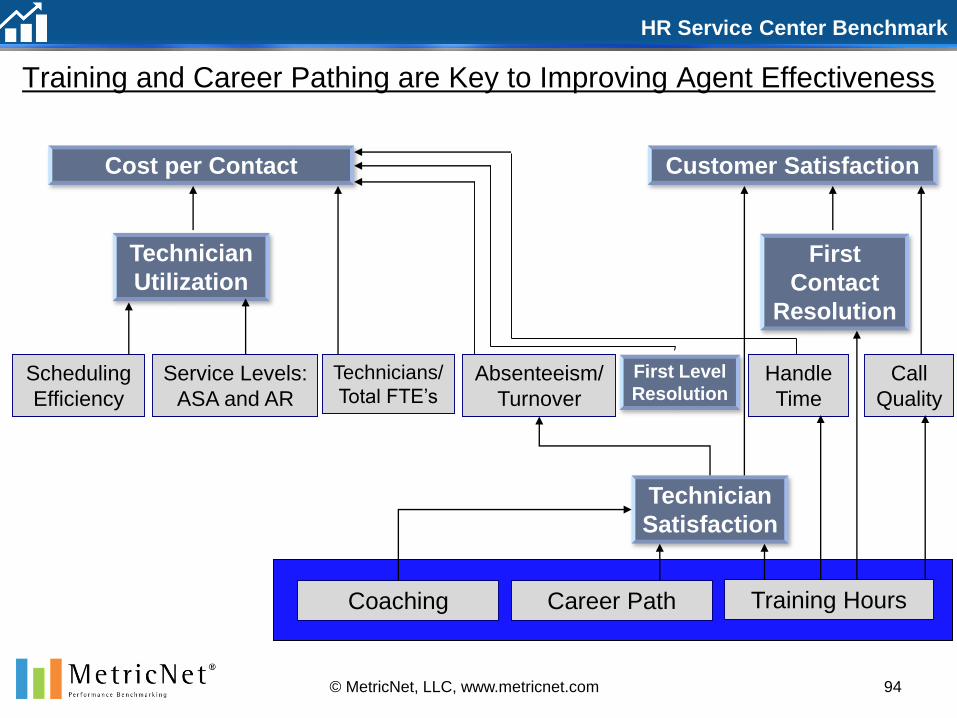
HR Service Center Benchmark
Training and Career Pathing are Key to Improving Agent Effectiveness
Cost per Contact Customer Satisfaction
Technician
UtilizationFirst
Contact
Resolution
Technician
Satisfaction
Coaching Career Path Training Hours
Call
Quality
Handle
Time
Technicians/
Total FTE’sAbsenteeism/
Turnover
First Level
ResolutionScheduling
Efficiency
Service Levels:
ASA and AR
94© MetricNet, LLC, www.metricnet.com
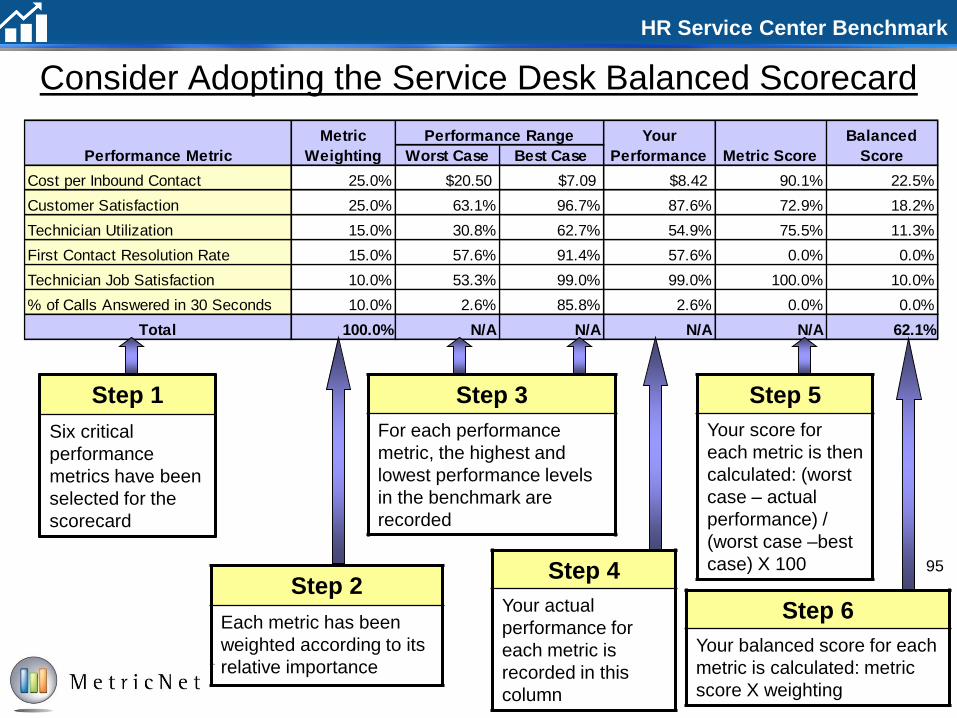
HR Service Center Benchmark
Worst Case Best Case
Cost per Inbound Contact 25.0% $20.50 $7.09 $8.42 90.1% 22.5%
Customer Satisfaction 25.0% 63.1% 96.7% 87.6% 72.9% 18.2%
Technician Utilization 15.0% 30.8% 62.7% 54.9% 75.5% 11.3%
First Contact Resolution Rate 15.0% 57.6% 91.4% 57.6% 0.0% 0.0%
Technician Job Satisfaction 10.0% 53.3% 99.0% 99.0% 100.0% 10.0%
% of Calls Answered in 30 Seconds 10.0% 2.6% 85.8% 2.6% 0.0% 0.0%
Total 100.0% N/A N/A N/A N/A 62.1%
Performance Metric
Metric
Weighting
Performance Range Your
Performance Metric Score
Balanced
Score
95© MetricNet, LLC, www.metricnet.com
Consider Adopting the Service Desk Balanced Scorecard
Step 1
Six critical
performance
metrics have been
selected for the
scorecard
Step 2
Each metric has been
weighted according to its
relative importance
Step 3
For each performance
metric, the highest and
lowest performance levels
in the benchmark are
recorded
Step 4
Your actual
performance for
each metric is
recorded in this
column
Step 5
Your score for
each metric is then
calculated: (worst
case – actual
performance) /
(worst case –best
case) X 100
Step 6
Your balanced score for each
metric is calculated: metric
score X weighting
95
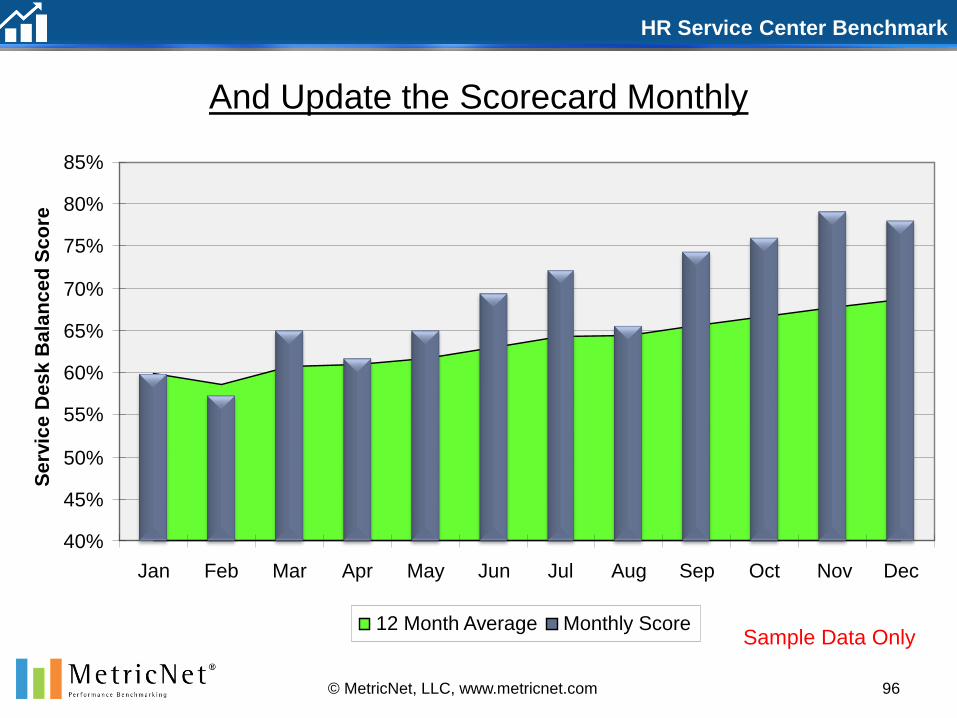
HR Service Center Benchmark
And Update the Scorecard Monthly
© MetricNet, LLC, www.metricnet.com 96
40%
45%
50%
55%
60%
65%
70%
75%
80%
85%
Jan Feb Mar Apr May Jun Jul Aug Sep Oct Nov Dec
Se
rvic
e D
es
k B
ala
nc
ed
Sc
ore
12 Month Average Monthly ScoreSample Data Only
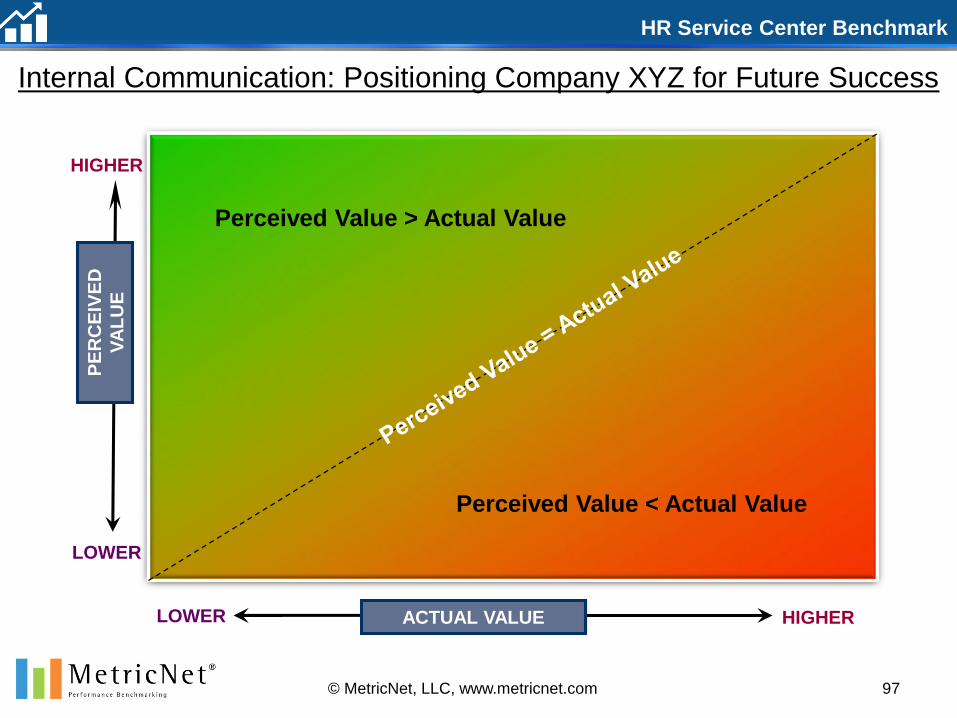
HR Service Center Benchmark
97© MetricNet, LLC, www.metricnet.com
Internal Communication: Positioning Company XYZ for Future Success
LOWER COST HIGHERACTUAL VALUE
PE
RC
EIV
ED
VA
LU
E
HIGHER
LOWER
Perceived Value > Actual Value
Perceived Value < Actual Value
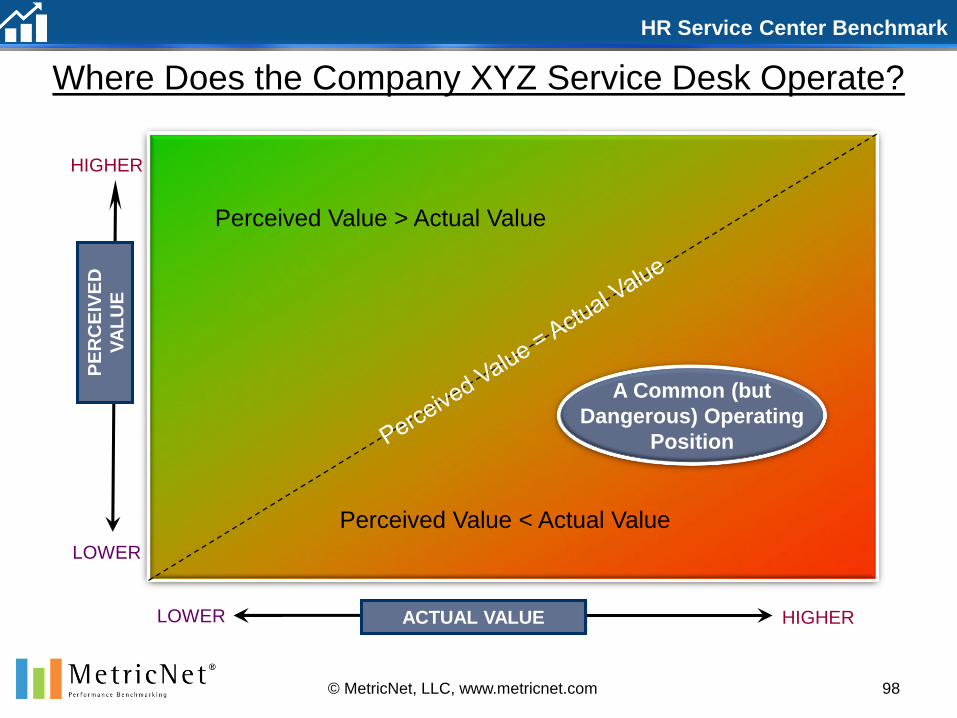
HR Service Center Benchmark
Where Does the Company XYZ Service Desk Operate?
LOWER COST HIGHERACTUAL VALUE
PE
RC
EIV
ED
VA
LU
E
HIGHER
LOWER
Perceived Value > Actual Value
Perceived Value < Actual Value
A Common (but
Dangerous) Operating
Position
98© MetricNet, LLC, www.metricnet.com

HR Service Center Benchmark
Operational Effectiveness First!
LOWER COST HIGHERACTUAL VALUE
PE
RC
EIV
ED
VA
LU
E
HIGHER
LOWER
Perceived Value > Actual Value
Perceived Value < Actual Value
#1 Operational
Effectiveness
#2 B
rand
Managem
ent
99© MetricNet, LLC, www.metricnet.com
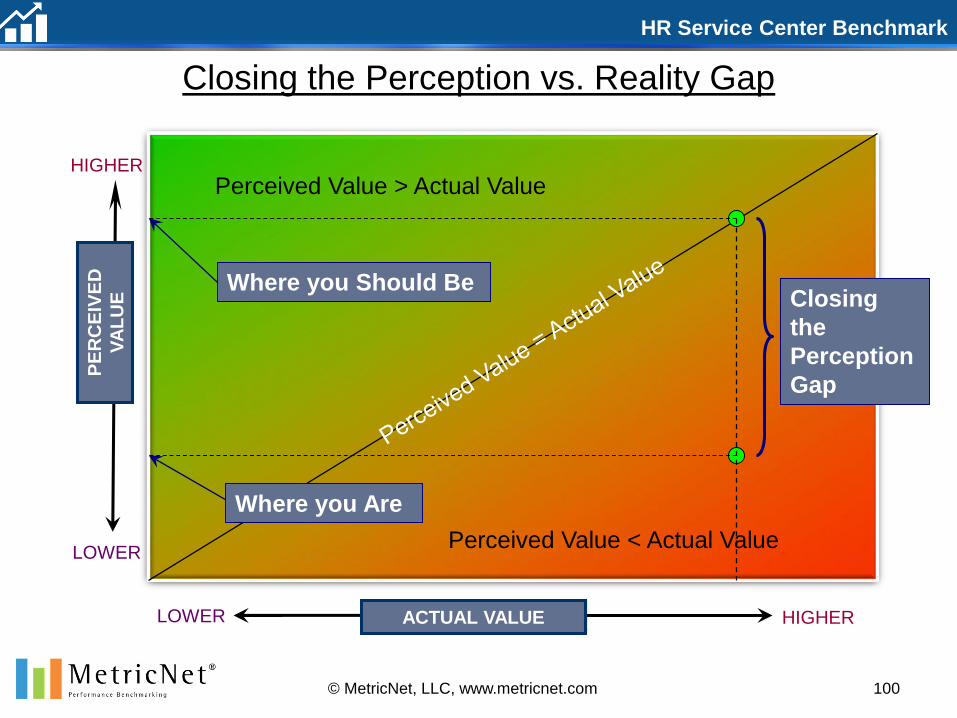
HR Service Center Benchmark
Closing the Perception vs. Reality Gap
LOWER COST HIGHERACTUAL VALUE
PE
RC
EIV
ED
VA
LU
E
HIGHER
LOWER
Perceived Value > Actual Value
Perceived Value < Actual Value
Closing
the
Perception
Gap
Where you Should Be
Where you Are
100© MetricNet, LLC, www.metricnet.com
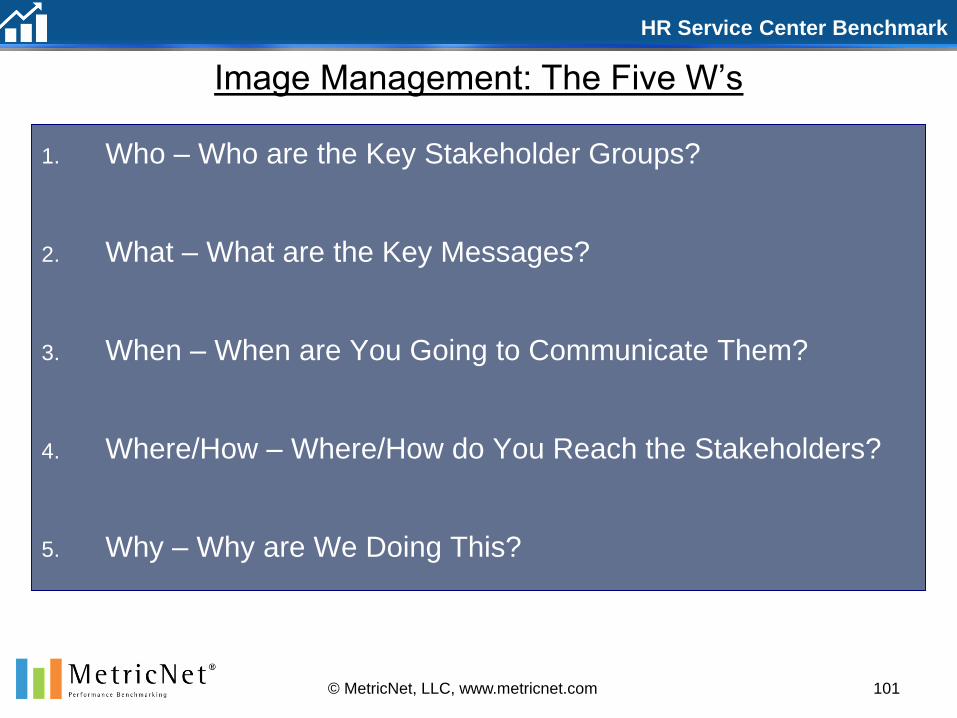
HR Service Center Benchmark
101© MetricNet, LLC, www.metricnet.com
Image Management: The Five W’s
1. Who – Who are the Key Stakeholder Groups?
2. What – What are the Key Messages?
3. When – When are You Going to Communicate Them?
4. Where/How – Where/How do You Reach the Stakeholders?
5. Why – Why are We Doing This?
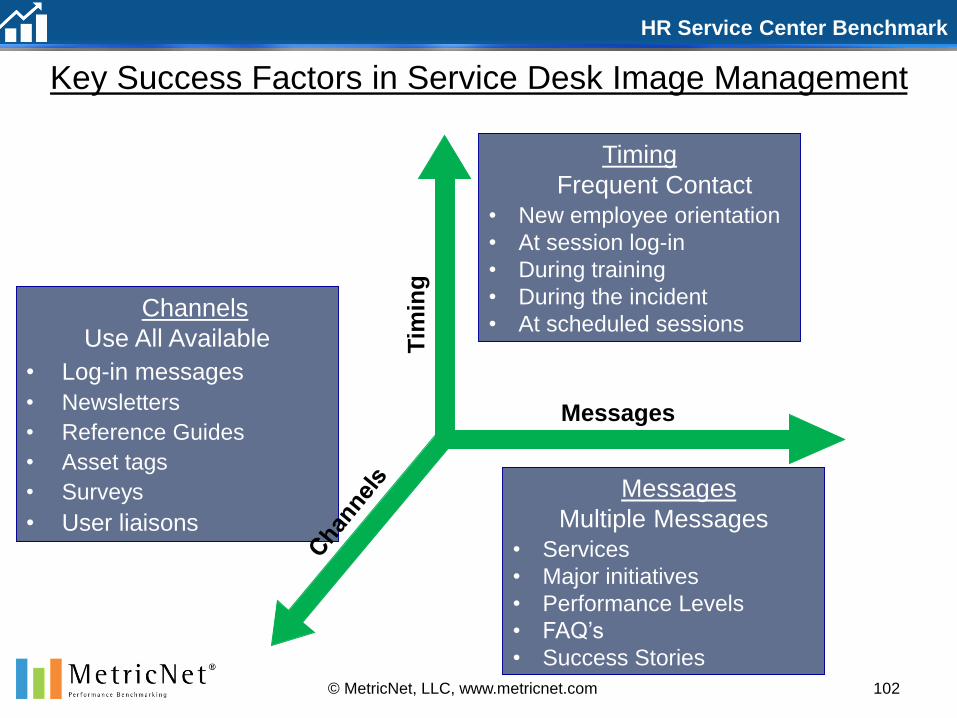
HR Service Center Benchmark
102© MetricNet, LLC, www.metricnet.com
Key Success Factors in Service Desk Image Management
MessagesTim
ing
Timing
Frequent Contact• New employee orientation
• At session log-in
• During training
• During the incident
• At scheduled sessions
Messages
Multiple Messages• Services
• Major initiatives
• Performance Levels
• FAQ’s
• Success Stories
Channels
Use All Available
• Log-in messages
• Newsletters
• Reference Guides
• Asset tags
• Surveys
• User liaisons
Tim
ing

HR Service Center Benchmark
103© MetricNet, LLC, www.metricnet.com
Why are We Doing This?
We’ve all heard the expression…
“Expectations Not Set…
are Expectations Not Met!
So, let’s get serious about proactively
managing expectations!
HR Service Center Benchmark
© MetricNet, LLC, www.metricnet.com 104
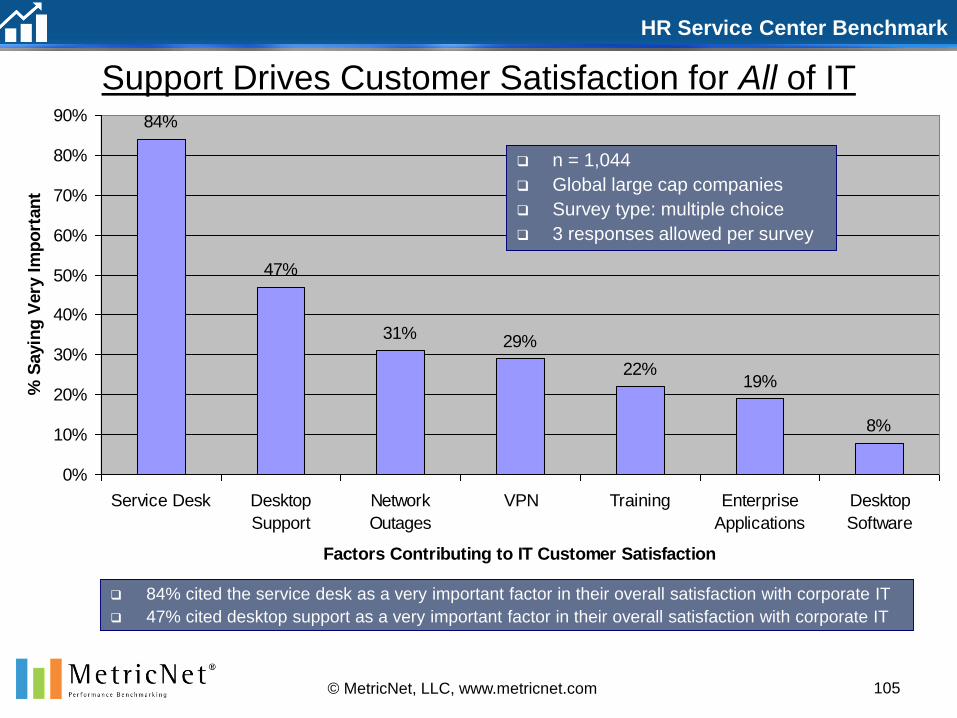
HR Service Center Benchmark
84%
47%
31%29%
22%19%
8%
0%
10%
20%
30%
40%
50%
60%
70%
80%
90%
Service Desk Desktop
Support
Network
Outages
VPN Training Enterprise
Applications
Desktop
Software
Factors Contributing to IT Customer Satisfaction
% S
ayin
g V
ery
Im
po
rtan
t
n = 1,044
Global large cap companies
Survey type: multiple choice
3 responses allowed per survey
84% cited the service desk as a very important factor in their overall satisfaction with corporate IT
47% cited desktop support as a very important factor in their overall satisfaction with corporate IT
Support Drives Customer Satisfaction for All of IT
105© MetricNet, LLC, www.metricnet.com
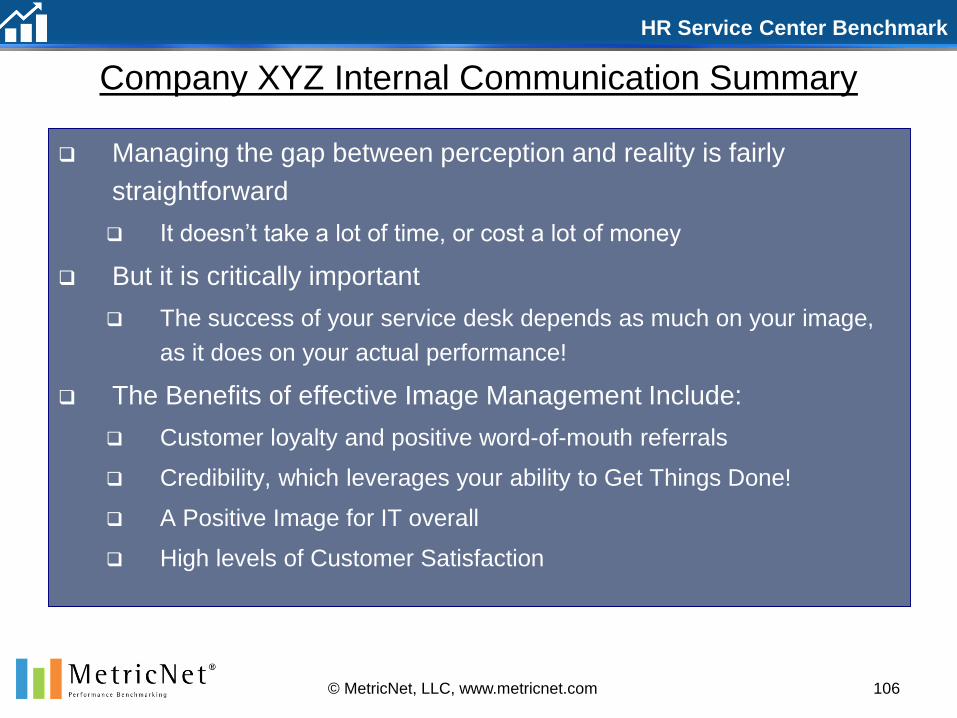
HR Service Center Benchmark
106© MetricNet, LLC, www.metricnet.com
Company XYZ Internal Communication Summary
Managing the gap between perception and reality is fairly
straightforward
It doesn’t take a lot of time, or cost a lot of money
But it is critically important
The success of your service desk depends as much on your image,
as it does on your actual performance!
The Benefits of effective Image Management Include:
Customer loyalty and positive word-of-mouth referrals
Credibility, which leverages your ability to Get Things Done!
A Positive Image for IT overall
High levels of Customer Satisfaction
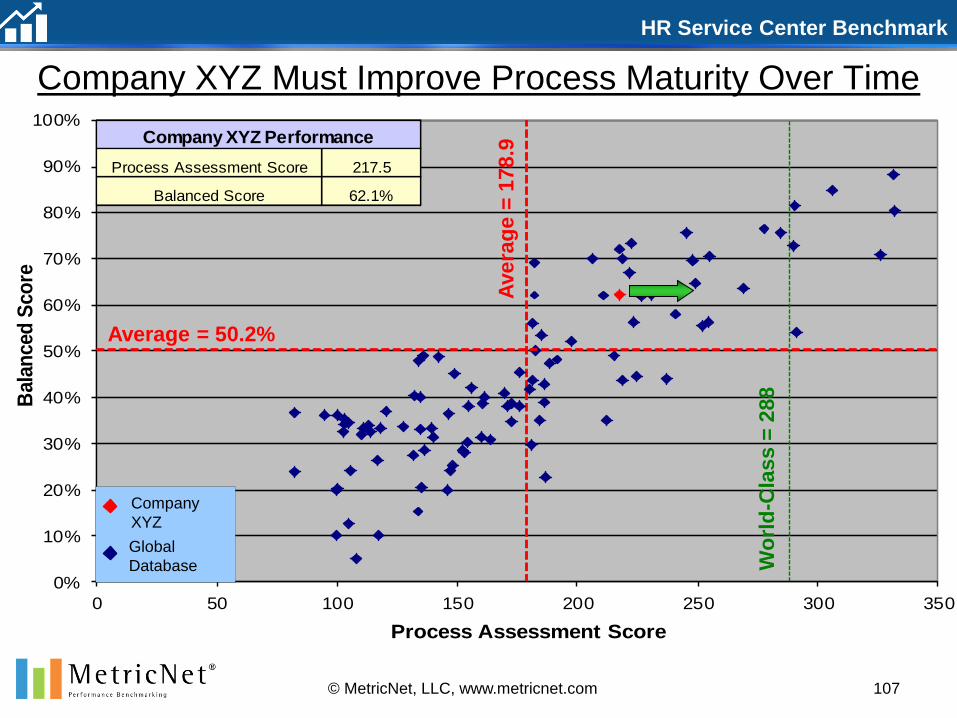
HR Service Center Benchmark
0%
10%
20%
30%
40%
50%
60%
70%
80%
90%
100%
0 50 100 150 200 250 300 350
Bala
nced
Sco
re
Process Assessment Score
Company XYZ Must Improve Process Maturity Over Time
107© MetricNet, LLC, www.metricnet.com
Company
XYZ
Global
Database
Average = 50.2%
Avera
ge =
178.9
Wo
rld
-Cla
ss =
288
Process Assessment Score 217.5
Balanced Score 62.1%
Company XYZ Performance

HR Service Center Benchmark
Best Practice Focus Areas: Strategy
108© MetricNet, LLC, www.metricnet.com
Company XYZ's
Score
2.0
2.0
The Service Desk has SLA's that define the level of service to be delivered to users. The
SLA's are documented, published, and communicated to key stakeholders in the organization.
The Service Desk has OLA's (Operating Level Agreements) with other support groups in the
organization (e.g., level 2 support, desktop support, field support, etc.). The OLA's clearly
define the roles and responsibilities of each support group, and the different support groups
abide by the terms of the OLA's.
Strategy Best Practices Defined
The Service Desk actively seeks to improve Level 1 Resolution Rates, First Contact Resolution
Rates, Level 0 Resolution Rates (User Self-Help), and Level -1 (Problem Prevention)
Resolution Rates by implementing processes, technologies, and training that facilitate these
objectives.
4.0
The Service Desk has a published Service Catalog, including a Supported Products List, that
is distributed and communicated to key stakeholders including end users. The Service
Catalog is available on-line.
The Service Desk has an action plan for continuous improvement. The plan is documented
and distributed to key stakeholders in the organization, and specific individuals are held
accountable for implementing the action plan.
The Service Desk is well integrated into the information technology function. The service desk
acts as the "voice of the user" in IT, and is involved in major IT decisions and deliberations that
affect end users. The Service Desk is alerted ahead of time so that they can prepare for major
rollouts, or other changes in the IT environment.
The Service Desk has a well-defined mission, vision, and strategy. The vision and strategy are
well-documented, and communicated to key stakeholders in the organization.
4.0
3.5
2.5
2.0
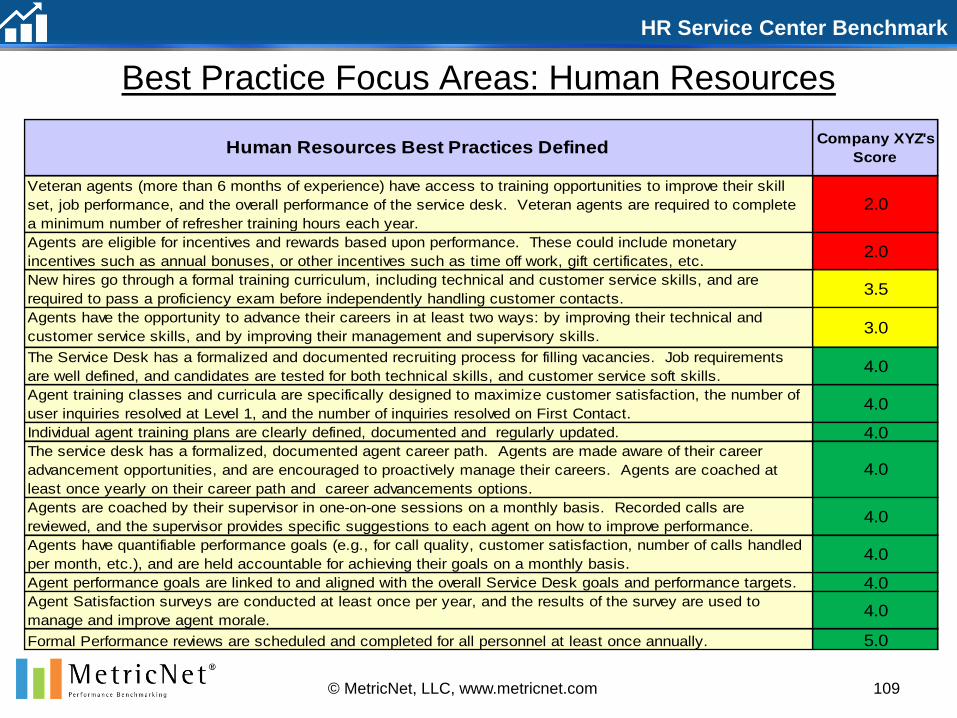
HR Service Center Benchmark
Best Practice Focus Areas: Human Resources
109© MetricNet, LLC, www.metricnet.com
Company XYZ's
Score
4.0
4.0
5.0Formal Performance reviews are scheduled and completed for all personnel at least once annually.
Agent Satisfaction surveys are conducted at least once per year, and the results of the survey are used to
manage and improve agent morale.4.0
Human Resources Best Practices Defined
Agents are coached by their supervisor in one-on-one sessions on a monthly basis. Recorded calls are
reviewed, and the supervisor provides specific suggestions to each agent on how to improve performance.4.0
New hires go through a formal training curriculum, including technical and customer service skills, and are
required to pass a proficiency exam before independently handling customer contacts.3.5
Veteran agents (more than 6 months of experience) have access to training opportunities to improve their skill
set, job performance, and the overall performance of the service desk. Veteran agents are required to complete
a minimum number of refresher training hours each year.
2.0
The Service Desk has a formalized and documented recruiting process for filling vacancies. Job requirements
are well defined, and candidates are tested for both technical skills, and customer service soft skills. 4.0
Agents are eligible for incentives and rewards based upon performance. These could include monetary
incentives such as annual bonuses, or other incentives such as time off work, gift certificates, etc.2.0
Agent performance goals are linked to and aligned with the overall Service Desk goals and performance targets.
The service desk has a formalized, documented agent career path. Agents are made aware of their career
advancement opportunities, and are encouraged to proactively manage their careers. Agents are coached at
least once yearly on their career path and career advancements options.
4.0
Agents have the opportunity to advance their careers in at least two ways: by improving their technical and
customer service skills, and by improving their management and supervisory skills.3.0
Agents have quantifiable performance goals (e.g., for call quality, customer satisfaction, number of calls handled
per month, etc.), and are held accountable for achieving their goals on a monthly basis.4.0
Individual agent training plans are clearly defined, documented and regularly updated.
Agent training classes and curricula are specifically designed to maximize customer satisfaction, the number of
user inquiries resolved at Level 1, and the number of inquiries resolved on First Contact.4.0
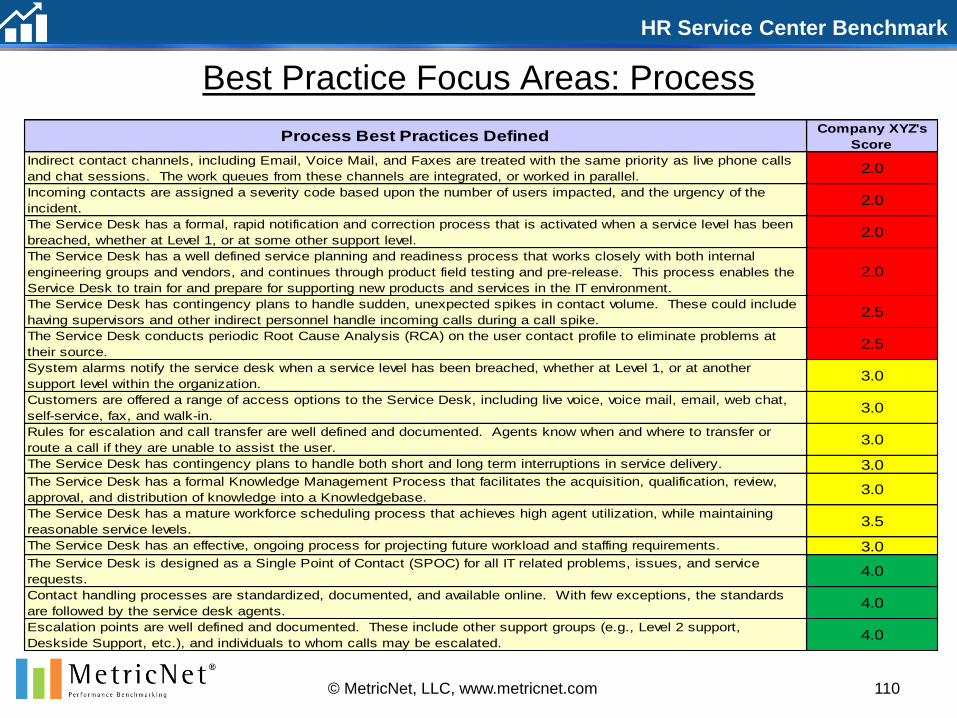
HR Service Center Benchmark
Best Practice Focus Areas: Process
110© MetricNet, LLC, www.metricnet.com
Company XYZ's
Score
3.0
3.0
Contact handling processes are standardized, documented, and available online. With few exceptions, the standards
are followed by the service desk agents.4.0
Customers are offered a range of access options to the Service Desk, including live voice, voice mail, email, web chat,
self-service, fax, and walk-in.3.0
3.0
The Service Desk has a mature workforce scheduling process that achieves high agent utilization, while maintaining
reasonable service levels.3.5
The Service Desk is designed as a Single Point of Contact (SPOC) for all IT related problems, issues, and service
requests.4.0
Process Best Practices Defined
Escalation points are well defined and documented. These include other support groups (e.g., Level 2 support,
Deskside Support, etc.), and individuals to whom calls may be escalated.4.0
System alarms notify the service desk when a service level has been breached, whether at Level 1, or at another
support level within the organization.3.0
The Service Desk has a formal Knowledge Management Process that facilitates the acquisition, qualification, review,
approval, and distribution of knowledge into a Knowledgebase.
Rules for escalation and call transfer are well defined and documented. Agents know when and where to transfer or
route a call if they are unable to assist the user.3.0
Indirect contact channels, including Email, Voice Mail, and Faxes are treated with the same priority as live phone calls
and chat sessions. The work queues from these channels are integrated, or worked in parallel.2.0
Incoming contacts are assigned a severity code based upon the number of users impacted, and the urgency of the
incident.2.0
The Service Desk has an effective, ongoing process for projecting future workload and staffing requirements.
The Service Desk conducts periodic Root Cause Analysis (RCA) on the user contact profile to eliminate problems at
their source.2.5
The Service Desk has a formal, rapid notification and correction process that is activated when a service level has been
breached, whether at Level 1, or at some other support level.2.0
The Service Desk has contingency plans to handle sudden, unexpected spikes in contact volume. These could include
having supervisors and other indirect personnel handle incoming calls during a call spike.2.5
The Service Desk has contingency plans to handle both short and long term interruptions in service delivery.
The Service Desk has a well defined service planning and readiness process that works closely with both internal
engineering groups and vendors, and continues through product field testing and pre-release. This process enables the
Service Desk to train for and prepare for supporting new products and services in the IT environment.
2.0
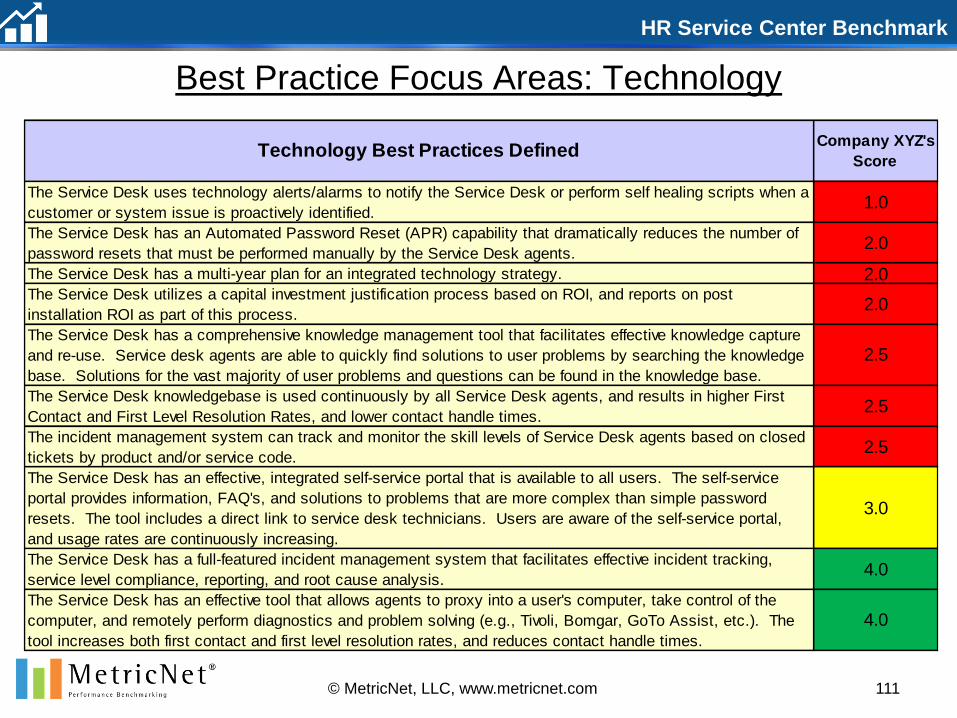
HR Service Center Benchmark
Best Practice Focus Areas: Technology
111© MetricNet, LLC, www.metricnet.com
Company XYZ's
Score
2.0
The Service Desk uses technology alerts/alarms to notify the Service Desk or perform self healing scripts when a
customer or system issue is proactively identified.1.0
2.0
The Service Desk has an Automated Password Reset (APR) capability that dramatically reduces the number of
password resets that must be performed manually by the Service Desk agents.2.0
The Service Desk has an effective, integrated self-service portal that is available to all users. The self-service
portal provides information, FAQ's, and solutions to problems that are more complex than simple password
resets. The tool includes a direct link to service desk technicians. Users are aware of the self-service portal,
and usage rates are continuously increasing.
3.0
2.5
The Service Desk knowledgebase is used continuously by all Service Desk agents, and results in higher First
Contact and First Level Resolution Rates, and lower contact handle times.2.5
The Service Desk has an effective tool that allows agents to proxy into a user's computer, take control of the
computer, and remotely perform diagnostics and problem solving (e.g., Tivoli, Bomgar, GoTo Assist, etc.). The
tool increases both first contact and first level resolution rates, and reduces contact handle times.
4.0
The Service Desk has a full-featured incident management system that facilitates effective incident tracking,
service level compliance, reporting, and root cause analysis.4.0
The Service Desk has a comprehensive knowledge management tool that facilitates effective knowledge capture
and re-use. Service desk agents are able to quickly find solutions to user problems by searching the knowledge
base. Solutions for the vast majority of user problems and questions can be found in the knowledge base.
Technology Best Practices Defined
The incident management system can track and monitor the skill levels of Service Desk agents based on closed
tickets by product and/or service code.2.5
The Service Desk has a multi-year plan for an integrated technology strategy.
The Service Desk utilizes a capital investment justification process based on ROI, and reports on post
installation ROI as part of this process.
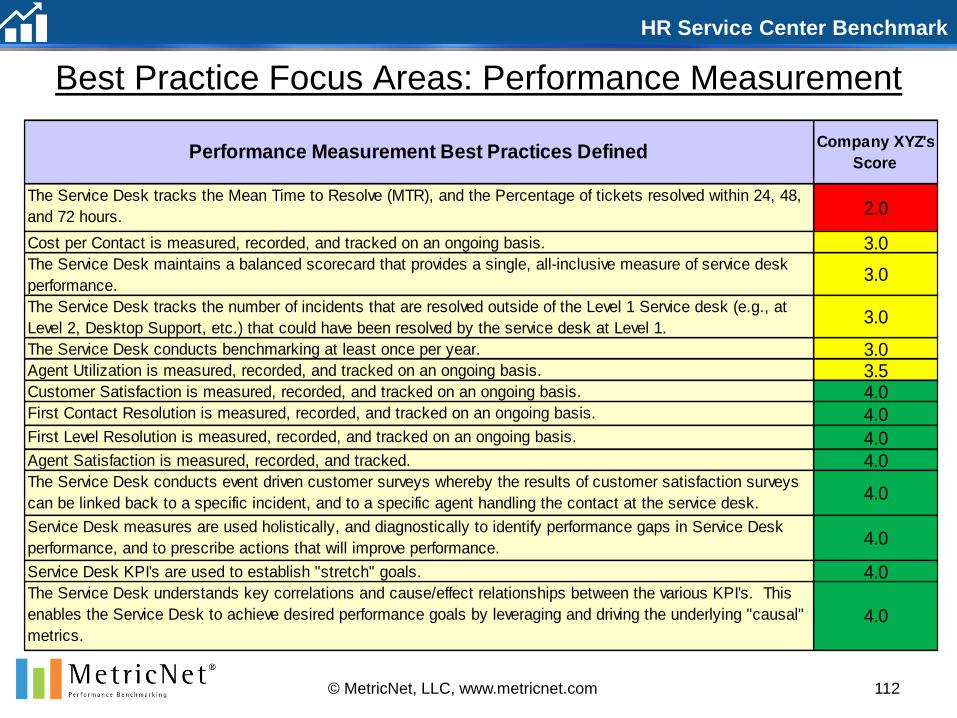
HR Service Center Benchmark
Best Practice Focus Areas: Performance Measurement
112© MetricNet, LLC, www.metricnet.com
Company XYZ's
Score
3.0
3.03.54.0
4.0
4.0
4.0
4.0
4.0
4.0
4.0
2.0
First Contact Resolution is measured, recorded, and tracked on an ongoing basis.
Service Desk KPI's are used to establish "stretch" goals.
The Service Desk understands key correlations and cause/effect relationships between the various KPI's. This
enables the Service Desk to achieve desired performance goals by leveraging and driving the underlying "causal"
metrics.
The Service Desk tracks the Mean Time to Resolve (MTR), and the Percentage of tickets resolved within 24, 48,
and 72 hours.
The Service Desk tracks the number of incidents that are resolved outside of the Level 1 Service desk (e.g., at
Level 2, Desktop Support, etc.) that could have been resolved by the service desk at Level 1.
3.0
The Service Desk conducts benchmarking at least once per year.
3.0
The Service Desk conducts event driven customer surveys whereby the results of customer satisfaction surveys
can be linked back to a specific incident, and to a specific agent handling the contact at the service desk.
Service Desk measures are used holistically, and diagnostically to identify performance gaps in Service Desk
performance, and to prescribe actions that will improve performance.
Cost per Contact is measured, recorded, and tracked on an ongoing basis.
Customer Satisfaction is measured, recorded, and tracked on an ongoing basis.
Agent Utilization is measured, recorded, and tracked on an ongoing basis.
Agent Satisfaction is measured, recorded, and tracked.
Performance Measurement Best Practices Defined
First Level Resolution is measured, recorded, and tracked on an ongoing basis.
The Service Desk maintains a balanced scorecard that provides a single, all-inclusive measure of service desk
performance.
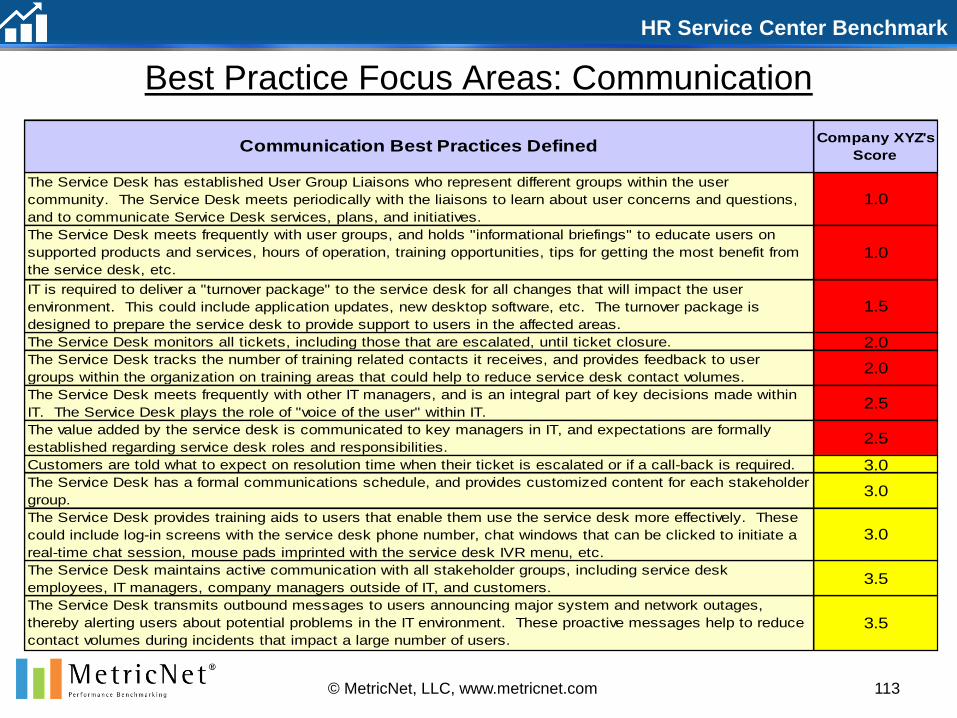
HR Service Center Benchmark
Best Practice Focus Areas: Communication
113© MetricNet, LLC, www.metricnet.com
Company XYZ's
Score
2.0
3.0
The Service Desk provides training aids to users that enable them use the service desk more effectively. These
could include log-in screens with the service desk phone number, chat windows that can be clicked to initiate a
real-time chat session, mouse pads imprinted with the service desk IVR menu, etc.
3.0
The Service Desk tracks the number of training related contacts it receives, and provides feedback to user
groups within the organization on training areas that could help to reduce service desk contact volumes.2.0
The Service Desk has established User Group Liaisons who represent different groups within the user
community. The Service Desk meets periodically with the liaisons to learn about user concerns and questions,
and to communicate Service Desk services, plans, and initiatives.
1.0
The Service Desk meets frequently with user groups, and holds "informational briefings" to educate users on
supported products and services, hours of operation, training opportunities, tips for getting the most benefit from
the service desk, etc.
1.0
Communication Best Practices Defined
IT is required to deliver a "turnover package" to the service desk for all changes that will impact the user
environment. This could include application updates, new desktop software, etc. The turnover package is
designed to prepare the service desk to provide support to users in the affected areas.
1.5
Customers are told what to expect on resolution time when their ticket is escalated or if a call-back is required.
The Service Desk monitors all tickets, including those that are escalated, until ticket closure.
The Service Desk transmits outbound messages to users announcing major system and network outages,
thereby alerting users about potential problems in the IT environment. These proactive messages help to reduce
contact volumes during incidents that impact a large number of users.
3.5
The Service Desk meets frequently with other IT managers, and is an integral part of key decisions made within
IT. The Service Desk plays the role of "voice of the user" within IT.2.5
3.5
The Service Desk has a formal communications schedule, and provides customized content for each stakeholder
group.3.0
The Service Desk maintains active communication with all stakeholder groups, including service desk
employees, IT managers, company managers outside of IT, and customers.
The value added by the service desk is communicated to key managers in IT, and expectations are formally
established regarding service desk roles and responsibilities.2.5

HR Service Center Benchmark
Some Suggested Performance Targets
114© MetricNet, LLC, www.metricnet.com
Achieving the performance targets recommended above will increase the Company XYZ Balanced
Score from 62.1% to 74.3%, and put Company XYZ in the top position on the Balanced Scorecard.
Performance MetricCurrent
Performance
Target
Performance
First Contact Resolution Rate 57.6% 75.0%
First Level Resolution Rate N/A 85.0%
Average Speed of Answer (ASA) (seconds) 124 90
% of Calls Answered in 30 Seconds 2.6% 40.0%
Call Abandonment Rate 15.3% 7.0%
New Technician Training Hours 100 140
Service Desk Balanced Score 62.1% 74.3%
115
Detailed Benchmarking
Comparisons
Company
XYZ

Cost and Price Metrics
116
Company
XYZ
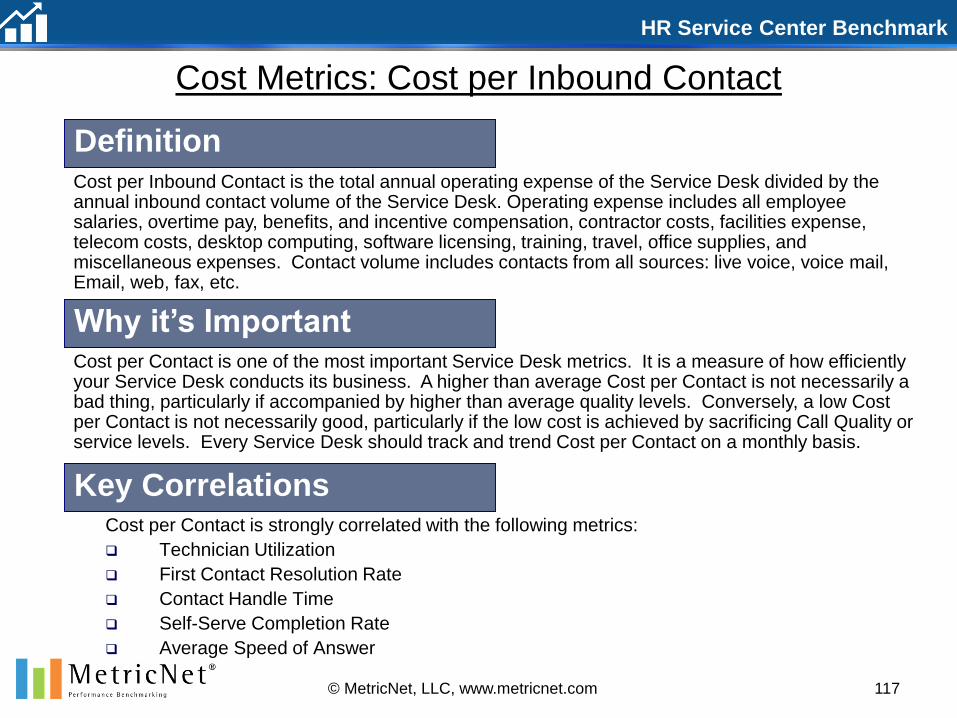
HR Service Center Benchmark
117© MetricNet, LLC, www.metricnet.com
Cost Metrics: Cost per Inbound Contact
Cost per Contact is strongly correlated with the following metrics:
Technician Utilization
First Contact Resolution Rate
Contact Handle Time
Self-Serve Completion Rate
Average Speed of Answer
Definition
Why it’s Important
Key Correlations
Cost per Contact is one of the most important Service Desk metrics. It is a measure of how efficiently your Service Desk conducts its business. A higher than average Cost per Contact is not necessarily a bad thing, particularly if accompanied by higher than average quality levels. Conversely, a low Cost per Contact is not necessarily good, particularly if the low cost is achieved by sacrificing Call Quality or service levels. Every Service Desk should track and trend Cost per Contact on a monthly basis.
Cost per Inbound Contact is the total annual operating expense of the Service Desk divided by the annual inbound contact volume of the Service Desk. Operating expense includes all employee salaries, overtime pay, benefits, and incentive compensation, contractor costs, facilities expense, telecom costs, desktop computing, software licensing, training, travel, office supplies, and miscellaneous expenses. Contact volume includes contacts from all sources: live voice, voice mail, Email, web, fax, etc.
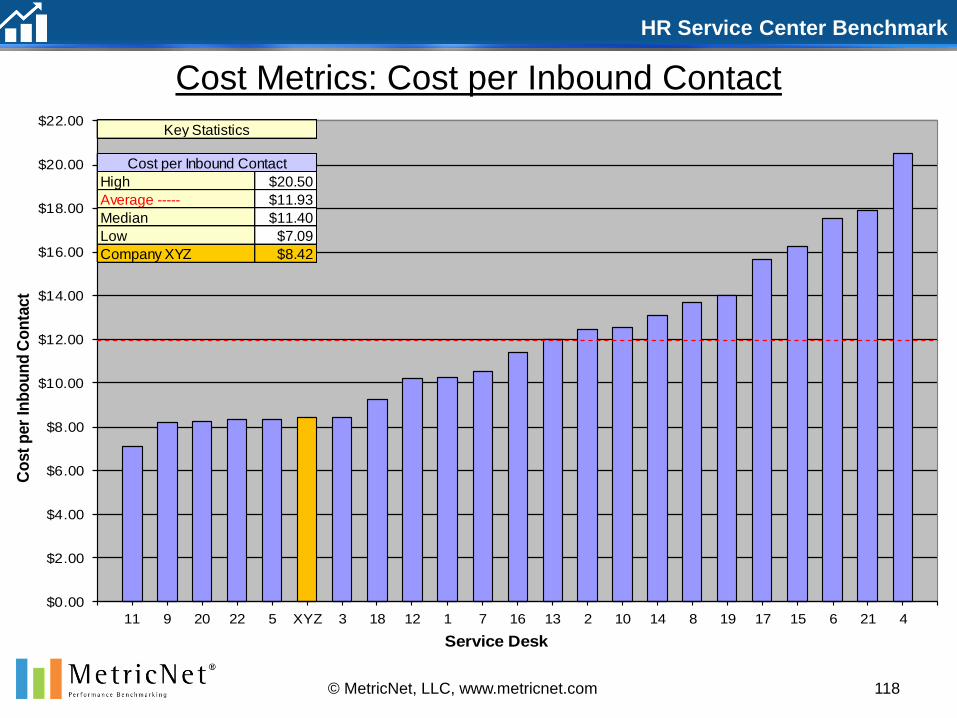
HR Service Center Benchmark
118© MetricNet, LLC, www.metricnet.com
Cost Metrics: Cost per Inbound Contact
$0.00
$2.00
$4.00
$6.00
$8.00
$10.00
$12.00
$14.00
$16.00
$18.00
$20.00
$22.00
11 9 20 22 5 XYZ 3 18 12 1 7 16 13 2 10 14 8 19 17 15 6 21 4
Co
st
per
Inb
ou
nd
Co
nta
ct
Service Desk
High $20.50
Average ----- $11.93
Median $11.40
Low $7.09
Company XYZ $8.42
Key Statistics
Cost per Inbound Contact

HR Service Center Benchmark
Cost Metrics: Cost per Minute of Inbound Handle Time
Cost per Minute of Inbound Handle Time is strongly correlated with the following metrics:
Technician Utilization
First Contact Resolution Rate
User Self-Serve Completion Rate
Average Speed of Answer
Inbound Contacts as a % of Total Contacts
Definition
Why it’s Important
Key Correlations
Unlike Cost per Inbound Contact, which does not take into account the Contact Handle Time or call complexity, Cost per Minute of Inbound Handle Time is a measure of the per minute cost of providing customer support. It enables a more direct comparison of costs between Service Desks because it is independent of the types of contacts that come into the Service Desk and the complexity of those contacts.
Cost per Minute of Inbound Handle Time is simply the Cost per Contact divided by the Average Inbound Contact Handle Time. The Average Inbound Contact Handle Time includes all inbound contacts: voice calls, voice mail, email, web chat, walk-in, etc.
119© MetricNet, LLC, www.metricnet.com
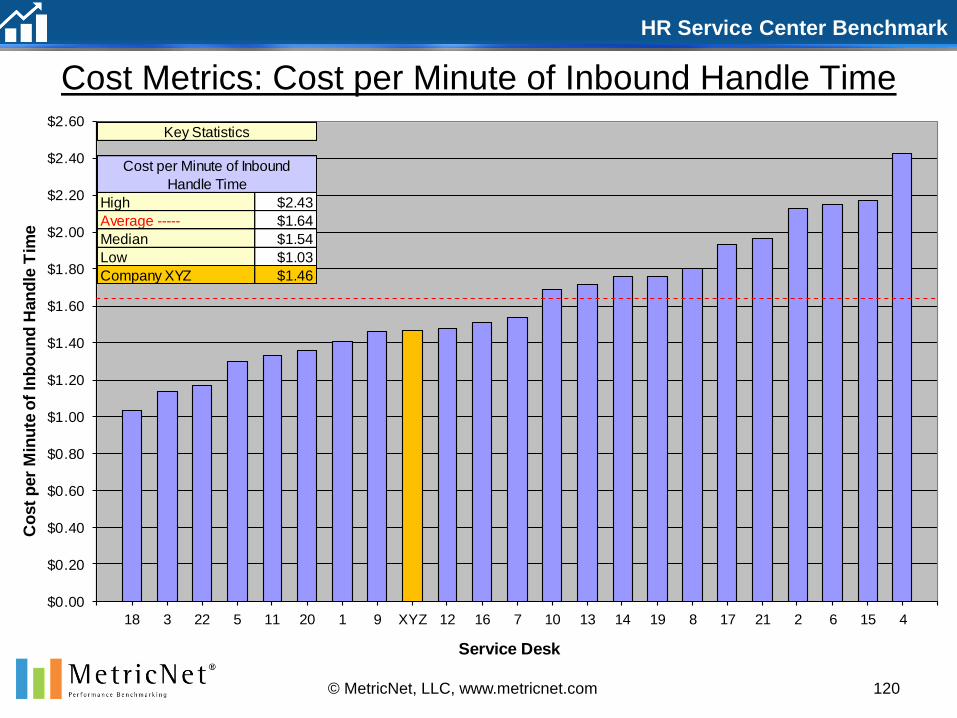
HR Service Center Benchmark
120© MetricNet, LLC, www.metricnet.com
Cost Metrics: Cost per Minute of Inbound Handle Time
$0.00
$0.20
$0.40
$0.60
$0.80
$1.00
$1.20
$1.40
$1.60
$1.80
$2.00
$2.20
$2.40
$2.60
18 3 22 5 11 20 1 9 XYZ 12 16 7 10 13 14 19 8 17 21 2 6 15 4
Co
st
per
Min
ute
of
Inb
ou
nd
Han
dle
Tim
e
Service Desk
High $2.43
Average ----- $1.64
Median $1.54
Low $1.03
Company XYZ $1.46
Key Statistics
Cost per Minute of Inbound
Handle Time
HR Service Center Benchmark
121© MetricNet, LLC, www.metricnet.com
Price Metrics: Price per Inbound Contact
Price per Inbound Contact is strongly correlated with the following metrics:
Agent Utilization
First Contact resolution rate
Inbound Contact Handle Time
User Self-Service Completion Rate
Average Speed of Answer
Definition
Why it’s Important
Key Correlations
Price per Inbound Contact is one of the most important Service Desk metrics. It is a measure of contract efficiency and effectiveness with your outsourcer. A higher than average Price per Inbound Contact is not necessarily a bad thing, particularly if accompanied by higher than average quality levels. Conversely, a low Price per Inbound Contact is not necessarily good, particularly if the low price is achieved by sacrificing Customer Satisfaction or service levels. Every outsourced Service Desk should track and trend Price per Inbound Contact on an ongoing basis.
Price per Inbound Contact is the amount paid to the outsourcer for each inbound contact handled. It is typically calculated by dividing the annual fee paid to the outsourcer by the annual inbound contact volume. Contact volume includes contacts from all sources: live voice, voice mail, Email, web, fax, etc.
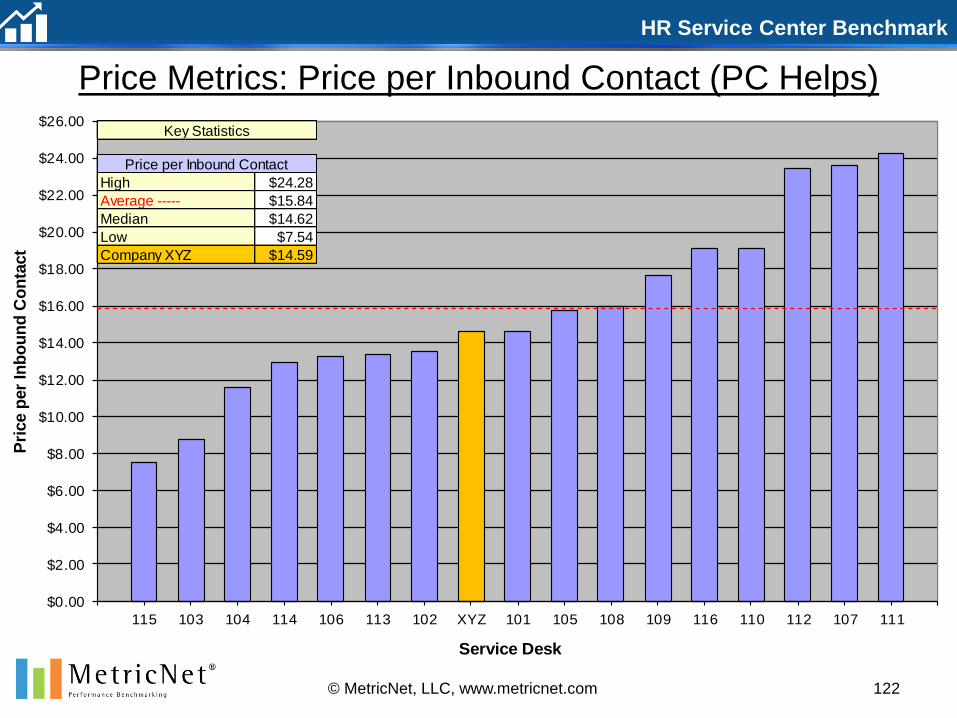
HR Service Center Benchmark
122© MetricNet, LLC, www.metricnet.com
Price Metrics: Price per Inbound Contact (PC Helps)
$0.00
$2.00
$4.00
$6.00
$8.00
$10.00
$12.00
$14.00
$16.00
$18.00
$20.00
$22.00
$24.00
$26.00
115 103 104 114 106 113 102 XYZ 101 105 108 109 116 110 112 107 111
Pri
ce p
er
Inb
ou
nd
Co
nta
ct
Service Desk
High $24.28
Average ----- $15.84
Median $14.62
Low $7.54
Company XYZ $14.59
Key Statistics
Price per Inbound Contact
HR Service Center Benchmark
Price Metrics: Price per Minute of Handle Time
Price per Minute of Handle Time is strongly correlated with the following metrics:
Agent Utilization
First Contact Resolution Rate
User Self-Service Completion Rate
Average Speed of Answer
Definition
Why it’s Important
Key Correlations
Unlike Price per Contact, which does not take into account the Contact Handle Time or call complexity, Price per Minute of Handle Time is a measure of the per minute price paid to your outsourcer for providing technical support. It enables a more direct comparison of price between service desks and outsourcers because it is independent of the types of calls that come into the service desk and the complexity of those calls.
Price per Minute of Handle Time is simply the Price per Contact divided by the average Inbound Contact Handle Time.
123© MetricNet, LLC, www.metricnet.com
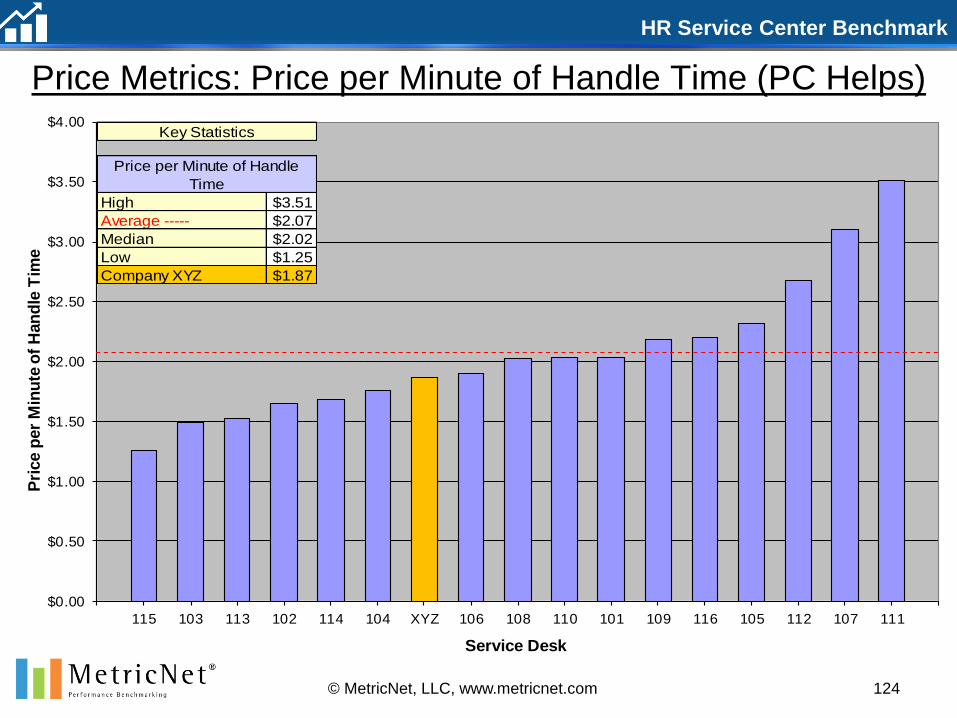
HR Service Center Benchmark
Price Metrics: Price per Minute of Handle Time (PC Helps)
124© MetricNet, LLC, www.metricnet.com
$0.00
$0.50
$1.00
$1.50
$2.00
$2.50
$3.00
$3.50
$4.00
115 103 113 102 114 104 XYZ 106 108 110 101 109 116 105 112 107 111
Pri
ce p
er
Min
ute
of
Han
dle
Tim
e
Service Desk
High $3.51
Average ----- $2.07
Median $2.02
Low $1.25
Company XYZ $1.87
Key Statistics
Price per Minute of Handle
Time

HR Service Center Benchmark
125© MetricNet, LLC, www.metricnet.com
Cost Metrics: First Level Resolution Rate
First Level Resolution is strongly correlated with the following metrics:
First Contact Resolution Rate
New Technician Training Hours
Annual Technician Training Hours
Cost per Inbound Contact
Total Cost of Ownership
Definition
Why it’s Important
Key Correlations
First Level Resolution is a measure of the overall competency of the Service Desk, and is a proxy for Total Cost of Ownership (TCO). A high First Level Resolution Rate helps to minimize TCO because each contact that is resolved at Level 1 avoids a higher cost of resolution at Level n (IT, Desktop Support, Vendor Support, etc.). Service Desks can improve their First Level Resolution Rates through training, and investments in certain technologies such as remote diagnostic tools, and knowledge management systems.
First Level Resolution Rate is the number of incidents resolved in the Service Desk, divided by all incidents that can potentially be resolved at the Service Desk. Any incident that is pushed out to another support level (Desktop Support, Level 2 IT support, Vendor Support, etc.) is, by definition, not resolved at Level 1. Incidents than cannot be resolved at Level 1, such as a hardware failure, do not count in the First Level Resolution Rate. MetricNet considers this a cost metric since it has a strong impact on Total Cost of Ownership for end-user support
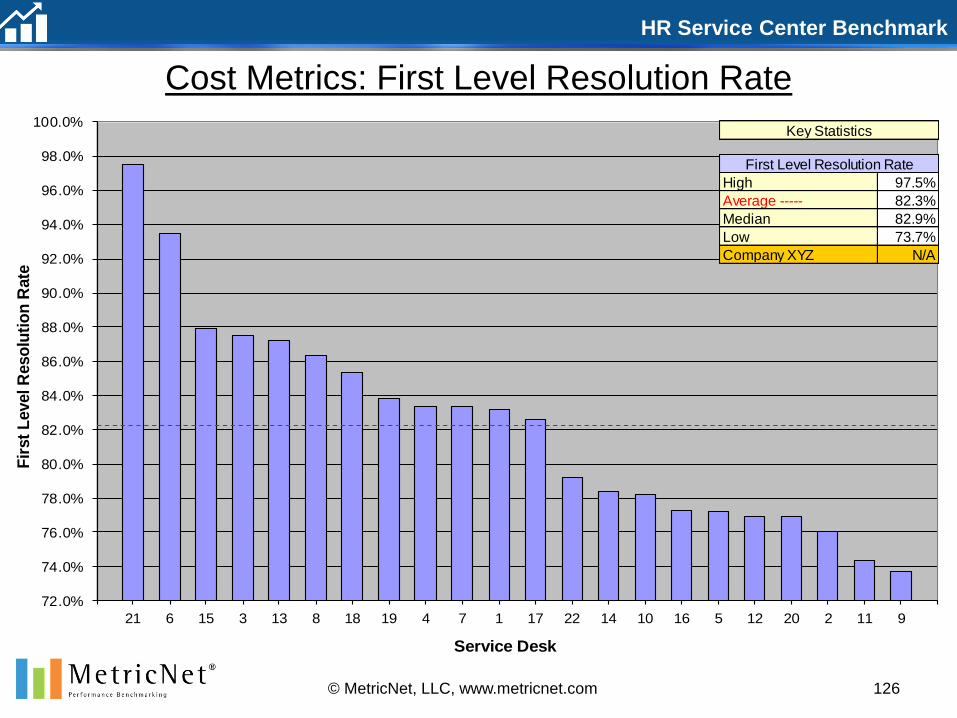
HR Service Center Benchmark
126© MetricNet, LLC, www.metricnet.com
Cost Metrics: First Level Resolution Rate
72.0%
74.0%
76.0%
78.0%
80.0%
82.0%
84.0%
86.0%
88.0%
90.0%
92.0%
94.0%
96.0%
98.0%
100.0%
21 6 15 3 13 8 18 19 4 7 1 17 22 14 10 16 5 12 20 2 11 9
Fir
st
Level R
eso
luti
on
Rate
Service Desk
High 97.5%
Average ----- 82.3%
Median 82.9%
Low 73.7%
Company XYZ N/A
Key Statistics
First Level Resolution Rate
Productivity Metrics
127
Company
XYZ
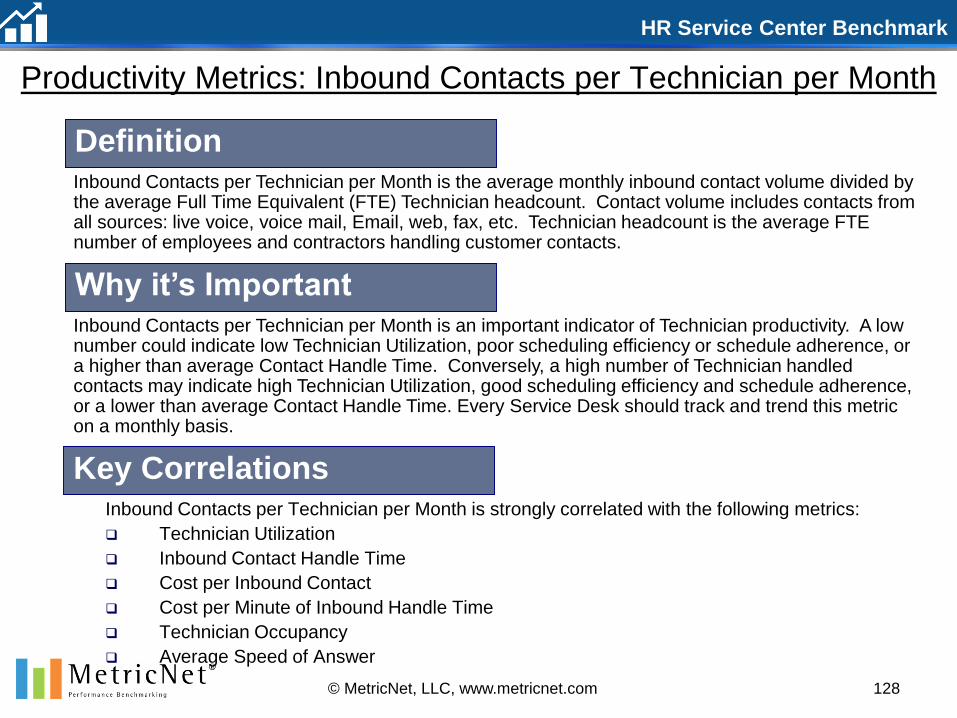
HR Service Center Benchmark
128© MetricNet, LLC, www.metricnet.com
Productivity Metrics: Inbound Contacts per Technician per Month
Inbound Contacts per Technician per Month is strongly correlated with the following metrics:
Technician Utilization
Inbound Contact Handle Time
Cost per Inbound Contact
Cost per Minute of Inbound Handle Time
Technician Occupancy
Average Speed of Answer
Definition
Why it’s Important
Key Correlations
Inbound Contacts per Technician per Month is an important indicator of Technician productivity. A low number could indicate low Technician Utilization, poor scheduling efficiency or schedule adherence, or a higher than average Contact Handle Time. Conversely, a high number of Technician handled contacts may indicate high Technician Utilization, good scheduling efficiency and schedule adherence, or a lower than average Contact Handle Time. Every Service Desk should track and trend this metric on a monthly basis.
Inbound Contacts per Technician per Month is the average monthly inbound contact volume divided by the average Full Time Equivalent (FTE) Technician headcount. Contact volume includes contacts from all sources: live voice, voice mail, Email, web, fax, etc. Technician headcount is the average FTE number of employees and contractors handling customer contacts.

HR Service Center Benchmark
129© MetricNet, LLC, www.metricnet.com
Productivity Metrics: Inbound Contacts per Tech per Month
200
250
300
350
400
450
500
550
600
650
700
750
800
850
900
950
XYZ 11 9 20 3 5 7 22 12 13 1 10 14 16 6 18 2 19 8 17 15 21 4
Inb
ou
nd
Co
nta
cts
per
Tech
nic
ian
per
Mo
nth
Service Desk
High 910
Average ----- 591
Median 574
Low 329
Company XYZ 910
Key Statistics
Inbound Contacts per Technician
per Month
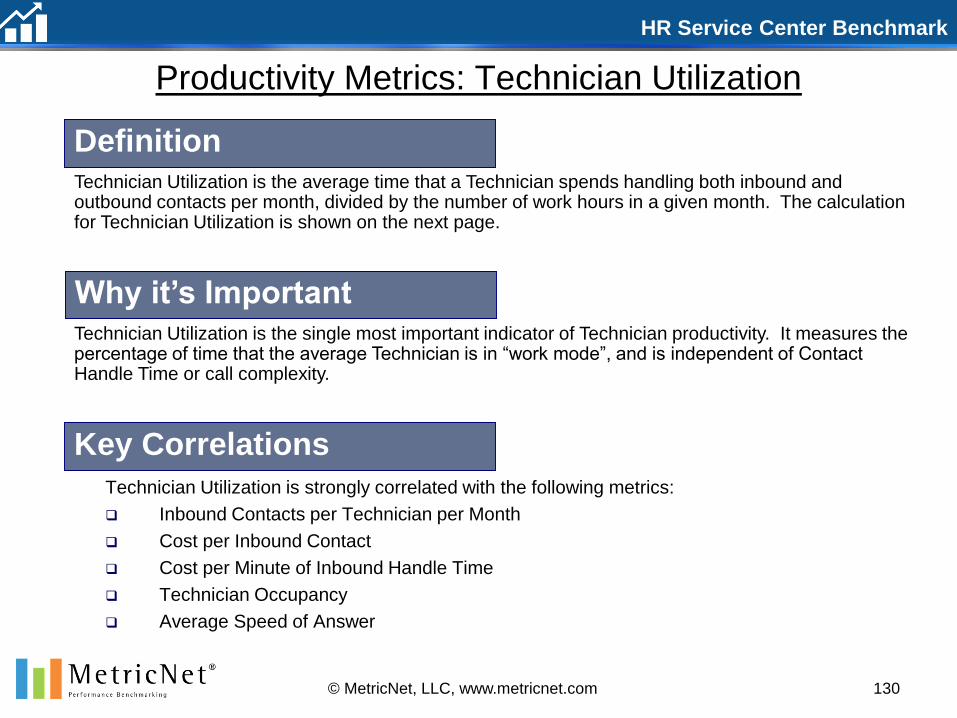
HR Service Center Benchmark
130© MetricNet, LLC, www.metricnet.com
Productivity Metrics: Technician Utilization
Technician Utilization is strongly correlated with the following metrics:
Inbound Contacts per Technician per Month
Cost per Inbound Contact
Cost per Minute of Inbound Handle Time
Technician Occupancy
Average Speed of Answer
Definition
Why it’s Important
Key Correlations
Technician Utilization is the single most important indicator of Technician productivity. It measures the percentage of time that the average Technician is in “work mode”, and is independent of Contact Handle Time or call complexity.
Technician Utilization is the average time that a Technician spends handling both inbound and outbound contacts per month, divided by the number of work hours in a given month. The calculation for Technician Utilization is shown on the next page.
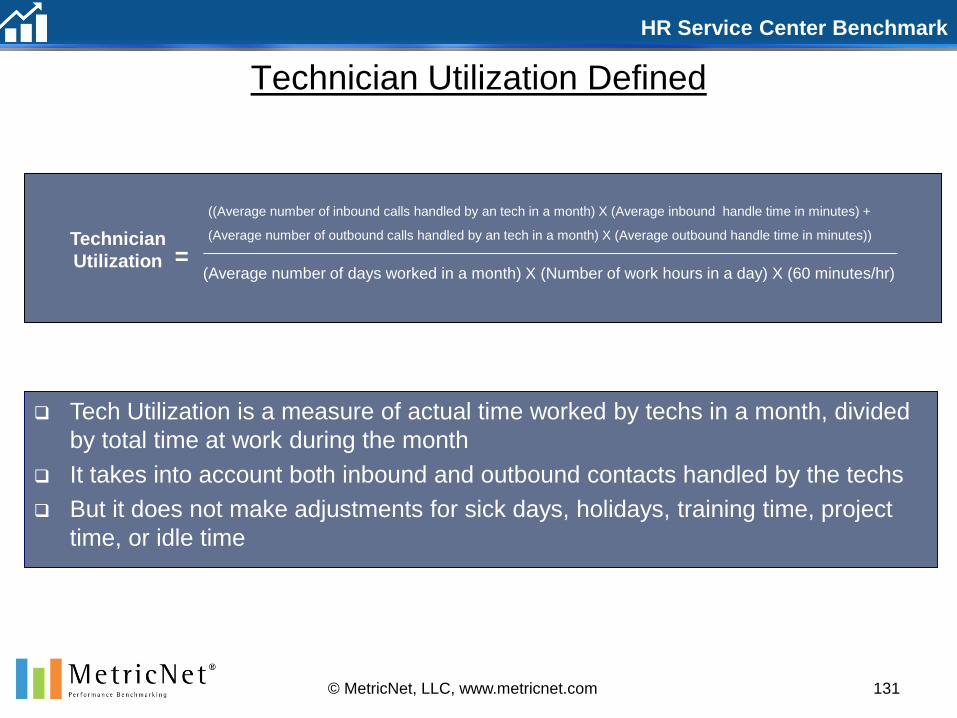
HR Service Center Benchmark
Technician Utilization Defined
Technician
Utilization
((Average number of inbound calls handled by an tech in a month) X (Average inbound handle time in minutes) +
(Average number of outbound calls handled by an tech in a month) X (Average outbound handle time in minutes))
(Average number of days worked in a month) X (Number of work hours in a day) X (60 minutes/hr)
Tech Utilization is a measure of actual time worked by techs in a month, divided
by total time at work during the month
It takes into account both inbound and outbound contacts handled by the techs
But it does not make adjustments for sick days, holidays, training time, project
time, or idle time
=
© MetricNet, LLC, www.metricnet.com 131
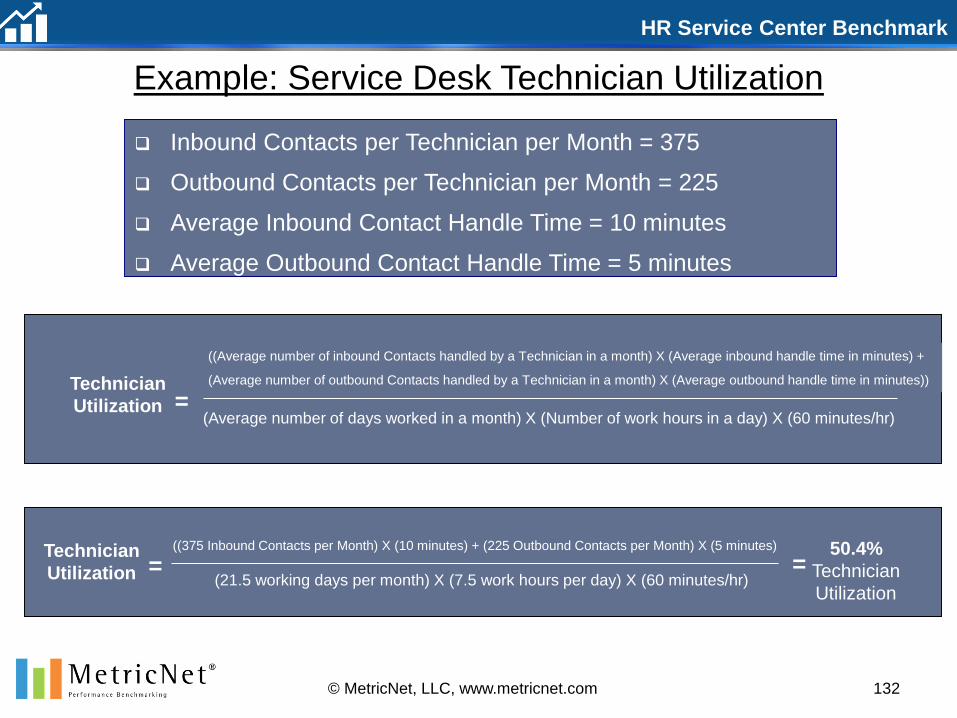
HR Service Center Benchmark
Example: Service Desk Technician Utilization
Inbound Contacts per Technician per Month = 375
Outbound Contacts per Technician per Month = 225
Average Inbound Contact Handle Time = 10 minutes
Average Outbound Contact Handle Time = 5 minutes
Technician
Utilization
((375 Inbound Contacts per Month) X (10 minutes) + (225 Outbound Contacts per Month) X (5 minutes)
(21.5 working days per month) X (7.5 work hours per day) X (60 minutes/hr)= =
50.4%
Technician
Utilization
Technician
Utilization
((Average number of inbound Contacts handled by a Technician in a month) X (Average inbound handle time in minutes) +
(Average number of outbound Contacts handled by a Technician in a month) X (Average outbound handle time in minutes))
(Average number of days worked in a month) X (Number of work hours in a day) X (60 minutes/hr)=
132© MetricNet, LLC, www.metricnet.com

HR Service Center Benchmark
133© MetricNet, LLC, www.metricnet.com
Productivity Metrics: Technician Utilization
20.0%
25.0%
30.0%
35.0%
40.0%
45.0%
50.0%
55.0%
60.0%
65.0%
12 11 3 22 XYZ 18 7 14 9 6 16 10 13 5 1 20 19 17 2 8 21 15 4
Tech
nic
ian
Uti
lizati
on
Service Desk
High 62.7%
Average ----- 48.1%
Median 50.3%
Low 30.8%
Company XYZ 54.9%
Key Statistics
Technician Utilization

HR Service Center Benchmark
134© MetricNet, LLC, www.metricnet.com
Productivity Metrics: Technicians as a % of Total Headcount
Technicians as a % of Total Headcount is strongly correlated with the following metrics:
Cost per Inbound Contact
Cost per Minute of Inbound Handle Time
Definition
Why it’s Important
Key Correlations
The Technician headcount as a percent of total Service Desk headcount is an important measure of management and overhead efficiency. Since non-Technicians include both management and non-management personnel (e.g., supervisors and team leads, QA/QC, trainers, etc.), this metric is not a pure measure of management span of control. It is, however, a more useful metric than management span of control because the denominator of this ratio takes into account all personnel that are not directly engaged in customer service activities.
This metric is the Full Time Equivalent Technician headcount divided by the total Service Desk headcount. It is expressed as a percentage, and represents the percentage of total Service Desk personnel who are engaged in direct customer service activities.
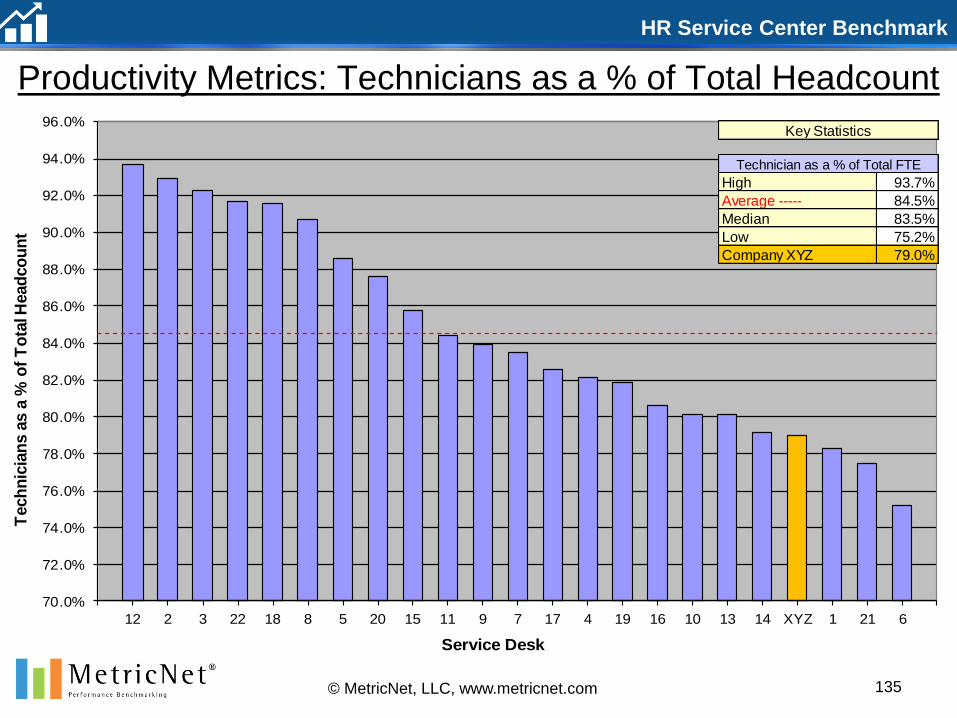
HR Service Center Benchmark
135© MetricNet, LLC, www.metricnet.com
Productivity Metrics: Technicians as a % of Total Headcount
70.0%
72.0%
74.0%
76.0%
78.0%
80.0%
82.0%
84.0%
86.0%
88.0%
90.0%
92.0%
94.0%
96.0%
12 2 3 22 18 8 5 20 15 11 9 7 17 4 19 16 10 13 14 XYZ 1 21 6
Tech
nic
ian
s a
s a
% o
f T
ota
l Head
co
un
t
Service Desk
High 93.7%
Average ----- 84.5%
Median 83.5%
Low 75.2%
Company XYZ 79.0%
Key Statistics
Technician as a % of Total FTE
Service Level Metrics
136
Company
XYZ
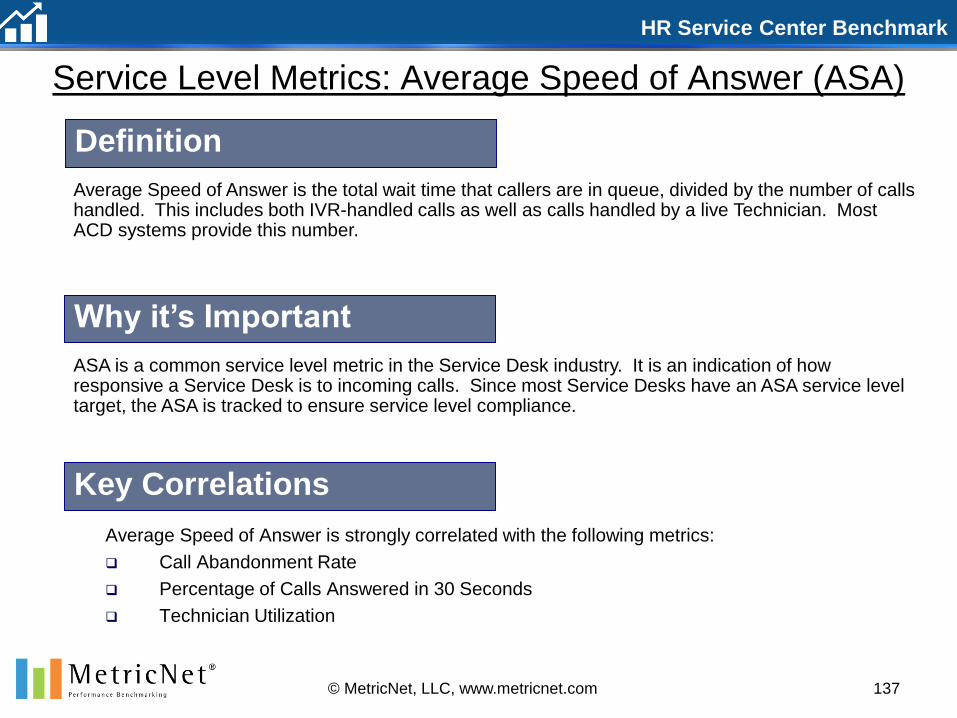
HR Service Center Benchmark
137© MetricNet, LLC, www.metricnet.com
Service Level Metrics: Average Speed of Answer (ASA)
Average Speed of Answer is strongly correlated with the following metrics:
Call Abandonment Rate
Percentage of Calls Answered in 30 Seconds
Technician Utilization
Definition
Why it’s Important
Key Correlations
ASA is a common service level metric in the Service Desk industry. It is an indication of how responsive a Service Desk is to incoming calls. Since most Service Desks have an ASA service level target, the ASA is tracked to ensure service level compliance.
Average Speed of Answer is the total wait time that callers are in queue, divided by the number of calls handled. This includes both IVR-handled calls as well as calls handled by a live Technician. Most ACD systems provide this number.
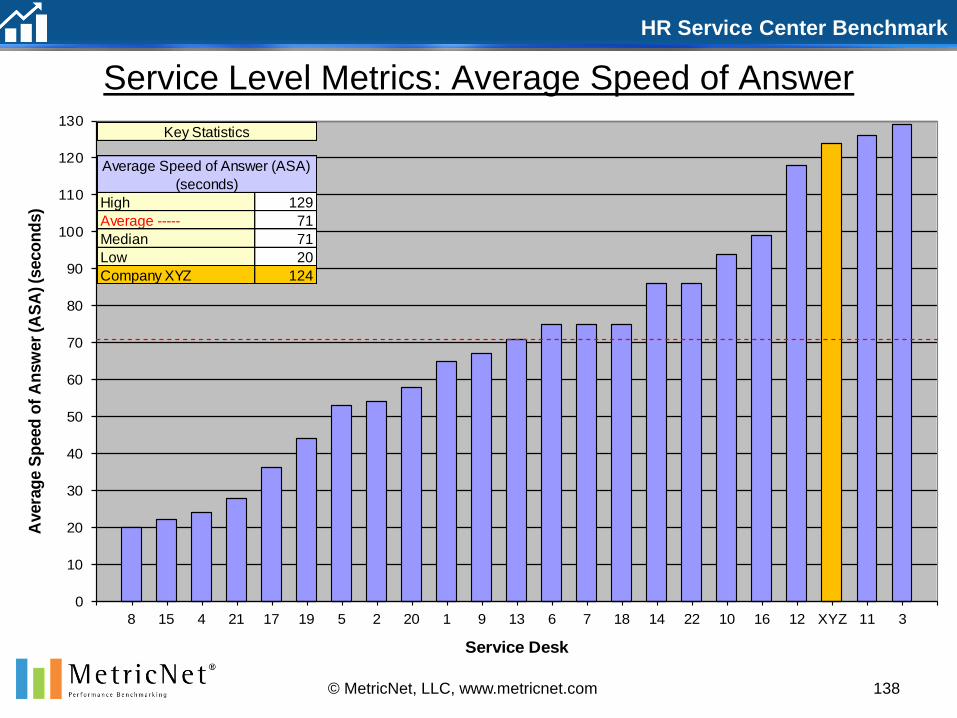
HR Service Center Benchmark
138© MetricNet, LLC, www.metricnet.com
Service Level Metrics: Average Speed of Answer
0
10
20
30
40
50
60
70
80
90
100
110
120
130
8 15 4 21 17 19 5 2 20 1 9 13 6 7 18 14 22 10 16 12 XYZ 11 3
Avera
ge S
peed
of
An
sw
er
(AS
A) (s
eco
nd
s)
Service Desk
High 129
Average ----- 71
Median 71
Low 20
Company XYZ 124
Key Statistics
Average Speed of Answer (ASA)
(seconds)
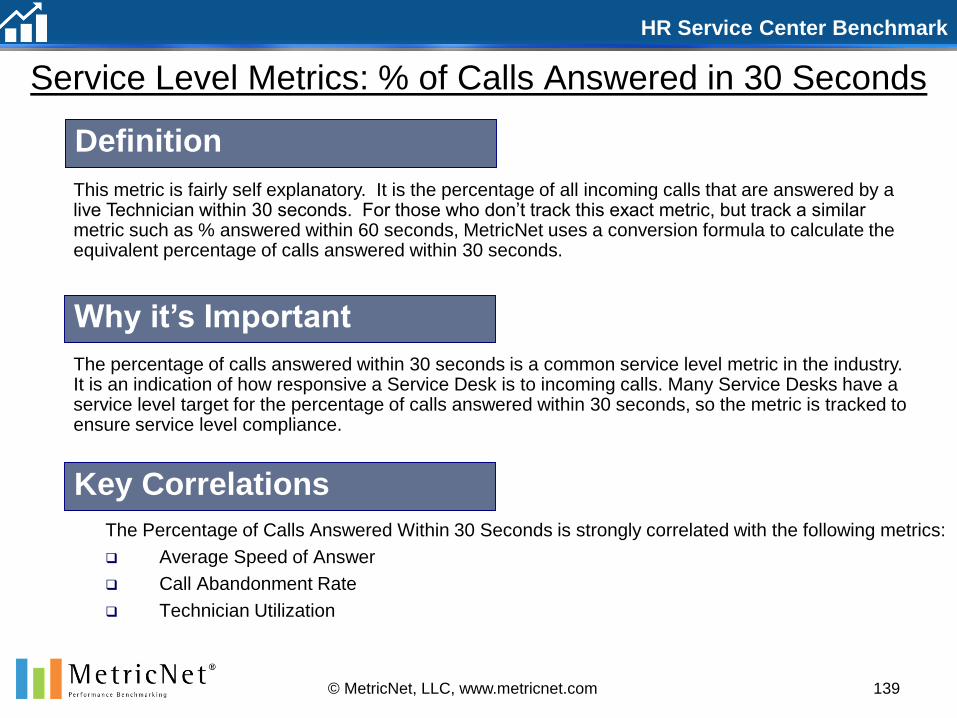
HR Service Center Benchmark
139© MetricNet, LLC, www.metricnet.com
Service Level Metrics: % of Calls Answered in 30 Seconds
The Percentage of Calls Answered Within 30 Seconds is strongly correlated with the following metrics:
Average Speed of Answer
Call Abandonment Rate
Technician Utilization
Definition
Why it’s Important
Key Correlations
The percentage of calls answered within 30 seconds is a common service level metric in the industry. It is an indication of how responsive a Service Desk is to incoming calls. Many Service Desks have a service level target for the percentage of calls answered within 30 seconds, so the metric is tracked to ensure service level compliance.
This metric is fairly self explanatory. It is the percentage of all incoming calls that are answered by a live Technician within 30 seconds. For those who don’t track this exact metric, but track a similar metric such as % answered within 60 seconds, MetricNet uses a conversion formula to calculate the equivalent percentage of calls answered within 30 seconds.

HR Service Center Benchmark
140© MetricNet, LLC, www.metricnet.com
Service Level Metrics: % of Calls Answered in 30 Seconds
0.0%
10.0%
20.0%
30.0%
40.0%
50.0%
60.0%
70.0%
80.0%
90.0%
4 21 20 5 8 13 15 6 7 17 14 18 2 9 19 16 1 22 10 12 3 11 XYZ
% o
f C
alls A
nsw
ere
d in
30 S
eco
nd
s
Service Desk
High 85.8%
Average ----- 43.9%
Median 44.4%
Low 2.6%
Company XYZ 2.6%
Key Statistics
% of Calls Answered in 30
Seconds
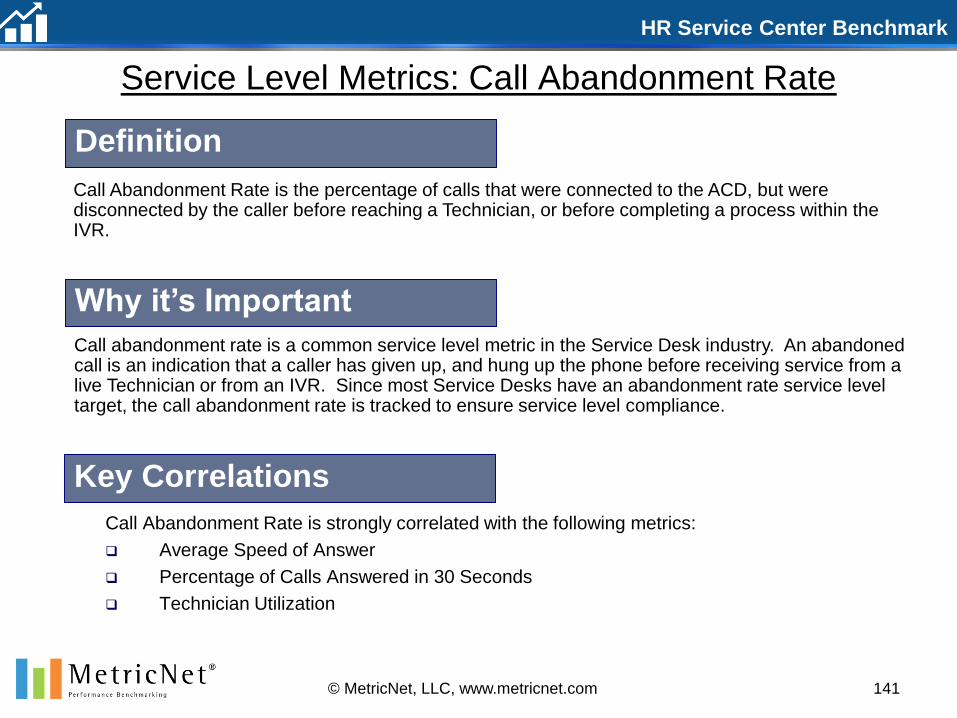
HR Service Center Benchmark
141© MetricNet, LLC, www.metricnet.com
Service Level Metrics: Call Abandonment Rate
Call Abandonment Rate is strongly correlated with the following metrics:
Average Speed of Answer
Percentage of Calls Answered in 30 Seconds
Technician Utilization
Definition
Why it’s Important
Key Correlations
Call abandonment rate is a common service level metric in the Service Desk industry. An abandoned call is an indication that a caller has given up, and hung up the phone before receiving service from a live Technician or from an IVR. Since most Service Desks have an abandonment rate service level target, the call abandonment rate is tracked to ensure service level compliance.
Call Abandonment Rate is the percentage of calls that were connected to the ACD, but were disconnected by the caller before reaching a Technician, or before completing a process within the IVR.
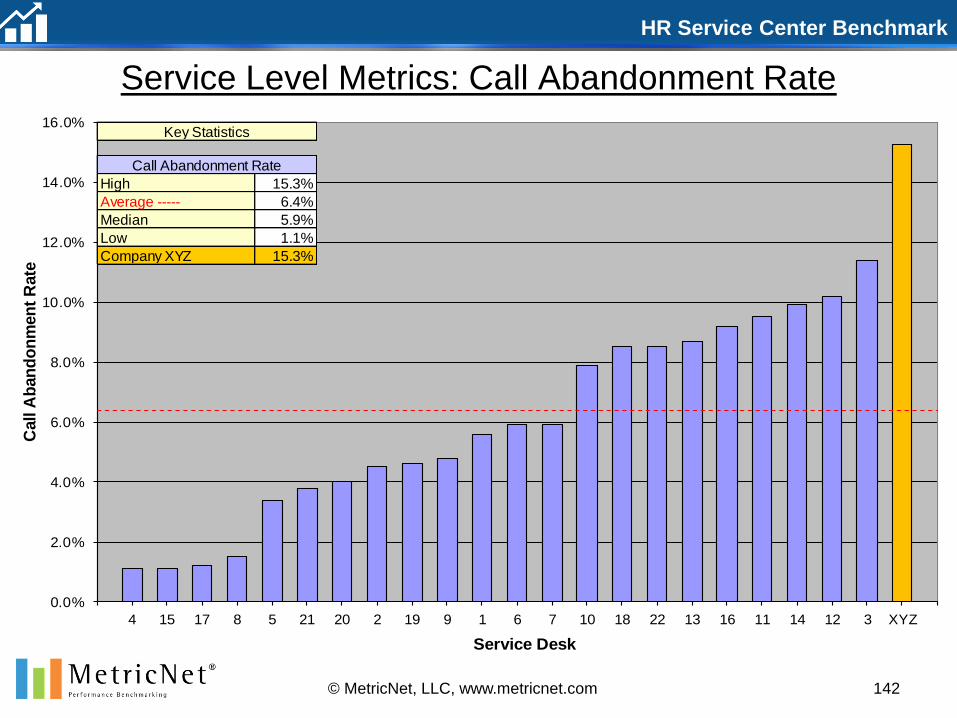
HR Service Center Benchmark
142© MetricNet, LLC, www.metricnet.com
Service Level Metrics: Call Abandonment Rate
0.0%
2.0%
4.0%
6.0%
8.0%
10.0%
12.0%
14.0%
16.0%
4 15 17 8 5 21 20 2 19 9 1 6 7 10 18 22 13 16 11 14 12 3 XYZ
Call A
ban
do
nm
en
t R
ate
Service Desk
High 15.3%
Average ----- 6.4%
Median 5.9%
Low 1.1%
Company XYZ 15.3%
Key Statistics
Call Abandonment Rate
Quality Metrics
143
Company
XYZ
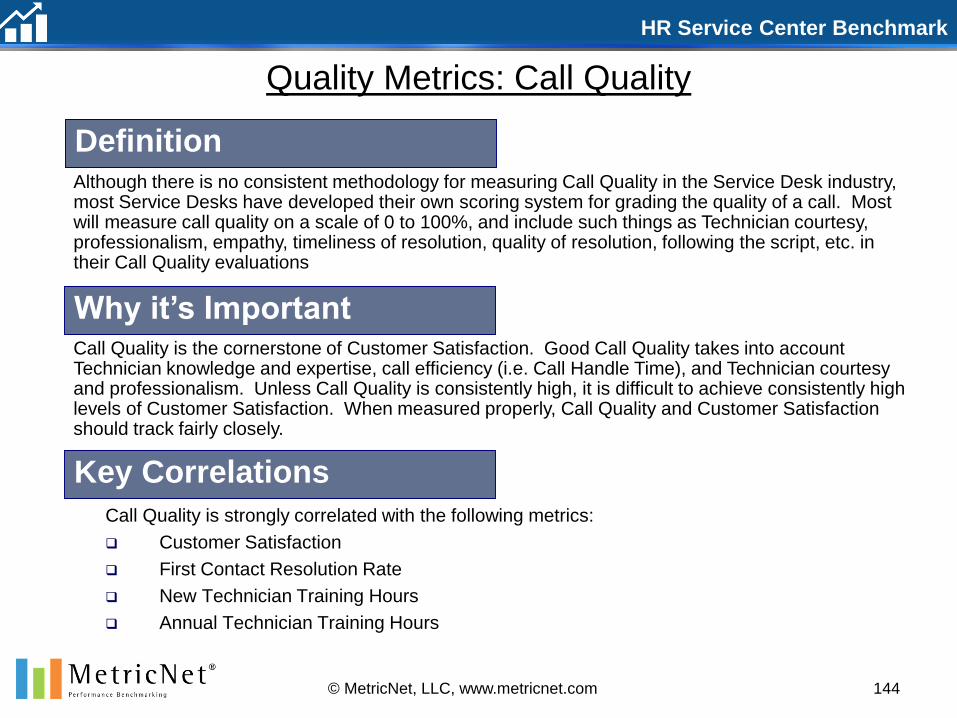
HR Service Center Benchmark
144© MetricNet, LLC, www.metricnet.com
Quality Metrics: Call Quality
Call Quality is strongly correlated with the following metrics:
Customer Satisfaction
First Contact Resolution Rate
New Technician Training Hours
Annual Technician Training Hours
Definition
Why it’s Important
Key Correlations
Call Quality is the cornerstone of Customer Satisfaction. Good Call Quality takes into account Technician knowledge and expertise, call efficiency (i.e. Call Handle Time), and Technician courtesy and professionalism. Unless Call Quality is consistently high, it is difficult to achieve consistently high levels of Customer Satisfaction. When measured properly, Call Quality and Customer Satisfaction should track fairly closely.
Although there is no consistent methodology for measuring Call Quality in the Service Desk industry, most Service Desks have developed their own scoring system for grading the quality of a call. Most will measure call quality on a scale of 0 to 100%, and include such things as Technician courtesy, professionalism, empathy, timeliness of resolution, quality of resolution, following the script, etc. in their Call Quality evaluations

HR Service Center Benchmark
145© MetricNet, LLC, www.metricnet.com
Quality Metrics: Call Quality
62.0%
64.0%
66.0%
68.0%
70.0%
72.0%
74.0%
76.0%
78.0%
80.0%
82.0%
84.0%
86.0%
88.0%
90.0%
92.0%
94.0%
96.0%
1 21 6 13 9 22 19 16 12 18 17 10 2 11 4 5 3 8 7 1 15 20
Call Q
uality
Service Desk
High 94.5%
Average ----- 83.7%
Median 83.9%
Low 65.1%
Company XYZ N/A
Key Statistics
Call Quality
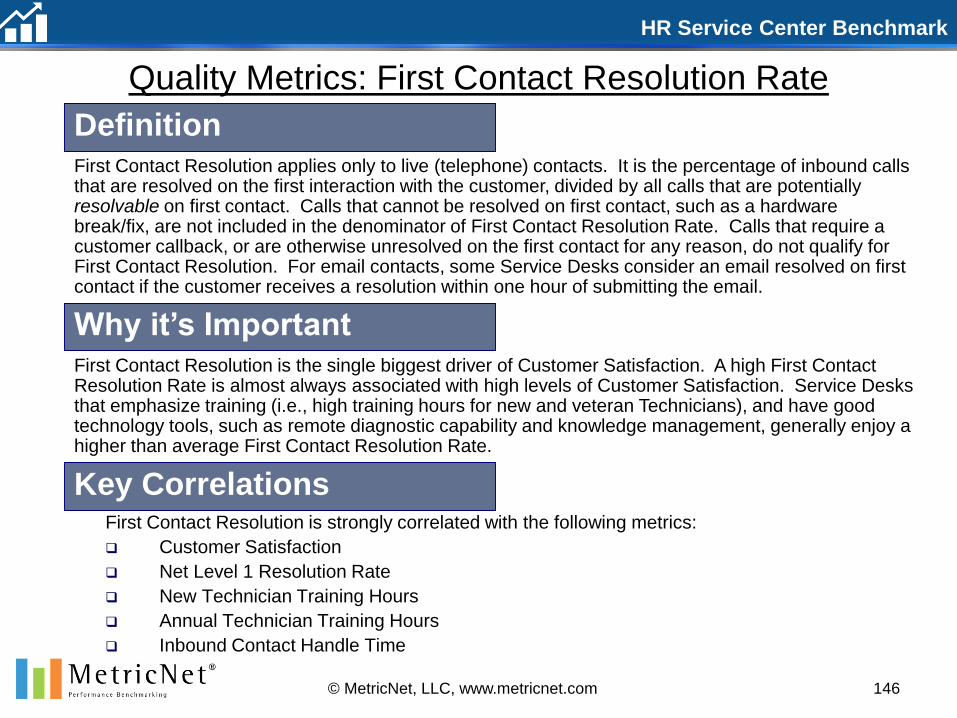
HR Service Center Benchmark
146© MetricNet, LLC, www.metricnet.com
Quality Metrics: First Contact Resolution Rate
First Contact Resolution is strongly correlated with the following metrics:
Customer Satisfaction
Net Level 1 Resolution Rate
New Technician Training Hours
Annual Technician Training Hours
Inbound Contact Handle Time
Definition
Why it’s Important
Key Correlations
First Contact Resolution is the single biggest driver of Customer Satisfaction. A high First Contact Resolution Rate is almost always associated with high levels of Customer Satisfaction. Service Desks that emphasize training (i.e., high training hours for new and veteran Technicians), and have good technology tools, such as remote diagnostic capability and knowledge management, generally enjoy a higher than average First Contact Resolution Rate.
First Contact Resolution applies only to live (telephone) contacts. It is the percentage of inbound calls that are resolved on the first interaction with the customer, divided by all calls that are potentially resolvable on first contact. Calls that cannot be resolved on first contact, such as a hardware break/fix, are not included in the denominator of First Contact Resolution Rate. Calls that require a customer callback, or are otherwise unresolved on the first contact for any reason, do not qualify for First Contact Resolution. For email contacts, some Service Desks consider an email resolved on first contact if the customer receives a resolution within one hour of submitting the email.

HR Service Center Benchmark
147© MetricNet, LLC, www.metricnet.com
Quality Metrics: First Contact Resolution Rate
45.0%
50.0%
55.0%
60.0%
65.0%
70.0%
75.0%
80.0%
85.0%
90.0%
95.0%
6 21 13 8 15 4 22 7 14 3 18 5 2 20 19 9 10 16 1 17 11 12 XYZ
Fir
st
Co
nta
ct
Reso
luti
on
Rate
Service Desk
High 91.4%
Average ----- 71.6%
Median 70.4%
Low 57.6%
Company XYZ 57.6%
Key Statistics
First Contact Resolution Rate
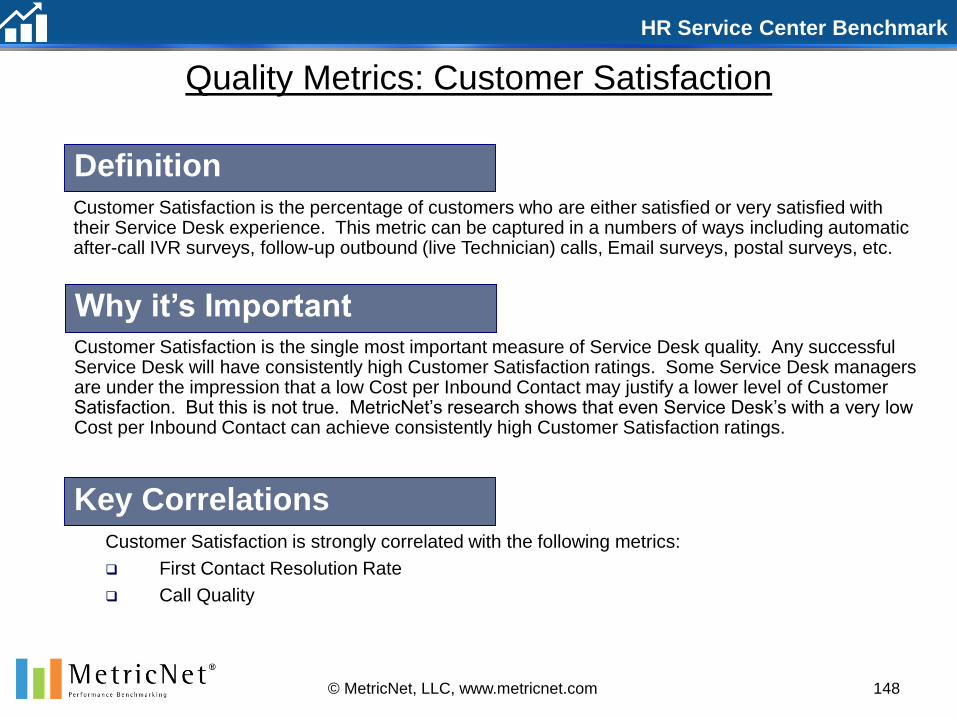
HR Service Center Benchmark
148© MetricNet, LLC, www.metricnet.com
Quality Metrics: Customer Satisfaction
Customer Satisfaction is strongly correlated with the following metrics:
First Contact Resolution Rate
Call Quality
Definition
Why it’s Important
Key Correlations
Customer Satisfaction is the single most important measure of Service Desk quality. Any successful Service Desk will have consistently high Customer Satisfaction ratings. Some Service Desk managers are under the impression that a low Cost per Inbound Contact may justify a lower level of Customer Satisfaction. But this is not true. MetricNet’s research shows that even Service Desk’s with a very low Cost per Inbound Contact can achieve consistently high Customer Satisfaction ratings.
Customer Satisfaction is the percentage of customers who are either satisfied or very satisfied with their Service Desk experience. This metric can be captured in a numbers of ways including automatic after-call IVR surveys, follow-up outbound (live Technician) calls, Email surveys, postal surveys, etc.

HR Service Center Benchmark
149© MetricNet, LLC, www.metricnet.com
Quality Metrics: Customer Satisfaction
50.0%
55.0%
60.0%
65.0%
70.0%
75.0%
80.0%
85.0%
90.0%
95.0%
100.0%
21 6 XYZ 19 13 9 17 3 8 22 2 10 1 4 14 15 18 5 11 16 12 7 20
Cu
sto
mer
Sati
sfa
cti
on
Service Desk
High 96.7%
Average ----- 78.2%
Median 76.1%
Low 63.1%
Company XYZ 87.6%
Key Statistics
Customer Satisfaction

Technician Metrics
150
Company
XYZ
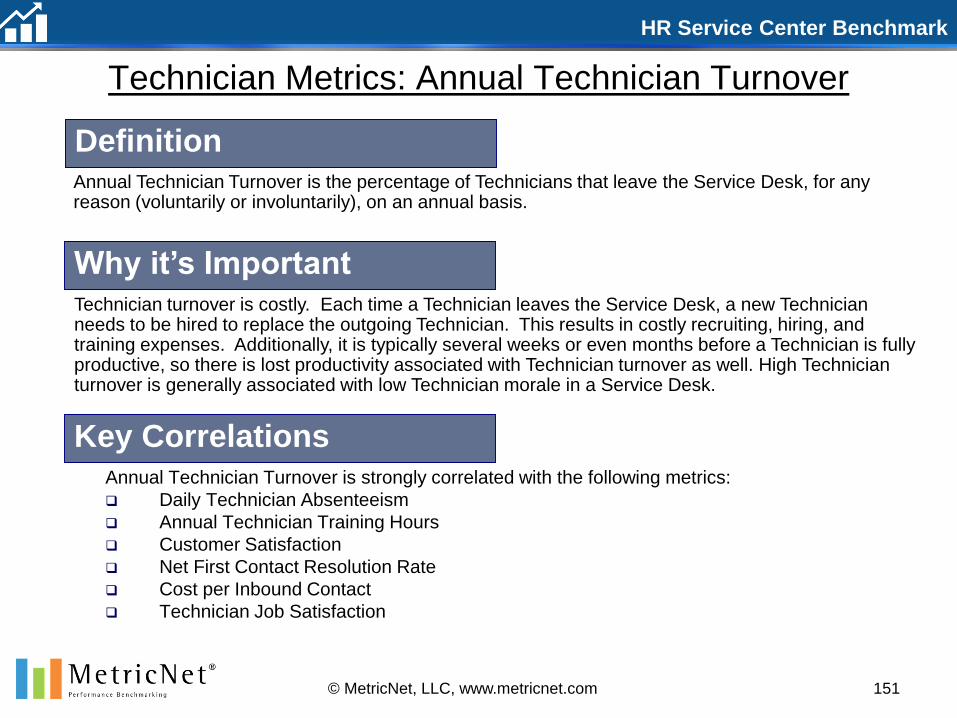
HR Service Center Benchmark
151© MetricNet, LLC, www.metricnet.com
Technician Metrics: Annual Technician Turnover
Annual Technician Turnover is strongly correlated with the following metrics:
Daily Technician Absenteeism
Annual Technician Training Hours
Customer Satisfaction
Net First Contact Resolution Rate
Cost per Inbound Contact
Technician Job Satisfaction
Definition
Why it’s Important
Key Correlations
Technician turnover is costly. Each time a Technician leaves the Service Desk, a new Technician needs to be hired to replace the outgoing Technician. This results in costly recruiting, hiring, and training expenses. Additionally, it is typically several weeks or even months before a Technician is fully productive, so there is lost productivity associated with Technician turnover as well. High Technician turnover is generally associated with low Technician morale in a Service Desk.
Annual Technician Turnover is the percentage of Technicians that leave the Service Desk, for any reason (voluntarily or involuntarily), on an annual basis.
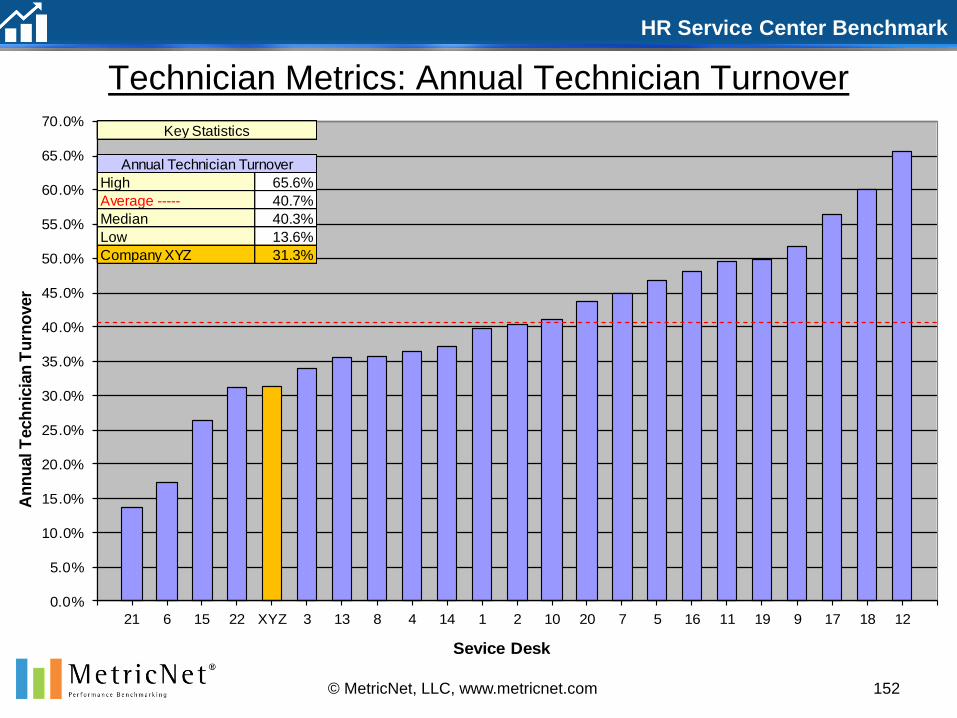
HR Service Center Benchmark
152© MetricNet, LLC, www.metricnet.com
Technician Metrics: Annual Technician Turnover
0.0%
5.0%
10.0%
15.0%
20.0%
25.0%
30.0%
35.0%
40.0%
45.0%
50.0%
55.0%
60.0%
65.0%
70.0%
21 6 15 22 XYZ 3 13 8 4 14 1 2 10 20 7 5 16 11 19 9 17 18 12
An
nu
al T
ech
nic
ian
Tu
rno
ver
Sevice Desk
High 65.6%
Average ----- 40.7%
Median 40.3%
Low 13.6%
Company XYZ 31.3%
Key Statistics
Annual Technician Turnover

HR Service Center Benchmark
153© MetricNet, LLC, www.metricnet.com
Technician Metrics: Daily Technician Absenteeism
Daily Technician Absenteeism is strongly correlated with the following metrics:
Annual Technician Turnover
Technician Job Satisfaction
Technician Utilization
Cost per Inbound Contact
Contacts per Technician per Month
Definition
Why it’s Important
Key Correlations
High Technician Absenteeism is problematic because it makes it difficult for a Service Desk to schedule resources efficiently. High absenteeism can severely impact a Service Desk’s operating performance, and increase the likelihood that service level targets will be missed. A Service Desk’s ASA and Call Abandonment Rate typically suffer when absenteeism is high. Also, chronically high absenteeism is often a sign of low Technician morale.
Daily Technician Absenteeism is the average percentage of Technicians with an unexcused absence on any given day. It is calculated by dividing the number of absent Technicians by the total number of Technicians that are scheduled to be at work.
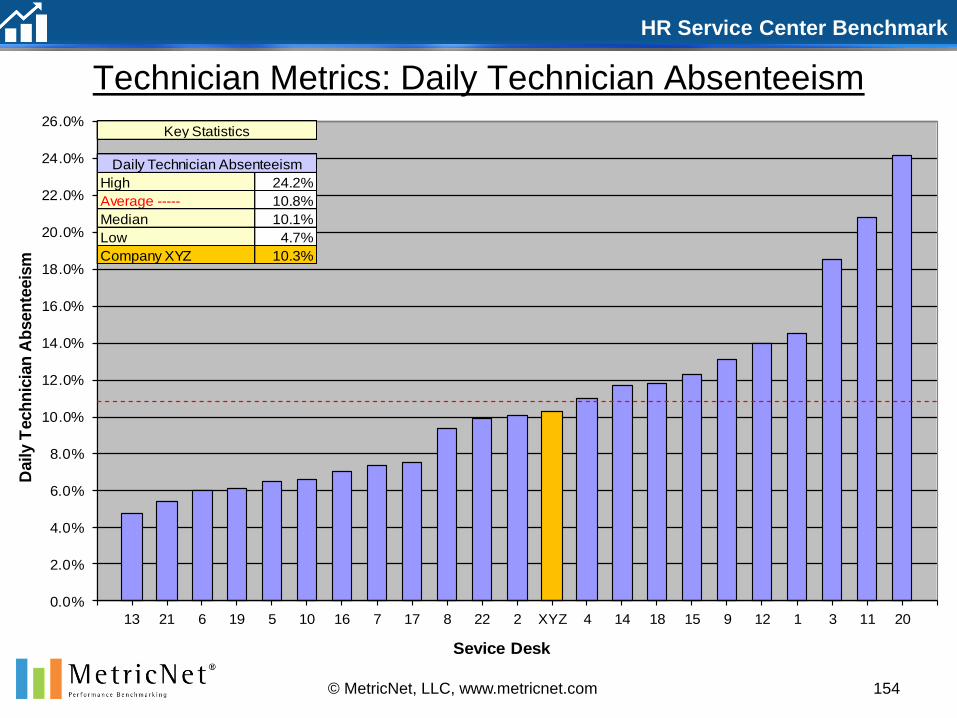
HR Service Center Benchmark
154© MetricNet, LLC, www.metricnet.com
Technician Metrics: Daily Technician Absenteeism
0.0%
2.0%
4.0%
6.0%
8.0%
10.0%
12.0%
14.0%
16.0%
18.0%
20.0%
22.0%
24.0%
26.0%
13 21 6 19 5 10 16 7 17 8 22 2 XYZ 4 14 18 15 9 12 1 3 11 20
Daily T
ech
nic
ian
Ab
sen
teeis
m
Sevice Desk
High 24.2%
Average ----- 10.8%
Median 10.1%
Low 4.7%
Company XYZ 10.3%
Key Statistics
Daily Technician Absenteeism
HR Service Center Benchmark
155
Technician Metrics: Technician Schedule Adherence
Technician schedule adherence is strongly correlated with the following metrics:
Technician Utilization
Inbound Contacts per Technician per Month
Technician Occupancy
Average Speed of Answer
Definition
Why it’s Important
Key Correlations
Effective Technician scheduling is critical to achieving a Service Desk’s service level goals and maximizing Technician Utilization. However, a work schedule, no matter how well constructed, is only as good as the adherence to the schedule. It is therefore important for Technicians to adhere to the schedule as closely as possible to ensure that these productivity and service level goals are met.
Technician Schedule Adherence is a measure of whether Technicians are in their seats ready to accept calls as scheduled. It measures how well a Service Desk’s Technicians are “adhering” to the schedule. Technician Schedule Adherence is equal to the actual time that a Technician is logged in to the system ready to accept calls, divided by the total time the Technician is scheduled to be available to accept calls.
© MetricNet, LLC, www.metricnet.com
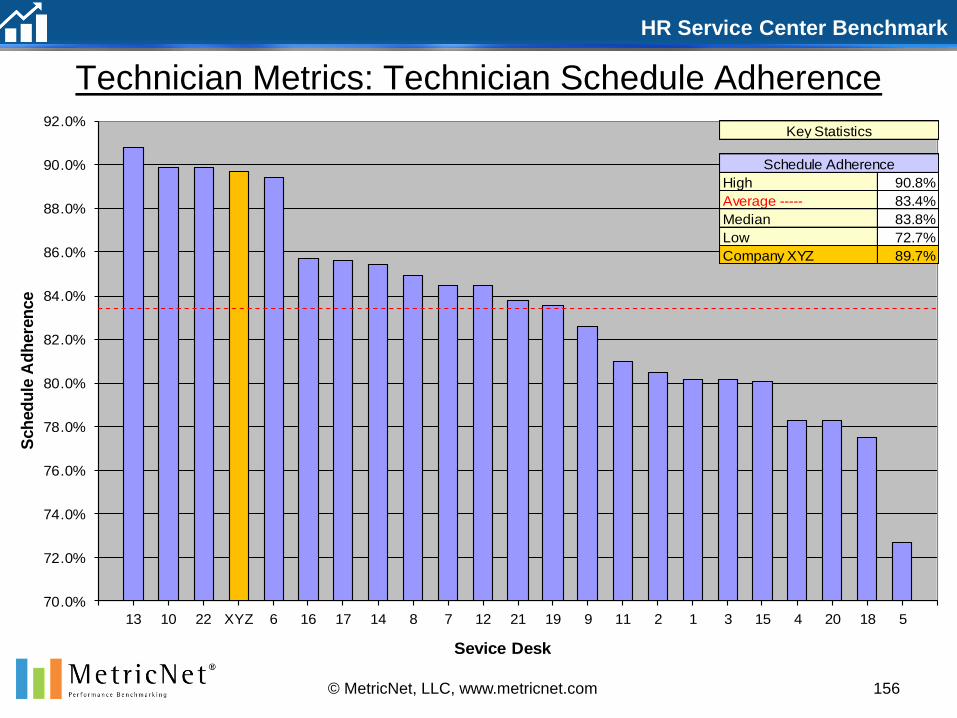
HR Service Center Benchmark
Technician Metrics: Technician Schedule Adherence
156© MetricNet, LLC, www.metricnet.com
70.0%
72.0%
74.0%
76.0%
78.0%
80.0%
82.0%
84.0%
86.0%
88.0%
90.0%
92.0%
13 10 22 XYZ 6 16 17 14 8 7 12 21 19 9 11 2 1 3 15 4 20 18 5
Sch
ed
ule
Ad
here
nce
Sevice Desk
High 90.8%
Average ----- 83.4%
Median 83.8%
Low 72.7%
Company XYZ 89.7%
Key Statistics
Schedule Adherence

HR Service Center Benchmark
157© MetricNet, LLC, www.metricnet.com
Technician Metrics: New Technician Training Hours
New Technician Training Hours are strongly correlated with the following metrics:
Call Quality
Net First Contact Resolution Rate
Customer Satisfaction
Inbound Contact Handle Time
Technician Job Satisfaction
Definition
Why it’s Important
Key Correlations
New Technician Training Hours are strongly correlated with Call Quality and Net First Contact Resolution Rate. particularly during a Technician’s first few months on the job. The more training a new Technician receives, the higher the Call Quality and Net FCR will typically be. This, in turn, has a positive effect on many other performance metrics including Customer Satisfaction. Perhaps most importantly, training levels have a strong impact on Technician morale: Technicians who receive more training typically have higher levels of job satisfaction.
The name of this metric is somewhat self explanatory. New Technician Training Hours is the number of training hours (including classroom, CBT, self-study, shadowing, being coached, and OJT) that a new Technicians receives before he/she is allowed to handle customer contacts independently.
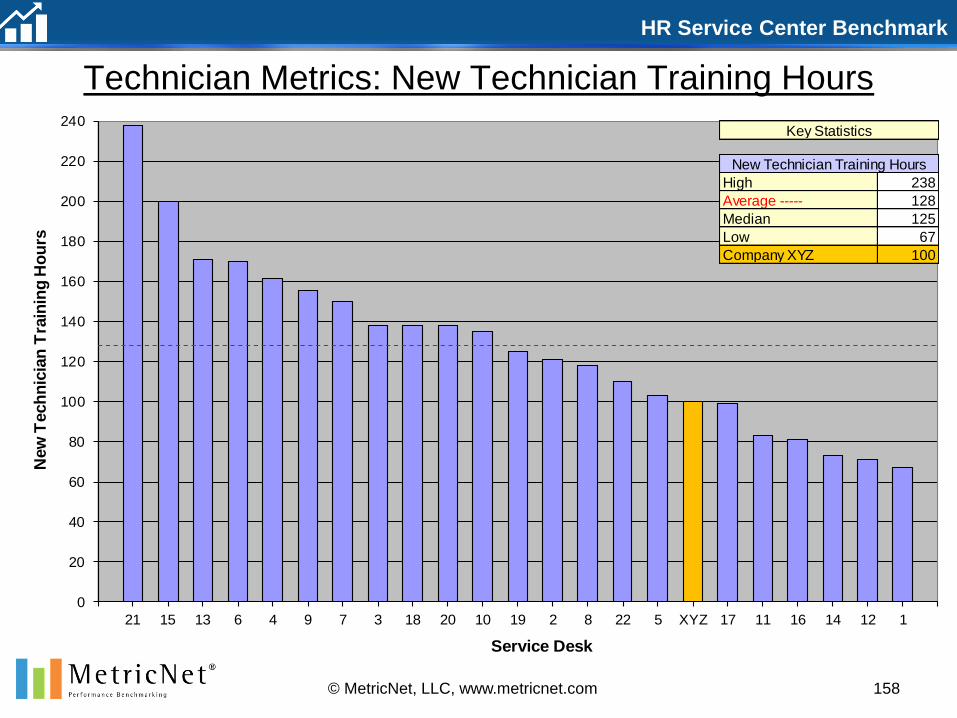
HR Service Center Benchmark
158© MetricNet, LLC, www.metricnet.com
Technician Metrics: New Technician Training Hours
0
20
40
60
80
100
120
140
160
180
200
220
240
21 15 13 6 4 9 7 3 18 20 10 19 2 8 22 5 XYZ 17 11 16 14 12 1
New
Tech
nic
ian
Tra
inin
g H
ou
rs
Service Desk
High 238
Average ----- 128
Median 125
Low 67
Company XYZ 100
Key Statistics
New Technician Training Hours
HR Service Center Benchmark
159© MetricNet, LLC, www.metricnet.com
Technician Metrics: Annual Technician Training Hours
Annual Technician Training Hours are strongly correlated with the following metrics:
Call Quality
Net First Contact Resolution Rate
Customer Satisfaction
Inbound Contact Handle Time
Technician Job Satisfaction
Definition
Why it’s Important
Key Correlations
Annual Technician Training Hours are strongly correlated with Call Quality, Customer Satisfaction, and Net First Contact Resolution Rate. Perhaps most importantly, training levels have a strong impact on Technician morale: Technicians who train more typically have higher levels of job satisfaction.
Annual Technician Training Hours is the average number of training hours (including classroom, CBT, self-study, shadowing, etc.) that a Technician receives on an annual basis. This number includes any training hours that a Technician receives that are not part of the Technician’s initial (new Technician) training, but it does not include routine team meetings, shift handoffs, or other activities that do not involve formal training.
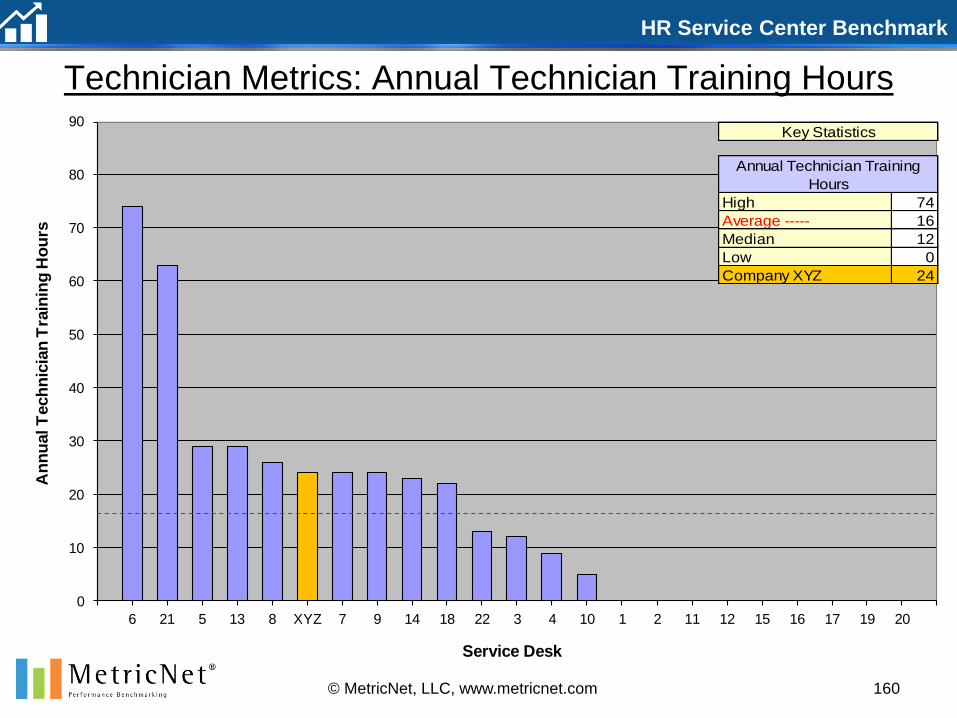
HR Service Center Benchmark
160© MetricNet, LLC, www.metricnet.com
Technician Metrics: Annual Technician Training Hours
0
10
20
30
40
50
60
70
80
90
6 21 5 13 8 XYZ 7 9 14 18 22 3 4 10 1 2 11 12 15 16 17 19 20
An
nu
al T
ech
nic
ian
Tra
inin
g H
ou
rs
Service Desk
High 74
Average ----- 16
Median 12
Low 0
Company XYZ 24
Key Statistics
Annual Technician Training
Hours
HR Service Center Benchmark
161© MetricNet, LLC, www.metricnet.com
Technician Metrics: Technician Tenure
Definition
Why it’s Important
Key Correlations
Technician tenure is a measure of Technician experience. Virtually every metric related to Service Desk cost and quality is impacted by the level of experience the Technicians have.
Technician tenure is the average number of months that Technicians have worked on a particular Service Desk.
Technician tenure is strongly correlated with the following metrics:
Cost per Inbound Contact
Call Quality
Customer Satisfaction
Annual Technician Turnover
Training Hours
Coaching Hours
Inbound Contact Handle Time
Net First Contact Resolution
Rate
Technician Job Satisfaction
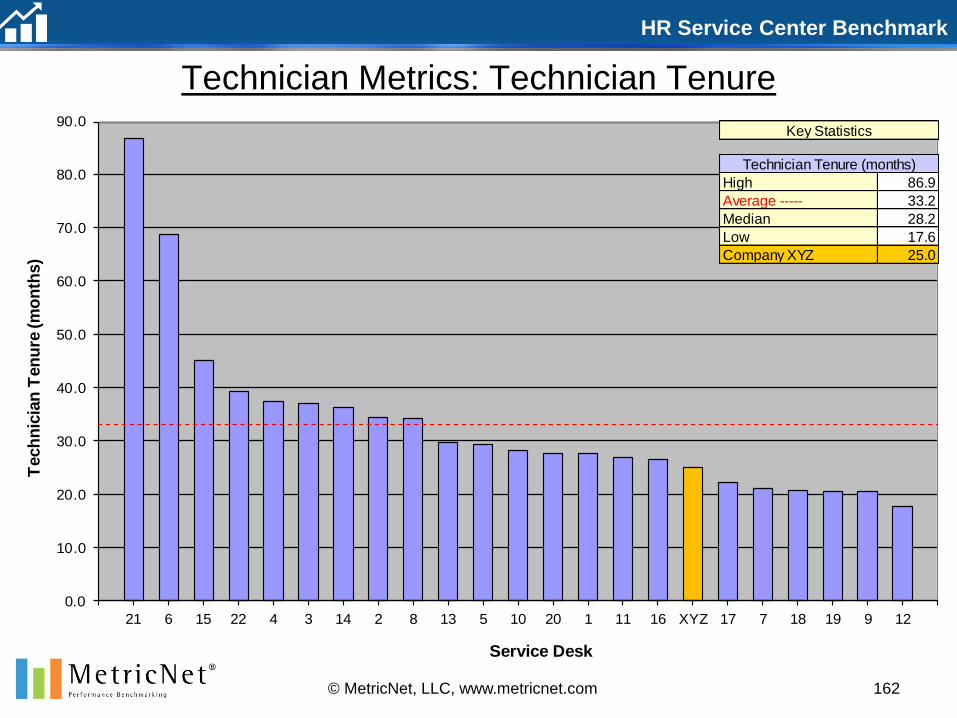
HR Service Center Benchmark
162© MetricNet, LLC, www.metricnet.com
Technician Metrics: Technician Tenure
0.0
10.0
20.0
30.0
40.0
50.0
60.0
70.0
80.0
90.0
21 6 15 22 4 3 14 2 8 13 5 10 20 1 11 16 XYZ 17 7 18 19 9 12
Tech
nic
ian
Ten
ure
(m
on
ths)
Service Desk
High 86.9
Average ----- 33.2
Median 28.2
Low 17.6
Company XYZ 25.0
Key Statistics
Technician Tenure (months)

HR Service Center Benchmark
163© MetricNet, LLC, www.metricnet.com
Technician Metrics: Technician Job Satisfaction
Technician Job Satisfaction is strongly correlated with the following metrics:
Annual Technician Turnover
Daily Technician Absenteeism
Technician Training Hours
Technician Coaching Hours
Definition
Why it’s Important
Key Correlations
Technician Job Satisfaction is a proxy for Technician morale. And morale, while difficult to measure, is a bellwether metric that affects almost every other metric in the Service Desk. High performance Service Desks almost always have high levels of Technician Job Satisfaction. Perhaps more importantly, this metric can be controlled and improved through training, coaching, and career pathing.
Technician Job Satisfaction is the percent of Technicians in a Service Desk that are either satisfied or very satisfied with their jobs.
Customer Satisfaction
Net First Contact Resolution Rate
Inbound Contact Handle Time
Cost per Inbound Contact
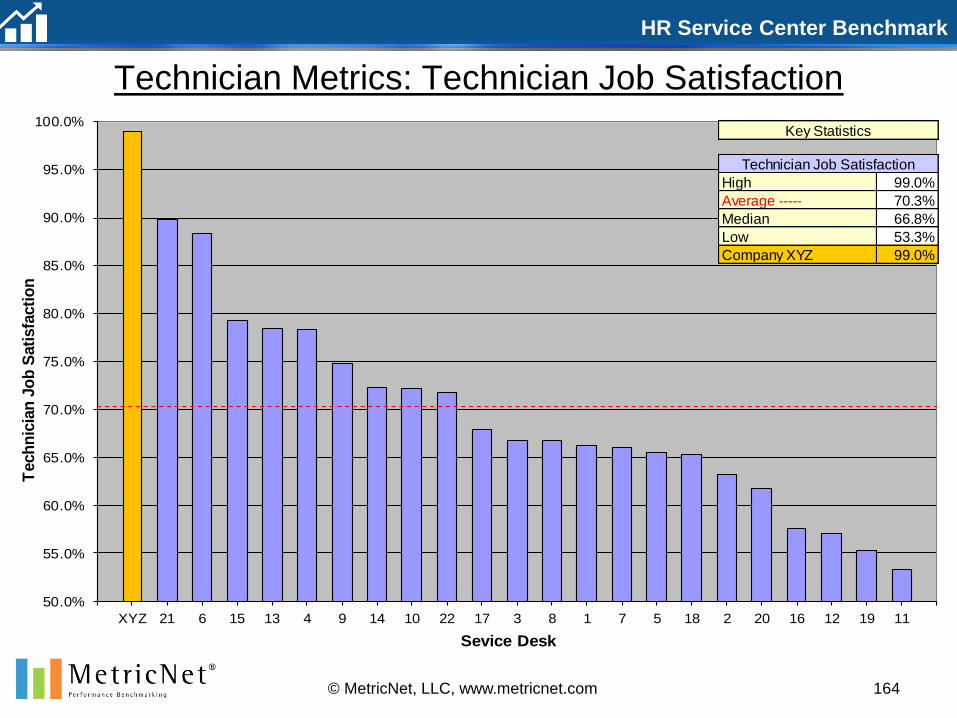
HR Service Center Benchmark
164© MetricNet, LLC, www.metricnet.com
Technician Metrics: Technician Job Satisfaction
50.0%
55.0%
60.0%
65.0%
70.0%
75.0%
80.0%
85.0%
90.0%
95.0%
100.0%
XYZ 21 6 15 13 4 9 14 10 22 17 3 8 1 7 5 18 2 20 16 12 19 11
Tech
nic
ian
Jo
b S
ati
sfa
cti
on
Sevice Desk
High 99.0%
Average ----- 70.3%
Median 66.8%
Low 53.3%
Company XYZ 99.0%
Key Statistics
Technician Job Satisfaction
Contact Handling Metrics
165
Company
XYZ
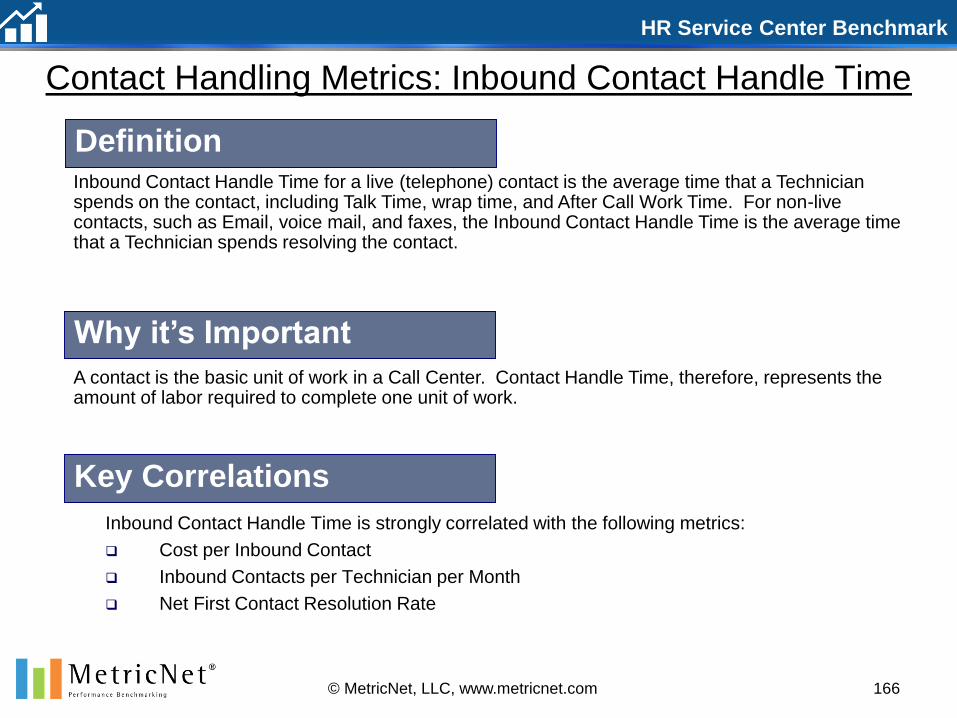
HR Service Center Benchmark
166© MetricNet, LLC, www.metricnet.com
Contact Handling Metrics: Inbound Contact Handle Time
Inbound Contact Handle Time is strongly correlated with the following metrics:
Cost per Inbound Contact
Inbound Contacts per Technician per Month
Net First Contact Resolution Rate
Definition
Why it’s Important
Key Correlations
A contact is the basic unit of work in a Call Center. Contact Handle Time, therefore, represents the amount of labor required to complete one unit of work.
Inbound Contact Handle Time for a live (telephone) contact is the average time that a Technician spends on the contact, including Talk Time, wrap time, and After Call Work Time. For non-live contacts, such as Email, voice mail, and faxes, the Inbound Contact Handle Time is the average time that a Technician spends resolving the contact.
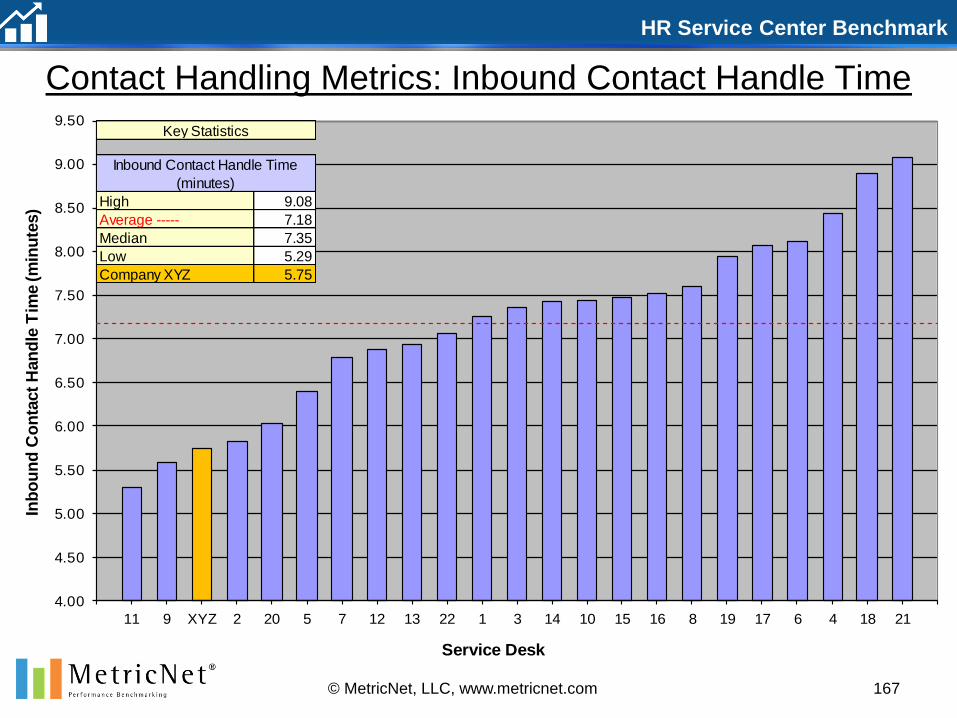
HR Service Center Benchmark
167© MetricNet, LLC, www.metricnet.com
Contact Handling Metrics: Inbound Contact Handle Time
4.00
4.50
5.00
5.50
6.00
6.50
7.00
7.50
8.00
8.50
9.00
9.50
11 9 XYZ 2 20 5 7 12 13 22 1 3 14 10 15 16 8 19 17 6 4 18 21
Inb
ou
nd
Co
nta
ct
Han
dle
Tim
e (m
inu
tes)
Service Desk
High 9.08
Average ----- 7.18
Median 7.35
Low 5.29
Company XYZ 5.75
Key Statistics
Inbound Contact Handle Time
(minutes)
HR Service Center Benchmark
168© MetricNet, LLC, www.metricnet.com
Contact Handling Metrics: User Self-Serve Completion Rate
User Self-Serve Completion Rate is strongly correlated with the following metrics:
Cost per Inbound Contact
Definition
Why it’s Important
Key Correlations
The Cost per Contact for self-serve contacts is significantly lower than it is for Technician assisted calls. By increasing the number of contacts resolved through Self-Serve, the average Cost per Inbound Contact can be reduced significantly. Many Service Desks, recognizing the potential to reduce their costs, constantly strive to increase their Self-Serve Completion Rates.
The User Self-Serve Completion Rate is the percentage of incidents that are resolved by the user without the assistance of a live Technician. These could include contacts that are resolved within the IVR (e.g., automated password resets), and incidents that are resolved by the user through a self-help portal. A user who opts out of the IVR or self-help session to speak with a live Technician does not count as User Self-Serve because the user did not obtain a resolution for their issue before speaking with a live Technician.
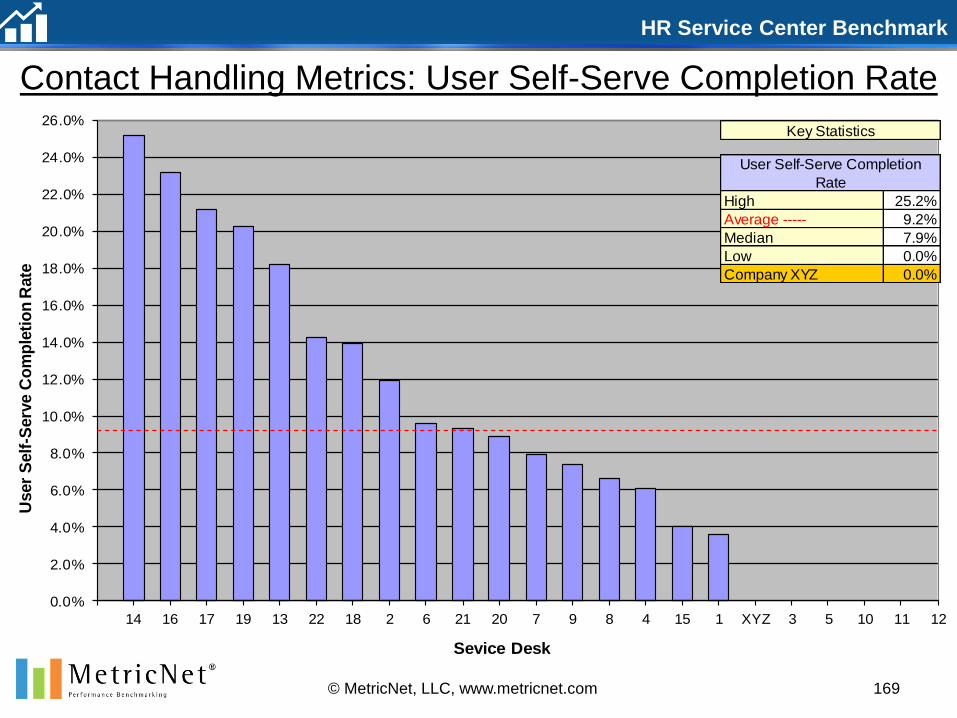
HR Service Center Benchmark
169© MetricNet, LLC, www.metricnet.com
Contact Handling Metrics: User Self-Serve Completion Rate
0.0%
2.0%
4.0%
6.0%
8.0%
10.0%
12.0%
14.0%
16.0%
18.0%
20.0%
22.0%
24.0%
26.0%
14 16 17 19 13 22 18 2 6 21 20 7 9 8 4 15 1 XYZ 3 5 10 11 12
User
Self
-Serv
e C
om
ple
tio
n R
ate
Sevice Desk
High 25.2%
Average ----- 9.2%
Median 7.9%
Low 0.0%
Company XYZ 0.0%
Key Statistics
User Self-Serve Completion
Rate

HR Service Center Benchmark
Your Speaker: Jeff Rumburg
Co Founder and Managing Partner,
MetricNet, LLC
Winner of the 2014 Ron Muns
Lifetime Achievement Award
Former CEO, The Verity Group
Former Vice President, Gartner
Founder of the Service Desk
Benchmarking Consortium
Author of A Hands-On Guide to
Competitive Benchmarking
Harvard MBA, Stanford MS
170© 2016 MetricNet, LLC, www.metricnet.com
About MetricNet:
Your Benchmarking Partner
Company
XYZ
HR Service Center Benchmark
Benchmarking is MetricNet’s Core Business
Call Centers
Telecom
Information
Technology
Satisfaction
Technical Support
Customer Service
Telemarketing/Telesales
Collections
Service Desk
Desktop Support
Field Services
Cost Benchmarking
Customer Satisfaction
Employee Satisfaction
© 2016 MetricNet, LLC, www.metricnet.com 172
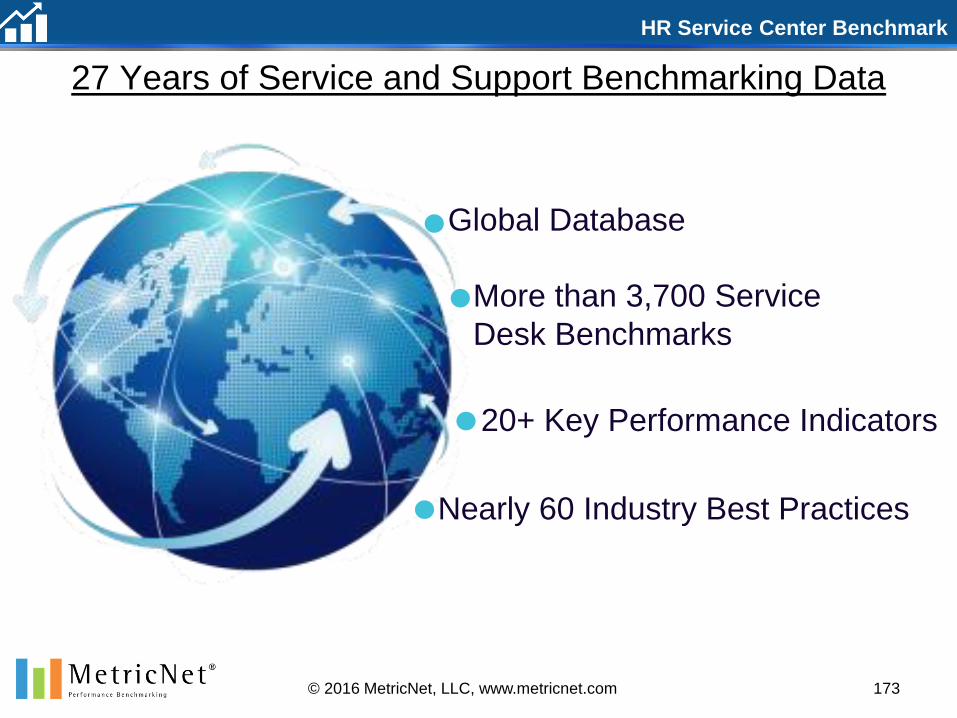
HR Service Center Benchmark
27 Years of Service and Support Benchmarking Data
© 2016 MetricNet, LLC, www.metricnet.com 173
More than 3,700 Service
Desk Benchmarks
Global Database
20+ Key Performance Indicators
Nearly 60 Industry Best Practices
HR Service Center Benchmark
More than Half the FORTUNE 500 Use MetricNet Benchmarks
MetricNet Conducts HR Service Center benchmarking for organizations
worldwide, and across virtually every industry sector.
© 2016 MetricNet, LLC, www.metricnet.com 174

HR Service Center Benchmark
Your Project Manager: Jeff Rumburg
Co Founder and Managing Partner,
MetricNet, LLC
Winner of the 2014 Ron Muns
Lifetime Achievement Award
Former CEO, The Verity Group
Former Vice President, Gartner
Founder of the Service Desk
Benchmarking Consortium
Author of A Hands-On Guide to
Competitive Benchmarking
Harvard MBA, Stanford MS
175© 2016 MetricNet, LLC, www.metricnet.com

Thank You!
Company
XYZ